Numerical Study on the Effects of Partial Oxidation Fuel Reforming (POFR) on the Performance of a Natural Gas Engine

Abstract
:1. Introduction
2. Numerical Method
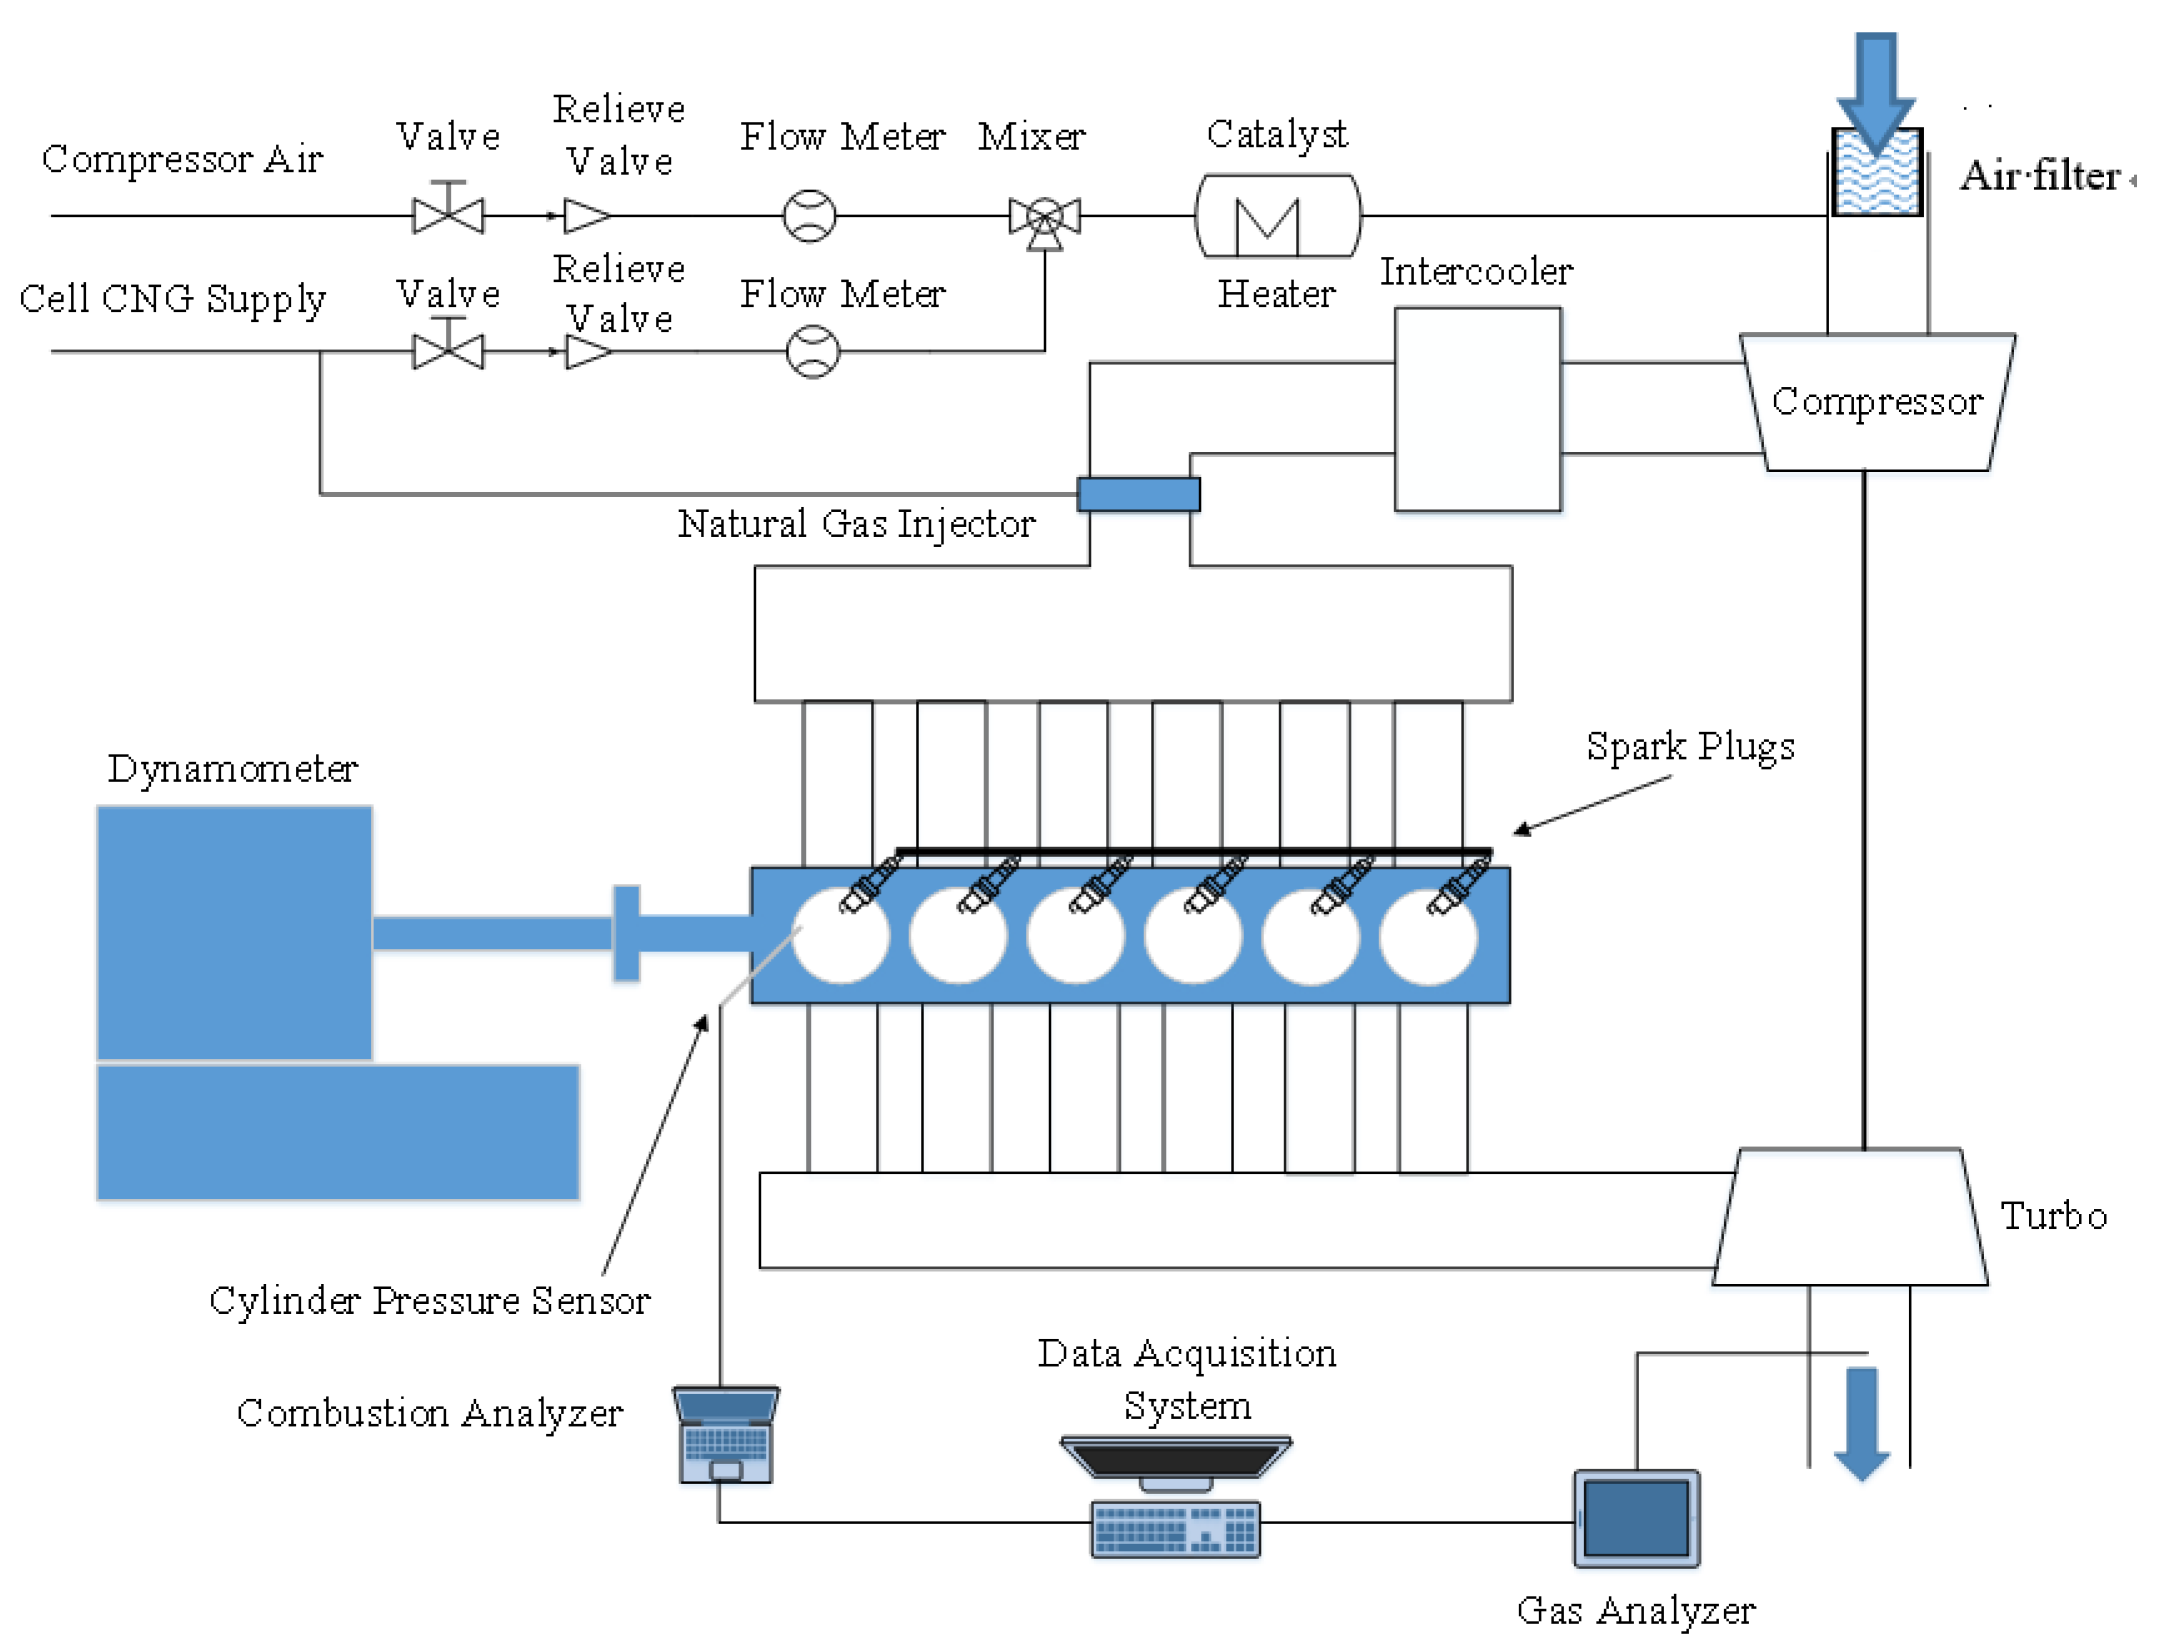
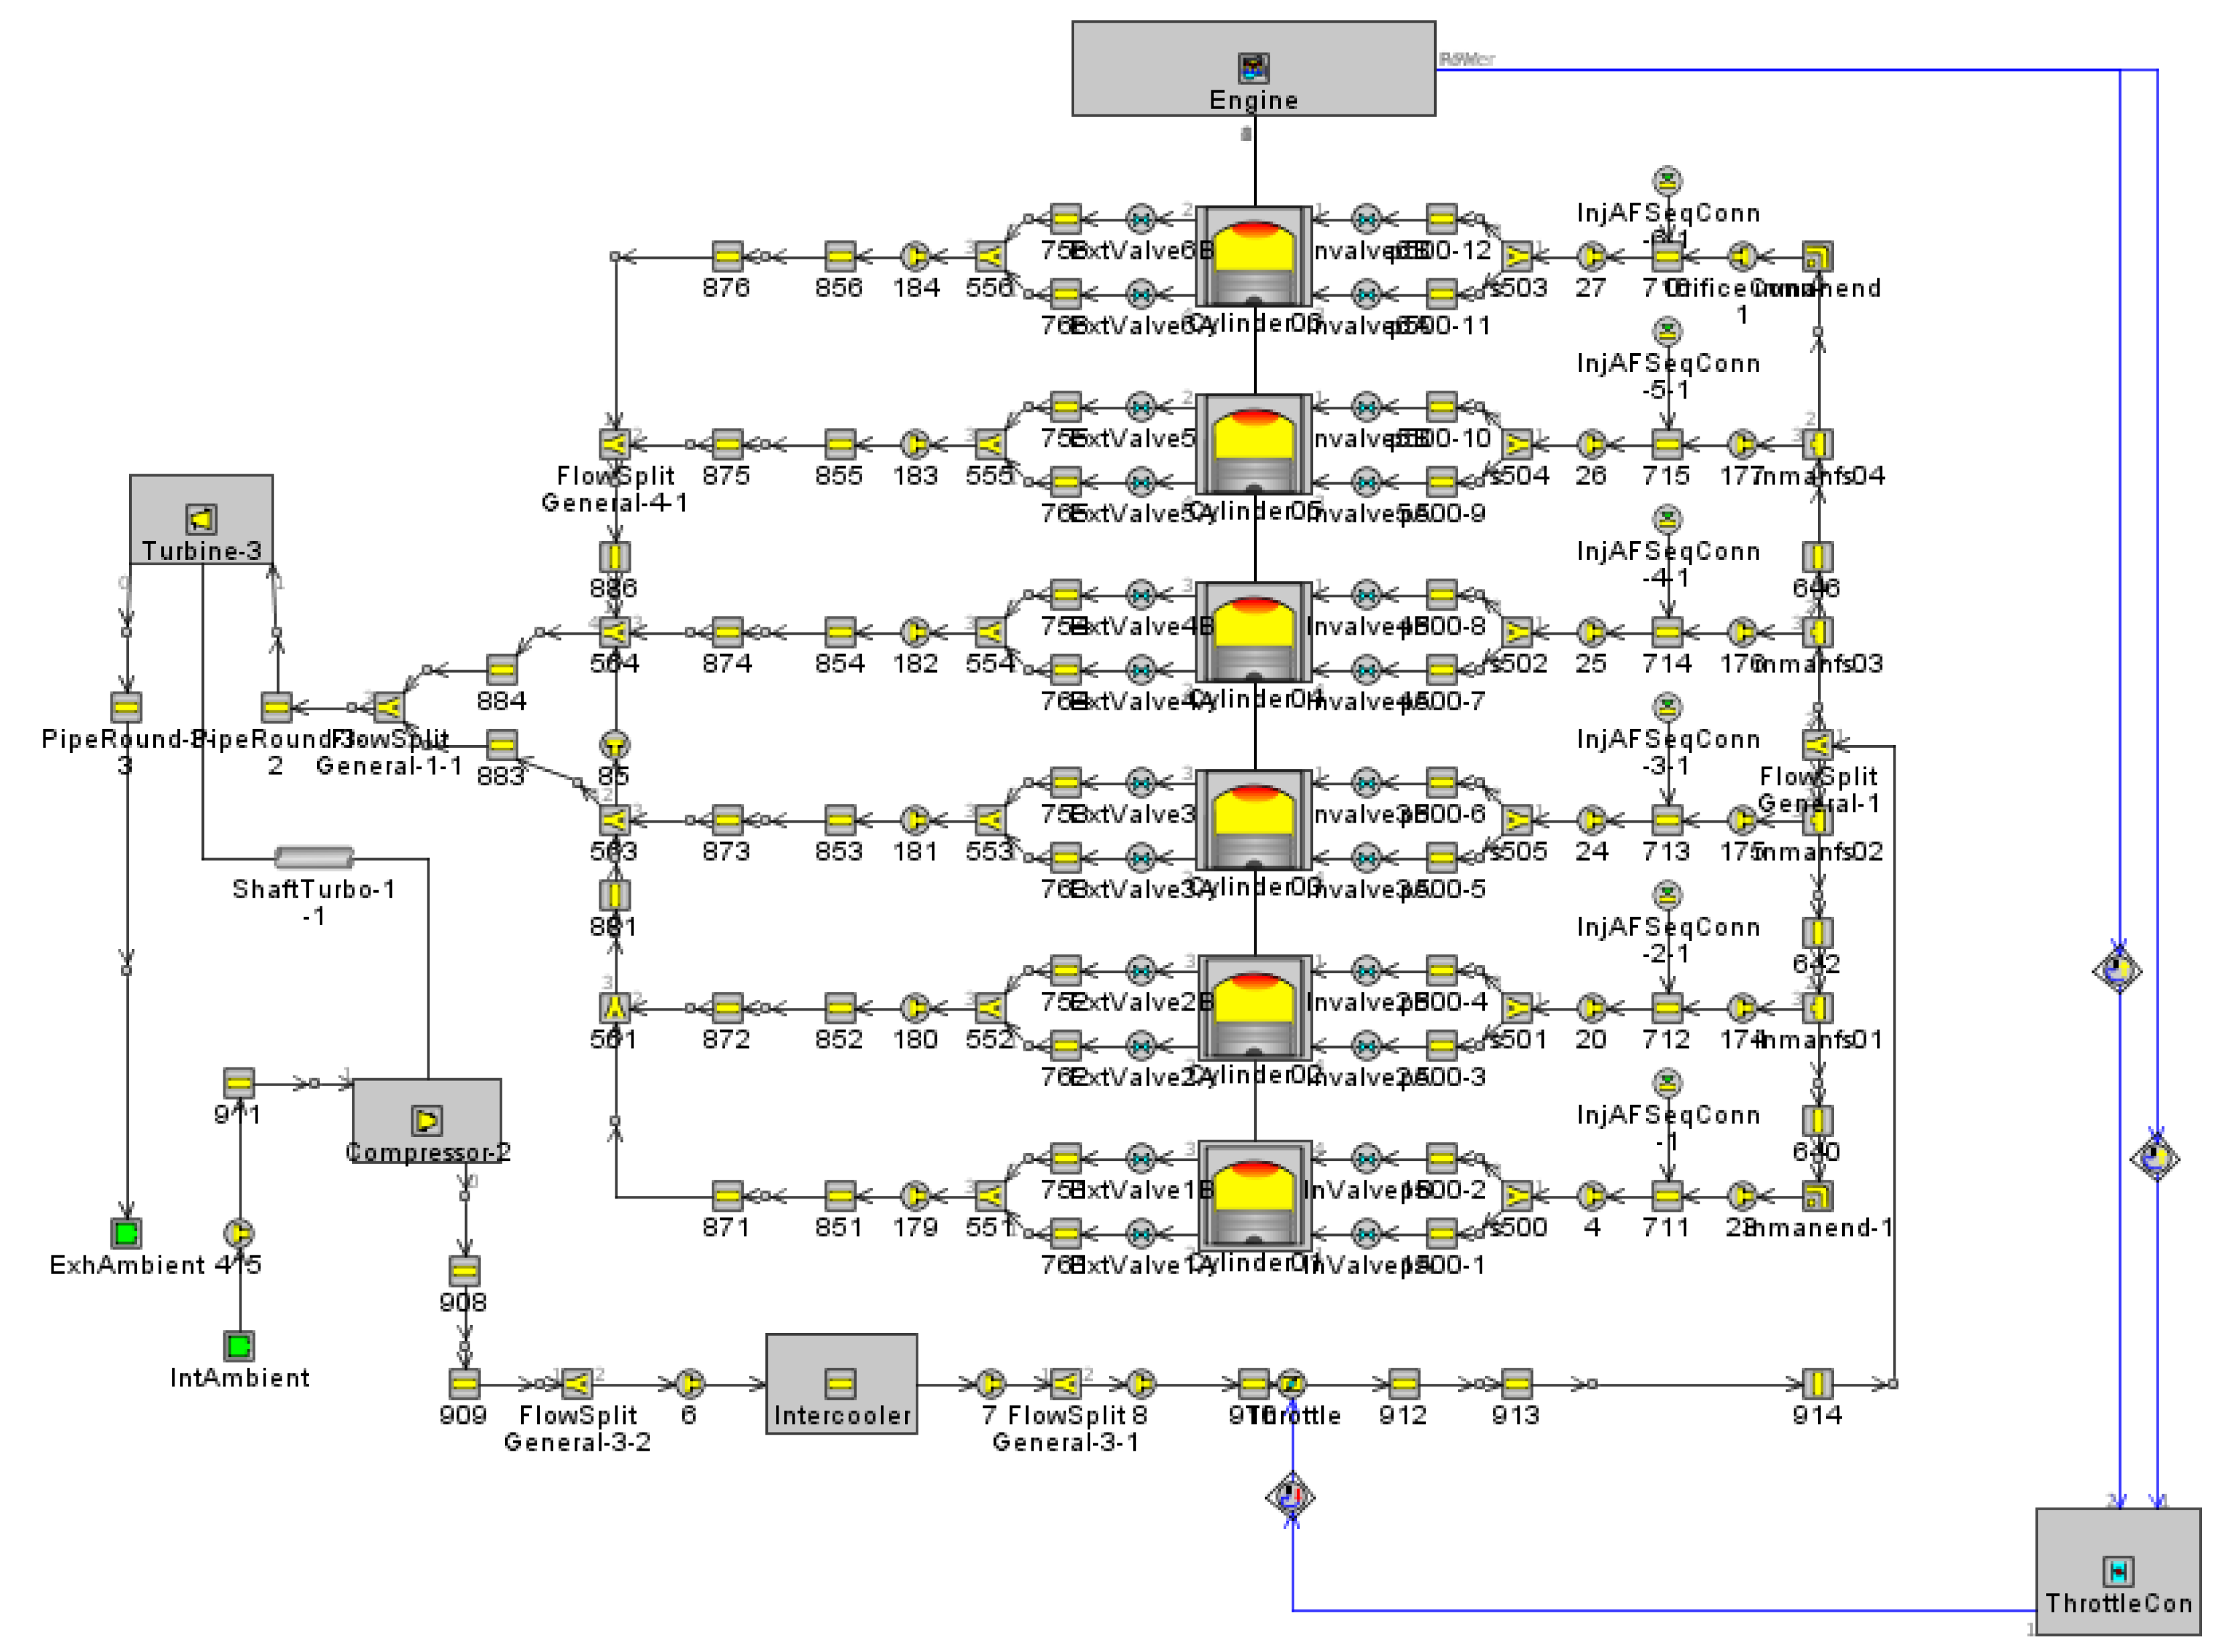
2.1. Engine and Simulation Model
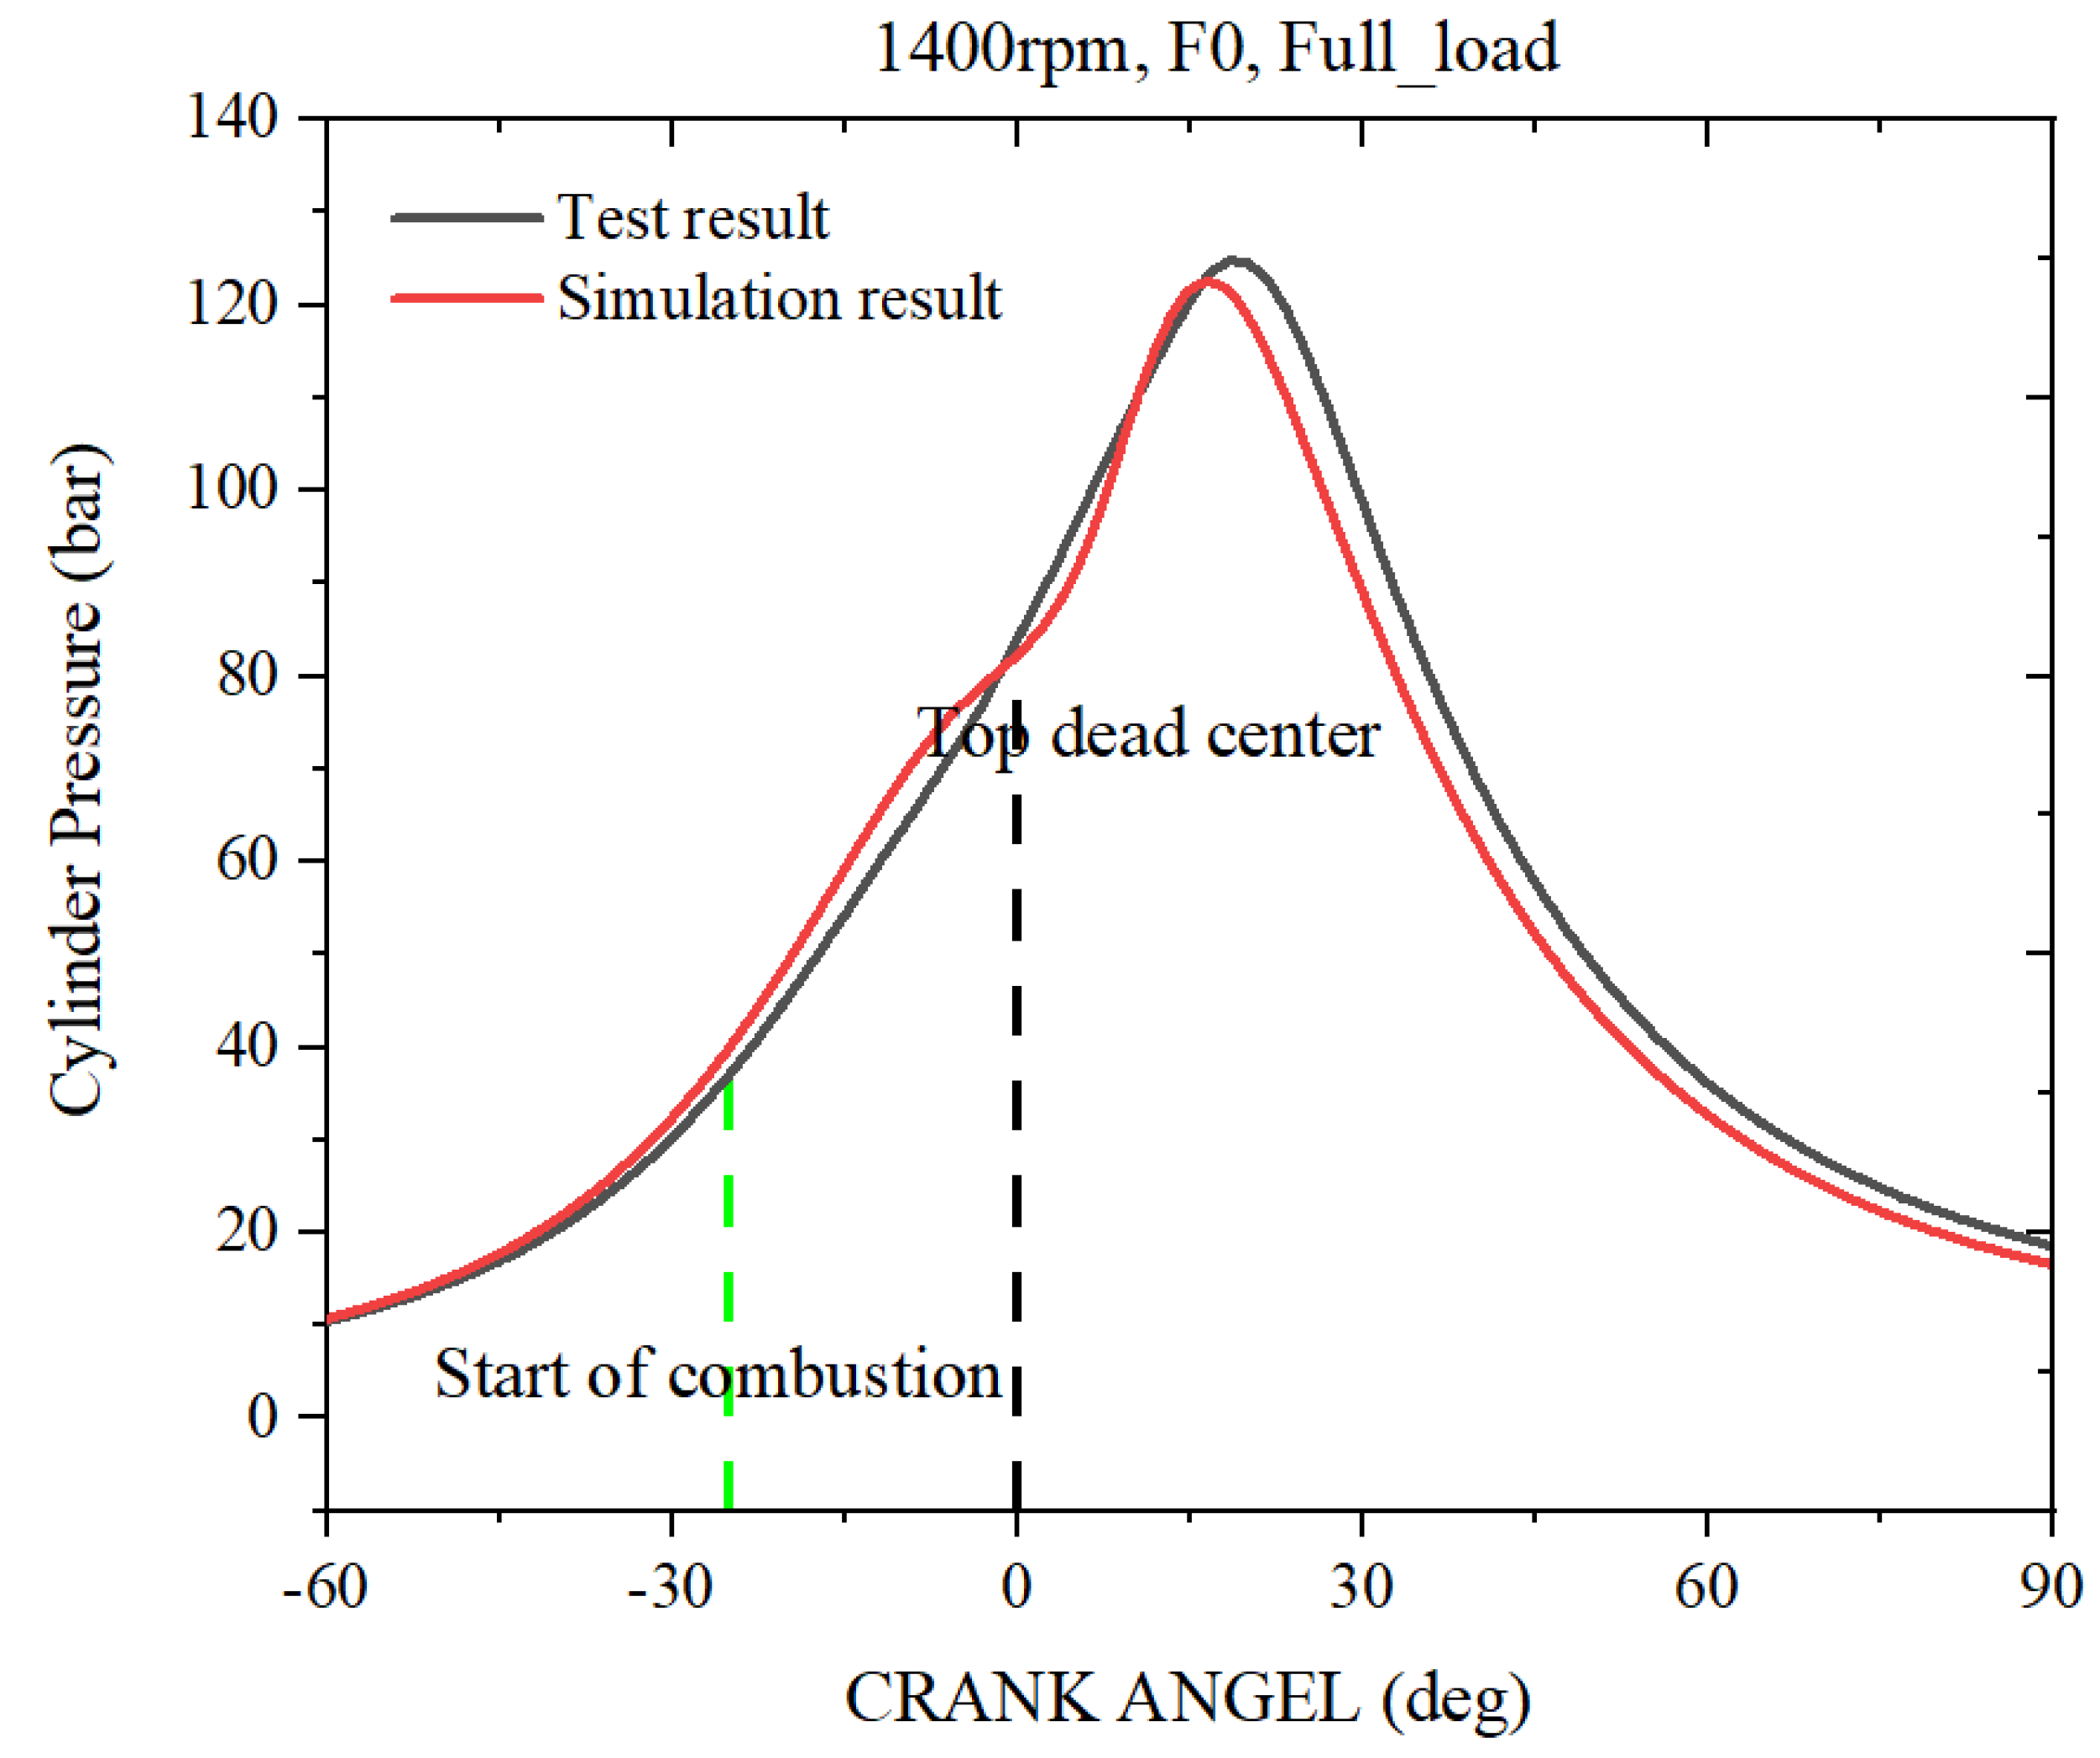
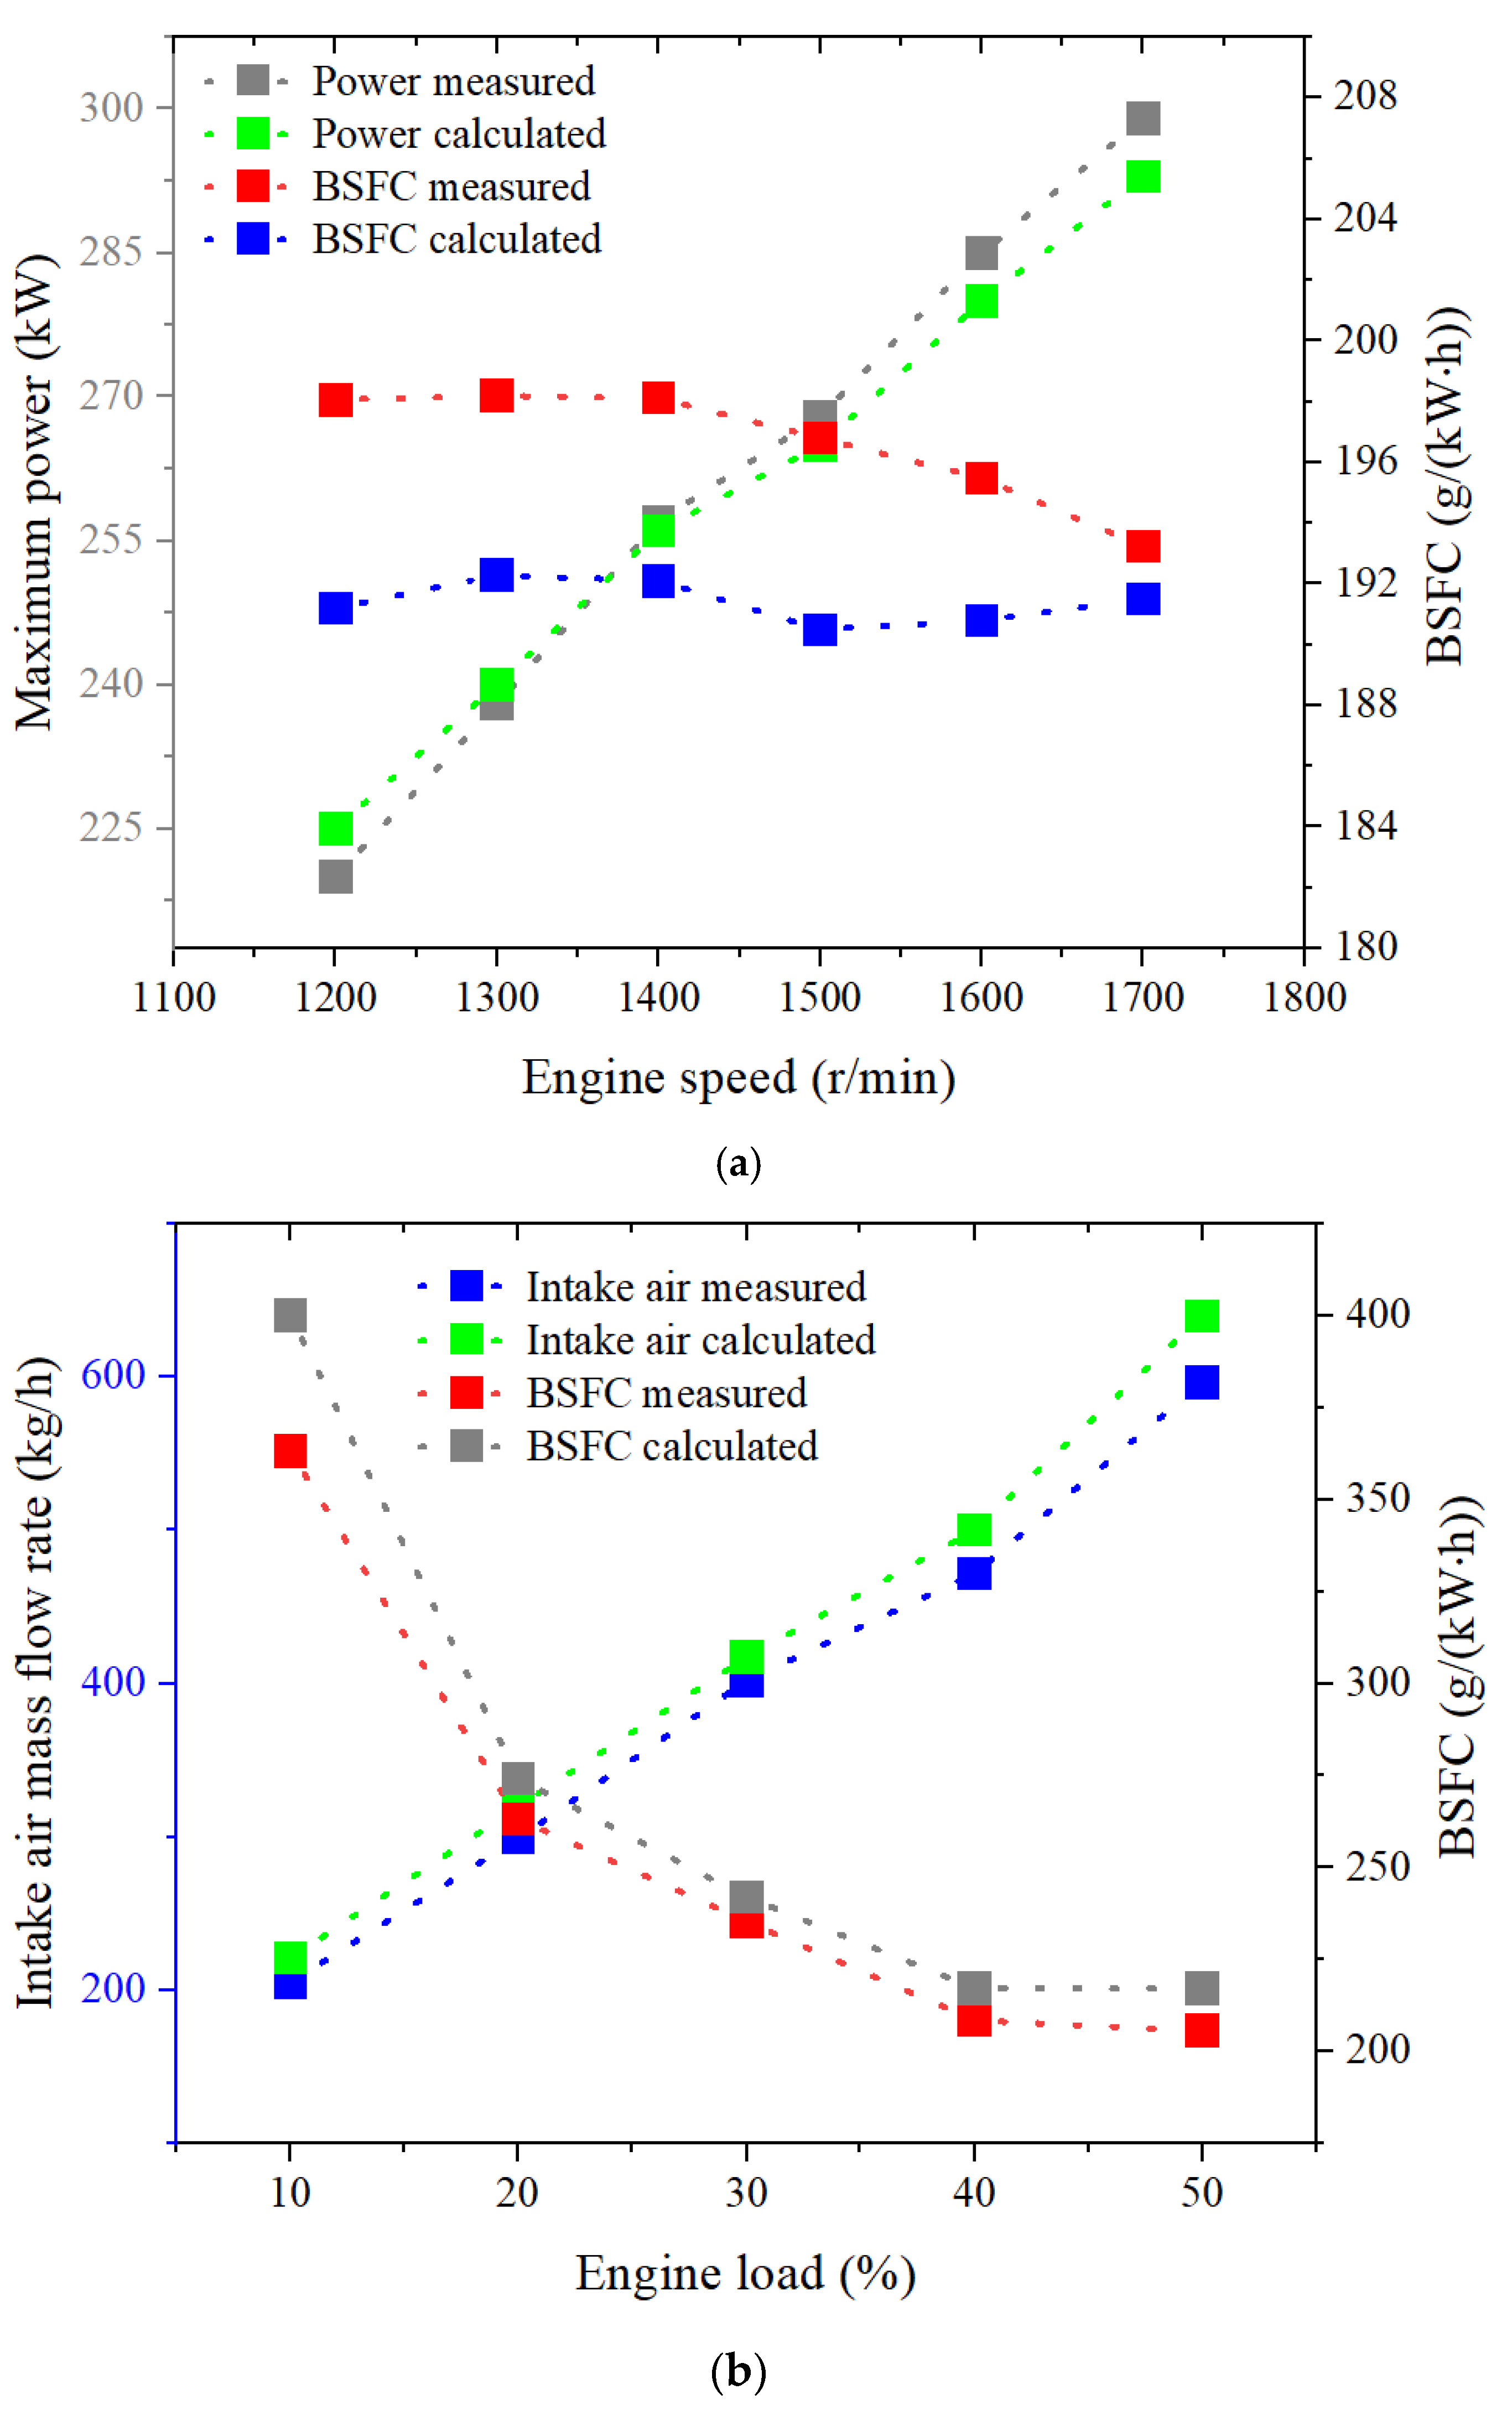
2.2. Natural Gas Engine Simulation Model Validation
3. Results and Discussion
3.1. Characteristics of Combustion and Performance
3.1.1. Partial Load (30% Load)
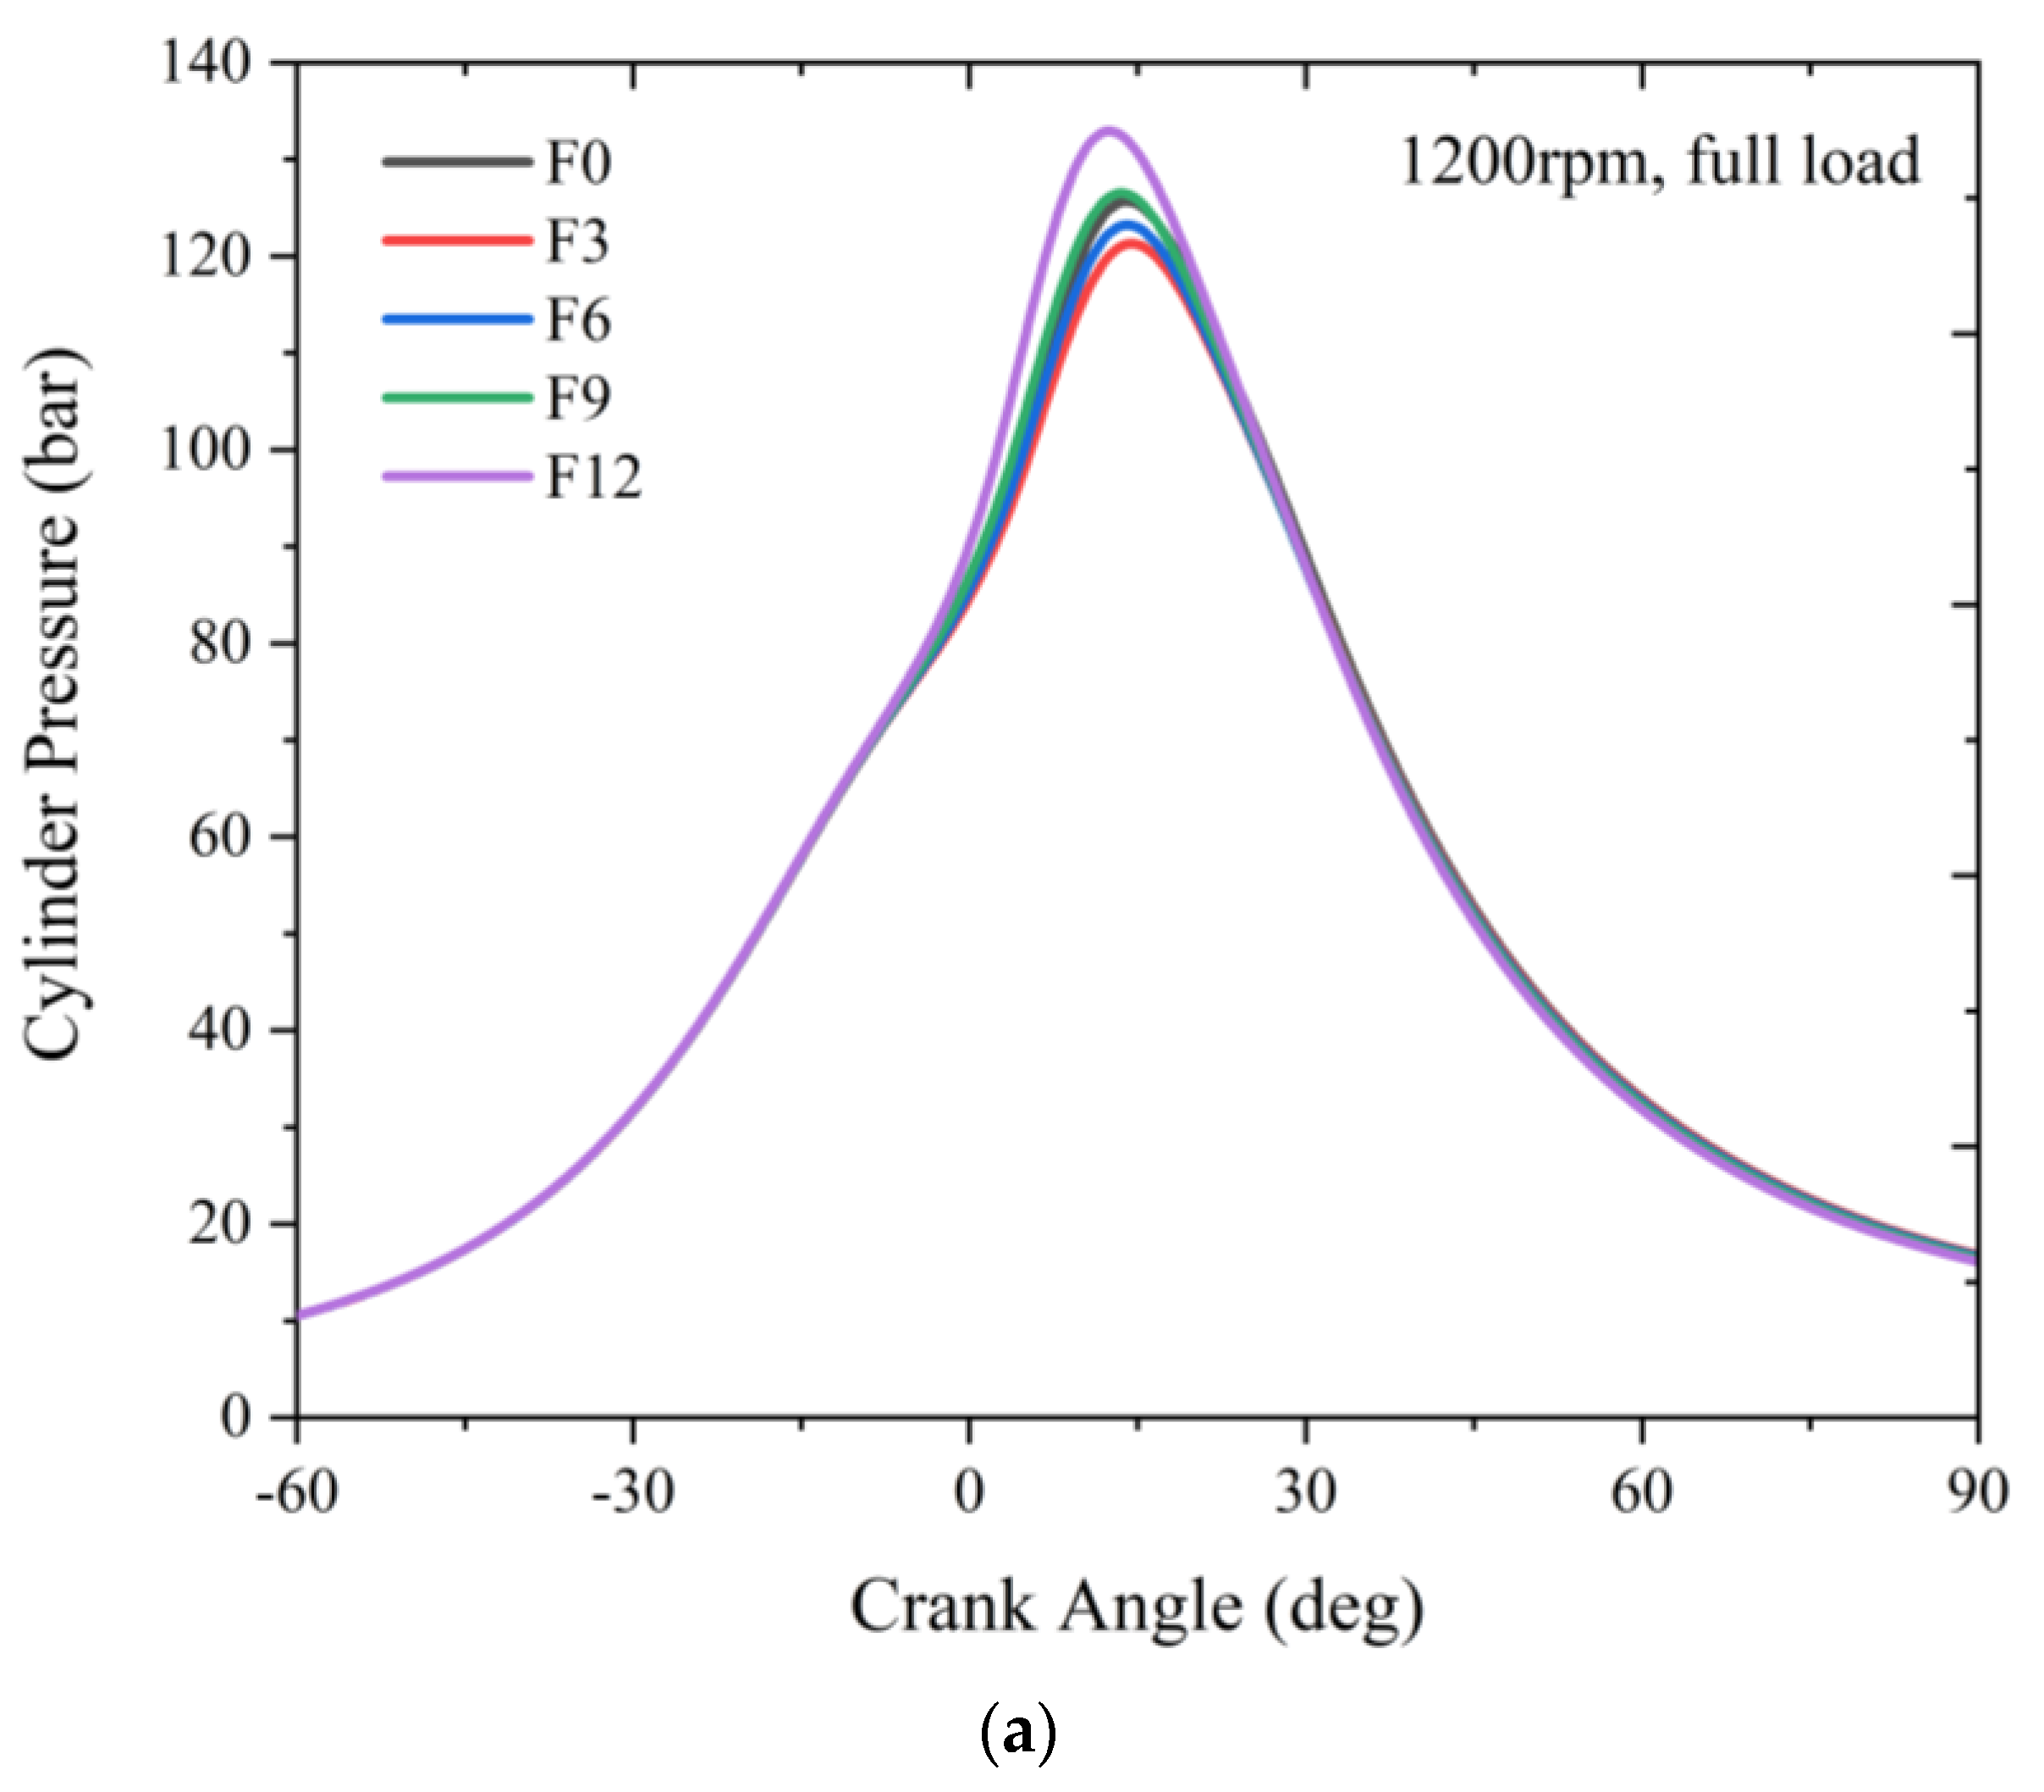
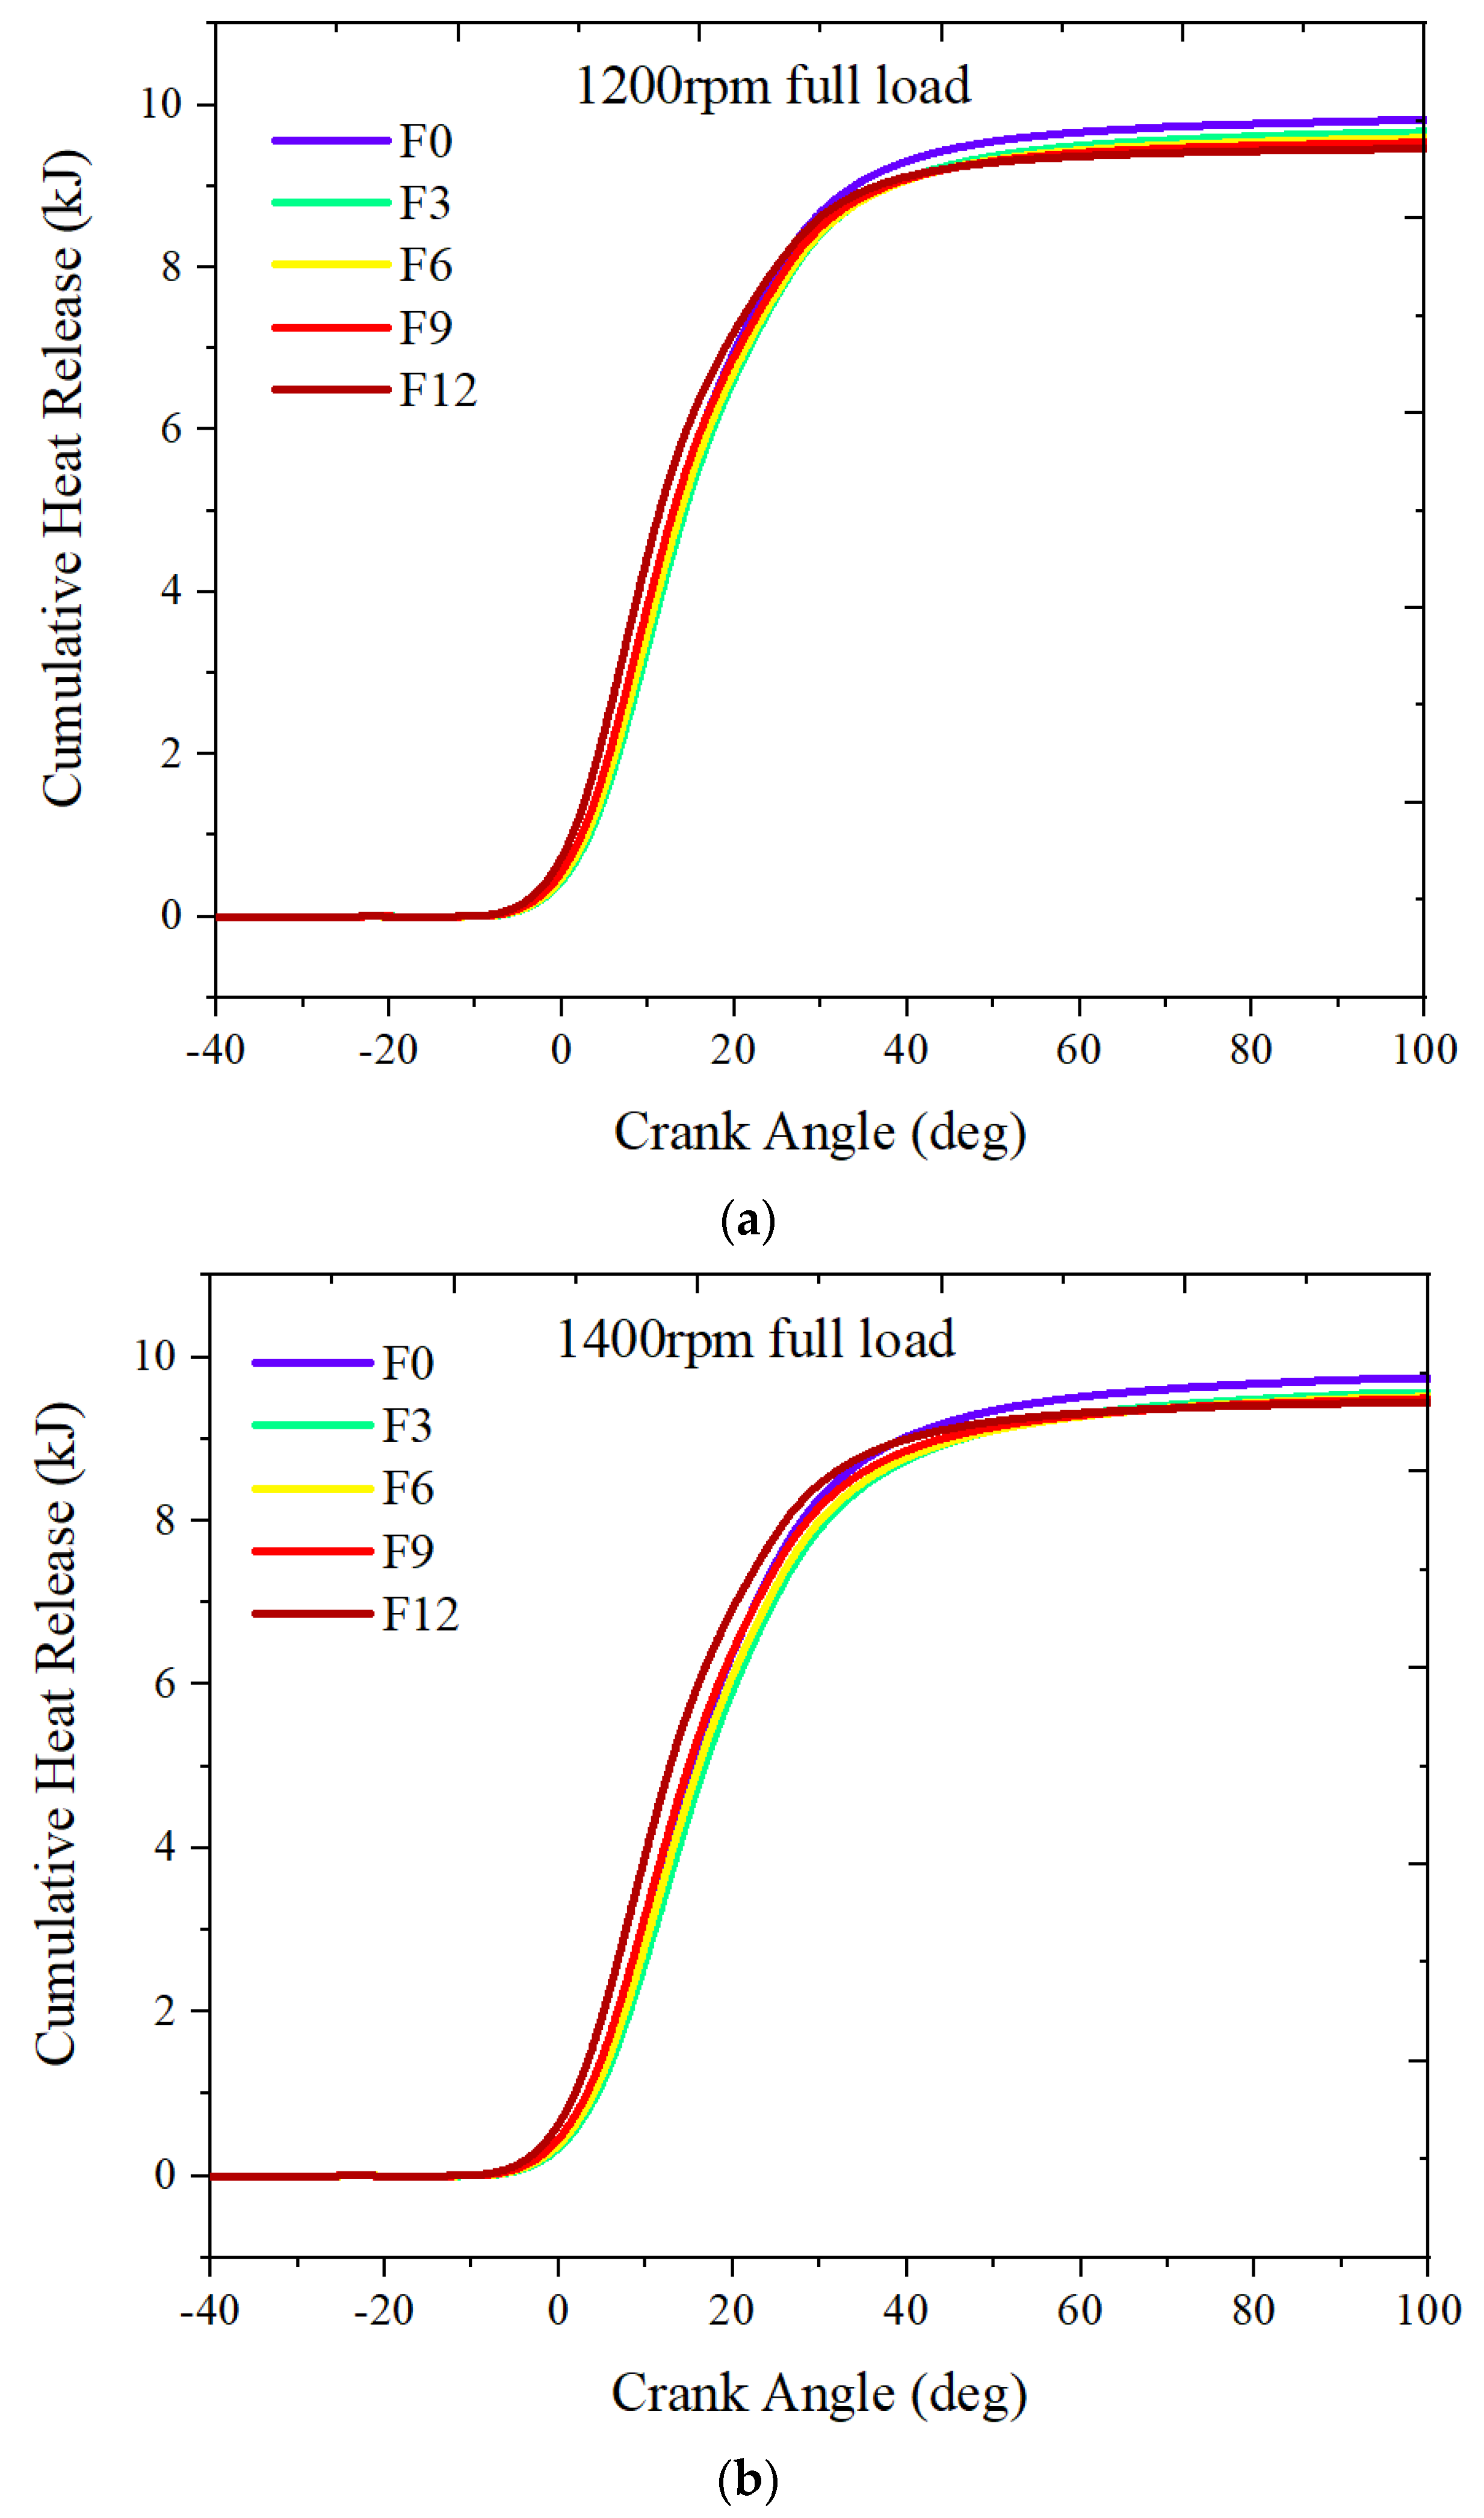
3.1.2. Full Load
3.2. Emission Characteristics
4. Conclusions
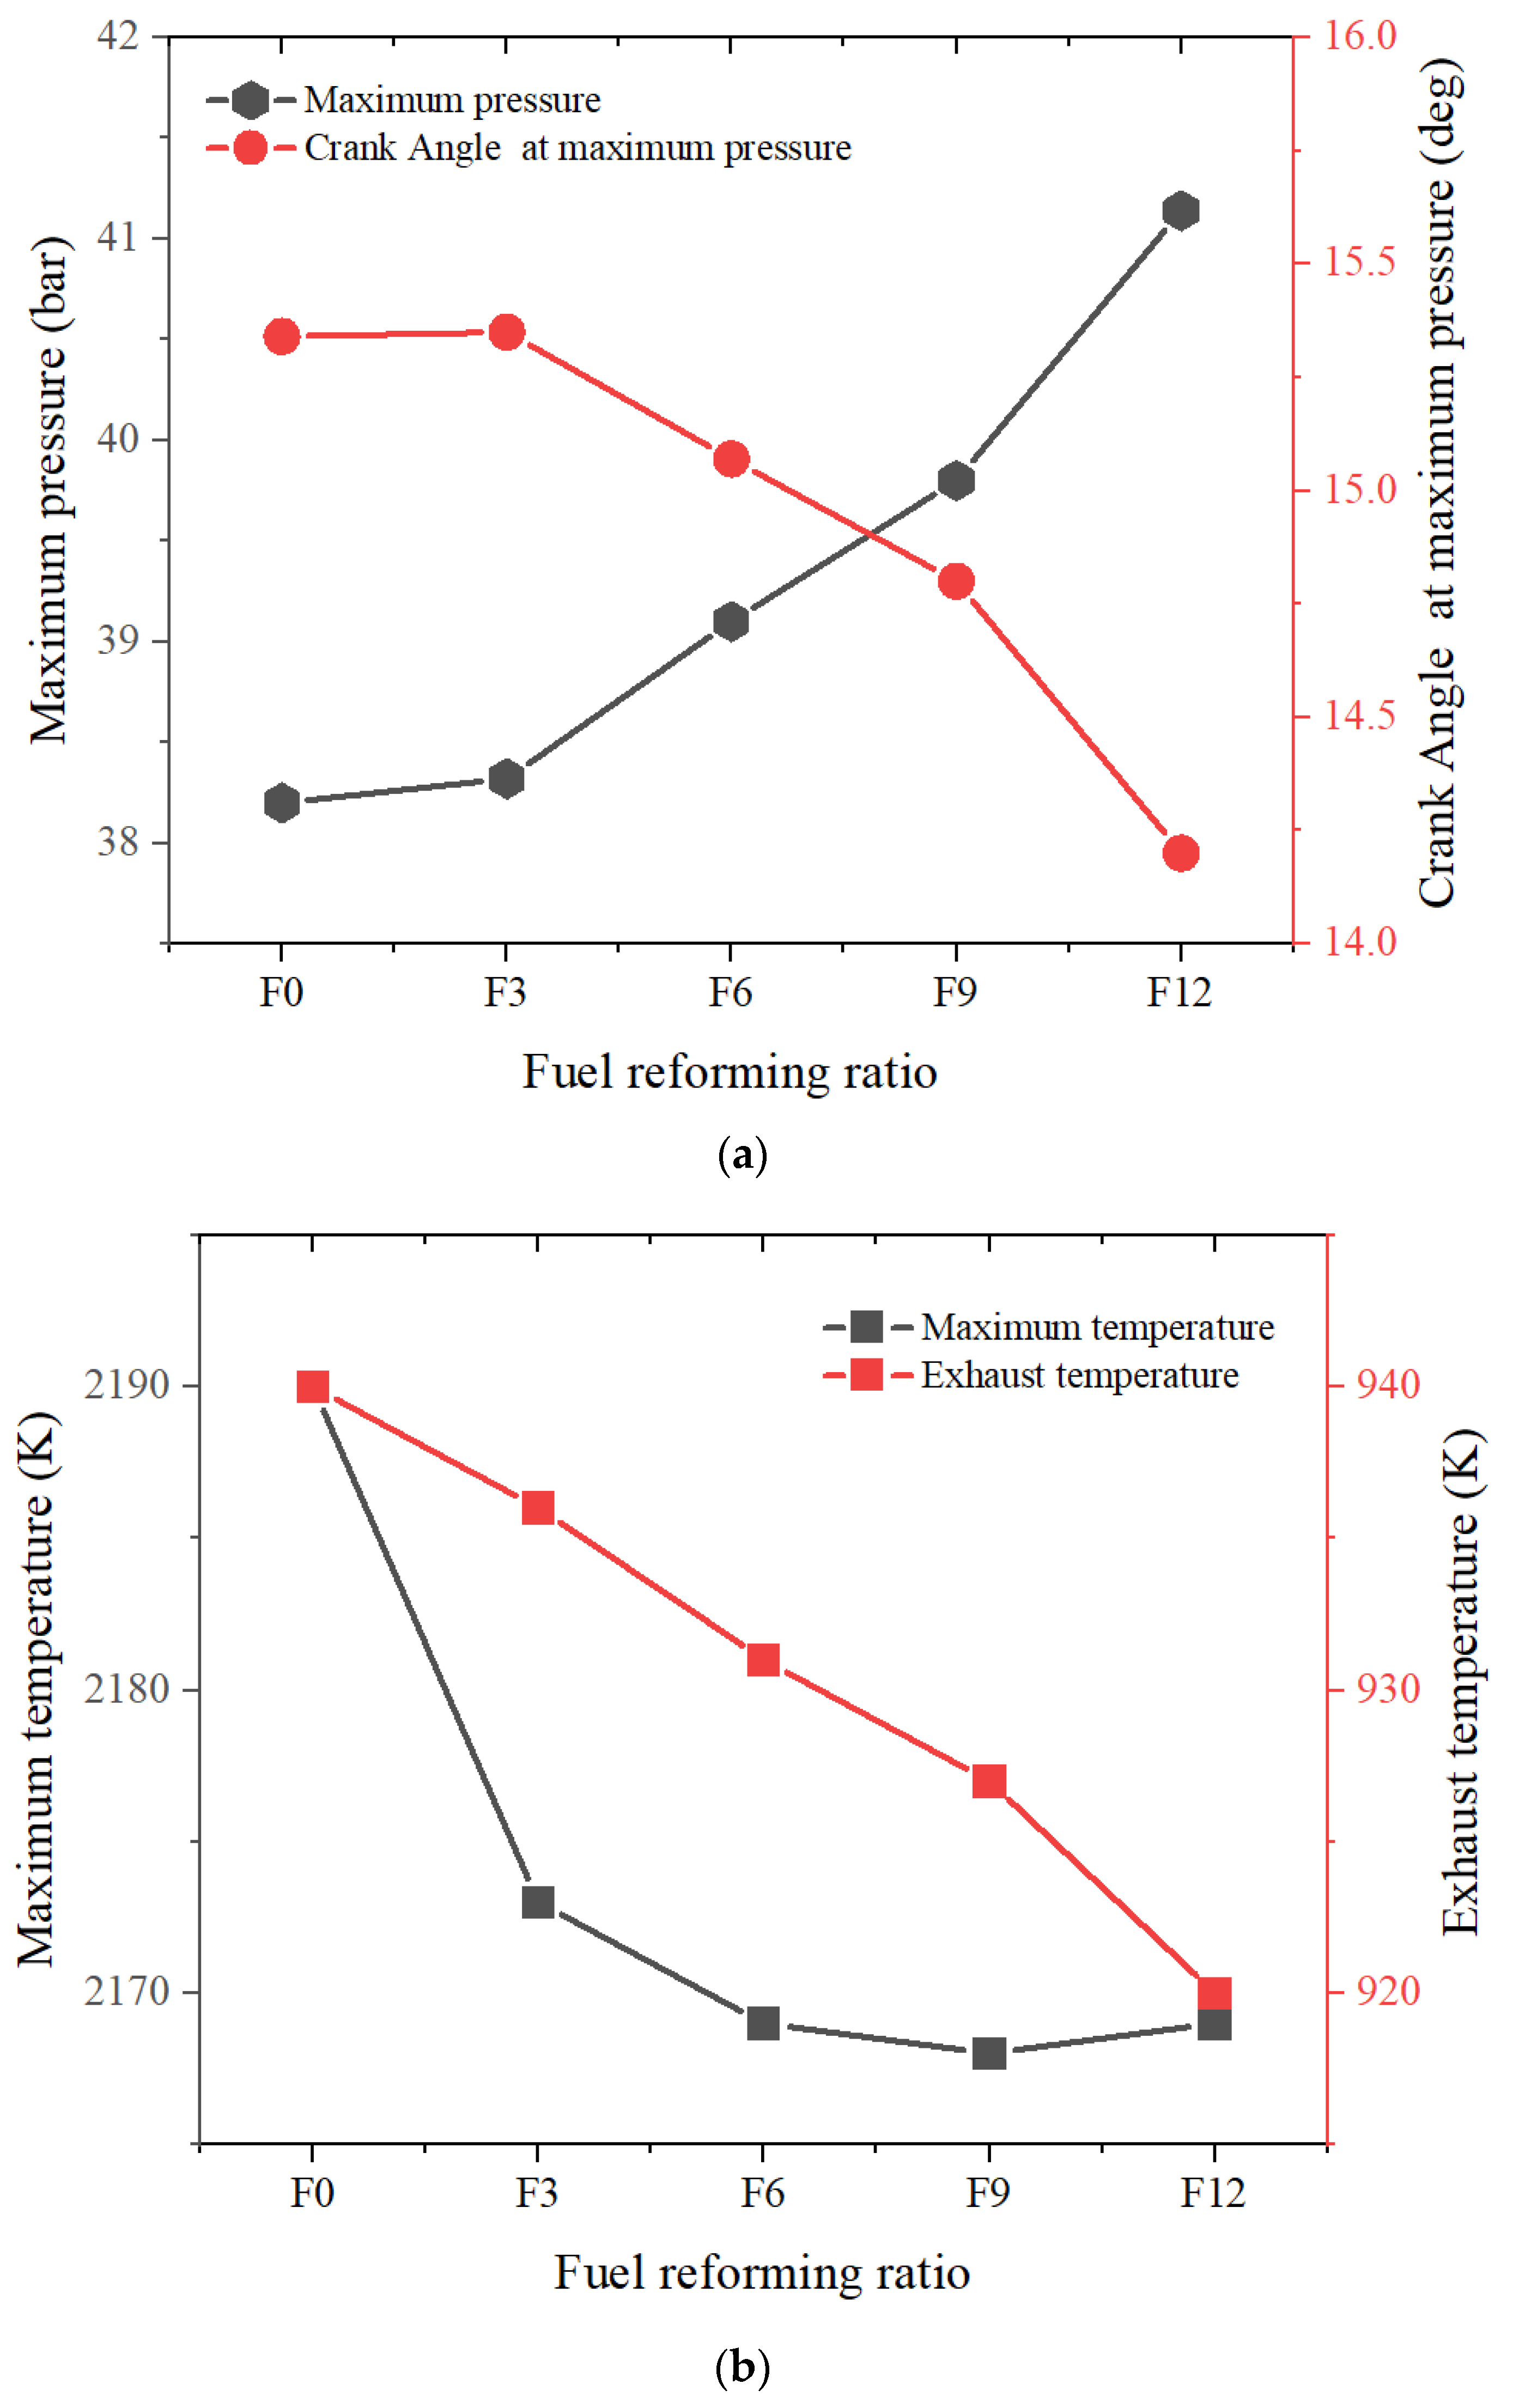
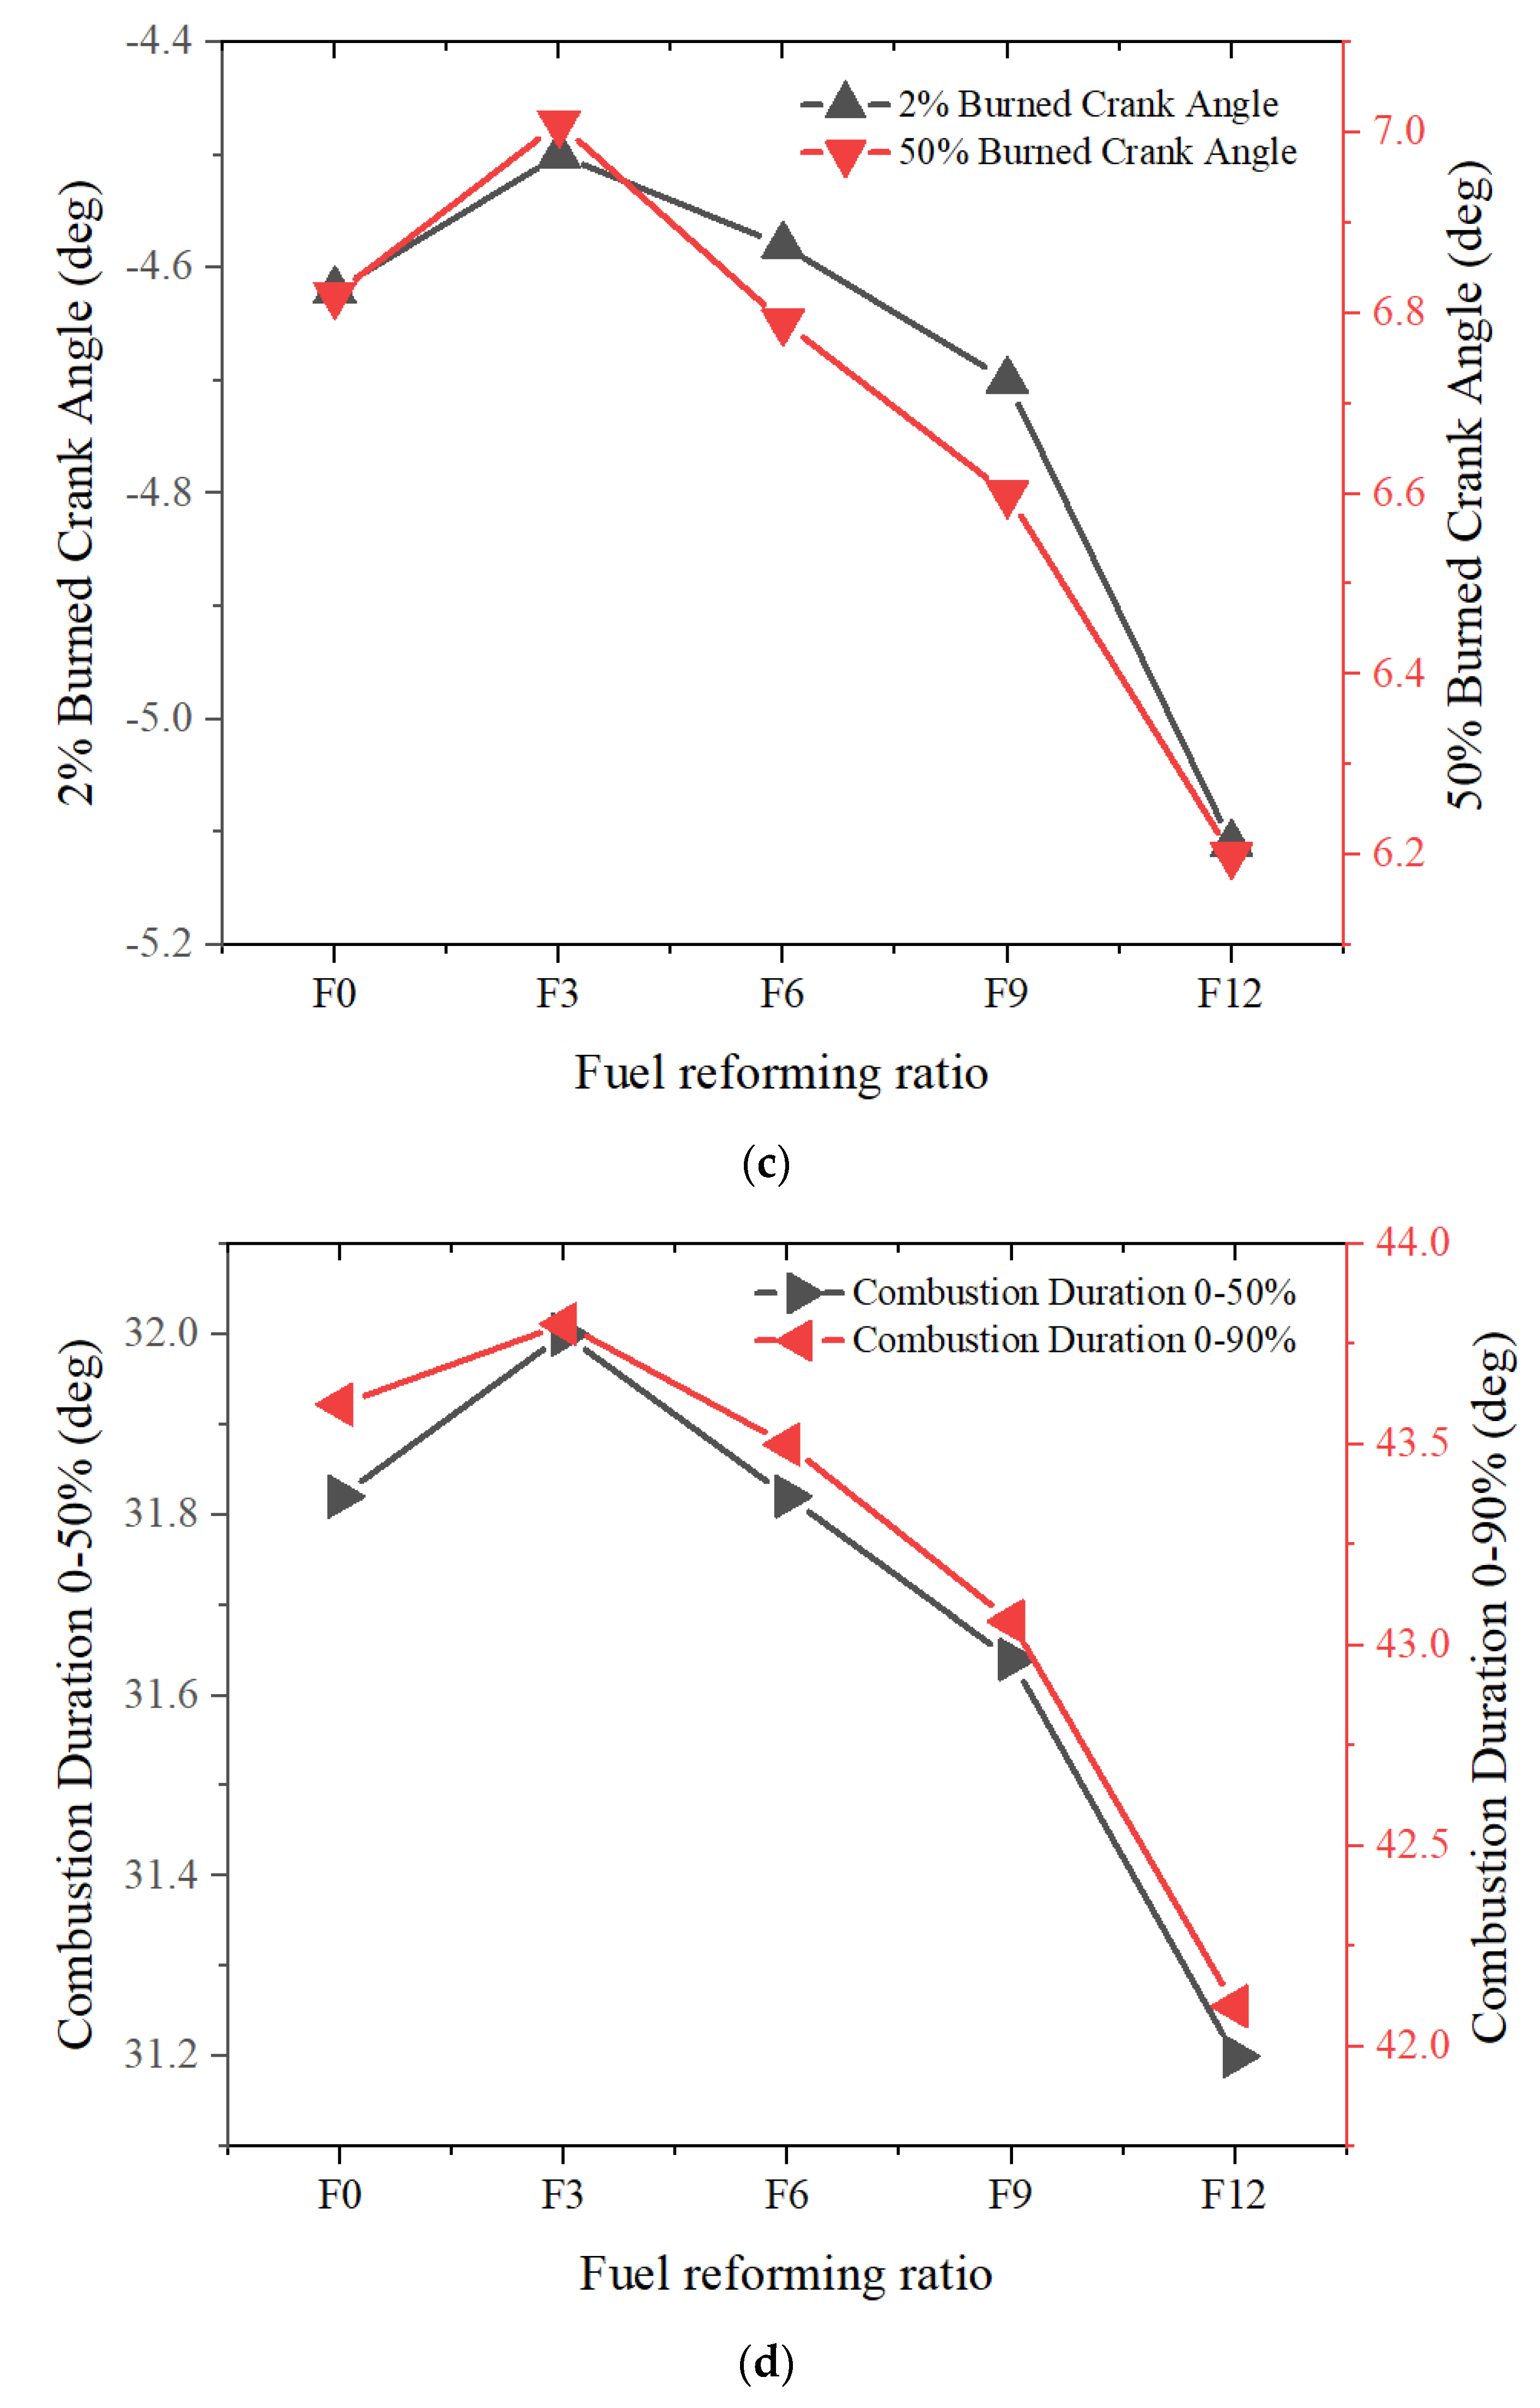
- Increasing the fuel-reforming ratio results in higher peak in-cylinder temperature and pressure at full load. However, only combustion with 9% and 12% fuel-reforming gases shifted the maximum pressure crank angle closer to the TDC and increased the maximum in-cylinder pressure compared to pure natural gas. This suggests that a fuel-reforming ratio of 9% and 12% can enhance the combustion performance of natural gas engines.
- As engine speed increases, the excess air ratio also increases, resulting in a more obvious impact of fuel reforming on in-cylinder combustion performance.
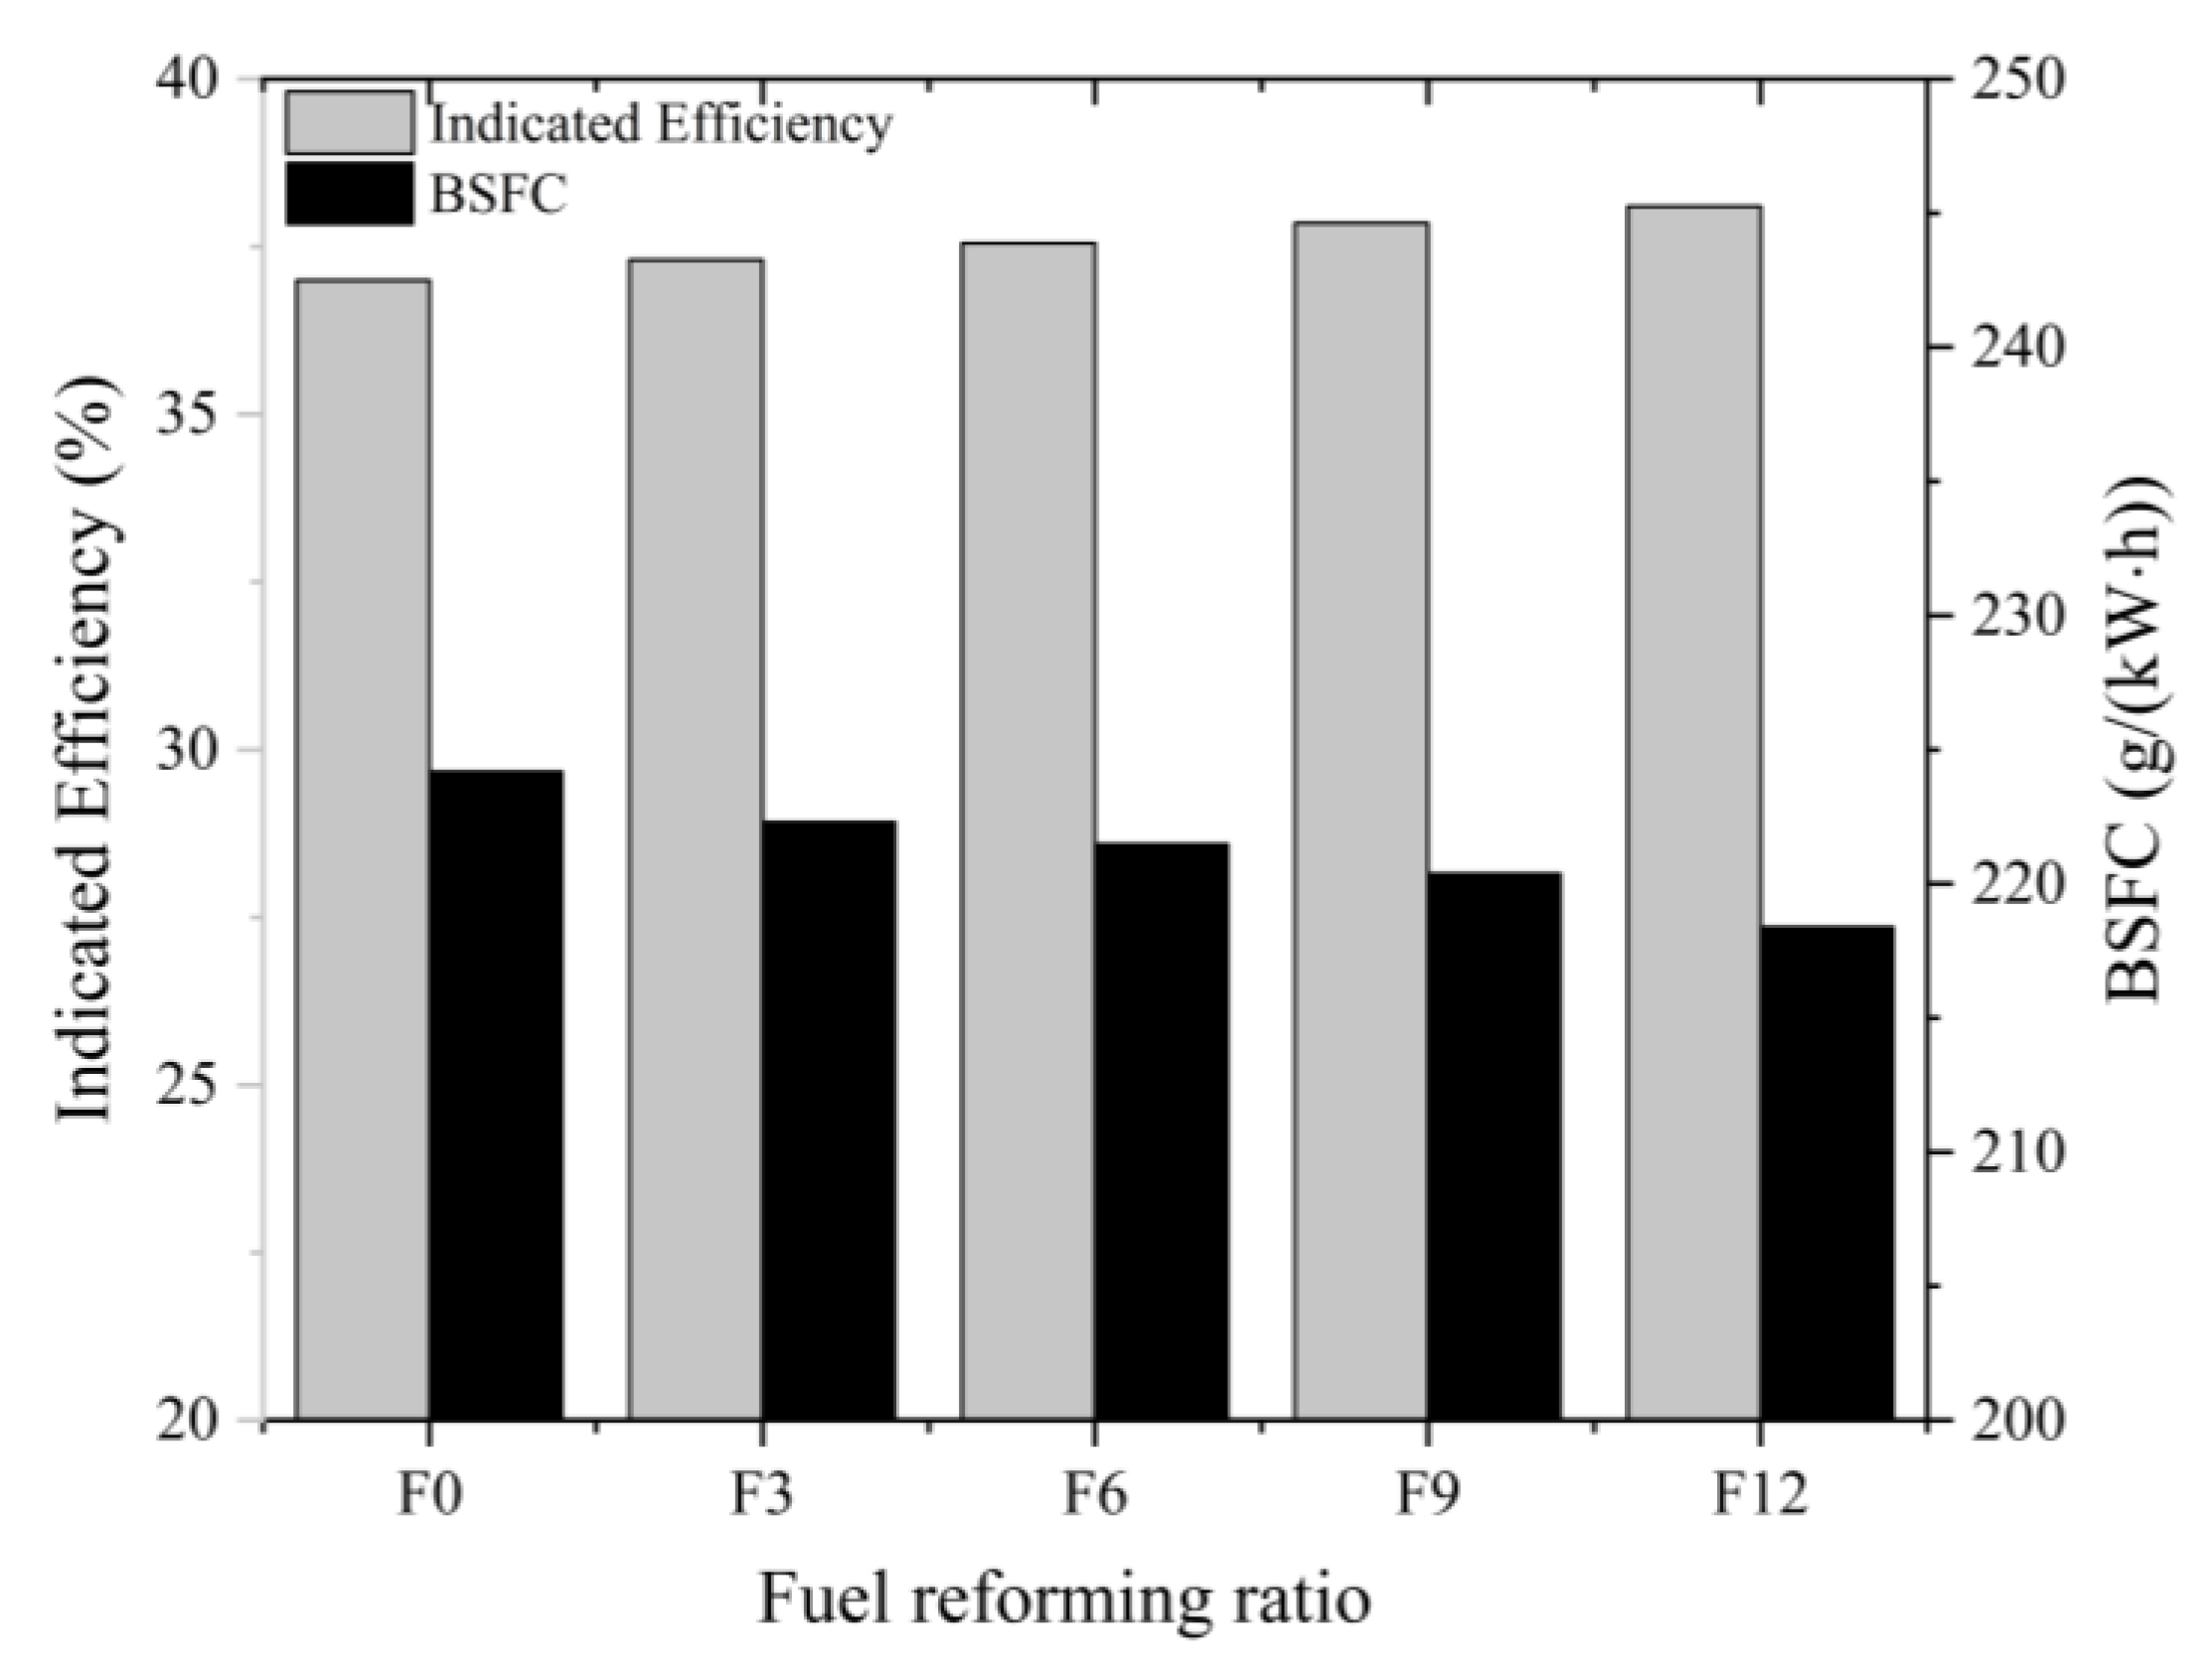
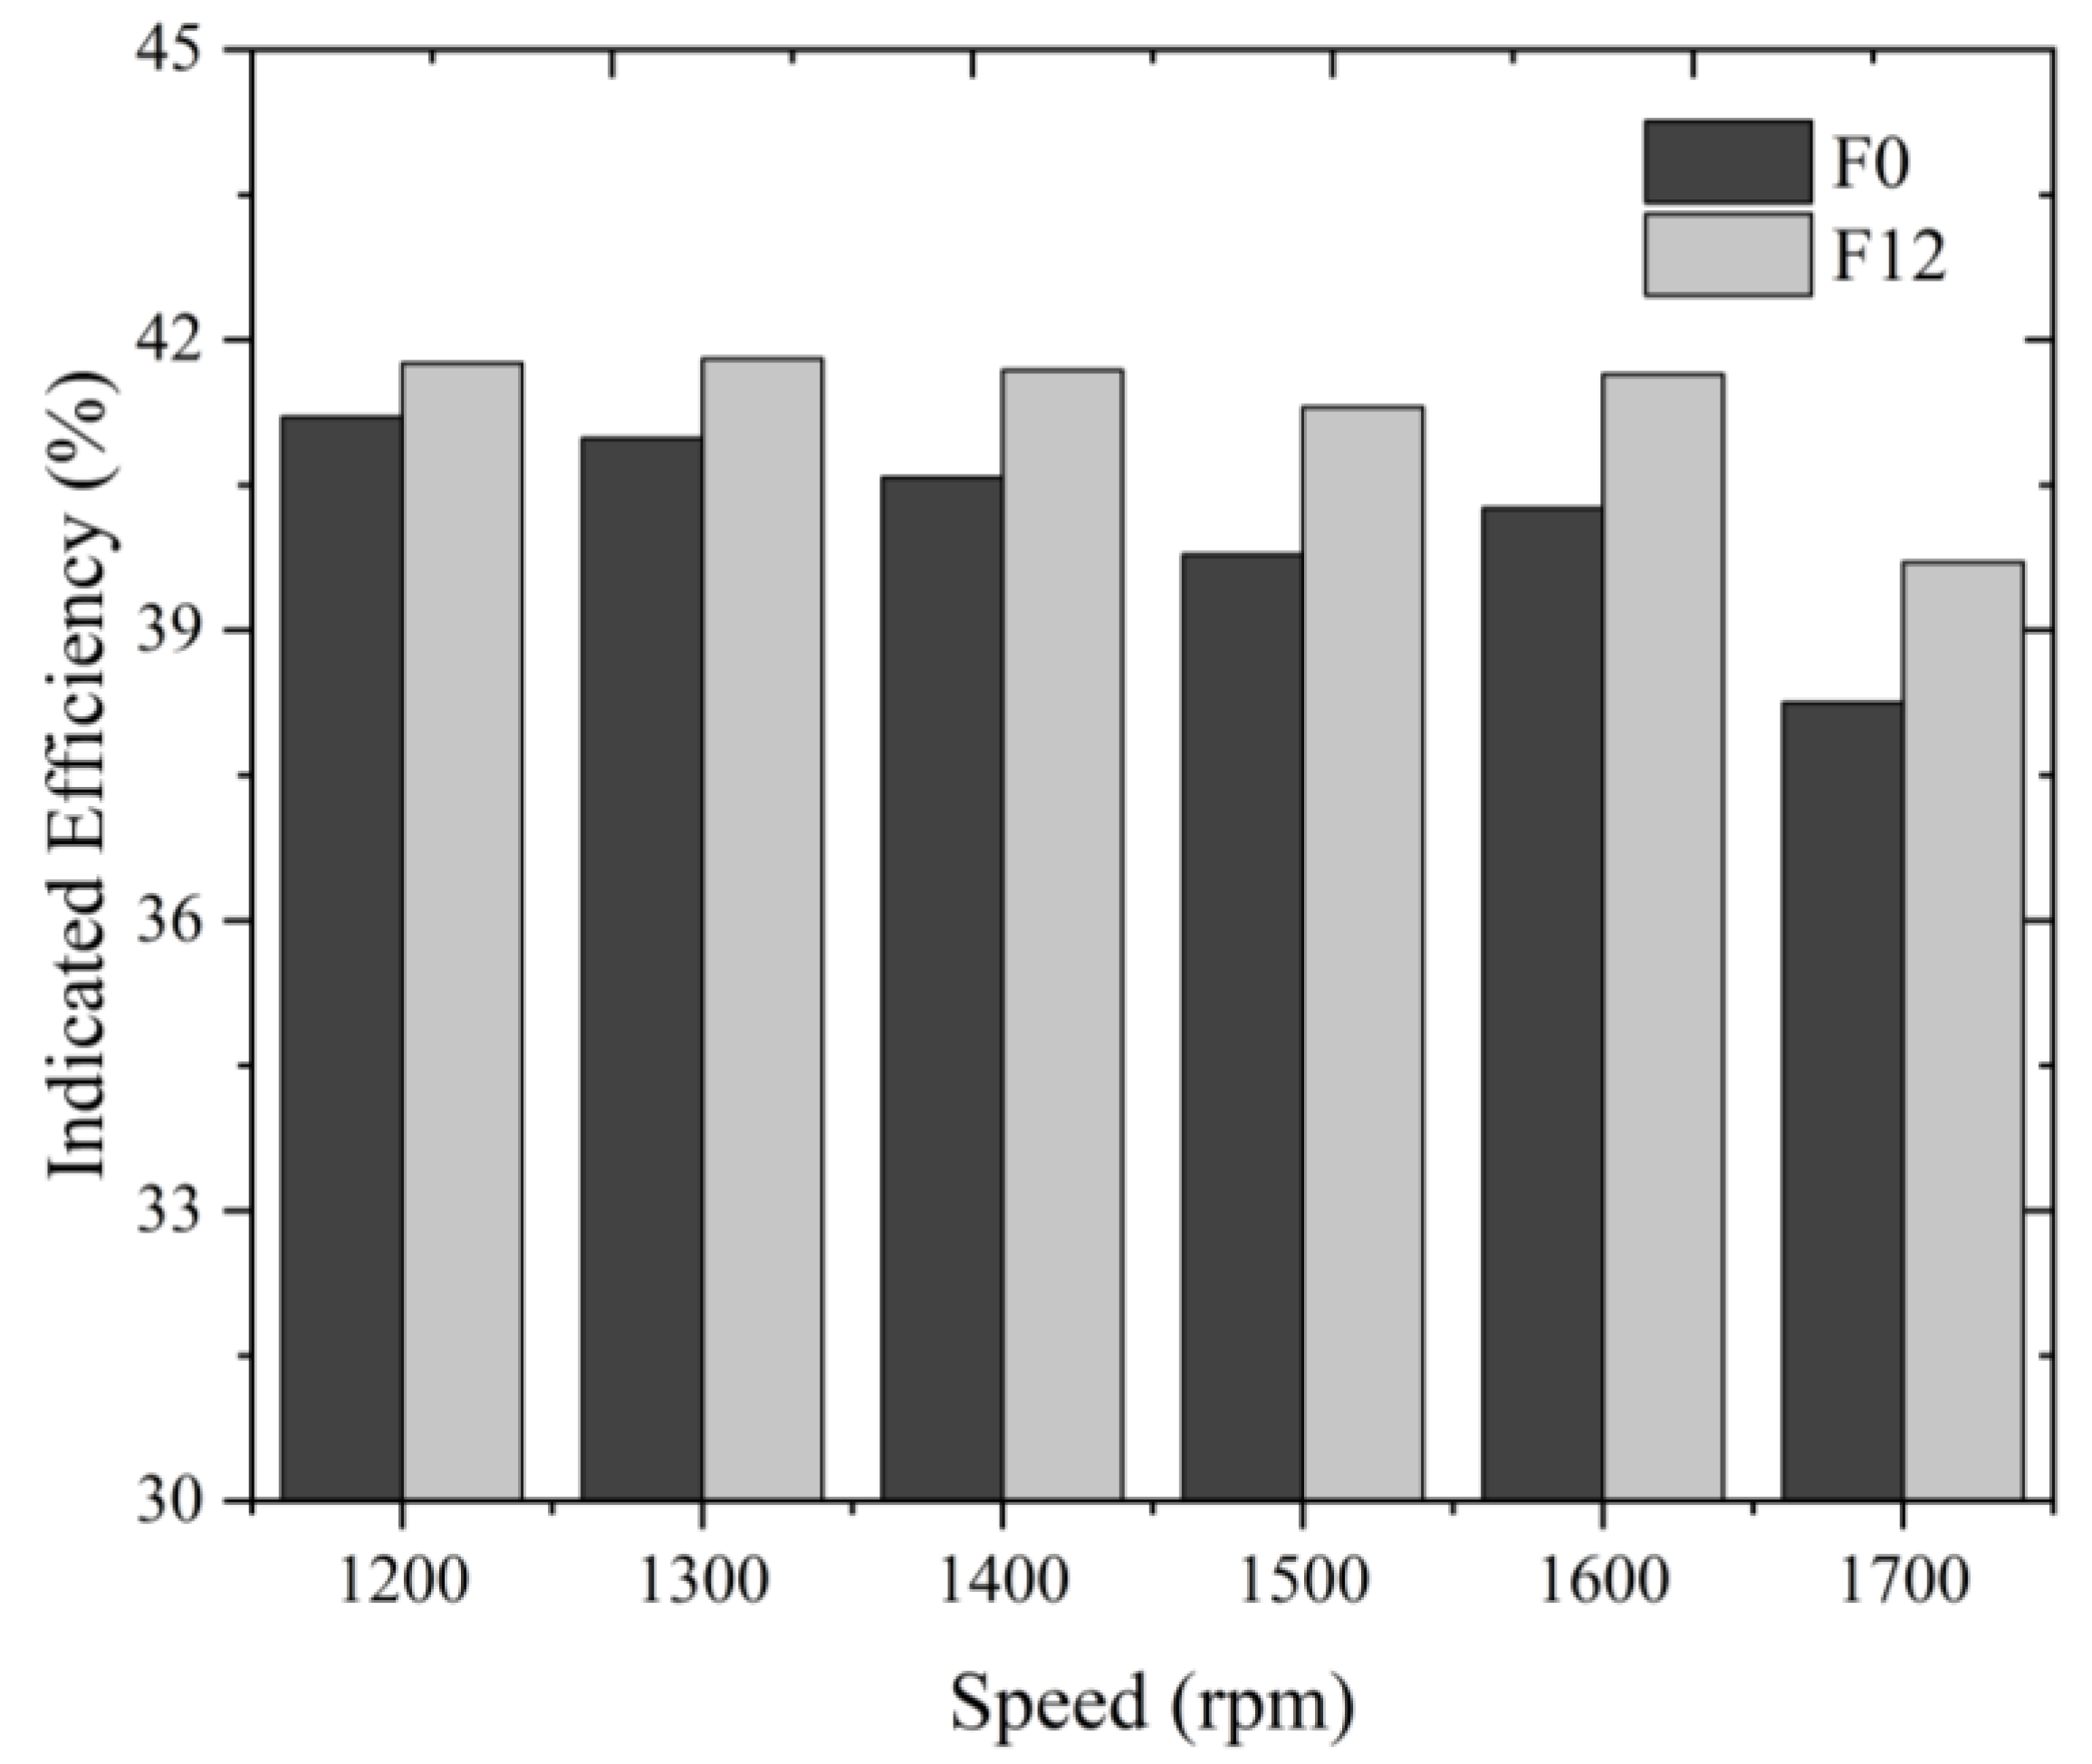
- Combustion with 12% fuel-reforming gases could enhance the indicated engine efficiency by 2% under a full-load condition of 1700 rpm but could have an adverse impact on the engine’s power performance.
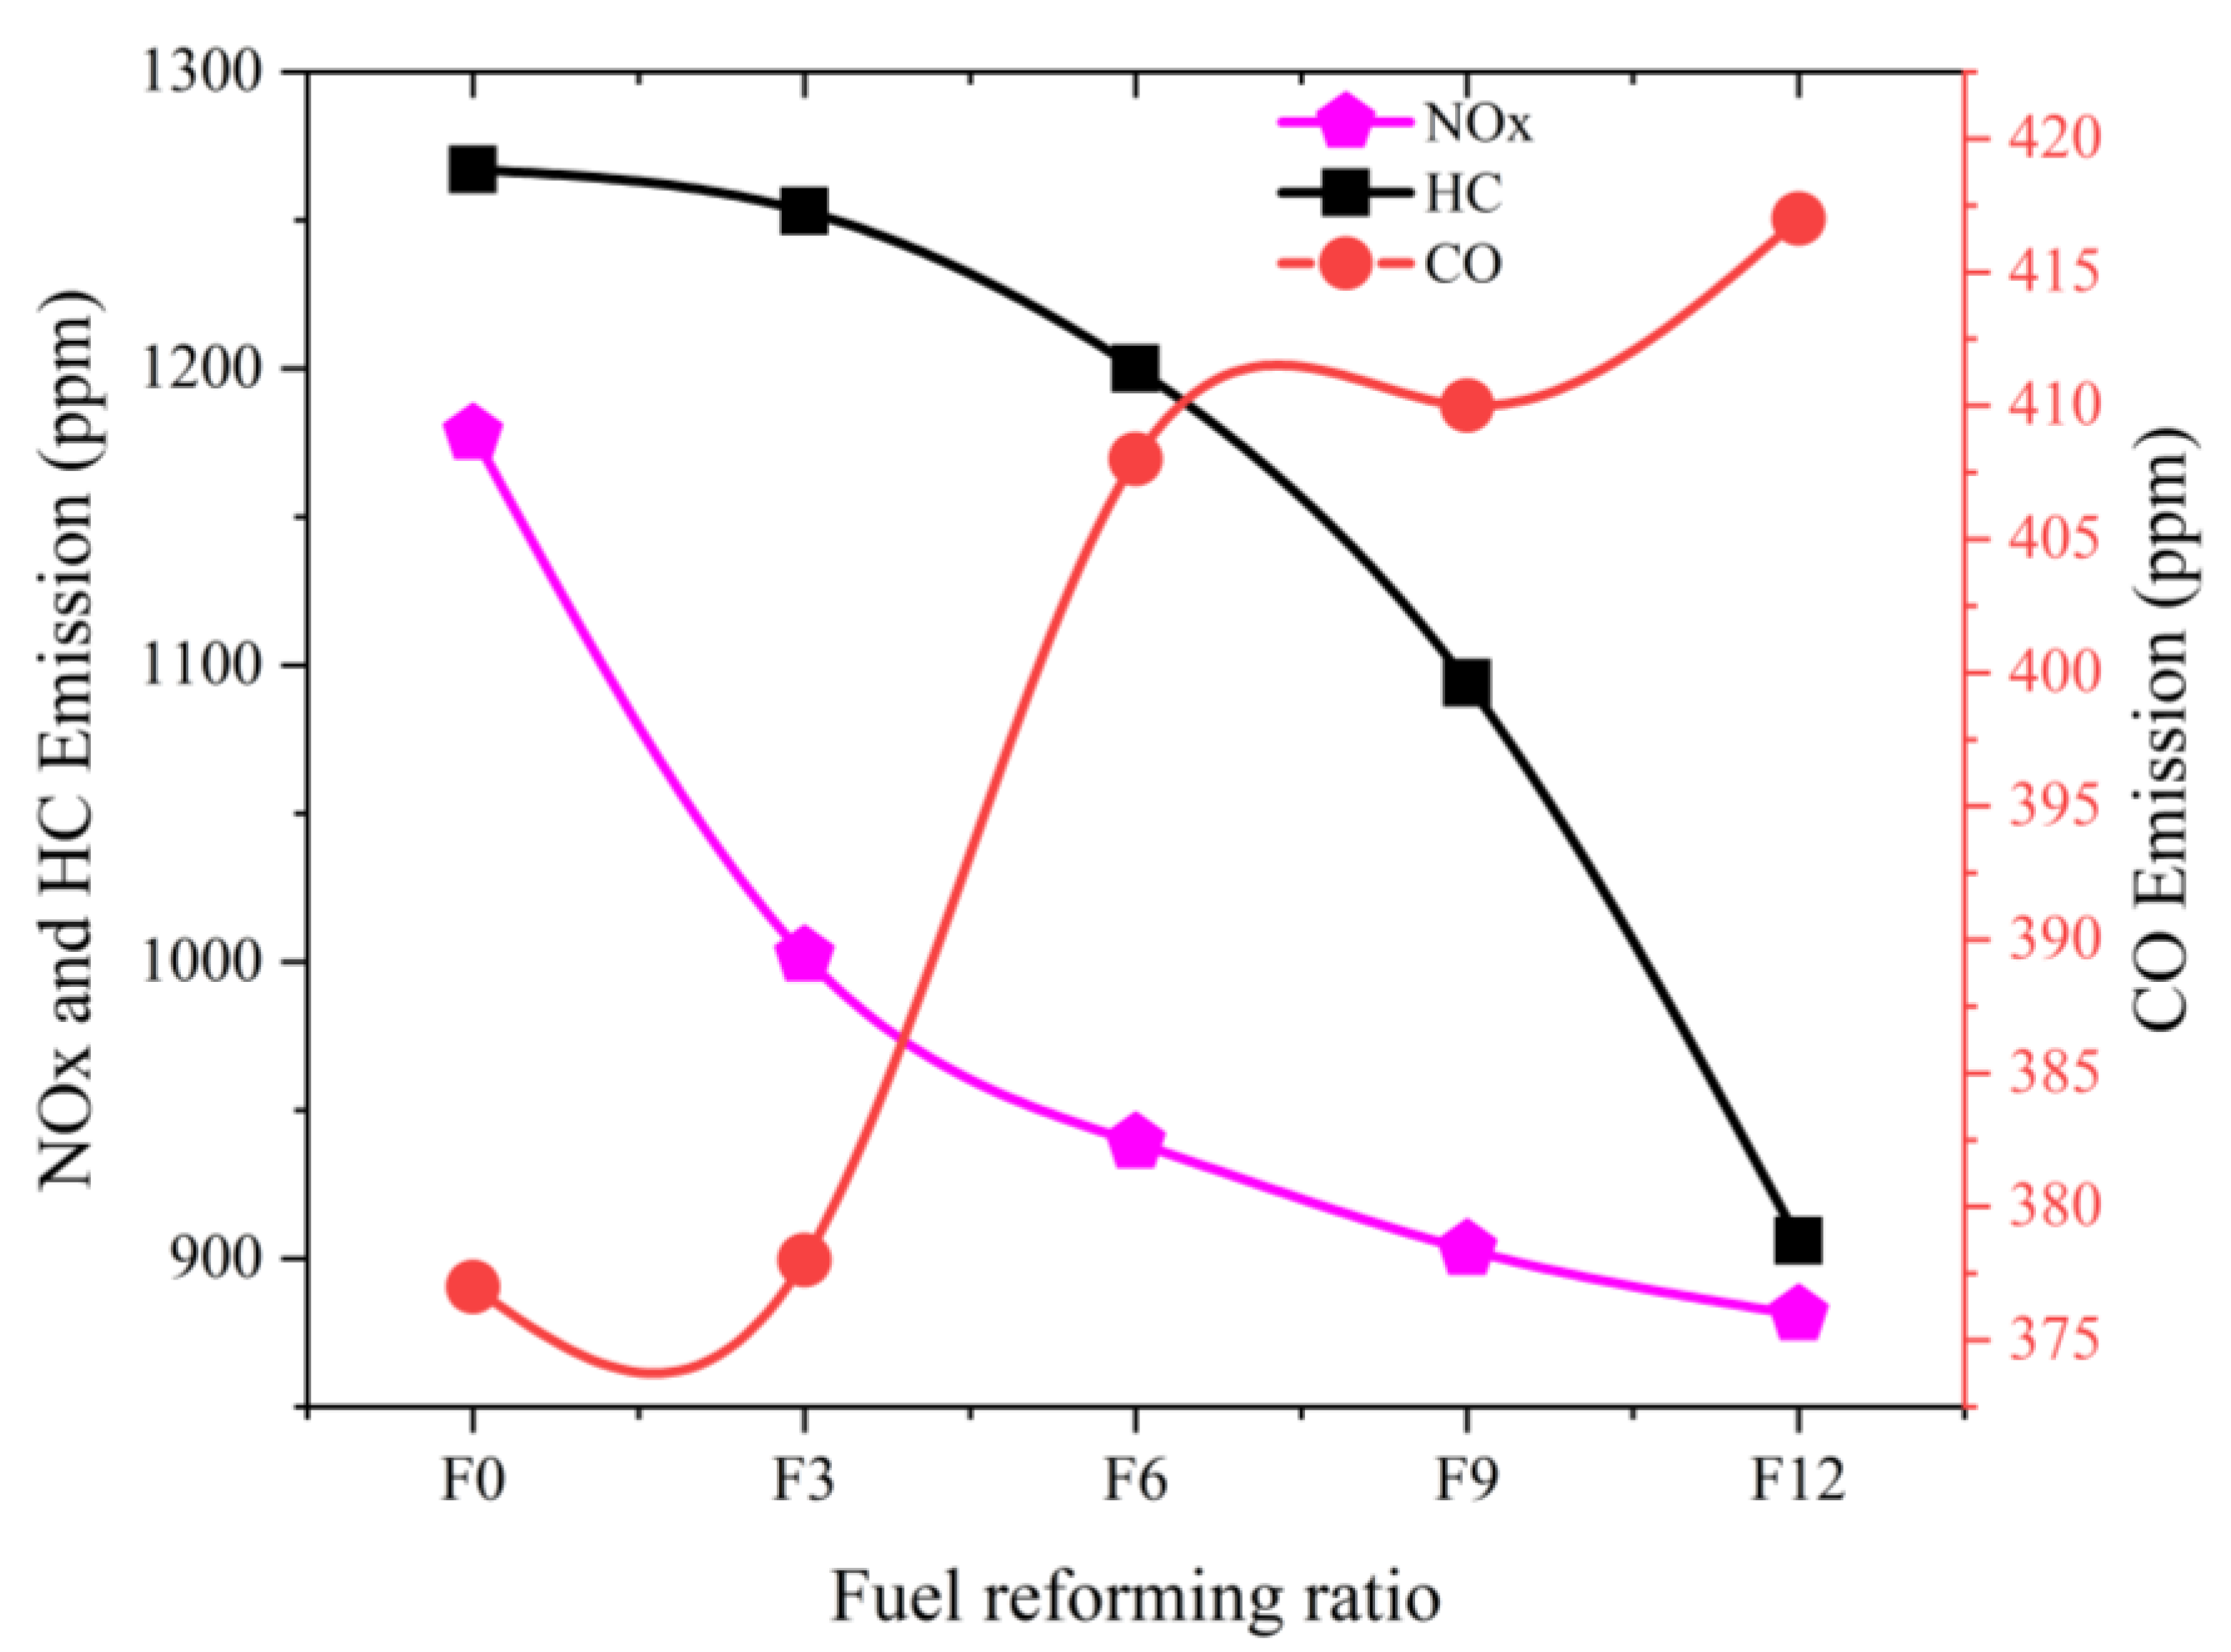
- The emissions of NOX and HC can be decreased significantly by increasing the fuel-reforming ratio. CH4 emissions were reduced by up to 33%, and NOX emissions were lowered by up to 20% at the full-load condition of 1200 rpm.
Author Contributions
Funding
Data Availability Statement
Conflicts of Interest
Abbreviations
| Φ | Equivalence ratio |
| BSFC | Brake-specific fuel consumption |
| °CA | Degrees crank angle |
| CA02 | Crank angle of 2% mass fraction burnt |
| CA50 | Crank angle of 50% mass fraction burnt |
| CO | Carbon monoxide |
| CO2 | Carbon dioxide |
| CNG | Compressed natural gas |
| D-EGR | Dedicated EGR |
| HC | Hydrocarbon |
| NOX | Nitrogen oxides |
| POFR | Partial oxidation fuel reforming |
| Rpm | Revolution per minute |
| SMR | Steam methane reforming |
| THC | Total hydrocarbon |
| WGS | Water–gas shift |
References
- Bae, C.; Kim, J. Alternative fuels for internal combustion engines. Proc. Combust. Inst. 2017, 36, 3389–3413. [Google Scholar] [CrossRef]
- Khan, M.I.; Yasmin, T.; Shakoor, A. Technical overview of compressed natural gas (CNG) as a transportation fuel. Renew. Sustain. Energy Rev. 2015, 51, 785–797. [Google Scholar] [CrossRef]
- Alois, K.; Heinz, H.; David, R.; Laura, L.; Robert, E.; Jean-François, L.; Kenneth, D.R.; Simon, G.; Heather, H.; Robin, N.; et al. JEC Well-to-Wheels Report Version 4a; Publications Office of the European Union: Luxembourg, 2014. [Google Scholar] [CrossRef]
- Poulton, M.L. Alternative Fuels for Road Vehicles; Computational Mechanics Publications: London, UK, 1994. [Google Scholar]
- Singh, S.; Mathai, R.; Singh, V.; Sehgal, A.K.; Basu, B.; Malhotra, R.K.; Nagarajan, S.; Yoganandam, S.; Kumar, G.S.; Gopal, G. Effect of Hydrogen on the Performance & Emission Characteristics of a 6.0 L Heavy Duty Natural Gas Engine; SAE Technical Paper 2014-01-2431; SAE: Warrendale, PA, USA, 2014. [Google Scholar] [CrossRef]
- Alrazen, H.A.; Ahmad, K.A. HCNG fueled spark-ignition (SI) engine with its effects on performance and emissions. Renew. Sustain. Energy Rev. 2018, 82, 324–342. [Google Scholar] [CrossRef]
- Lather, R.S.; Das, L.M. Performance and emission assessment of a multi-cylinder S.I engine using CNG & HCNG as fuels. Int. J. Hydrogen Energy 2019, 44, 21181–21192. [Google Scholar]
- Michikawauchi, R.; Tanno, S.; Ito, Y.; Kanda, M.; Kawauchi, M. Combustion Improvement of CNG Engines by Hydrogen Addition; SAE Technical Paper, 2011-01-1996; SAE: Warrendale, PA, USA, 2011. [Google Scholar] [CrossRef]
- Kim, J.; Chun, K.M.; Song, S.; Baek, H.K.; Lee, S.W. Effect of Hydrogen as an Additive on Lean Limit and Emissions of a Turbo Gasoline Direct Injection Engine; SAE Technical Papers; SAE: Warrendale, PA, USA, 2015. [Google Scholar] [CrossRef]
- Alger, T.; Mangold, B. Dedicated EGR: A New Concept in High Efficiency Engines. SAE Int. J. Engines 2009, 2, 620–631. [Google Scholar] [CrossRef]
- Robertson, D.; Chadwell, C.; Alger, T.; Zuehl, J.; Gukelberger, R.; Denton, B.; Smith, I. Dedicated EGR Vehicle Demonstration. SAE Int. J. Engines 2017, 10, 898–907. [Google Scholar] [CrossRef]
- Mitchell, R.; Kocsis, M. Performance Evaluation of Dedicated EGR on a 12 L Natural Gas Engine; SAE Technical Paper, 2019-01-114; SAE: Warrendale, PA, USA, 2019. [Google Scholar] [CrossRef]
- Thawko, A.; Persy, S.; Eyal, A.; Tartakovsky, L. Effects of Fuel Injection Method on Energy Efficiency and Combustion Characteristics of SI Engine Fed with a Hydrogen-Rich Reformate; SAE Technical Paper 2020–01-2082; SAE: Warrendale, PA, USA, 2020. [Google Scholar] [CrossRef]
- Weiss, B.; Beutel, T.W.; Chapman, B.R.; Saathoff, J.D.; Merchant, S.; Majano, G.J.; Weissman, W. Onboard Natural Gas Reforming for Heavy Duty Vehicles. SAE Int. J. Commer. Veh. 2019, 12, 45–56. [Google Scholar] [CrossRef]
- Gukelberger, R.; Gingrich, J.; Alger, T.; Almaraz, S. Potential and Challenges for a Water-Gas-Shift Catalyst as a Combustion Promoter on a D-EGR® Engine. SAE Int. J. Engines 2015, 8, 583–595. [Google Scholar] [CrossRef]
- Yap, D.; Peucheret, S.M.; Megaritis, A.; Wyszynski, M.L.; Xu, H. Natural gas HCCI engine operation with exhaust gas fuel reforming. Int. J. Hydrogen Energy 2006, 31, 587–595. [Google Scholar] [CrossRef]
- Long, Y.; Li, G.; Zhang, Z.; Liang, J. Application of reformed exhaust gas recirculation on marine LNG engines for NOx emission control. Fuel 2021, 291, 120114. [Google Scholar] [CrossRef]
- Zheng, J.; Zhou, R.; Zhan, R.; Lin, H. Combustion and emission characteristics of natural gas engine with partial-catalytic oxidation of the fuel. Fuel 2022, 312, 122796. [Google Scholar] [CrossRef]
- Verlato, E.; Barison, S.; Cimino, S.; Dergal, F.; Lisi, L.; Mancino, G.; Musiani, M.; Vázquez-Gómez, L. Catalytic partial oxidation of methane over nanosized Rh supported on Fecralloy foams. Int. J. Hydrogen Energy 2014, 39, 11473–11485. [Google Scholar] [CrossRef]
- Zheng, J.; Zhou, R.; Zheng, Z.; Zhang, Y.; Lin, H. Effects of excess air ratio and spark timing on performance and gaseous pollutant emissions of fuel reforming natural gas engine. Int. J. Engine Res. 2023, 24, 2649–2659. [Google Scholar] [CrossRef]
- Dziubak, T.; Karczewski, M. Experimental Study of the Effect of Air Filter Pressure Drop on Internal Combustion Engine Performance. Energies 2022, 15, 3285. [Google Scholar] [CrossRef]
- Varghese, R.J.; Kolekar, H.; Kumar, S. Laminar burning velocities of H2/CO/CH4/CO2/N2-air mixtures at elevated temperatures. Int. J. Hydrogen Energy 2019, 44, 12188–12199. [Google Scholar] [CrossRef]
- Heywood, J.B. Internal Combustion Engine Fundamentals; McGraw-Hill: New York, NY, USA, 1988; pp. 567–659. [Google Scholar]
- Liao, S.Y.; Jiang, D.M.; Cheng, Q. Determination of laminar burning velocities for natural gas. Fuel 2004, 83, 1247–1250. [Google Scholar] [CrossRef]
- Kahraman, N.; Çeper, B.; Akansu, S.O.; Aydin, K. Investigation of combustion characteristics and emissions in a spark-ignition engine fuelled with natural gas–hydrogen blends. Int. J. Hydrogen Energy 2009, 34, 1026–1034. [Google Scholar] [CrossRef]


| Engine Parameters | Specifications |
|---|---|
| Number of cylinders | 6 |
| Bore × Stroke (mm) | 128 × 153 |
| Displacement (L) | 12 |
| Compression ratio | 12:1 |
| Rated power (kW) | 310 |
| Rated speed (rpm) | 1900 |
| Maximum torque(N m) | 1750 |
| Maximum torque related speed (rpm) | 1400 |
| Combustion mode | Lean burn |
| Blended Fuel Components | |||||
|---|---|---|---|---|---|
| Fuel reforming ratio (%) | 0 | 3 | 6 | 9 | 12 |
| CNG (%) | 100 | 95.3 | 89.6 | 85.7 | 79.3 |
| H2 (%) | 0 | 3.0 | 6.6 | 9.3 | 13.4 |
| CO (%) | 0 | 1.3 | 3.1 | 4.1 | 6.1 |
| CO2 (%) | 0 | 0.4 | 0.7 | 0.9 | 1.2 |
| Fuel reforming ratio (%) | 0 | 3 | 6 | 9 | 12 |
| Low calorific value (MJ/kg) | 48.6 | 47.5 | 46.2 | 45.5 | 44.0 |
| Measurements | Measurement Range | Accuracy |
|---|---|---|
| Power | 0~450 kW | ±1 rpm |
| Torque | 0~2500 Nm | ±1 Nm |
| Fuel flow rate | 0~150 kg/h | ±0.1 kg/h |
| Air flow rate | 0~3000 kg/h | ±0.8% measured value |
| NOX | 0~5000 ppm | ±5 ppm |
| THC | 0~30,000 ppm | ±5 ppm |
| CO | 0~5000 ppm | ±2 ppm |
| Temperature | 0~1000 °C | ±1 °C |
| Pressure | 80–120 kPa | ±1 kPa |
| Rotational Speed (r/min) | 1200 | 1300 | 1400 | 1500 | 1600 | 1700 |
|---|---|---|---|---|---|---|
| Equivalence ratio () | 0.655 | 0.652 | 0.65 | 0.65 | 0.65 | 0.645 |
| Spark timing (deg) | −23 | −24 | −25 | −25 | −27 | −29 |
Disclaimer/Publisher’s Note: The statements, opinions and data contained in all publications are solely those of the individual author(s) and contributor(s) and not of MDPI and/or the editor(s). MDPI and/or the editor(s) disclaim responsibility for any injury to people or property resulting from any ideas, methods, instructions or products referred to in the content. |
© 2023 by the authors. Licensee MDPI, Basel, Switzerland. This article is an open access article distributed under the terms and conditions of the Creative Commons Attribution (CC BY) license (https://creativecommons.org/licenses/by/4.0/).
Share and Cite
Wang, M.; Zhou, R.; Guan, M.; Zheng, J.; Yi, F. Numerical Study on the Effects of Partial Oxidation Fuel Reforming (POFR) on the Performance of a Natural Gas Engine. Energies 2023, 16, 7909. https://doi.org/10.3390/en16237909
Wang M, Zhou R, Guan M, Zheng J, Yi F. Numerical Study on the Effects of Partial Oxidation Fuel Reforming (POFR) on the Performance of a Natural Gas Engine. Energies. 2023; 16(23):7909. https://doi.org/10.3390/en16237909
Chicago/Turabian StyleWang, Mingda, Rui Zhou, Min Guan, Jian Zheng, and Fei Yi. 2023. "Numerical Study on the Effects of Partial Oxidation Fuel Reforming (POFR) on the Performance of a Natural Gas Engine" Energies 16, no. 23: 7909. https://doi.org/10.3390/en16237909
APA StyleWang, M., Zhou, R., Guan, M., Zheng, J., & Yi, F. (2023). Numerical Study on the Effects of Partial Oxidation Fuel Reforming (POFR) on the Performance of a Natural Gas Engine. Energies, 16(23), 7909. https://doi.org/10.3390/en16237909