Article

Thermodynamic Evaluation of the Energy Self-Sufficiency of the Tyre Pyrolysis Process

by
Alexander A. R. Gamboa
1,*,†,
Leila R. dos Santos
2,†,
Cristiane A. Martins
2,†,
Ana M. A. Rocha
3,†,
Carlos A. Alvarado-Silva
1,† and
João A. de Carvalho, Jr.
4,†
1
Programa de Investigación Formativa e Integridad Científica, Universidad César Vallejo, Trujillo CEP 13001, Peru
2
Combustion, Propulsion and Energy Laboratory, Technological Institute of Aeronautics, São José dos Campos CEP 12228-900, Brazil
3
School of Mines, Federal University of Ouro Preto, Ouro Preto CEP 35400-000, Brazil
4
Campus of Guaratinguetá, São Paulo State University, Guaratinguetá CEP 12516-410, Brazil
*
Author to whom correspondence should be addressed.
These authors contributed equally to this work.
Energies 2023, 16(24), 7932; https://doi.org/10.3390/en16247932
Submission received: 25 September 2023 / Revised: 18 October 2023 / Accepted: 19 October 2023 / Published: 6 December 2023
(This article belongs to the Section J2: Thermodynamics)

Abstract

:
The aim of this paper is to evaluate the energy self-sufficiency of the tyre pyrolysis process using the pyrolysis gas produced as a heat source. Experimental data on the properties of the tyre and the main pyrolysis products (char, pyrolysis gas, and condensable vapours) have been compiled for a pyrolysis temperature range from 698 to 848 K. The laws of thermodynamics were used to calculate the energy demand of the tyre pyrolysis process, which was divided into heat for the pyrolysis reaction and heat transferred to the carrier gas. The pyrolysis gas was composed of 15 components, and its composition was calculated using a nonstoichiometric equilibrium model. For the temperature range studied, the heat required for the pyrolysis reaction was between 1.41 and 2.16 kJ/g of tyre. In addition, hydrocarbons (71 to 73 wt.%) were the major components in the calculated pyrolysis gas composition. An average lower heating value of 37.3 MJ/kg was calculated for the pyrolysis gas. The heat required for the tyre pyrolysis reaction was provided for burning 30–50% of the pyrolysis gas produced, thus making it self-sustaining. Energy self-sufficiency may not be achieved if the heat losses due to poor reactor insulation are high. However, this problem can be overcome by heating the combustion air using the heat released by the pyrolysis products during cooling.

1. Introduction

The environmentally correct disposal of unusable tyres is a critical issue worldwide, with the demand for tyres growing by about 4.3% annually [1]. According to the World Business Council for Sustainable Development’s 2019 report, countries covering 89% of the world’s vehicles generated 30.9 million tonnes of unusable tyres in 2018. The countries that generated the most waste tyres were China, the United States, India, Japan, and Russia [2].
Pyrolysis has been presented as an environmentally sound method for disposing of unusable tyres. The products of tyre pyrolysis consist of three phases: liquid, solid, and gas. The liquid phase is called tyre pyrolysis oil (TPO), and its properties (low viscosity and high heating power) have attracted much attention in the scientific community. These properties have motivated the experimental investigation of its use as an alternative fuel in furnaces [3,4], boilers [5] and compression ignition engines [6,7,8]. The gas fraction, in turn, is an attractive energy source due to its high calorific value (about 44 MJ/kg) [9], which can meet the energy needs of the tyre pyrolysis process. On the other hand, the high calorific value of char (the solid phase) must be highlighted: although it is lower than that of the original tyre, it can be compared to that of good quality coal [10].
Pyrolysis is attractive not only because of the use of used tyres as raw material, but also because of the possibility of energy self-sufficiency within the process [11,12]. Some papers [13,14,15] have reported the energy requirements (electricity, fuel consumption, and microwave power) of the tyre pyrolysis process as a secondary result. Frigo et al. [13] reported energy (electrical) requirements between 0.90 and 2.10 kWh/kg for tyre material, which were consumed by an electric motor and electrical resistances. The motor was used to run the reactor (twin screw extruder type) continuously, while the resistances were used to heat the reactor to the necessary temperatures (573 to 773 K) to pyrolyse the tyre material. In the work of Lopez et al. [14], the energy requirement was reported as fuel consumption, with 0.15 kg of propane calculated to be required per kg of tyre material pyrolysed at 823 K in a pyrolysis unit operating at a batch scale. On the other hand, in the work of Song et al. [15], the energy demand of the tyre pyrolysis process was reported in terms of microwave power, as the system used consisted of a microwave oven and a quartz reactor. The microwave pyrolysis system consumed between 9 and 24 W per gram of tyre material, and it reached temperatures between 688 and 847 K. However, we did not find any studies in the literature that focused on determining this value (after searching the Web of Science and Scopus platforms (The keywords used in the research were the following: heat for pyrolysis, tyre, energy self-sufficiency). We only found secondary results with limited discussion on the electricity consumption [13], fuel consumption [14], and microwave power demand [15] of the tyre pyrolysis process. The only value found was that in the review article by Antonio and Zabaniatou [16], which was obtained from data published in the CalRecovery Report No. 1364 [17]. According to this, the heat requirement to sustain tyre pyrolysis is between about 1.47 and 2.38 kJ/g of feedstock (the pyrolysis temperature was not given).
At present, efforts have only been focused on determining the pyrolysis heat of other types of biomass [18,19,20], thus showing the importance of knowing this value for the design of reactors. Yang et al. [18] calculated the heat required for the pyrolysis of five types of biomass (cedar, pine, willow, bamboo, and sasa bamboo). The estimated heat value for pyrolysis at 773 K for the five biomass samples was 1.2 kJ/g on average, which increased to 1.5 kJ/g when the pyrolysis temperature was 823 K. Daugaard and Brown [19] performed experiments to estimate the heat needed for pyrolysis at 773 K of woody biomass (Northern Red Oak and Western White Pine) and herbaceous biomass (corn stover and oat hulls). For the pine and oak, the heat values needed for pyrolysis at 773 K were 1.77 ± 0.33 and 1.61 ± 0.26 kJ/g, respectively, while for the corn stover and oat hulls, the values were 1.53 ± 0.56 and 1.04 ± 0.18 kJ/g, respectively. Reed and Gaur [20] analyzed the heat necessary to pyrolyse birch wood, which they carried out in a Meeker burner. The heat values calculated by Reed and Gaur [20] were 3.47, 3.28, and 2.91 kJ/g of dry biomass at 1273 K.
Although the literature is mainly concerned with the energy requirements for the pyrolysis of plant biomass [18,19,20], the use of tyre pyrolysis technology is well established in the world, with some countries processing large portions of their unusable tyres through pyrolysis (e.g., Indonesia and Thailand process 30% and 35%, respectively) [2]. In Brazil, the figure is only 2%, but the potential for producing tyre pyrolysis oil is 280 thousand m 3 per year [21]. Furthermore, the energetic advantages of tyre pyrolysis gas in terms of calorific value (>40 MJ/kg [22]) compared to plant biomass pyrolysis gas (<20 MJ/kg [23]) suggest the possibility of obtaining an energetically self-sustaining tyre pyrolysis process. However, little emphasis has been placed on the energy demands of tyre pyrolysis, with the emphasis typically placed on the pyrolysis of plant biomass [18,19,20].
Therefore, this work aims to evaluate the energy self-sufficiency of the tyre pyrolysis process using the laws of thermodynamics. For this purpose, the energy requirements of the tyre pyrolysis process were determined under different operating conditions of the proposed pyrolysis system. The gaseous fraction resulting from the pyrolysis of tyre material was used as a heat source to meet the energy needs of the process, and, therefore, its composition was determined. The pyrolysis gas composition was obtained using an equilibrium model based on Gibbs free energy minimisation. In addition, an extensive compilation of experimental data was carried out to support the results obtained and to simulate pyrolysis conditions that were close to real ones.

2. Materials and Methods

The energy self-sufficiency of the tyre pyrolysis process was evaluated considering the following pyrolysis system operating at a pressure of 1 atm, Figure 1.
Figure 1 shows the pyrolysis system studied with the pyrolysis gas produced as the heat source. The pyrolysis process consists of heating the reactor until it reaches a temperature (pyrolysis temperature > 400 K) at which the thermal degradation of the tyre begins, i.e., with the release of vapours (pyrolysis vapours). When the tyre loses almost all of its volatile components, it becomes char, which leaves the reactor at the pyrolysis temperature. The vapours released during the pyrolysis reaction are transported out of the reactor with the help of an inert gas such as nitrogen ( N 2 as a carrier gas). The pyrolysis vapours leaving the reactor at the pyrolysis temperature are cooled (in a condenser) until two new products are formed: tyre pyrolysis gas and tyre pyrolysis oil (TPO, which is measured as a condensable fraction).
In order to evaluate whether it is possible to meet the energy demand by burning the pyrolysis gas produced, the pyrolysis process is idealised so that the laws of thermodynamics can be applied.

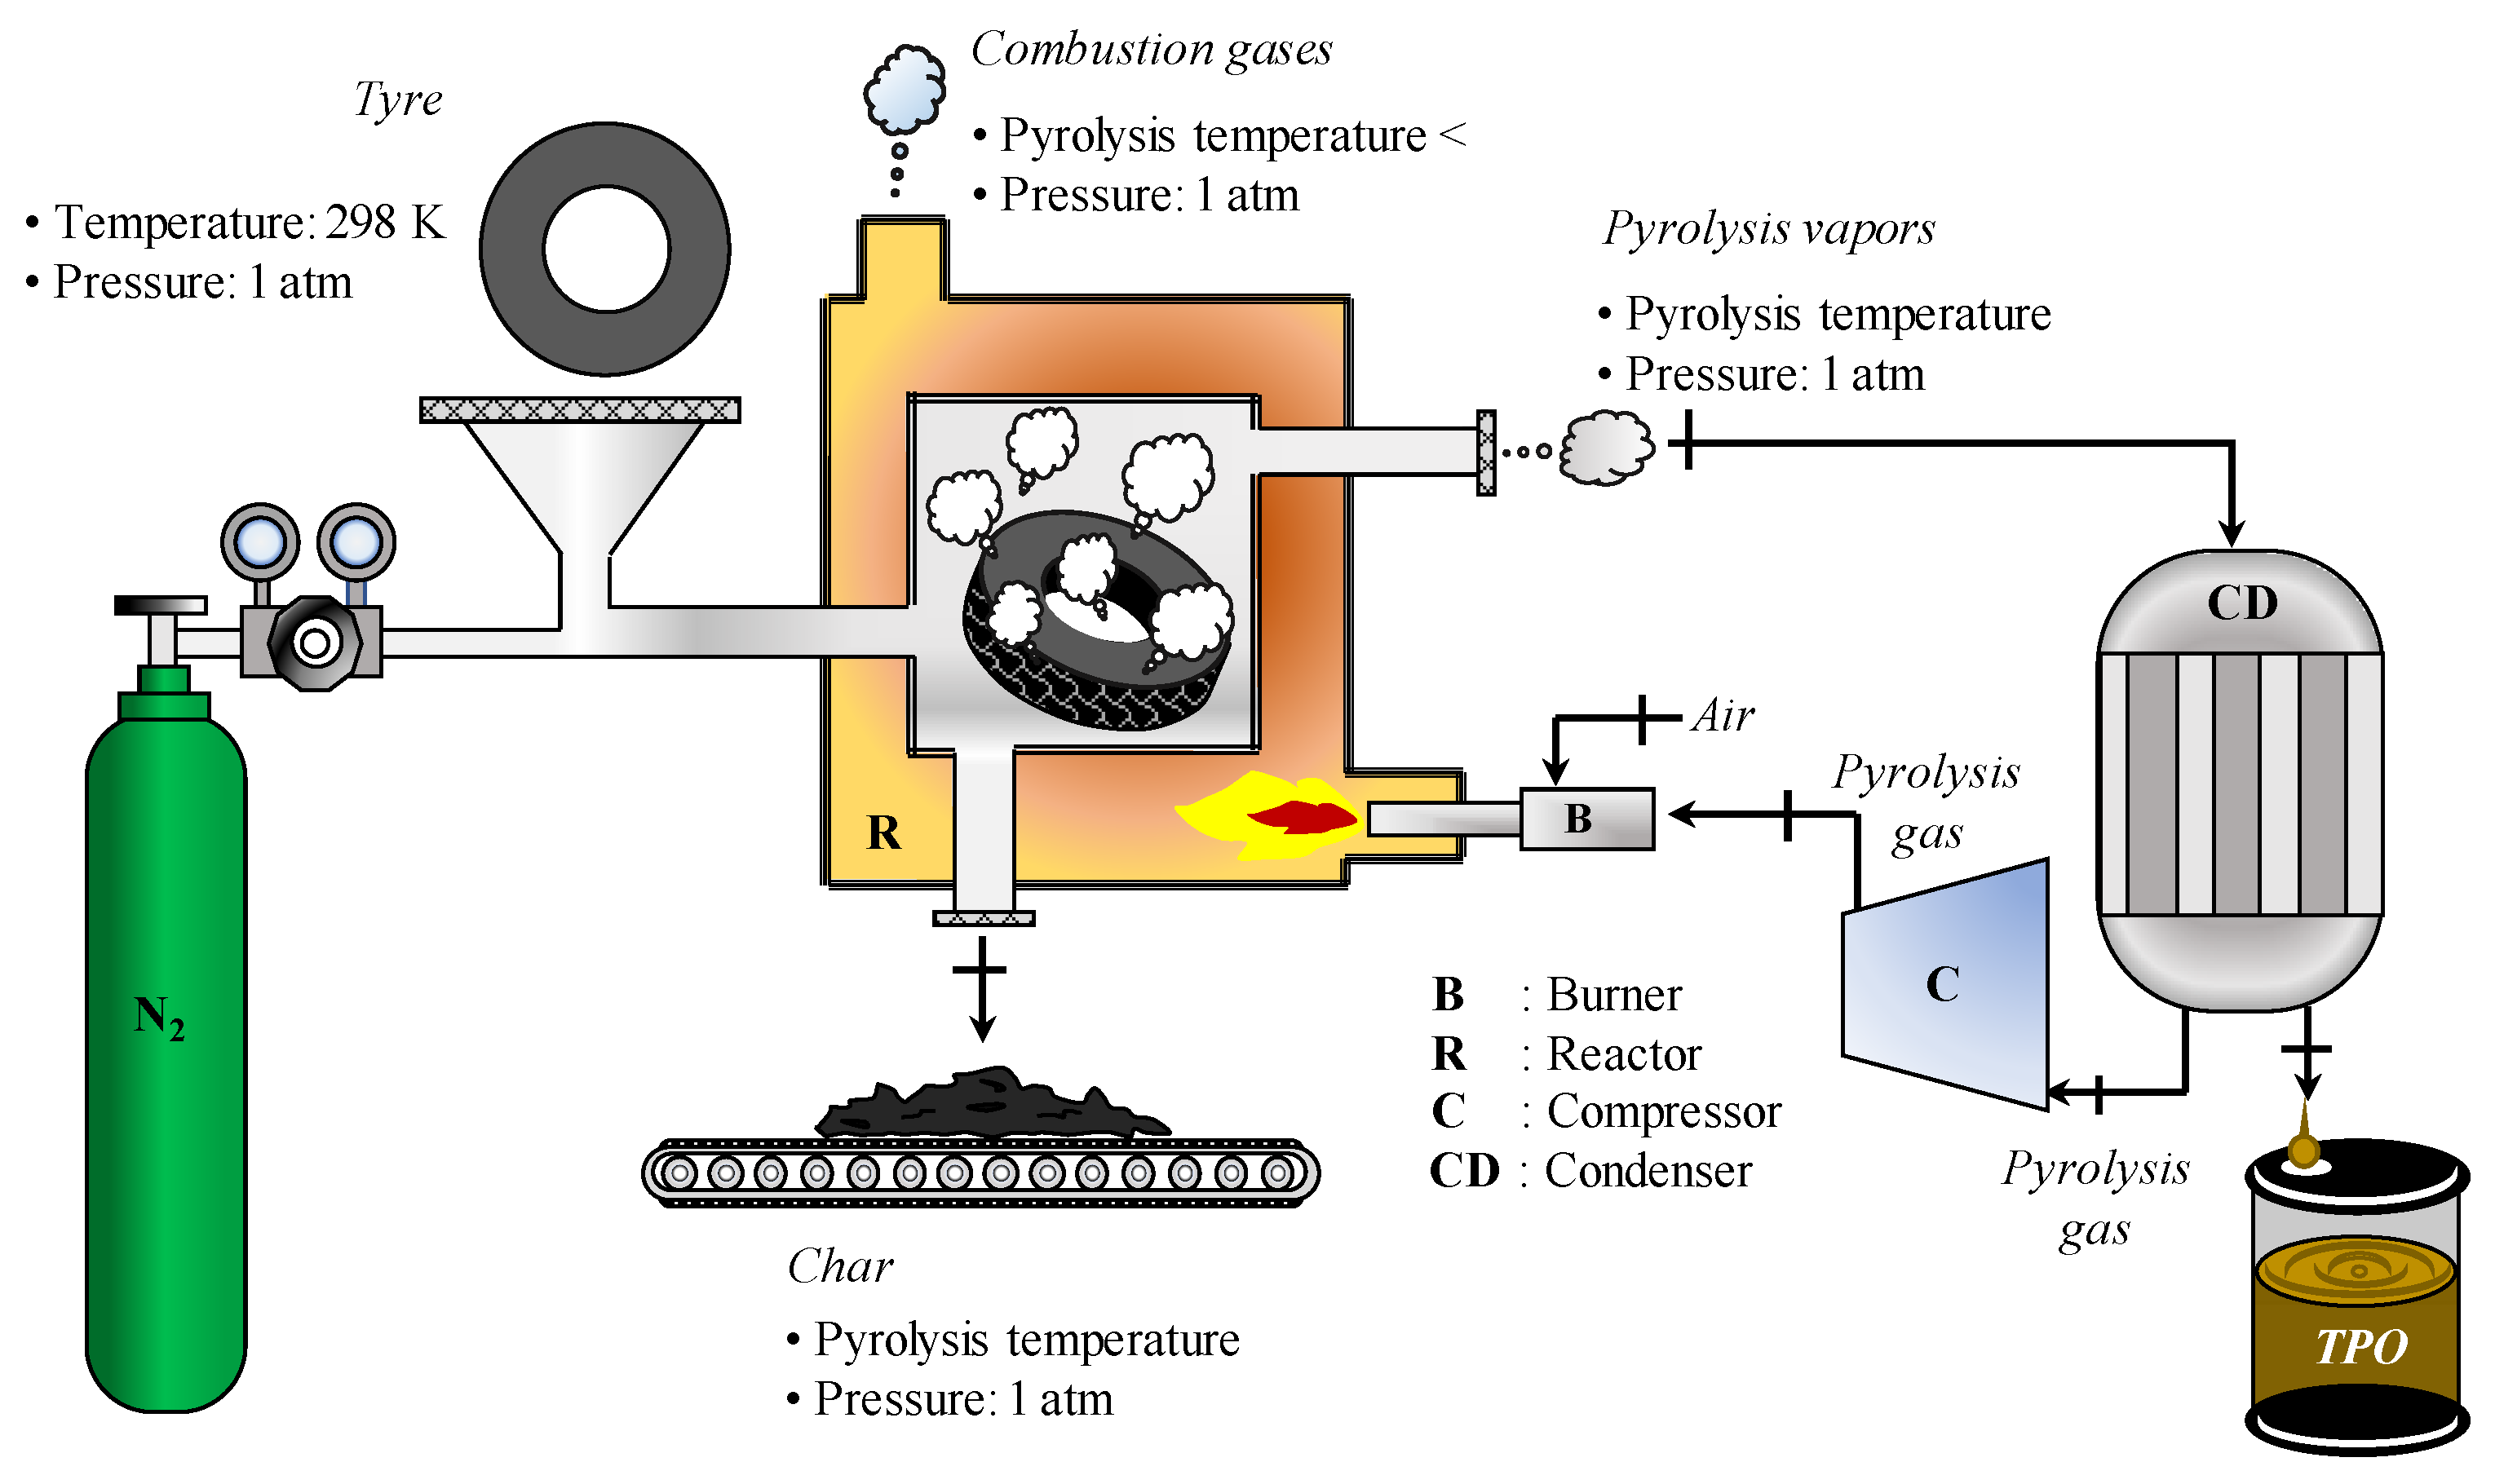
2.1. Idealised Pyrolysis Process

Based on Figure 1 and the description of the tyre pyrolysis process, the following assumptions were considered:
  • The reactor operates in a permanent regime at atmospheric pressure (1 atm).
  • The temperature inside the reactor is homogeneous (the pyrolysis temperature).
  • The tyre material and the nitrogen gas enter the reactor at a temperature of 298 K.
  • The pyrolysis of the tyres only produces char and pyrolysis vapours.
  • The pyrolysis products and nitrogen gas exit the reactor at the pyrolysis temperature.
  • The pyrolysis gas combustion products leave the reactor at a temperature below the pyrolysis temperature.
  • The tyre material and its pyrolysis products are homogeneous materials consisting only of C, H, N, S, and O.
  • The elemental compositions and mass yields of the pyrolysis products are constant over the operating temperature range of the reactor (the pyrolysis temperature).
  • The pyrolysis vapours and the combustion products of the pyrolysis gas behave similarly to an ideal gas.
  • The composition of the TPO vapour is invariant during its phase transformation into a liquid, i.e., there are no combinations or decomposition reactions.
  • The mass fractions of the pyrolysis gas compounds may change with the pyrolysis temperature.
The assumptions used in this study facilitated the calculation of the energy required for the tyre pyrolysis process and the energy released by the combustion of the pyrolysis gas obtained during the process. Although the real pyrolysis process differs from the idealised one, the results obtained from the latter provide valuable benchmarks for optimising the tyre pyrolysis process. The calculation methodology of both quantities is described in detail in the following subsections.

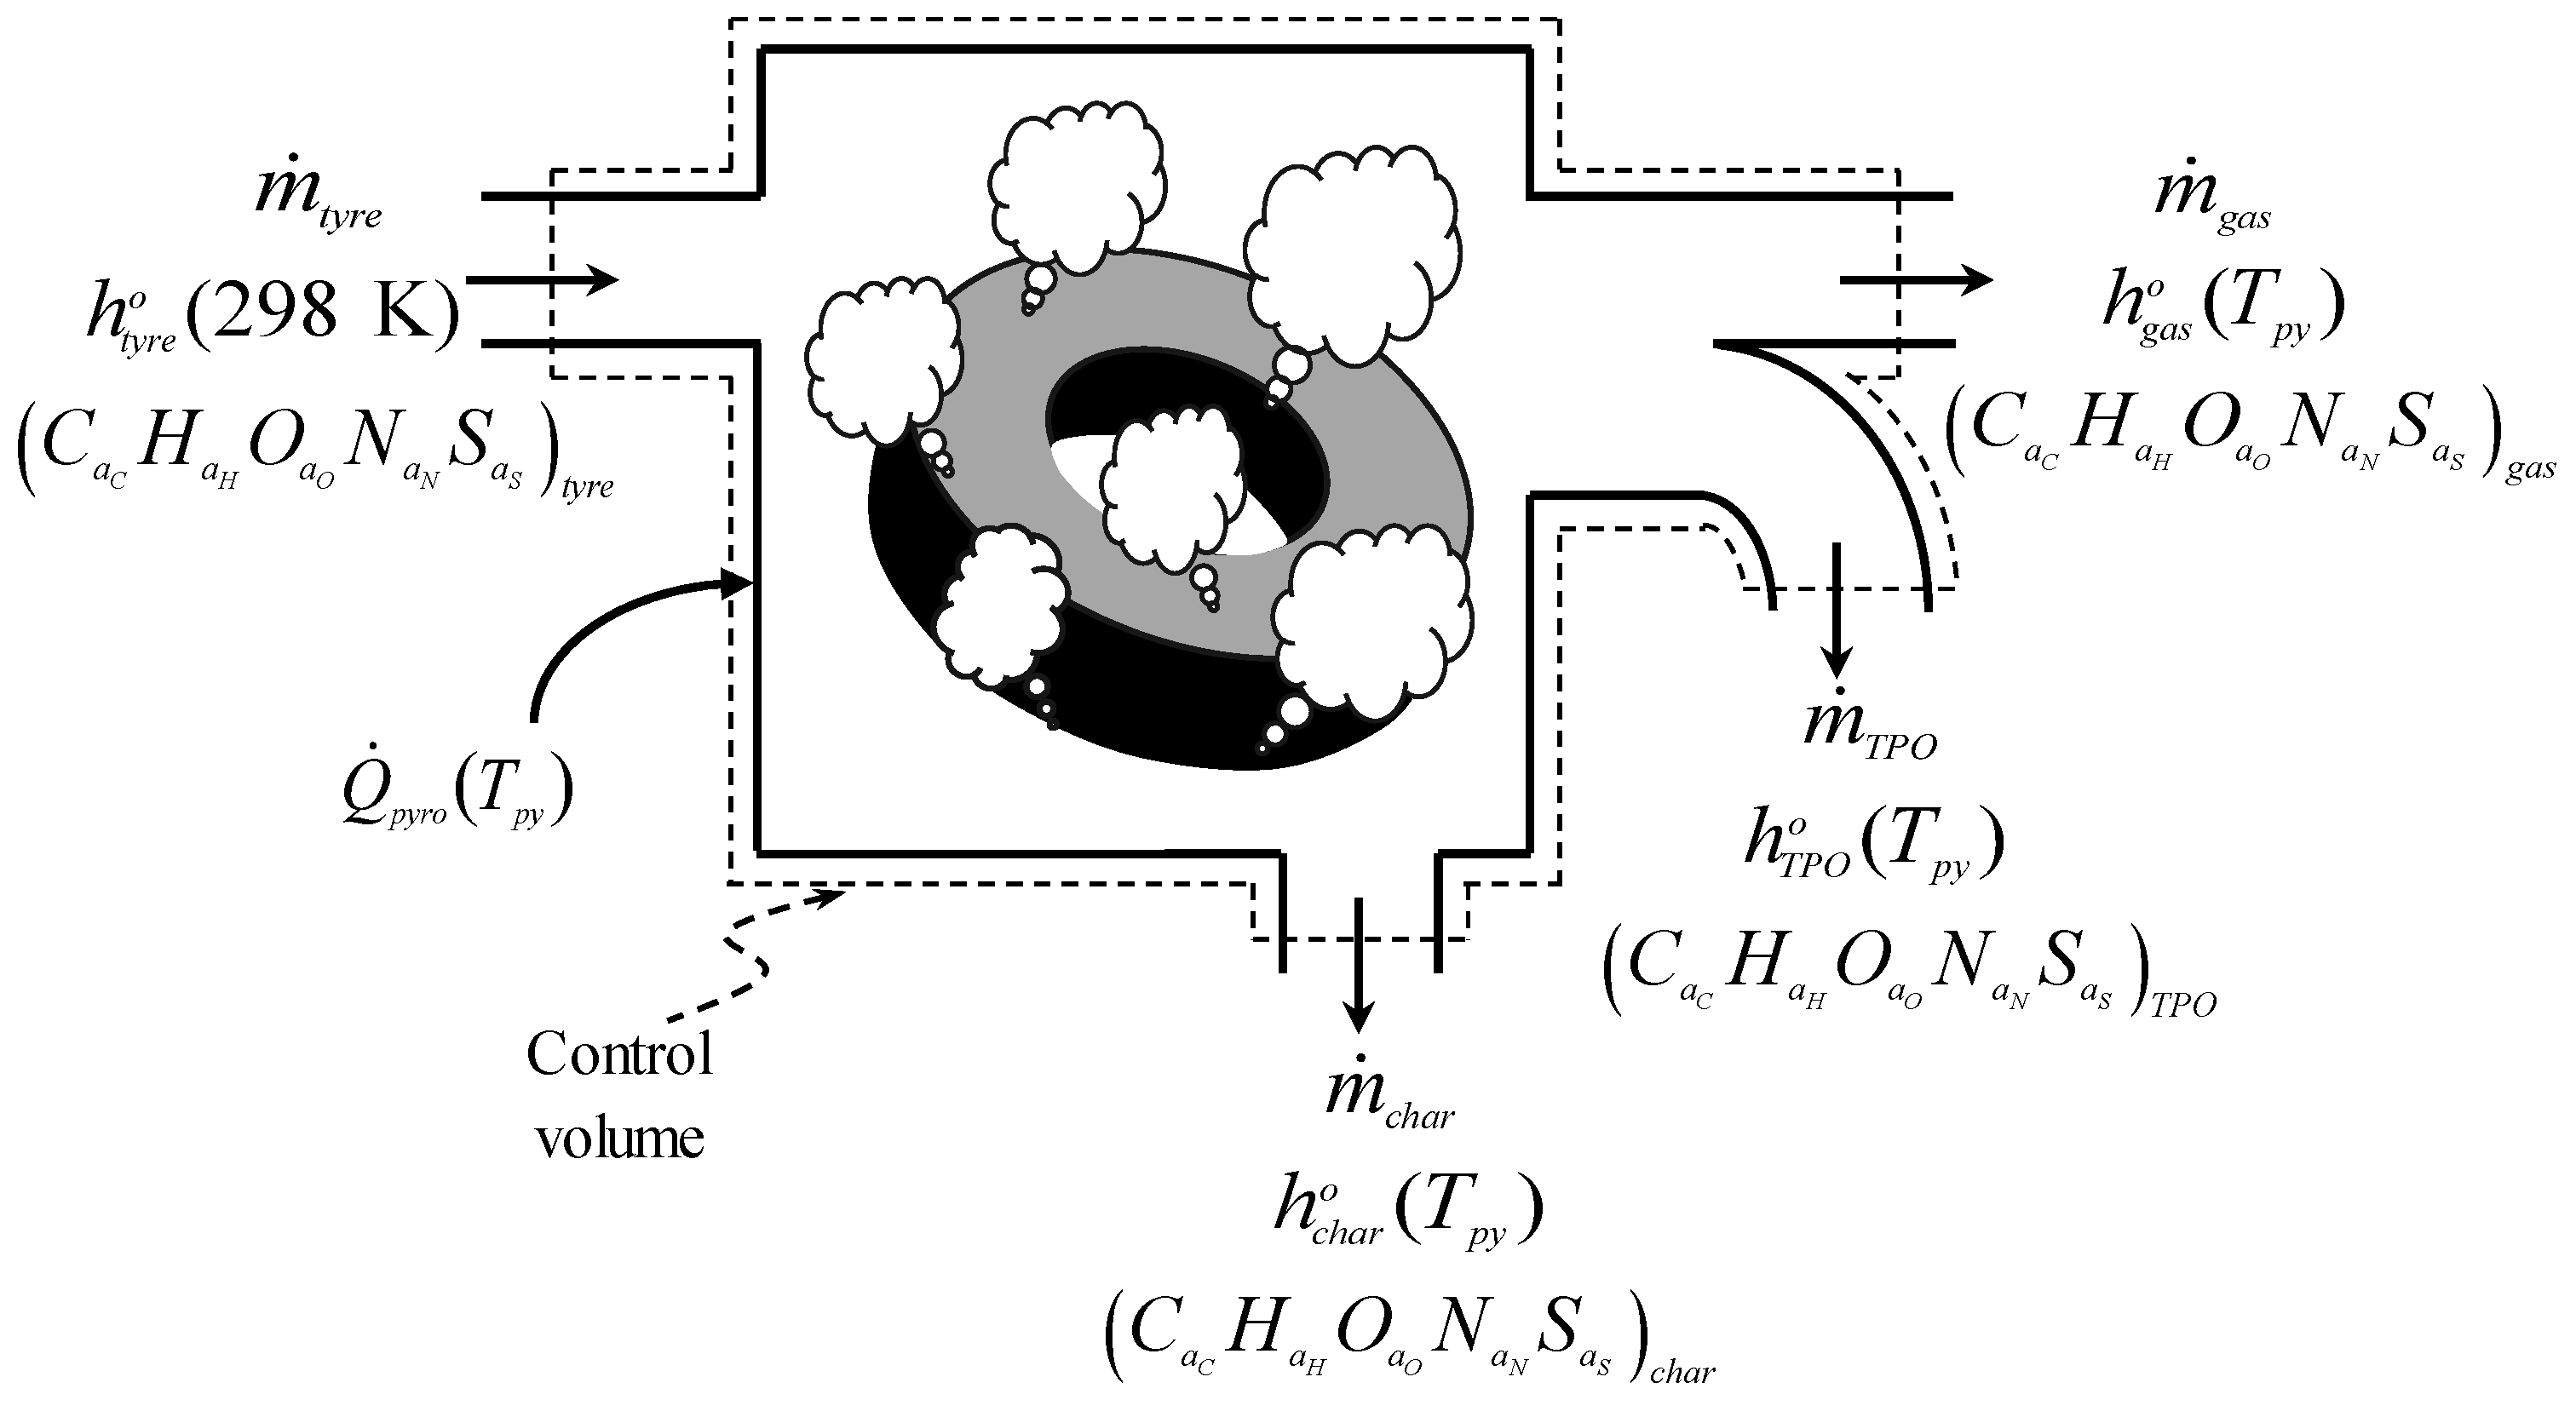
2.1.1. Energy Demand of the Tyre Pyrolysis Process

The heat required for the tyre pyrolysis reaction is only equal to the energy required to convert the tyre at 298 K into char and pyrolysis vapours (TPO vapour and pyrolysis gas) at the pyrolysis temperature. Some of the assumptions considered for the tyre pyrolysis process (i, iii, iv, v, and vii) can be summarised in a single drawing (see Figure 2) showing the control volume applied to the ideal continuous operation reactor in Figure 1 and the quantities required to calculate the heat needed for the tyre pyrolysis reaction.
The mass flow rates of tyre material, pyrolysis gas, TPO vapour, and char are represented by m ˙ t y r e , m ˙ g a s , m ˙ T P O , and m ˙ c h a r , respectively, while their specific enthalpies are written as h t y r e o , h g a s o , h T P O o , and h c h a r o , respectively. The enthalpies are evaluated at the pyrolysis temperature ( T p y ) for the pyrolysis products and at 298 K for the tyre material. On the other hand, the empirical chemical formulas C a C H a H O a O N a N S a S are used to indicate the elemental composition of the species involved in the pyrolysis reaction, where a C , a H , a O , a N , and a S are the number of gram atoms of C, H, O, N, and S, respectively. Then, the first law of thermodynamics is applied to the control volume in Figure 2 to determine the heat required by the tyre pyrolysis reaction at T p y , which is calculated according to Equation (1):
Q ˙ p y r o ( T p y ) m ˙ t y r e = m ˙ T P O m ˙ t y r e h T P O o ( T p y ) + m ˙ c h a r m ˙ t y r e h c h a r o ( T p y ) + m ˙ g a s m ˙ t y r e h g a s o ( T p y ) h t y r e o ( 298 K ) ,
where the changes in the kinetic and potential energy were considered insignificant in the energy balance, while the work term in Equation (1) is missing because the pyrolysis process consists mainly of heating.
In addition to Q ˙ p y r o , the energy demand of the tyre pyrolysis process ( E ˙ d ) must include the heat transferred to nitrogen ( Q ˙ N 2 ), which must be added to Equation (1), thus resulting in
E ˙ d ( T p y ) m ˙ t y r e = Q ˙ p y r o ( T p y ) m ˙ t y r e + Q ˙ N 2 m ˙ t y r e .

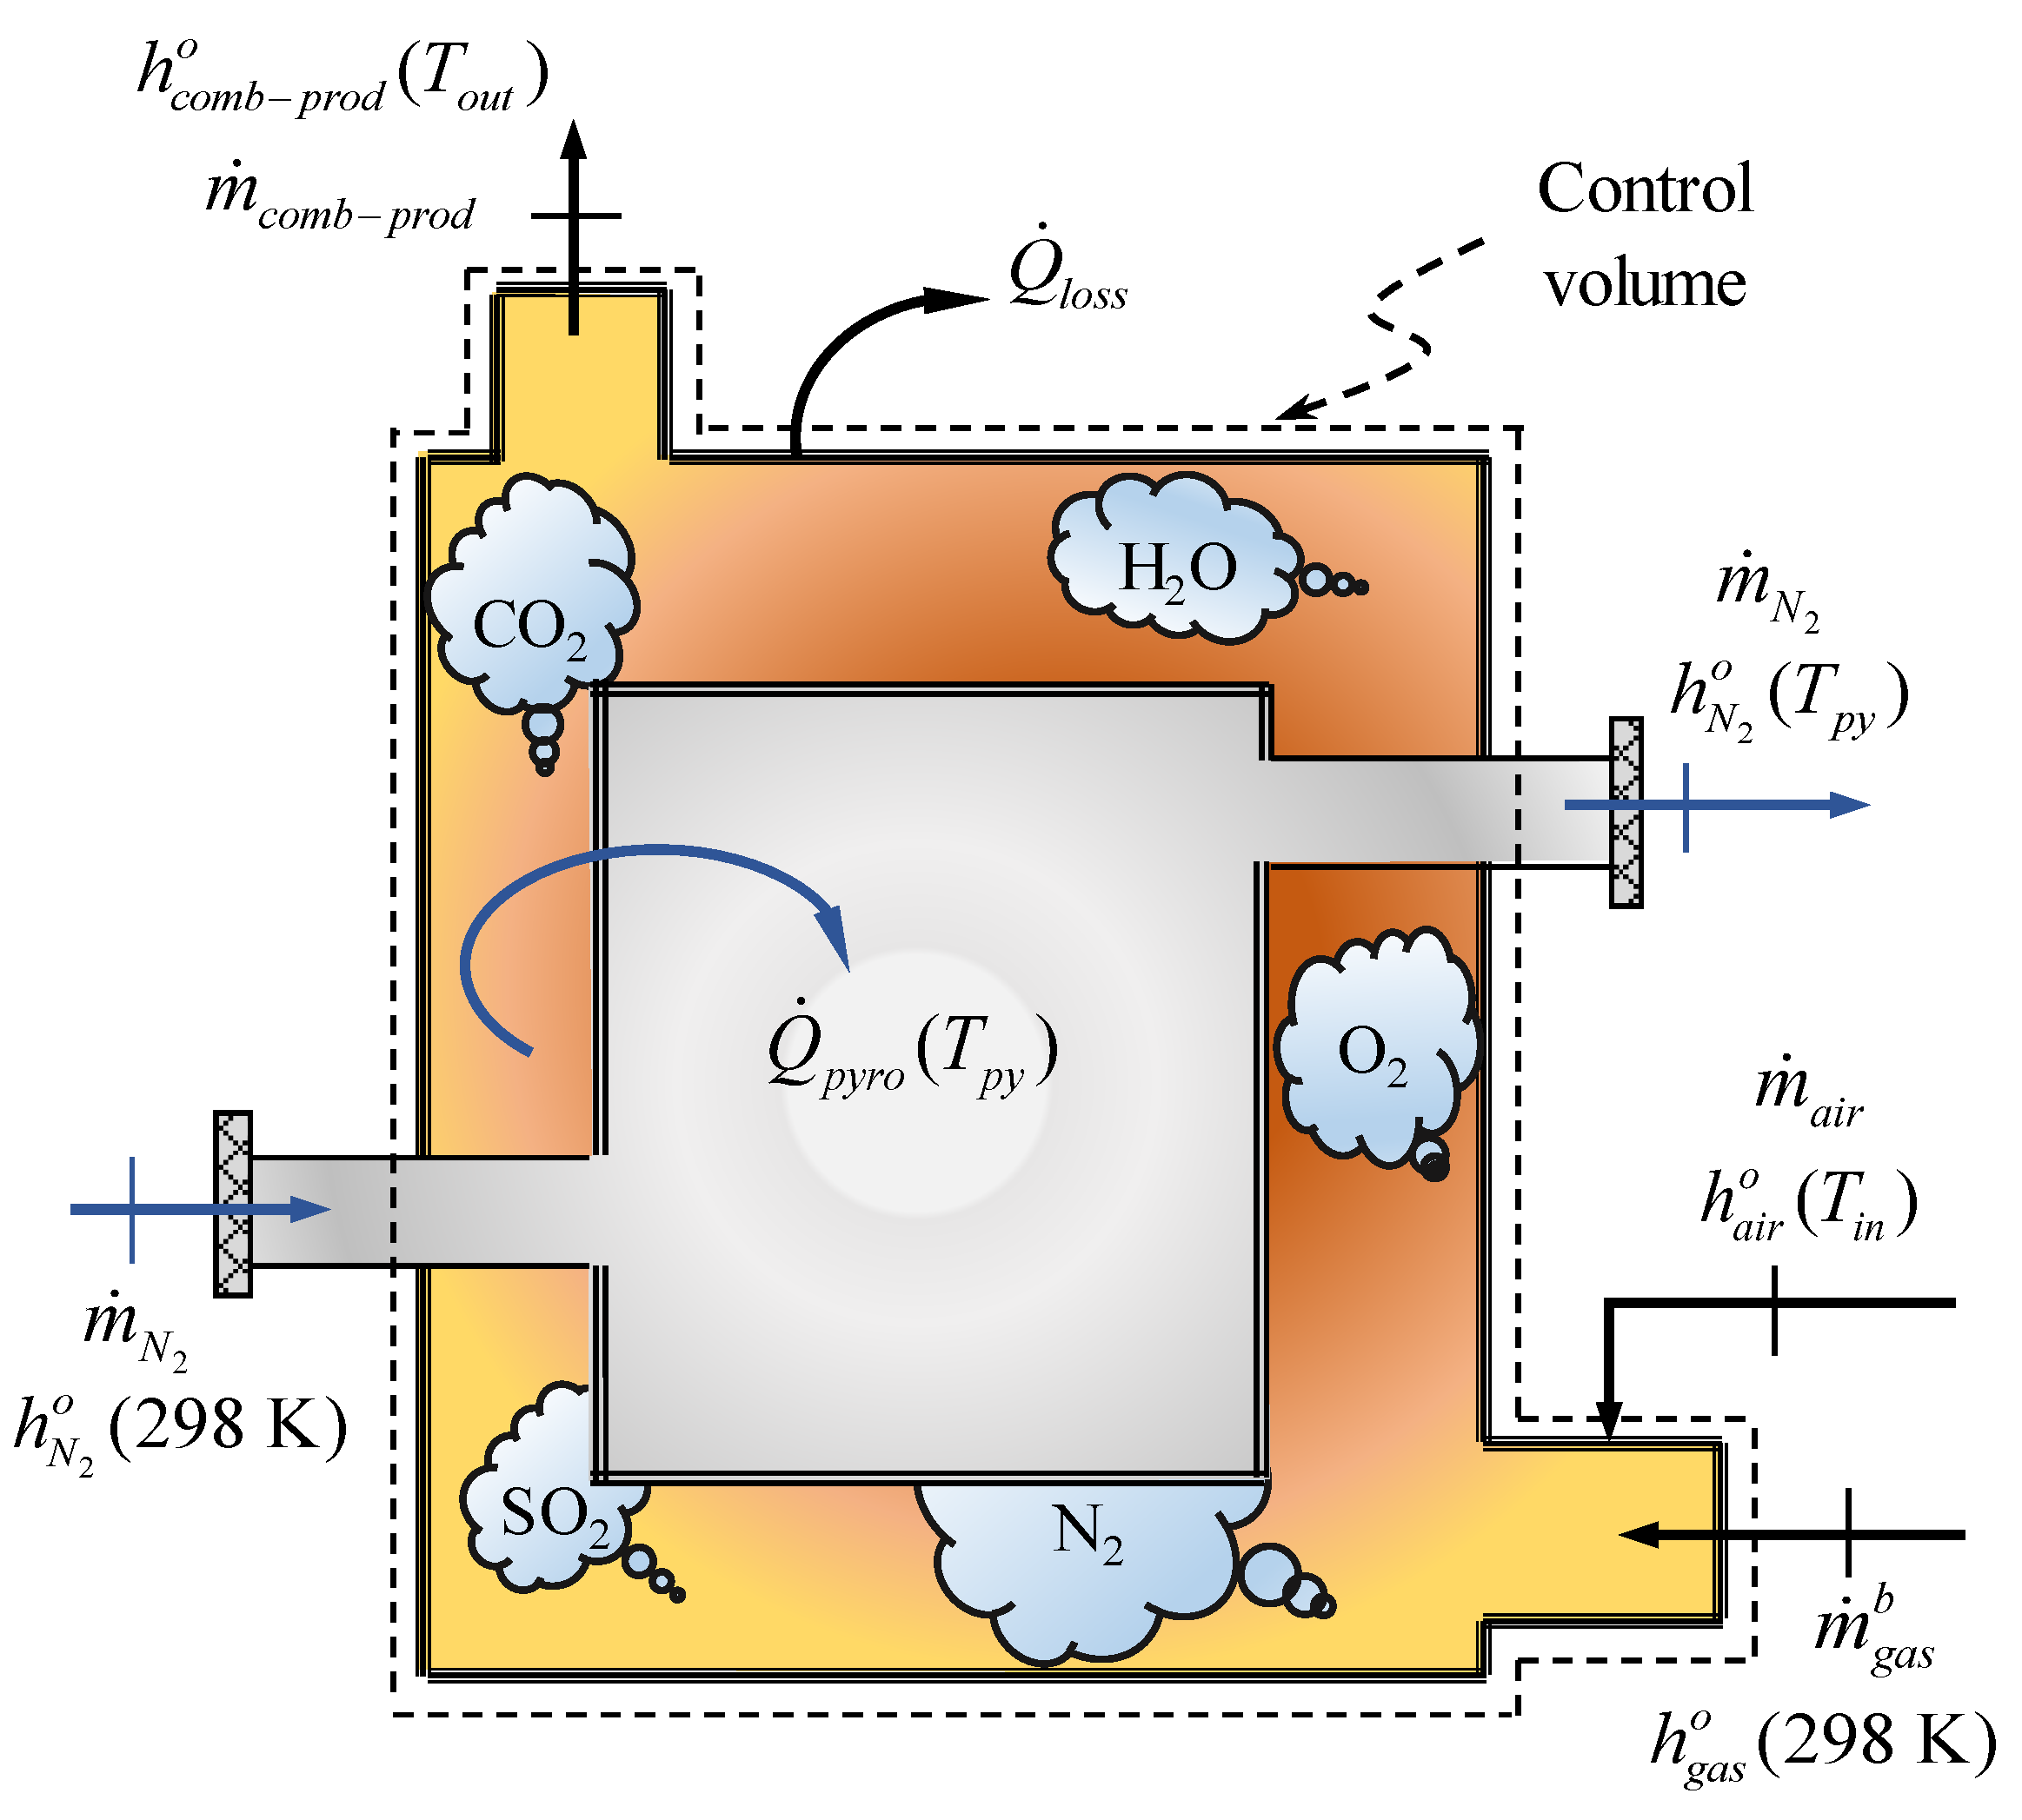
2.1.2. Energy Self-Sufficiency of the Tyre Pyrolysis Process

The heat obtained from the combustion of the pyrolysis gas is determined using the following control volume (Figure 3), which is individualised from Figure 1.
According to Figure 3, the flows through the inlet and outlet of the reactor, which correspondto the tyre and pyrolysis products being subtracted and replaced by Q ˙ p y r o , respectively, to leave only the flows through the inlet and outlet of the inert gas (N 2 ). On the other hand, the heat input to cover E ˙ d comes from the combustion of the mass flow rates of the pyrolysis gas ( m ˙ g a s b ) and air ( m ˙ a i r ) entering the reactor, at a temperature of 298 K and T i n , respectively. The mass flow rate m ˙ g a s b corresponds to a portion of the pyrolysis gas that is produced during the thermal degradation of the tyre material, and it can be written in terms of the mass flow rate of the pyrolysis gas produced in the process as follows
m ˙ g a s b = X m ˙ g a s ,
where the tyre pyrolysis process is energy self-suficient if X 1 (or 100%); otherwise, an additional fuel is needed to achieve E ˙ d . The subsequent combustion of the pyrolysis gas produces a mass flow of combustion products m ˙ c o m b p r o d (= m ˙ g a s b + m ˙ a i r ), which leaves the reactor at the temperature T o u t (< T p y r o ). On the other hand, heat losses ( Q ˙ l o s s ) occur during pyrolysis due to the imperfect insulation of the reactor walls. Therefore, the energy balance of the control volume in Figure 3 is expressed according to Equation (4):
E ˙ d ( T p y ) m ˙ t y r e = X m ˙ g a s m ˙ t y r e h g a s o ( 298 K ) + m ˙ a i r m ˙ t y r e h a i r o ( T i n ) m ˙ c o m b p r o d m ˙ t y r e h c o m b p r o d o ( T o u t ) Q ˙ l o s s m ˙ t y r e ,
where the specific enthalpies of the pyrolysis gas ( h g a s o ), air ( h a i r o ), and combustion products ( h c o m b p r o d o ) are evaluated from the compositions of each of them. For example, the value of h a i r o was calculated assuming a composition of air by volume of 78% N 2 and 21% O 2 .
Equations (2) and (4) allow for the evaluation of the energy self-sufficiency ( X 1 ) of the tyre pyrolysis process and were obtained by only applying the first law of thermodynamics. However, some of the terms in such equations need to be determined, which correspond to the following:
  • The mass yields of tyre pyrolysis products: m ˙ c h a r / m ˙ t y r e , m ˙ T P O / m ˙ t y r e , and m ˙ g a s / m ˙ t y r e ;
  • The specific enthalpy of the tyre material at 298 K: h t y r e o ;
  • The specific enthalpies of the tyre pyrolysis products: h c h a r o , h T P O o , and h g a s o ;
  • The specific enthalpy of the pyrolysis gas combustion products: h c o m b p r o d o ;
  • The heat transferred to nitrogen: Q ˙ N 2 ;
  • The heat losses due to imperfect insulation of the reactor walls: Q ˙ l o s s .
Some of the above values were obtained directly from the experimental data available in the literature, while others were calculated based on such information. The methodology for determining these values is described in the following subsections.

2.2. Experimental Information and Theoretical Foundations

The collection of the experimental data and the calculation of the quantities required to evaluate the energy self-sufficiency of the tyre pyrolysis process were carried out for a pyrolysis temperature range of 698 to 848 K. This interval was chosen due to the extensive availability of experimental information and the almost constant elemental compositions of the pyrolysis products (assumption viii) in such an interval, as will be shown later.

2.2.1. Mass Yields of the Tyre Pyrolysis Products

Several factors can affect the yield and elemental composition of any tyre pyrolysis product, such as the reactor type, operating temperature, operating pressure, tyre composition, particle size, particle geometry, reaction environment, purge-gas flow rate, pyrolysis vapour residence time, and heating rate. If a single factor is selected as the most important for determining the yields and elemental compositions of the pyrolysis products, the others can be interpreted as systematic or fossil errors during a measurement. The literature shows that the most important parameter is temperature [24,25,26]. Therefore, experimental data [10,11,13,14,22,24,27,28,29,30,31,32,33,34,35,36,37,38,39,40,41,42,43,44,45,46,47,48,49,50,51,52,53] on the mass yields of char, pyrolysis gas, and TPO as a function of the pyrolysis temperature were compiled and are shown in Figure 4, together with the mean values (dashed lines) of the individual samples.
The mass yields of the products from tyre pyrolysis shown in Figure 4 are from the conventional pyrolysis process, i.e., without the use of catalysts or another type of biomass (copyrolysis), which can change the yield of the individual products. The solid blue dots represent the average of the experimental values at the same temperature. In the temperature range from 698 to 848 K, it can be observed (blue dots) that the yields show a central tendency, although the data came from diferent operating conditions. Therefore, confidence intervals can be established for the mean value of the individual yields of the pyrolysis products, which are assumed to be representative values in the temperature range from 698 to 848 K. At a confidence level of 95%, the confidence intervals for the mean values of the mass yields of char, TPO, and pyrolysis gas (in percent) are, respectively, as follows:
m ˙ c h a r m ˙ t y r e = 38.02 ± 1.69 ,   m ˙ T P O m ˙ t y r e = 45.78 ± 1.86 ,   and   m ˙ g a s m ˙ t y r e = 16.20 ± 2.25 .

2.2.2. Specific Enthalpy of the Tyre Material at 298 K

Based on a complete combustion reaction according to Equation (5),
C a C H a H O a O N a N S a S + a C + a H 4 a O 2 + a S O 2 + 3.76 N 2 a C C O 2 + a H 2 H 2 O ( l ) + r N 2 + a S S O 2 ,
and the definition of the higher heating value ( H H V ), the standard enthalpy at 298 K for the tyre material can be calculated by applying Equation (6),
h o ( 298 K ) = H H V + a C h ¯ f , C O 2 o ( 298 K ) + a H / 2 h ¯ f , H 2 O ( l ) o ( 298 K ) + a S h ¯ f , S O 2 o ( 298 K ) P M ,
where P M is the molar mass of the tyre material, which is calculated from the number of gram atoms a i and the atomic mass of element i (C, H, O, N, and S). In turn, h ¯ f o ( 298 K ) is the molar enthalpy of formation at 298 K corresponding to the combustion products and whose values can be calculated using the NASA Glenn coefficients [54]. Nevertheless, the calculation of a i requires information on the elemental composition of the tyre material, that is, the mass fraction ( x i ) of each of the elements present in its composition. Then, the number of gram atoms of elemental species i in the chemical formula is calculated by Equation (7),
a i = x i P M C x C P M i ,
with P M C and x C being the molar mass and mass fraction of carbon, respectively. That is to say, the number of gram atoms of the other elments (H, O, N, and S) are calculated based on 1 gram atom of carbon.
The experimental data on the elemental compositions and higher heating values of tyre material were collected from literature [9,13,14,22,27,28,29,30,31,32,33,34,35,55,56,57,58,59,60,61,62,63,64,65,66] and presented in detail in the Supplementary Materials. In some cases, it was necessary to recalculate the elemental compositions reported by the authors, because the data were presented considering inorganic compounds. Based on the experimental values, confidence intervals were calculated at a confidence level of 95% for the mean value (t distribution) of the mass percent of C, H, N, and S, which respectively came out to the following:
x C , t y r e = 85.91 ± 1.04 ,   x H , t y r e = 7.38 ± 0.32 ,   x N , t y r e = 0.55 ± 0.12 ,   and   x S , t y r e = 1.93 ± 0.22 .
The mass fraction of oxygen was determined by the difference formation due to the nature of the elemental analysis, i.e., x O , t y r e = 4.23 %. The confidence interval for the mean H H V was 36.41 ± 1.03 MJ/kg. In addition to the variability due to the type and origin of the tyre, the part of the tyre from which the sample was taken also influences the composition [67]. Therefore, it is reasonable to use the mean value as a representative value to describe the elemental composition values, as recycling technologies do not differentiate by tyre type and origin. On the contrary, they use a mixture (passenger car, truck, motorcycle, van, etc.).

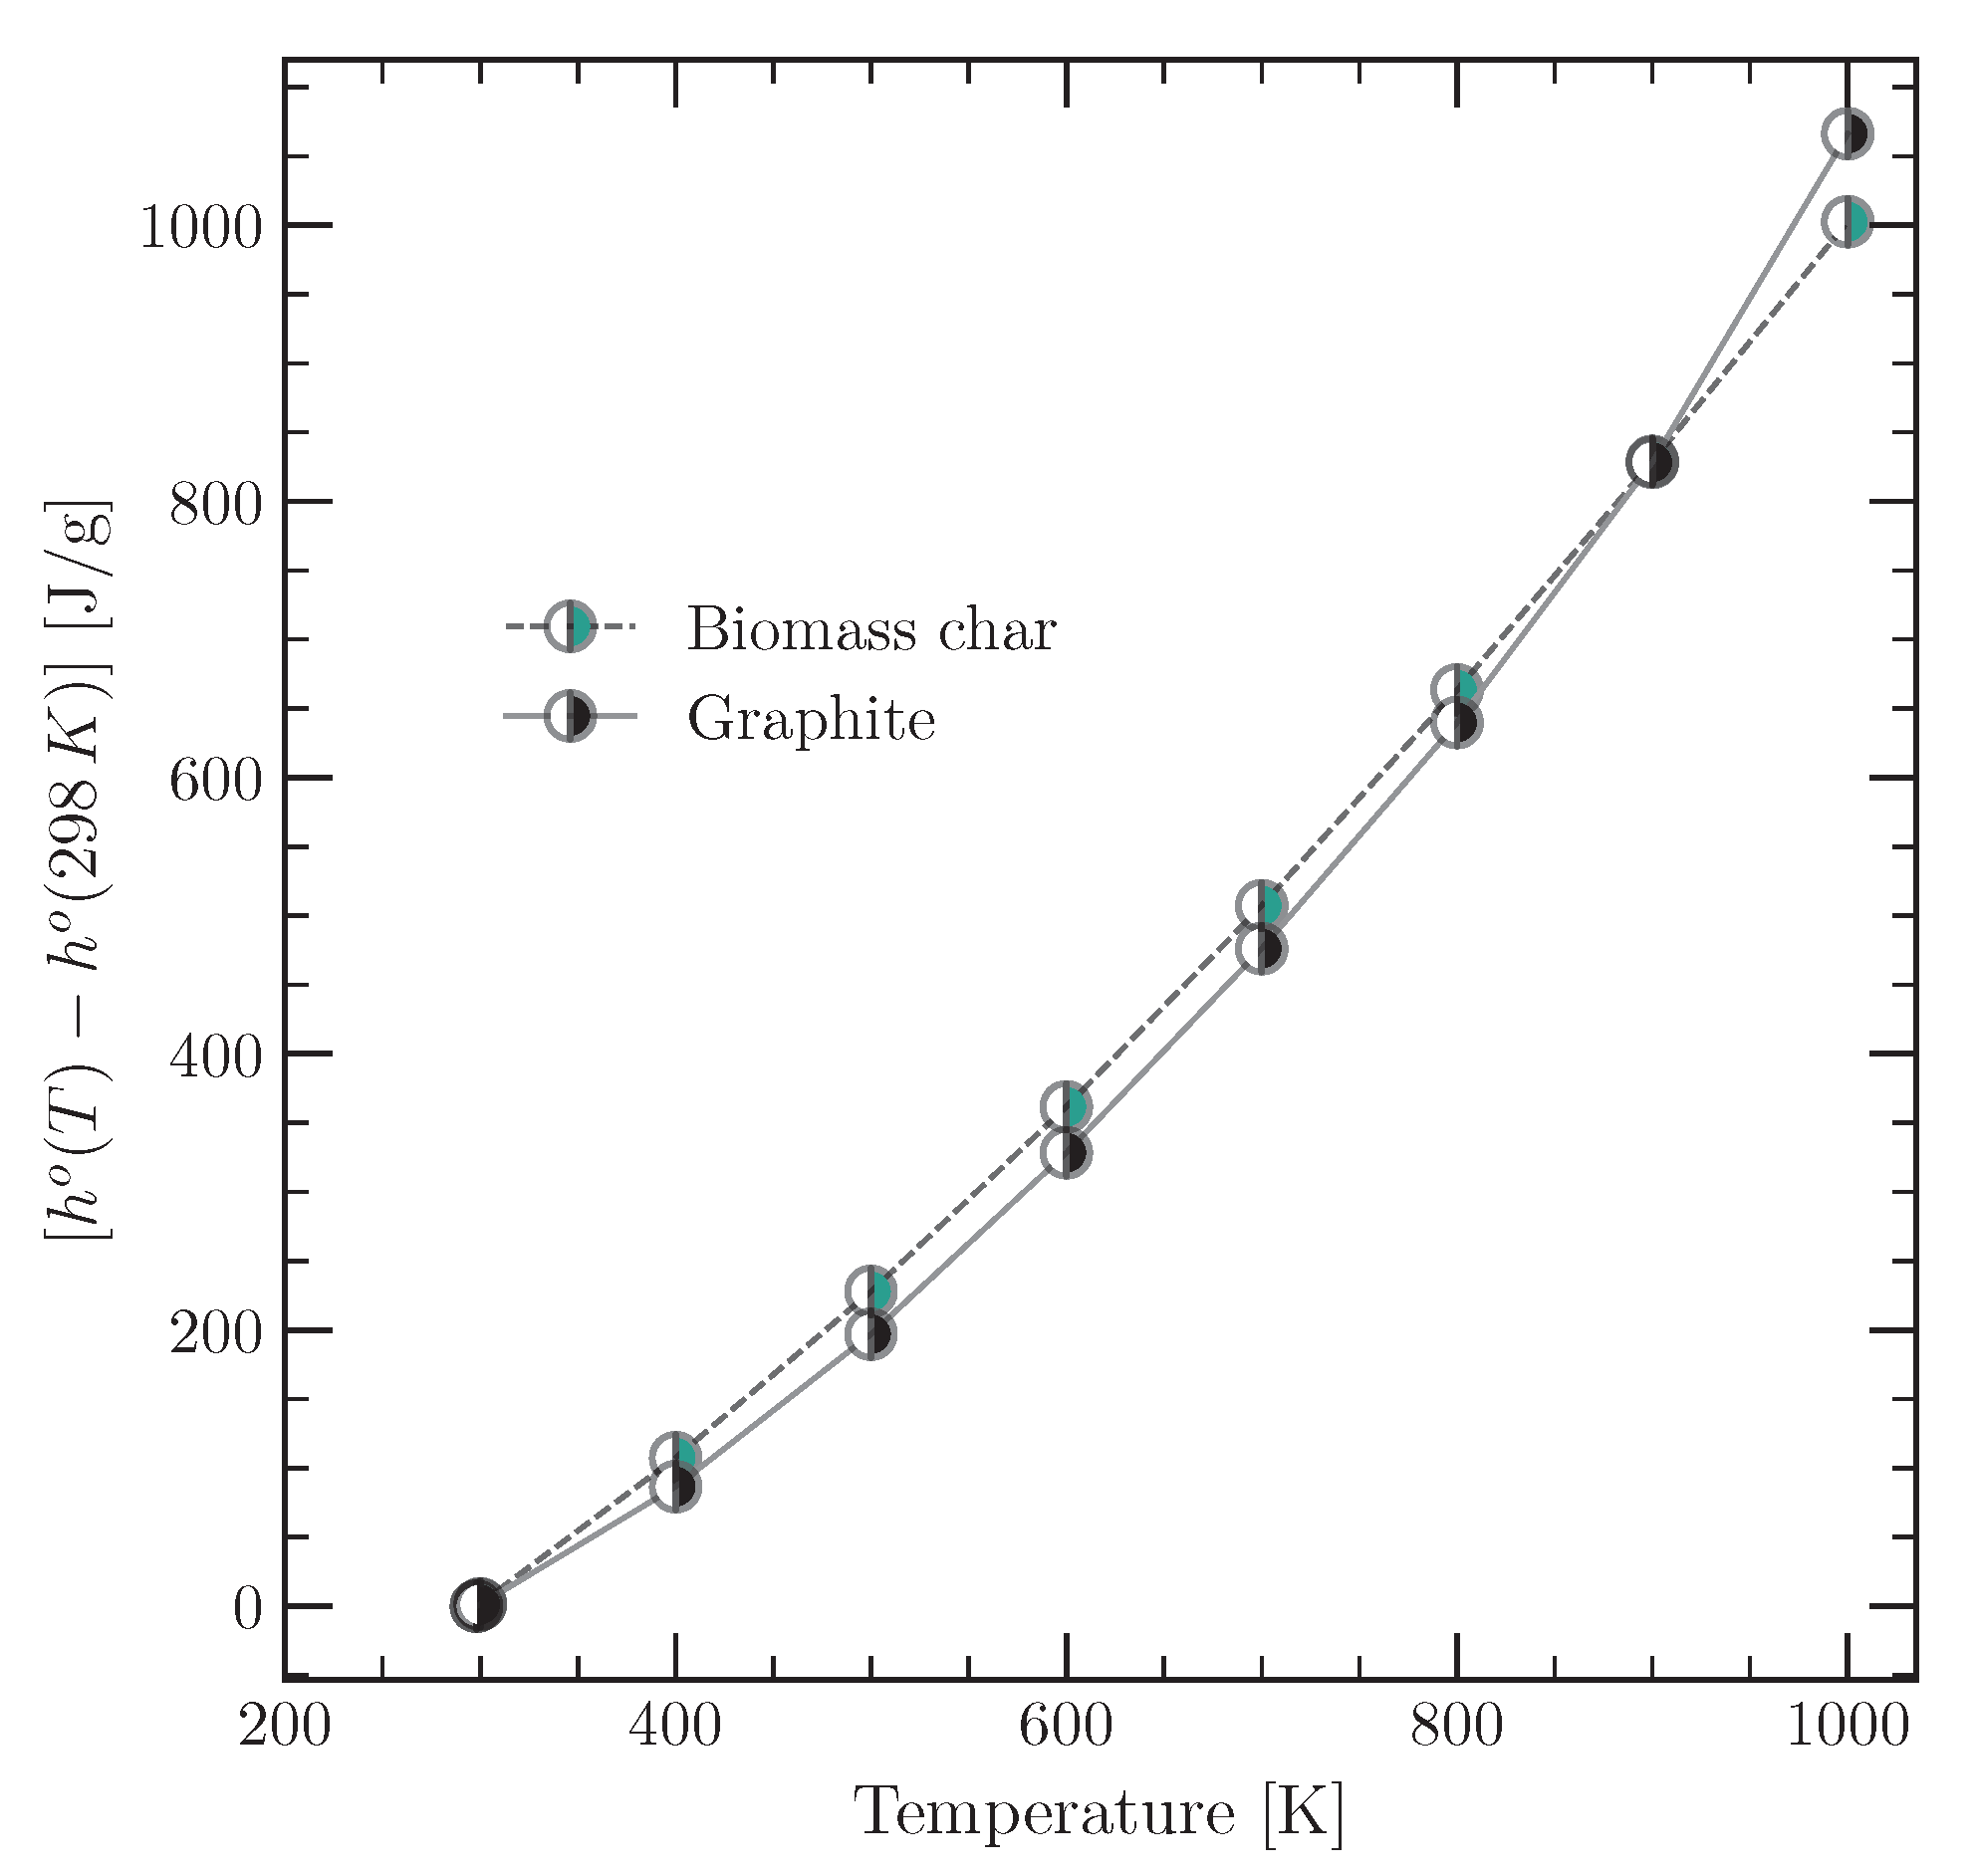
2.2.3. Specific Enthalpies of Tyre Pyrolysis Products

The specific enthalpy h o ( T ) of the pyrolysis products was determined by applying Equation (8),
h o ( T ) = h o ( 298 K ) + [ h o ( T ) h o ( 298 K ) ] ,
where the two terms on the right side of Equation (8) correspond to the standard enthalpy of formation at 298 K and the variation in enthalpy in the transformation from 298 K → T (sensible enthalpy), respectively. The sensible enthalpy can be expressed in terms of the specific heat ( c p o ) of the substance according to Equation (9):
h o ( T ) h o ( 298 K ) = 298 K T c p o ( T ) d T .
Since the pyrolysis products are in different phases, the methodology used to calculate h o ( T ) is different for each one. Next, the calculation of the specific enthalpy for each pyrolysis product is described, as well as the required experimental information.
  • A. Solid Product: Char
For the solid pyrolysis product (char), h c h a r o ( 298 K ) is calculated in a similar way as for the tyre material, i.e., using Equation (6). The data on the elemental composition (dry, ash-free) and H H V of the tyre char were obtained from numerous sources [10,11,13,14,22,28,29,30,33,35,36,37,40,42,43,49,62,68,69,70] and are presented in detail in the Supplementary Materials. The data on the mass fractions of N and O were neglected, because together they account for less than 1.1% of the composition. Based on the experimental data, confidence intervals with a confidence level of 95% were calculated for the mean value (t distribution) of the mass fractions (in percent) of C, H, and S, which are, respectively, as follows:
x C , c h a r = 94.78 ± 0.43 ,   x H , c h a r = 1.10 ± 0.22 ,   and   x S , c h a r = 3.05 ± 0.21 .
Meanwhile, the confidence interval for the mean H H V of char was 30.14 ± 0.73 MJ/kg.
On the other hand, the sensible enthalpy for the char requires the value of c p , c h a r o , which depends on the temperature. An estimate was made based on the specific heat of char biomass and graphite. This estimate is confirmated by the fact that the tyre char has a high carbon content, which lies between the composition of char biomass and graphite (100% carbon). Haseli et al. [71] provide a correlation to estimate the specific heat of char biomass as a function of temperature according to Equation (10):
c p , b i o c h a r o ( T ) = 0.44 + 2 × 10 3 T 6.7 × 10 7 T 2 .
The specific heat of graphite is well defined, and experimental data are available for different temperature ranges. The data used were the NASA Glenn coefficients [54], the values of which allow the specific heat of graphite to be calculated using a fitting polynomial as a function of temperature. Then, the sensible enthalpy of the char biomass and graphite can be estimated as a function of temperature using Equation (9). The values obtained are shown in Figure 5 in order to demonstrate the reasonableness of considering the sensible enthalpy of the tyre char as the average between the sensible enthalpy of the char biomass and the sensible enthalpy of the graphite. The values obtained were fitted using a quadratic polynomial (see the Supplementary Materials), which was then used to estimate the sensible enthalpy for the tyre char according to Equation (11):
h o ( T ) h o ( 298 K ) c h a r = 189.20 + 38.56 × 10 2 T + 8.35 × 10 4 T 2 .
  • B. Condensable Fraction of Pyrolysis Vapours: TPO Vapour
The assumption of ideal gas behaviour of the pyrolysis vapours (assumption ix) allows for the use of the Gibbs–Dalton law to calculate the standard enthalpy of formation at 298 K according to Equation (12),
h o ( 298 K ) = j x j h j o ( 298 K ) ,
where x j and h j o ( 298 K ) are the mass fraction and enthalpy of formation, respectively, of the gas component j in the mixture of ideal gases. However, sometimes there are components in the mixture whose experimental values of the enthalpy of formation at 298 K is unknown. In these cases, the method of Joback and Reid [72] can be used, which is known as the group contribution method (GCM). Then, the standard enthalpy of formation at 298 K of any organic substance can be calculated using the GCM according to Equation (13):
h j o ( 298 K ) = 68.29 + r h r , 298 K o P M j .
The terms h r , 298 K o and P M j correspond to the contribution of the molecular group r to the value of h j o ( 298 K ) and the molar mass of component j with an unknown enthalpy of formation, respectively. See the Supplementary Materials for an example calculation.
As with the calculation of the enthalpy of formation at 298 K, the Gibbs–Dalton law can be used to calculate the sensible enthalpy of the TPO vapour according to Equation (14),
h o ( T ) h o ( 298 K ) = j x j h j o ( T ) h j o ( 298 K ) = j x j 298 K T c p , j o ( T ) d T ,
where h j o ( T ) h j o ( 298 K ) and c p , j o ( T ) are the sensible enthalpy and the specific heat of the gas component j in the mixture of ideal gases, respectively. As in the case of h j o ( 298 K ) , the GCM [72] can be used to calculate the value of c p . j o ( T ) for which experimental data are not available, as presented in Equation (15):
c p , j o ( T ) = 1 P M j r a r 37.93 + r b r + 0.21 T + r c r 3.91 × 10 4 T 2 + r d r + 2.06 × 10 7 T 3 .
The values a r , b r , c r , and d r are coefficients defined according to the molecular group r, and P M j is the molar mass of component j with an unknown specific heat. See the Supplementary Materials for an example calculation.
In addition, Equations (12) and (14) show that the composition of the TPO vapour is necessary to calculate its specific enthalpy. TPO is a mixture of organic components with 6 to 21 carbons in its chemical structure. Some authors [14,22,30,31,34,37,42,44,45,55,57,73,74] have identified 15 to 187 components in TPO using chromatographic techniques. Assuming that the composition of TPO vapours remains unchanged upon its phase change to a liquid (assumption x), it is possible to use the available experimental information on the composition of tyre pyrolysis oil. Thus, the information of Alvarez et al. [55], who identified 187 components, was used to determine the specific enthalpy of the TPO vapour.
Furthermore, the elemental composition of TPO was compiled from the literature for the temperature range of 698 to 848 K [10,11,13,14,22,28,29,33,34,40,41,42,44,45,49,50,51,52,53]. As with tyre char, the elemental composition of TPO showed little significant variation in the range of 698 to 848 K (see the Supplementary Materials). Consequently, confidence intervals with 95% confidence were determined for the mean values of the mass fractions (in percent) of C, H, N and S, which come out to the following respective values:
x C , T P O = 85.23 ± 1.05 ,   x H , T P O = 10.36 ± 0.31 ,   x N , T P O = 0.55 ± 0.16 ,   x S , T P O = 1.55 ± 0.18 ;
For O, its mass fraction was determined using the difference formation, so that value is x O , T P O = 2.71 %.
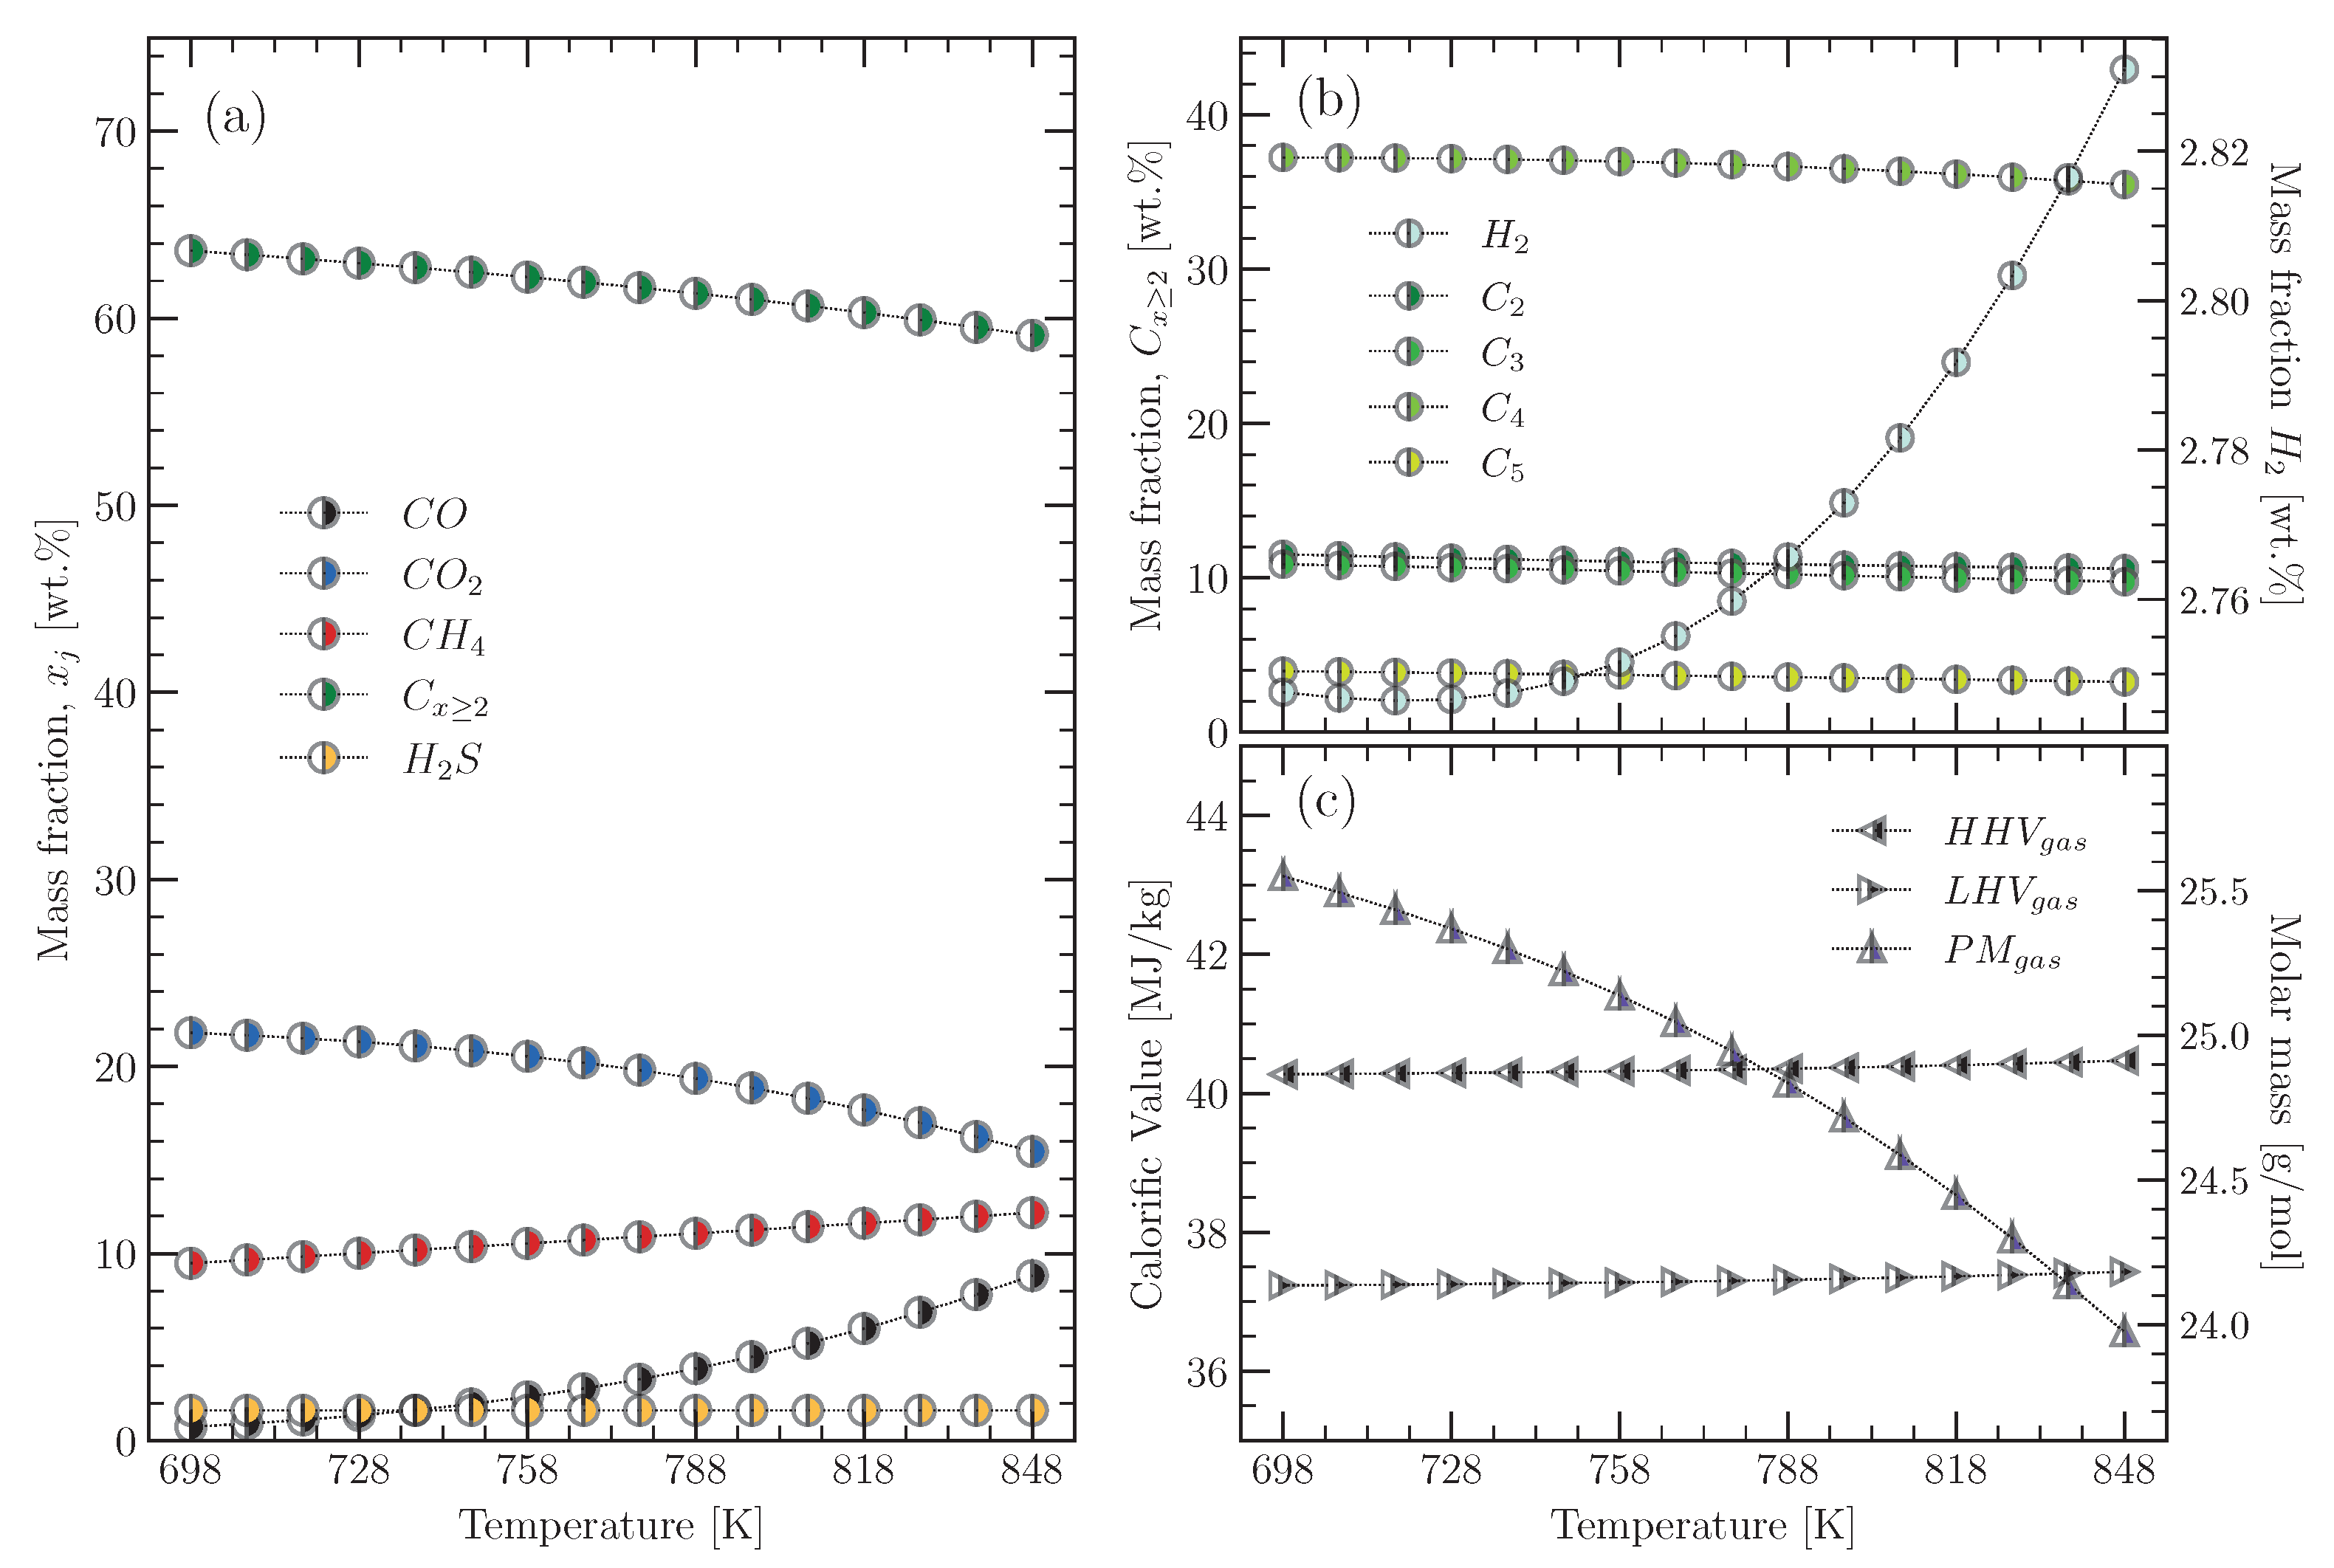
  • C. Noncondensable Fraction of Pyrolysis Vapours: Pyrolysis Gas
The calculation of the enthalpy of the pyrolysis gas requires, as with TPO, its composition, i.e., the mass fraction of the components that make up the pyrolysis gas. The first step is to determine the elemental composition of the pyrolysis gas, which remains constant with temperature (assumption xiii). For this purpose, the mass conservation of the elemental species (C, H, O and S) is applied to the control volume in Figure 2. Consequently, the mass fraction of element i in the pyrolysis gas ( x i , g a s ) is calculated according to Equation (16):
x i , g a s = x i , t y r e x i , c h a r m ˙ c h a r m ˙ t y r e x i , T P O m ˙ T P O m ˙ t y r e m ˙ g a s m ˙ t y r e 1 .
Then, the value of the x i , g a s is used to determine the number of gram atoms of element i in the empirical formula C a C H a H O a O S a S for the pyrolysis gas. Although it is assumed that the elemental composition of the pyrolysis gas is constant in the range from 698 to 848 K, the concentration of the compounds that make up the pyrolysis gas can vary with temperature (assumption xi).
In fact, the pyrolysis gas is a mixture of hydrocarbons with up to six carbons (≤C6), carbon oxides (CO and CO 2 ), hydrogen gas (H 2 ), and hydrogen sulphide (H 2 S), as reported in various studies [10,11,14,22,29,33,35,37,40,46,70]. These studies report a large variability between the mass fractions of the pyrolysis gas compounds obtained at different temperatures, but it is possible to set limits for each of these compounds in the temperature range of 698–848 K:
  • A range of 0.73% ≤ H 2 (hydrogen) ≤ 20.59%;
  • A range of 1.32% ≤ CO (carbon monoxide) ≤ 9.01%;
  • A range of 3.29% ≤ CO 2 (carbon dioxide) ≤ 33.02%;
  • A range of 1.00% ≤ CH 4 (methane) ≤ 31.19%;
  • A range of 1.95% ≤ C 2 : C 2 H 4 (ethylene) + C 2 H 6 (ethane) ≤ 35.21%;
  • A range of 3.37% ≤ C3: C 3 H 6 (propene) + C 3 H 8 (prapane) ≤ 39.92%;
  • A range of 9.41% ≤ C 4 : C 4 H 6 (1,3-butadiene) + C 4 H 8 (1-butene) + C 4 H 10 (isobutene) ≤ 64.89%;
  • A range of 0.36% ≤ C 5 : C 5 H 8 (isoprene) + C 5 H 10 (1-pentane) + C 5 H 12 (n-pentane) ≤ 43.01%;
  • A range of 0.06% ≤ H 2 S (hydrogen sulphide) ≤ 4.60%.
In this paper, we have assumed that pyrolysis gas consists of 15 gas components: hydrogen (H 2 ), carbon monoxide (CO), carbon dioxide (CO 2 ), methane (CH 4 ), ethylene (C 2 H 4 ), ethane (C 2 H 6 ), propene (C 3 H 6 ), propane (C 3 H 8 ), 1,3-butadiene (C 4 H 6 ), 1-butene (C 4 H 8 ), isobutane (C 4 H 10 ), isoprene (C 5 H 8 ), 1-pentane (C 5 H 10 ), n-pentane (C 5 H 12 )m and hydrogen sulphide (H 2 S). Each component is present in the pyrolysis gas with a number of moles n j that can vary with the pyrolysis temperature, but the mass percents x i , g a s (i = C, H, S, and O) remain invariant. This consideration can be expressed by Equation (17):
C a C H a H O a O S a S n 1 H 2 + n 2 C O + n 3 C O 2 + n 4 C H 4 + + n 15 H 2 S .
The composition of the pyrolysis gas is thus established when the number of moles n j of each component is determined. A useful tool for determining these values is the Gibbs free energy minimisation method. It consists of solving an optimisation problem using the Lagrange multiplier technique. According to the reaction in Equation (17), the objective function and the equality constraints of the optimisation problem are the Gibbs free energy of the mixture ( G s y s t e m ) and the mass conservation of the elements i (C, H, S, O) of the components j (1, 2, …, 15) of the mixture according to Equations (18) and (19),
G s y s t e m R T = j = 1 15 n j g ¯ f , j o ( T ) R T + l n n j n t o t a l ,
i = 1 4 α i j = 1 15 a i j n j p r o d a i r e a g = 0 ,
where n t o t a l ( = j 15 n j ) is the total number of moles in the gas mixture; R is the universal gas constant; g ¯ f , j o is the standard molar Gibbs free energy of formation of the component j at the temperature T; α i is the Lagrange multiplier associated with the element i (C, H, S, O); a i j is the number of gram atoms of the element i in the gas component j in the products; and a i is the number of gram atoms of the element i in the reagent. Then, the Lagrange function (L) is defined, Equation (20), which results from the combination of Equations (18) and (19):
L ( α i , n j ) = G s y s t e m R T i = 1 4 α i j = 1 15 a i j n j p r o d a i r e a g .
Equation (20) has a minimum when G s y s t e m reaches its minimum value (chemical equilibrium condition). This condition is expressed in Equation (21),
s L = 0 , s = [ α i , n j ] ,
where s = α i , from Equation (22), is obtained, which corresponds to the conservation of mass of the element i in the reaction of Equation (17):
j = 1 15 a i j n j p r o d a i r e a g = 0 .
On the other hand, when s = n j , Equation (23) is obtained for the component j in the mixture:
g ¯ f , j o ( T ) R T + l n n j n t o t a l i = 1 4 α i a i j p r o d = 0 .
Nevertheless, we have modified Equation (23), because the theoretical equilibrium condition is not fully achieved in a real process. We introduced the empirical multiplication factors k j into the 15 equations generated by Equation (23) according to Equation (24):
k j g ¯ f , j o ( T ) R T + l n n j n t o t a l i = 1 4 α i a i j p r o d = 0 .
The empirical multiplicative factors k j were introduced to improve the prediction of the composition of pyrolysis gas from the tyre material, i.e., without exceeding the limits of the experimental mass fractions collected in the range of 698 to 848 K and presented above. In the studies by Jarungthammachote et al. [75], Vaezi et al. [76], Barman et al. [77], and Mendiburu et al. [78], the equilibrium constant was modified using correction factors to improve the biomass syngas composition values predicted by the equilibrium models used. Here, we followed the same reasoning, by modifying g ¯ f , j o , which is similar to the modification of the equilibrium constant in the case of a stoichiometric equilibrium model. Subsequently, the system of equations generated from Equations (22) and (24) (see the Supplementary Materials) can be solved using the Newton–Raphson numerical method after calculating the g ¯ f , j o value for each component of the pyrolysis gas using the NASA Glenn coefficients [54]. From the calculated molar fractions of the 15 components of the pyrolysis gas, the mass fractions of the individual components were determining using Equation (25):
x j = n j / n t o t a l P M j j = 1 15 [ n j / n t o t a l P M j ]
Finally, the values obtained from Equation (25) can be substituted into Equations (12) and (14) to determine the specific enthalpy of the pyrolysis gas using Equation (8). The specific enthalpies of the 15 components assumed for the pyrolysis gas are calculated using the NASA Glenn coefficients [54] and information available on the National Institute of Standards and Technology website [79].

2.2.4. Specific Enthalpy of Pyrolysis Gas Combustion Products

The combustion products of pyrolysis gas are a mixture of gases, so Equations (12) and (14) can be used to calculate their enthalpy, but their composition is required. The composition of the combustion products for 1 mole of pyrolysis gas results from the combustion reaction shown in Equation (26):
y 1 H 2 + y 2 C O + y 3 C O 2 + y 4 C H 4 + y 15 H 2 S + n O 2 ( O 2 + 3.76 N 2 ) a C C O 2 + a H 2 H 2 O + a S S O 2 + d N 2 + e O 2 .
For the molar fraction y j (= n j / n t o t a l ) of the individual components of the pyrolysis gas, j = 1 15 y j = 1 . Furthermore, the pyrolysis gas can be represented by the formula C a C H a H O a O S a S , as given in Equation (17), whose contents of C, H, O, and S were assumed to be invariant in the temperature range from 698 to 848 K (assumption viii). The values of d and e depend on the number of moles of oxygen ( n O 2 ) used in Equation (26). The value of n O 2 is calculated from the number of moles of stoichiometric oxygen ( n O 2 e s t ) and the coefficient of excess air ( λ ), i.e., n O 2 = λ n O 2 e s t . From the formula C a C H a H O a O S a S of the pyrolysis gas, the value of n O 2 e s t is calculated using Equation (27):
n O 2 e s t = a C + a H 4 a O 2 + a S .
Equation (27) makes it possible to link the mass flow rate of the burnt pyrolysis gas ( m ˙ g a s b ) and the combustion air ( m ˙ a i r ) using the air-to-fuel ratio ( A F ) according to Equation (28),
A F = m ˙ a i r m ˙ g a s b = 4.76 λ n O 2 e s t P M a i r P M g a s ,
where, P M a i r and P M g a s correspond to the molar mass of the air and pyrolysis gas, respectively. For λ = 1 , A F is called the stoichiometric air-to-fuel ratio and is represented by A F e s t , so A F = λ A F e s t .
Furthermore, the specific enthalpy of the combustion products is obtained once their temperature is defined. In a real pyrolysis process, the exit temperature ( T o u t ) of the combustion products is slightly lower than the pyrolysis temperature ( T p y ). In the work of Daugaard and Brown [19], this temperature was, on average, 50 K lower than the pyrolysis temperature. Therefore, the temperature range of the combustion products at the outlet of the reactor can be assumed as 648 T o u t 798 K. Once the value of T o u t is defined, the specific enthalpy of the combustion products ( h c o m b p r o d o ) can be determined according to Equation (29),
h c o m b p r o d o ( T o u t ) = h ¯ c o m b p r o d o ( T o u t ) P M g a s m ˙ g a s b m ˙ c o m b p r o d ,
where h ¯ c o m b p r o d o represents the molar enthalpy of the combustion products of Equation (26), which is expressed in terms of one mole of burnt pyrolysis gas.

2.2.5. Heat Transferred to Carrier Gas (N 2 )

For a pyrolysis system operating in a steady state (assumption i), the N 2 mass flow rate at the inlet and outlet of the reactor is equal ( m ˙ N 2 ). Furthermore, if N 2 enters the reactor at 298 K (assumption iii) and exits at the pyrolysis temperature (assumption v), then the heat transferred to the carrier gas ( Q ˙ N 2 ) can be calculated according to Equation (30):
Q ˙ N 2 m ˙ N 2 = m ˙ N 2 m ˙ t y r e h N 2 o ( T p y ) h N 2 o ( 298 K ) .
The values for h N 2 o are well defined, but the value of nitrogen-to-tyre mass ratio ( m ˙ N 2 / m ˙ t y r e ) depends on the characteristics of the reactor. Some authors, such as Martinez et al. [11] and Aylon et al. [80,81], used screw reactors (or scroll reactors) to study the tyre pyrolysis process, used nitrogen-to-tyre mass ratios ranging from 0.002 to 0.006. Meanwhile, Galvagno et al. [33] used a rotary kiln reactor, which required a nitrogen-to-tyre mass ratio of 0.36 to achieve a tyre conversion of 81%. In fluidised bed reactors [19] and conical spouted bed reactors [22], m ˙ N 2 / m ˙ t y r e can reach values of 7.7, beacuse N 2 is used as a fluidising gas in addition to removing the pyrolysis vapours.

2.2.6. Heat Losses Due to Imperfect Insulation of the Reactor

Heat losses during the operation of a reactor can be quantified using the theory of heat transfer, for which one must know the distribution temperature, the type of material, and the geometry of the reactor. On the other hand, empirical expressions can be used to simplify this task, which involve only a few variables. Daugaard and Brown [19] provided the empirical expression shown in Equation (31) to estimate the heat losses Q ˙ l o s s (J/s) in the reactor used (noninsulated walls) during their experiments on plant biomass pyrolysis:
Q ˙ l o s s = 428.3 V ˙ N G 3747.4 .
The term V ˙ N G corresponds to the volumetric flow rate of natural gas (l/min) used by the authors to meet the energy requirements of the pyrolysis process. Equation (31) can be rewritten as Equation (32), where Q ˙ l o s s is expressed as a percentage Z of the lower heating value of natural gas ( L H V N G ):
Z = Q ˙ l o s s L H V N G m ˙ N G .
The decision to rewrite Equation (31) as (32) is due to the asymptotic behaviour of the latter with respect to m ˙ N G , as can be seen in Figure 6. It was prepared assuming that the natural gas is composed only of methane gas supplied under normal conditions of pressure and temperature (273 K and 1 atm).
Since the percentages Z shown in Figure 6 correspond to a noninsulated reactor [19], values below 70% are reasonable to evaluate the pyrolysis process of this work, therein assuming heat losses due to imperfect insulation of the reactor walls. Based on the experimental evidence so far, Equation (33) was proposed in this paper to express Q ˙ l o s s from the tyre pyrolysis process in terms of the mass flow rate of the burnt pyrolysis gas ( m ˙ g a s b ) and its respective heating value ( L H V g a s ):
Z = Q ˙ l o s s L H V g a s m ˙ g a s b .

2.3. Mass Fraction of Pyrolysis Gas to Cover the Energy Demand of the Tyre Pyrolysis Process

Based on the theoretical foundation and experimental information presented in Section 2.2, Equation (4) was rewritten for the mass fraction X of the pyrolysis gas that must be burned to meet the energy demand of the tyre pyrolysis process according to Equation (34) (see Appendix A):
X = E ˙ d / m ˙ t y r e m ˙ g a s m ˙ t y r e h g a s o ( 298 K ) + λ A F e s t h a i r o ( T i n ) h ¯ c o m b p r o d o ( T o u t ) P M g a s L H V g a s Z .
Some authors [11,12] have evaluated the energy self-sufficiency of the tyre pyrolysis process by comparing the L H V of the pyrolysis gas and the enthalpy of the pyrolysis reaction. However, this comparison is insufficient. First, the calculation of the energy released by the pyrolysis gas from its L H V assumes that the combustion products leave the reactor at 298 K, which is not true, because they leave the reactor at a temperature close to the pyrolysis temperature [19]. On the other hand, the enthalpy of the reaction of tyre pyrolysis, given by Martinez et al. [11], was calculated from the enthalpy of the tyre and its pyrolysis products at 298 K, which did not take into account the sensible enthalpy associated with increasing the temperature of the pyrolysis products from 298 K to the pyrolysis temperature.

3. Results and Discussion

3.1. Composition: Tyre Material and Pyrolysis Products

The experimental data compiled and presented in Section 2.2 were employed to estimate the mass yields and elemental compositions of the tyre pyrolysis products. Table 1 shows the values adopted for the mass yields and elemental compositions of the tyre pyrolysis products.
On the other hand, the mass fractions of the 15 gas components assumed to form the pyrolysis gas were estimated based on the elemental compositions of the pyrolysis gas shown in Table 1 and Equations (22), (24) and (25). The empirical multiplication factors k j used in Equation (24) were all between −0.1 and 1, with values chosen to not exceed the experimental values presented at the beginning. Figure 7 shows the values obtained from the mass fractions of the components, the molar mass, and the calorific value ( L H V and H H V ) of the pyrolysis gas as a function of the pyrolysis temperature.
The results in Figure 7a were arranged into five groups: CO, CO 2 , CH 4 , C x 2 , and H 2 S. The C x 2 group includes hydrocarbons with two or more carbons in their composition. The carbon oxides (CO and CO 2 ) in the pyrolysis gas come from oxygenated organic components that are part of the tyre material such as stearic acid, extender oils, etc. [14,22,29,46,81]. Hydrogen sulphide (H 2 S) is another important component of pyrolysis gas, which comes from the decomposition of sulphur bonds in the structure of vulcanised rubber [46,81]. In Figure 7b, the C x 2 group was decomposed into four groups corresponding to C 2 (C 2 H 4 , C 2 H 6 ), C 3 (C 3 H 6 , C 3 H 8 ), C 4 (C 4 H 6 , C 4 H 8 , C 4 H 10 ), and C 5 (C 5 H 8 , C 5 H 10 , C 5 H 12 ). The value of the mass fractions for each group is equal to the sum of the mass fractions of the elements that make it up. In addition, the mass fraction for H 2 has been plotted in Figure 7b to observe its behaviour with temperature. Figure 7a,b show how the concentration of CO 2 and hydrocarbons C x 2 decreased with increasing temperature, while H 2 , CH 4 , and CO increased. The same behaviour was observed by Neves et al. [23] for the components of pyrolysis gas from plant biomass. They attributed the increase in H 2 , CH 4 , and CO to secondary reactions, which became more significant above 773 K. In this work, using the modified equilibrium model, it was found that the mass concentration of CH 4 , CO, and H 2 increased with increasing temperature (from 698 to 848 K) from 9.48 to 12.19%, from 0.74 to 8.82%, and from 2.75 to 2.83%, respectively.
Figure 7b shows how the C 2 , C 3 , C 4 , and C 5 groups decreased with increasing temperature, as was expected. The most important hydrocarbons in the pyrolysis gas are those with four carbons ( C 4 ), whose presence can be attributed mainly to the depolymerisation of the butadiene–styrene rubber of the tyres [11,22,29,46]. The mass fractions of the C 4 hydrocarbons estimated in this work were 37.24% and 35.49% at temperatures of 698 and 848 K, respectively. According to Lopez et al. [22], the decrease in the C 4 concentrations with increasing temperature is related to the secondary cracking reactions, which increase the concentrations of light hydrocarbons such as CH 4 .
The increase in the concentration of the light components in the pyrolysis gas was reflected in its molar mass ( P M g a s ), which decreased with increasing temperature, as can be seen in Figure 7c. Moreover, according to Figure 7c, the H H V of the pyrolysis gas derived from tyre material ranged between 40.28 and 40.47 MJ/kg for pyrolysis temperatures between 698 and 848 K, respectively, which is within the limits (32.06–53.53 MJ/kg) defined by the collected experimental data [10,11,14,22,29,35,37,40,70]. A similar result was obtained for the L H V , where the estimated values (37.23–37.43 MJ/kg) were within the limits (29.45–48.49 MJ/kg) defined by the experimental data [10,11,14,22,29,35,37,40,70]. High concentrations of CO 2 and CO have a negative impact on the H H V of the pyrolysis gas, as these components have H H V s of zero and 10.1 MJ/kg, respectively. This fact explains the energetic superiority of tyre pyrolysis gas over the gas from plant biomass (<20 MJ/kg), as the latter consists mainly of carbon monoxide at temperatures below 1023 K [23].

3.2. Enthalpy of the Tyre Material and Its Pyrolysis Products

The values of the enthalpy of formation and sensible enthalpy from Equation (8) for the tyre material and its pyrolysis products were determined using different methods, as described in Section 2.2. The assumptions made in the idealisation of the tyre pyrolysis process made it possible to obtain equations depending on the pyrolysis temperature (698–848 K), as this was the only variable in the process studied.

3.2.1. Specific Enthalpy of the Tyre Material and Char

The values of the enthalpy of formation for the tyre material and char were estimated from Equation (6) assuming H H V values of 36.41 MJ/kg and 30.14 MJ/kg, respectively (see Section 2.2). The value of the specific enthalpy of the tyre material did not change with the pyrolysis temperature, as it entered the reactor at 298 K. The specific enthalpy of the char, on the other hand, changed with the pyrolysis temperature, as it left the reactor at the same pyrolysis temperature, which varied betweem 698 and 848 K. Therefore, the sensible enthalpy of the char at temperatures above 298 K was different from zero and was estimated using Equation (11). The relationships obtained for the specific enthalpy of the tyre material and char are shown in Equations (35) and (36), respectively, which are valid for pyrolysis temperatures between 698 and 848 K:
h t y r e o ( 298 K ) = 2357.90 [ J / g ]
and
h c h a r o ( T ) = 2985.34 + 38.56 × 10 2 T + 8.35 × 10 4 T 2 [ J / g ] .

3.2.2. Specific Enthalpy of the TPO Vapour

The specific enthalpy of the TPO vapour was estimated based on the 187 components identified in TPO by Alvarez et al. [55]. Although Alvarez et al. [55] identified 187 compounds, there was a mass fraction of the TPO sample that could not be identified. The authors analysed three TPO samples obtained at pyrolysis temperatures of 698, 748, and 848 K; the percentages of unidentified samples in these three samples were 30.22, 27.96, and 21.22%, respectively. Here, we assumed that the TPO was formed exclusively from the identified components, so the mass fractions of each of the 187 components were recalculated such that j = 1 187 x j = 1 . Next, the assumption that the composition of the pyrolysis vapours remains invariant upon a phase change allowed us to calculate the enthalpy of the pyrolysis vapours for the three pyrolysis temperatures (698, 748, and 848 K). The experimental values for the enthalpy of formation at 298 K and the specific heat were obtained from the National Institute of Standards and Technology website [79] and the NASA Glenn coefficients [54]. However, of the 187 components, only the experimental values of h j o ( 298 K ) and c p , j o ( T ) for 57 and 27 components, respectively, were known. Therefore, the GCM was used as given in Equations (13) and (15). Finally, using the composition reported by Alvarez et al. [55], the enthalpy values of each component and the Gibbs–Dalton law (Equations (12) and (14)) were used to generate the three specific enthalpy values for the TPO vapour, which were fitted by Equation (37) for a temperature range of 698 to 848 K (see the Supplementary Materials for more details):
h T P O o ( T ) = 2611.09 12.78 T + 1.34 × 10 2 T 2 [ J / g ] .

3.2.3. Specific Enthalpy of the Pyrolysis Gas

The specific enthalpy of pyrolysis gas was estimated using Equation (8). Each of its terms, i.e., the enthalpy of formation at 298 K and the sensible enthalpy, were calculated using Equations (12) and (14), respectively. The mass fractions required for Equations (12) and (14) were taken from Figure 7, while the enthalpy of formation at 298 K and the sensible enthalpy were calculated using the NASA Glenn coefficients [54]. Equation (38) was obtained for the specific enthalpy of the pyrolysis gas in the temperature range from 698 to 848 K:
h g a s o ( T ) = 494.33 7.49 T + 7.60 × 10 3 T 2 [ J / g ] .

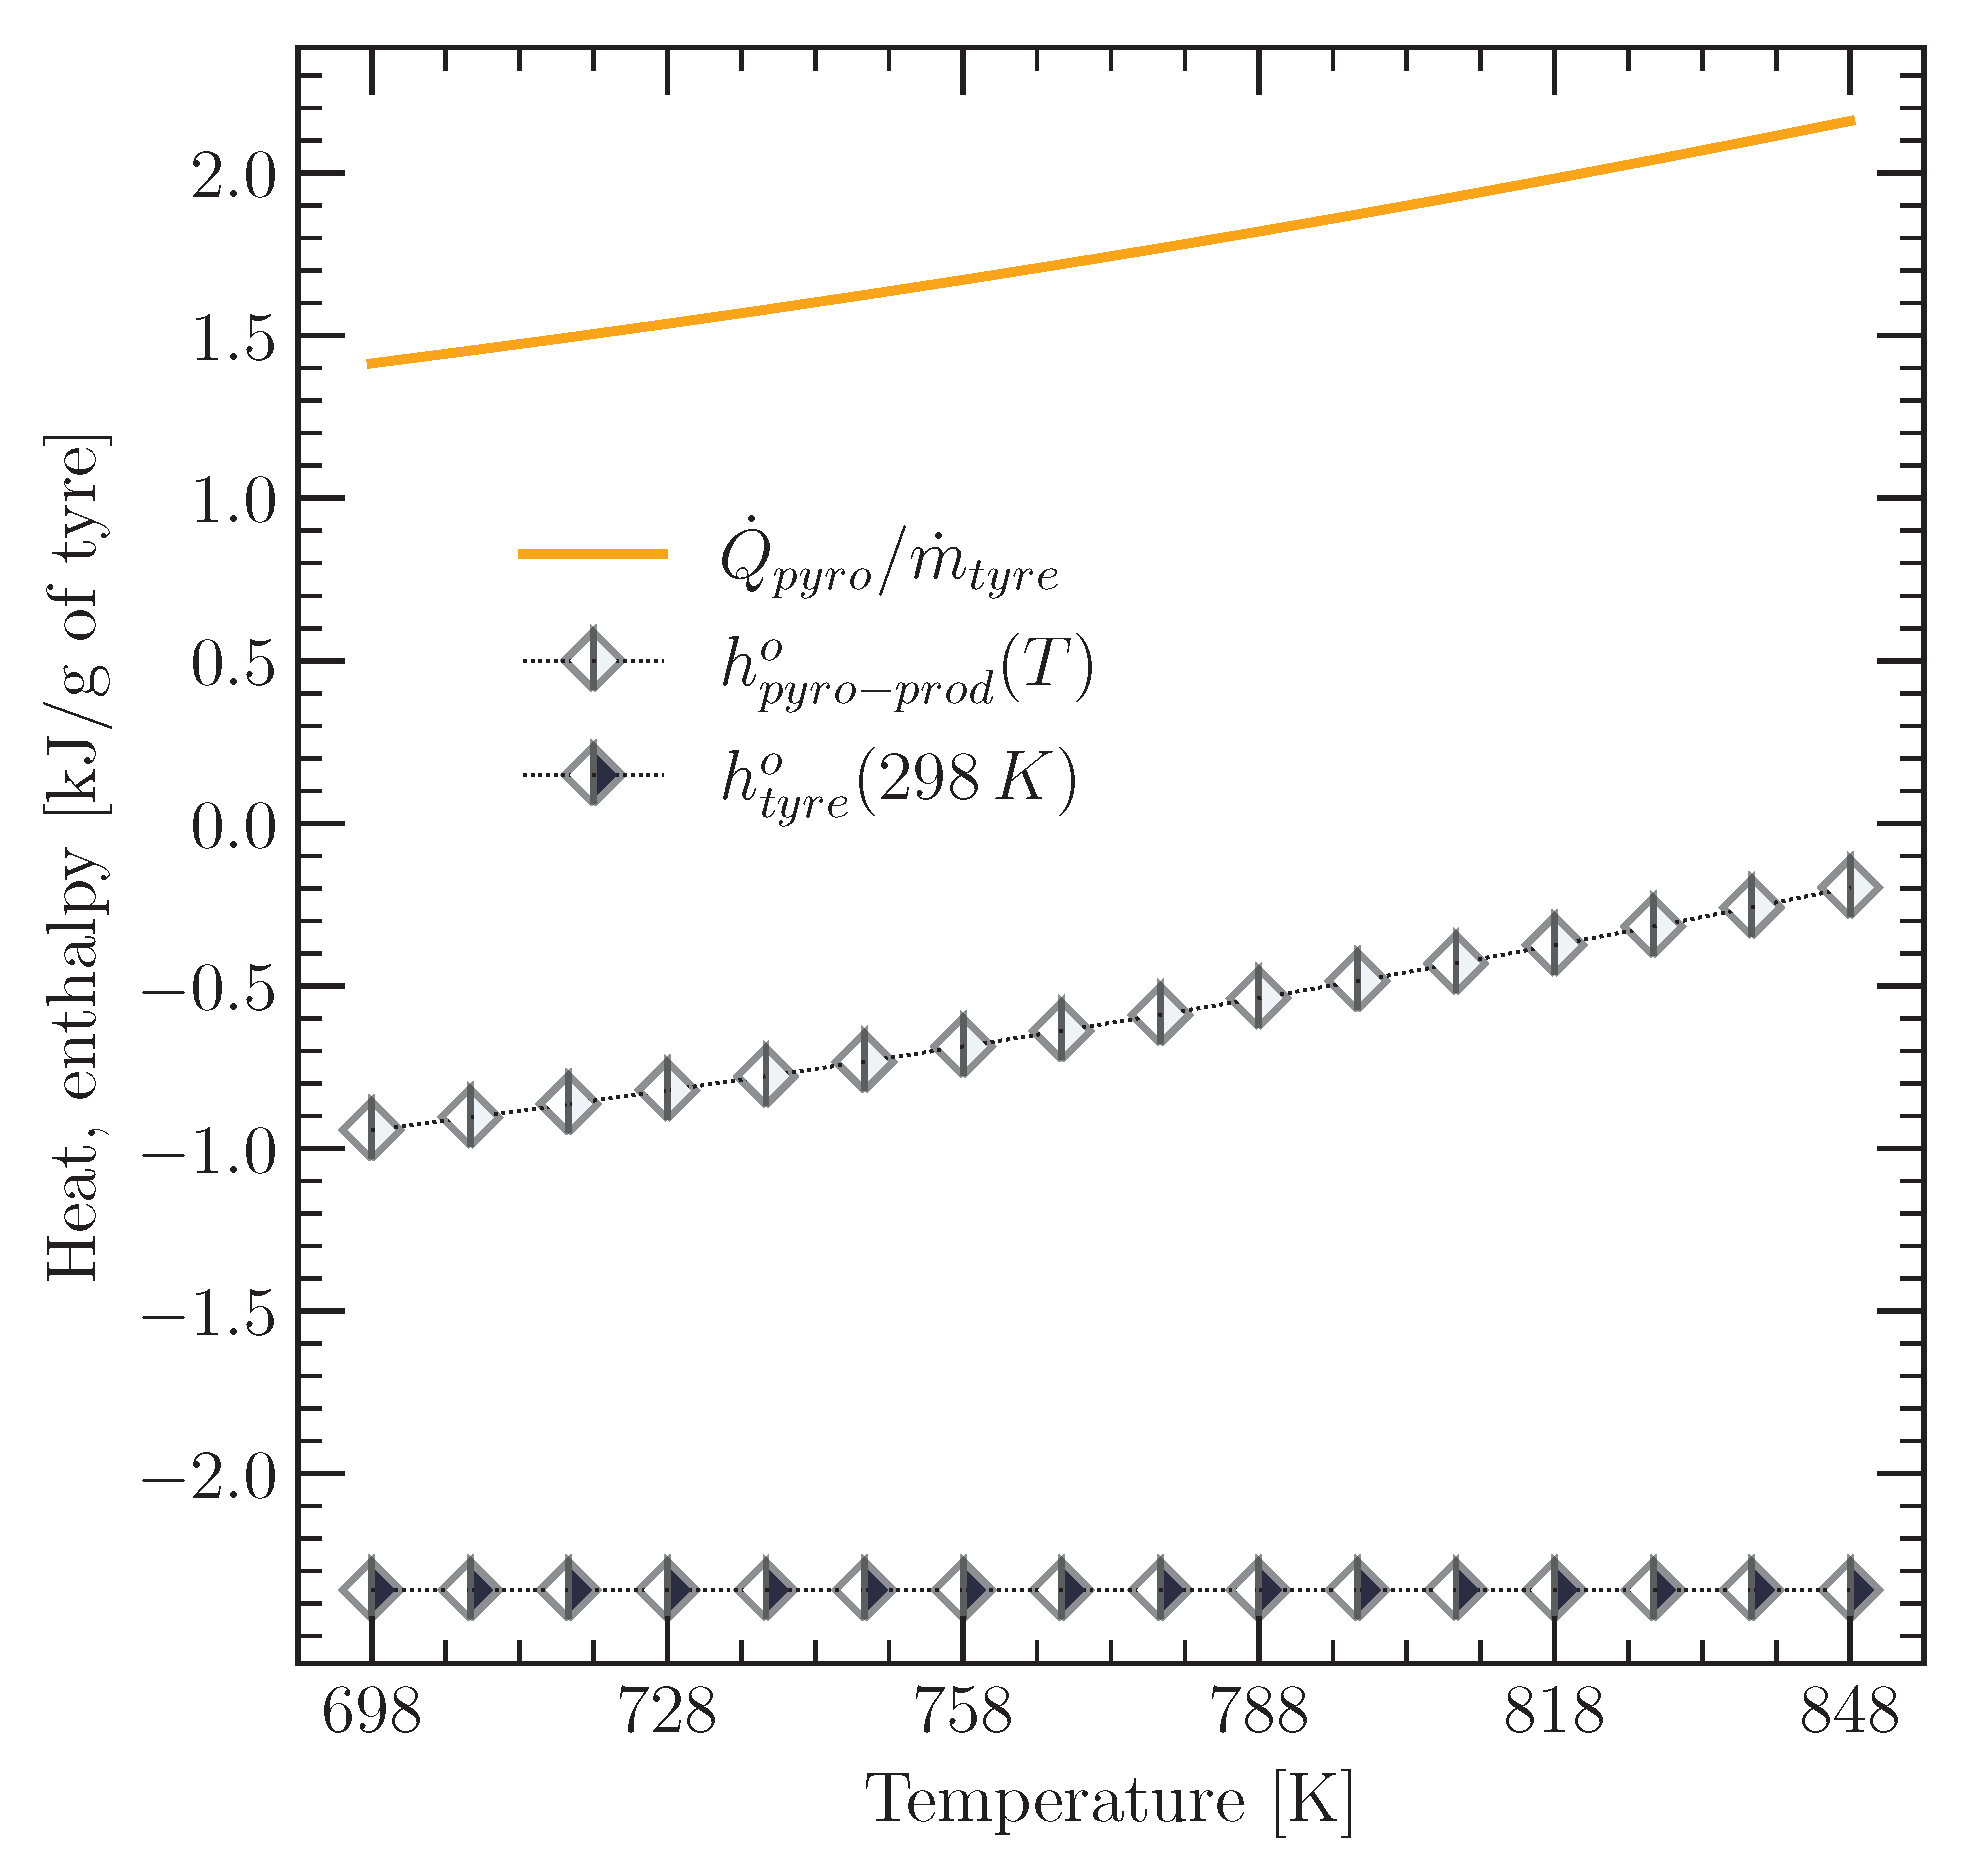
3.3. Heat Required by the Tyre Pyrolysis Reaction

The heat required for the pyrolysis reaction of the tyre was calculated using Equation (1). Each term of this equation was defined by the data presented in Table 1 and Equations (35)–(38). Figure 8 shows the heat required for the tyre pyrolysis reaction, together with the specific enthalpy values of the tyre pyrolysis products ( h p y r o p r o d o ). The value of h p y r o p r o d o corresponds to the sum of the specific enthalpy values of char, TPO vapour, and pyrolysis gas, which are each based on the mass of pyrolysed tyre.
Figure 8 shows that the enthalpy of the products increased as the temperature rose from 698 to 848 K, while the enthalpy of the tyre material remained constant because, as mentioned above, the tyre material entered the reactor at a fixed temperature of 298 K. The higher the pyrolysis temperature, the greater the heat requirement for the pyrolysis reaction. The estimated value for the heat required by the tyre pyrolysis reaction was 1.41 kJ/g of tyre material at 698 K and increased to 2.16 kJ/g of tyre material at a temperature of 848 K. These values are close to those reported in the CalRecovery Report No 1364 [17], according to which the heat required to sustain tyre pyrolysis appears to be between about 1.47 and 2.38 kJ/g tyre material, respectively.
Furthermore, the values for the heat requirement of the tyre pyrolysis reaction shown in Figure 8 are slightly higher than those reported by Yang et al. [18] for biomass: 1.2 kJ/g at a pyrolysis temperature of 773 K and 1.5 kJ/g at 823 K. The reason for this may be the complex structure of the tyre material and the presence of sulphur in its composition due to the vulcanisation process. Daugaard and Brown [19] investigated the influence of biomass composition on the energy requirement for pyrolysis and found that biomasses with a higher lignocellulosic composition (woody biomass) required more heat for pyrolysis than herbaceous biomasses. Reed and Gaur [20] found that the heat values required for the pyrolysis of pine and oak at 773 K were 1.77 and 1.61 kJ/g, respectively, while the corresponding values for corn stover and oat hulls were 1.53 and 1.04 kJ/g, respectively.

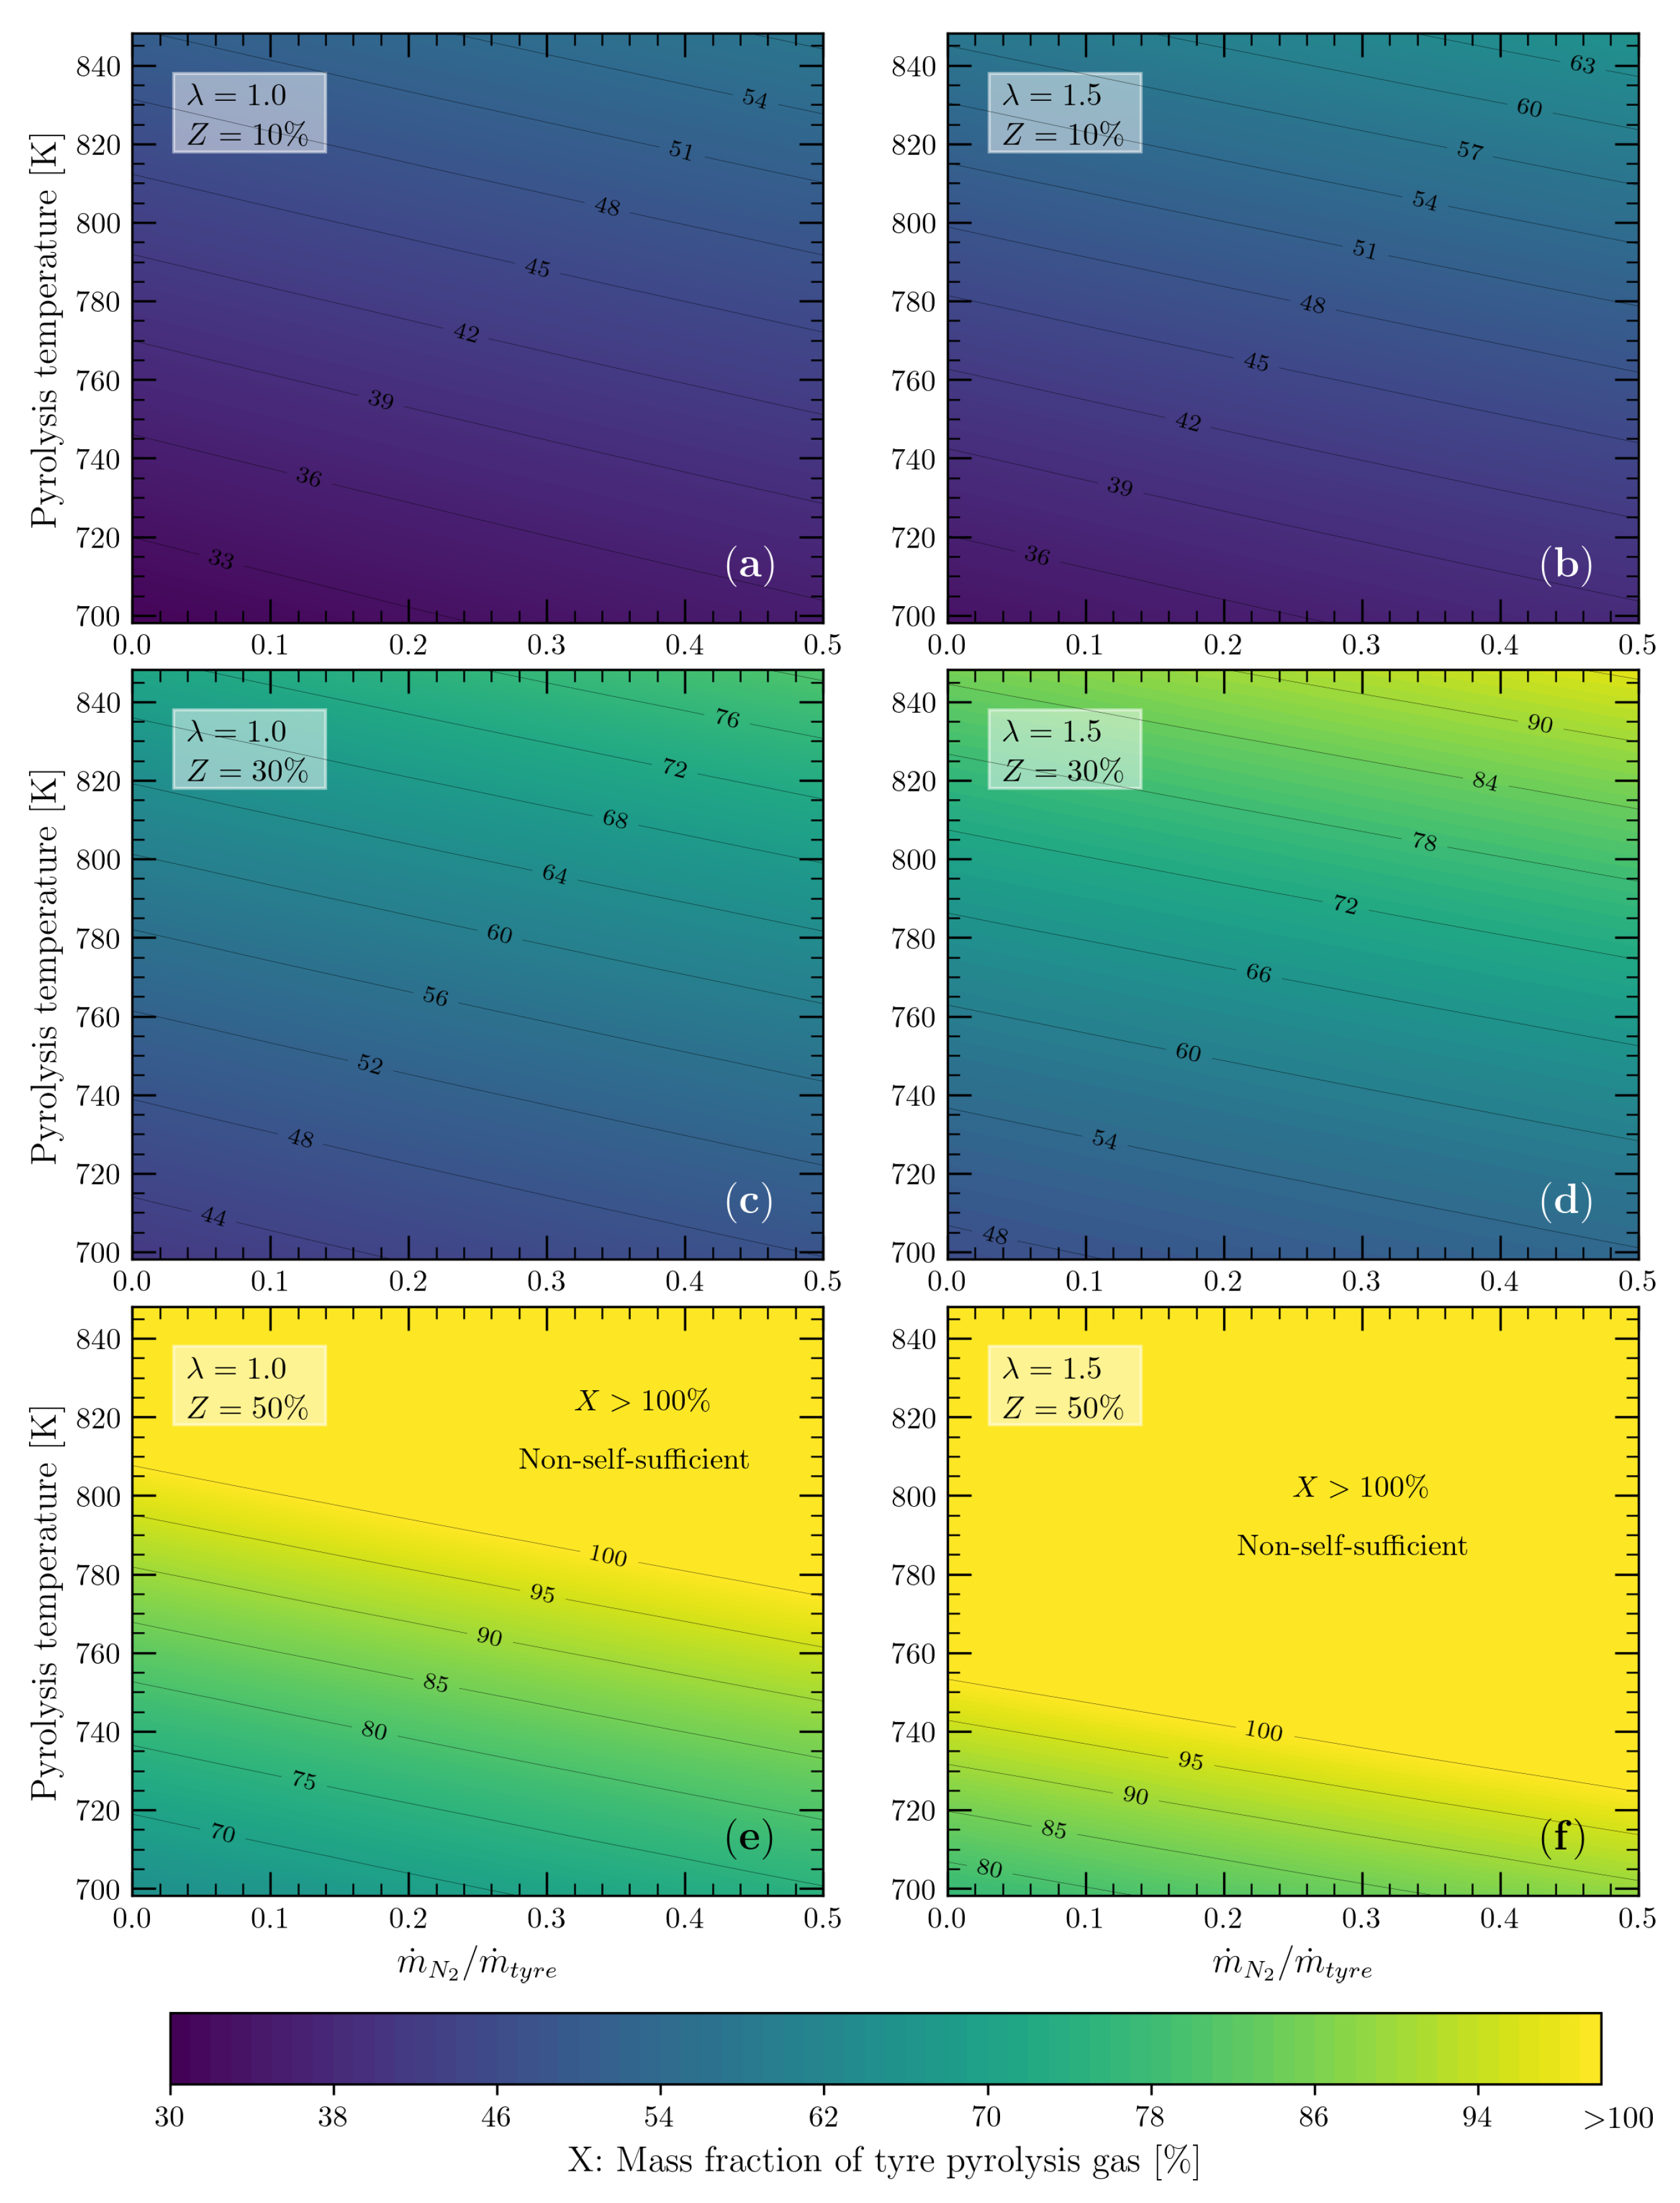
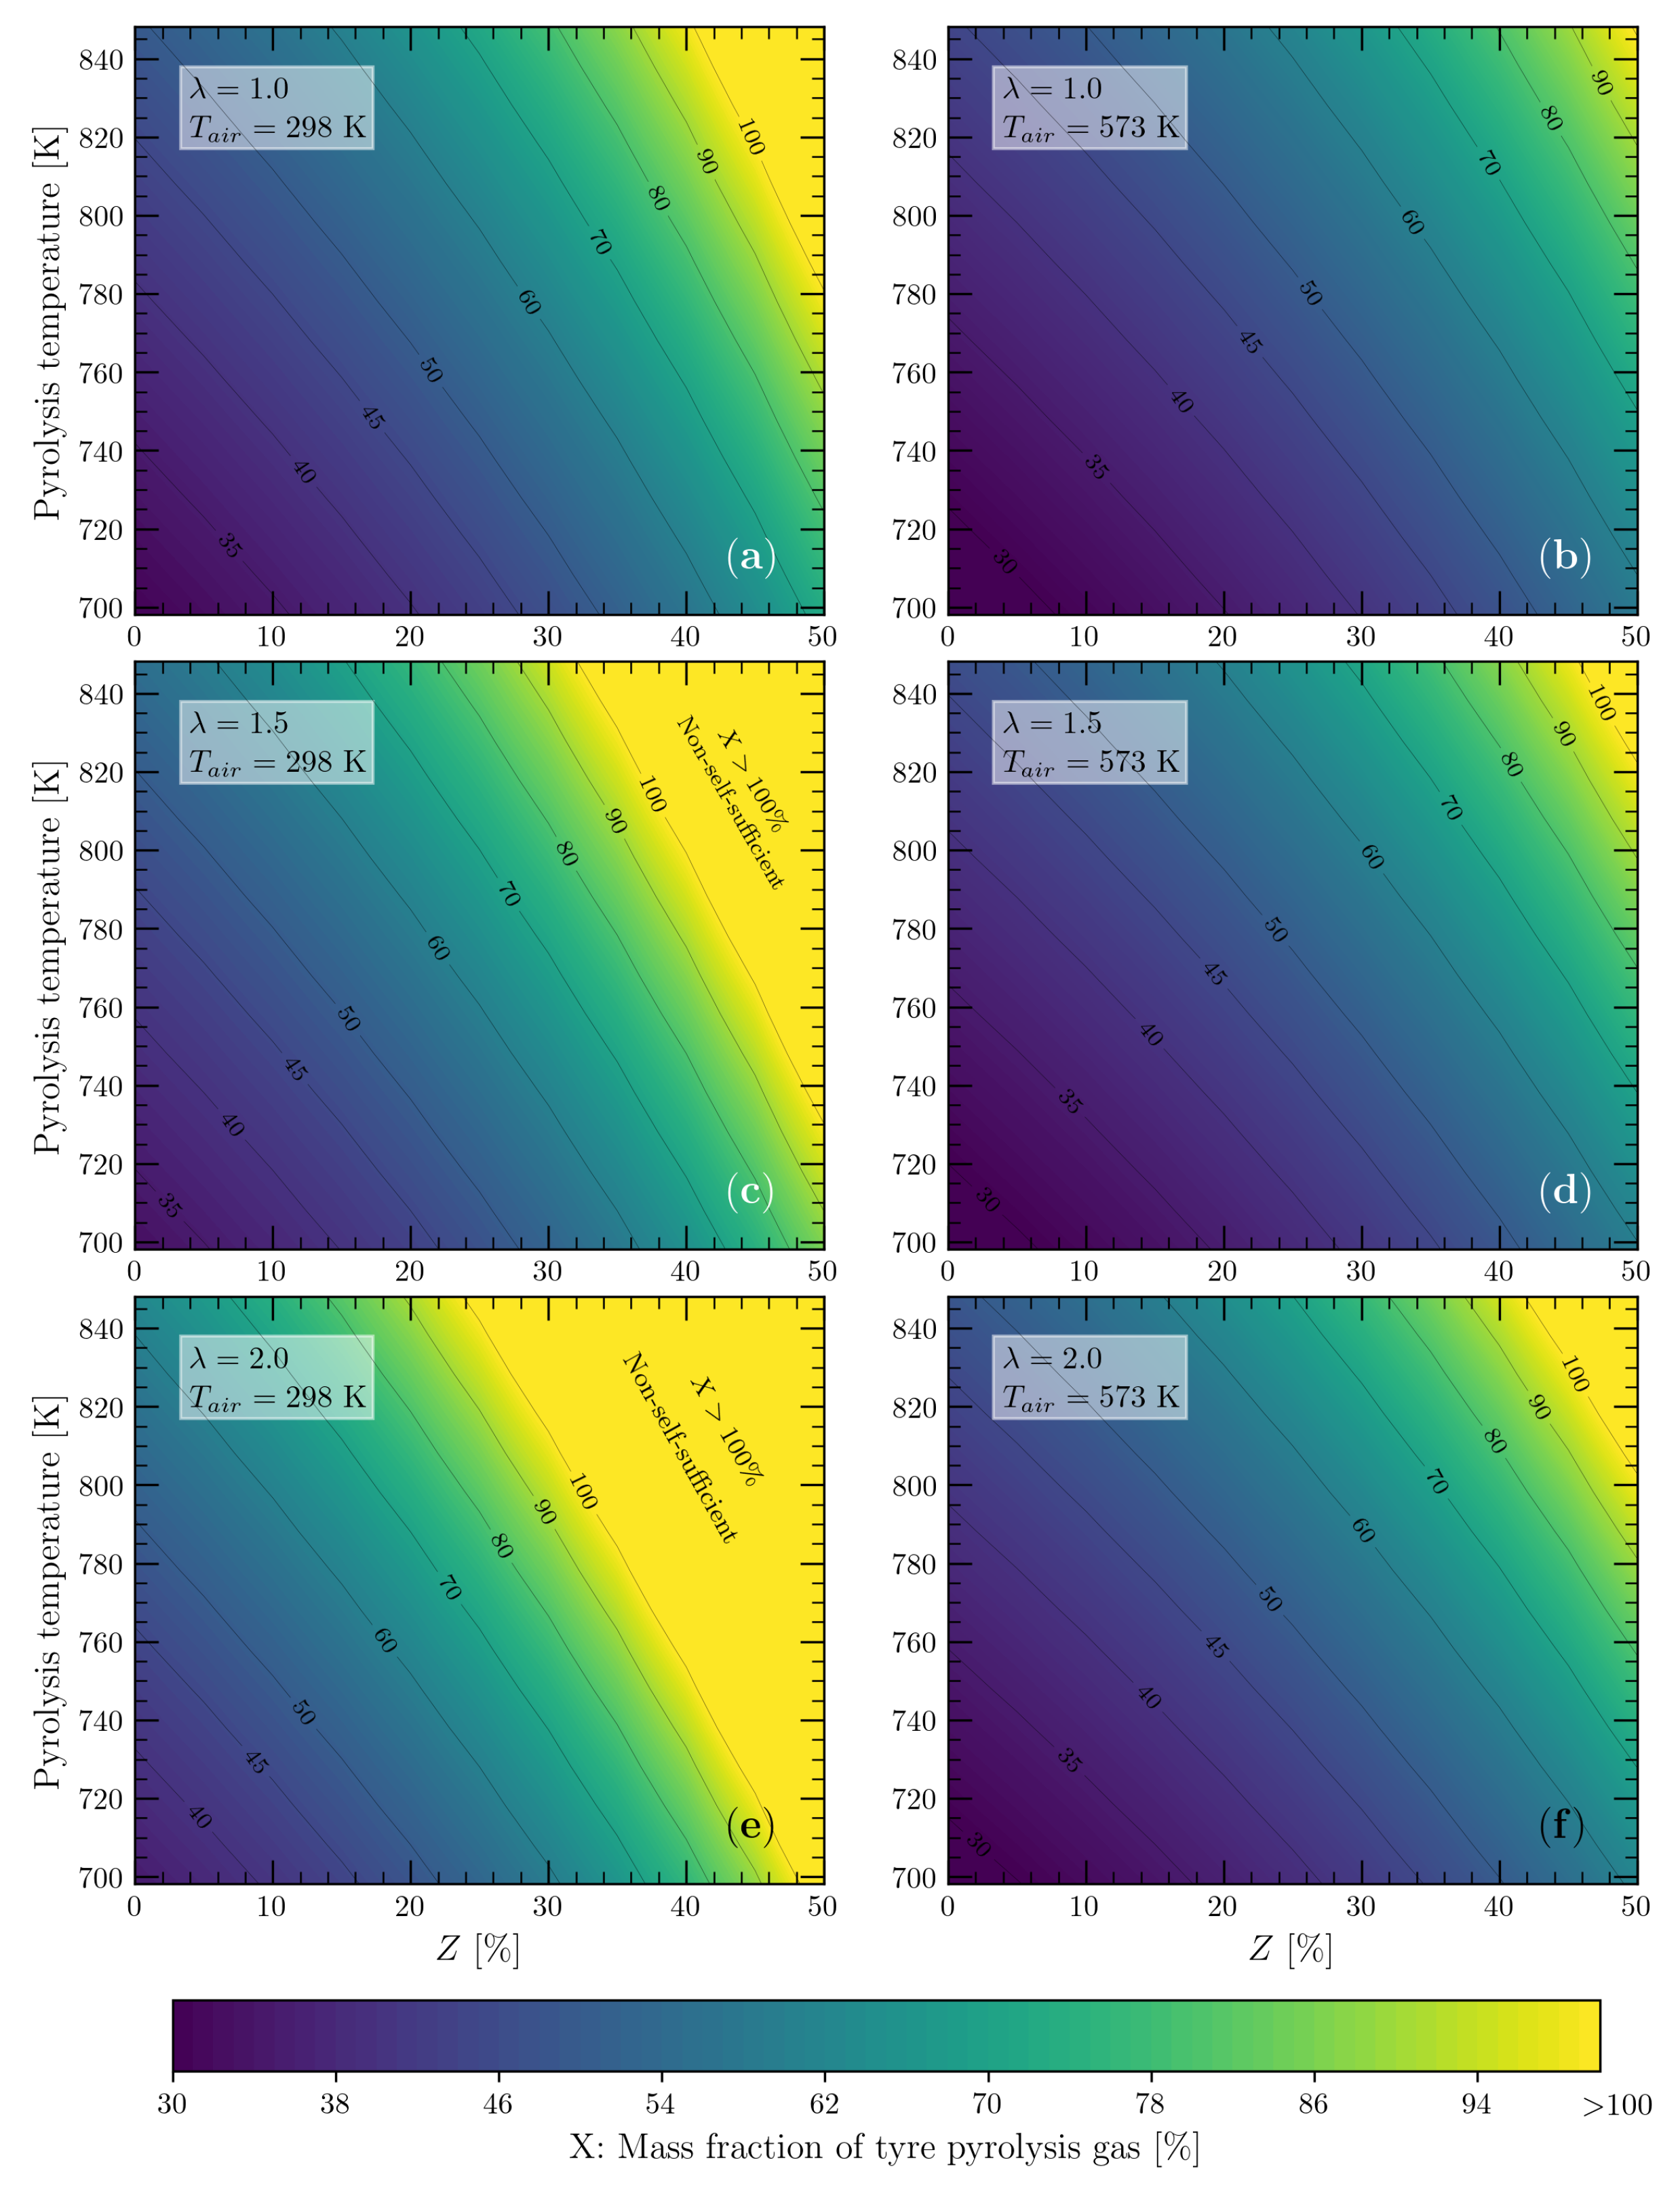
3.4. Energy Self-Sufficiency of the Tyre Pyrolysis Process

In this work, pyrolysis gas was used as a heat source to meet the energy demand of the pyrolysis process due to its high calorific value. The agreement between the calculated values for the L H V g a s and the collected experimental data made it possible to use the values shown in Figure 7c and Figure 8 to calculate the mass fraction of pyrolysis gas (X) that must be burnt to meet the energy demand of the tyre pyrolysis process. For the case where only the heat was required for the tyre pyrolysis reaction (Equation (1)), i.e., without considering Q ˙ N 2 and Q ˙ l o s s , X varied between 30 to 50% for the pyrolysis temperture range from 698 to 848 K, respectively, and λ varied between 1 and 2, respectively. However, for the actual tyre pyrolysis process, the heat losses due to the imperfect insulation of the reactor and the heat transferred to the carrier gas have to be considered. Therefore, Figure 9 shows the results for X as a function of the nitrogen-to-tyre mass ratio and the pyrolysis temperature. In addition, the combustion of the pyrolysis gas was assumed under stoichiometric ( λ = 1 ) and air-rich ( λ = 1.5 ) conditions, with heat losses of 10 to 50% of the lower heating value of the pyrolysis gas.
The contour lines in Figure 9 represent the mass fraction X of pyrolysis gas that must be burnt to meet the energy demand of the tyre pyrolysis process. Lower X values were required for λ = 1.0 (Figure 9a,c,e) than for λ = 1.5 (Figure 9b,d,f), because the heat released during the combustion reaction of the pyrolysis gas was only used for the formation of combustion products (without O 2 ) and raised their temperature to T o u t (648 to 798 K). In λ > 1 , on the other hand, excess air became part of the combustion products that absorbed some of the heat released during the combustion reaction, so a larger amount of pyrolysis gas was required to balance the heat transferred to excess air.
On the other hand, Figure 9a–d show that the pyrolysis gas produced during tyre pyrolysis is capable of meeting the energy demand of the pyrolysis process, even with heat losses of up to 30% of the L H V g a s . Nevertheless, the energy self-sufficiency of the pyrolysis process was limited at Z = 50 %, and the tyre pyrolysis process was only suitable for pyrolysis temperatures below 773 and 723 K for λ = 1.0 and λ = 1.5 (Figure 9e,f), respectively.
It is important to see in Figure 9 that the carrier gas (N 2 ) did not significantly affect the demand for the pyrolysis gas to meet the energy demand of the process (slope of the contour lines), but the higher the air mass flow rate ( λ > 1 ), the greater the demand for pyrolysis gas was. One way to deal with air mass flow rates higher than the stoichiometric value is to preheat the combustion air, thereby taking advantage of the high temperature of the tyre pyrolysis products and leaving the reactor with temperatures close to the pyrolysis temperature (698 to 848 K). The previous results, Figure 9a–d, were obtained by assuming that the temperature of the combustion air was 298 K. In order to evaluate the influence of preheating the air, the pyrolysis gas demand was calculated by assuming a combustion air temperature equal to 573 K. In addition, a nitrogen-to-tyre mass ratio of 0.4 was considered, which includes typical the operating values for rotary kiln reactors [33]. From these operating conditions, the mass fractions X of the required pyrolysis gas were calculated and are shown in Figure 10, together with the values obtained for the nonpreheated combustion air (298 K).
As can be seen in Figure 10, preheating the combustion air had a positive effect, as it allowed the energy self-sufficiency range of the tyre pyrolysis process to be extended under the operating conditions described. For example, in Figure 10a, at temperatures of 788 and 848 K, with heat losses of 50 and 40%, respectively, all of the pyrolysis gas produced must be combusted to meet the energy requirements of the pyrolysis process. However, when the air was preheated to 573 K, the required proportion of pyrolysis gas dropped to 80% in both cases (Figure 10b). In the cases of λ = 1.5 (Figure 10c,d) and 2.0 (Figure 10e,f), preheating the air had a greater positive effect due to the larger air mass flow rate, thus making the pyrolysis process energy self-sufficient in almost all of the entire operating range studied. Therefore, the preheating of the combustion air is a crucial factor for the possibility of obtaining an energy self-sufficient tyre pyrolysis process, which can be achieved without the use of an external heat source, since the heat that would be released to the environment when cooling the pyrolysis products could be used efficiently by choosing a suitable heat exchanger.
Finally, the results obtained in this work show the energetic attractiveness of the tyre pyrolysis process, which can become energy self-sufficient under certain operating conditions. These results are in line with the information provided by Polimix [82], which uses rotating reactors (continuous operation) to pyrolyse about 85 tonnes of tyres per day. According to Polimix (technical visit), the reactors operate in the temperature range of 753 to 823 K, and the pyrolysis gas produced by one reactor can meet the energy needs of two reactors, i.e., ∼50% of the mass of pyrolysis gas produced can meet the energy needs of the process.

4. Conclusions

Although the pyrolysis process allows for the recovery and disposal of waste tyres, its viability must be consolidated by using the high-energy contents of its pyrolysis products to cover its own energy demand. Tyre pyrolysis gas is rich in hydrocarbons, which gives it a high calorific value that is capable of making the pyrolysis process energetically self-sustainable when used (partially or completely) as a heat source. However, the energy self-sufficiency of the tyre pyrolysis process can be compromised by heat losses due to the imperfect insulation of the pyrolysis reactor walls. This situation can be reversed by utilising the heat that is released from the pyrolysis products when they cool down after leaving the reactor. This is because their high temperatures make them a valuable source of energy. The heat released when used to raise the temperature of the combustion air reduces the consumption of fuel (pyrolysis gas) that must be burned to meet the energy demand of the process.
While some works have stated that the energy demand of the tyre pyrolysis process can be covered by using the pyrolysis gas produced, a more detailed study was needed, as has been presented here. However, despite the favourable results obtained in this work to achieve the energy self-sufficiency of the tyre pyrolysis process, experimental work must be conducted in order to fully answer such a question.

Supplementary Materials

The following supporting information can be downloaded at: https://www.mdpi.com/article/10.3390/en16247932/s1.

Author Contributions

Conceptualisation, A.A.R.G. and J.A.d.C.J.; methodology, A.A.R.G. and J.A.d.C.J.; formal analysis, A.A.R.G.; investigation, A.A.R.G. and L.R.d.S.; resources, A.M.A.R. and C.A.M.; writing—original draft preparation, A.A.R.G., J.A.d.C.J. and L.R.d.S.; writing—review and editing, J.A.d.C.J. and C.A.A.-S.; visualisation, A.A.R.G. and C.A.A.-S.; supervision, J.A.d.C.J., L.R.d.S., C.A.M. and A.M.A.R.; funding acquisition, J.A.d.C.J. and C.A.M. All authors have read and agreed to the published version of the manuscript.

Funding

This work was carried out with financial support from the São Paulo State Research Foundation (FAPESP), process no. 2016/10274-9, and the National Council for Scientific and Technological Development (CNPq), process numbers 381252/2020-5 and 428039/2018-9. The authors would like to thank the APC funded by Cesar Vallejo University.

Data Availability Statement

The data presented in this study are available in the Supplementary Materials.

Conflicts of Interest

The authors declare no conflict of interest.

Nomenclature

aNumber of gram atoms
c p o Specific heat at standard pressure, in J/g·K
g ¯ f o Molar Gibbs free energy at standard pressure, in J/mol
G s y s t e m Gibbs free energy of a mixture of gases
H H V Higher heating value, in J/g
h o Specific enthalpy at standard pressure, in J/g
h f o Specific enthalpy of formation at standard pressure, in J/g
h ¯ f o Molar enthalpy of formation at standard pressure, in J/mol
LLagrange function
L H V Lower heating value, in J/g
m ˙ Mass flow rate, in g/s
nNumber of moles
P M Molar mass, g/mol
Q ˙ Heat exchanged per unit of time, in J/s
RUniversal gas constant, in J/mol·K
TTemperature, in K
xMass fraction
α Lagrange multiplier
λ Excess air coefficient
Subscripst
c o m b p r o d Combustion products
iElemental species (C, H, N, S, and O)
jComponent of a mixture of gases
p y r o / p y Pyrolysis
p y r o p r o d Pyrolysis products
p r o d Products
r e a g Reagents
rMolecular group

Appendix A

The derivation of Equation (34) from Equations (3), (4), (28), (29) and (33):
E ˙ d ( T p y ) m ˙ t y r e = X m ˙ g a s m ˙ t y r e h g a s o ( 298 K ) + m ˙ a i r m ˙ t y r e h a i r o ( T i n ) m ˙ c o m b p r o d m ˙ t y r e h c o m b p r o d o ( T o u t ) Q ˙ l o s s m ˙ t y r e , E ˙ d ( T p y ) m ˙ t y r e = X m ˙ g a s m ˙ t y r e h g a s o ( 298 K ) + m ˙ g a s b m ˙ t y r e A F h a i r o ( T i n ) m ˙ c o m b p r o d m ˙ t y r e h ¯ c o m b p r o d o ( T o u t ) P M g a s m ˙ g a s b m ˙ c o m b p r o d Z L H V g a s m ˙ g a s b m ˙ t y r e , E ˙ d ( T p y ) m ˙ t y r e = X m ˙ g a s m ˙ t y r e h g a s o ( 298 K ) + X m ˙ g a s m ˙ t y r e λ A F e s t h a i r o ( T i n ) X m ˙ g a s m ˙ t y r e h ¯ c o m b p r o d o ( T o u t ) P M g a s X m ˙ g a s m ˙ t y r e Z L H V g a s , E ˙ d ( T p y ) m ˙ t y r e = X m ˙ g a s m ˙ t y r e h g a s o ( 298 K ) + m ˙ g a s m ˙ t y r e λ A F e s t h a i r o ( T i n ) m ˙ g a s m ˙ t y r e h ¯ c o m b p r o d o ( T o u t ) P M g a s m ˙ g a s m ˙ t y r e Z L H V g a s ,
X = E ˙ d ( T p y ) / m ˙ t y r e m ˙ g a s m ˙ t y r e h g a s o ( 298 K ) + λ A F e s t h a i r o ( T i n ) h ¯ c o m b p r o d o ( T o u t ) P M g a s L H V g a s Z .

References

  1. Machin, E.B.; Pedroso, D.T.; de Carvalho, J.A. Energetic valorization of waste tires. Renew. Sustain. Energy Rev. 2017, 68, 306–315. [Google Scholar] [CrossRef]
  2. World Business Council for Sustainable Development. Global ELT Management—A Global State of Knowledge on Collection Rates, Recovery Routes, and Management Methods. 2019. Available online: https://www.wbcsd.org/Sector-Projects/Tire-Industry-Project/End-of-Life-Tires-ELTs (accessed on 22 October 2023).
  3. Williams, P.; Bottrill, R.; Cunliffe, A. Combustion of Tyre Pyrolysis Oil. Process Saf. Environ. Prot. 1998, 76, 291–301. [Google Scholar] [CrossRef]
  4. Gamboa, A.R. Study of Tire Pyrolytic oil Combustion. Master’s Thesis, São Paulo State University, Sao Paulo, Brazil, 2016. (In Portuguese). [Google Scholar]
  5. García-Contreras, R.; Martínez, J.D.; Armas, O.; Murillo, R.; García, T. Study of a residential boiler under start-transient conditions using a tire pyrolysis liquid (TPL)/diesel fuel blend. Fuel 2015, 158, 744–752. [Google Scholar] [CrossRef]
  6. Vihar, R.; Žvar Bškovič, U.; Seljak, T.; Katrašnik, T. Combustion and emission formation phenomena of tire pyrolysis oil in a common rail Diesel engine. Energy Convers. Manag. 2017, 149, 706–721. [Google Scholar] [CrossRef]
  7. Sharma, A.; Murugan, S. Potential for using a tyre pyrolysis oil-biodiesel blend in a diesel engine at different compression ratios. Energy Convers. Manag. 2015, 93, 289–297. [Google Scholar] [CrossRef]
  8. Doǧan, O.; Çelik, M.B.; Özdalyan, B. The effect of tire derived fuel/diesel fuel blends utilization on diesel engine performance and emissions. Fuel 2012, 95, 340–346. [Google Scholar] [CrossRef]
  9. Akkouche, N.; Balistrou, M.; Loubar, K.; Awad, S.; Tazerout, M. Heating rate effects on pyrolytic vapors from scrap truck tires. J. Anal. Appl. Pyrolysis 2017, 123, 419–429. [Google Scholar] [CrossRef]
  10. Díez, C.; Martínez, O.; Calvo, L.; Cara, J.; Morán, A. Pyrolysis of tyres. Influence of the final temperature of the process on emissions and the calorific value of the products recovered. Waste Manag. 2004, 24, 463–469. [Google Scholar] [CrossRef]
  11. Martínez, J.D.; Murillo, R.; García, T.; Veses, A. Demonstration of the waste tire pyrolysis process on pilot scale in a continuous auger reactor. J. Hazard. Mater. 2013, 261, 637–645. [Google Scholar] [CrossRef]
  12. Aylón, E.; Murillo, R.; Fernández-Colino, A.; Aranda, A.; García, T.; Callén, M.; Mastral, A. Emissions from the combustion of gas-phase products at tyre pyrolysis. J. Anal. Appl. Pyrolysis 2007, 79, 210–214. [Google Scholar] [CrossRef]
  13. Frigo, S.; Seggiani, M.; Puccini, M.; Vitolo, S. Liquid fuel production from waste tyre pyrolysis and its utilisation in a Diesel engine. Fuel 2014, 116, 399–408. [Google Scholar] [CrossRef]
  14. López, F.A.; Centeno, T.A.; Alguacil, F.J.; Lobato, B. Distillation of granulated scrap tires in a pilot plant. J. Hazard. Mater. 2011, 190, 285–292. [Google Scholar] [CrossRef] [PubMed]
  15. Song, Z.; Yang, Y.; Sun, J.; Zhao, X.; Wang, W.; Mao, Y.; Ma, C. Effect of power level on the microwave pyrolysis of tire powder. Energy 2017, 127, 571–580. [Google Scholar] [CrossRef]
  16. Antoniou, N.; Zabaniotou, A. Features of an efficient and environmentally attractive used tyres pyrolysis with energy and material recovery. Renew. Sustain. Energy Rev. 2013, 20, 539–558. [Google Scholar] [CrossRef]
  17. CalRecovery, I. Final Report Environmental Factors of Waste Tire Pyrolysis, Gasification, and Liquefaction; CalRecovery report; American Consulting and Commodities, Inc.: Williams, CA, USA, 1995. [Google Scholar]
  18. Yang, H.; Kudo, S.; Kuo, H.P.; Norinaga, K.; Mori, A.; Mašek, O.; Hayashi, J.i. Estimation of Enthalpy of Bio-Oil Vapor and Heat Required for Pyrolysis of Biomass. Energy Fuels 2013, 27, 2675–2686. [Google Scholar] [CrossRef]
  19. Daugaard, D.E.; Brown, R.C. Enthalpy for Pyrolysis for Several Types of Biomass. Energy Fuels 2003, 17, 934–939. [Google Scholar] [CrossRef]
  20. Reed, T.B.; Gaur, S. The High Heat of Fast Pyrolysis for Large Particles. In Developments in Thermochemical Biomass Conversion: Volume 1/Volume 2; Bridgwater, A.V., Boocock, D.G.B., Eds.; Springer: Dordrecht, The Netherlands, 1997; pp. 97–103. [Google Scholar]
  21. Gamboa, A.R.; Rocha, A.M.; dos Santos, L.R.; de Carvalho, J.A. Tire pyrolysis oil in Brazil: Potential production and quality of fuel. Renew. Sustain. Energy Rev. 2020, 120, 109614. [Google Scholar] [CrossRef]
  22. Lopez, G.; Alvarez, J.; Amutio, M.; Mkhize, N.; Danon, B.; van der Gryp, P.; Görgens, J.; Bilbao, J.; Olazar, M. Waste truck-tyre processing by flash pyrolysis in a conical spouted bed reactor. Energy Convers. Manag. 2017, 142, 523–532. [Google Scholar] [CrossRef]
  23. Neves, D.; Thunman, H.; Matos, A.; Tarelho, L.; Gómez-Barea, A. Characterization and prediction of biomass pyrolysis products. Prog. Energy Combust. Sci. 2011, 37, 611–630. [Google Scholar] [CrossRef]
  24. Raj, R.E.; Kennedy, Z.R.; Pillai, B. Optimization of process parameters in flash pyrolysis of waste tyres to liquid and gaseous fuel in a fluidized bed reactor. Energy Convers. Manag. 2013, 67, 145–151. [Google Scholar] [CrossRef]
  25. Williams, P.T. Pyrolysis of waste tyres: A review. Waste Manag. 2013, 33, 1714–1728. [Google Scholar] [CrossRef]
  26. Martínez, J.D.; Puy, N.; Murillo, R.; García, T.; Navarro, M.V.; Mastral, A.M. Waste tyre pyrolysis—A review. Renew. Sustain. Energy Rev. 2013, 23, 179–213. [Google Scholar] [CrossRef]
  27. Kordoghli, S.; Khiari, B.; Paraschiv, M.; Zagrouba, F.; Tazerout, M. Impact of different catalysis supported by oyster shells on the pyrolysis of tyre wastes in a single and a double fixed bed reactor. Waste Manag. 2017, 67, 288–297. [Google Scholar] [CrossRef]
  28. Li, S.Q.; Yao, Q.; Chi, Y.; Yan, J.H.; Cen, K.F. Pilot-Scale Pyrolysis of Scrap Tires in a Continuous Rotary Kiln Reactor. Ind. Eng. Chem. Res. 2004, 43, 5133–5145. [Google Scholar] [CrossRef]
  29. De Marco Rodriguez, I.; Laresgoiti, M.; Cabrero, M.; Torres, A.; Chomón, M.; Caballero, B. Pyrolysis of scrap tyres. Fuel Process. Technol. 2001, 72, 9–22. [Google Scholar] [CrossRef]
  30. Ucar, S.; Karagoz, S.; Ozkan, A.R.; Yanik, J. Evaluation of two different scrap tires as hydrocarbon source by pyrolysis. Fuel 2005, 84, 1884–1892. [Google Scholar] [CrossRef]
  31. Dai, X.; Yin, X.; Wu, C.; Zhang, W.; Chen, Y. Pyrolysis of waste tires in a circulating fluidized-bed reactor. Energy 2001, 26, 385–399. [Google Scholar] [CrossRef]
  32. Barbooti, M.M. Thermogravimetric and pyrolytic investigations on scrap tires. J. Anal. Appl. Pyrolysis 2014, 110, 419–423. [Google Scholar] [CrossRef]
  33. Galvagno, S.; Casu, S.; Casabianca, T.; Calabrese, A.; Cornacchia, G. Pyrolysis process for the treatment of scrap tyres: Preliminary experimental results. Waste Manag. 2002, 22, 917–923. [Google Scholar] [CrossRef]
  34. Laresgoiti, M.; Caballero, B.; de Marco, I.; Torres, A.; Cabrero, M.; Chomón, M. Characterization of the liquid products obtained in tyre pyrolysis. J. Anal. Appl. Pyrolysis 2004, 71, 917–934. [Google Scholar] [CrossRef]
  35. Díez, C.; Sánchez, M.; Haxaire, P.; Martínez, O.; Morán, A. Pyrolysis of tyres: A comparison of the results from a fixed-bed laboratory reactor and a pilot plant (rotatory reactor). J. Anal. Appl. Pyrolysis 2005, 74, 254–258. [Google Scholar] [CrossRef]
  36. Lopez, G.; Olazar, M.; Amutio, M.; Aguado, R.; Bilbao, J. Influence of Tire Formulation on the Products of Continuous Pyrolysis in a Conical Spouted Bed Reactor. Energy Fuels 2009, 23, 5423–5431. [Google Scholar] [CrossRef]
  37. Kyari, M.; Cunliffe, A.; Williams, P.T. Characterization of Oils, Gases, and Char in Relation to the Pyrolysis of Different Brands of Scrap Automotive Tires. Energy Fuels 2005, 19, 1165–1173. [Google Scholar] [CrossRef]
  38. Barbooti, M.M.; Mohamed, T.J.; Hussain, A.A.; Abas, F.O. Optimization of pyrolysis conditions of scrap tires under inert gas atmosphere. J. Anal. Appl. Pyrolysis 2004, 72, 165–170. [Google Scholar] [CrossRef]
  39. Jitkarnka, S.; Chusaksri, B.; Supaphol, P.; Magaraphan, R. Influences of thermal aging on properties and pyrolysis products of tire tread compound. J. Anal. Appl. Pyrolysis 2007, 80, 269–276. [Google Scholar] [CrossRef]
  40. Berrueco, C.; Esperanza, E.; Mastral, F.; Ceamanos, J.; García-Bacaicoa, P. Pyrolysis of waste tyres in an atmospheric static-bed batch reactor: Analysis of the gases obtained. J. Anal. Appl. Pyrolysis 2005, 74, 245–253. [Google Scholar] [CrossRef]
  41. Qu, W.; Zhou, Q.; Wang, Y.Z.; Zhang, J.; Lan, W.W.; Wu, Y.H.; Yang, J.W.; Wang, D.Z. Pyrolysis of waste tire on ZSM-5 zeolite with enhanced catalytic activities. Polym. Degrad. Stab. 2006, 91, 2389–2395. [Google Scholar] [CrossRef]
  42. Choi, G.G.; Jung, S.H.; Oh, S.J.; Kim, J.S. Total utilization of waste tire rubber through pyrolysis to obtain oils and CO2 activation of pyrolysis char. Fuel Process. Technol. 2014, 123, 57–64. [Google Scholar] [CrossRef]
  43. Cunliffe, A.M.; Williams, P.T. Properties of Chars and Activated Carbons Derived from the Pyrolysis of Used Tyres. Environ. Technol. 1998, 19, 1177–1190. [Google Scholar] [CrossRef]
  44. Islam, M.R.; Haniu, H.; Beg, M.R.A. Liquid fuels and chemicals from pyrolysis of motorcycle tire waste: Product yields, compositions and related properties. Fuel 2008, 87, 3112–3122. [Google Scholar] [CrossRef]
  45. Kar, Y. Catalytic pyrolysis of car tire waste using expanded perlite. Waste Manag. 2011, 31, 1772–1782. [Google Scholar] [CrossRef] [PubMed]
  46. Laresgoiti, M.; de Marco, I.; Torres, A.; Caballero, B.; Cabrero, M.A.; Chomón, M. Chromatographic analysis of the gases obtained in tyre pyrolysis. J. Anal. Appl. Pyrolysis 2000, 55, 43–54. [Google Scholar] [CrossRef]
  47. Leung, D.; Yin, X.; Zhao, Z.; Xu, B.; Chen, Y. Pyrolysis of tire powder: Influence of operation variables on the composition and yields of gaseous product. Fuel Process. Technol. 2002, 79, 141–155. [Google Scholar] [CrossRef]
  48. Namchot, W.; Jitkarnka, S. Catalytic pyrolysis of waste tire using HY/MCM-41 core-shell composite. J. Anal. Appl. Pyrolysis 2016, 121, 297–306. [Google Scholar] [CrossRef]
  49. Abnisa, F.; Daud, W.M.A.W. Optimization of fuel recovery through the stepwise co-pyrolysis of palm shell and scrap tire. Energy Convers. Manag. 2015, 99, 334–345. [Google Scholar] [CrossRef]
  50. Sanahuja-Parejo, O.; Veses, A.; Navarro, M.; López, J.; Murillo, R.; Callén, M.; García, T. Catalytic co-pyrolysis of grape seeds and waste tyres for the production of drop-in biofuels. Energy Convers. Manag. 2018, 171, 1202–1212. [Google Scholar] [CrossRef]
  51. Wang, W.C.; Bai, C.J.; Lin, C.T.; Prakash, S. Alternative fuel produced from thermal pyrolysis of waste tires and its use in a DI diesel engine. Appl. Therm. Eng. 2016, 93, 330–338. [Google Scholar] [CrossRef]
  52. Li, W.; Huang, C.; Li, D.; Huo, P.; Wang, M.; Han, L.; Chen, G.; Li, H.; Li, X.; Wang, Y.; et al. Derived oil production by catalytic pyrolysis of scrap tires. Chin. J. Catal. 2016, 37, 526–532. [Google Scholar] [CrossRef]
  53. Aydin, H.; Ilkiliç, C. Optimization of fuel production from waste vehicle tires by pyrolysis and resembling to diesel fuel by various desulfurization methods. Fuel 2012, 102, 605–612. [Google Scholar] [CrossRef]
  54. McBride, B.J.; Zehe, M.J.; Gordon, S. NASA Glenn Coefficients for Calculating Thermodynamic Properties of Individual Species. Available online: https://ntrs.nasa.gov/citations/20020085330 (accessed on 22 October 2023).
  55. Alvarez, J.; Lopez, G.; Amutio, M.; Mkhize, N.; Danon, B.; van der Gryp, P.; Görgens, J.; Bilbao, J.; Olazar, M. Evaluation of the properties of tyre pyrolysis oils obtained in a conical spouted bed reactor. Energy 2017, 128, 463–474. [Google Scholar] [CrossRef]
  56. Ayanoğlu, A.; Yumrutaş, R. Rotary kiln and batch pyrolysis of waste tire to produce gasoline and diesel like fuels. Energy Convers. Manag. 2016, 111, 261–270. [Google Scholar] [CrossRef]
  57. Banar, M.; Akyıldız, V.; Özkan, A.; Çokaygil, Z.; Onay, O. Characterization of pyrolytic oil obtained from pyrolysis of TDF (Tire Derived Fuel). Energy Convers. Manag. 2012, 62, 22–30. [Google Scholar] [CrossRef]
  58. Siva, M.; Onenc, S.; UÇar, S.; Yanik, J. Influence of oily wastes on the pyrolysis of scrap tire. Energy Convers. Manag. 2013, 75, 474–481. [Google Scholar] [CrossRef]
  59. Choi, G.G.; Oh, S.J.; Kim, J.S. Non-catalytic pyrolysis of scrap tires using a newly developed two-stage pyrolyzer for the production of a pyrolysis oil with a low sulfur content. Appl. Energy 2016, 170, 140–147. [Google Scholar] [CrossRef]
  60. Aslan, D.I.; Parthasarathy, P.; Goldfarb, J.L.; Ceylan, S. Pyrolysis reaction models of waste tires: Application of Master-Plots method for energy conversion via devolatilization. Waste Manag. 2017, 68, 405–411. [Google Scholar] [CrossRef] [PubMed]
  61. Luo, S.; Feng, Y. The production of fuel oil and combustible gas by catalytic pyrolysis of waste tire using waste heat of blast-furnace slag. Energy Convers. Manag. 2017, 136, 27–35. [Google Scholar] [CrossRef]
  62. Song, Z.; Liu, L.; Yang, Y.; Sun, J.; Zhao, X.; Wang, W.; Mao, Y.; Yuan, X.; Wang, Q. Characteristics of limonene formation during microwave pyrolysis of scrap tires and quantitative analysis. Energy 2018, 142, 953–961. [Google Scholar] [CrossRef]
  63. Hu, H.; Fang, Y.; Liu, H.; Yu, R.; Luo, G.; Liu, W.; Li, A.; Yao, H. The fate of sulfur during rapid pyrolysis of scrap tires. Chemosphere 2014, 97, 102–107. [Google Scholar] [CrossRef]
  64. Ding, K.; Zhong, Z.; Zhang, B.; Wang, J.; Min, A.; Ruan, R. Catalytic pyrolysis of waste tire to produce valuable aromatic hydrocarbons: An analytical Py-GC/MS study. J. Anal. Appl. Pyrolysis 2016, 122, 55–63. [Google Scholar] [CrossRef]
  65. Uçar, S.; Karagöz, S. Co-pyrolysis of pine nut shells with scrap tires. Fuel 2014, 137, 85–93. [Google Scholar] [CrossRef]
  66. Undri, A.; Rosi, L.; Frediani, M.; Frediani, P. Upgraded fuel from microwave assisted pyrolysis of waste tire. Fuel 2014, 115, 600–608. [Google Scholar] [CrossRef]
  67. Kim, S.; Park, J.K.; Chun, H.D. Pyrolysis Kinetics of Scrap Tire Rubbers. I: Using DTG and TGA. J. Environ. Eng. 1995, 121, 507–514. [Google Scholar] [CrossRef]
  68. Helleur, R.; Popovic, N.; Ikura, M.; Stanciulescu, M.; Liu, D. Characterization and potential applications of pyrolytic char from ablative pyrolysis of used tires. J. Anal. Appl. Pyrolysis 2001, 58-59, 813–824. [Google Scholar] [CrossRef]
  69. Olazar, M.; Aguado, R.; Arabiourrutia, M.; Lopez, G.; Barona, A.; Bilbao, J. Catalyst Effect on the Composition of Tire Pyrolysis Products. Energy Fuels 2008, 22, 2909–2916. [Google Scholar] [CrossRef]
  70. Kordoghli, S.; Paraschiv, M.; Kuncser, R.; Tazerout, M.; Zagrouba, F. Catalysts’ influence on thermochemical decomposition of waste tires. Environ. Prog. Sustain. Energy 2017, 36, 1560–1567. [Google Scholar] [CrossRef]
  71. Haseli, Y.; van Oijen, J.; de Goey, L. Modeling biomass particle pyrolysis with temperature-dependent heat of reactions. J. Anal. Appl. Pyrolysis 2011, 90, 140–154. [Google Scholar] [CrossRef]
  72. Joback, K.; Reid, R. Estimation of pure-component properties from group-contributions. Chem. Eng. Commun. 1987, 57, 233–243. [Google Scholar] [CrossRef]
  73. Kaminsky, W.; Mennerich, C.; Zhang, Z. Feedstock recycling of synthetic and natural rubber by pyrolysis in a fluidized bed. J. Anal. Appl. Pyrolysis 2009, 85, 334–337. [Google Scholar] [CrossRef]
  74. Ayanoǧlu, A.; Yumrutaş, R. Production of gasoline and diesel like fuels from waste tire oil by using catalytic pyrolysis. Energy 2016, 103, 456–468. [Google Scholar] [CrossRef]
  75. Jarungthammachote, S.; Dutta, A. Thermodynamic equilibrium model and second law analysis of a downdraft waste gasifier. Energy 2007, 32, 1660–1669. [Google Scholar] [CrossRef]
  76. Vaezi, M.; Passandideh-Fard, M.; Moghiman, M.; Charmchi, M. Gasification of heavy fuel oils: A thermochemical equilibrium approach. Fuel 2011, 90, 878–885. [Google Scholar] [CrossRef]
  77. Barman, N.S.; Ghosh, S.; De, S. Gasification of biomass in a fixed bed downdraft gasifier—A realistic model including tar. Bioresour. Technol. 2012, 107, 505–511. [Google Scholar] [CrossRef] [PubMed]
  78. Mendiburu, A.Z.; Carvalho, J.A.; Coronado, C.J. Thermochemical equilibrium modeling of biomass downdraft gasifier: Stoichiometric models. Energy 2014, 66, 189–201. [Google Scholar] [CrossRef]
  79. Linstrom, P.J.; Mallard, W.G. NIST Chemistry Webbook, NIST Standard Reference Database Number 69; National Institute of Standards and Technology: Gaithersburg, MD, USA, 2019. [Google Scholar] [CrossRef]
  80. Aylón, E.; Fernández-Colino, A.; Murillo, R.; Navarro, M.; García, T.; Mastral, A. Valorisation of waste tyre by pyrolysis in a moving bed reactor. Waste Manag. 2010, 30, 1220–1224. [Google Scholar] [CrossRef]
  81. Aylón, E.; Fernández-Colino, A.; Navarro, M.V.; Murillo, R.; García, T.; Mastral, A.M. Waste Tire Pyrolysis: Comparison between Fixed Bed Reactor and Moving Bed Reactor. Ind. Eng. Chem. Res. 2008, 47, 4029–4033. [Google Scholar] [CrossRef]
  82. POLIMIX. POLIMIX Ambiental. 2019. Available online: http://www.polimixambiental.com.br (accessed on 22 October 2023).
Figure 1. Tyre pyrolysis system.
Energies 16 07932 g001
Figure 2. Control volume used to calculate the heat required by the tyre pyrolysis reaction.
Energies 16 07932 g002
Figure 3. Control volume used to evaluate the energy self-suficiency of the tyre pyrolysis process.
Energies 16 07932 g003
Figure 4. Experimental data collected for a pyrolysis temperature range between 698 to 848 K: (a) type of reactor, (b) char yield, (c) TPO yield, and (d) pyrolysis gas yield.
Energies 16 07932 g004
Figure 5. Sensible enthalpy of the char biomass and graphite.
Energies 16 07932 g005
Figure 6. Heat losses in a noninsulated pyrolysis reactor.
Energies 16 07932 g006
Figure 7. (a,b) compositions; (c) molar masses and calorific values of the pyrolysis gas for a pyrolysis temperature range from 698 to 848 K.
Energies 16 07932 g007
Figure 8. Heat required by the tyre pyrolysis reaction, as well as enthalpy of the tyre and its pyrolysis products for a pyrolysis temperature range from 698 to 848 K.
Energies 16 07932 g008
Figure 9. Mass percentage of pyrolysis gas required to meet the energy demand of a tyre pyrolysis process operating between 698 and 848 K with a nitrogen-to-tyre mass ratio from 0 to 0.5: (a) λ = 1.0 and Z = 10 %; (b) λ = 1.5 and Z = 10 %; (c) λ = 1.0 and Z = 30 %; (d) λ = 1.5 and Z = 30 %; (e) λ = 1.0 and Z = 50 %; and (f) λ = 1.5 and Z = 50 %.
Energies 16 07932 g009
Figure 10. Mass percentages of pyrolysis gas required to meet the energy demand of the tyre pyrolysis process operating between 698 and 848 K with a nitrogen-to-tyre mass ratio of 0.4: (a) λ = 1.0 and T a i r = 298 K; (b) λ = 1.0 and T a i r = 573 K; (c) λ = 1.5 and T a i r = 298 K; (d) λ = 1.5 and T a i r = 573 K; (e) λ = 2.0 and T a i r = 298 K; and (f) λ = 2.0 and T a i r = 573 K.
Energies 16 07932 g010
Table 1. Mass yields and elemental compositions of the tyre material and its pyrolysis products for a pyrolysis temperature range between 698 and 848 K.
CompositionTyreCharTPOGas a
C [wt.%]85.9194.7885.2368.21
H [wt.%]7.381.1010.3613.96
O b [wt.%]4.23<1.002.7116.28
N [wt.%]0.55<1.000.550.00
S [wt.%]1.933.051.151.52
Yield [wt.%]100.0038.0245.7816.20
a Calculated by Equation (16). b Calculated by difference.
Disclaimer/Publisher’s Note: The statements, opinions and data contained in all publications are solely those of the individual author(s) and contributor(s) and not of MDPI and/or the editor(s). MDPI and/or the editor(s) disclaim responsibility for any injury to people or property resulting from any ideas, methods, instructions or products referred to in the content.

