Article

Experimental and Numerical Investigations into the Effects of Rim Seal Structure on Endwall Film Cooling and Flow Field Characteristics

Shaanxi Engineering Laboratory of Turbomachinery and Power Equipment, Institute of Turbomachinery, School of Energy & Power Engineering, Xi’an Jiaotong University, Xi’an 710049, China
*
Author to whom correspondence should be addressed.
Energies 2023, 16(24), 7976; https://doi.org/10.3390/en16247976
Submission received: 7 November 2023 / Revised: 1 December 2023 / Accepted: 7 December 2023 / Published: 8 December 2023

Abstract

:
During the practical operation of gas turbines, relatively cooled air from the compressor and the rim seal is applied in order to prevent mainstream ingestion into the space between the rotor and stator disc cavities, which can prolong the service life of hot components. On the one hand, the purge flow from the rim seal will inevitably interact with the mainstream and result in secondary flow on the endwall. On the other hand, it can also provide an additional cooling effect. In this paper, four rim seal structures, including an original single-tooth seal (ORI), a double-tooth seal (DS), a single-tooth seal with an adverse direction of the coolant purge flow and mainstream (AS) and a double-tooth seal with an adverse direction of the coolant purge flow and mainstream (ASDS), are experimentally and numerically investigated with mass flow ratios of 0.5%, 1.0% and 1.5%. The flow orientation of the coolant from the rim seal is considered as one of the main factors. The pressure-sensitive paint technique is used to experimentally measure the film cooling effectiveness on the endwall, and flow field analysis is conducted via numerical simulations. The results show that the cooling effect decreases in the cases of DS and ASDS. AS and ASDS can achieve a better film cooling performance, especially under a higher mass flow ratio. Furthermore, the structural changes in the rim seal have little impact on the aerodynamic performance. AS and ASDS can both achieve a better aerodynamic and film cooling performance.

1. Introduction

The spacing between rotor and stator discs forms an unavoidable cavity in the gas path of a gas turbine, which causes mainstream ingestion into the rotor–stator disc cavity and makes it become overheated. In order to prevent mainstream ingestion and prolong service life, a small amount of relatively cooled air is introduced from the compressor and passed through the rim seal. This part of the coolant injection from the rim seal is normally called the purge flow (PF). Because of the interaction with the mainstream, the PF from the rim seal has a notable impact on the flow and cooling characteristics of the endwall. It was reported that large-scale low-frequency vortices emerged on the interface between the rim seal entrance and the endwall surface and strongly affected the flow boundary layer. This phenomenon was experimentally supported in studies by Beard et al. [1] and Schadler et al. [2]. Also, De la Rosa Blanco et al. [3] adopted a numerical method to study PF from rim seals and observed a series of vortices through the blade passage. So, studies on the effect of PF from rim seals has become a research hot spot.
Mclean et al. [4,5] and Kost et al. [6] conducted early studies on the influence of wheel space coolant injection in turbines, especially on the endwall region. They pointed out that due to the interaction of cooled air and the mainstream, this leakage flow intensifies the intricacy of the three-dimensional flow characteristics on the endwall surface, and even a small amount of coolant injection (1%) has a significant impact on the aerodynamic and flow field structures of the stage. In order to decrease the turbulence level, the injection slot should be set away from the leading edge. Reid et al. [7] quantified the influence of this interaction between the PF and mainstream with steady and unsteady calculation methods; both these methods could generally achieve the right prediction. It was concluded that the PF mostly affected the tangential component of the mainstream velocity, so regulating its influence on the tangential component was verified to be effective in decreasing flow loss. Gao et al. [8] performed experiments and numerical simulations to research the effect of the exit inclination angle on the interaction of the PF and mainstream. It was concluded that the interaction of the PF and mainstream becomes more intense as the inclination angle is increased. These studies have proven the impact of PF on flow characteristics.
Apart from the interaction with the mainstream and unavoidable flow loss, PF from rim seals was also found to have a positive effect on the cooling effect of the endwall. A study by Lynch and Thole [9] illustrated that PF can provide an additional film cooling effect on the endwall, which was regarded as secondary cooling. A similar conclusion was drawn by Song et al. [10] and Cong et al. [11], who also confirmed this film cooling effect on the endwall and found that the cooling performance is enhanced with a higher PF mass flow ratio (MFR). But they also noted that aerodynamic loss cannot be neglected, especially when the MFR is gradually increased. With regard to aerodynamic loss, Barigozzi et al. [12] investigated the effect of coolant leakage flow from different widths of the slot entrance on the film cooling effectiveness and found that the film cooling performance was improved as the PF rate was increased. Moreover, the slot width only had a little impact on the cooling and aerodynamic performance. Mansouri et al. [13] investigated a generic rim seal and indicated the significance of selecting the optimal PF rate, which can provide a better film cooling performance and relatively less aerodynamic loss.
The above-mentioned studies summarized the influence of PF on the aerodynamic and cooling characteristics. Additionally, a variety of studies have focused on the geometric structure of the rim seal, which impacts the out-flowing of the PF, thus affecting the flow and film cooling performance as well. Zhang et al. [14] and Fiore et al. [15] confirmed this conclusion by investigating different seal geometry structures on the loss generation, which indicated that the structural change in the rim seals should be taken into account in the flow structure analysis of the endwall. Wang et al. [16] investigated the sealing efficiency of a basic axial and radial seal structure and drew a preliminary conclusion that the radial seal structure had a better sealing efficiency than the axial structure. Further studies conducted by Schuler et al. [17] and Jia et al. [18] proposed that a radial–axial rim seal was superior to a single radial or axial rim seal. Schular et al. indicated that the total pressure loss of the compound seal was lower at the same sealing flow mass flow because of the favorable diversion of this structure. The findings by Jia et al. demonstrated that the cooling and aerodynamic efficiency were 23.71% and 12.79% higher than the axial and radial structure, respectively. Jia et al. [19] investigated the impacts of different axial and radial rim seals on the endwall aerodynamic performance in a low-aspect-ratio turbine. The results indicated that the capability of axial rim seal was better in the same PF conditions. Zhang et al. [20] investigated the aerodynamics performance of three rim seal structures in different PF ratios. The results demonstrated that the upper structure of the seal was the dominant characteristic of the secondary flow caused by coolant leakage flow, and the complicated lower structure of the seal can improve the sealing efficiency while leading to a more complex vortex. Several other complicated rim seal geometries have been researched by Wang et al. [21], Zhao et al. [22], Zhang et al. [23] and other scholars; they found that the practical flow and cooling performance of different seal geometries were related to the PF ratio.
Previous studies have mainly focused on the impact of the rim seal geometry and the coolant PF on the flow and aerodynamic characteristics of the endwall; some focused on its film cooling effect on the endwall surface. But considering the increasingly high turbine inlet temperature (TIT) in the design of modern gas turbines, the additional cooling effect provided by the PF is still a valuable research point. So, in this paper, four rim seal geometry structures, including an original single-tooth seal (ORI), a double-tooth seal (DS), a single-tooth seal with an adverse direction of the coolant PF and mainstream (AS) and a double-tooth seal with an adverse direction of the coolant PF and mainstream (ASDS), were experimentally and numerically investigated with an MFR of 0.5%, 1.0% and 1.5%. The pressure-sensitive paint (PSP) method was applied to measure the film cooling effectiveness on the endwall, and numerical simulations were performed to analyze the flow structures and the aerodynamic loss of the seal and the endwall. The first part of this paper introduced the research background and summarized the previous literature. The second part presents the experimental system and test section, and the measurement principle is also detailed and introduced. The third part shows the numerical setups and the necessary validation segments before the numerical calculation, including verification of the turbulence model and validation of the grid independence. The fourth part illustrates and analyzes the film cooling effectiveness results obtained by the experiments and the flow and aerodynamic loss results performed by the numerical simulations. The last part summarizes the main conclusions achieved in this paper. The results achieved in this paper can provide useful guidance to the design of the rim seal in modern gas turbines.

2. Experimental Method

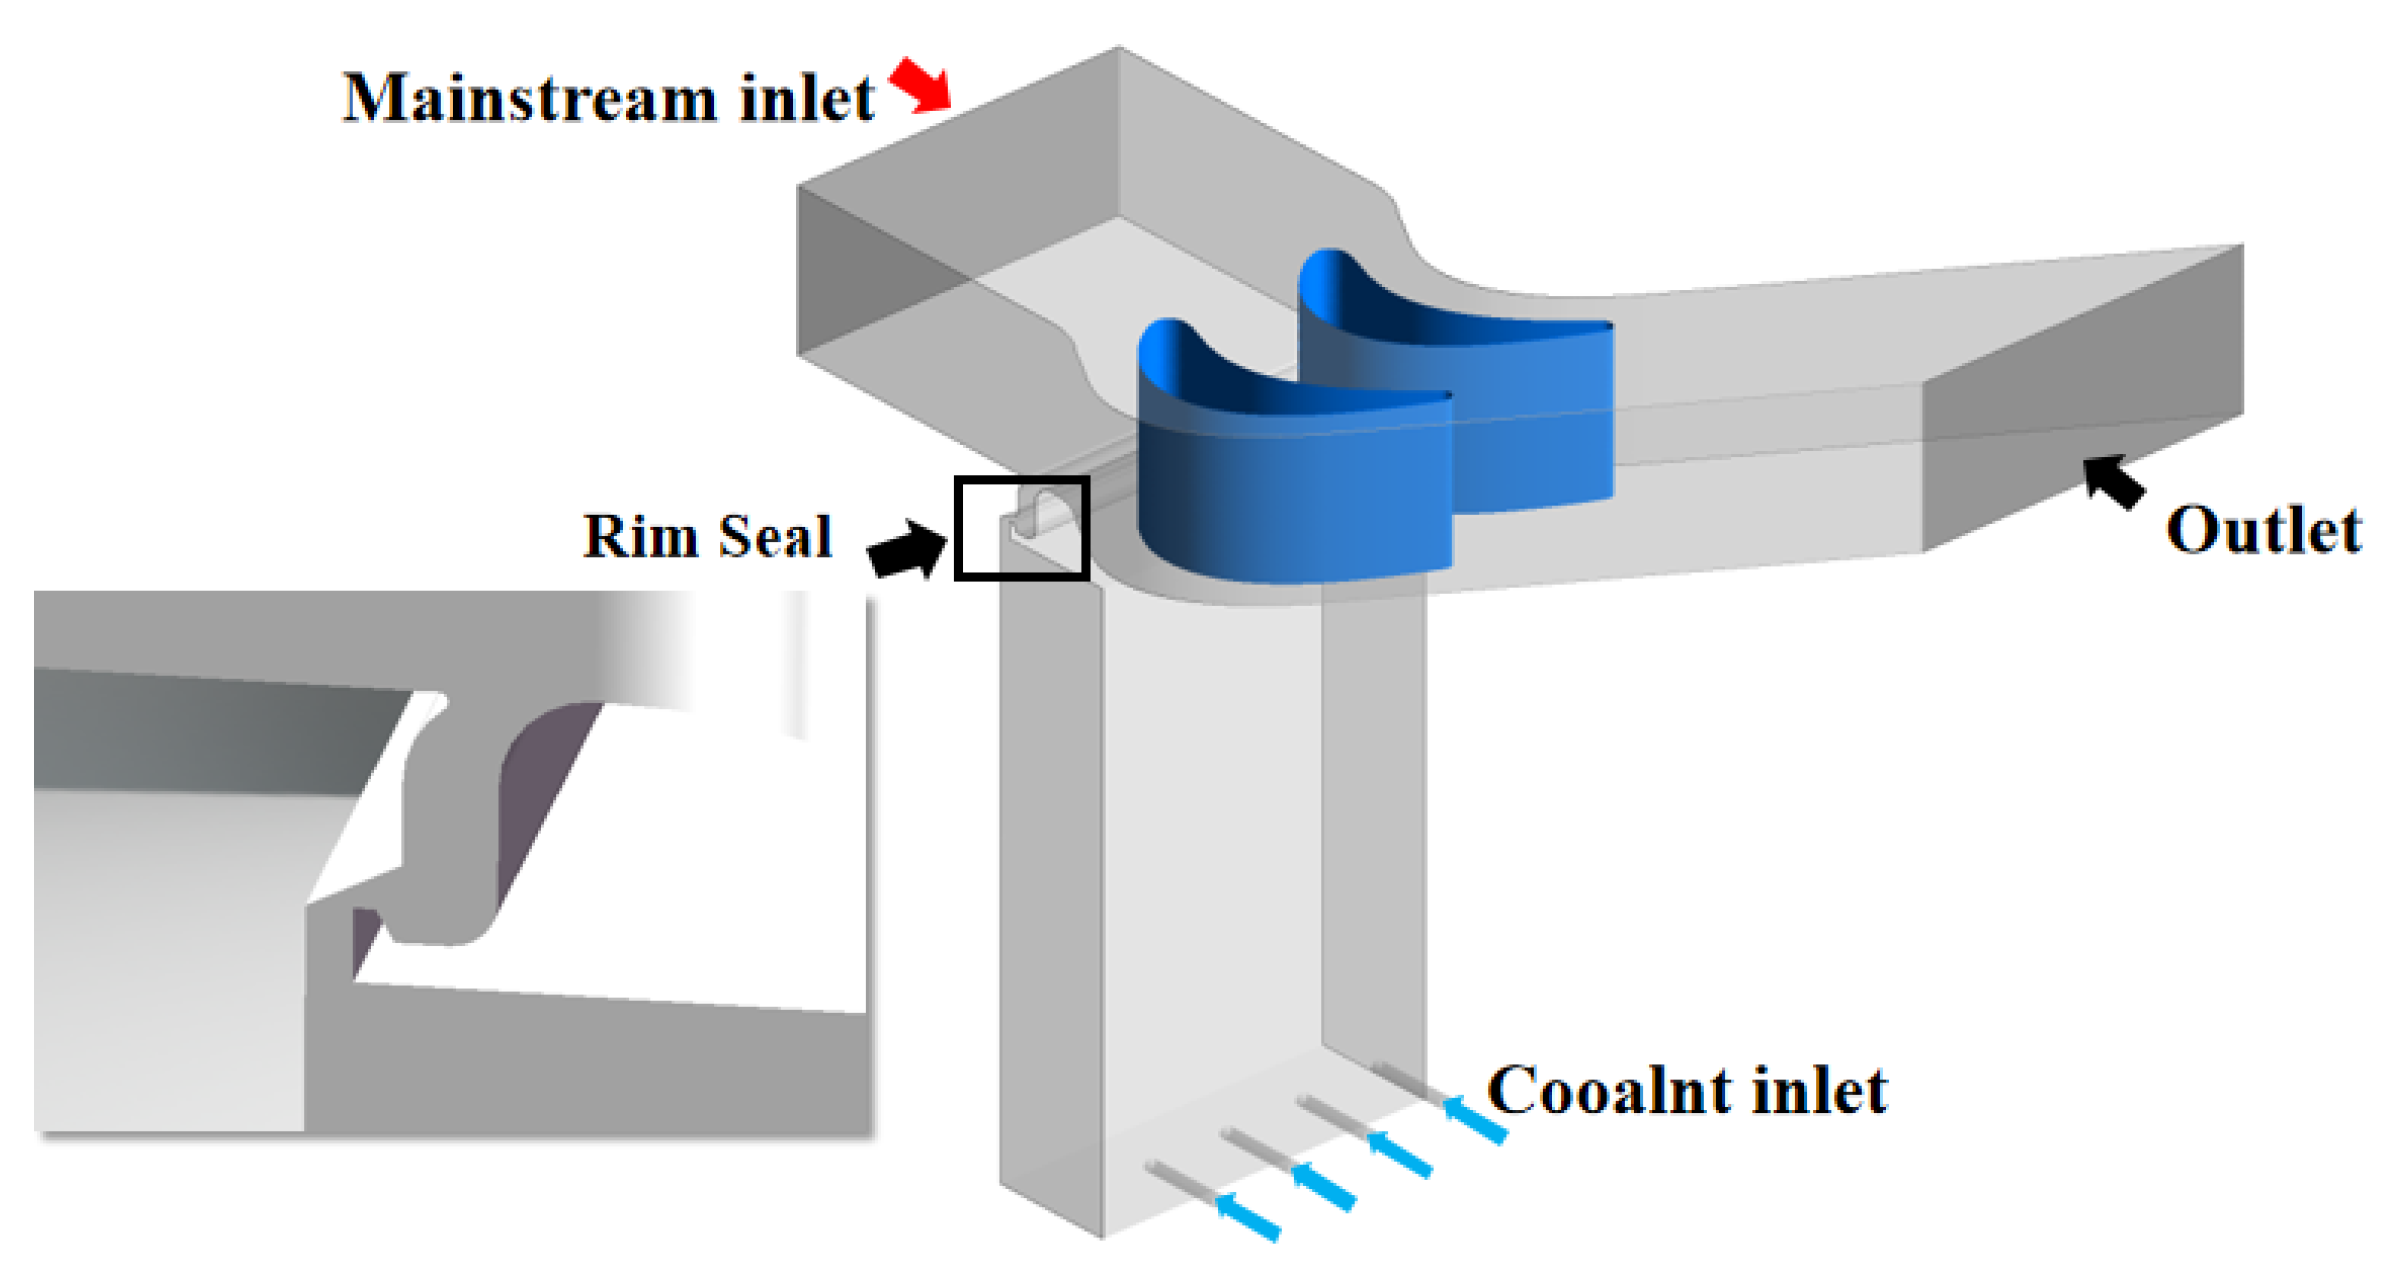
2.1. Experimental System and Test Section

Figure 1 illustrates the schematic of the experimental test system, which involves the mainstream, coolant system, measurement equipment and the test linear cascade. The mainstream air was provided by four screw compressors. The air from the compressors firstly passed through the dryer and filter and then passed through the bypass valve to achieve the experimentally required velocity. After that, it then flowed through expansion section, steady flow section, contraction section and finally entered the test section. The mainstream grid was used to maintain the flow uniformity of the mainstream, and the turbulence grid was used to make the mainstream turbulence intensity fulfill the experimental requirements. The coolant system was equivalent to the secondary flow system in an actual gas turbine, where carbon dioxide (CO2) was taken as the coolant. The mass flow rate of the coolant was altered by a mass flow controller, which ensured that the MFR of the coolant and mainstream could meet the requirements of each working condition. The temperature, pressure and velocity were measured by a thermocouple, pressure probe and hot wire, respectively. The experimentally required velocity was 30 m/sm and mainstream turbulence intensity was 10%.
A photo of the test section is illustrated in Figure 2. The replaceable endwall was well installed in the vacant part of the cascade. The blade studied in this experiment was adapted from the rotor blade of a real gas turbine, and the main blade parameters are presented in Table 1.
The experimental cascade contained six blades and five passages in all. Due to the existence of the passage side wall, which affected the flow field, the mass flow of the mainstream entering each passage was generally not evenly distributed. To match the practical operation of the gas turbine and the numerical boundary conditions, a trailing board was arranged on one side of the outlet of the cascade to adjust the mass flow through the five passages and ensure equality. According to Bernoulli’s principle, the periodicity of the cascade can be considered to meet the requirements when the distribution of the static pressure ( P s ) on the pressure side and the suction side of the blades are keep constant. Figure 3 shows the experimental results of the periodicity measurement in a 50% span of the cascade. The abscissa and ordinate represent the position of the pressure test point and the pressure coefficient, respectively. The equation of the pressure coefficient ( C p ) is defined as follows:
C p = P s ,   l o c P t ,   i n
where P s ,   l o c represents the local static pressure and P t ,   i n represents the total pressure of the mainstream inlet. It can be observed from the experimental results that the static pressure distribution of the two adjacent blades stayed very close, so the mass flow entering through each passage was almost the same, which means that the periodicity of the cascade met the experimental requirements.
Figure 4 and Figure 5 demonstrate a whole graphic model and a detailed partial diagram of the four seal geometries investigated in this paper, respectively. The coolant entered the cavity and then passed through the rim seal chamber. As shown in the figures, the blue and red arrows represent the flow direction of coolant and mainstream, respectively, which was the same in the structure of ORI and DS and adverse in the case of AS and ASDS. Meanwhile, the structures of ORI and AS were only designed with a single tooth, while those of DS and ASDS were designed with two teeth, which were the main differences in the four seal geometry structures.

2.2. Measurement Method of Film Cooling Effectiveness

The PSP method was employed in this study to experimentally measure the film cooling effectiveness (η) on the endwall, which could allow for a visualization of the pressure on the test surface. The measurement principle of PSP is called oxygen-quenched photoluminescence. From a micro-molecule aspect, when fluorescent molecules with an appropriate energy level are irradiated by a light source with a specific wavelength, the fluorescent molecules will obtain energy and transfer to an excited state. Excited-state molecules are relatively unstable and will emit light quantum to the environment after a transient moment. At the same time, the excited-state molecules will fall back to the ground state and release the energy. This means when the oxygen molecules in the environment are in the ground state, they will capture this part of energy and change to an excited state, and this part of the fluorescent molecules will not emit light. The PSP method is a non-contact measurement method, which applies the comparable law of heat–mass transfer to calculate the local η, and the η can be expressed as follows:
η = C m a i n C m i x C m a i n C C O 2 η = T ,   i n T a w T ,   i n T C O 2
where C m a i n and C m i x is the concentration of oxygen in the mainstream and in the mixture of the mainstream and coolant, respectively. In order to obtain more accurate experimental data, the PSP should be calibrated before the measurement and the uncertainty analysis should be performed. For a detailed formula derivation, the PSP calibration curve and the uncertainty results achieved, please refer to the study from Zhang et al. [24].
Figure 6 shows a photograph of the PSP measurement process from different views. During the experimental process, LED blue light with a 400 nm wavelength was employed as the optical stimulation source. When blue light was illuminated on the test endwall surface covered with PSP, the endwall emitted red light at a wavelength of between 620 nm and 750 nm. According to the detailed principle introduced above, when the oxygen concentration of environment was low, more PSP molecules could release red photons and fall back to the ground state, and when the oxygen concentration was relatively high, this part of the PSP molecules did not release red photons, so the endwall surface was a weakened red color. The experimental data were collected by a charge-coupled device (CCD) high-speed camera, where four points of images were shot for each working condition, and the detailed requirements of each point are as shown in Table 2. In particular, point 3 with the mainstream off was taken as a reference to point 2, and point 4 with the LED blue light off was taken as the background image. The PSP measurement data were subsequently treated by a certain Python program and converted to corresponding contours and curves.

3. Numerical Simulation Method

3.1. Numerical Settings

For part of the numerical simulations, ANSYS CFX was used to solve the Reynolds-averaged Navier–Stokes (RANS) equations. The corresponding continuity equation, momentum equation and energy equation are expressed in Equations (3)–(5), respectively.
ρ t + · ρ U = 0
where ρ is the fluid density and U is the velocity vector of the fluid.
ρ u t + ρ u · u = ρ f + ·
where f and represent the mass force and surface force acting on the surface of the fluid, respectively.
ρ h * t ρ t + ρ U h * = λ T + U τ + U S M + S E
where h * is the total specific enthalpy,  U τ is the work of viscous force, U S M is the work of external force and S E represents the source term of the energy.
The computational domain was the same as the experimental model which is shown in Figure 4 and the left and right interface were both set as the translational periodic interface. The mainstream (air at 25 °C) entered through the inlet, and the equivalent amount of coolant (CO2 at standard temperature and pressure) entered through the four coolant channels. Then, the coolant passed through and flowed out from the rim seal chamber, interacting with the mainstream. Figure 7 shows the velocity distribution of the mainstream inlet. Table 3 lists the main boundary conditions in the calculations. As for the solver control, a high resolution was selected as the advection scheme, and a time scale factor of 1.0 was set as the convergence control. The targeted convergence precision was set at 10−6 to ensure the rationality and accuracy of the whole calculation.

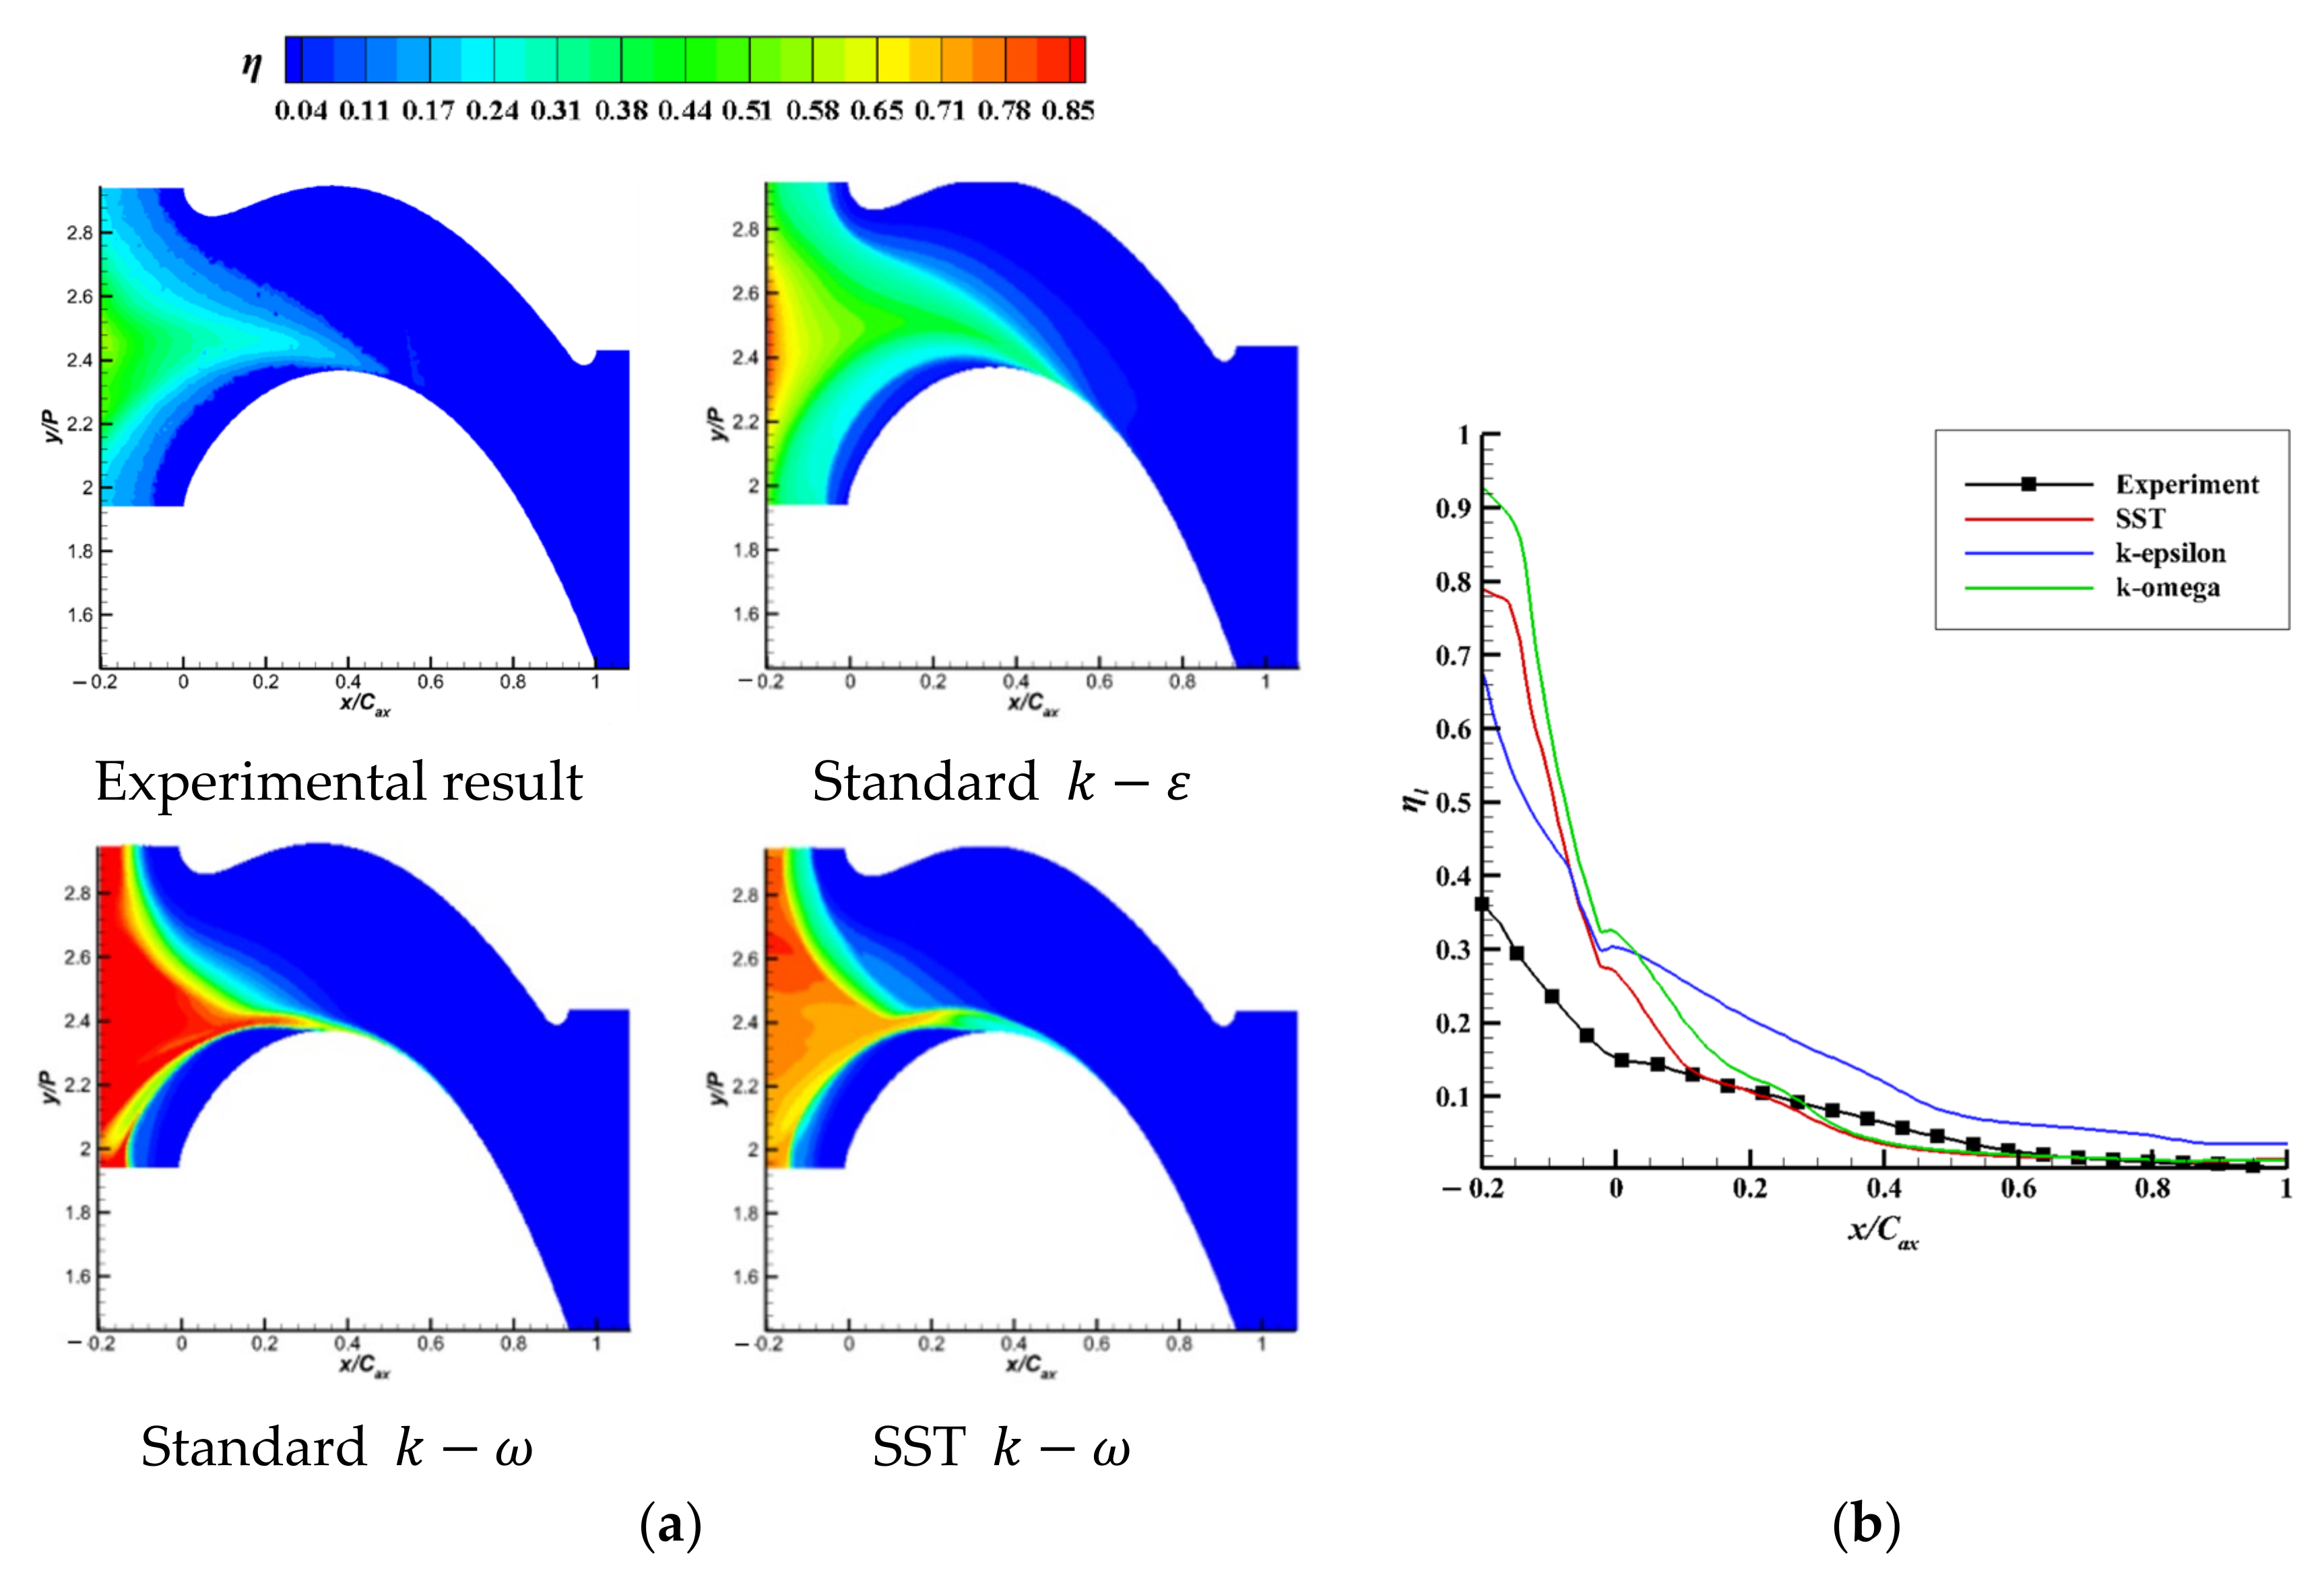
3.2. Turbulence Model Validation

The selection of the turbulence model will impact the numerical calculation, so three turbulence models, including the standard k ε , the standard k ω and the SST k ω , were chosen to validate the precision of the numerical results, as shown in Figure 8. From the contours, the distribution of the coolant PF will aggregate on the outlet of the seal chamber and flow to the suction side of the blade. The standard k ε model had an obvious cooling effect extension on the passage downstream. Although the standard k ω and SST k ω both had a relatively higher prediction at the outlet of the seal chamber, both of their predictions at the endwall passage were closer to the experimental results. According to the laterally averaged η, it was further confirmed that the standard k ε model badly predicted the trend of the cooling effect at the endwall passage. As for the other two turbulence models, the standard k ω model had a significant over-prediction at the outlet of the seal chamber, and the prediction of the cooling effect at the passage downstream was the same. So, comprehensively, the SST k ω model was best matched to the experimental results and was finally selected in the numerical calculations.

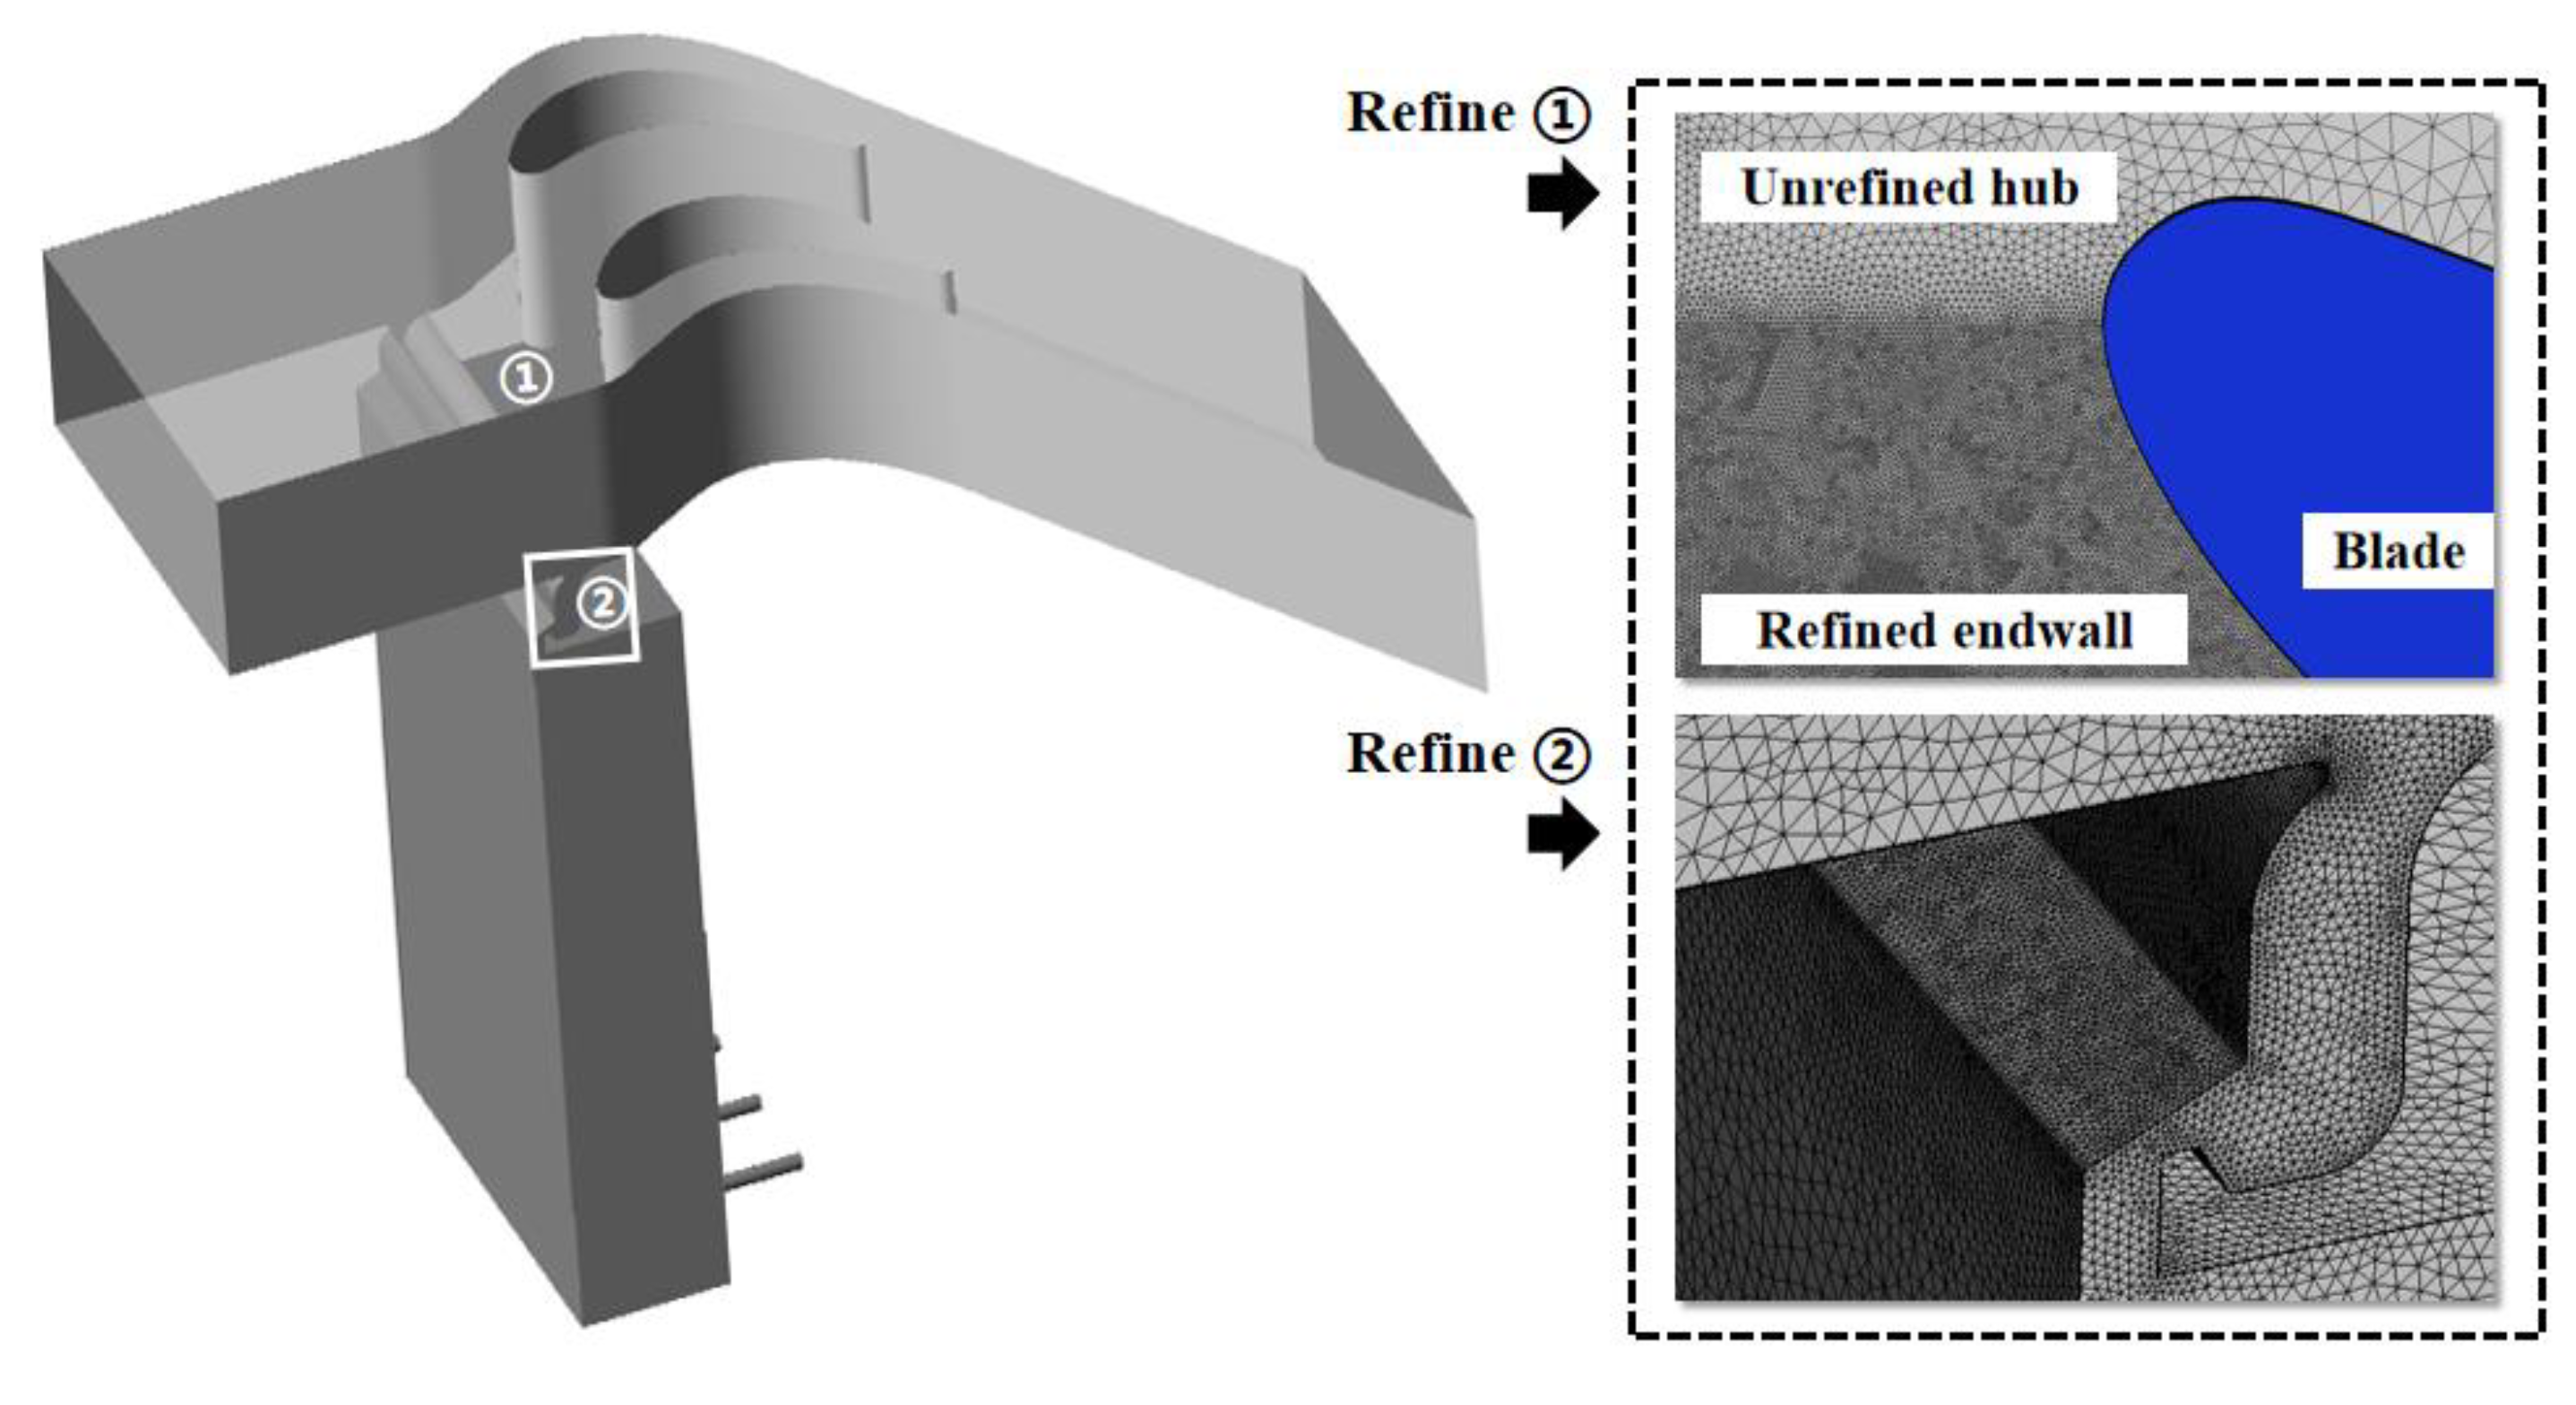
3.3. Grid Independence Verification

ICEM CFD was employed to generate the unstructured grid of the computational model. In order to achieve accurate simulation results, the thickness of the first layer of grid was set as 0.001 mm, and twenty-five layers with a growth rate of 1.1 were set in total for the boundary layer. To meet the requirements of turbulence model, the maximum y+ was 0.5767 and the averaged y+ was 0.1309, which was suitable for SST k ω . Meanwhile, the local regions of the endwall and seal were both refined, as shown in Figure 9.
The number of grid elements is very important in the numerical simulation, because an over-dense grid will not only require a high-performance computer CPU but also occupy so much of the computational resources in the subsequent calculations. But when the number of grid elements is too small, the numerical results will be affected, so a grid independence verification should be performed. Figure 10 demonstrates the grid information and the globally averaged η, which were used to analyze the grid independence. It was found that when the number of grid elements >32 million, the globally averaged η almost stayed the same. Therefore, the finally calculated grid was set as 32 million, and the other cases in this paper were all based on these grid settings.

4. Results and Discussion

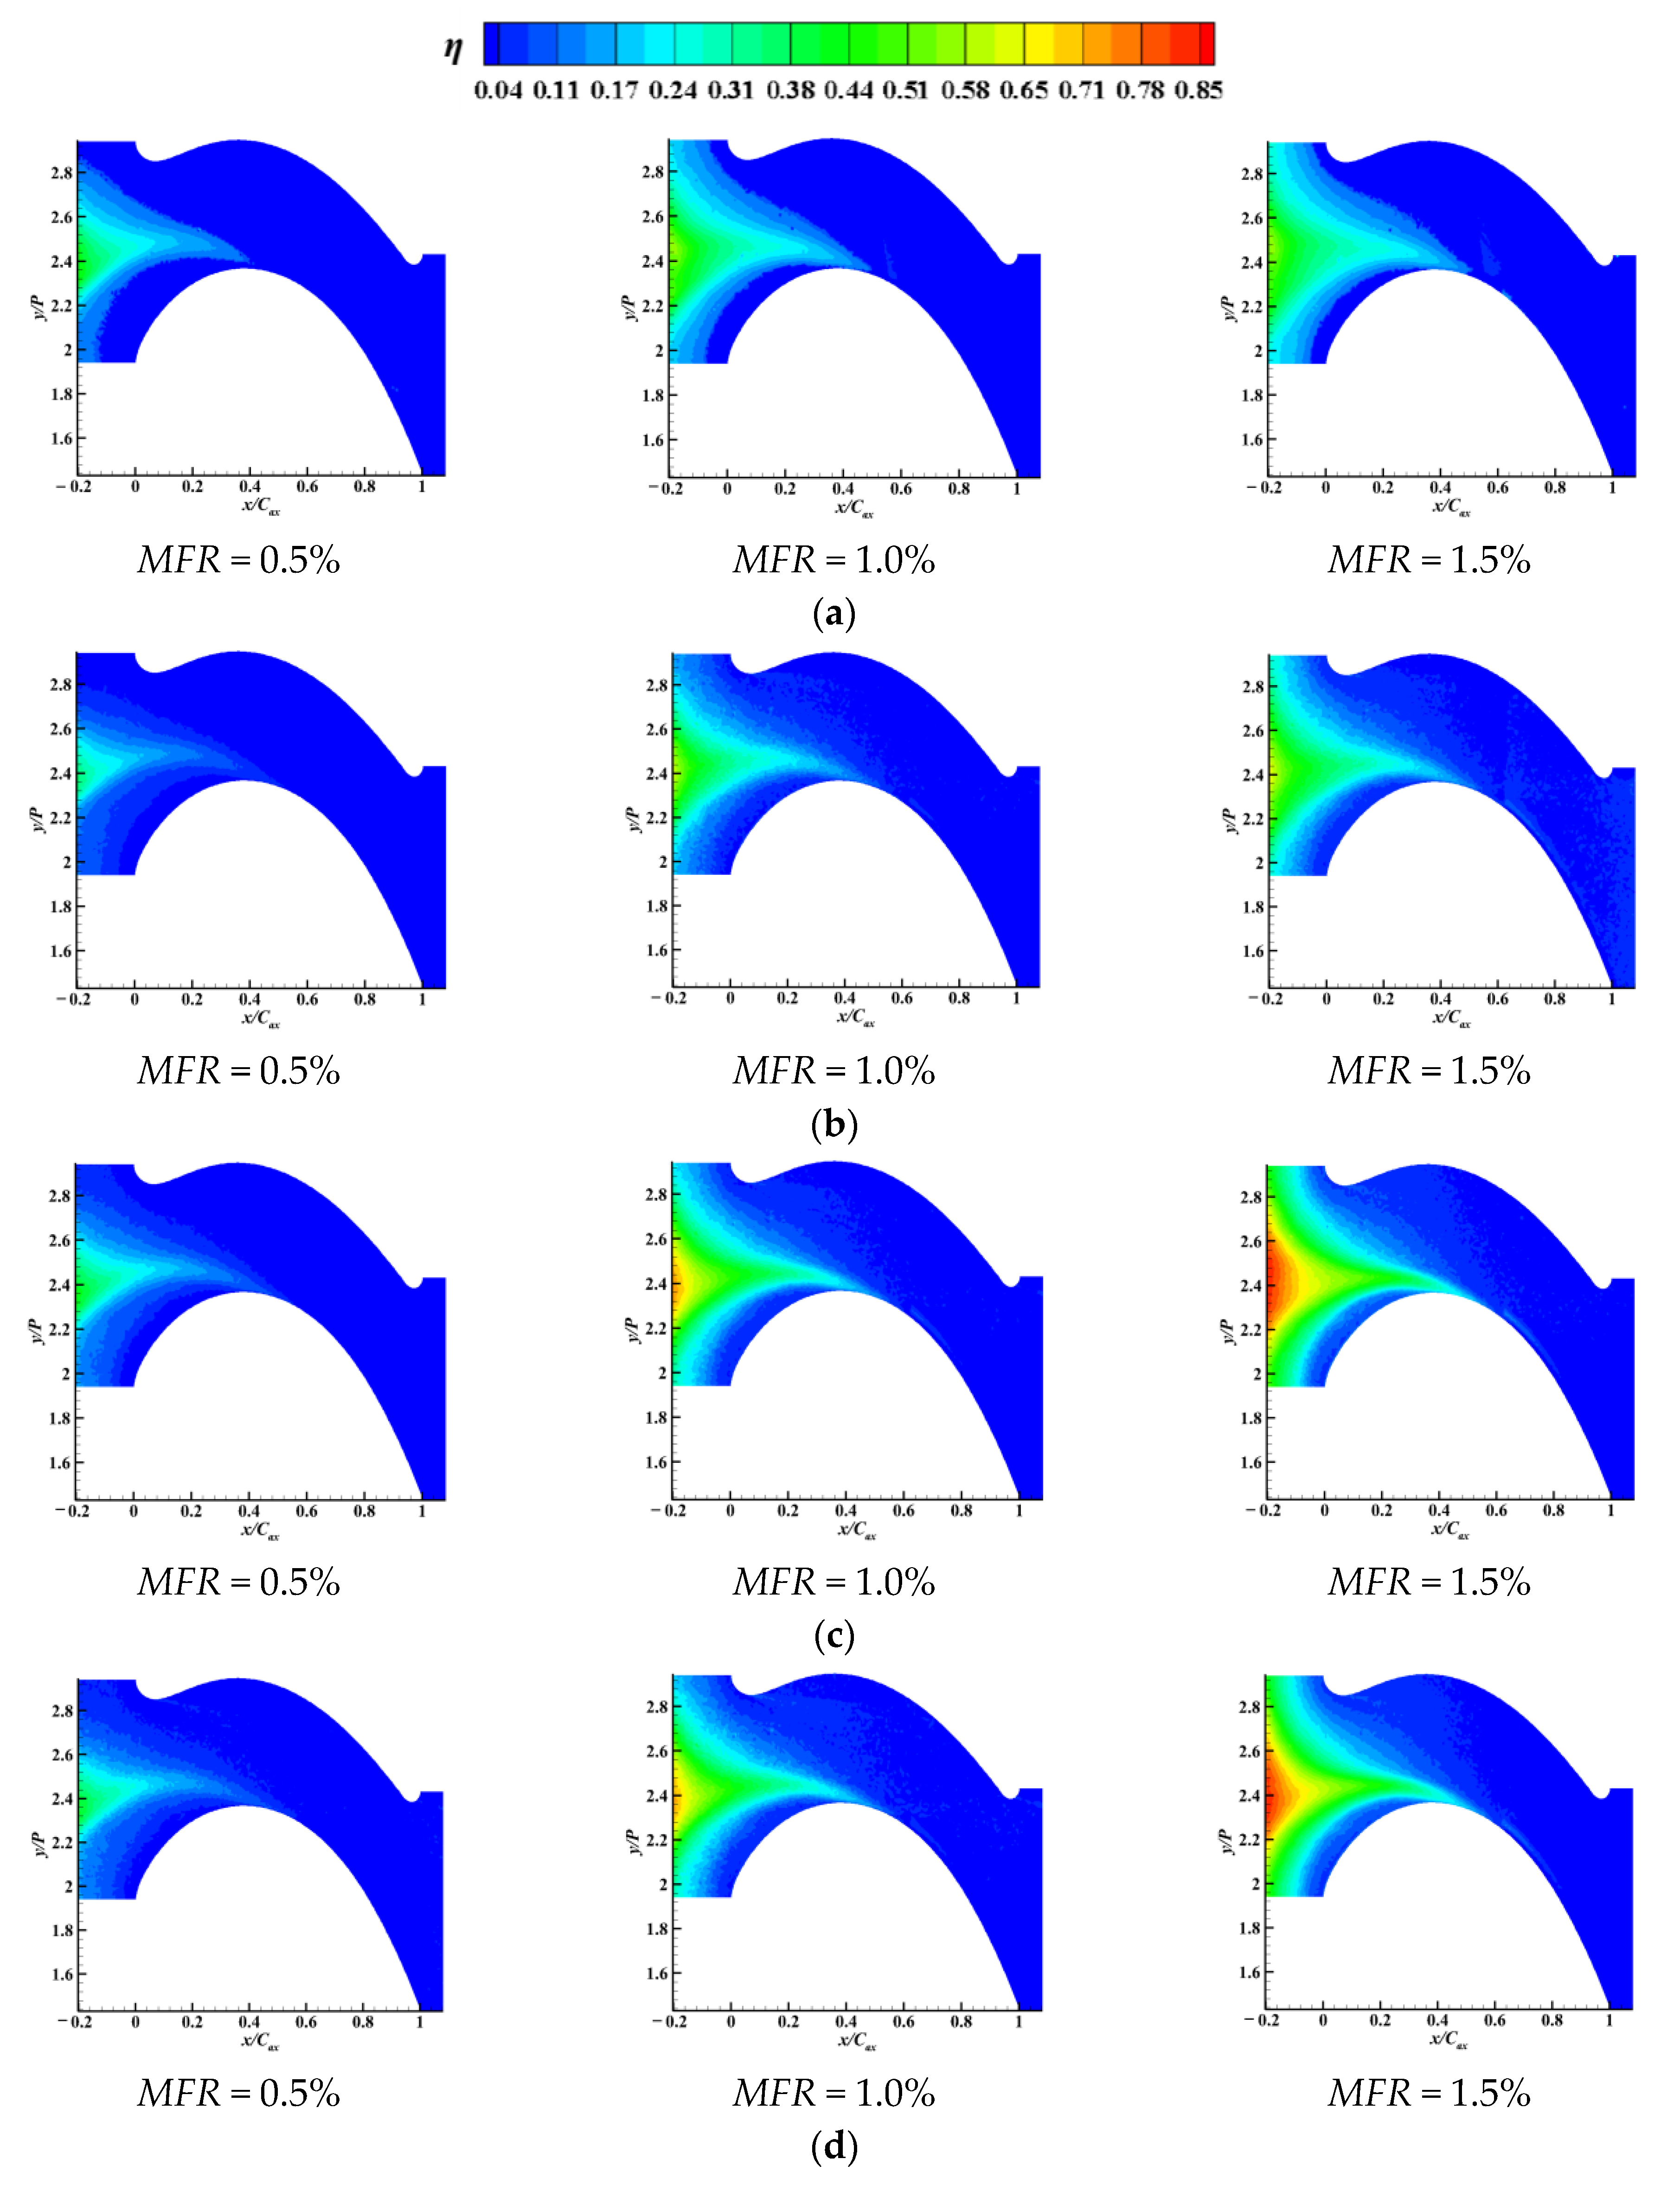
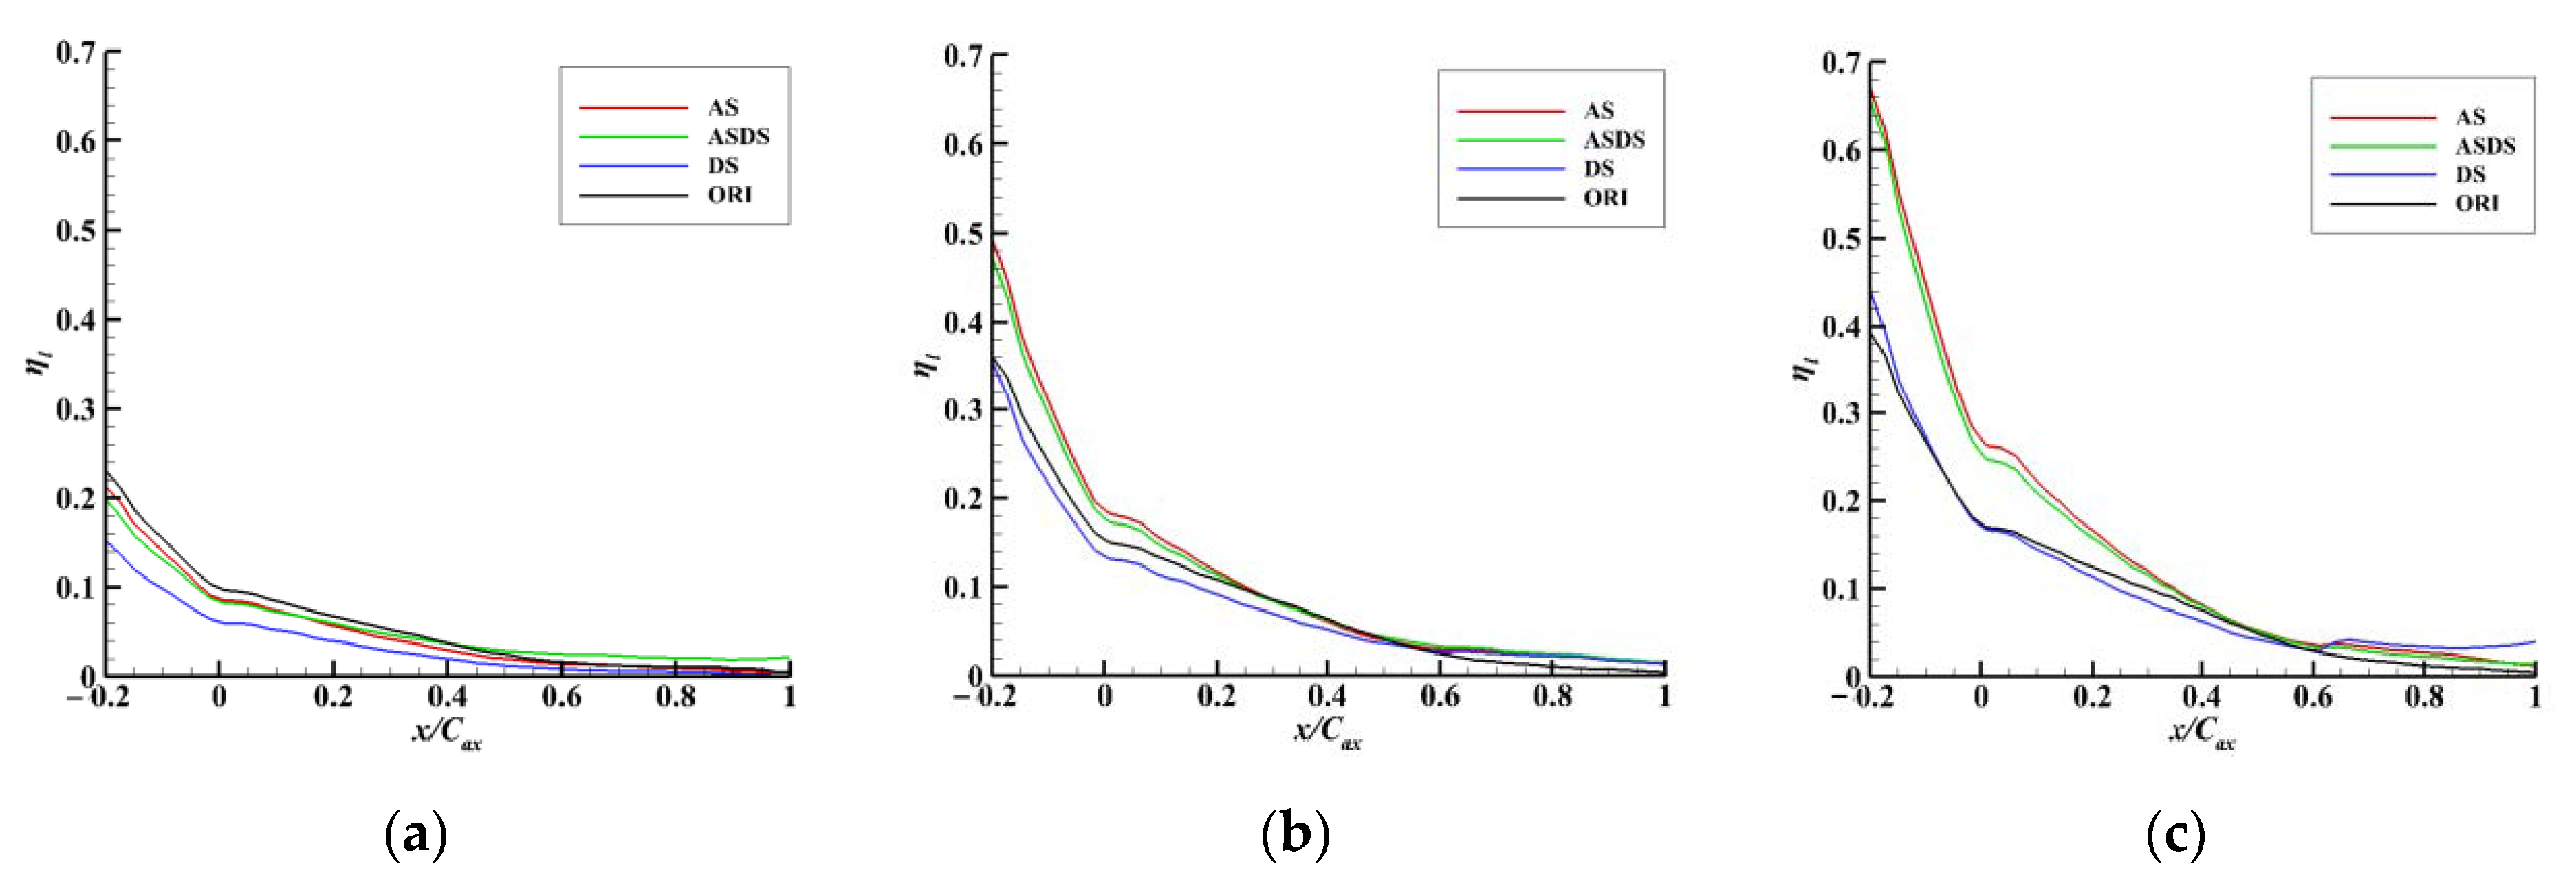
4.1. Endwall Film Cooling Effectiveness

This section presents the contours and laterally-averaged η of the coolant PF on the endwall surface. The different MFRs ranged from 0.5% to 1.5%, and the seal structures (ORI, DS, AS and ASDS) were investigated by the experiments.
Figure 11 presents the contour results of the PF on the endwall surface. It was found that the η of the coolant PF gradually became greater with the increment in the MFR. When the MFR was 0.5%, all the structural adjustments had little impact on the cooling performance, which were instead lower than the original structure. The changes in the seal structure became apparent only when the MFR was greater than 1.0%. Since the coolant distribution was highly affected by the secondary flow on the endwall surface, its distribution and covered area did change with the MFR. Meanwhile, the cases of AS and ASDS with an adverse flow direction of the coolant PF and mainstream revealed that the film cooling performance of the coolant PF was higher than cases of ORI and DS, especially in the case of AS. Under the same MFR, the portion of the coolant extending through the endwall surface was further reduced when the flow direction of the coolant PF and mainstream was opposite. It was also found from the results that the DS structure had no effect on the advancement of η compared to the original structure but instead increased the blowing off of the coolant. Compared to the original structure, the DS structure mainly affected the angular direction of the rim seal outlet, which also affected the corner vortex structure inside the rim seal chamber.
The results of the laterally averaged and area-averaged η are presented in Figure 12 and Figure 13, respectively. It was found that when the MFR was less than 0.5%, the structural changes had little effect on the cooling effect. When the MFR was greater than 1.0%, the cases of AS and ASDS had a significant improvement in the detailed values of η. At this time, the increase in the MFR did not change the trend of the coolant film distribution for all the structures and only affected its peak value. Due to the influence of the secondary flow on the surface and the passage vortices, the coolant film only covered the front and middle region of the endwall and did not affect downstream of the endwall. The results of the contours and laterally averaged η were consistent.
According to the analysis of the film cooling characteristics, it was concluded that the cooling performance of the PF was higher when the flow direction of the coolant PF and mainstream was opposite (both in the case of AS and ASDS) when the MFR was greater than 1.0%. In the cases with a low MFR, the original structure was more effective, and the adjustment to the seal structure had little effect on η on the endwall surface.

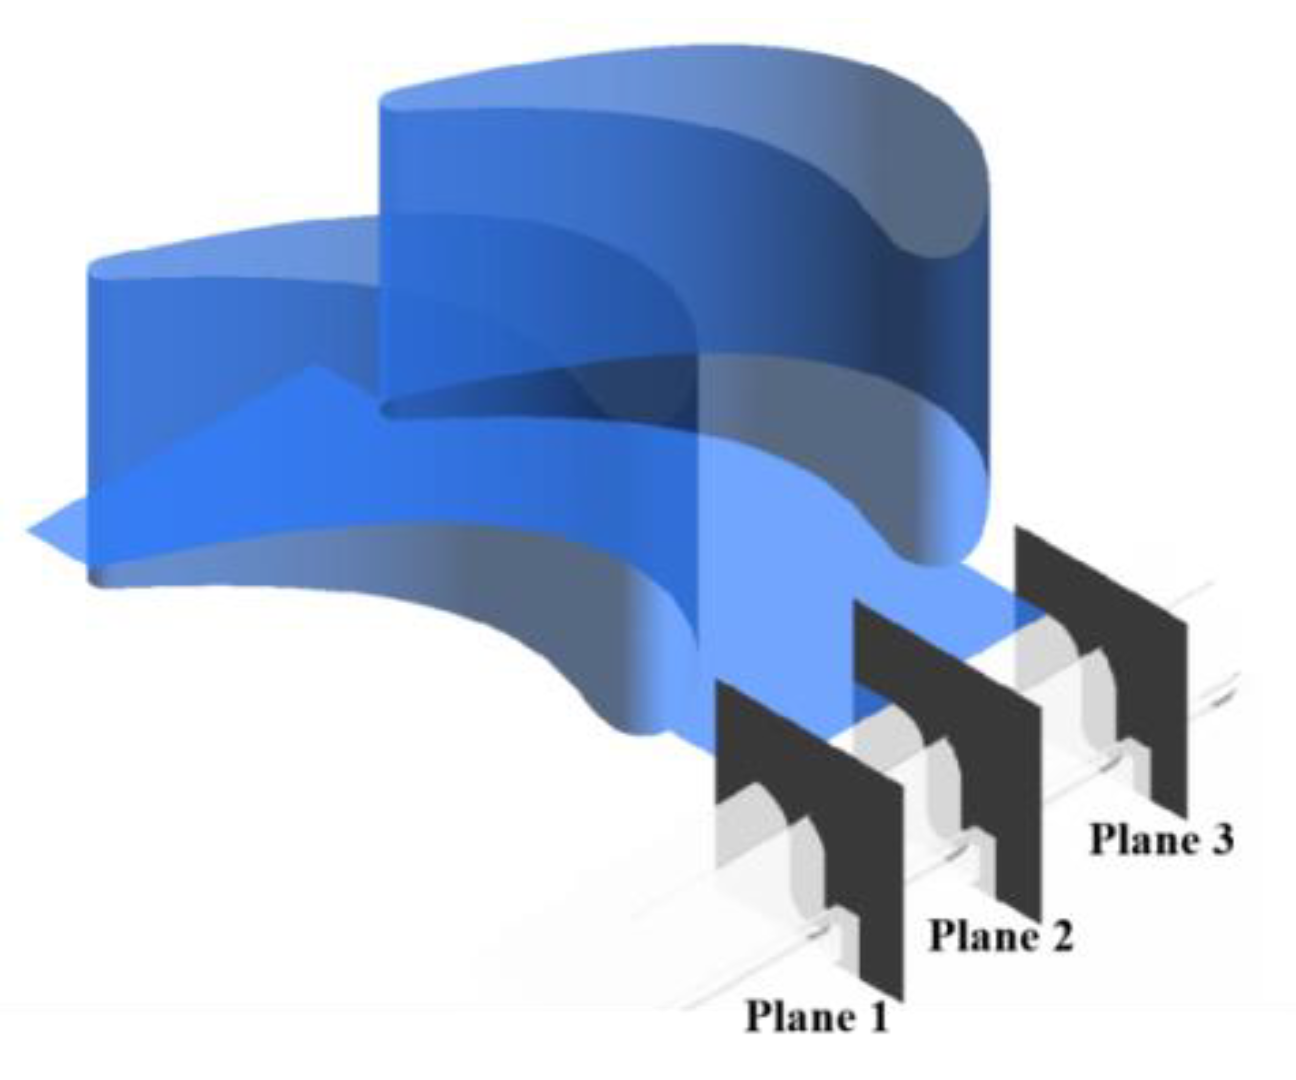
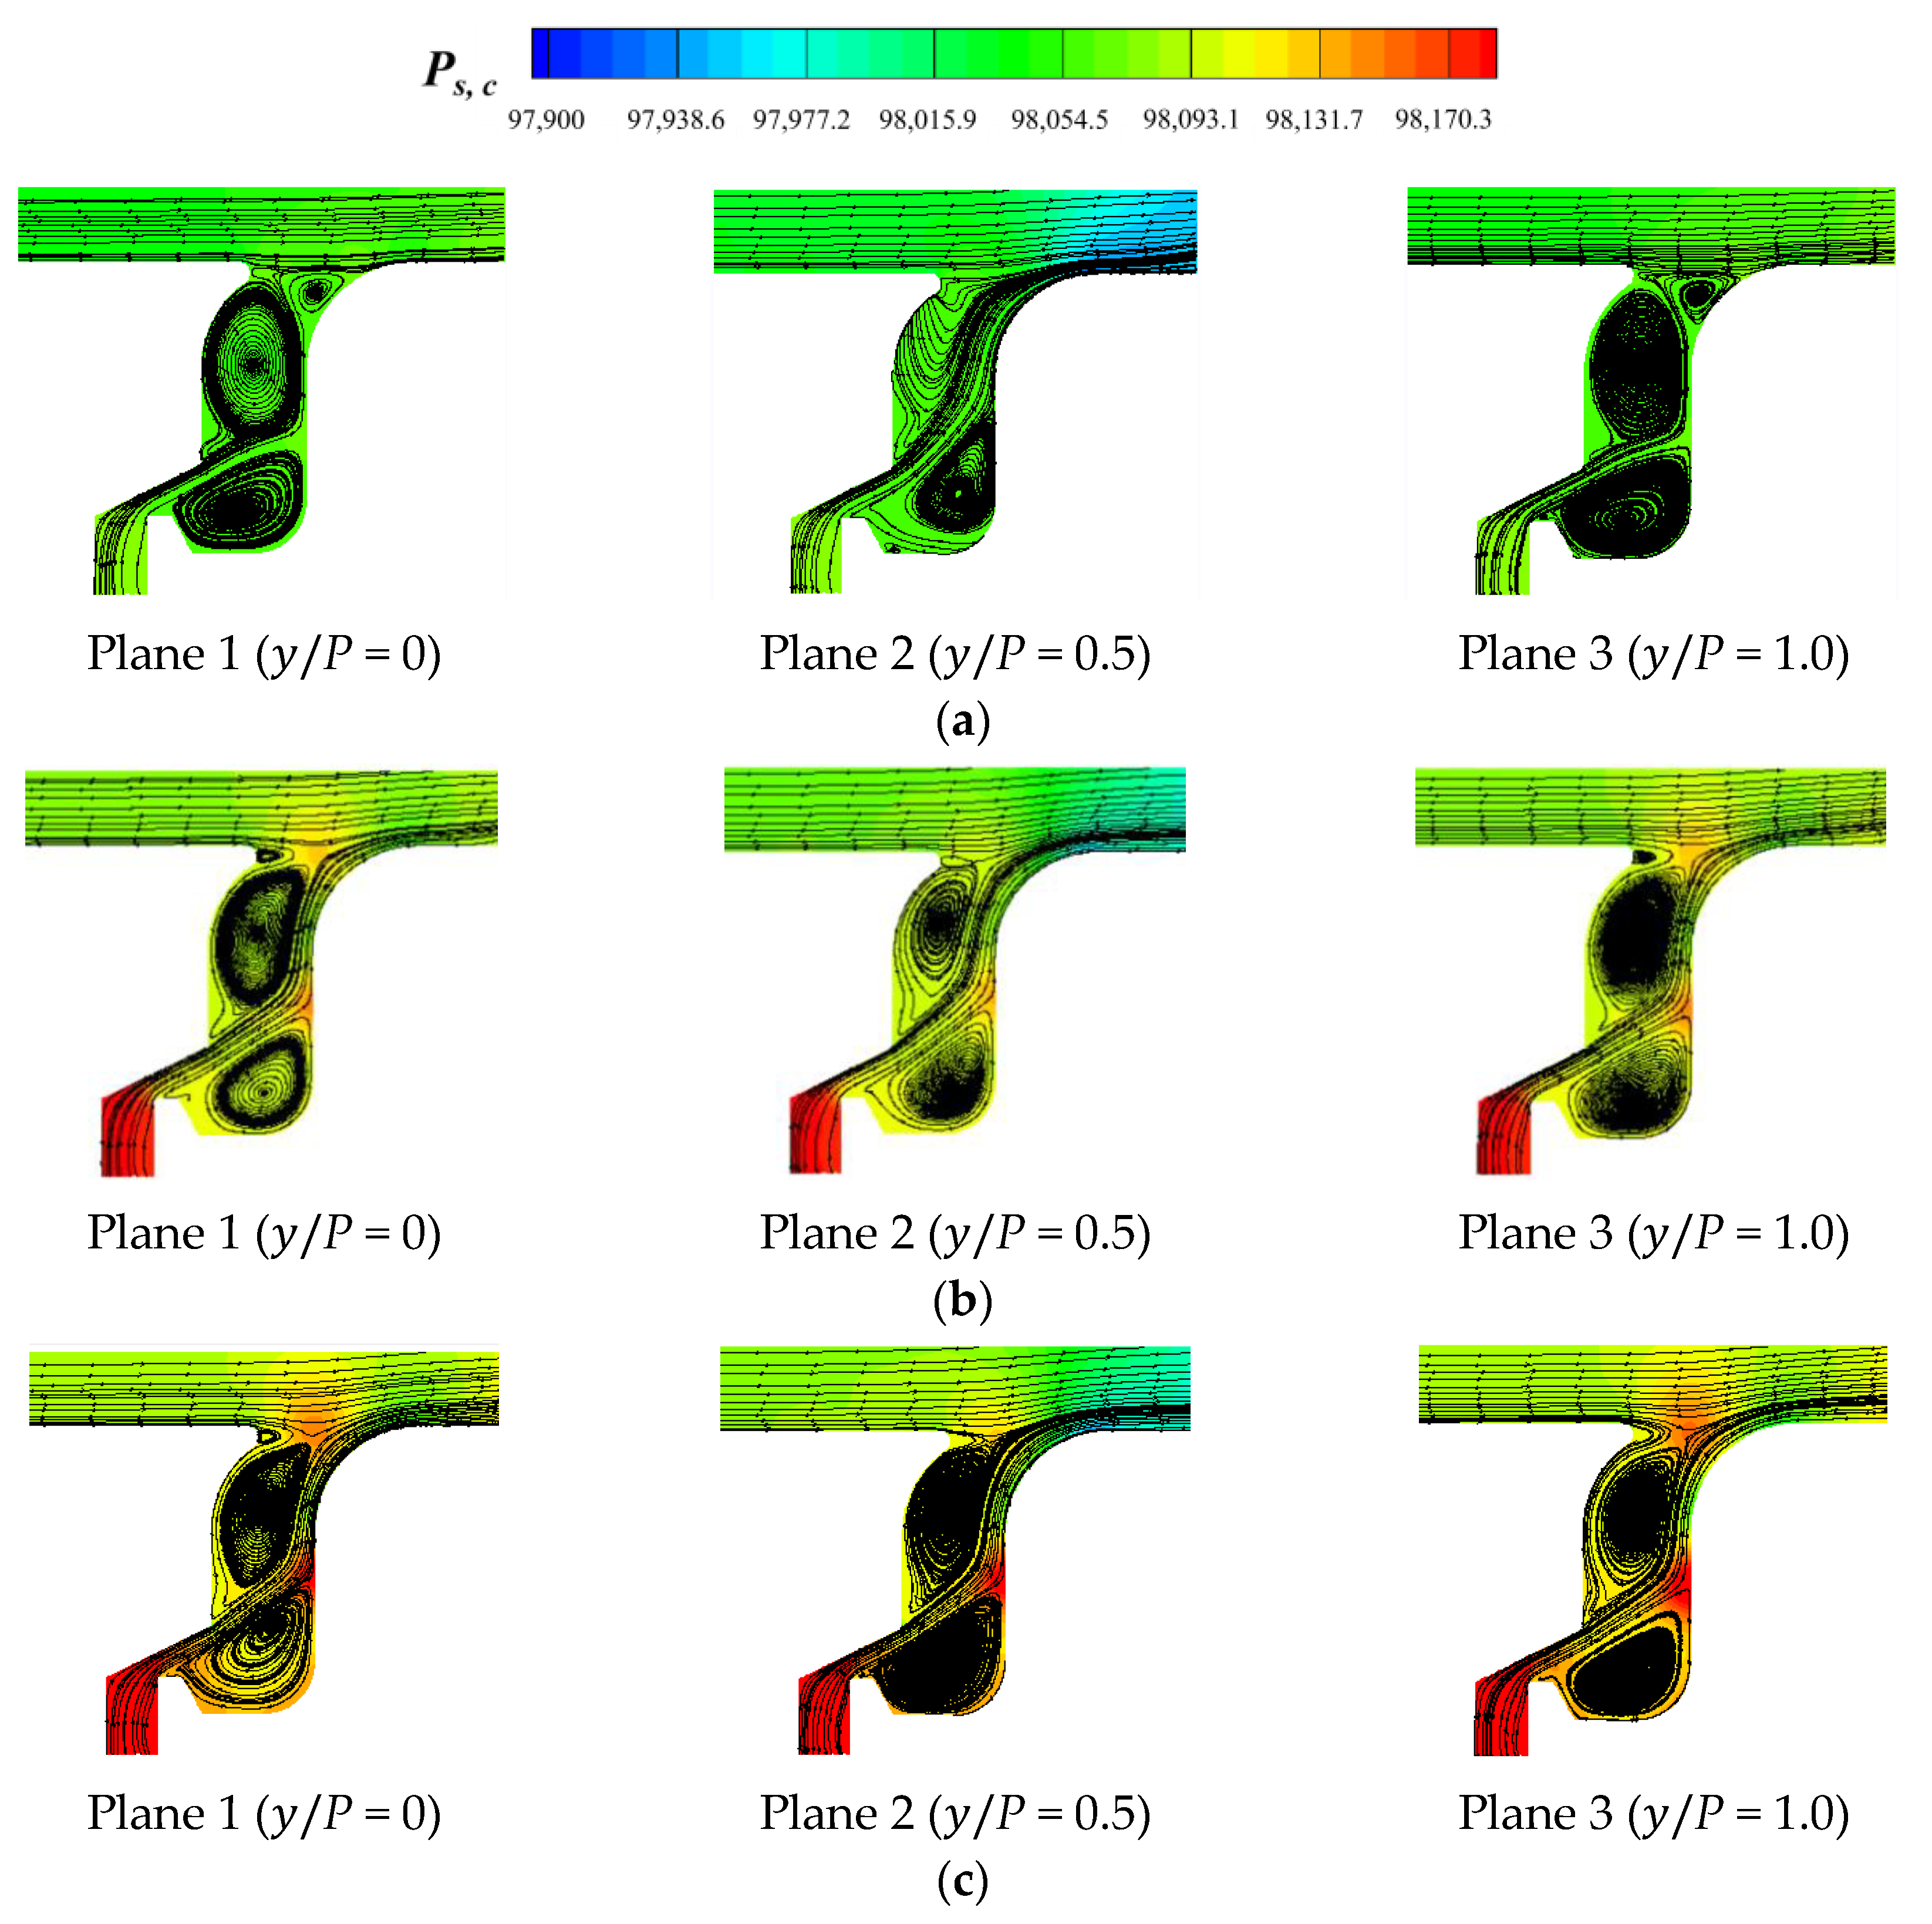
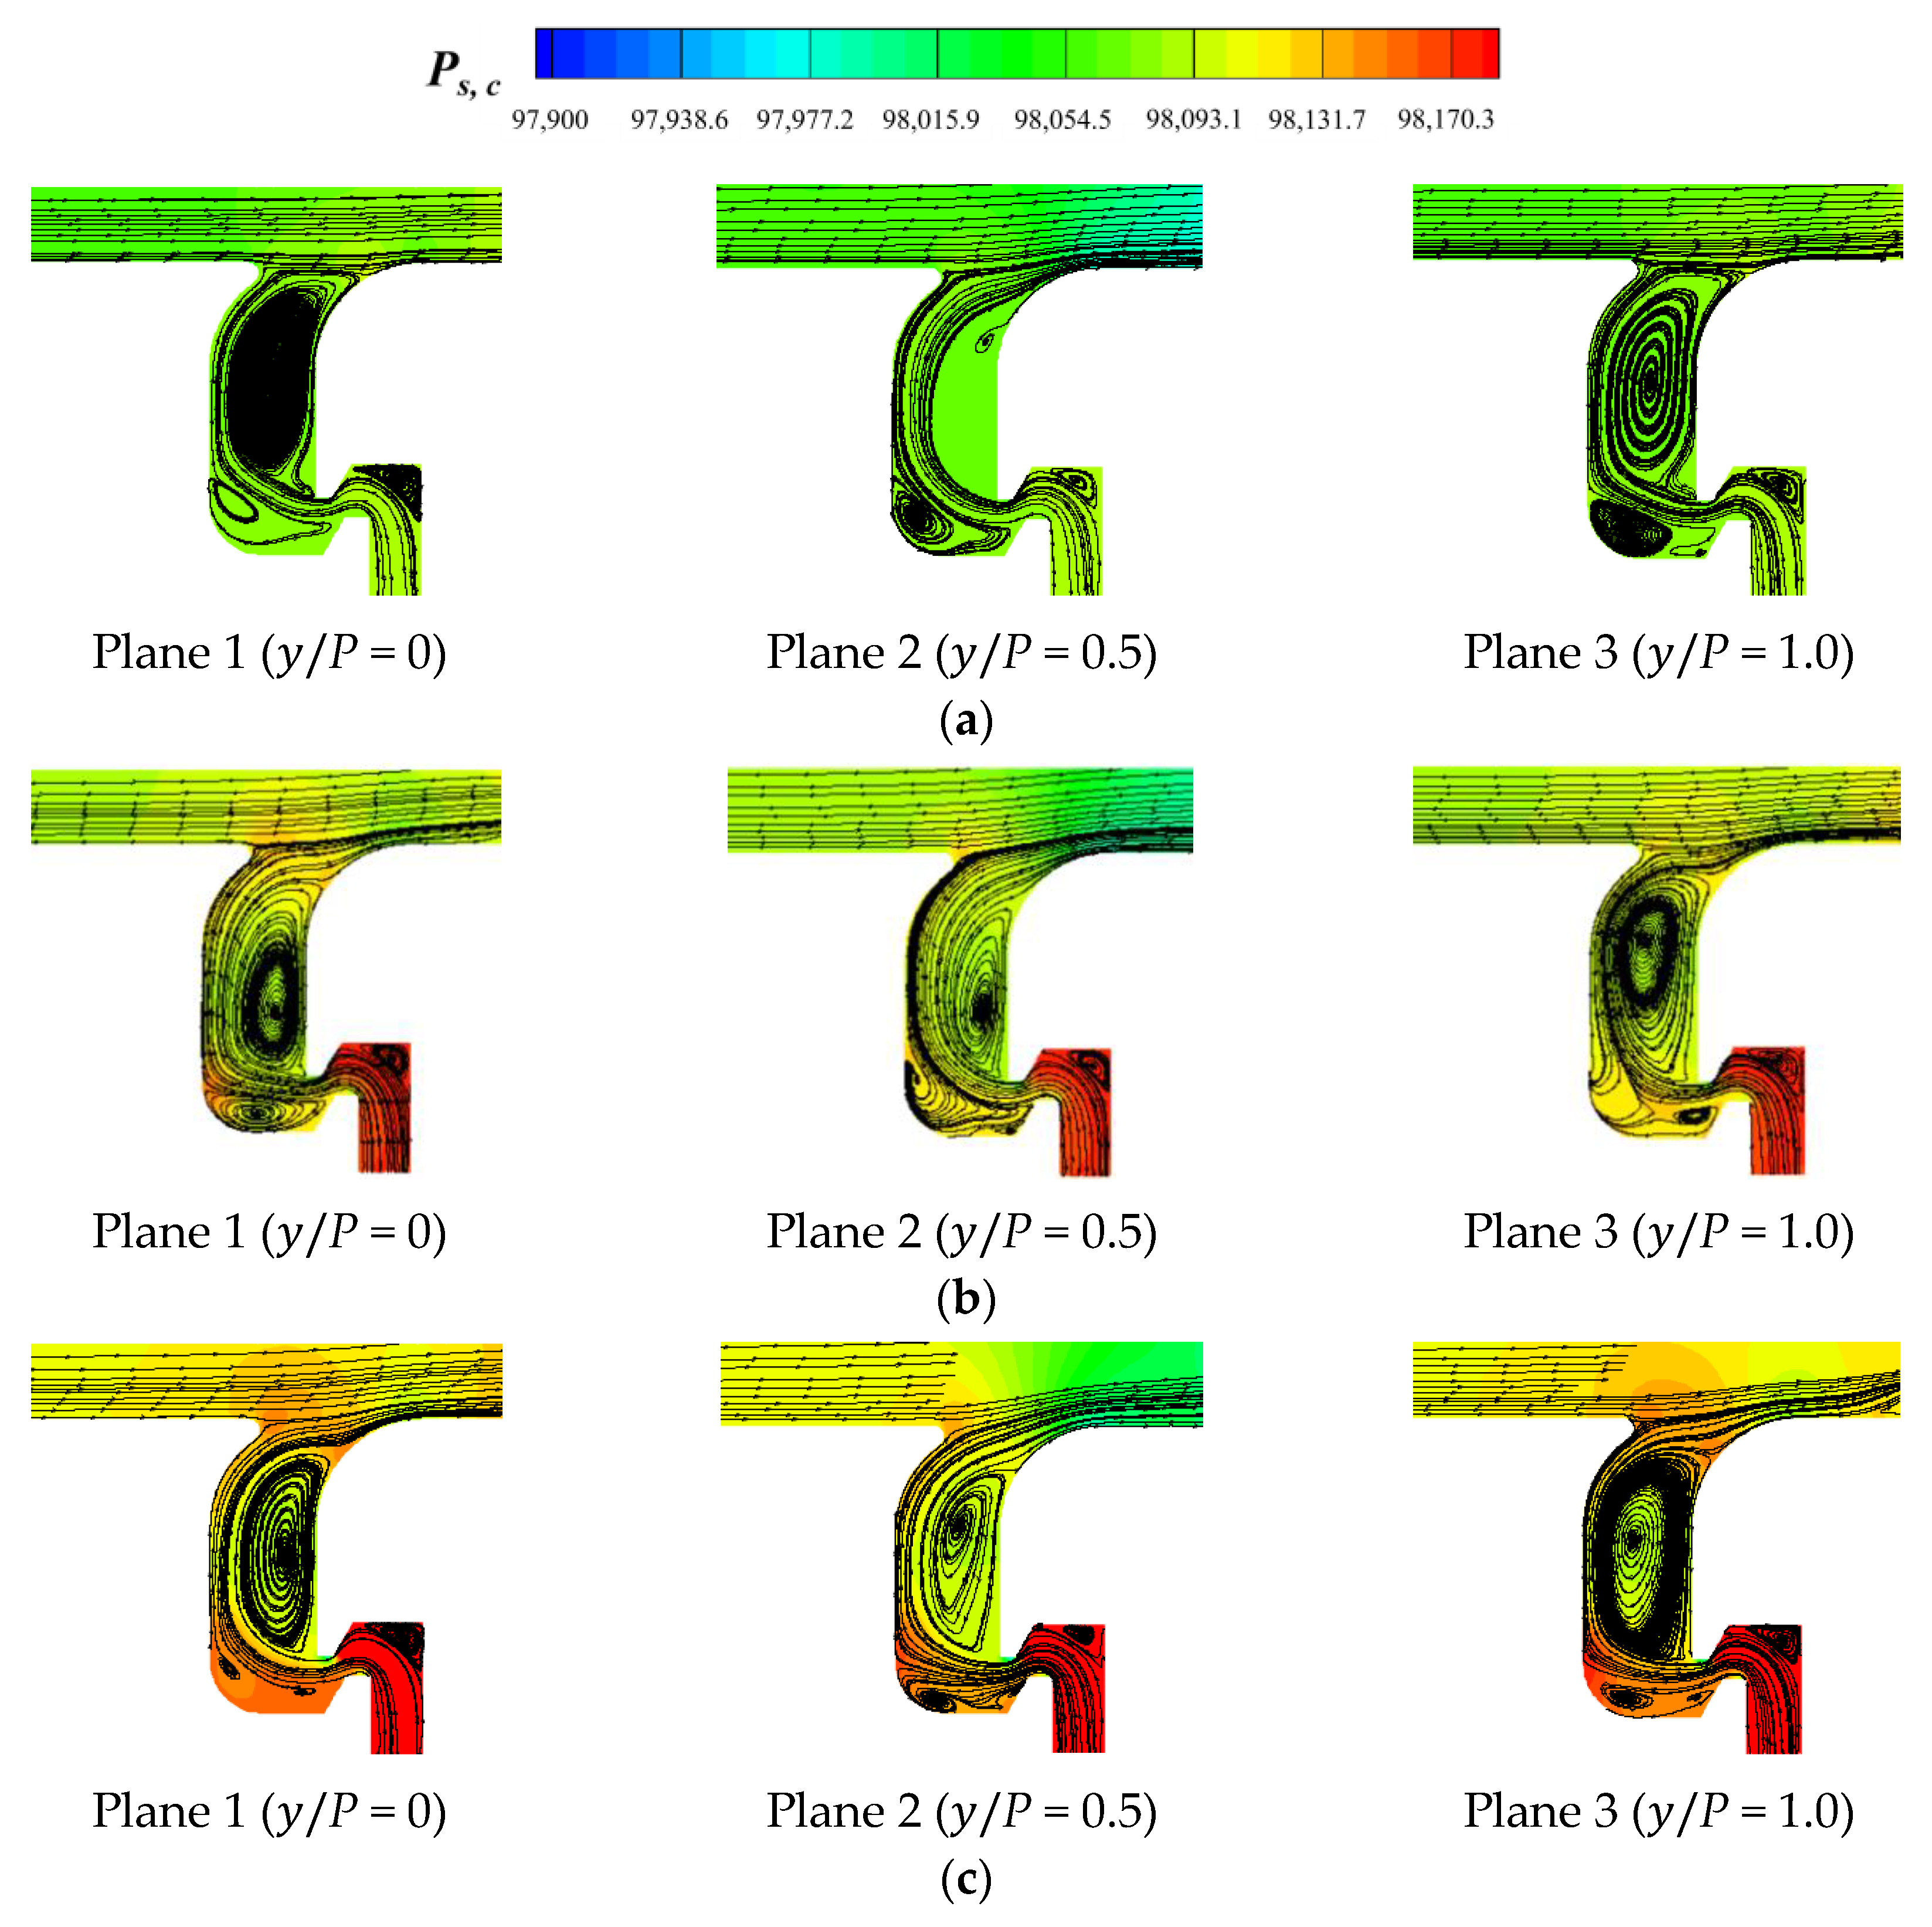
4.2. Flow Field Analysis

In the flow process, the coolant leakage from the seal chamber firstly flowed through the leading edge and then flowed from the pressure side to suction side of the blade, which formed the coolant film on the endwall surface. The flow characteristics inside the seal chamber affected the film cooling characteristics on the endwall. The coolant flow in the rim seal cavity was affected by the appearance of blade and it blocked the out-flow of the coolant since the pressure increased there. More details can be seen in the streamlines in the cut planes 1–3 in Figure 14, Figure 15, Figure 16, Figure 17 and Figure 18. The streamline distributions inside the rim seal chamber in the three cross-sectional planes at y / P = 0, y / P = 0.5 and y / P = 1.0 are shown in Figure 14. The various MFRs ranged from 0.5% to 1.5%, and the seal structures (ORI, DS, AS and ASDS) were investigated by computational fluid dynamics (CFD).
Figure 15 presents the vortex in the rim seal chamber of the ORI case. It was found from the distribution of the streamlines that the PF suppressed the corner vortex generation near the seal outlet and also weakened the corner vortex at the bottom of the rim seal chamber when the MFR was 0.5%. With the gradual increment in the MFR, the strength of the corner vortex at the seal outlet gradually increased. At the same time, due to the intense momentum exchange absorbed by the two corner vortices, the effect range of the corner vortex gradually expanded, which kept the coolant PF in the middle of these two corner vortices and suppressed the coolant from blowing away from the endwall surface. Furthermore, because the corner vortex at the outlet of the rim real was rotating counterclockwise, its tangential velocity direction near the surface was opposite to the direction of the mainstream, which in turn inhibited the mainstream from entering the seal chamber. Figure 16 presents the streamline distribution of DS. Compared to the ORI case, the DS case changed the number of seal teeth, thus changing the size of the internal seal chamber, which could in turn inhibit the generation of the corner vortex at the bottom of the rim seal chamber and increase the generation of the corner vortex at the outlet of the seal chamber. Meanwhile, this could also lead to a further weakening of the coolant momentum and a consequent decrease in the film cooling performance.
When the flow direction of the coolant PF and the mainstream was opposite (AS and ASDS), the rotating direction of the two corner vortices was also opposite to the original rim seal case, as shown in Figure 17 and Figure 18. The adjustment of the corner vortex position and direction also affected the coolant injection. Compared to the cases of ORI and DS, the cases of AS and ASDS had a smaller coolant injection angle, which ultimately led to a higher η. In the case of ASDS, due to both the adjustments of the flow direction and the number of seal teeth, the intensity of the corner vortex near the seal outlet increased, which in turn weakened the film cooling effect of the PF on the endwall surface, so the η was lower than the case of AS. The results of ASDS were consistent with the conclusion of the case of DS.

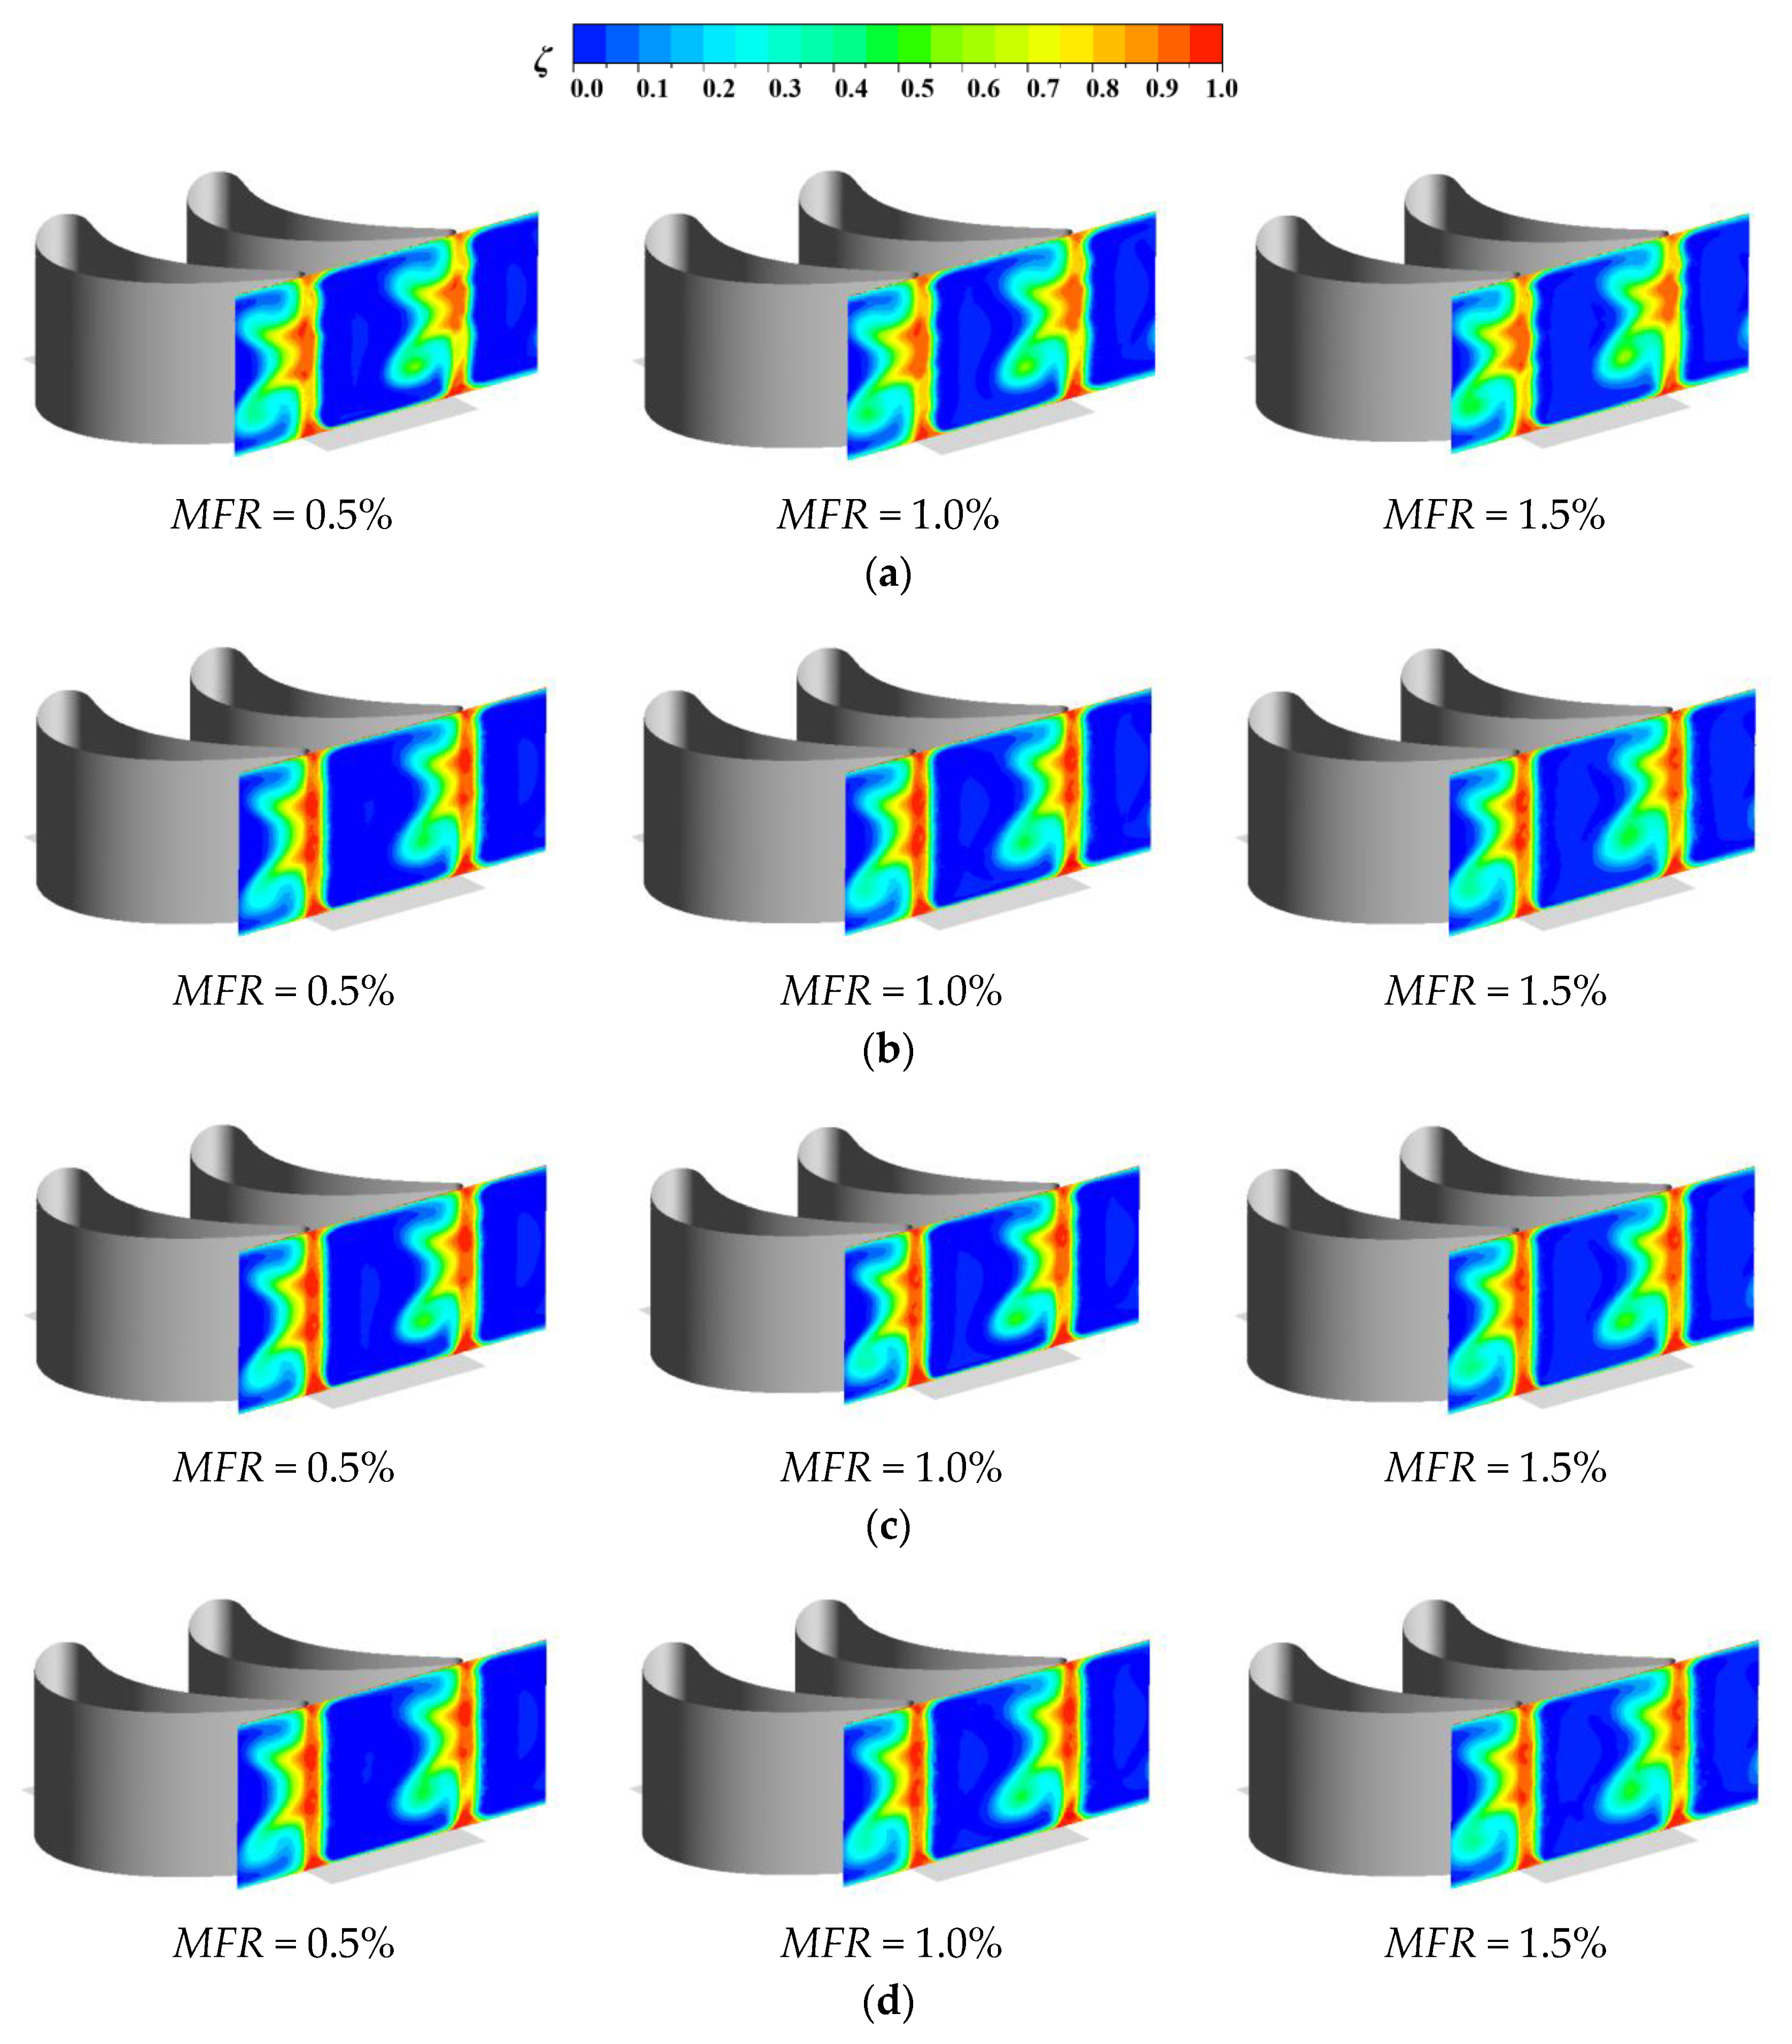
4.3. Aerodynamic Loss Analysis

Figure 19 and Figure 20 illustrate the distribution of the total pressure loss coefficients (ζ) and the area-averaged ζ. The distribution of ζ at the passage outlet was used to evaluate the influence of the different seal structures on the aerodynamic loss caused by the PF. ζ is defined as:
ζ = P ,   r e f P t ,   l o c P ,   r e f P s ,   o u t
where P s ,   o u t is the local static pressure at the passage outlet and P t ,   l o c is the local total pressure at a selected location, in which the cut plane of the endwall passage outlet was selected to analyze the aerodynamic performance. P ,   r e f is the mass and area-averaged total pressure of the mainstream inlet and coolant inlet, which can be defined as:
P ,   r e f = m ,   i n P ,   i n ,   t + m c P c ,   i n ,   t m ,   i n + m c
in which P ,   i n ,   t is the area-averaged total pressure at the mainstream inlet. P c ,   i n ,   t is the area-averaged total pressure at the coolant inlet.
According to the contours, the total pressure loss distribution of the four seal structures was similar under the same MFR, and with the increase in the MFR, the area of the pressure loss became larger. This was because the momentum exchange level of the coolant and mainstream at the seal chamber outlet was higher and the intensity of the corner vortex also gradually increased, which resulted in larger aerodynamic loss. Furthermore, from the results of the area-averaged ζ, it was obviously found that the results had little difference in the cases of DS, AS and ASDS under the same MFR, which indicates that the structural changes had little influence on the aerodynamic performance, and the ORI case had the highest total pressure loss among all the cases. This was because the corner vortex at the bottom and outlet of seal chamber of ORI case was the most intense among all the cases.
Combined with the conclusions achieved in Section 4.1 and Section 4.2, which have proven that the cases of AS and ASDS performed with a better cooling performance than the other two cases (ORI and DS), the structural changes in the cases of AS and ASDS also had little impact on the aerodynamic penalty, which means that both the AS and ASDS cases achieved good aerodynamic and cooling performances.

5. Conclusions

In this paper, the effects of four rim seal structures with MFR values of 0.5%, 1.0% and 1.5% on the endwall film cooling performance were investigated through experiments in a linear cascade. The turbulence model and grid independence were verified to analyze the structure of the vortices inside the rim seal chamber and the flow structures of the blade passage, and the passage aerodynamic loss characteristics were investigated by numerical calculations. The main conclusions are presented as follows:
(1)
The cooling effect of the PF was higher when the flow direction of the coolant and mainstream was opposite (both in the cases of AS and ASDS). When the MFR was greater than 1.0%, in the cases with a low MFR, the original structure (ORI) was more effective, and the adjustment to the seal structure had little effect on η on the endwall surface.
(2)
The case of DS changed the direction of flow out of the seal gap and the size of the two angular vortices at the outlet, resulting in the absorption of cold air energy and a decrease in η. Compared to the cases of ORI and DS, the cases of AS and ASDS had a smaller injection angle, which ultimately led to a higher η.
(3)
The aerodynamic loss became larger with the increment in the MFR, and the structural changes had little influence on the aerodynamic performance of the four seal structures. The aerodynamic performances of the DS, AS and ASDS cases were all better than that of the ORI case, and the cases of AS and ASDS could achieve a better cooling effect while having little impact on the aerodynamic penalty.
Rim seals are widely used in modern gas turbines to prevent mainstream ingestion and are of great research value. Besides the film cooling effectiveness and aerodynamic loss of the rim seal leakage investigated and analyzed in this paper, other characteristics such as heat transfer characteristics are also worth studying. Meanwhile, because of the limitations of the experimental conditions, the experiment in this paper was carried out in a linear cascade. In the future, experiments in an annular cascade under rotating conditions can be conducted to provide more comprehensive results to the design of gas turbine cooling.

Author Contributions

Conceptualization, Y.L. and Z.L.; methodology, Z.L. and Y.D.; software, Z.L. and W.Z.; validation, Y.L. and W.Z.; formal analysis, Y.L.; investigation, Y.L. and Z.L.; resources, Z.F.; data curation, Y.L.; writing—original draft preparation, Y.L.; writing—review and editing, Z.L.; visualization, Z.F. and Z.L.; funding acquisition, Z.L. All authors have read and agreed to the published version of the manuscript.

Funding

This work was supported by the National Science and Technology Major Project (J2019-III-0007-0050).

Data Availability Statement

The data presented in this study are available on request from the corresponding author. The data are not publicly available due to privacy.

Conflicts of Interest

The authors declare no conflict of interest.

Abbreviations

CConcentration
CaxAxial chord (mm)
HBlade height (mm)
MFRMass flow ratio
PPressure
PFPurge flow
RSRim seal
ReReynolds number
TTemperature
TuTurbulence intensity
UVelocity
hHeight
xX axial length
Greek symbol
αInjection angle (°)
βBlade geometric angle (°)
γBlade attack angle (°)
ηFilm cooling effectiveness
ζPressure loss coefficient
Subscripts
awAdiabatic surface
cCoolant
aArea-averaged
locLocal parameter
inInlet
outOutlet
mainMainstream
maxMaximum
mixMixture
lLaterally averaged
tGlobally averaged
refReference
sStatic
Infinity of the passage

References

  1. Beard, P.F.; Gao, F.; Chana, K.S.; Chew, J. Unsteady Flow Phenomena in Turbine Rim Seals. J. Eng. Gas Turbines Power 2017, 139, 032501. [Google Scholar] [CrossRef]
  2. Schädler, R.; Kalfas, A.I.; Abhari, R.S.; Schmid, G.; Voelker, S. Modulation and Radial Migration of Turbine Hub Cavity Modes by the Rim Seal Purge Flow. J. Turbomach. 2017, 139, 034416. [Google Scholar] [CrossRef]
  3. Blanco, E.D.L.R.; Hodson, H.P.; Vazquez, R. Effect of the Leakage Flows and the Upstream Platform Geometry on the Endwall Flows of a Turbine Cascade. J. Turbomach. 2009, 131, 011004. [Google Scholar] [CrossRef]
  4. Mclean, C.; Camci, C.; Glezer, B. Mainstream Aerodynamic Effects Due to Wheelspace Coolant Injection in a High-Pressure Turbine Stage: Part I—Aerodynamic Measurements in the Stationary Frame. J. Turbomach. 2001, 123, 401026. [Google Scholar] [CrossRef]
  5. Mclean, C.; Camci, C.; Engineering, O.A.; Glezer, B. Mainstream Aerodynamic Effects Due to Wheelspace Coolant Injection in a High-Pressure Turbine Stage: Part II—Aerodynamic Measurements in the Rotational Frame. J. Turbomach. 2001, 123, 687–696. [Google Scholar] [CrossRef]
  6. Kost, F.; Nicklas, M. Film-Cooled Turbine Endwall in a Transonic Flow Field. Part I—Aerodynamic Measurements. In Proceedings of the Asme Turbo Expo, New Orleans, LA, USA, 4–7 June 2001. [Google Scholar] [CrossRef]
  7. Reid, K.; Denton, J.; Pullan, G.; Curtis, E.; Longley, J. The Effect of Stator-Rotor Hub Sealing Flow on the Mainstream Aerodynamics of a Turbine. In Proceedings of the Asme Turbo Expo: Power for Land, Sea, & Air, Barcelona, Spain, 8–11 May 2006. [Google Scholar] [CrossRef]
  8. Gao, H.; Li, X.; Ren, J.; Jiang, H. Effect of leakage flow on the endwall cooling performance in high subsonic turbine cascade. Int. J. Therm. Sci. 2021, 170, 07140. [Google Scholar] [CrossRef]
  9. Lynch, S.P.; Thole, K. The Effect of Combustor-Turbine Interface Gap Leakage on the Endwall Heat Transfer for a Nozzle Guide Vane. J. Turbomach. 2008, 130, 812950. [Google Scholar] [CrossRef]
  10. Song, L.; Zhu, P.; Li, J.; Feng, Z. Effect of purge flow on endwall flow and heat transfer characteristics of a gas turbine blade. Appl. Therm. Eng. 2017, 110, 504–520. [Google Scholar] [CrossRef]
  11. Cong, Q.; Zhang, K.; Li, Z.; Li, J. Numerical Investigations on Gas Ingestion Mechanism Based on Flow Instabilities in Rim Seal and Cooling Characteristics of Endwall in a 1.5-Stage Axial Turbine. J. Eng. Gas Turbines Power 2023, 145, 055826. [Google Scholar] [CrossRef]
  12. Barigozzi, G.; Franchini, G.; Perdichizzi, A.; Maritano, M.; Abram, R. Purge flow and interface gap geometry influence on the aero-thermal performance of a rotor blade cascade. Int. J. Heat Fluid Flow 2013, 44, 563–575. [Google Scholar] [CrossRef]
  13. Mansouri, Z. Aerodynamic and heat transfer performances of a highly loaded transonic turbine rotor with upstream generic rim seal cavity. Propuls. Power Res. 2021, 10, 317–331. [Google Scholar] [CrossRef]
  14. Zhang, Z.; Zhang, Y.; Zhang, Y.; Dong, X.; Lu, X. Numerical investigation of the purge flow mechanisms and heat-transfer characteristics of turbine rim seals. Case Stud. Therm. Eng. 2022, 40, 02484. [Google Scholar] [CrossRef]
  15. Fiore, M.; Gourdain, N.; Boussuge, J.F.; Lippinois, E. Numerical Study of a Linear Cascade with Upstream Cavity Using Various Rim-Seal Geometries and Purge Rates. In Proceedings of the ASME Turbo Expo 2018: Turbomachinery Technical Conference and Exposition, Oslo, Norway, 11–15 June 2018. [Google Scholar] [CrossRef]
  16. Wang, X.; Liao, G.; Zhang, F.; Li, J. Numerical investigation on the steady and unsteady flow characteristics of rim seal for the first stage in gas turbine. Appl. Therm. Eng. 2016, 99, 11–22. [Google Scholar] [CrossRef]
  17. Schuler, P.; Kurz, W.; Dullenkopf, K.; Bauer, H.J. The Influence of Different Rim Seal Geometries on Hot-Gas Ingestion and Total Pressure Loss in a Low-Pressure Turbine. In Proceedings of the Asme Turbo Expo: Power for Land, Sea, & Air, Glasgow, UK, 14–18 June 2010. [Google Scholar] [CrossRef]
  18. Jia, X.; Zhang, H.; Jiang, Y. Performance of radial–axial clearance rim seal in realistic working conditions. Aerosp. Sci. Technol. 2018, 77, 373–387. [Google Scholar] [CrossRef]
  19. Jia, W.; Liu, H. Numerical investigation of the effect of rim seal on turbine aerodynamic design parameters and end wall flows in low-aspect ratio turbine. Comput. Fluids 2013, 74, 114–125. [Google Scholar] [CrossRef]
  20. Zhang, Z.; Zhang, Y.; Dong, X.; Qu, X.; Lu, X.; Zhang, Y. Flow mechanism between purge flow and mainstream in different turbine rim seal configurations. Chin. J. Aeronaut. 2020, 33, 2162–2175. [Google Scholar] [CrossRef]
  21. Wang, L.; Ma, H.; Zhang, J. Experimental Investigation of Effects of Rim Sealing Flow on the Flow Field in a Turbine Cascade Passage with Different Rim Seal Configurations. In Proceedings of the ASME Turbo Expo 2016: Turbomachinery Technical Conference and Exposition, Seoul, Republic of Korea, 13–17 June 2016. [Google Scholar] [CrossRef]
  22. Zhao, Q.; Yang, X.; Feng, Z. Effects of Rim Seal Geometries on Aerodynamic Performance and Rotor Platform Cooling in a One-Stage Turbine. In Proceedings of the ASME Turbo Expo 2020: Turbomachinery Technical Conference and Exposition, Virtual, 21–25 September 2020. [Google Scholar] [CrossRef]
  23. Zhang, Q.-C.; Tan, X.-M.; Wang, Q.-Q.; Zhang, J.-Z. Numerical investigation on effects of egress flow through different rim seals. Therm. Sci. Eng. Prog. 2023, 38, 01648. [Google Scholar] [CrossRef]
  24. Zhang, W.; Li, F.; Xie, Y.; Ding, Y.; Liu, Z.; Feng, Z. Experimental and numerical investigations of discrete film holes cooling performance on a blade endwall with mid-passage gap leakage. Int. J. Heat Mass Transf. 2023, 201, 23550. [Google Scholar] [CrossRef]
Figure 1. Schematic diagram of experimental system: (a) 3D diagram of experimental system; (b) local diagram of the experimental section.
Energies 16 07976 g001
Figure 2. Diagram and photo of test section.
Energies 16 07976 g002
Figure 3. Distribution of the pressure coefficient.
Energies 16 07976 g003
Figure 4. Graphic model of the seal geometry.
Energies 16 07976 g004
Figure 5. Graphic model and partial diagram of different seal geometry structures: (a) ORI; (b) DS; (c) AS; (d) ASDS.
Energies 16 07976 g005
Figure 6. Photograph of the PSP measurement process from different views: (a) overall view of the experiment; (b) partial view of the experimental cascade.
Energies 16 07976 g006
Figure 7. Velocity distribution of the mainstream.
Energies 16 07976 g007
Figure 8. Validation of the turbulence model: (a) contours of η; (b) laterally averaged η.
Energies 16 07976 g008
Figure 9. Local refined regions of the grid.
Energies 16 07976 g009
Figure 10. Grid independence analysis.
Energies 16 07976 g010
Figure 11. Experimental contours η of four seal structures with different MFRs: (a) ORI; (b) DS; (c) AS; (d) ASDS.
Energies 16 07976 g011
Figure 12. The comparison of laterally averaged η of four seal structures with different MFRs: (a) MFR = 0.5%; (b) MFR = 1.0%; (c) MFR = 1.5%.
Energies 16 07976 g012
Figure 13. The comparison of area-averaged η of four seal structures with different MFRs.
Energies 16 07976 g013
Figure 14. The cross-sections of rim seal.
Energies 16 07976 g014
Figure 15. Streamline distribution of ORI with different MFRs: (a) MFR = 0.5%; (b) MFR = 1.0%; (c) MFR = 1.5%.
Energies 16 07976 g015
Figure 16. Streamline distribution of DS with different MFRs: (a) MFR = 0.5%; (b) MFR = 1.0%; (c) MFR = 1.5%.
Energies 16 07976 g016
Figure 17. Streamline distribution of AS with different MFRs: (a) MFR = 0.5%; (b) MFR = 1.0%; (c) MFR = 1.5%.
Energies 16 07976 g017aEnergies 16 07976 g017b
Figure 18. Streamline distribution of ASDS with different MFRs: (a) MFR = 0.5%; (b) MFR = 1.0%; (c) MFR = 1.5%.
Energies 16 07976 g018
Figure 19. ζ of four seal structures with different MFRs: (a) ORI; (b) DS; (c) AS; (d) ASDS.
Energies 16 07976 g019
Figure 20. Area-averaged ζ of four seal structures with different MFRs.
Energies 16 07976 g020
Table 1. Geometric parameters of the experimental blade.
ParametersValue
Axial chord, Cax126.9
H/Cax0.615
P/Cax0.670
Inlet geometric angle, βin/deg41.1
Outlet geometric angle, βout/deg32.4
Attack angle, γ/deg0
Table 2. Detailed requirements of each point.
PointMainstreamCoolantLED Blue Light
1OnOnOn
2OnOffOn
3OffOffOn
4OffOffOff
Table 3. Boundary conditions.
Boundary ConditionValue
Mainstream inlet static temperature298.15 K
Mainstream inlet CO2 fraction0%
Coolant mass flow rate0.6375–1.9125 g/s
Coolant inlet static temperature288.15 K
Outlet static pressure97.5 kPa
Averaged mainstream velocity30 m/s
Mainstream turbulence intensity10%
Coolant turbulence intensity5%
Wall propertiesAdiabatic, smooth
Disclaimer/Publisher’s Note: The statements, opinions and data contained in all publications are solely those of the individual author(s) and contributor(s) and not of MDPI and/or the editor(s). MDPI and/or the editor(s) disclaim responsibility for any injury to people or property resulting from any ideas, methods, instructions or products referred to in the content.

