Article

Management of Hybrid Wind and Photovoltaic System Electrolyzer for Green Hydrogen Production and Storage in the Presence of a Small Fleet of Hydrogen Vehicles—An Economic Assessment

by
Anestis G. Anastasiadis
1,2,
Panagiotis Papadimitriou
1,
Paraskevi Vlachou
3 and
Georgios A. Vokas
1,*
1
Department of Electrical and Electronics Engineering, University of West Attica, P. Ralli & Thivon 250, 12244 Athens, Greece
2
Power Public Corporation (PPC S.A.), Xalkokondyli 22, 10432 Athens, Greece
3
Department of Mechanical Engineering, University of West Attica, P. Ralli & Thivon 250, 12244 Athens, Greece
*
Author to whom correspondence should be addressed.
Energies 2023, 16(24), 7990; https://doi.org/10.3390/en16247990
Submission received: 6 November 2023 / Revised: 29 November 2023 / Accepted: 5 December 2023 / Published: 10 December 2023
(This article belongs to the Special Issue Techno-Economic Analysis and Optimization for Energy Systems)

Abstract

:
Nowadays, with the need for clean and sustainable energy at its historical peak, new equipment, strategies, and methods have to be developed to reduce environmental pollution. Drastic steps and measures have already been taken on a global scale. Renewable energy sources (RESs) are being installed with a growing rhythm in the power grids. Such installations and operations in power systems must also be economically viable over time to attract more investors, thus creating a cycle where green energy, e.g., green hydrogen production will be both environmentally friendly and economically beneficial. This work presents a management method for assessing wind–solar–hydrogen (H2) energy systems. To optimize component sizing and calculate the cost of the produced H2, the basic procedure of the whole management method includes chronological simulations and economic calculations. The proposed system consists of a wind turbine (WT), a photovoltaic (PV) unit, an electrolyzer, a compressor, a storage tank, a fuel cell (FC), and various power converters. The paper presents a case study of green hydrogen production on Sifnos Island in Greece through RES, together with a scenario where hydrogen vehicle consumption and RES production are higher during the summer months. Hydrogen stations represent H2 demand. The proposed system is connected to the main power grid of the island to cover the load demand if the RES cannot do this. This study also includes a cost analysis due to the high investment costs. The levelized cost of energy (LCOE) and the cost of the produced H2 are calculated, and some future simulations correlated with the main costs of the components of the proposed system are pointed out. The MATLAB language is used for all simulations.

Graphical Abstract

1. Introduction

When the supply of electricity is generated from non-polluting sources, the electrolytic hydrogen produced via water electrolysis is a clean source of energy. Even though conventional thermal power plants can provide electrical energy at relatively low costs, their impact on the environment is a concern. On the other hand, renewable sources of energy, such as wind and solar energy, can provide the required electricity without negatively impacting the environment. To reduce the emissions of greenhouse gases in the hydrogen production process, RESs are identified as alternatives to fossil fuels in countries that are fully dependent on, and net importers of, fossil fuels. To meet the energy demand, wind and solar energy conversion systems are used. This has been made possible due to the advanced power technologies in the distributed generation systems. To solve this challenge, a hybrid power system (HyPS) is required, which uses storage subsystems and energy management strategies [1,2,3].
The use of wind energy (WE) for power generation is a promising technology, especially in remote areas such as islands and isolated villages in forests and mountains. Wind farms can harness this abundant, widely distributed renewable energy source without emitting greenhouse gases. There have been tremendous advancements in wind turbine technology over the last decade, with commercial products ranging from a few hundred Watts to 10–15 MW [4,5]. In times of low wind speeds or no wind, energy storage facilities can be integrated into the WT to store the excess electricity generated during off-load periods. Via electrolyzing water, electrical energy can be converted into hydrogen. Additionally, solar energy (SE) is a renewable and green energy source that is environmentally friendly. In achieving sustainable energy solutions, it plays an important role. As a result, solar energy is a very attractive source of electricity due to its massive amount of obtainable energy every day [6,7].
To meet our energy needs, both technologies, concentrated solar power and solar photovoltaics, are constantly being developed. Thus, a large installed capacity of solar energy applications worldwide supports the energy sector and supports the development of the employment market. The world is facing a significant energy crisis, and the depletion of non-renewable energy sources is a significant contributing factor. The growing need for alternative and sustainable energy sources has led to the increased utilization of renewable energy sources like solar and wind power. While renewable energy sources have many advantages over non-renewable sources, their intermittency is one of the most significant challenges [8]. Intermittency means that renewable energy sources cannot provide a constant supply of energy, which limits their ability to replace non-renewable sources entirely. This intermittency issue has led to the development of hybrid renewable energy systems, which combine multiple renewable energy sources to provide a more reliable and consistent energy supply [9].
One potential application of hybrid renewable energy systems is the production of hydrogen through the process of electrolysis. Electrolysis is a process that uses electricity to split water molecules into hydrogen and oxygen. Through the use of renewable energy sources such as wind and solar power, the production of hydrogen can become a sustainable and environmentally friendly process [10]. However, the efficiency of electrolysis is dependent on the quality and consistency of the energy source. This dependence on the energy source’s quality and consistency can result in significant inefficiencies in the production of hydrogen. A hybrid wind and photovoltaic system electrolyzer can address the challenges associated with intermittency and provide a more efficient and reliable method of producing hydrogen. The importance of developing an efficient and reliable method of producing hydrogen using RES cannot be overstated. Hydrogen has the potential to be a game changer in the energy industry, as it can be used as a fuel for transportation, heating, and electricity generation. A hybrid wind and photovoltaic system electrolyzer could provide a sustainable and environmentally friendly method of producing hydrogen, which would significantly contribute to reducing the world’s dependence on non-renewable energy sources [11,12]. A hybrid wind and photovoltaic system is an RES that combines wind turbines and solar panels to generate electricity. The system is designed to address the challenges associated with intermittency by providing a more reliable and consistent source of renewable energy. The system can be designed to operate in different modes, depending on the availability of wind and solar energy. For example, when the wind is strong and the sun is not shining, the system can rely more on the wind turbine, whereas when the sun is shining and the wind is calm, the system can rely more on the solar panel [13].
Although there are many studies on, and methods of, managing an electrical hybrid system for the production of green hydrogen, usually they use one production unit, for example, WT [14,15,16,17,18,19]; this study attempted the simultaneous management of wind and solar energy for the production and storage of green hydrogen and meeting the energy needs of consumers but also—attempted for the first time here—the needs of a small hydrogen-powered fleet of cars in a small electrical section of an island. Hydrogen is compressed and stored in a high-pressure container. For grid-level applications, the stored hydrogen is converted into electricity-utilizing fuel cells, effectively addressing the energy demands of the grid. In the context of vehicular applications, hydrogen is directly supplied to vehicles equipped with fuel cells, which subsequently convert the hydrogen into electricity to power the vehicle’s propulsion system. The economic assessment of the previously mentioned system, the calculation of the LCOE (levelized cost of energy), and the equivalent cost of hydrogen, in combination with a sensitivity analysis, contribute positively throughout this study. The management of the whole system is carried out per hour, and the data are real, making the results significant for decision making and the management of such systems.
Subsequently, the structure of this study is the following: the following section describes the components of the examinee hybrid system. Simultaneously, we describe the mathematical expressions of the variables that are taking place in the management of the hybrid system. Following is a flow diagram of the proposed management of the hybrid system. Then, the case study is described, and all the data are given in detail. Then, the results are listed to close the paper, with the necessary conclusions and future applications and extensions.
For the input of the data, for the processing based on the proposed management, and for the extraction of the results, we used the MATLAB programming language [20].

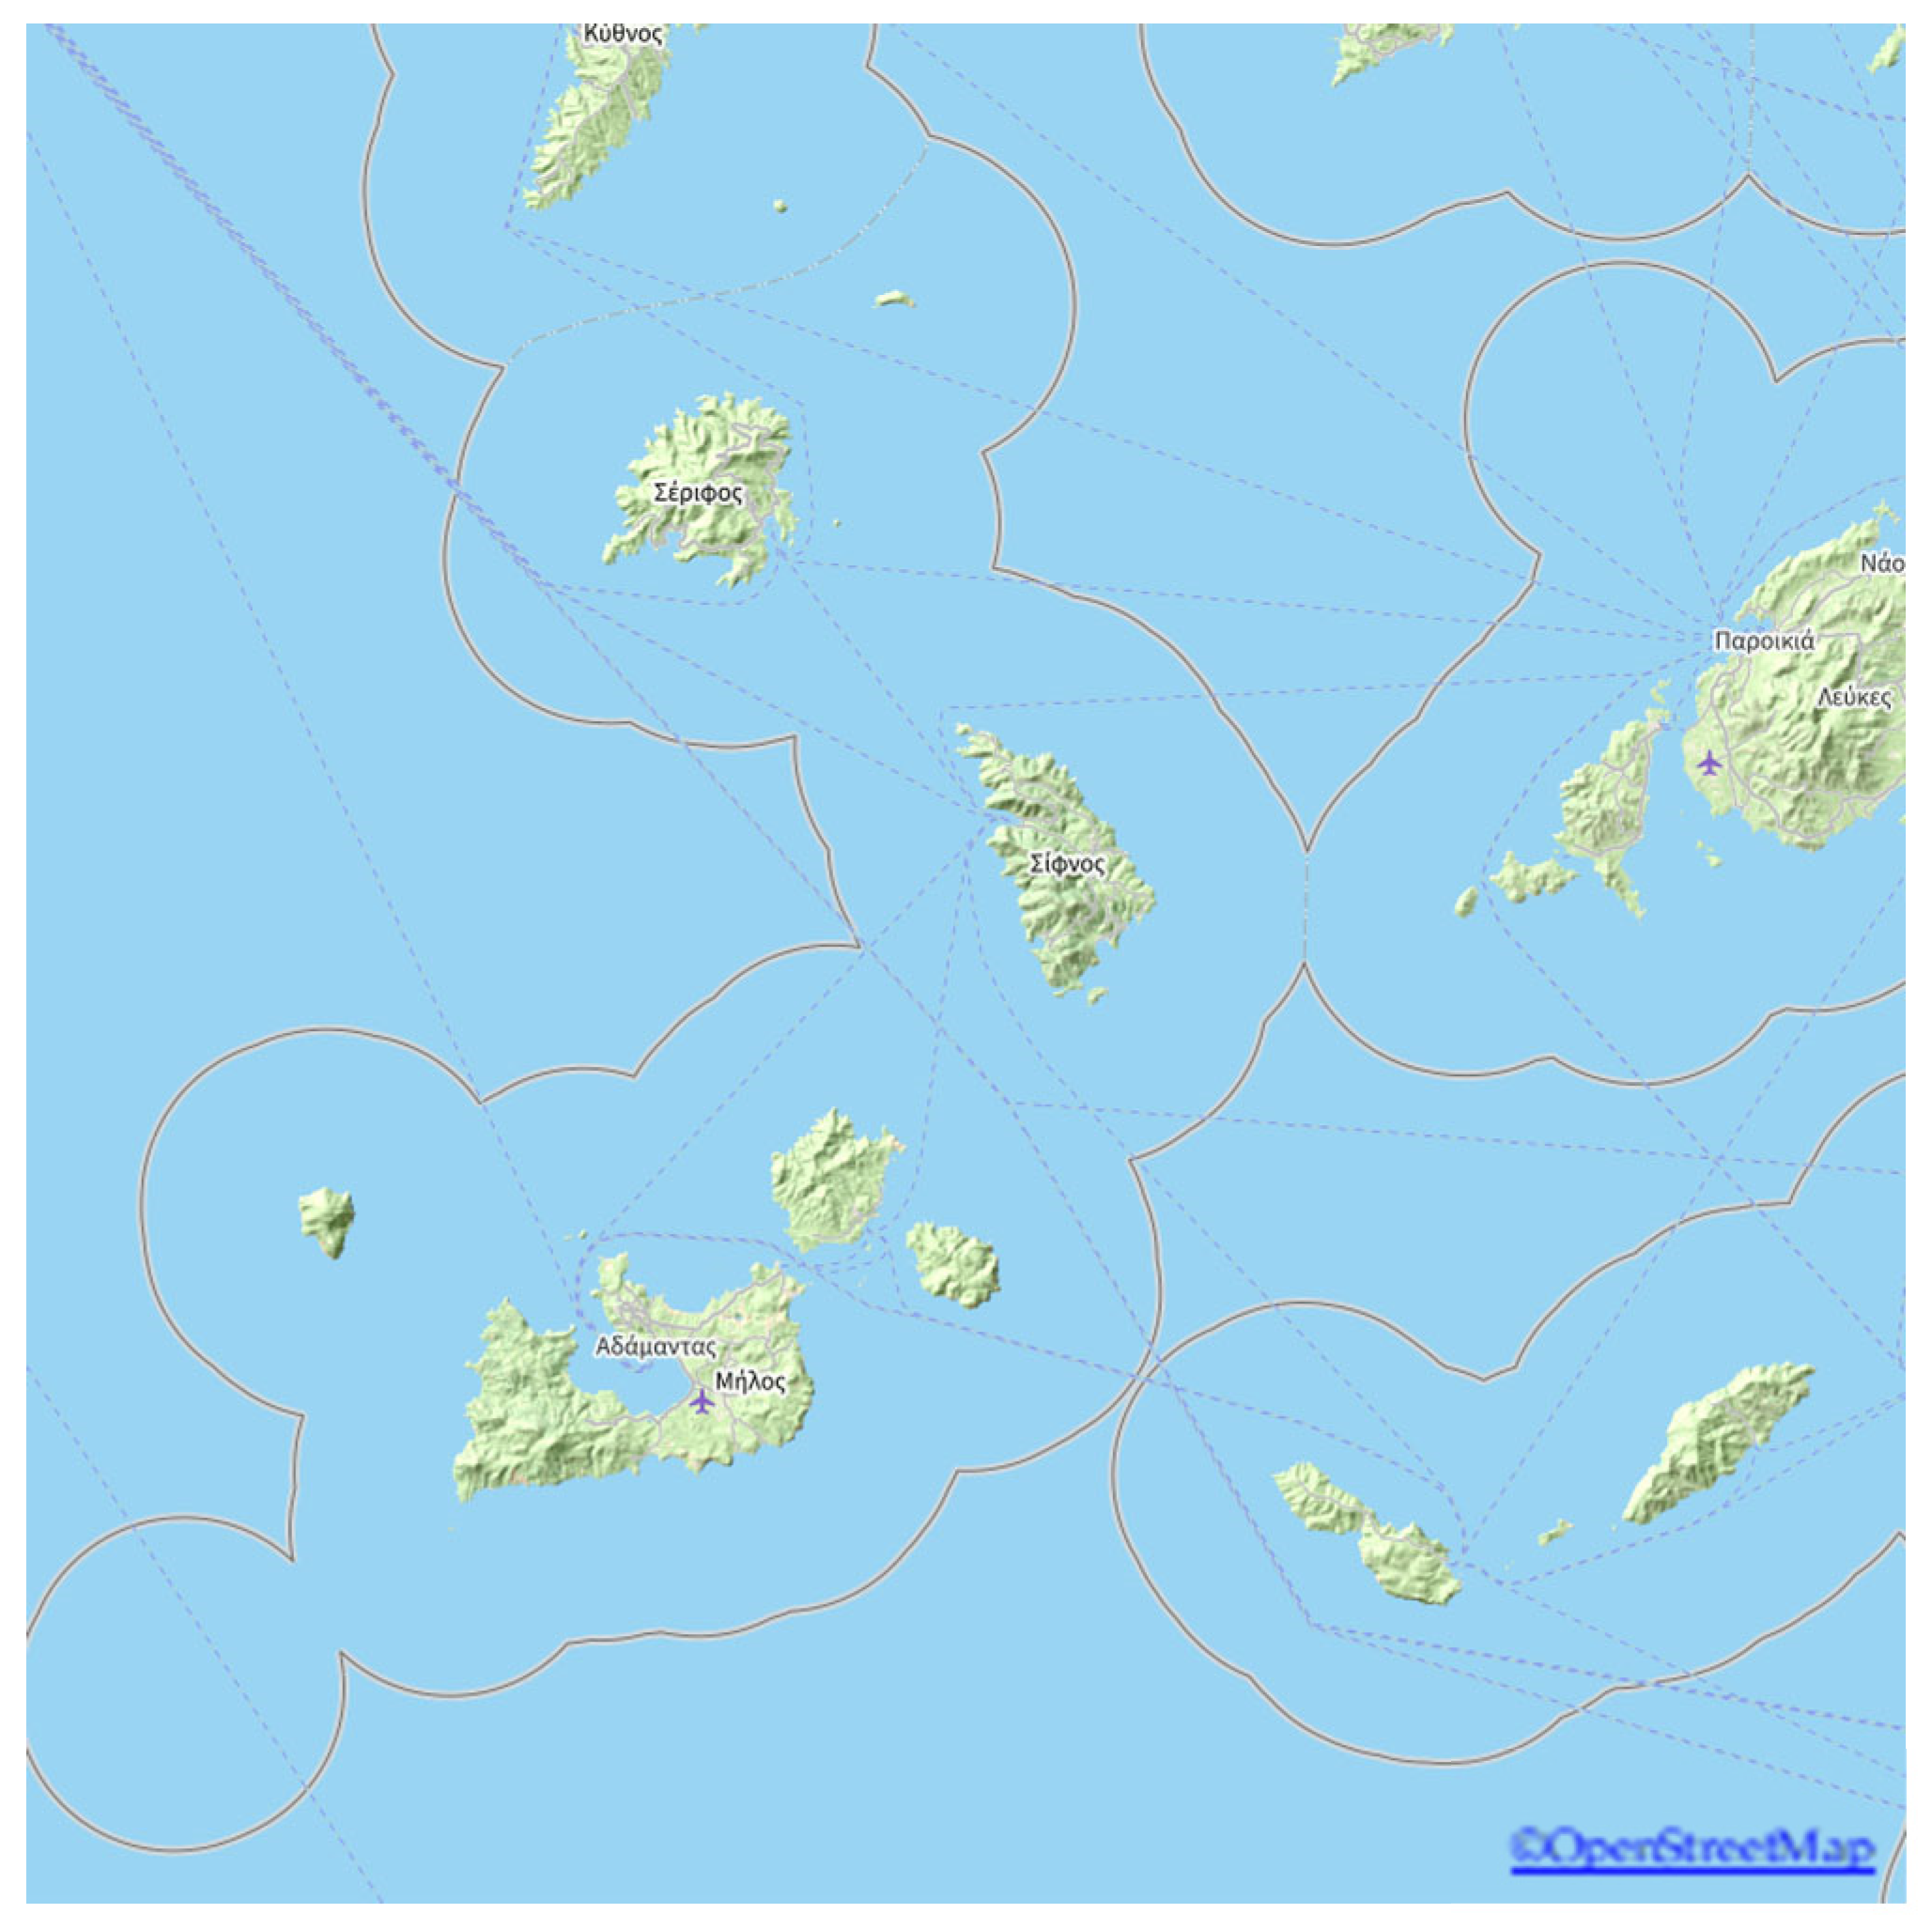
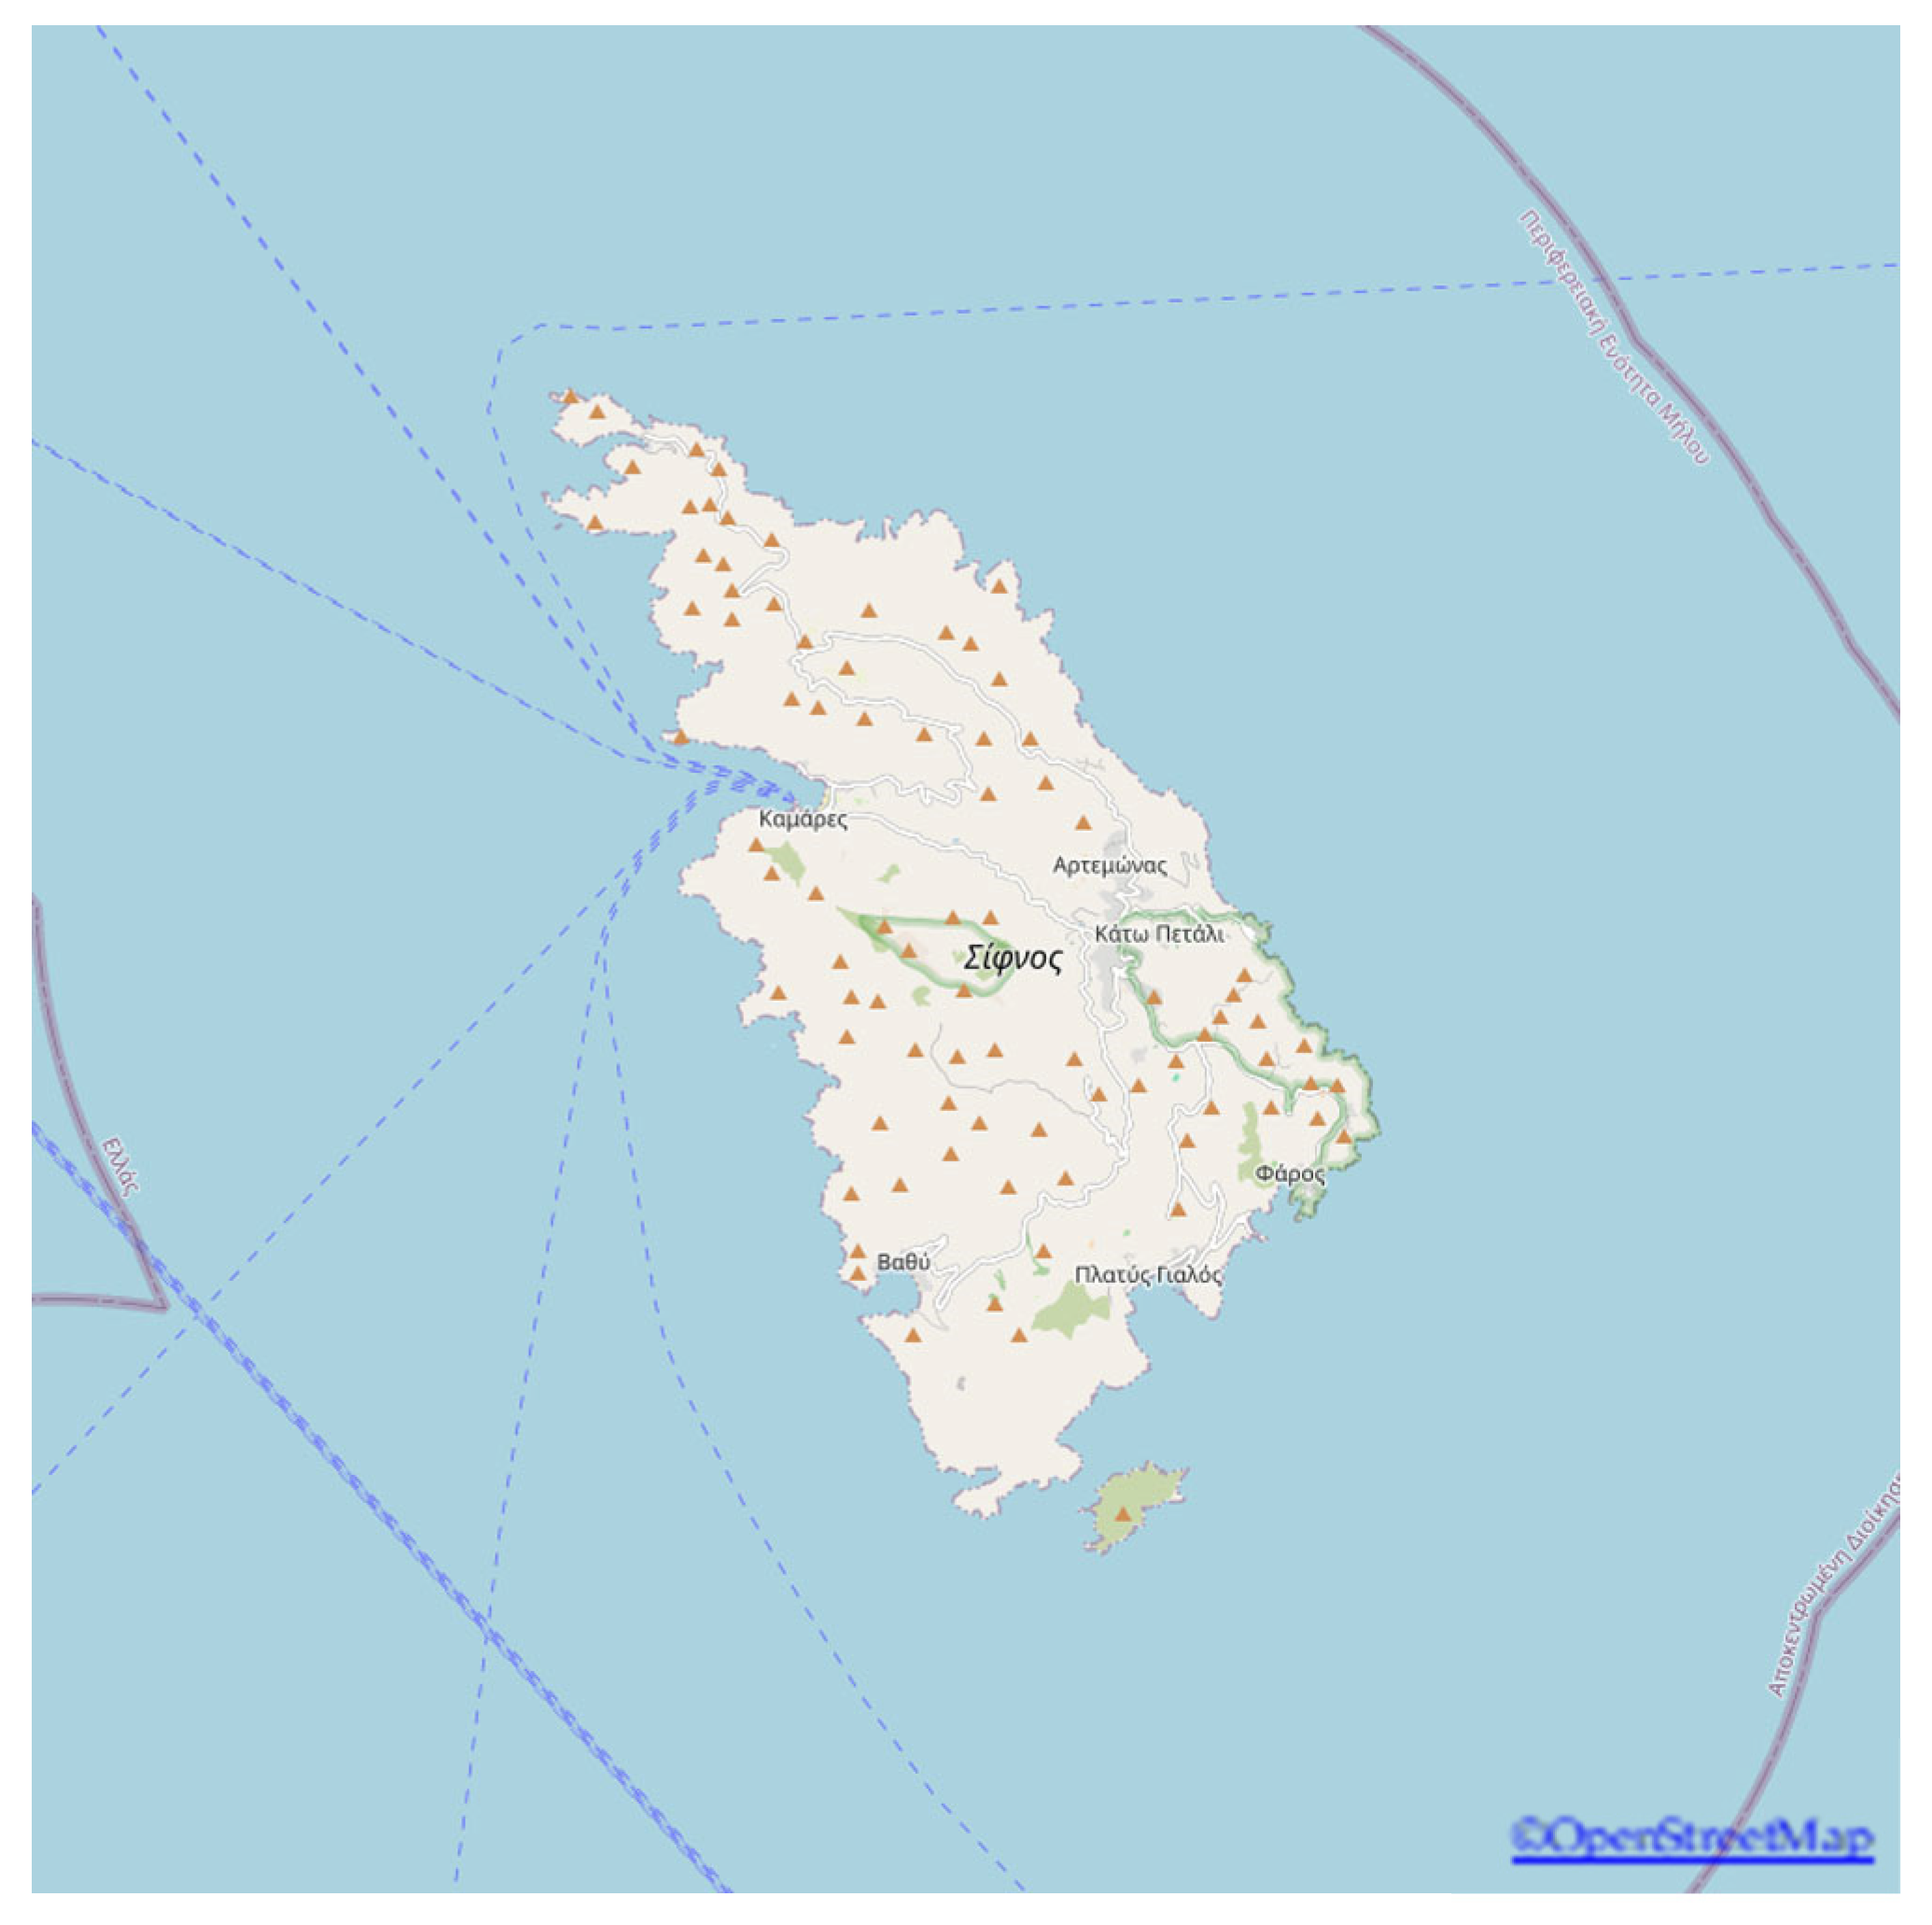
2. Description of Sifnos Island

This case study of green hydrogen production management will take place on the island of Sifnos. This is primarily due to the island’s substantial wind potential, as well as the intensity of solar radiation. Furthermore, as part of the development of green and environmentally friendly energy in Greece, especially on the islands, there has been, and will continue to be, a growing penetration of renewable energy sources, with the main sources being wind and photovoltaic parks.
In the future, the production of electricity on the island of Sifnos will depend to a significant extent on renewable energy sources combined with energy storage units, as a large portion of the island’s thermal units will be phased out.
The island of Sifnos is located in the Cyclades, specifically neighboring the islands of Serifos, Antiparos, and Kimolos, as shown in Figure 1 [21]. It covers just 74 square kilometers and belongs to the Cyclades prefecture, with its capital being Ermoupoli on the island of Syros. Additionally, its coastline extends for approximately 70 km, with a permanent population of approximately 2700 residents. More specifically, the village where renewable energy sources cover the electricity demand is called “Kastro”. This village has 118 permanent residents and is situated on the summit of a steep hill near the eastern coast of the island, at an altitude of 80 m.
In general, the road network on Sifnos is quite good and convenient. The official road starts from the port area in the Kamares region and extends to the island’s capital, Apollonia. From there, roads lead to the other areas of the island, making transportation easy and quick, with a travel time of less than an hour from the northernmost to the southernmost part, as shown in Figure 2.
The island offers ample space for energy utilization, primarily in the context of renewable energy sources. Specifically, areas like Chersonisos and Kamares have been identified as suitable locations with significant wind potential and good solar data annually. For this reason, some wind and photovoltaic stations have already been installed, as well as hybrid systems. In the future, many investors are expected to undertake investments in renewable energy sources. The municipality’s goal is for Sifnos to become the first island with near-exclusive use of electric energy from renewable energy sources and an energy storage system through pumping or other feasible investments.

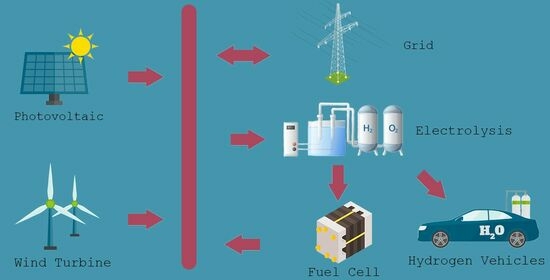
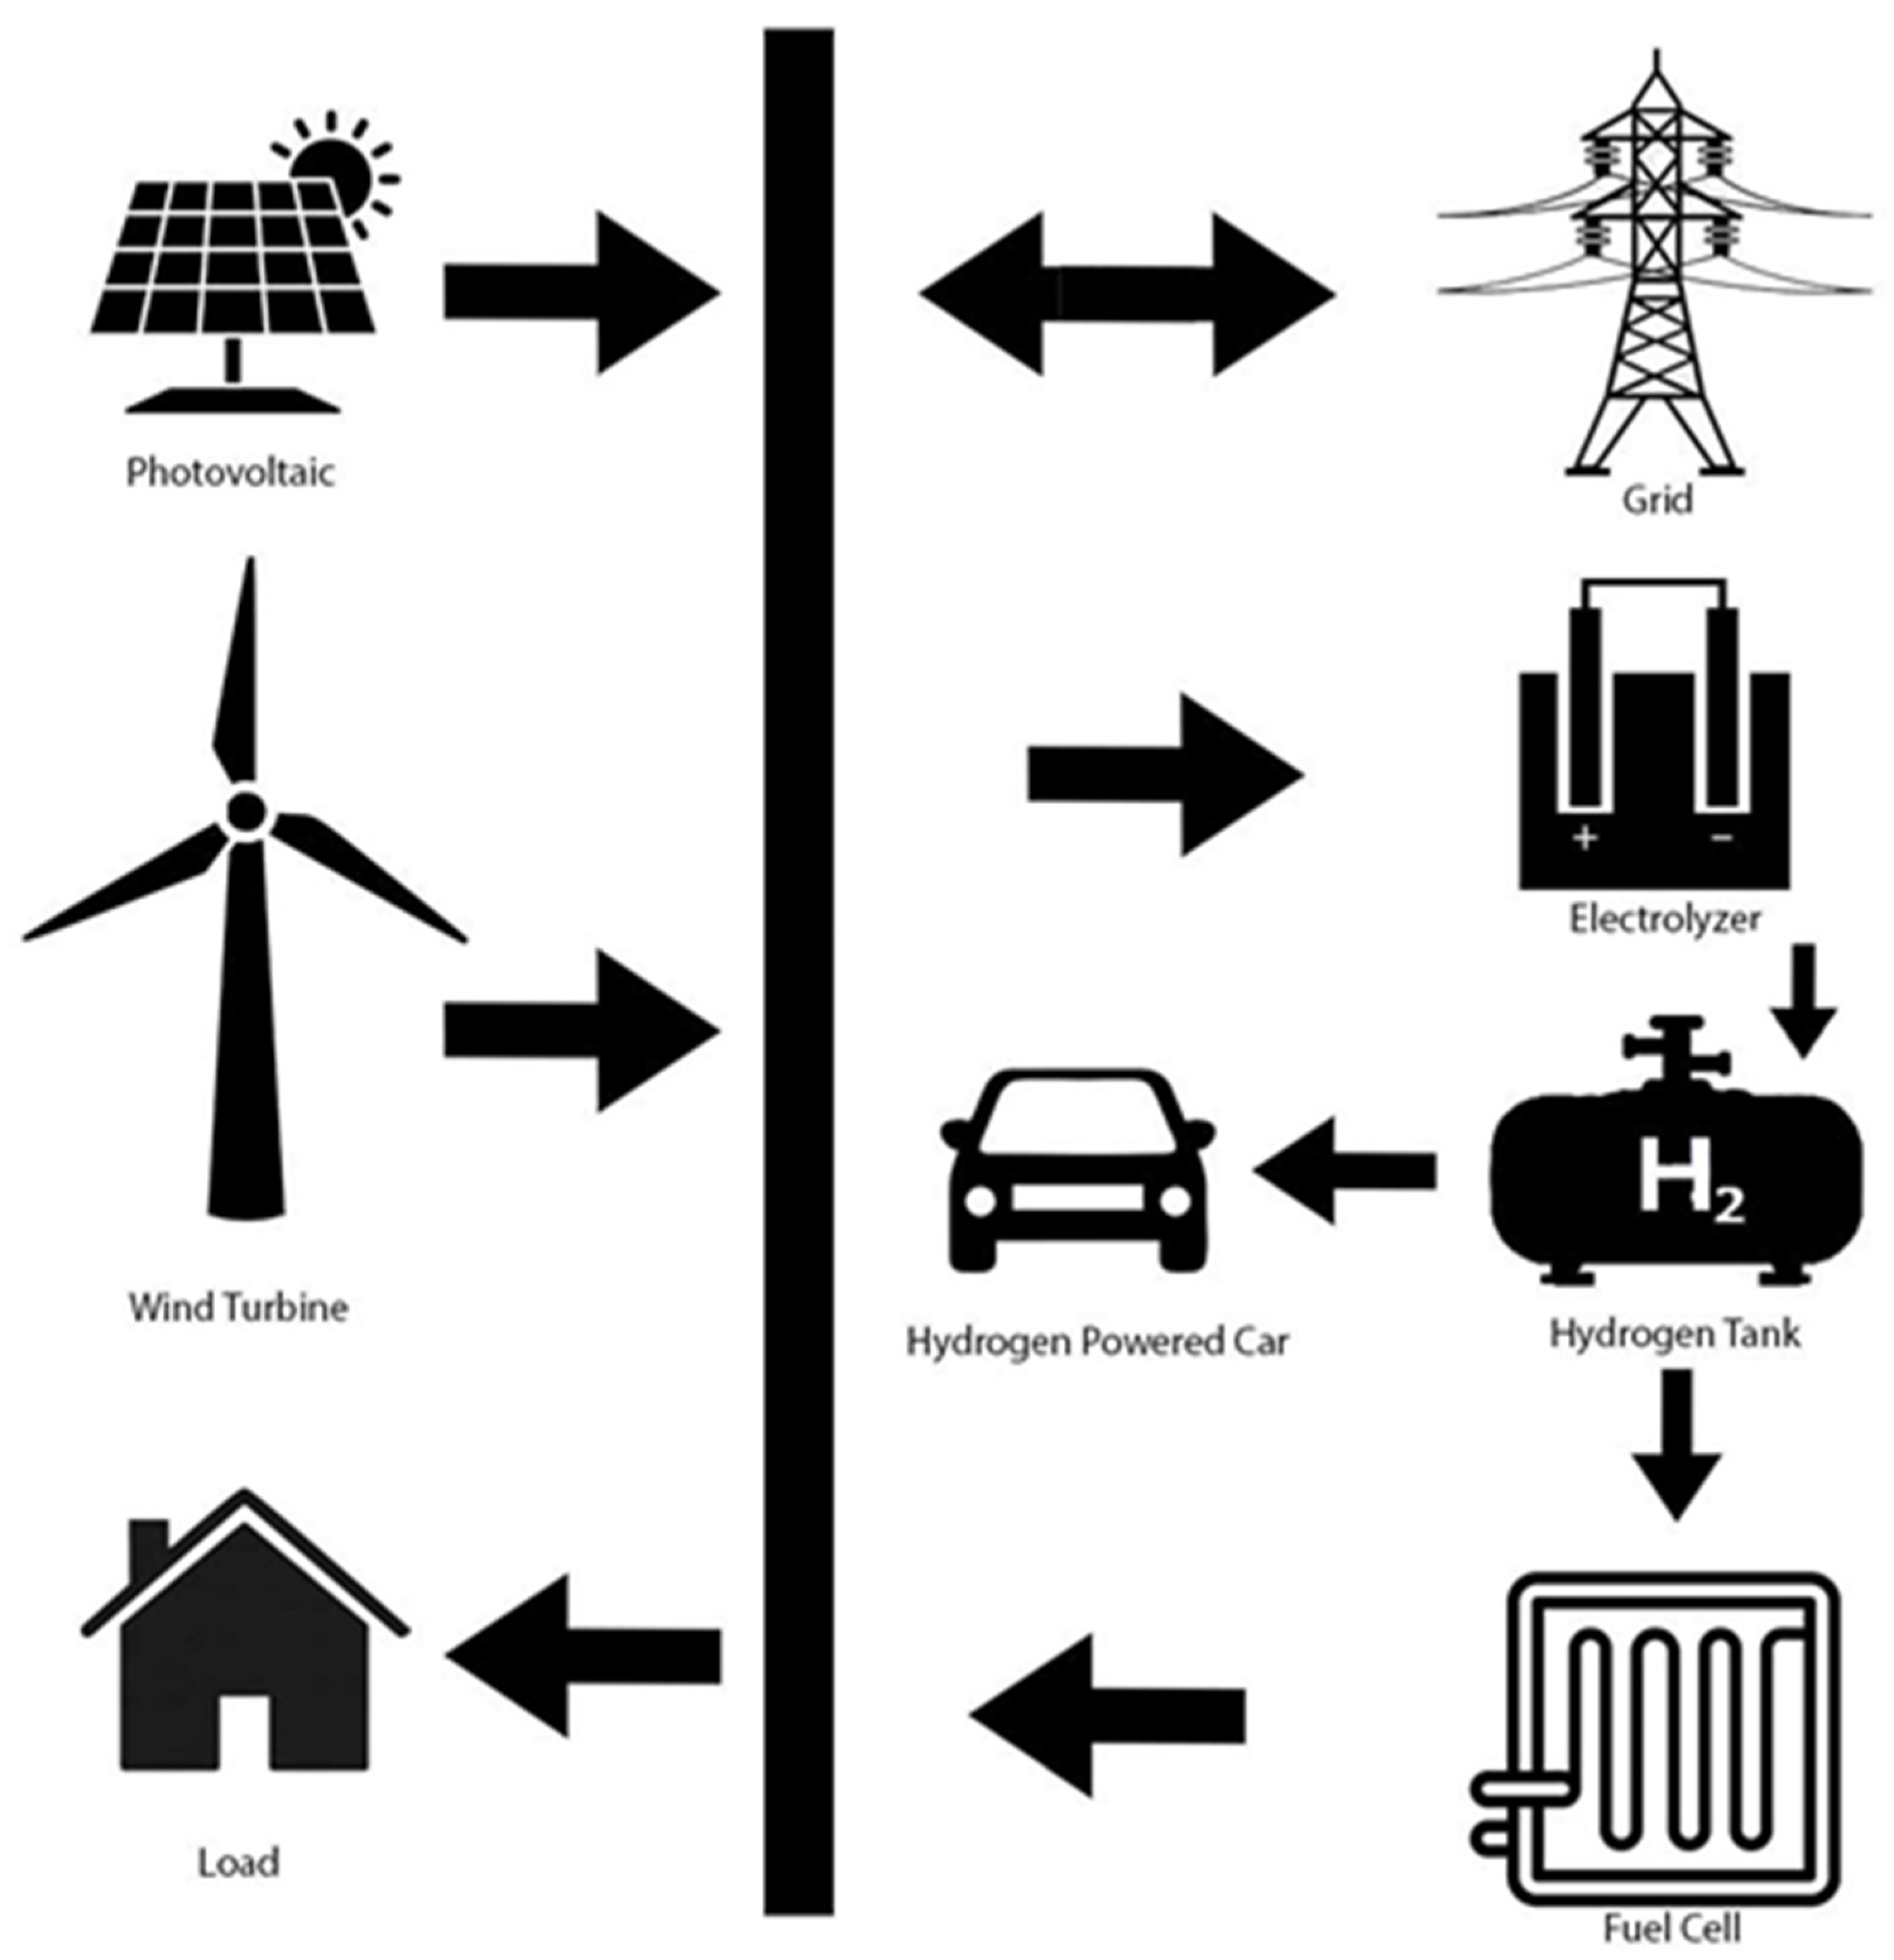
3. Component Description of the Proposed Hybrid Power System, Methodology and Mathematic Formulation, and Cost Analysis

3.1. Description of the Proposed Hybrid Power System

The proposed system consists of one WT plant, one PV plant, a hydrogen production and storage facility, a fuel cell (FC), and the local load consumption (electrical load demand and hydrogen vehicles). All these elements are connected to a power grid, which is assumed to be able to cover the need when the RES units do have not sufficient production to do so. A wind turbine with 200 kW power is located at the point of the island with the greatest wind potential. A photovoltaic park with a power of 50 kW is also located on the island. These two renewable energy sources (RESs) are connected to each other and provide energy to the entire island.
The RES production is used to cover the load demand of the island. Any excess energy is used to produce hydrogen. This is achieved using a 64.5 kW electrolysis unit. The hydrogen is then stored in a storage unit with a volume of one cubic meter and a pressure of 700 bar.
This system offers a number of advantages. First, it utilizes renewable energy sources to produce hydrogen, which is a clean and sustainable fuel. Second, it helps to reduce the island’s reliance on fossil fuels. Third, it can provide a stable source of energy even when the wind or solar conditions are not ideal.
The system is still in the early stages of development, but it has the potential to be a valuable asset for islands that are looking to reduce their reliance on fossil fuels. The whole system is depicted in Figure 3.
The advantages of using a hybrid wind and photovoltaic system include increased energy production, improved reliability, reduced environmental impact, and cost savings. The challenges and limitations of using a hybrid wind and photovoltaic system include the complex design, land-use requirements, intermittency, maintenance and repair, and limited scalability [9,13].

3.2. Electrolysis for Hydrogen Production—Electrolyzers and Compressor

Electrolysis is a process that uses electricity to split water molecules into hydrogen and oxygen. The process occurs in an electrolyzer, which consists of two electrodes (an anode and a cathode) separated by a membrane. When an electric current is passed through the water, the hydrogen ions (H+) are attracted to the cathode, while the oxygen ions (O2) are attracted to the anode. The ions then react at the electrodes to form hydrogen and oxygen gas [10].
There are three main types of electrolyzers [10]: (a) alkaline electrolyzers—the oldest and most mature technology for electrolysis and are often used for industrial-scale hydrogen production [22], (b) polymer electrolyte membrane (PEM) electrolyzers—a newer technology that is gaining popularity due to its high efficiency, rapid response time, and compact size; PEM electrolyzers are often used for small-scale hydrogen production, such as for fuel cell vehicles [23], (c) solid oxide electrolyzers, which operate at high temperatures (800–1000 °C) and can achieve very high efficiencies but are still in the research and development stage [24].
The efficiency of electrolysis is affected by several factors, including the energy input, electrolyte concentration, temperature, and catalysts [25,26].
The model proposed for the electrolyzer and compressor (and their respective equations) in this study is the same as that presented by Greiner, Korpas, and Holen [27]. This is where the electrolyzer and compressor are combined.
According to Equation (1), the electrolyzer power (Pelectrolyzer—kW) is related to the mass flow rate of hydrogen (Melectrolyzer,H2—kg/h).
Pelectrolyzer (t) = SPCelelctrolyzer * Melectrolyzer,H2 (t)
According to Equation (2) the H2 mass storage (Ms,H2—kg/h) balance is as follows:
Ms,H2 (t) = Ms,H2 (t − 1) + Melectrolyzer,H2 (t)
The H2 mass storage is limited by the minimum and maximum levels allowed (Equation (3)).
Ms,H2 (min) ≤ Ms,H2 (t) ≤ Ms,H2 (max)
Therefore, the specific power consumption of the electrolyzer (SPCelectrolyzer,H2—kWh/kg) is taken as a summation of the individual power consumptions of the electrolyzer and the compressor.
The production of 1 kg of H2 at 25 degrees Celsius requires 39.40 kWh divided by the efficiency according to [4]. The power consumption of the compressor is 2.38 kWh/kgH2 to bring H2 to 700 bar.

3.3. WT and PV

For the power of the wind turbine (PWT), the wind speed data for every hour of the year are retrieved. Table 1 shows the parameters used to calculate the wind power.
Equations (4)–(7) give the wind power generated each timestep using the parameters of Table 1:
PWT (t) = 0    if V < Vci
PWT (t) = 1/2 * ρ * A * V(t)3 * Cp * EffAD    if Vci ≤ V < Vr
PWT (t) = Pr    if Vr ≤ V ≤ Vco
PWT (t) = 0    if V > Vco
where V(t) is the airspeed at a given time, and Pr is the nominal power of the wind turbine. Therefore, the wind production for every timestep is calculated.
If the collected wind speed data are related to the height of, e.g., 10 m, but calculations require wind speed at a different height (the height of the turbine blades), then we use the following conversion: V2/V1 = (H2/H1)h, where V2 is the wind speed at the height H2 (which is the height of the turbine blades), and V1 is the wind speed at the height H1 (the height of measurement), and h is the power law coefficient, which must be calculated (or it is given for a specific area, e.g., for Sifnos, it is h = 0.2) [28].
Table 1. WT parameters of VESTAS 200 kW [29].
Wind Turbine Parameters
Swept area of the rotor (m2)—A491
Diameter of the turbine (m)— d 25.0
Cut-out turbine power (kW)—Pr200
AD converter efficiency—EffAD0.98
Rated speed (m/s)—Vr13.8
Maximum performance coefficient— C p 0.59
Cut-in speed (m/s)— V c i 3.8
Air density (kg/m3)—ρ1.225
Cut-out speed (m/s)— V c o 25
Height of the wind turbine (m)—H30

3.4. PV, FC, Load Demand, and Hydrogen Vehicle Consumption

The PV production, fuel cell performance, load demand, and hydrogen vehicle consumption are retrieved through an Excel file to be used in the main algorithm (see the below diagrams).

3.5. Cost Analysis and LCOE Calculation [30,31,32]

The cost analysis of the hybrid system is carried out via the MATLAB program. A 20-year lifespan is assumed for the hybrid system. The major components (WT + PV) will not need to be replaced within the first 20 years of operation and, lastly, we assume an interest rate of 7% and inflation of 2%.
According to Equation (8), the total cost of a component (TC_C) in EUR is the cost in EUR per kilowatt or per kilogram (C) of each component of the hybrid system multiplied by the power rated (PR) of the component. Then, for the calculation of the operational and maintenance cost per component, we use Equation (9).
TC_C = C * PR
MOC = (%C) * PR
The maintenance and operational costs (MOC) are the product of a defined percentage (%) of the C and the PR (%EUR/kW * kW).
Then, we proceed by setting the replacement year for every component of the system. With that in mind, we calculate how many times every component needs replacement. The replacement cost was calculated first in the future, and then we brought it back to the present with Equations (10) and (11), respectively.
Crep_future = C * (1 + inf)nrep
Crep = Crep_future * (1 + r)nrep
The replacement cost in the future (Crep_future) is the cost per kilowatt or kilogram multiplied by expression one plus inflation (inf) to the power of the lifespan of the component (nrep). Now, the replacement cost at present (Crep) is the replacement cost in the future (Crep_future) multiplied by expression one plus the interest rate (r) to the power of the lifespan (nrep). So, the total replacement cost of a component can be calculated using Equation (12).
Ct,rep = n_rep * Crep * PR
The total replacement cost of one component (Ct,rep) is the number of replacements (n_rep) multiplied by the replacement cost at present (Crep) multiplied by the power rating of each component (PR). Therefore, for the calculation of the LCOE, we used Equation (13).
L C O E = T C _ C + 1 n M a i n t e n a n c e   C o s t   +   R e p l a c e m e n t   C o s t ( 1 + r ) n 1 n T o t a l   E n e r g y   o f ( W T   +   P V ) ( 1 + r ) n
The calculation of the levelized cost of electricity (LCOE) requires the sum of all the initial costs (TC_C) plus all the operational and maintenance costs (maintenance) and all the replacement costs (replacement) divided by expression one plus the interest rate (r) to the power of the years the project takes place (n). Then, we divide all the costs with the fraction of the total electrical energy (total energy of WT and PV) for all the years of the project divided by expression one plus the interest rate (r) and all to the power of the years the project takes place (n).
Two other important equations are (14) and (15). The capital recovery factor (CRF) is the ratio of constant earnings to the present value of receiving those earnings for a given length of time. The real interest rate (RIR) is the interest without inflation, where i is the interest rate and t represents the years.
C R F = i 1 + i t 1 + i t 1 ,
RIR = ((1 + Nominal Interest Rate)/(1 + Inflation Rate)) − 1

4. The Implemented Management Algorithm of the Proposed Hybrid Power System

The algorithm commences by acquiring the anticipated hydrogen demand for the day from the input. Subsequently, it assesses the current hydrogen inventory within the storage container. If the stored hydrogen quantity is sufficient to meet the demand, the vehicles are promptly served. Conversely, if the stored hydrogen is inadequate, the algorithm prioritizes dispensing the available hydrogen and records the deficit. The algorithm then aggregates the renewable energy sources (RESs) and utilizes them to address the load requirements. If surplus power remains after the load demand is fulfilled, then it is redirected toward hydrogen production. Subsequent to the load assessment, the algorithm evaluates the container’s fullness. If the container is at its maximum capacity, then the surplus energy is directed towards the grid. Otherwise, the surplus energy is utilized to replenish the container’s hydrogen reserves until its capacity is reached. If, upon reaching its maximum capacity, excess energy persists, then it is transmitted to the grid. In the event that the renewable energy sources are incapable of meeting the load demand, the algorithm verifies the availability of sufficient hydrogen within the container to cover the shortfall. If the requisite hydrogen quantity is present, then a fuel cell is employed to convert the hydrogen into electricity, effectively addressing the load deficit. However, if the necessary hydrogen is unavailable, then the available hydrogen is converted into electricity, and the remaining energy deficit is supplemented via drawing power from the grid. In the absence of any hydrogen reserves, the entire energy requirement is sourced from the grid. A simplified flowchart presentation of the applied algorithm is presented in Figure 4.

5. Data and Assumptions

5.1. Assumptions and Input Data

The following subsections present all the assumptions and input data based on the flowchart proposed for the management of the proposed hybrid system. The input data are hourly for one year, as are the results. Characteristic graphical representations are provided on a monthly basis, per hour, or for an average 24 h period in a month. All graphical representations, data, and results come from suitable programs and code in the MATLAB 2022b language.

5.1.1. Assumptions

  • On a yearly basis, the hourly data of the wind speed are at 10 m height, and we increased them to 30 m as the hub of the wind turbine VESTAS 200 kW, Table 1 (PVGIS—Year 2020 [33]).
  • The installed capacity of the PV is 50 kWp, and the data production comes from [33] (year 2020).
  • Load consumption data (charts with the 24 average hours of a month in 30 or 31 days in 24 h using random ±10% fluctuations) [34,35,36].
  • Data for the electrolysis system and the tank are produced from the algorithm.
  • Data for the consumption by the hydrogen-powered car Toyota Mirai.
  • Economic data for the investment are based on the current prices of the market and in international studies [37,38].
For this study, with the given system on Sifnos Island, the first thing that must be carried out is the obtention of the necessary data.

5.1.2. Input Data

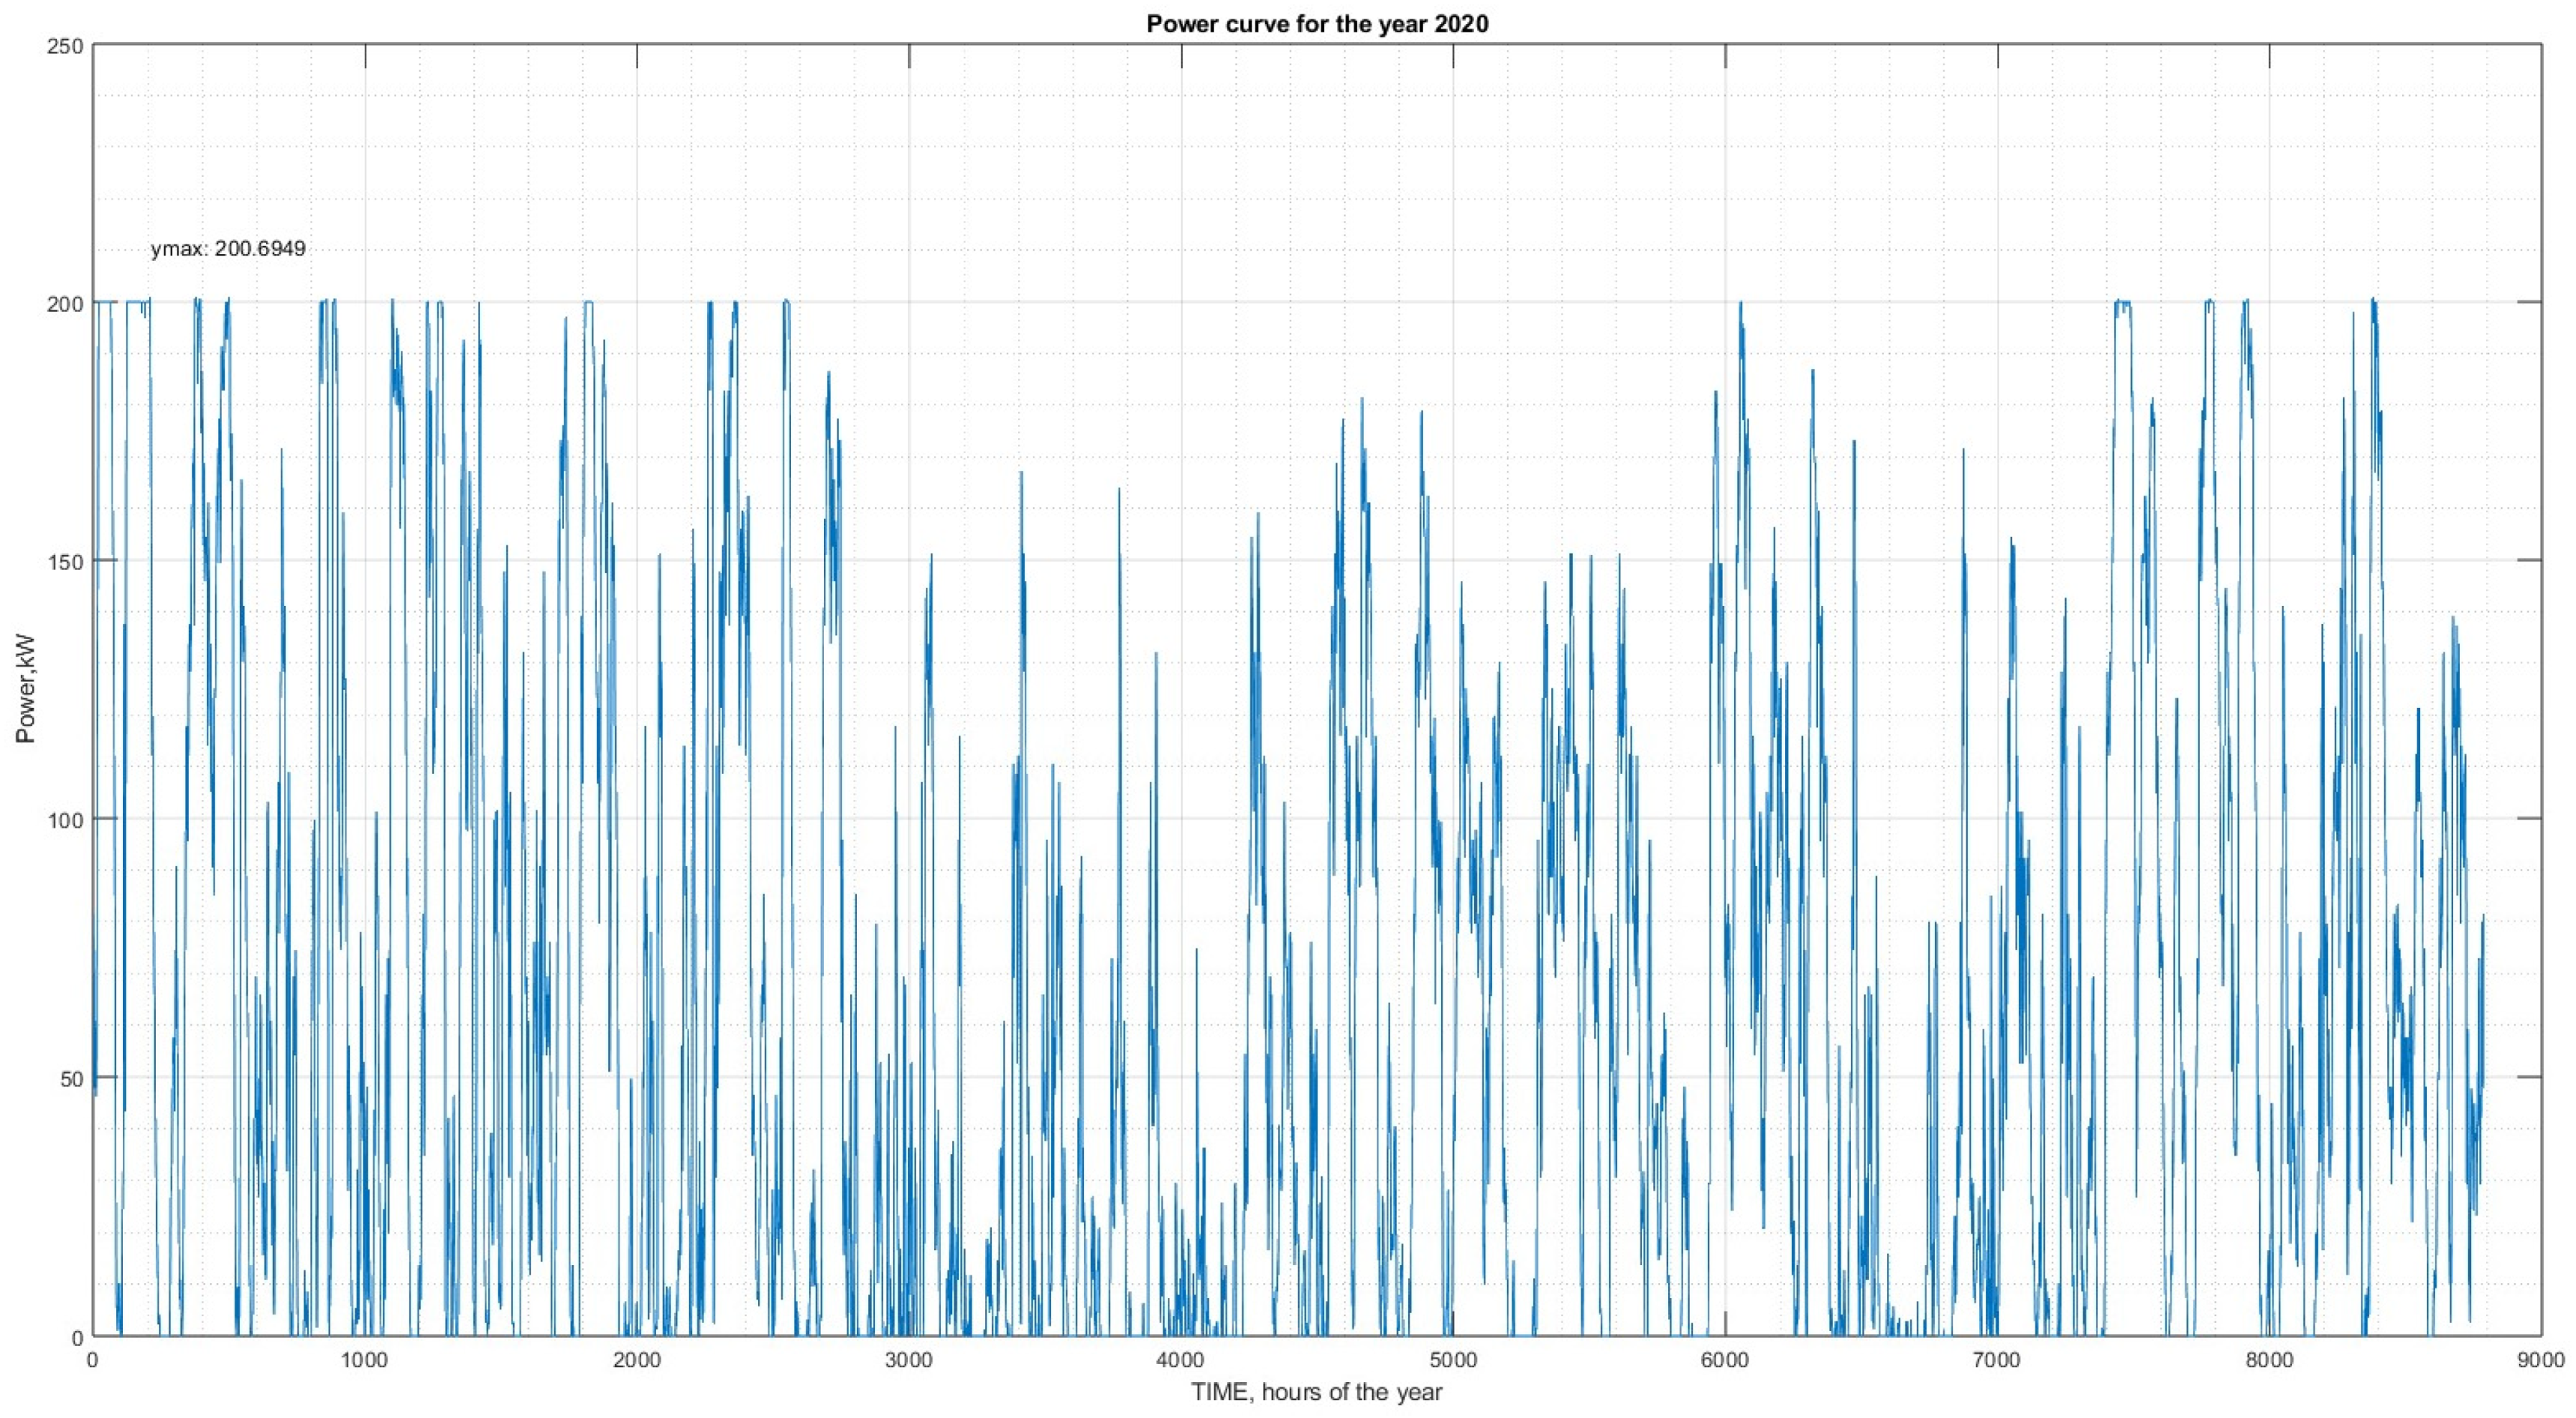
  • PWT (wind turbine installed capacity) = 200 kW—VESTAS.
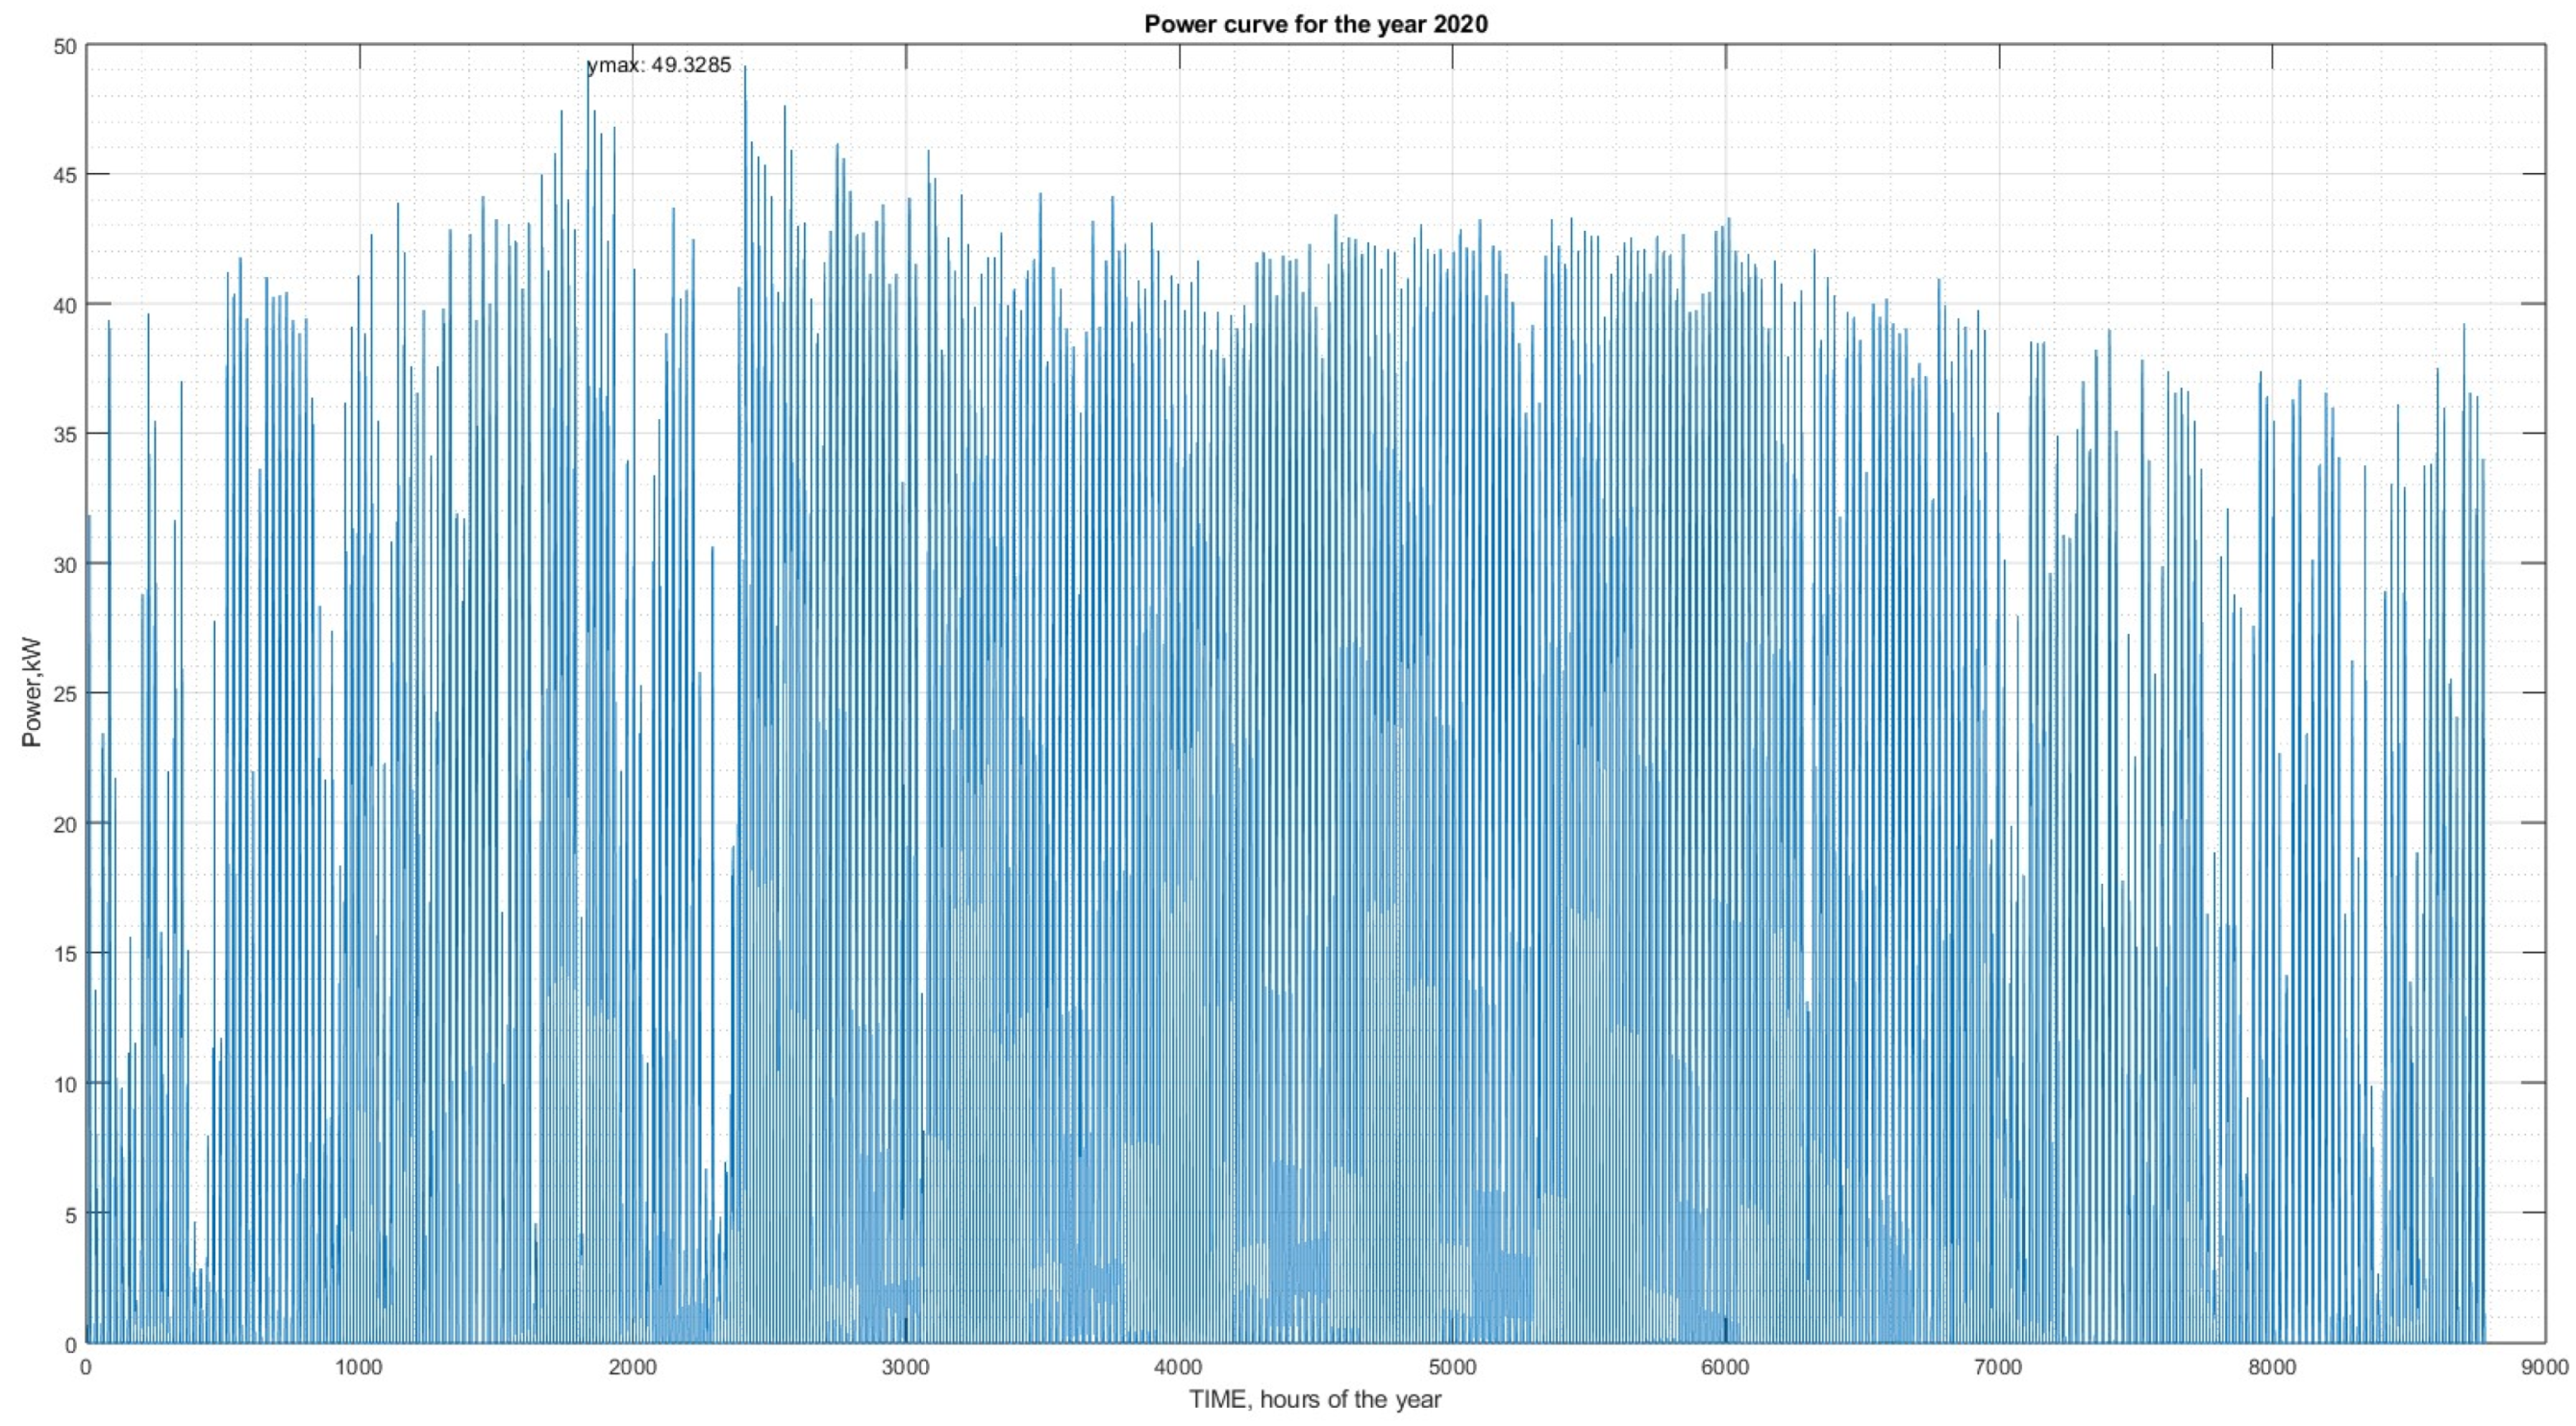
  • PPV (photovoltaic installed capacity) = 50 kW.
  • Electrolyzer = 236 kVA, 64.5 kWh/kg, 65 kg/24 h, nelectrolyzer = 61%, nFC = 50%.
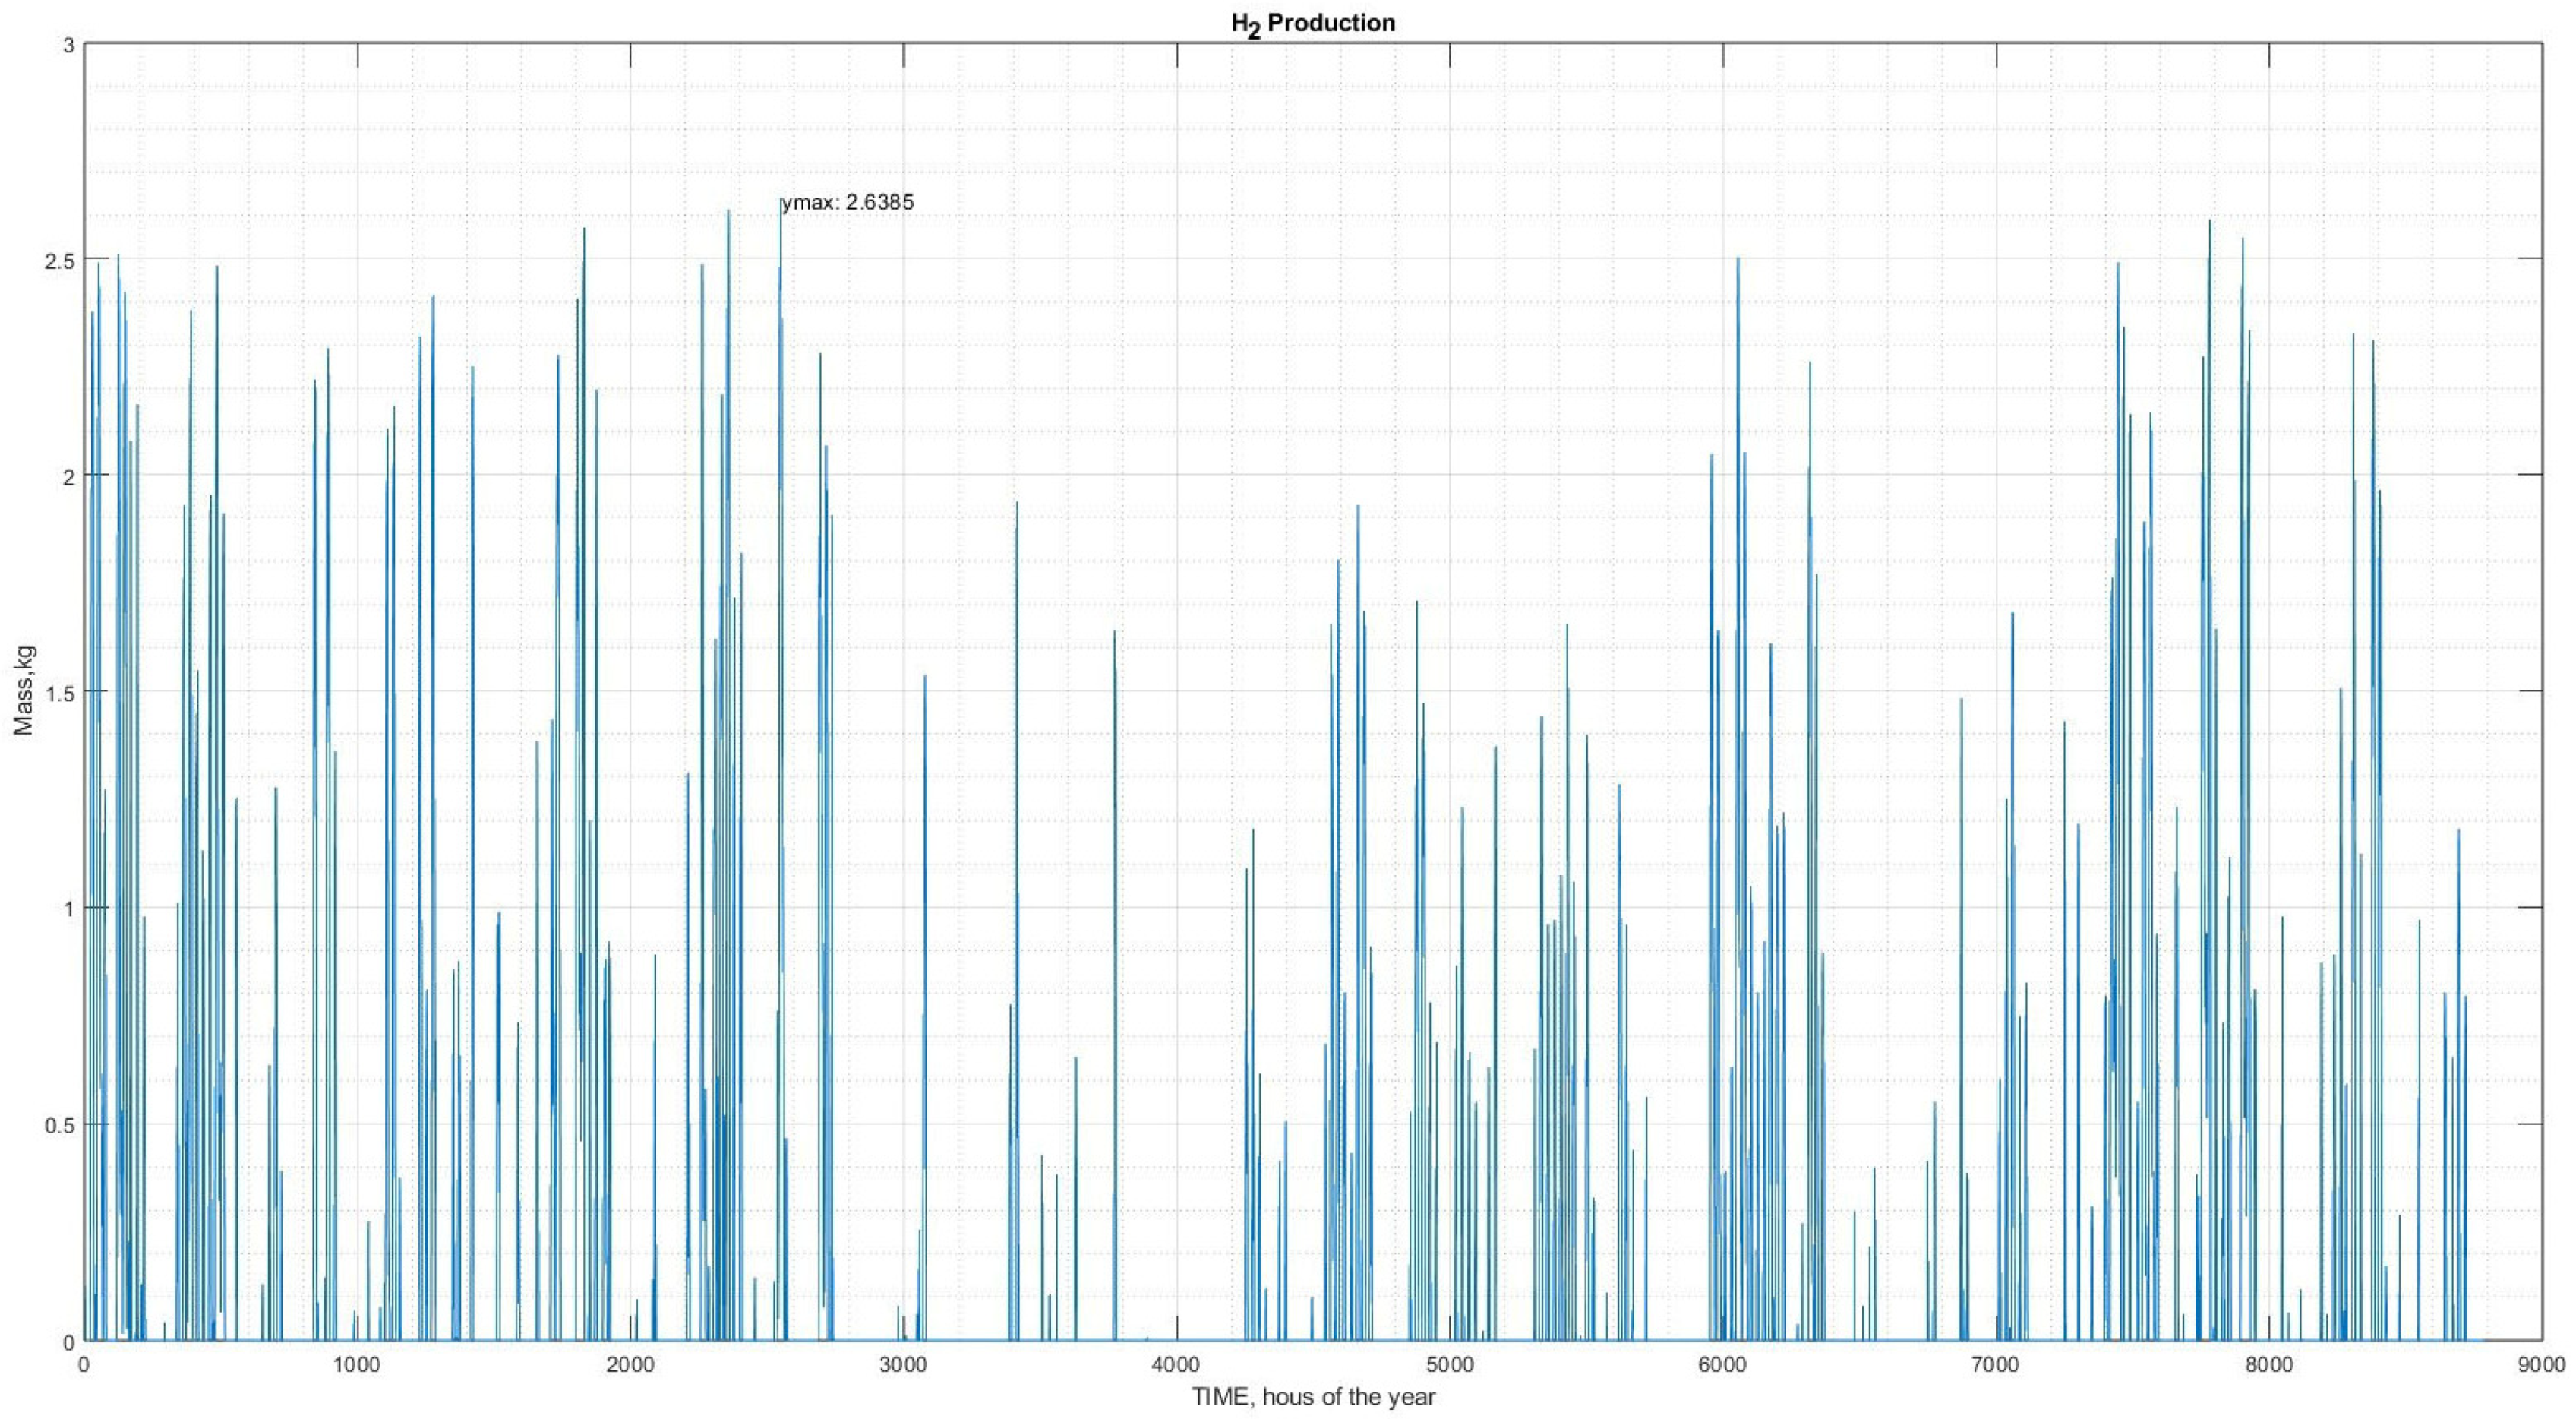
  • Max hydrogen mass production = 2.6 kg/h.
  • Compressor consumption (2.38 kWh/kg).
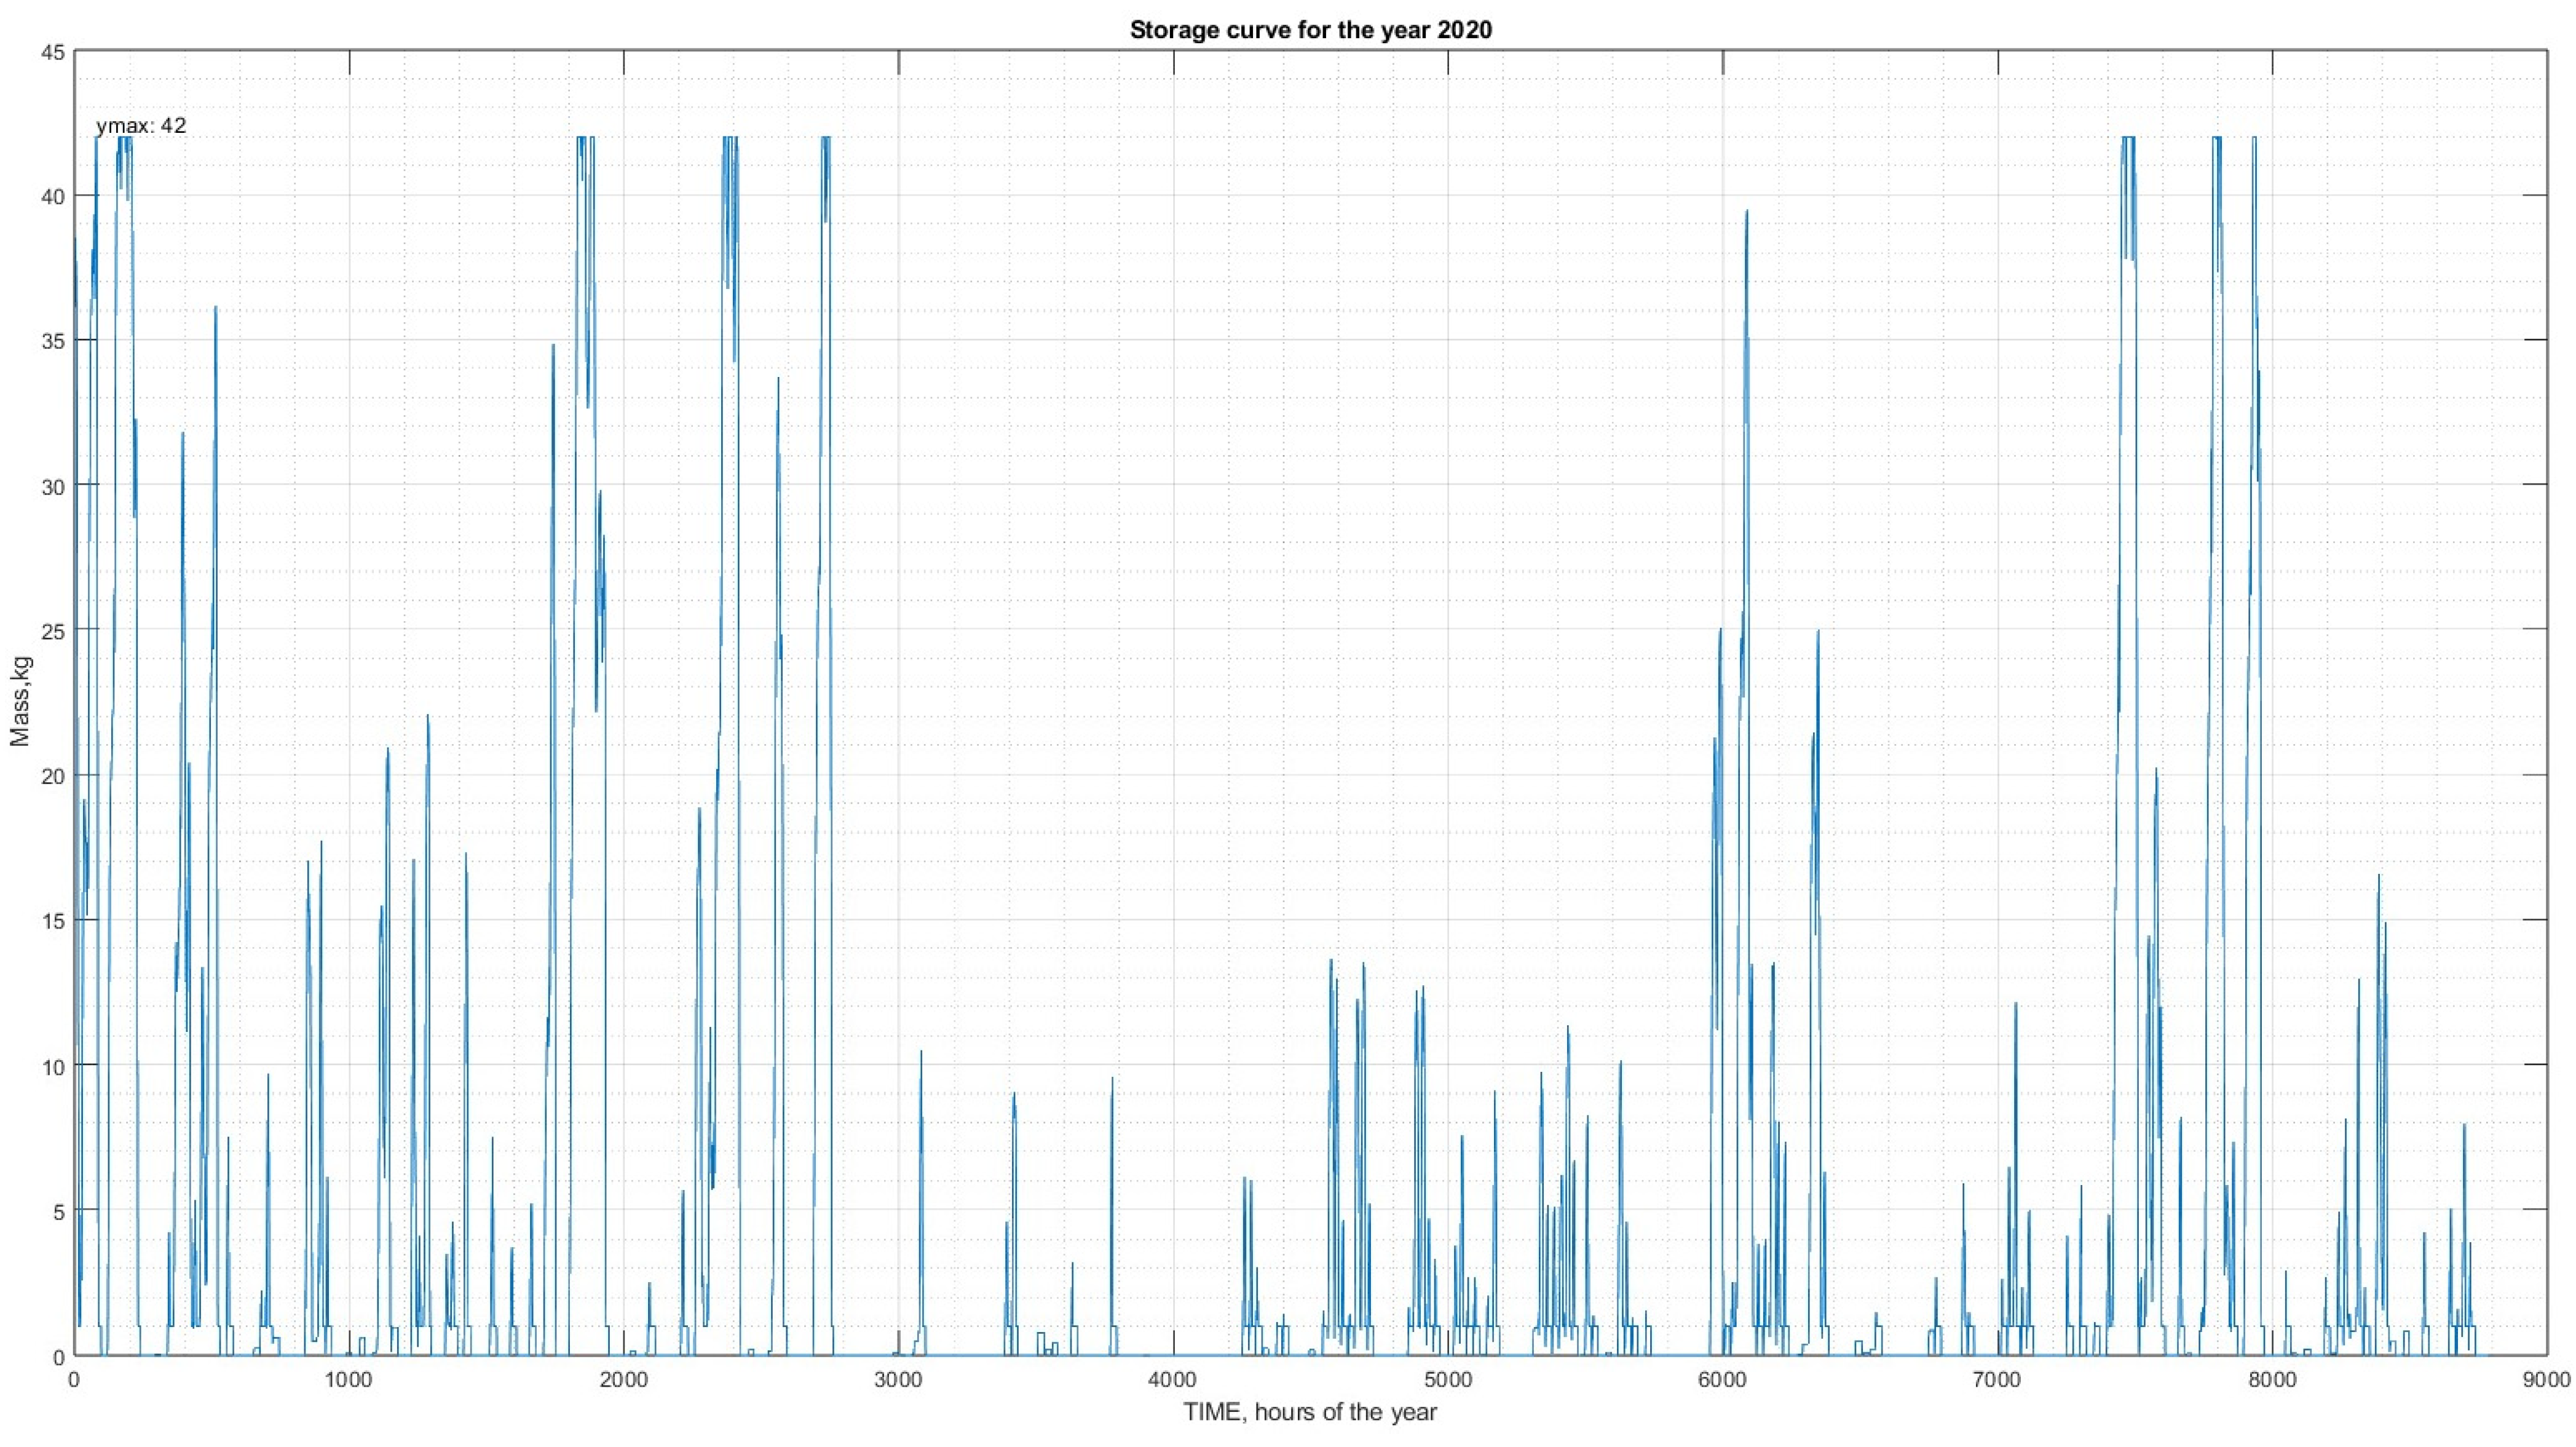
  • Tank storage H2 (42 kg, 700 bar, 1 m3). The hydrogen tank production must remain between 1–42 kg (700 bar, 1 m3).
  • Controller + inverter (200 + 50 + 64.5 + 2.38) kW = 316.88 kW

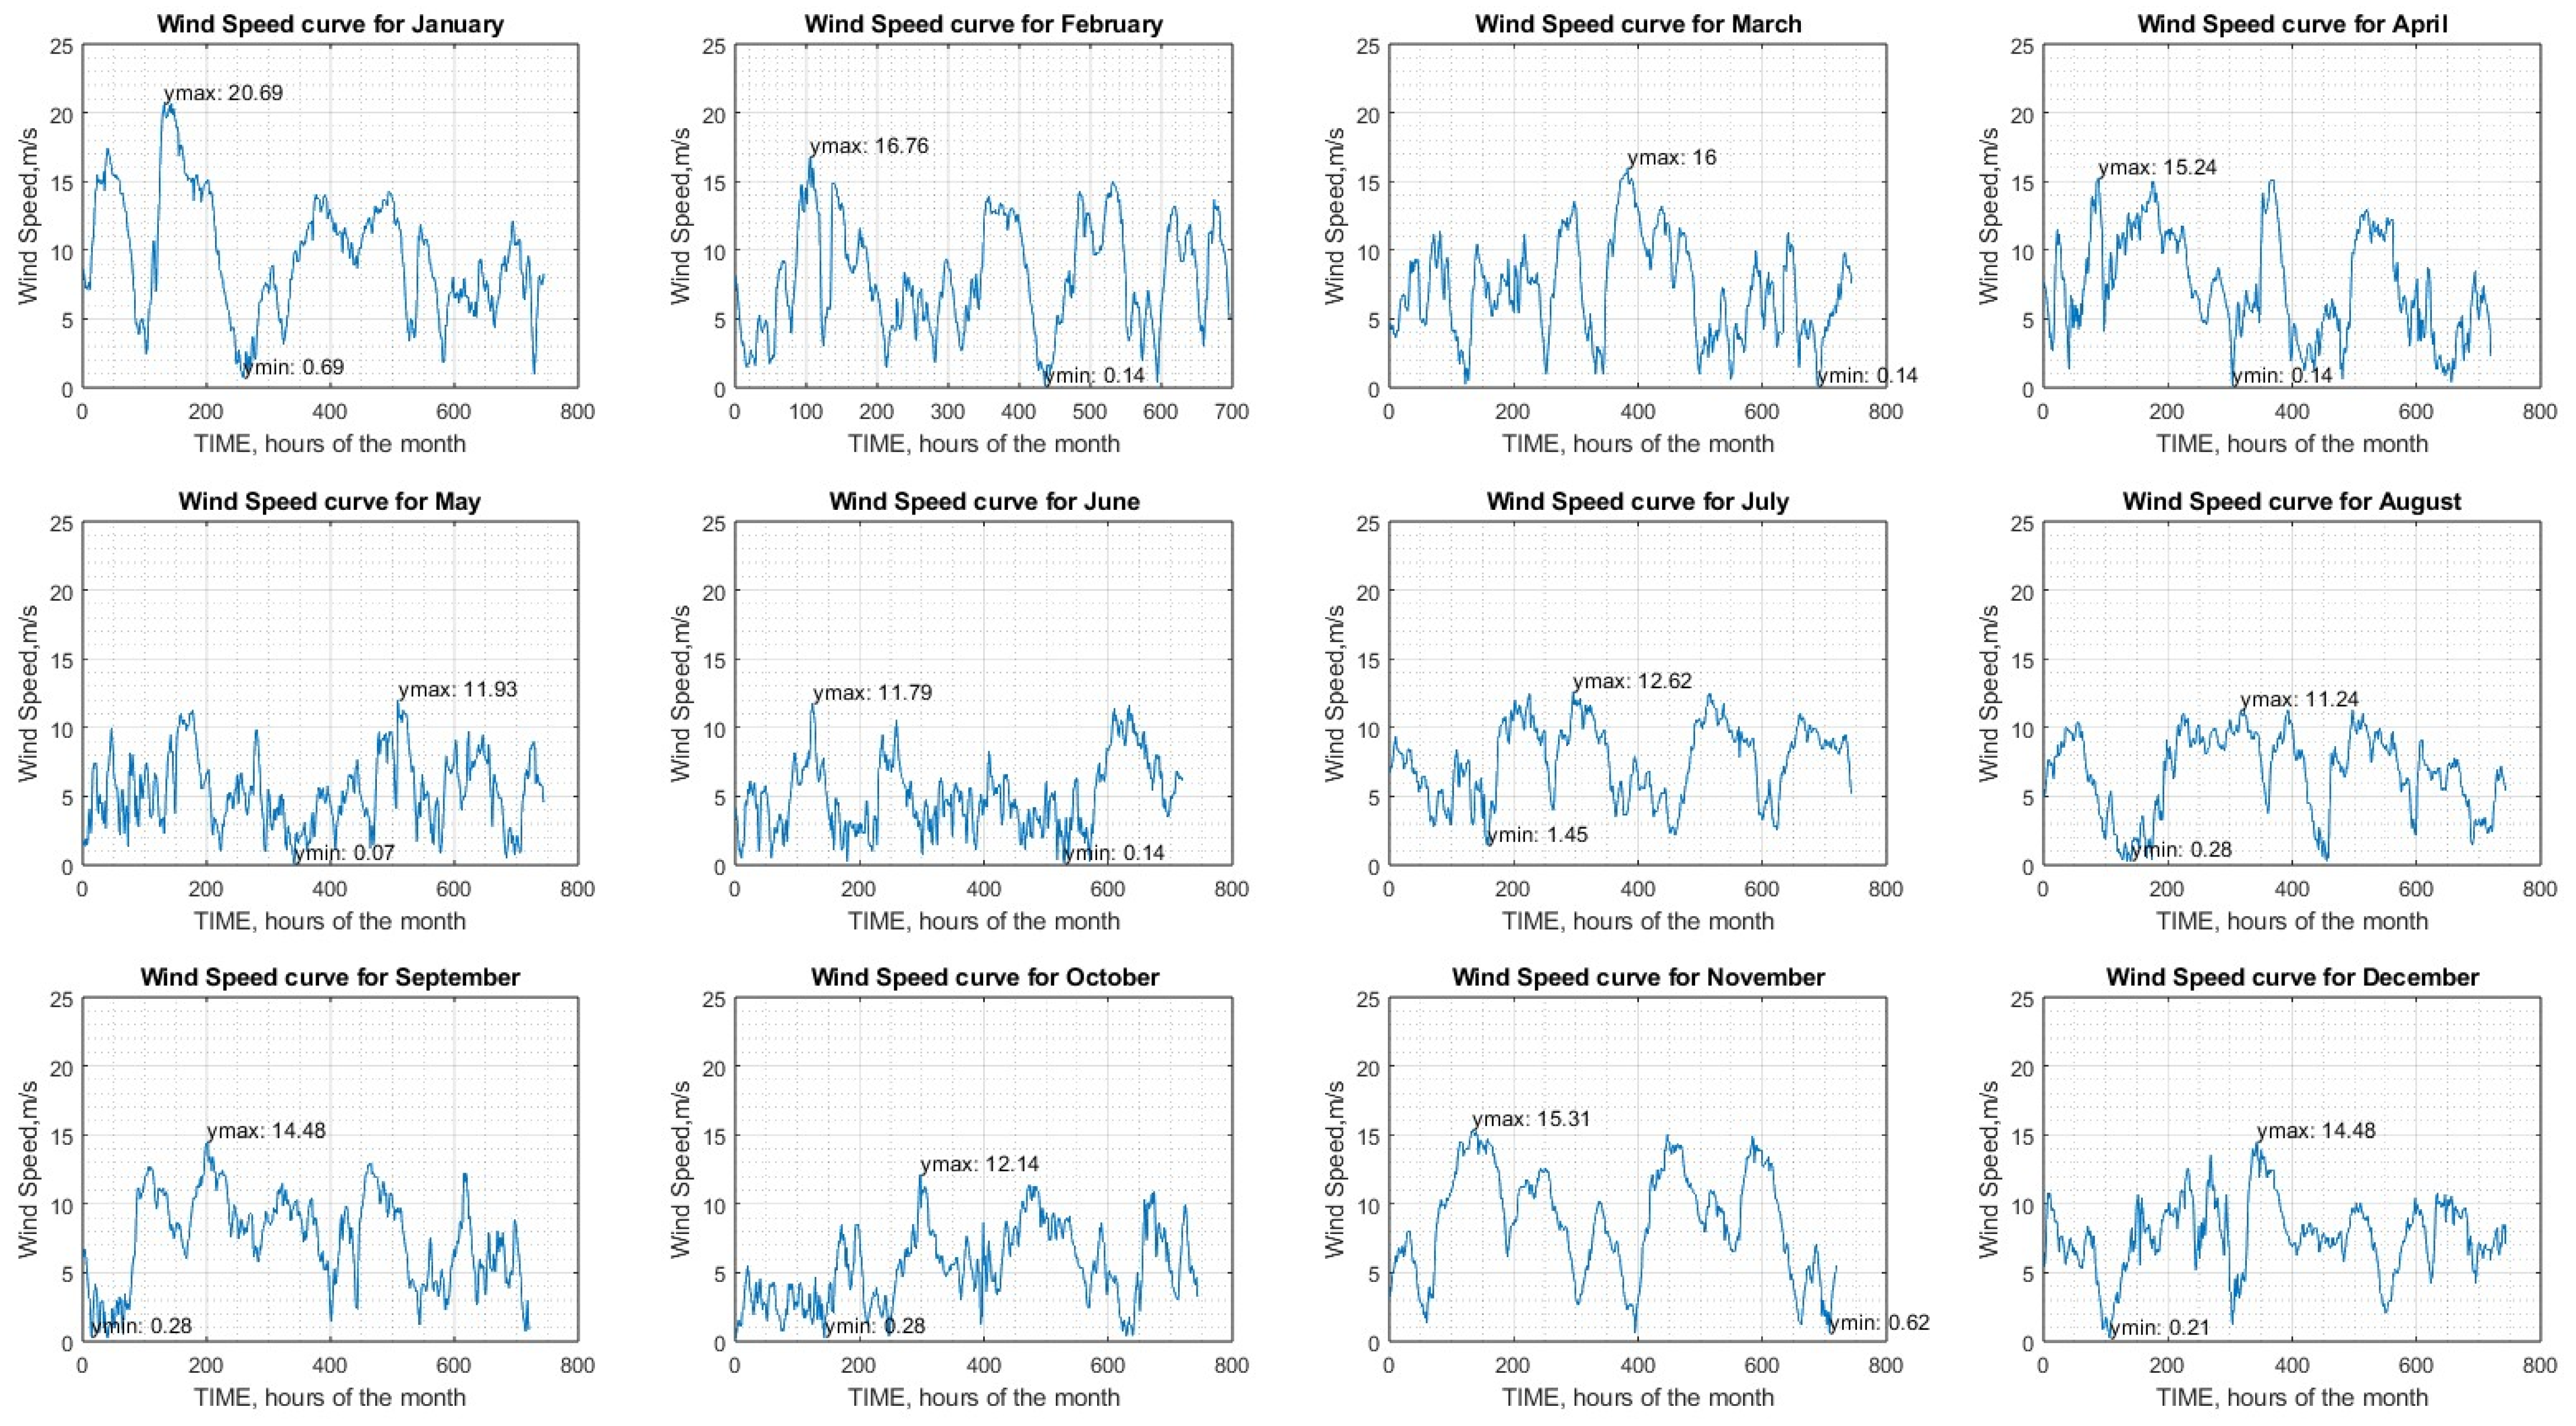
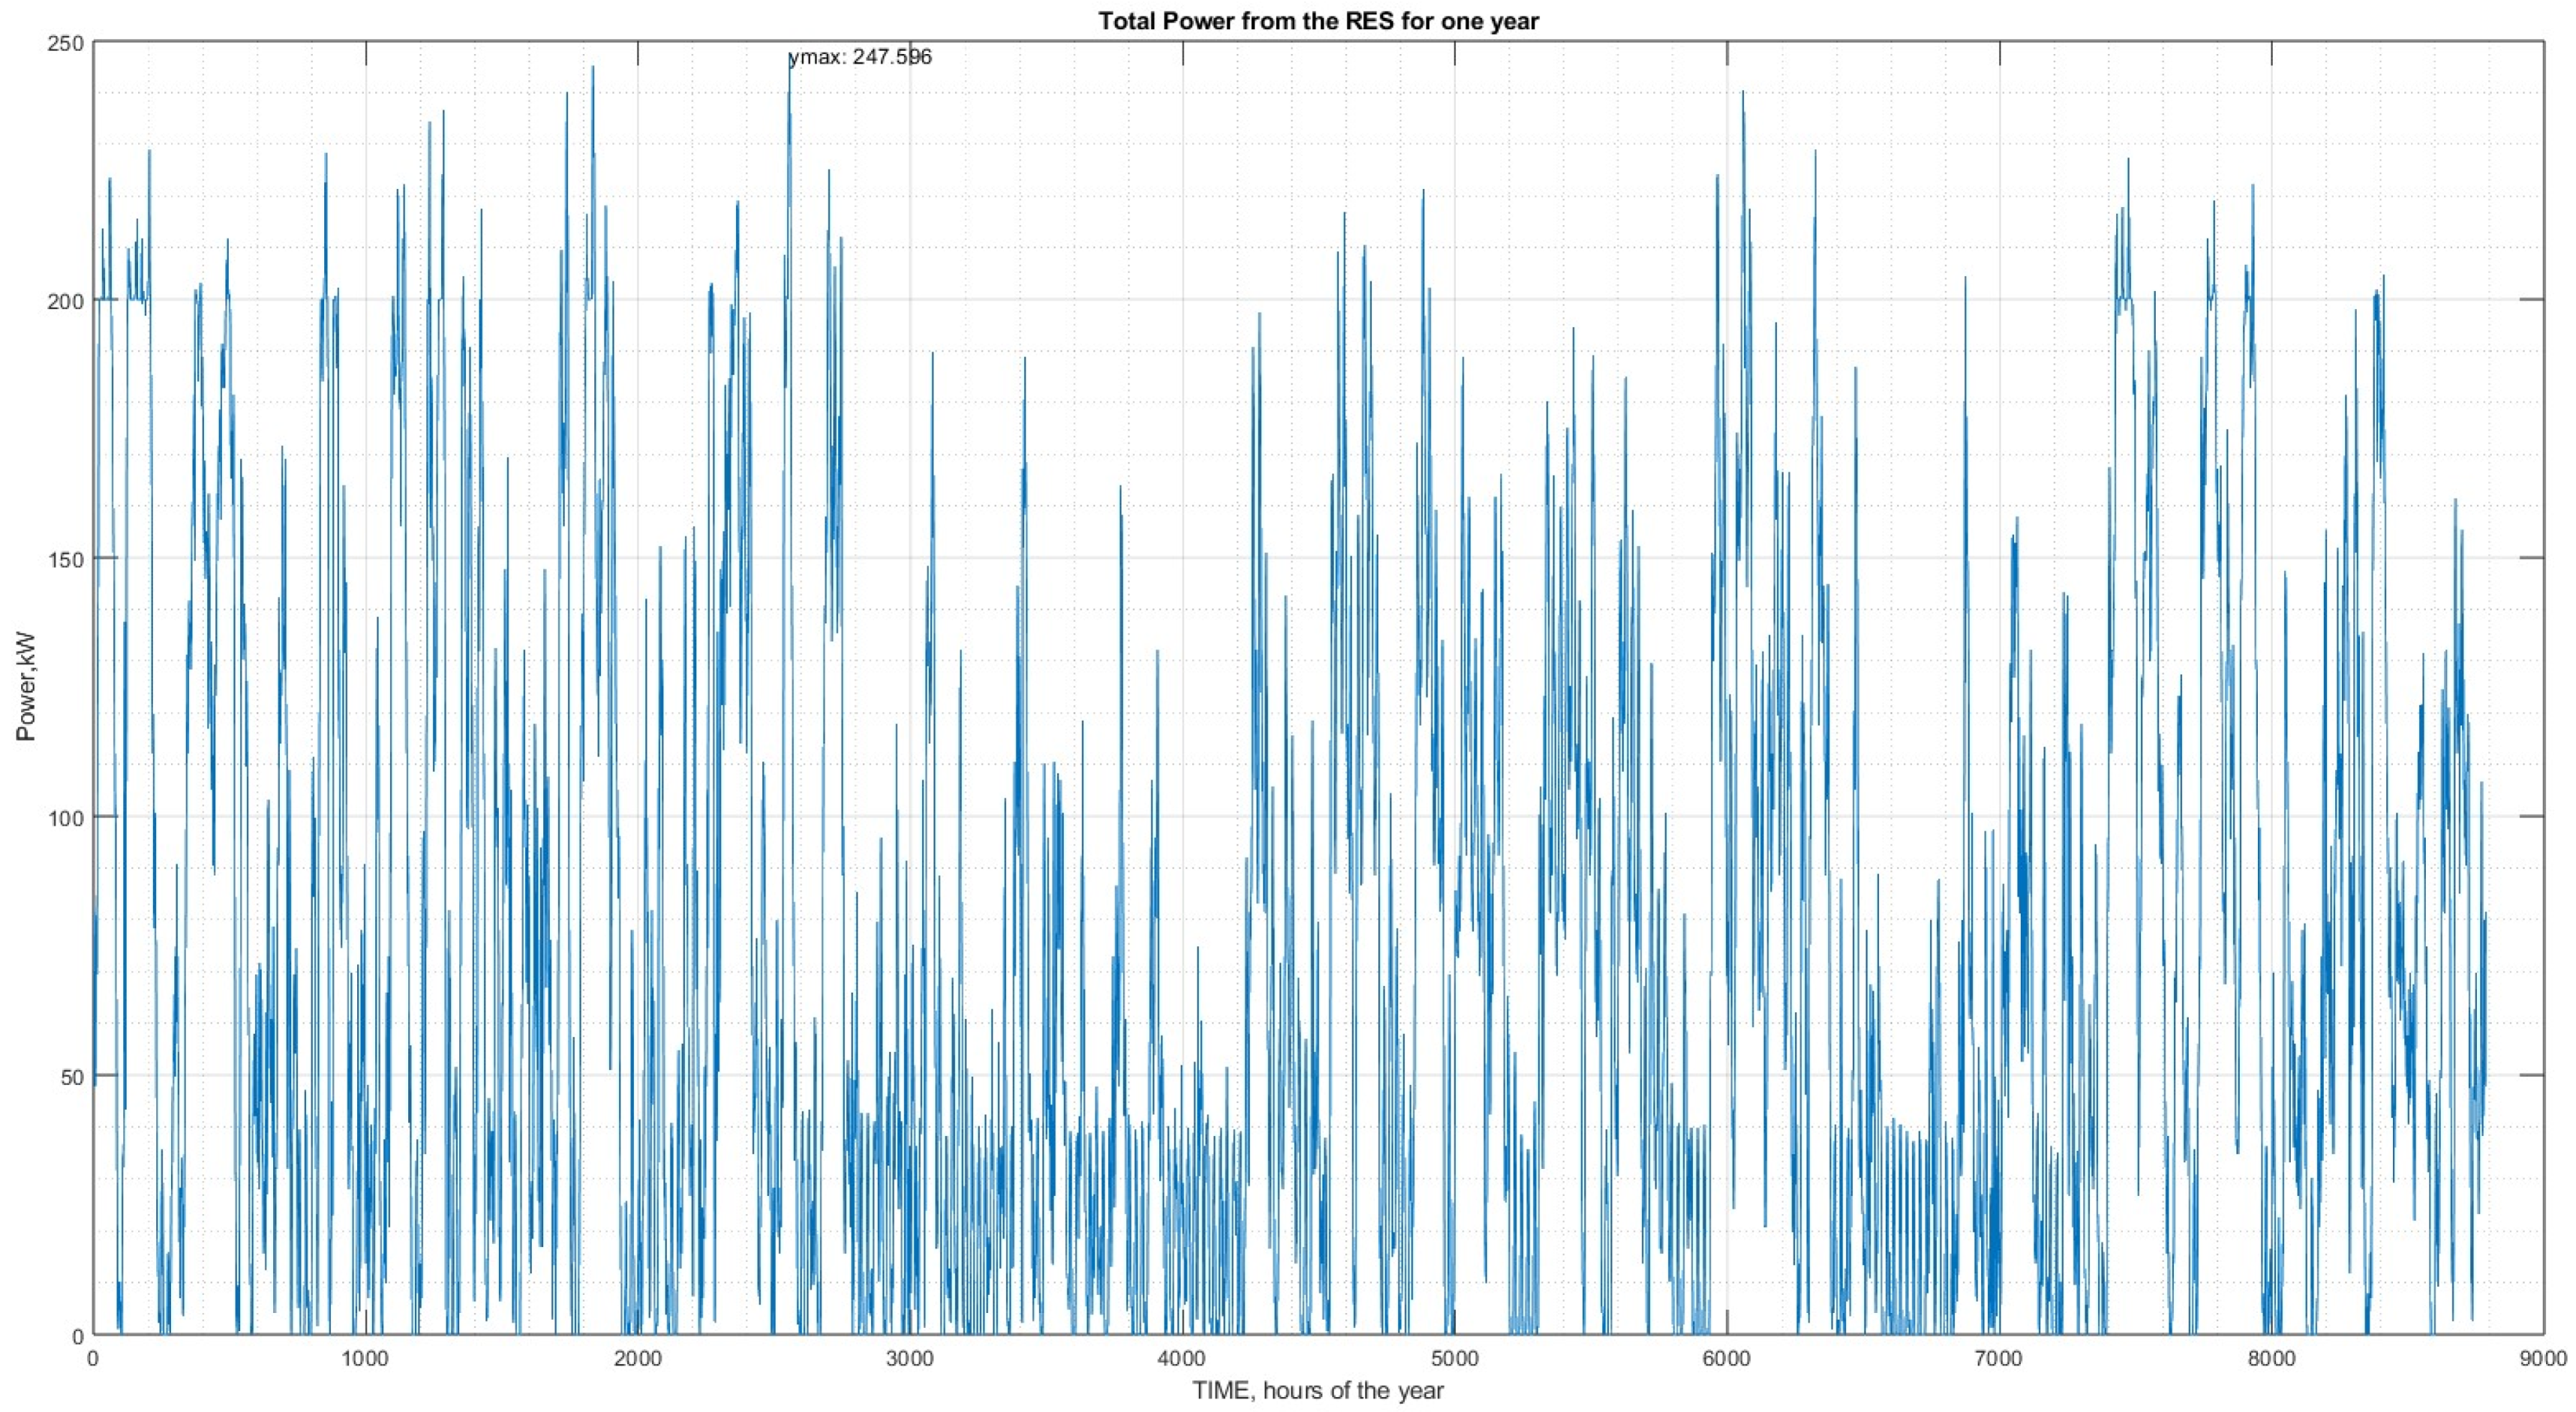
5.2. Data of the Wind Power Plant

In this study, the WT of Vestas200, with an installed capacity of 200 kW, is used; see Figure 5, Figure 6 and Figure 7.

5.3. Data of the Photovoltaic Power Plant

In this study, the PV with an installed capacity of 50 kW is used; see Figure 8 and Figure 9.

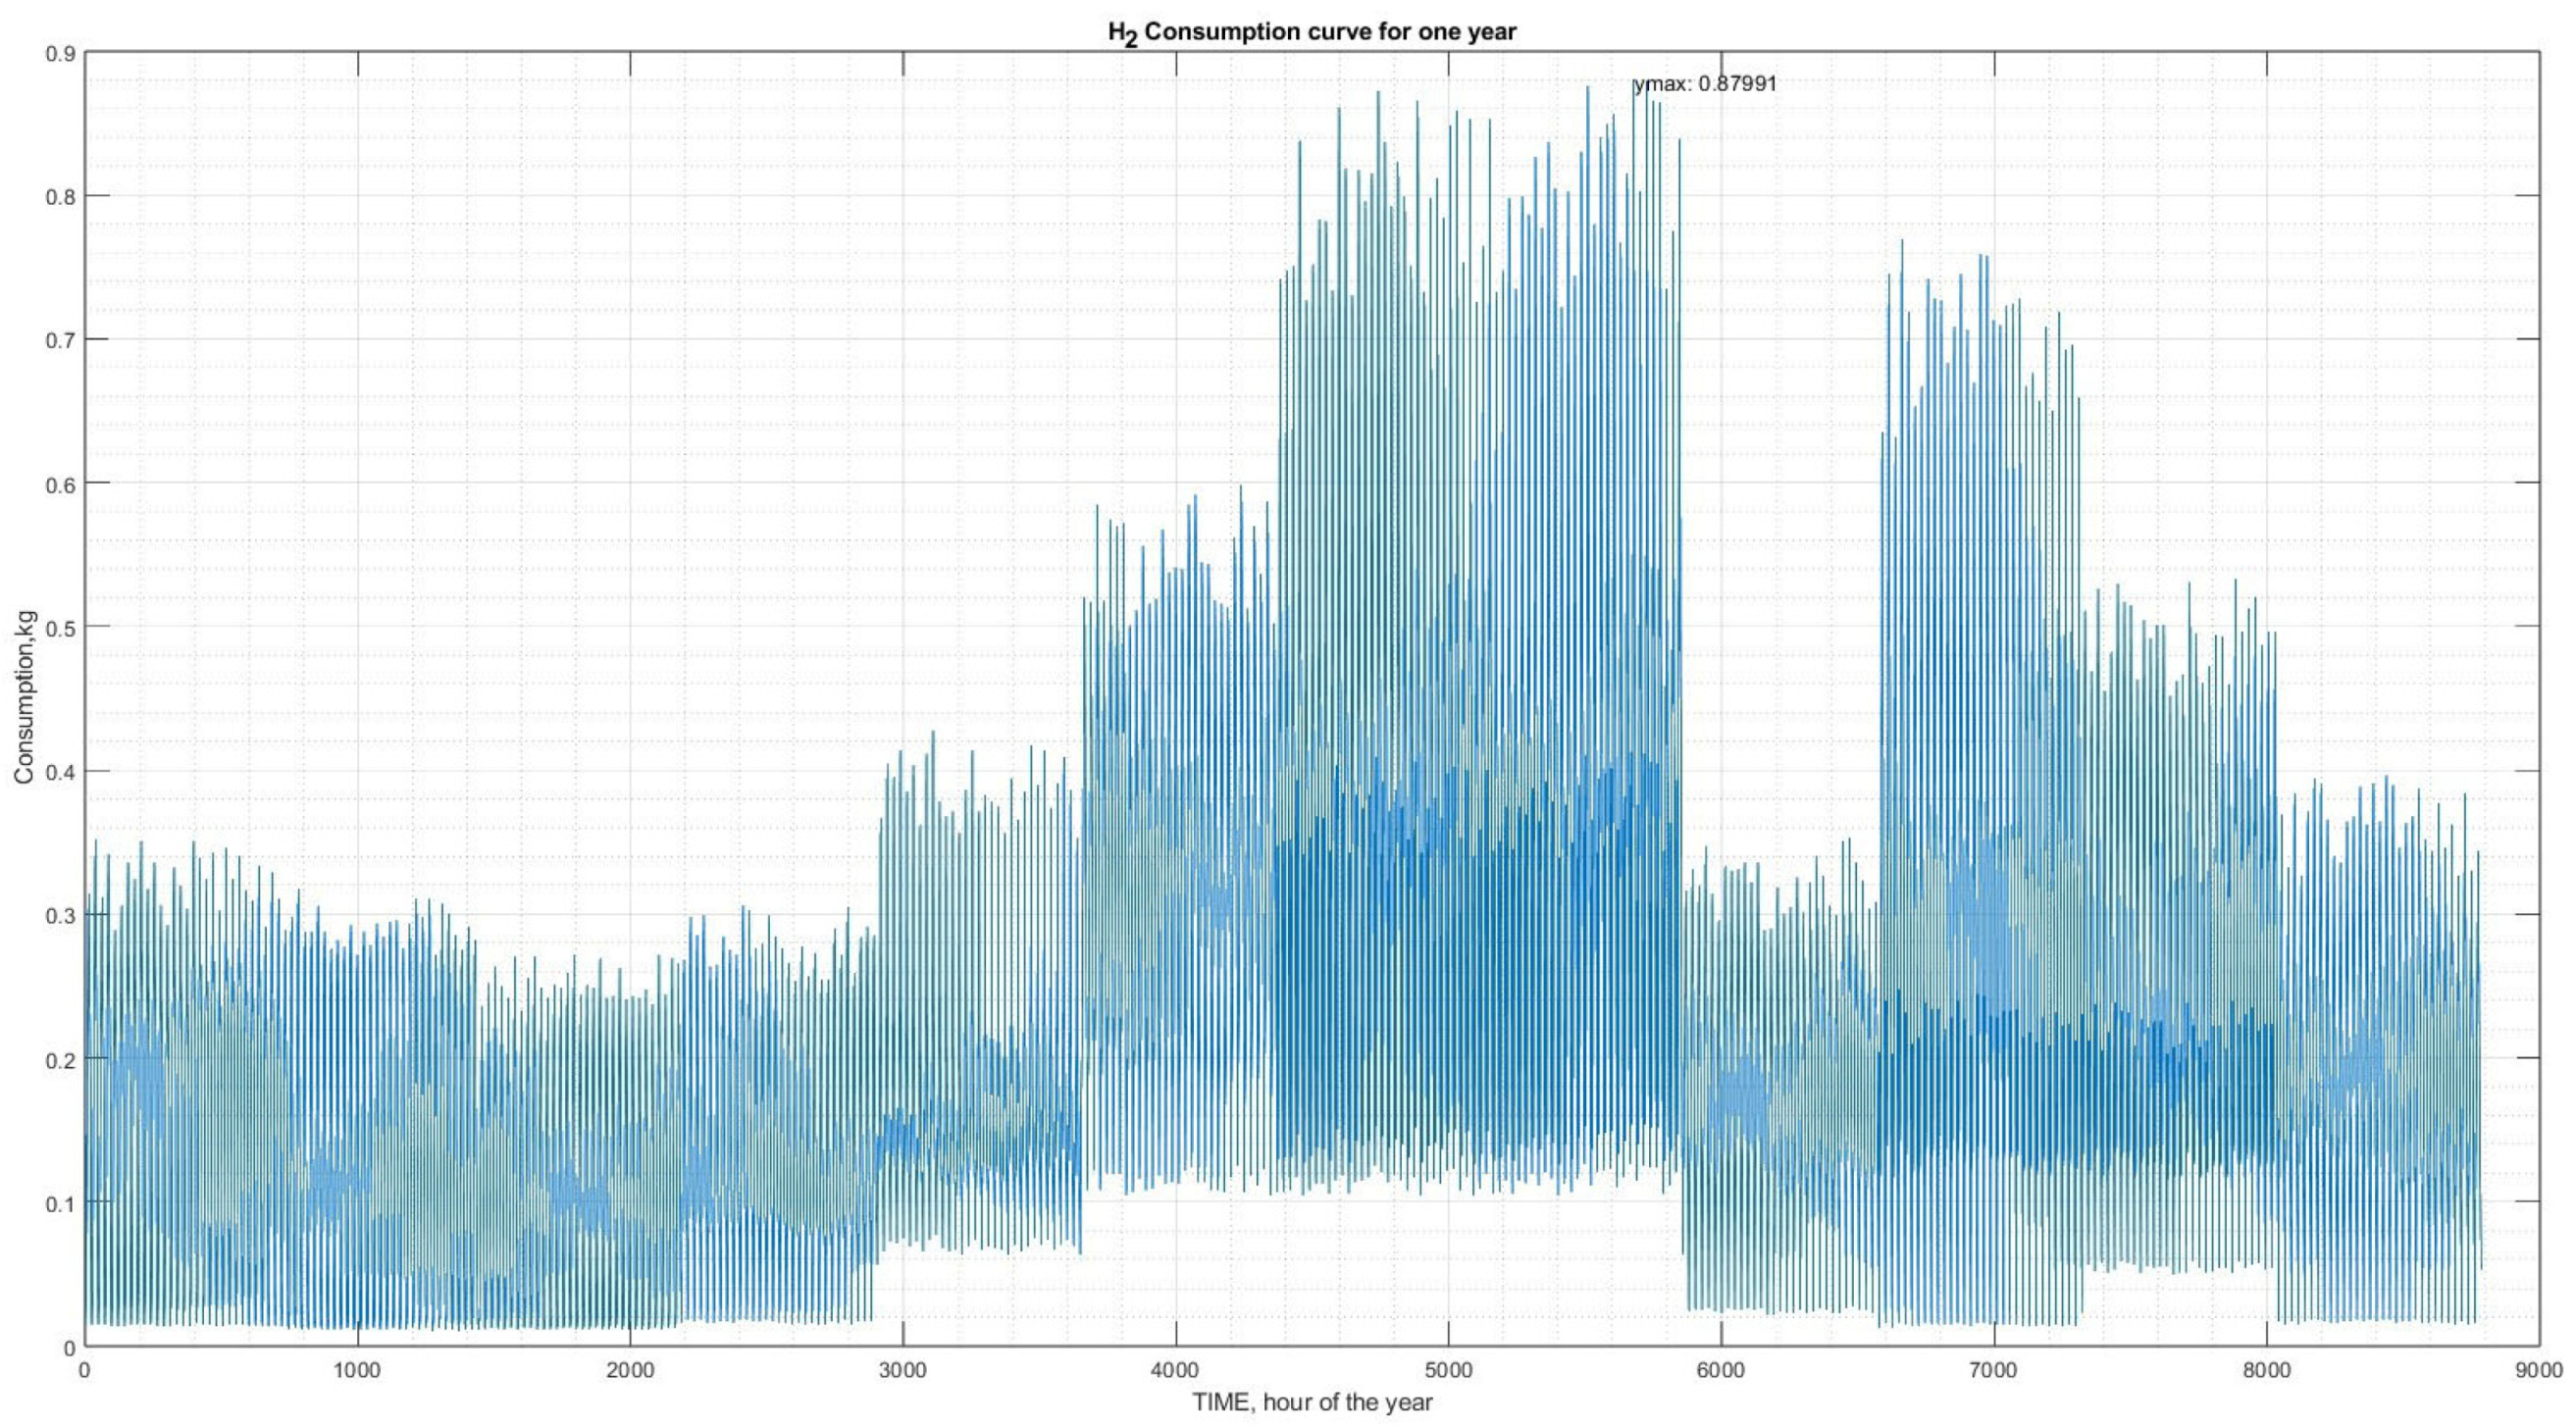
5.4. Data of Electrolyzer, Compressor, Storage Tank, and Hydrogen Vehicle [4,39]

All the input data are given in Figure 10 and Table 2.

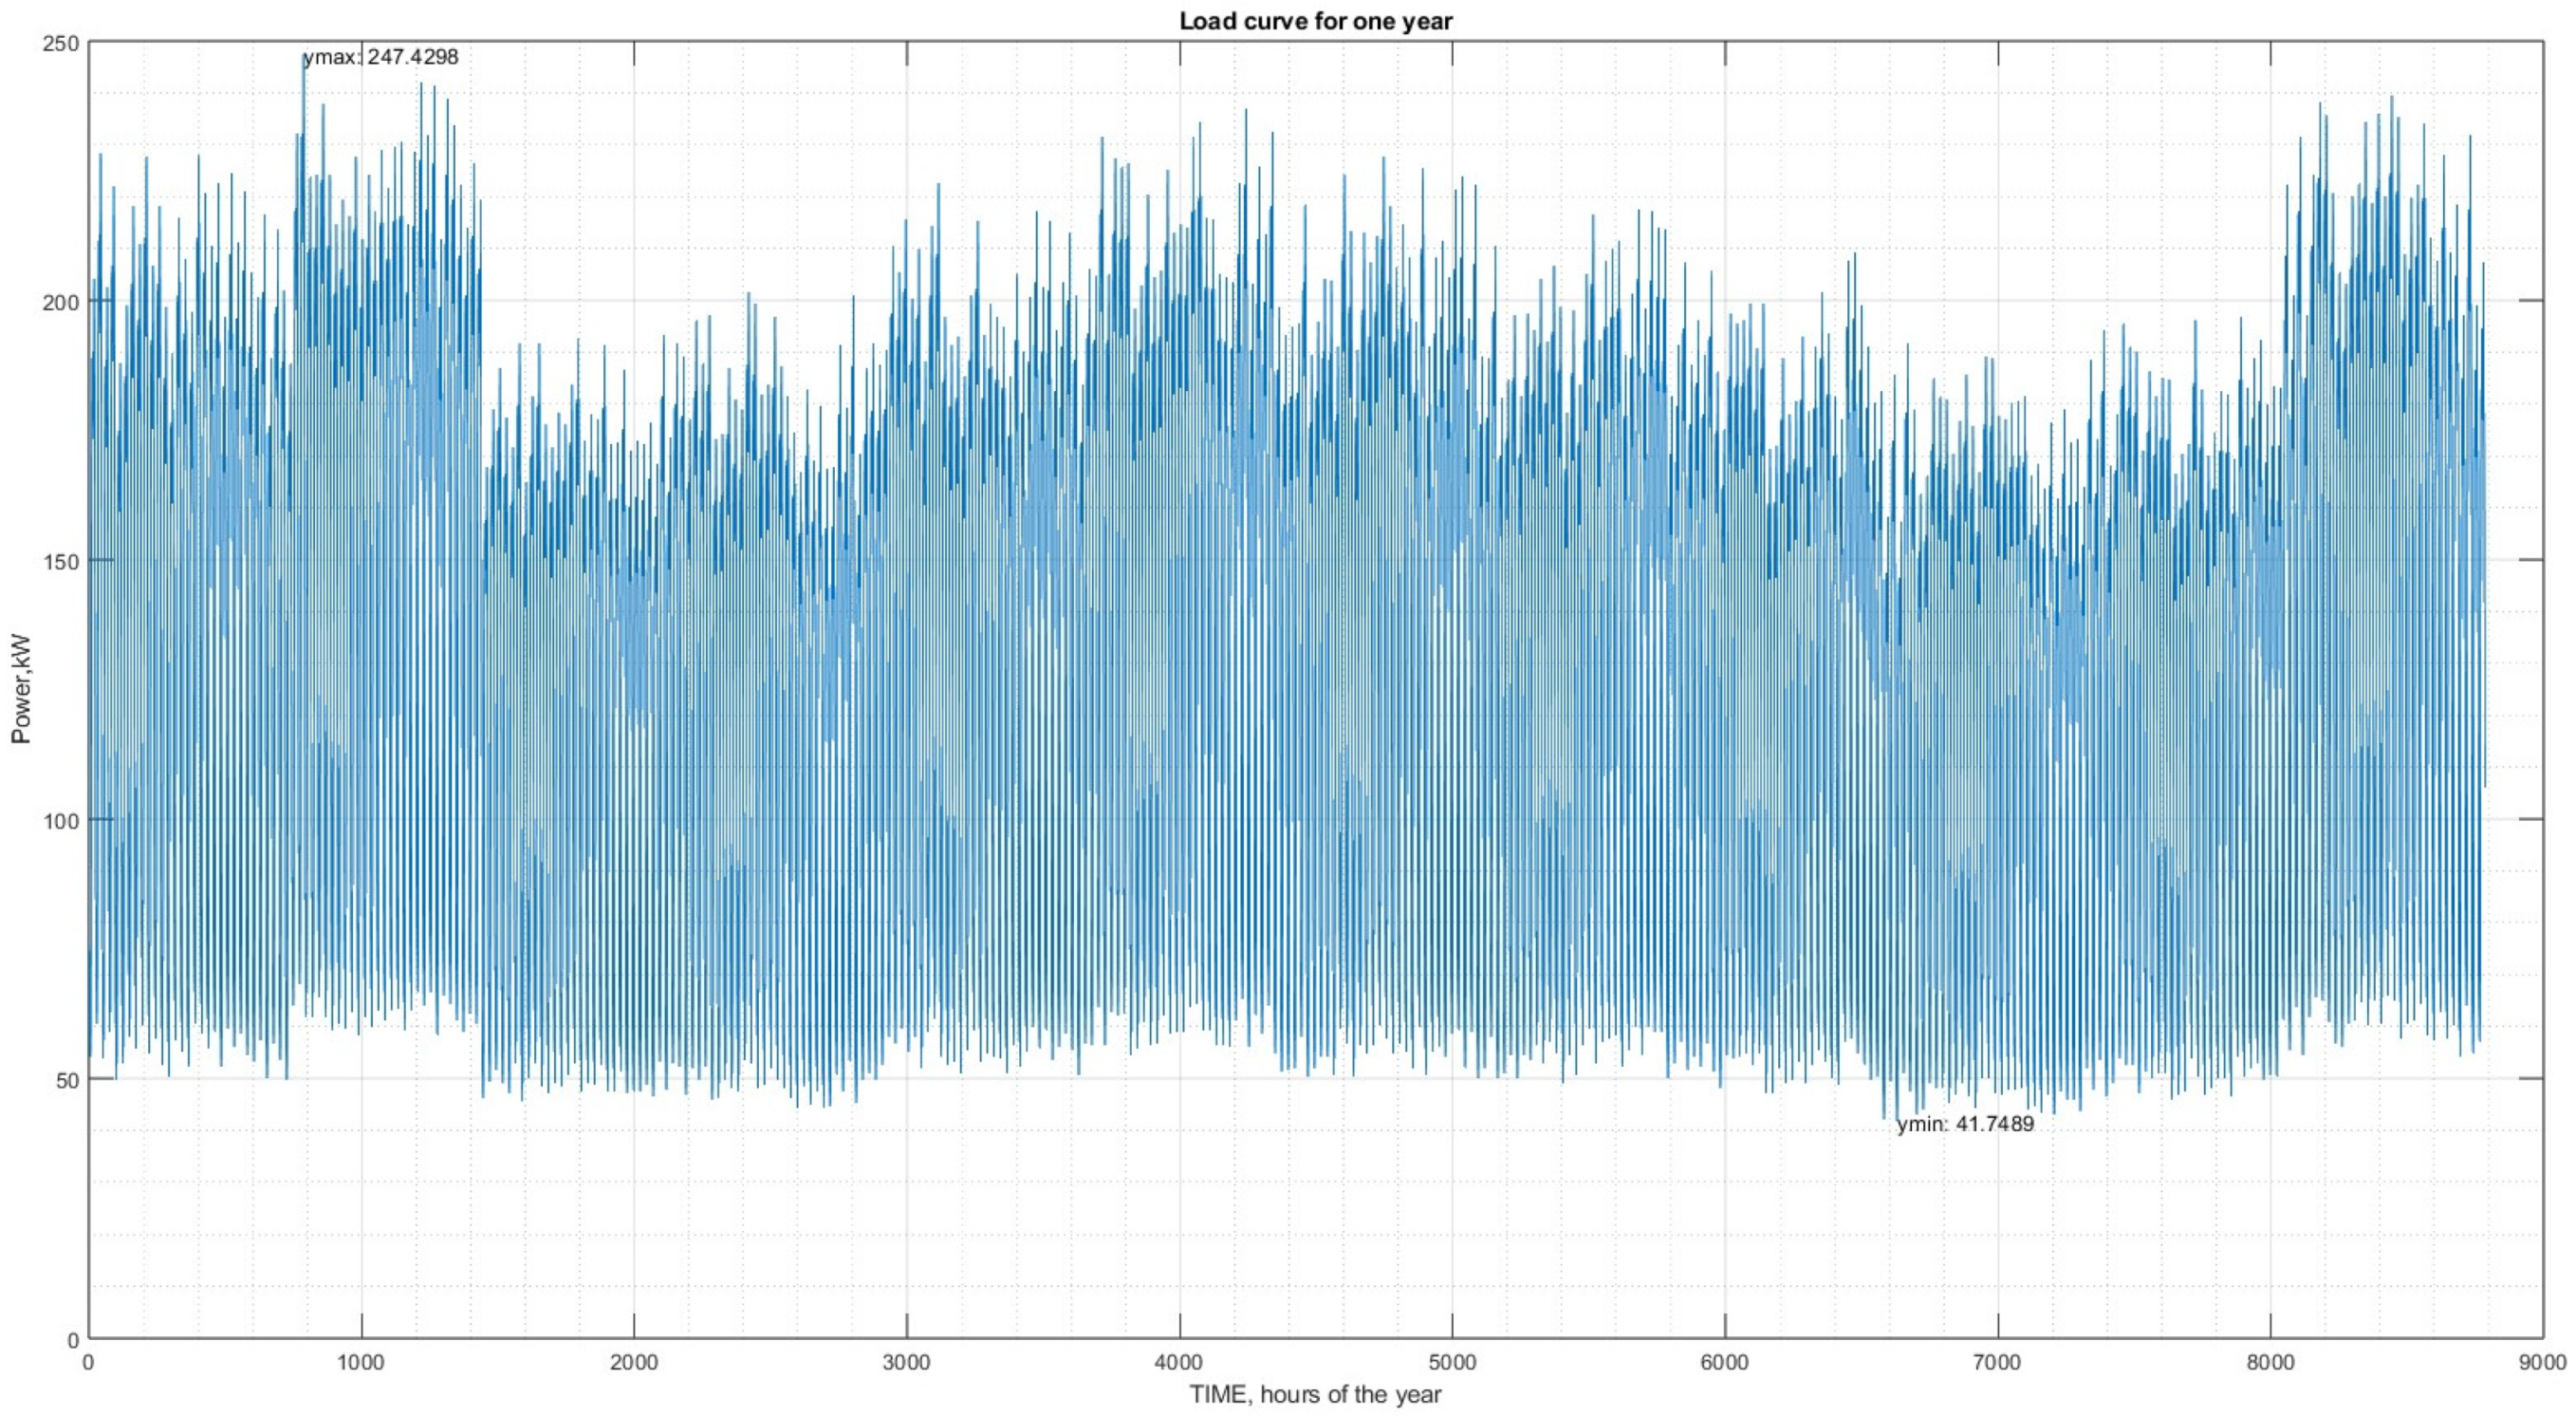
5.5. Data of Local Consumption

The input data for local demand are given in Figure 11 [34,35,36].

5.6. Data for the Economic Assessment

For the economic assessment, using the equations we referred to above, Table 3 presents the initial values that were used to calculate the results shown below, in Table 4.

6. Presentation of Results

The overall strategy of this study is to maximize hydrogen production using RES units. The hydrogen tank production must remain between 1 and 42 kg. For this purpose, at least the minimum power required for the hydrogen tank is obtained either from the RES units or the grid if the RES production is not high enough. If there is excess energy from the RES unit’s production, then this power is exported to the grid. It is assumed that the grid can cover any needs that arise during the simulation.
It must be noted here that, in every timestep of the simulation, it is checked whether the hydrogen tank production has reached its maximum limit for the period of interest. Then, the hydrogen tank is set not to produce any hydrogen.
The hydrogen that is produced is then used to fuel vehicles. If there is not enough hydrogen in the tank to cover the needs of the vehicles, then this deficit hydrogen is supplied from another station of the power grid. It is again assumed that the power grid can cover those needs.
The following Figure 12, Figure 13, Figure 14, Figure 15, Figure 16, Figure 17, Figure 18, Figure 19, Figure 20 and Figure 21 and Table 4 and Table 5 show the results obtained via the solution of the algorithm.
An integrated energy system was simulated over a one-year period to assess the feasibility of hydrogen production using renewable energy sources. The analysis revealed fluctuations in hydrogen production ranging from 0 kg to 2.6385 kg per hour due to the intermittent nature of renewable energy sources. However, the excess renewable energy was sufficient to meet the demand of the electrical grid, with the maximum power consumption reaching 238.799 kW and the maximum power supply reaching 147.337 kW. Refueling hydrogen vehicles daily proved challenging due to the vehicles’ consumption patterns not aligning with the daily production cycle. Additionally, the fuel cell demonstrated substantial power output variations, reaching a maximum of 175.321 kW. These findings underscore the need for improved energy storage systems to address the intermittency of renewable energy production, as well as the development of more efficient and adaptable hydrogen refueling infrastructure and fuel cells to ensure the consistent supply of hydrogen to vehicles. Overall, the utilization of renewable energy sources for hydrogen production holds promise for a sustainable energy future, but challenges remain that require further technological advancements.
The annual power generated is 714,620.5 kWh and, therefore, the LCOE is 0.1253 EUR/kWh or 4.17 EUR/kgH2 (lower calorific value of H2, 33.3 kWh/kg). There are similar results from LAZARD and other organizations [37].
What is interesting is the fluctuation in some variables detected using sensitivity analysis. Thus, below, we present charts that have a direct relationship with these fluctuations. The changes are threefold. First of all, the change in the CAPEX reduction of 2% every year as shown in Figure 20; secondly, the change in the capacity factor of the wind turbine and the photovoltaics as shown in Figure 21; and, finally, the change in the price of the electrolyzer as shown in Figure 22.
Finally, a sensitivity analysis was performed, affecting inflation and the initial interest rate, in order to see what would change in the LCOE.
Sensitivity analysis was conducted to evaluate the impact of three key factors on the cost of hydrogen production: the initial capital cost, the efficiency coefficient of the wind turbine and photovoltaic system, and the price of the electrolyser.
The analysis began by examining the influence of the initial capital cost on the hydrogen production cost. A gradual reduction in the initial capital cost by 2% per year led to a substantial decrease in the hydrogen selling price, reaching EUR 2.49/kg. This finding emphasizes the importance of optimizing capital expenditures to enhance hydrogen production cost competitiveness.
Next, the analysis investigated the impact of wind turbine and photovoltaic efficiency coefficients on hydrogen production cost. Incrementally increasing both efficiency coefficients by 1% resulted in a decrease in hydrogen cost from EUR 4.53/kg to EUR 3.79/kg. While the effect was less pronounced compared to the initial capital cost, it still demonstrates the contribution of renewable energy source efficiency in lowering hydrogen production costs.
Finally, the analysis focused on the effect of electrolyser price on the hydrogen production cost. A decrease in electrolyser price resulted in a corresponding decrease in hydrogen production cost, from an initial EUR 4.17/kg to EUR 3.97/kg. This highlights the significance of electrolyser technology developments in driving down hydrogen production costs.
In the latest sensitivity analysis, which was affected by the initial interest rate and inflation, we observed that the lowest LCOE was obtained for the lowest initial interest rate and inflation, which was expected. A good observation is that the LCOE value is more affected by the initial interest rate than by inflation, as shown in Table 5.
In conclusion, the sensitivity analysis revealed that the initial capital cost is the most crucial factor in determining the hydrogen production cost. The efficiency coefficient of renewable energy sources also plays a significant role, while the price of the electrolyser has a moderate impact. The financial aspect of hydrogen production projects is particularly sensitive to changes in interest rates, as shown in the latest sensitivity analysis.

7. Discussion

A hybrid system that combines renewable energy sources (RESs), hydrogen production, storage, and utilization effectively utilizes wind and photovoltaic (PV) generation to produce hydrogen and meet load requirements. Hydrogen production exhibits seasonal patterns, with lower production during low-RES periods and higher production during peak RES periods. The system relies on the grid to supplement energy needs during low-RES and high-hydrogen-consumption periods. The calculated levelized cost of electricity (LCOE) is comparable to the average European electricity price (Eurostat [40]), indicating economic feasibility. The wind turbine exceeds its maximum power due to high wind potential, while the photovoltaic panels contribute significantly to the overall energy production. The hydrogen storage tank occasionally reaches its maximum capacity, suggesting the potential benefit of a larger storage tank. The fuel cell effectively delivers up to 195 kW to the grid. Economic analysis reveals the initial cost and potential cost reductions through component efficiency improvements and capital cost reductions. Sensitivity analysis highlights the impact of various factors on the hydrogen production cost.

8. Conclusions

This study presents a novel hybrid system that integrates renewable energy sources (RESs), hydrogen production, storage, and utilization to address energy demands while minimizing the environmental impact. The system effectively utilizes wind and photovoltaic (PV) generation to produce hydrogen and meet load requirements. The study’s key findings include [41,42,43,44]:
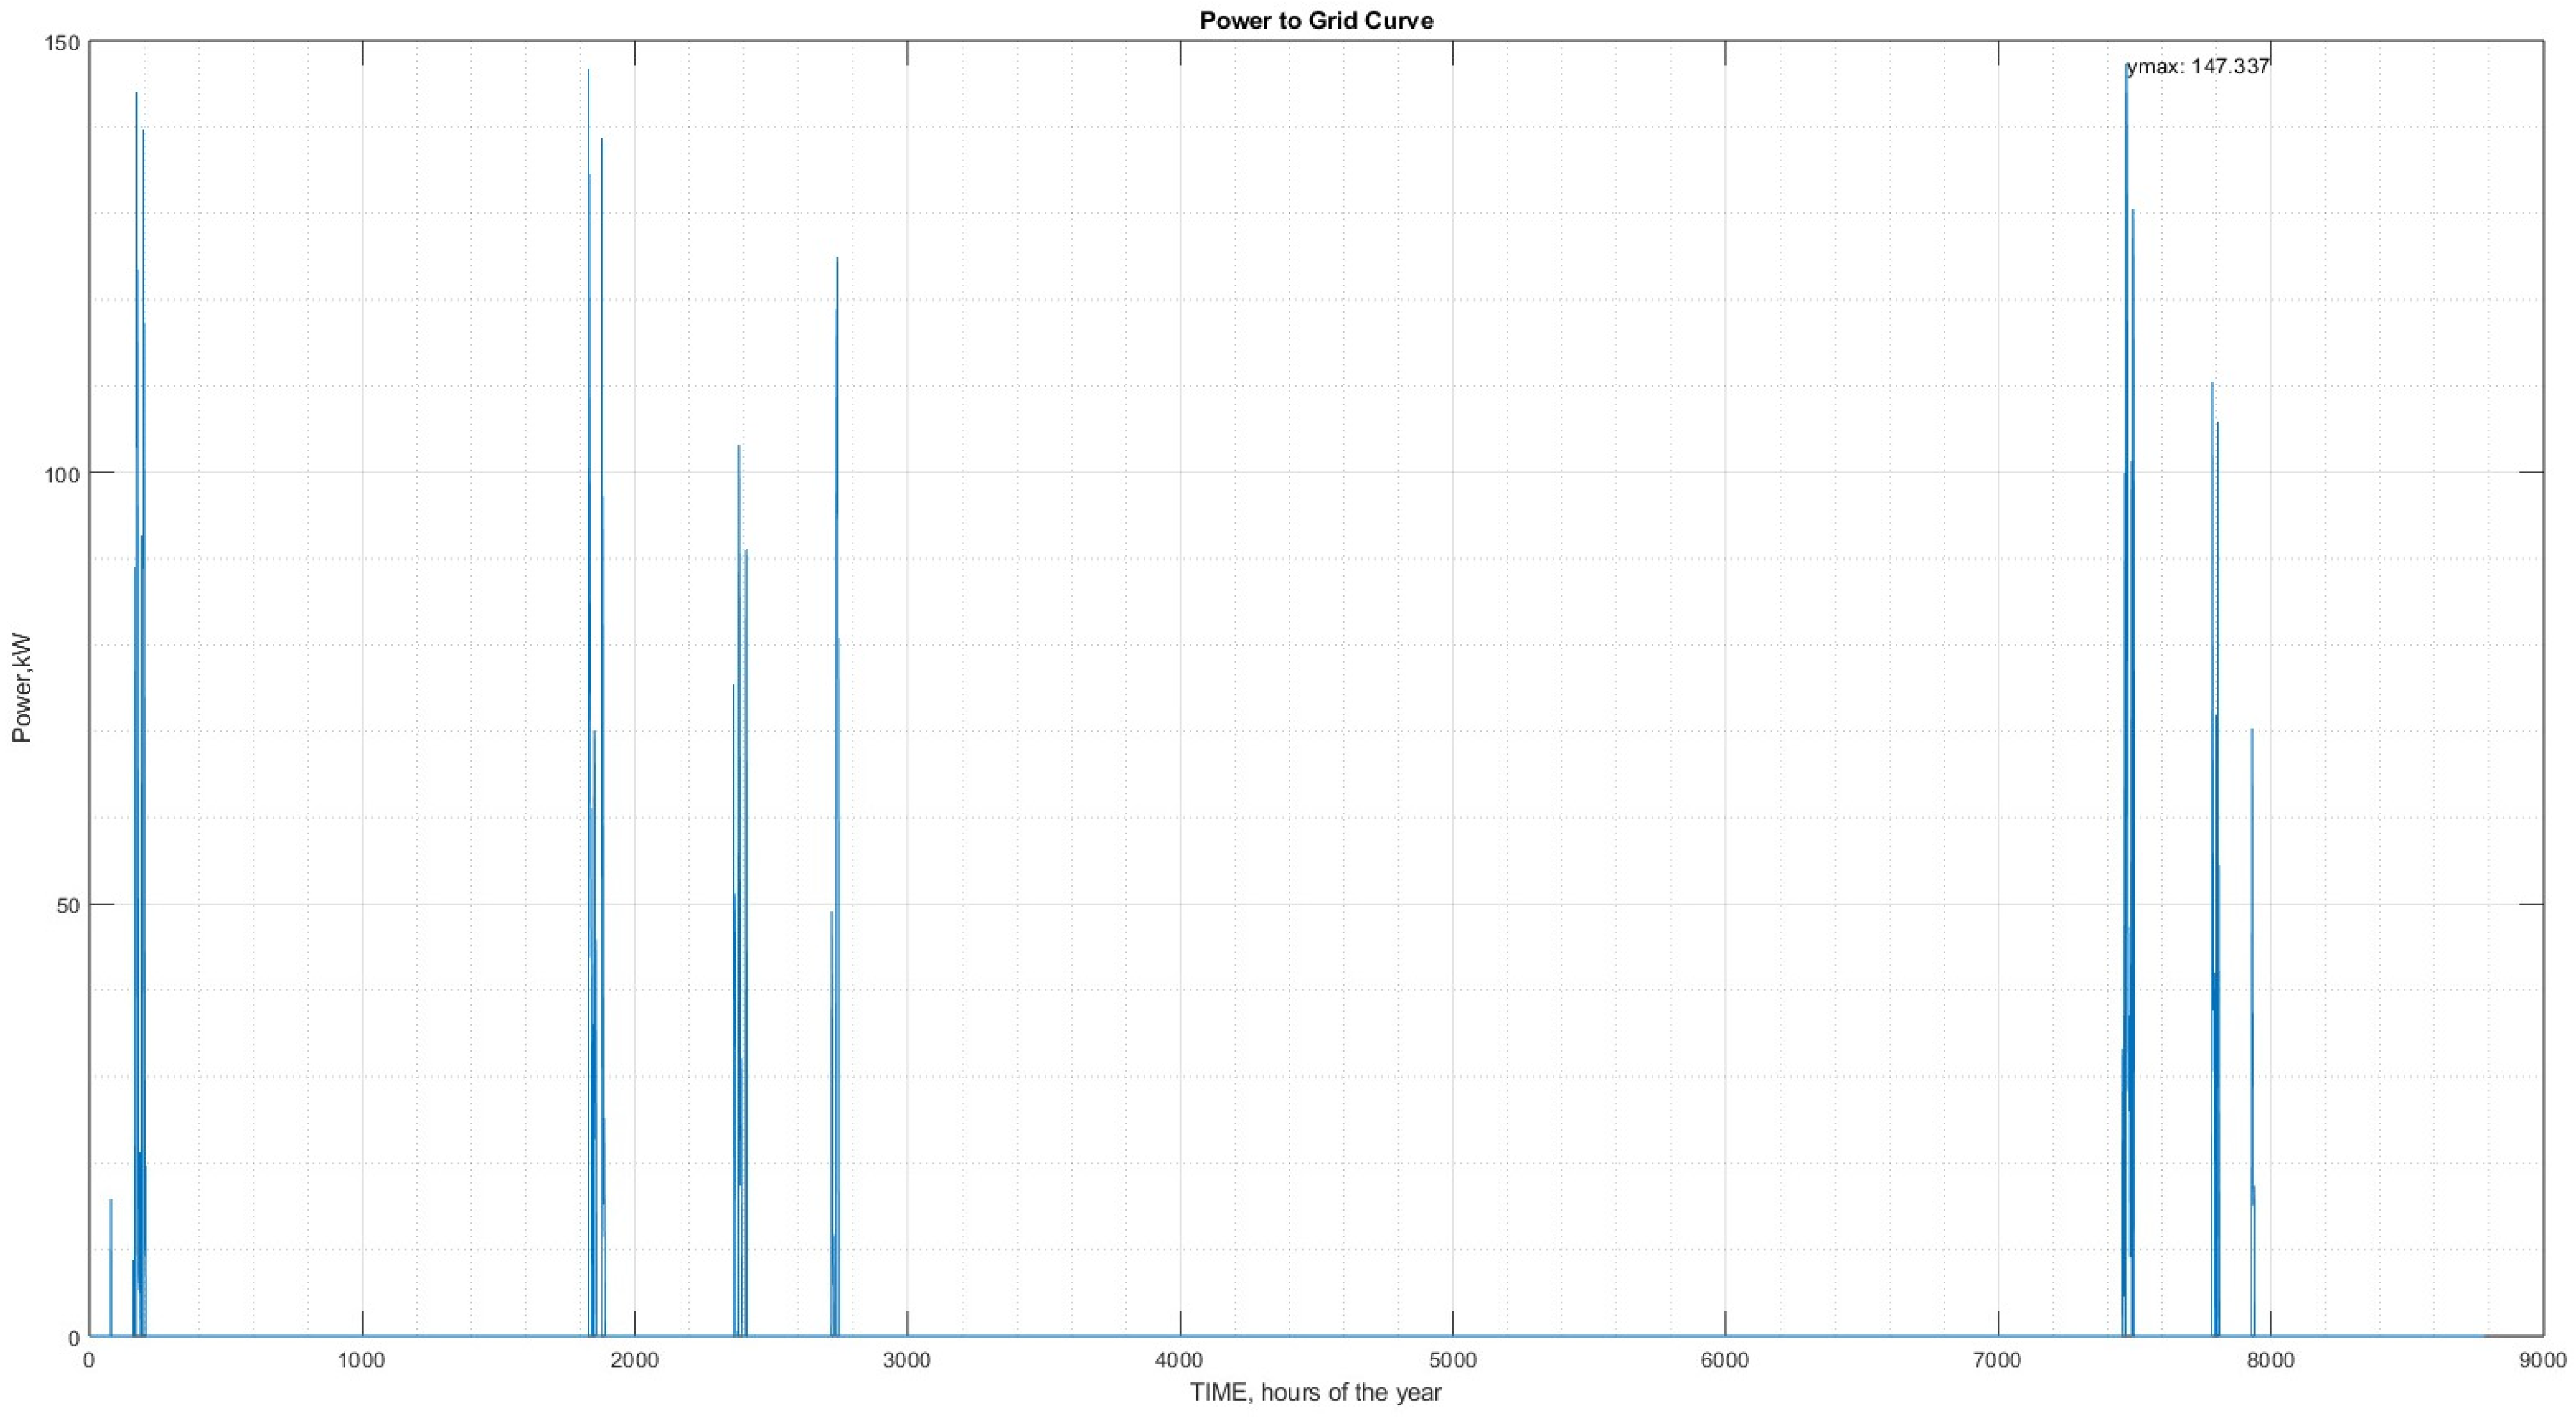
  • Effective utilization of RES: the system successfully exploits RES production to power the hydrogen tank and fulfill load demand. Excess RES energy is used to maximize hydrogen production without environmental pollution.
  • Optimized hydrogen production: hydrogen production is maintained within its maximum and minimum limits, ensuring efficient utilization of the storage tank.
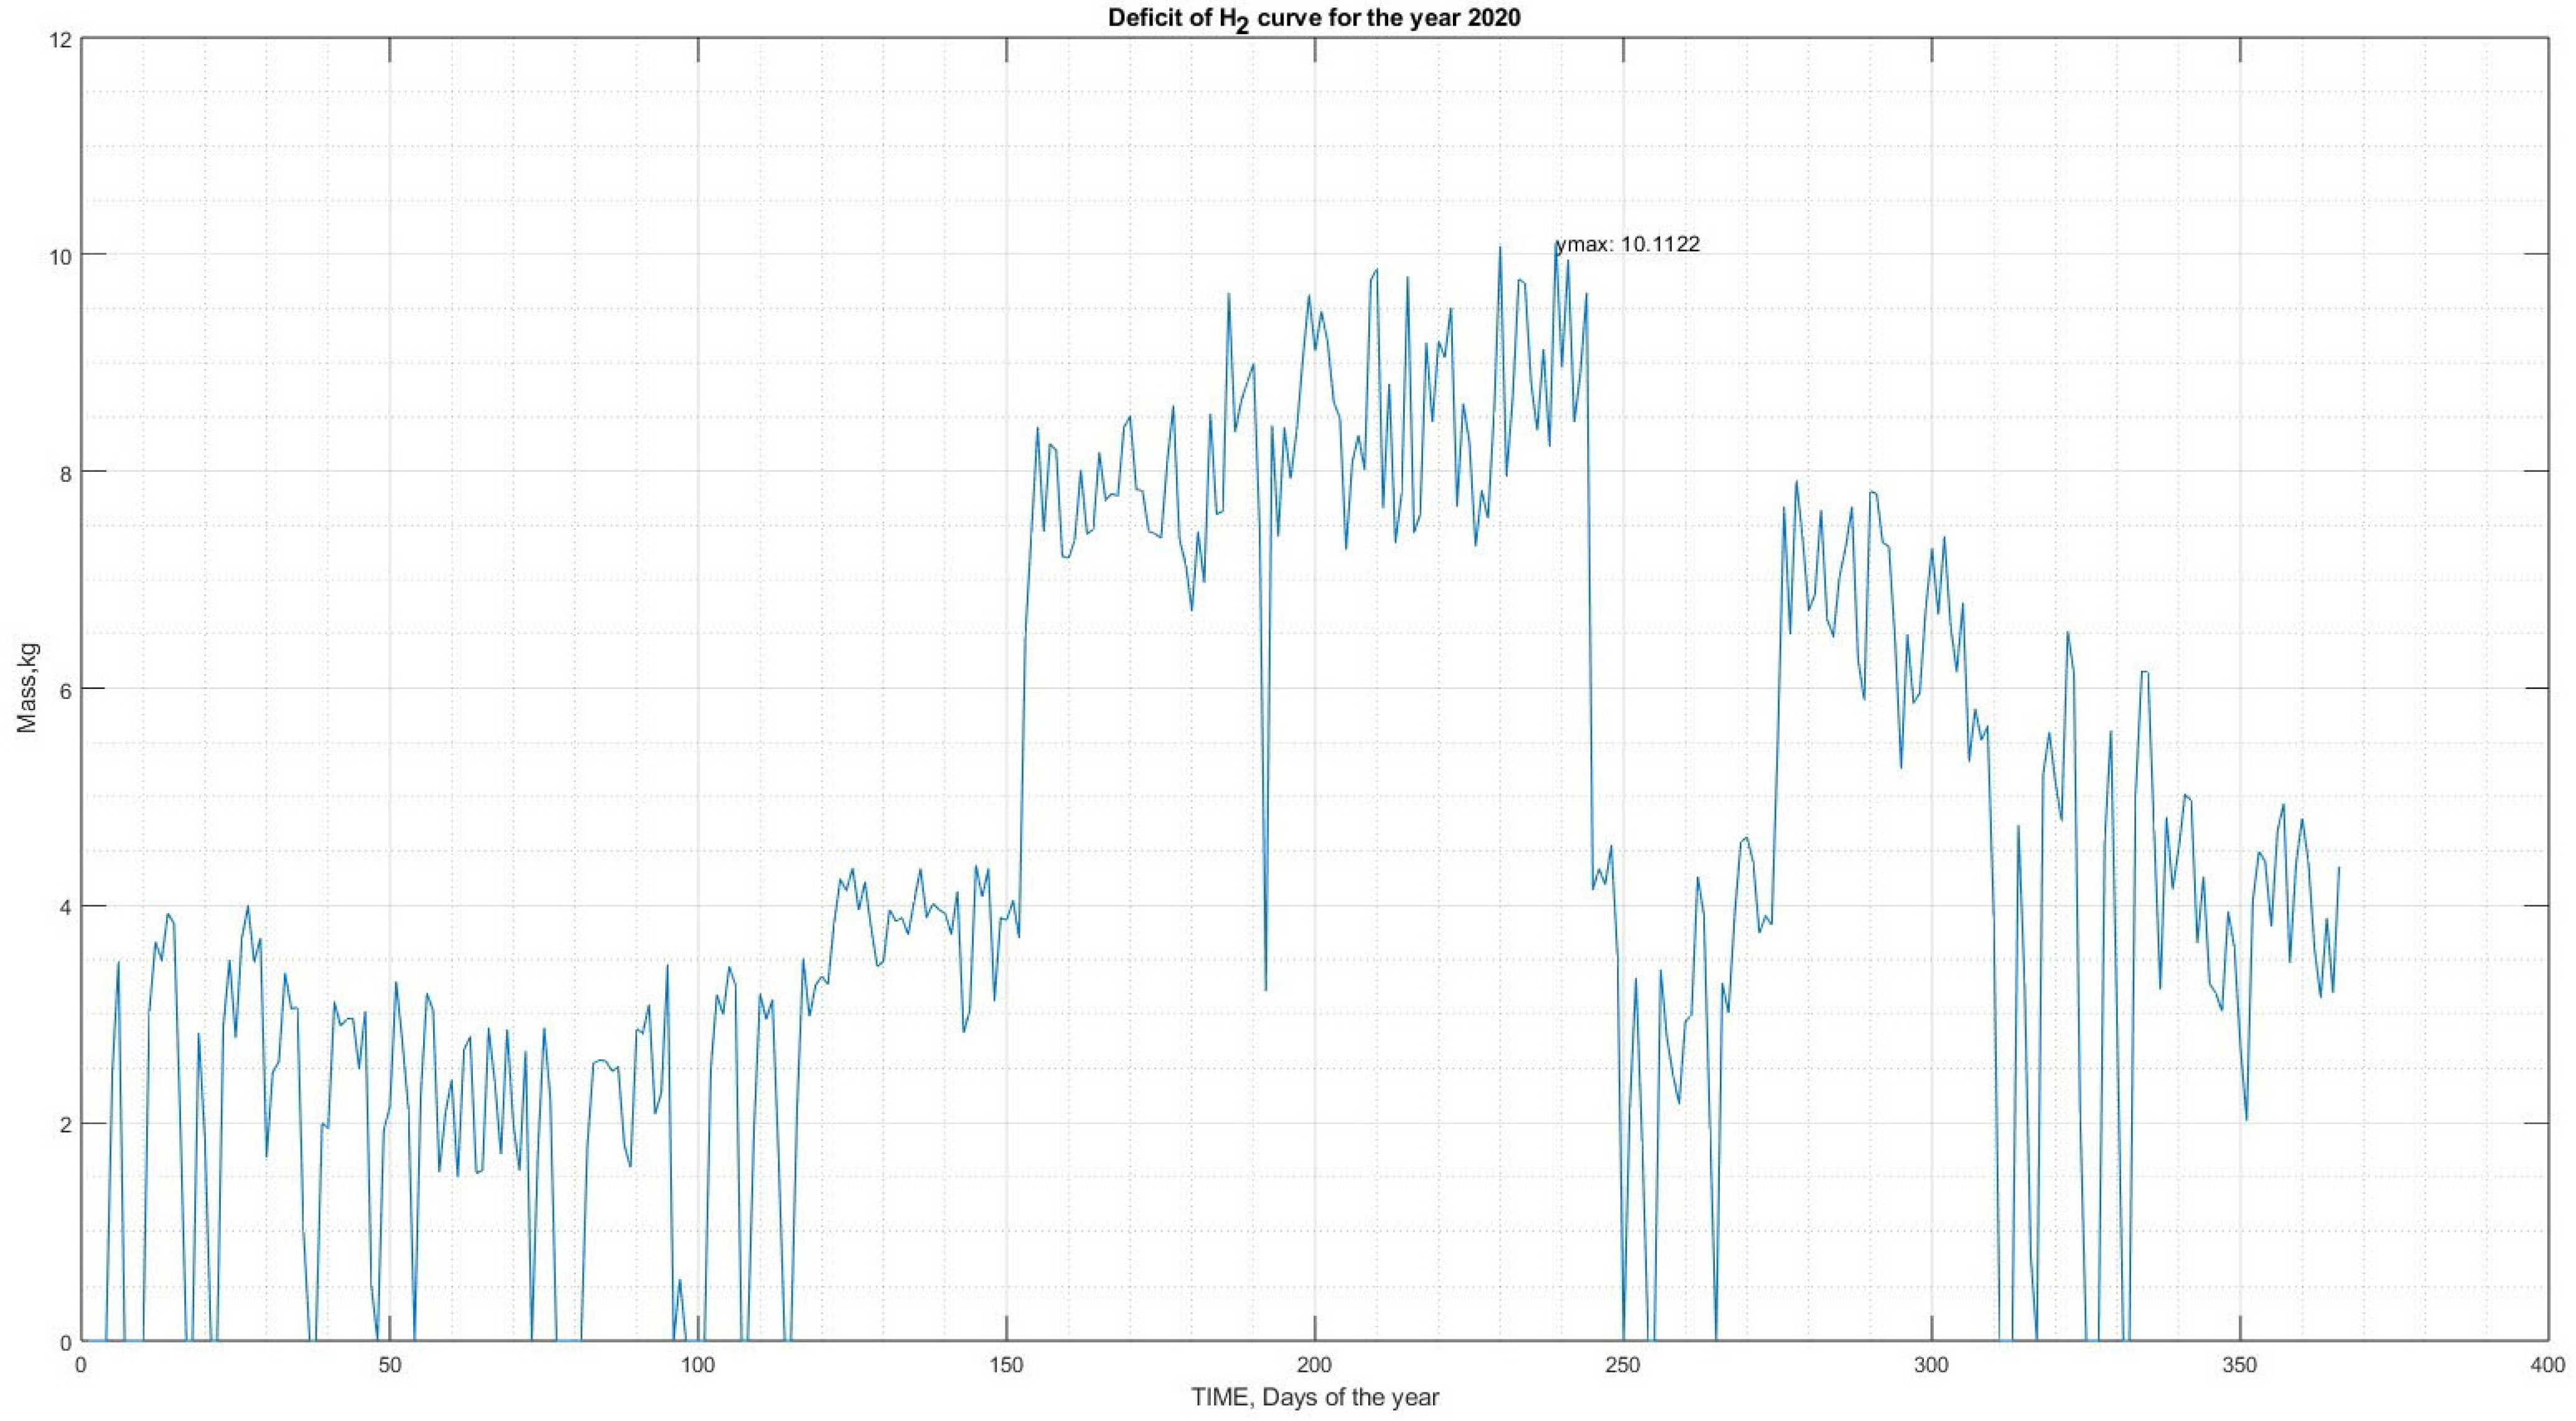
  • Maximized hydrogen utilization: the produced hydrogen is effectively utilized to charge hydrogen-powered vehicles and supplement fuel cell electrical energy, minimizing reliance on the power grid.
  • Adequate system management: the hybrid system demonstrates adequate overall management, effectively balancing energy production, storage, and utilization.
Despite the system’s effectiveness, the study acknowledges the limitations of relying solely on the power grid to address energy deficits. Real-world power grids may not always have the capacity to accommodate such deficits, necessitating alternative strategies. Additionally, hydrogen production is observed to be relatively low during the summer months due to high load demand and low wind speeds.
The study concludes with a comprehensive sensitivity analysis, evaluating the impact of cost reductions, capacity factor increases, electrolyzer price reductions, and interest rate and inflation fluctuations on the hydrogen production costs.
Future research directions include incorporating battery storage systems to enhance energy management and expanding the system’s scope to larger distribution grids with increased load demands and hydrogen vehicle fleets.
Overall, the study demonstrates the feasibility of a hybrid system that seamlessly integrates RES, hydrogen production, storage, and utilization, providing a promising pathway toward a sustainable and environmentally friendly energy future.

Author Contributions

Conceptualization, A.G.A. and G.A.V.; methodology, P.P.; software, A.G.A. and P.P; validation, A.G.A., P.P., P.V. and G.A.V.; resources, P.V.; writing—original draft preparation, A.G.A. and P.P.; writing—review and editing, A.G.A., P.P. and G.A.V.; supervision, G.A.V.; All authors have read and agreed to the published version of the manuscript.

Funding

This research received no external funding.

Data Availability Statement

Data are contained within the article.

Conflicts of Interest

A.G.A. is employee of Power Public Corporation (PPC S.A.). The other authors declare no conflict of interest in this work.

References

  1. Zhou, T.; Francois, B. Modeling and control design of hydrogen production process for an active hydrogen/wind hybrid power system. Int. J. Hydrogen Energy 2009, 34, 21–30. [Google Scholar] [CrossRef]
  2. Abdallah, A.; Ekekwe, N. Cost and performance of hybrid photovoltaic and wind-powered hydrogen generation systems: A review. Renew. Sustain. Energy Rev. 2019, 101, 708–723. [Google Scholar]
  3. Hannan, M.A.; Abu, S.M.; Al-Shetwi, A.Q.; Mansor, M.; Ansari, M.N.M.; Muttaqi, K.M.; Dong, Z.Y. Hydrogen energy storage integrated battery and supercapacitor-based hybrid power system: A statistical analysis towards future research directions. Int. J. Hydrogen Energy 2022, 47, 39523–39548. [Google Scholar] [CrossRef]
  4. Levene, J.; Kroposki, B.; Sverdrup, G. Wind Energy and Production of Hydrogen and Electricity—Opportunities for Renewable Hydrogen. In Proceedings of the 2006 POWER-GEN Renewable Energy and Fuels Technical Conference, Las Vegas, NV, USA, 10–12 April 2006. [Google Scholar]
  5. Becerra, M.; Moran, J.; Jerez, A.; Cepeda, F.; Valenzuela, M. Wind energy potential in Chile: Assessment of a small-scale wind farm for residential clients. Energy Convers. Manag. 2017, 140, 71–90. [Google Scholar] [CrossRef]
  6. Singh, M. Dynamic Models for Wind Turbines and Wind Power Plants; National Renewable Energy Lab. (NREL): Golden, CO, USA, 2011; p. 115.
  7. Ulleberg, Ø. The importance of control strategies in PV-hydrogen systems. Sol. Energy 2004, 76, 323–329. [Google Scholar] [CrossRef]
  8. International Renewable Energy Agency (IRENA). Available online: https://www.irena.org/ (accessed on 15 August 2023).
  9. Li, X.; Gao, W.; Feng, Y. A review of hybrid renewable energy systems: A new trend in energy production. Renew. Sustain. Energy Rev. 2020, 132, 110088. [Google Scholar]
  10. U.S. Department of Energy. 2021. Available online: https://www.energy.gov/eere/ (accessed on 10 July 2023).
  11. Bhatt, A.; Chatterjee, P. Hybrid Renewable Energy Systems (HRES) for Sustainable Energy Development. Energies 2020, 13, 3426. [Google Scholar]
  12. Okunlola, A.; Davis, M.; Kumar, A. The development of an assessment framework to determine the technical hydrogen production potential from wind and solar energy. Renew. Sustain. Energy Rev. 2022, 166, 112610. [Google Scholar] [CrossRef]
  13. National Renewable Energy Laboratory. Hybrid Wind Photovoltaic Systems. 2020. Available online: https://www.nrel.gov/docs/fy20osti/74251.pdf (accessed on 18 July 2023).
  14. Ishaq, H.; Dincer, I. Comparative assessment of renewable energy-based hydrogen production methods. Renew. Sustain. Energy Rev. 2021, 135, 110192. [Google Scholar] [CrossRef]
  15. Hassan, Q.; Sameen, A.Z.; Salman, H.M.; Jaszczur, M. Large-scale green hydrogen production via alkaline water electrolysis using solar and wind energy. Int. J. Hydrogen Energy 2023, 48, 34299–34315. [Google Scholar] [CrossRef]
  16. Hassan, N.S.; Jalil, A.A.; Rajendran, S.; Khusnun, N.F.; Bahari, M.B.; Johari, A.; Kamaruddin, M.J.; Ismail, M. Recent review and evaluation of green hydrogen production via water electrolysis for a sustainable and clean energy society. Int. J. Hydrogen Energy 2023. [Google Scholar] [CrossRef]
  17. Nelson, D.B.; Nehrir, M.H.; Wang, C. Unit sizing and cost analysis of stand-alone hybrid wind/PV/fuel cell power generation systems. Renew. Energy 2006, 31, 1641–1656. [Google Scholar] [CrossRef]
  18. Wijaya, A.; Akbar, H.I.; Winardi, S. Modeling and simulation of a standalone hybrid wind-solar-battery system for hydrogen production. Int. J. Hydrogen Energy 2021, 46, 3245–3257. [Google Scholar]
  19. Halder, P.; Babaie, M.; Salek, F.; Haque, N.; Savage, R.; Stevanovic, S.; Bodisco, T.A.; Zare, A. Advancements in hydrogen production, storage, distribution and refuelling for a sustainable transport sector: Hydrogen fuel cell vehicles. Int. J. Hydrogen Energy 2023. [Google Scholar] [CrossRef]
  20. MATLAB Program. Available online: https://www.mathworks.com/products/matlab.html (accessed on 20 December 2022).
  21. Roche, V.; Laurent, V.; Cardello, G.L.; Jolivet, L.; Scaillet, S. Anatomy of the Cycladic Blueschist Unit on Sifnos Island (Cyclades, Greece). J. Geodyn. 2016, 97, 62–87. [Google Scholar] [CrossRef]
  22. Zeng, K.; Zhang, D. Recent progress in alkaline water electrolysis for hydrogen production and applications. Prog. Energy Combust. Sci. 2010, 36, 307–326. [Google Scholar] [CrossRef]
  23. Dekel, D.R. Review of cell performance in anion exchange membrane water electrolysis. J. Appl. Electrochem. 2018, 48, 427–462. [Google Scholar]
  24. Park, J.; Kim, J.H.; Kim, J.H. Review of high-temperature solid oxide electrolysis for hydrogen production. Int. J. Hydrogen Energy 2020, 45, 10291–10307. [Google Scholar] [CrossRef]
  25. Narayan, R.; Cheruvally, G. Temperature effects on the efficiency of hydrogen production by water electrolysis—A review. Int. J. Hydrogen Energy 2017, 42, 19397–19414. [Google Scholar] [CrossRef]
  26. Badwal, S.P.S.; Giddey, S.S.; Munnings, C.; Bhatt, A.I. Review of progress in high-temperature electrolysis and steam electrolysis for hydrogen production. Int. J. Hydrogen Energy 2014, 39, 10362–10384. [Google Scholar] [CrossRef]
  27. Greiner, C.J.; Korpas, M.; Holen, A.T. A Norwegian case study on the production of hydrogen from wind power. Int. J. Hydrogen Energy 2007, 32, 1500–1507. [Google Scholar] [CrossRef]
  28. Tar, K. Some statistical characteristics of monthly average wind speed at various heights. Renew. Sustain. Energy Rev. 2008, 12, 1712–1724. [Google Scholar] [CrossRef]
  29. Vestas Wind Turbine. Available online: https://www.vestas.com/en (accessed on 10 May 2023).
  30. Bodie, Z.; Kane, A.; Markus, A. Investments; McGraw-Hill Education: New York, NY, USA, 2014. [Google Scholar]
  31. Anastasiadis, A.; Oikonomou, I.; Vokas, G. Optimal Levelised Cost of System Values with increasing Renewable Energy Sources in a Smart Microgrid. AIP Conf. Proc. 2019, 2190, 020060. [Google Scholar] [CrossRef]
  32. Financial Advisory and Asset Management LAZARD. Available online: https://www.lazard.com/financial-advisory/ (accessed on 20 August 2023).
  33. PVGIS Software. Available online: https://joint-research-centre.ec.europa.eu/photovoltaic-geographical-information-system-pvgis_en (accessed on 15 August 2023).
  34. Anastasiadis, A.G.; Konstantinopoulos, S.A.; Kondylis, G.P.; Vokas, G.A.; Papageorgas, P. Effect of fuel cell units in the economic and environmental dispatch of a Microgrid with penetration of photovoltaic and microturbine units. Int. J. Hydrogen Energy 2017, 42, 3479–3486. [Google Scholar] [CrossRef]
  35. Hatziargyriou, N.D.; Anastasiadis, A.G.; Tsikalakis, A.G.; Vasiljevska, J. Quantification of economic, environmental and operational benefits due to significant penetration of Microgrids in a typical LV and MV Greek network. Eur. Trans. Electr. Power Eur. Trans. Electr. Power 2011, 21, 1217–1237. [Google Scholar] [CrossRef]
  36. Anestis, A.; Georgios, V. Economic Benefits of Smart Microgrids with Penetration of DER and mCHP Units for Non-Interconnected Islands. Renew. Energy Int. J. 2019, 142, 478–486. [Google Scholar] [CrossRef]
  37. Lazard Site. Available online: https://www.lazard.com/ (accessed on 20 August 2023).
  38. International Energy Agency. World Energy Outlook 2020; International Energy Agency: Paris, France, 2020. [Google Scholar]
  39. Toyota Mirai Car Site. Available online: https://www.toyota.com/mirai/ (accessed on 12 August 2023).
  40. Eurostat. Electricity Price Statistics. Available online: https://ec.europa.eu/eurostat/statisticexplained/index.php?title=Electricity_price_statistics (accessed on 8 September 2023).
  41. Hosseini, S.E.; Wahid, M.A. Hydrogen production from renewable and sustainable energy resources: Promising green energy carrier for clean development. Renew. Sustain. Energy Rev. 2016, 57, 850–866. [Google Scholar] [CrossRef]
  42. Noussan, N.; Raimondi, P.P.; Scita, R.; Hafner, M. The Role of Green and Blue Hydrogen in the Energy Transition—A Technological and Geopolitical Perspective. Sustainability 2021, 13, 298. [Google Scholar] [CrossRef]
  43. Dincer, I.; Acar, C. Innovation in hydrogen production. Renew. Sustain. Energy Rev. 2017, 42, 14843–14864. [Google Scholar] [CrossRef]
  44. Nikolaidis, P.; Poullikkas, A. A comparative overview of hydrogen production processes. Renew. Sustain. Energy Rev. 2017, 67, 597–611. [Google Scholar] [CrossRef]
Figure 1. The island of Sifnos on a map of Greek islands (Aegean Sea—Cyclades).
Energies 16 07990 g001
Figure 2. Road map of Sifnos (Triangles – Peaks, Dotted – Ship routes, Purple line - Borders).
Energies 16 07990 g002
Figure 3. The proposed HyPS.
Energies 16 07990 g003
Figure 4. Simplified flow chart of the implemented algorithm.
Energies 16 07990 g004
Figure 5. Hourly wind speed curve per month (2020 year).
Energies 16 07990 g005
Figure 6. Characteristic wind speed–power curve for WT (VESTAS 200 kW).
Energies 16 07990 g006
Figure 7. Power curve production for VESTAS200 WT for the whole year (per hour)—estimated capacity factor of WT, CF = 37%.
Energies 16 07990 g007
Figure 8. Data for PV system (PVGIS 2020) [33].
Energies 16 07990 g008
Figure 9. Power production curve for PV system for the whole year (per hour).
Energies 16 07990 g009
Figure 10. H2 consumption curve for vehicles for the whole year (per hour).
Energies 16 07990 g010
Figure 11. Load demand curve for the whole year (per hour).
Energies 16 07990 g011
Figure 12. Total power from the RES (WT + PV) for one year (per hour).
Energies 16 07990 g012
Figure 13. H2 production from the RES (WT + PV) for one year (per hour).
Energies 16 07990 g013
Figure 14. Total power from the grid for one year (per hour).
Energies 16 07990 g014
Figure 15. Total power to the grid for one year (per hour).
Energies 16 07990 g015
Figure 16. Real hourly H2 consumption curve for one year.
Energies 16 07990 g016
Figure 17. Hourly H2 storage curve for one year.
Energies 16 07990 g017
Figure 18. Hourly H2 deficit curve for one year.
Energies 16 07990 g018
Figure 19. Hourly production curve of fuel cell for one year.
Energies 16 07990 g019
Figure 20. Estimated reduction in the LCOE and price of green hydrogen produced for the proposed hybrid power system with a time horizon of 2050 assuming a uniform reduction in the installation cost (CAPEX) of its components by 2% annually.
Energies 16 07990 g020
Figure 21. Estimated reduction in the LCOE and price of green hydrogen produced for the proposed hybrid power system through better capacity factor values for both WT (areas with better wind potential) and PV (more southerly areas).
Energies 16 07990 g021
Figure 22. Effect of percentage reduction in electrolyzer cost on the LCOE value for the hybrid case study system.
Energies 16 07990 g022
Table 2. Characteristics of H2, electrolyzer specifications, and details of the Toyota Mirai car.
Characteristics of H2
Energy Density39.4 kWh/kg
Density at Atmospheric Pressure0.09 kg/m3
Density at 350 bar26.1 kg/m3
Density at 700 bar42 kg/m3
Electrolyzer Specifications
Electrolyzer236 kW
Hydrogen Mass Production2.6 kg/h
Power Consumed per Mass of H264.5 kWh/kg
Toyota Mirai Car
Hydrogen Tank5.6 kg
Pressure700 bar
Range3 km/kWh
Table 3. Input data for the cost analysis [8,13,37,38].
Data for Cost Analysis
Interest Rate (i)0.07
Inflation Rate (f)0.02
Project Life for Wind Generator (years)20
Project Life for PV Generator (years)20
Project Life for Electrolyzer (years)10
Project Life for Fuel Cell (years)20
Project Life for Hydrogen Tank (years)10
Project Life for Other Items (years)10
Initial Capital Cost of Wind Generator (EUR/kW)1400
Initial Capital Cost of PV Generator (EUR/kW)1200
Initial Capital Cost of Electrolyzer (EUR/kW)650
Initial Capital Cost of Fuel Cell (EUR/kW)190
Initial Capital Cost for Hydrogen Tank (EUR/kg)560
Initial Capital Cost for Other Equipment (EUR/kW)300
Rated Power of Wind Generator (kW)200
Rated Power of PV Generator (kW)50
Rated Power of Electrolyzer (kW)64.5
Rated Power of Fuel Cell (kW)190
Rated mass of Hydrogen Tank (kg)42
Operation and Maintenance Cost for the first year of Wind Generator (EUR/kW)56
Operation and Maintenance Cost for the first year of PV Generator (EUR/kW)30
Operation and Maintenance Cost for the First Year of Electrolyzer (EUR/kW)32.5
Operation and Maintenance Cost for the First Year of Fuel Cell (EUR/kW)2
Operation and Maintenance Cost for the First Year of Hydrogen Tank (EUR/kg)5.6
Operation and Maintenance Cost for the First Year for Other Equipment (EUR/kW)16.5
Table 4. Output results for the cost analysis.
EquipmentInitial Investment (IV)
(EUR)
Maintenance Cost in the First Year
(EUR)
Annualized Replacement Cost
(EUR)
Annualized Total Cost
(EUR)
Wind Generator (1)280,0004% of IV (11,200)0291,200
PV Generator (2)60,0002.5% of IV (1500)061,500
Electrolyzer (3)41,9255% of IV (2096.25)51,106.34195,127.591
Fuel Cell (4)36,1001% of IV (361)036,461
Hydrogen Tank (5)23,5201% of IV (235.20)28,670.74852,425.948
Other Equipment (20%) of (sum = 1 + 2 + 3 + 4 + 5)94,3505.5% of IV (5189.25)115,021.125214,560.375
Total535,89520,581.700194,789.213751,274.914
Table 5. Effect of inflation and interest rate on the LCOE price and cost of green produced hydrogen for the proposed hybrid power system.
Inflation 2%Inflation 4%Inflation 6%
LCOEPrice of H2LCOEPrice of H2LCOEPrice of H2
(EUR/kWh)(EUR/kg)(EUR/kWh)(EUR/kg)(EUR/kWh)(EUR/kg)
Initial Interest Rate7%0.1254.1770.1314.3600.1374.580
Various Interest Rates4%0.1043.4670.1083.6100.1133.780
5%0.1113.6930.1163.8500.1214.037
6%0.1183.9300.1234.1000.1294.303
7%0.1254.1770.1314.3600.1374.580
8%0.1334.4300.1394.6300.1464.867
9%0.1414.6930.1474.9070.1555.160
10%0.1494.9630.1565.1930.1645.463
Disclaimer/Publisher’s Note: The statements, opinions and data contained in all publications are solely those of the individual author(s) and contributor(s) and not of MDPI and/or the editor(s). MDPI and/or the editor(s) disclaim responsibility for any injury to people or property resulting from any ideas, methods, instructions or products referred to in the content.

