
The Use of Biomethane in Internal Combustion Engines for Public Transport Decarbonization: A Case Study


1
Department of Energy, Politecnico di Torino, 10129 Torino, Italy
2
Paris School of International Affairs, Sciences Po, 75007 Paris, France
Energies 2023, 16(24), 7995; https://doi.org/10.3390/en16247995
Submission received: 18 November 2023
/
Revised: 3 December 2023
/
Accepted: 8 December 2023
/
Published: 10 December 2023
(This article belongs to the Section A4: Bio-Energy)
Abstract
:Public transport can play a central role in representing a viable and sustainable mobility solution, especially in urban areas. Average energy consumption and emissions per passenger are much lower than for private cars. At the same time, current buses often mostly rely on diesel, and there are different solutions that can contribute to public transport decarbonization. Biomethane is among the options to exploit local low-carbon resources to decrease the emissions of public transport in urban environments. This paper presents the analysis of a real case study considering real data on the fuel consumption and mileage of the existing bus fleet in the city of Turin, Italy, composed by diesel and natural gas buses. The aim of this study is to estimate the effect of different penetration levels of biomethane in substitution of the current fuels. The results show that the use of biomethane in urban buses could save to up to 71% of emissions compared to the current situation, and savings would increase to 75% when deploying biomethane and electric buses together. Average emissions per pkm could decrease from a current level of 85.5 gCO2/pkm to 21.3–63.4 gCO2/pkm depending on the penetration of biomethane and electric buses. The sensitivity analysis shows even higher savings when accounting for the future decrease of the electricity carbon intensity in Italy and for the additional benefits related to avoided emissions from manure disposal. The results of the analysis demonstrate the potential contribution of biomethane in decarbonizing urban buses, and the findings presented for this case study can be of use for policy makers and researchers that deal with a similar situation in other cities and countries.
1. Introduction
International strategies to decarbonize energy systems and local issues on air quality are two strong drivers towards low-emission solutions for urban transportation. Different transport segments are still heavily relying on oil products, from private cars to public transport. Several regulations and incentives have been set to support the adoption of passenger cars with lower emissions, both for local pollutants [1,2] and CO2 [3]. Regulations at the international and national level have also been complemented by specific limitations in entering the city center in many cities, with low-emission zones that can be accessed only by cars with very low or no tailpipe emissions [4]. Effort is mostly focused on private cars and trucks, which represent the largest share of transport activity, energy consumption and emissions.
However, another transport segment that is facing an important transition is public transport, in particular at the urban level. While some options are already electrified, such as subways and trams, and thus have no direct emissions, the large majority of buses are running on diesel oil. In some cases, and particularly in some countries, cities have adopted natural gas buses over the years to choose a cleaner alternative to decrease local pollution, while now electric buses are being deployed in several cities worldwide.
Natural gas buses have in fact proved that local emissions could be significantly reduced compared to diesel vehicles [5,6], and in particular for particulate matter, which is an issue in many countries. At the same time, their climate impact is often comparable to the diesel alternative, and in some cases it can also be slightly higher due to a lower engine efficiency and possible methane slip in the combustion process [7,8].
In this perspective, biomethane is gaining interest as a renewable and sustainable alternative to fossil natural gas [9]. This fuel can be produced from different pathways, and currently, the main option is the upgrading of the biogas produced in anaerobic digestion plants or in landfills. Biomethane is chemically similar to natural gas, and in some cases even better due to the high concentration of methane, and can thus be used directly in natural gas internal combustion engines. Some countries, such as Italy, already have an important number of vehicles running on natural gas, and a gradual shift to biomethane could provide interesting benefits in terms of climate emissions, with a limited need for investing in new powertrains. The emission savings that can be obtained depend on different factors, including the type of feedstock that is used for the production process and other specific parameters. The EU has set specific targets on the type of feedstock that can be used to ensure a sustainable and low-carbon production of biomethane and to avoid the competition with food and feed agriculture. The upcoming REDIII regulation includes a specific mechanism that require producers to demonstrate a minimum level of emission savings when comparing biomethane with fossil fuels, requiring the use of selected feedstock mixes and exploiting as much as possible agricultural residues and wastes.
This paper focuses on the potential role of biomethane in public transportation by analyzing its possible application for urban buses.
1.1. Literature Review
Compressed natural gas (CNG) buses are a mature technology that has been deployed over the years, mainly thanks to their lower local pollutant emissions compared to diesel. Different studies compare the NOX and particulate matter emissions of these technologies, confirming the advantages of CNG buses against diesel ones [5,7,8]. For this reason, many countries and cities have deployed natural gas buses in the last decades. Olawepo and Chen [6] present a social cost benefit analysis focused on the health benefits of transitioning from diesel to CNG buses, evaluating the monetary effect of avoided premature deaths and respiratory and cardiovascular illnesses in the US.
Although emission savings are often the strongest driver for the deployment of CNG buses instead of conventional diesel buses, the economic sustainability should also be addressed. In particular, the fuel cost can vary significantly from one country to another, depending on the availability of resources and the specific incentives and regulations [10].
However, CNG buses generally show a higher energy consumption compared to diesel buses, due to a lower engine efficiency [11]. CNG bus engines could potentially be closer to diesel ones in terms of energy consumption in series hybrid configurations. As CNG engines show a higher variation in the efficiency map, they would benefit more from being operated only at their most efficient operating point [12].
The higher energy consumption also affects climate emissions. Although natural gas has a lower CO2 emission factor per unit of energy than diesel, the lower engine efficiency counterbalances this advantage. Thus, CNG buses often show comparable climate emissions than those of diesel buses [7,8]. Additionally, the possible methane slip from the engine that is not properly combusted may cause additional climate impacts that are often neglected, although they are estimated to represent a marginal share of total climate emissions in urban buses [13].
Recently, due to strong decarbonization strategies at national and international levels, biomethane is being seen as an interesting opportunity to contribute to decarbonization of transport, which remains a hard-to-abate sector in some segments [9].
Biomethane could be used in internal combustion engines designed for natural gas, due to their similar composition. However, biomethane has in general a higher concentration of CH4 compared to natural gas, and an absence of C2–C4 hydrocarbons. This leads to a slightly lower calorific value, as well as other effects in terms of emissions. Lee et al. [14] highlight that a stoichiometric natural gas engine fueled with biomethane could lead to a lower thermal efficiency compared to the use of natural gas, as well as higher concentration of some pollutants (in particular CH4 and ammonia). Thus, the optimal use of biomethane may need the development of engines that are designed by considering its specific characteristics.
Many studies have addressed biomethane in road transport, especially focusing on its potential application in private cars [15,16] and heavy-duty vehicles [17,18]. The latter have received more attention in the last years: while passenger cars are seeing an increased penetration of battery electric vehicles, direct electrification is currently more difficult for trucks. Thus, alternative low-carbon solutions for freight transport are being analyzed, including biomethane.
Current literature also includes different analyses of case studies that investigate the biomethane production from different feedstocks with the application to transport. Sales Silva et al. [19] assess the technical and economic feasibility of using biomethane generated from landfills in the Southeastern region of Brazil to substitute diesel in vehicles, but without mentioning specific transport applications and their fuel consumption. Keogh et al. [20] present an economic analysis of biomethane injection in the natural gas grid to be supplied to heavy-duty vehicles, highlighting the crucial role of the use of the filling station for the profitability of the proposed solution. Singh and Kalamdhad [21] investigate the biomethane potential to decarbonize the transport sector in India, and their results confirm the massive scope of biogas in the transportation sector, as well as its current limited use.
Some studies specifically focus on urban buses. Chan Gutiérrez et al. [22] estimate that up to 6.5% of diesel used in transport could be displaced by biomethane from food waste, and they highlight that a plant producing 60,000 t/year could supply 136 urban buses. Nadaleti et al. [23] evaluate the benefits that can be obtained by producing biomethane from municipal wastes to supply urban buses in a Brazilian city, evaluating CO2 and pollutants emissions.
The other main option to decarbonize urban buses is direct electrification. Compared to battery electric buses, biomethane could provide some specific advantages. Existing natural gas buses could be used without modifications, and the refuelling process is much faster than the battery recharge, thus leading to a longer range for each vehicle. While electric buses have no direct CO2 emissions, those of biomethane are considered carbon-neutral, as the CO2 that is emitted has been captured by the plants used for its production. On the other hand, both solutions incorporate well-to-tank (WTT) emissions, which depend on the feedstock used for biomethane and the sources of electricity generation. Thus, the comparison of the well-to-wheels (WTW) emissions of biomethane buses could be higher or lower than those of electric buses, depending on the specific situation. These two solutions are not necessarily meant to compete with each other, as each powertrain shows specific advantages for different applications, and the huge challenge of decarbonizing the transport system is likely to require a combination of solutions rather than a single silver bullet technology.
Other solutions are being investigated in the literature to improve the performance of diesel engines and to decrease their carbon emissions and to evaluate the effect on local pollution, including the use of different blends of biofuels [24] or the use of hydrogen or other gaseous fuels in dual-fuel engines [25,26], or hydrogen blends with diesel or biodiesel [27]. Results mostly show positive impacts, although in some cases, the specific fuel consumption is increased, as are some specific pollutant emissions.
Although much emphasis is currently being put on climate and pollutant emissions, the sustainability of any technology should be assessed by taking into account a wide range of aspects. Dahlgren et al. [28] propose a multi-criteria analysis to compare different alternative fuels for buses, considering Sweden as a case study. Their work includes four different areas and twelve indicators, and their results highlight how the choice of the optimal technology depends on the weight of the different aspects being considered. Finally, the advantages of a powertrain over another can also vary from a city to another due to the socio-economic context and the companies that are involved in the process; a clear example is proposed by Mutter [29], which compares the competition between electric and biomethane buses in two Swedish municipalities, with different outcomes.
An analysis of the literature shows the existing interest for biomethane applications in transport, and in some cases specifically for urban buses. However, some research gaps remain to be addressed. The attention to urban buses remains marginal, and very few studies are based on real consumption data from existing bus fleets. Moreover, the estimation of emission savings is often limited to tailpipe emissions, while a comprehensive analysis of the entire supply chain could further increase the reliability of the results. Finally, emission savings from biomethane buses should also be compared against those obtainable using electric buses, given the rising interest towards direct electrification.
1.2. Key Contributions of This Work
This work addresses the current research gap by presenting an analysis of the potential WTW emission savings of different penetration levels of biomethane buses. The city of Turin is considered as a case study, since several buses are already operating with fossil natural gas. The availability of real data on fuel consumption and mileage for both natural gas and diesel buses allows for a reliable estimation of the potential biomethane demand, which is the basis for the scenarios that are evaluated in this study.
This study aims at evaluating the emission savings that can be reached with different penetration levels of biomethane that can substitute the existing fleet of buses running on natural gas and diesel. A specific scenario also evaluates the potential combination of biomethane and electric buses in the fleet. These results can be of interest for policy makers that need to quantify the potential emission savings of a transition towards low-carbon urban buses. Moreover, the available information also allows us to extend the results to other cities based on the indicators that are presented in the paper with respect to the total mobility demand.
The analysis also presents an evaluation of the biomethane production potential in the region to ensure the optimal use of local resources for transport decarbonization. This comparison could provide useful elements to policy makers for a first estimate of the available resources that can be allocated to public transport, also taking into account other potential applications.
2. Materials and Methods
The research goal of this paper is to estimate the potential biomethane demand needed to substitute existing diesel buses, and the related CO2 emission savings that could be obtained. The city of Turin is considered a case study thanks to the favorable conditions both on the demand side (availability of fossil gas buses) and on the supply side (a number of existing biogas plants are operating in the region).
2.1. The City of Turin as a Case Study
This paper focuses on the city of Turin, Italy as a case study. Turin is located in the north-west part of Italy, with a urban population of around 850,000 inhabitants, increasing to 1.4 million when considering the larger metropolitan area. The mobility in the city has been historically dependent on private cars, also due to a big automotive company in the city. Available estimates of public transport modal share show a very strong decrease after the COVID-19 pandemic, with a level of 11% in 2022, more than half of the previous estimate of 23% in 2014 [30]. This level remains much lower compared to most of the other Italian cities, where the public transport use after the pandemic has generally approached the previous levels.
The public transport network in Turin includes diesel, CNG and electric buses, trams and a subway line. As of 2021, Turin’s tram network has a total length of 73 km, making it the second city in Italy after Milan [31]. Its 14 km of subway network (although with a single line) is the fourth in Italy after Milan, Rome and Naples. In the same year, its bus fleet of 750 buses is the third in Italy, although the number of buses per 100,000 inhabitants is lower than many other cities (but higher than the average for Italian cities).
The bus fleet in Turin already includes around one third of the buses that run on fossil natural gas. This choice has been driven mostly by poor air quality concerns, as local pollution is a major problem in Northern Italy, and Turin ranks among the most polluted cities in the country [32].
2.2. Estimation of Biomethane Demand for Urban Buses
The chemical composition of biomethane is very similar to fossil natural gas, although the volumetric share of CH4 is slightly higher. At the same time, the performance of internal combustion engines running on biomethane and natural gas are very similar. For this reason, the consumption data of CNG buses are used as an estimate for biomethane demand. The calculations of this study are based on a biomethane lower calorific value of 9.7 kWh/Sm3 and a density of 0.67 kg/Sm3 [33].
The estimated consumption of CNG urban buses is based on measured data from actual buses in operation in Turin in 2018 [34]. Each bus is equipped with a GPS system that measures the actual distance and is automatically recorded in a centralized database, which is used to program the maintenance of the buses. This information is used to estimate the specific consumption per km, as further described below. The buses are refilled at the end of each day, and the information on the quantity of fuel that is refilled is also recorded in a centralized database for each bus. For this study, aggregated monthly data have been used per each bus family, both for actual distance and fuel consumption.
The main characteristics of the CNG bus fleet is reported in Table 1. There are four different bus models, although most of the fleet is composed of types 2, 3 and 4. The fleet is composed of both 18 m and 12 m buses. The table also reports the nominal fuel consumption provided by the manufacturer.
Additional technical characteristics of the CNG bus fleet, including engine features and empty and full weight, are reported in Table 2. For additional technical data on the bus fleet, please refer to [35].
Available data from [34] include the measurement of real fuel consumption and mileage that can be used for a better estimation of the actual fuel demand of the bus fleet in Turin instead of nominal consumption from data sheets. The measured data, which have been obtained for an entire year of operation, refer to a total mileage of 9 million km for the CNG buses of the fleet.
To compare the performance by accounting for the different sizes of the buses, the specific consumption per passenger-km has been calculated (by considering the maximum capacity). This indicator is then used to estimate the fuel demand for different penetration levels of biomethane buses. It is important to remark that the actual number of passengers will be lower than the maximum capacity, which is reached only during peak hours for some parts of the trips. Nevertheless, the maximum number of pkm is often used as a capacity indicator of a public transport system and is thus a useful metric to extend the results to other systems. The actual number of passengers has a slight influence on the fuel consumption, as it increases the weight of the bus, but this level of detail cannot be considered in this type of analysis.
A similar analysis has been performed also for diesel and electric buses (for which data are also available) in order to estimate the potential emission savings when shifting from a powertrain to another. The electric buses in the urban fleet in Turin in 2018 remain limited. Available electricity consumption data has been used, but these values may be slightly higher that the current best available technology for battery electric vehicles.
2.3. Biomethane Production
The use of biomethane in transport, in addition to reducing carbon emissions, allows us to exploit a local resource, which is often derived from waste streams. Thus, it is important to ensure that the estimated demand can be successfully matched with the production potential in the region.
Biomethane can be produced from the upgrading of biogas generated via anaerobic digestion. There are currently several biogas plants in Italy that exploit a range of agricultural and waste products to generate electricity. Their development has been mostly driven by national incentives in the last decades to increase the share of renewables in power generation.
Considering the Province of Turin, there are currently 59 biogas power plants in operation, with a total nominal capacity of 55.7 MW [36]. The distribution of plants based on the nominal output power is reported in Figure 1. The chart shows a significant variability of the output power, with many small plants and around 25% of the total plants around 1 MW of output power (due to the specific formulation of incentives, that were lower for plants larger than 1 MW).
There are also two biomethane plants already in operation near Turin. The biomethane plant of Pinerolo has a capacity of 800 m3/h and supplies biomethane to the grid, while the plant of Candiolo produces 300 m3/h of liquefied biomethane to be supplied to the transport sector [37]. Moreover, three plants in the province have recently applied for biomethane national incentives [38]. Two new plants will produce 300 and 500 m3/h of biomethane from municipal solid wastes (MSW), while a third plant will re-purpose an existing biogas plant to produce 400 m3/h of biomethane.
For the purpose of this study, the biomethane potential is estimated by considering the conversion of existing biogas plants. This is a preliminary assumption, as a detailed analysis of each plant would be needed to consider the economic conditions of such a conversion, especially due to the distance from the natural gas grid. At the same time, new plants are likely to be built thanks to the existing incentives, leading to an even larger biomethane potential in the region.
2.4. Estimation of Emissions Savings
The estimation of the CO2e emissions in this work is based on specific emission factors per unit of fuel obtained from the literature that are applied to the fuel consumption of the bus fleet. The same approach is used for the different fuels that are analyzed (i.e., diesel, natural gas, biomethane and electricity), both considering the WTT phase and the TTW phase.
Emission savings related to biomethane depend significantly on the type of feedstock that is used in the anaerobic digestion process. A recent study by the EU Joint Research Centre (JRC) [41] estimated the emission savings of the different routes. These figures have been adapted to the Italian context in [33] by considering three different potential feedstock mixes by 2030. This work will consider the “Medium” scenario that corresponds to a feedstock mix based on 69% of double crop, 18% of wet manure, 11% of MSW and 2% of sewage sludge.
Based on this feestock mix, the WTT emissions of compressed biomethane are estimated to be 17.0 gCO2e/MJ, already including the electricity consumption for compressing the gas. These figures are already incorporating the current electricity intensity of Italy (equal to 256.4 gCO2e/kWh, 2021 data). Considering the renewable targets for power generation in Italy by 2030, a decrease of the CO2 intensity of electricity to 101.1 gCO2e/kWh would lower compressed biomethane WTT emissions to 13.7 gCO2e/MJ.
There is an additional aspects that should be discussed when evaluating emission savings of biomethane produced from wet manure. If unused or stored, wet manure would produce CH4 and N2O from naturally occurring anaerobic digestion. These emissions can be avoided by controlling this process in closed tanks and collecting the gas produced [41]. Thus, the production of biogas from manure via anaerobic digestion is a better alternative when considering climate impacts, compared to the traditional use of manure as a fertilizer. The avoided emissions are estimated to be 111.9 gCO2e/MJ by the RED II Directive [42] and by the JRC study [41] (when considering closed digestate storage). This value can be seen as a credit that can be applied to the share of biomethane produced from manure. Considering the “manure credit” specific WTT biomethane emissions for the Italian feedstock mix become negative, reaching a value of −3.3 gCO2e/MJ (and −6.7 gCO2e/MJ when considering the foreseen 2030 electricity mix) [33]. This means that the emissions savings that can be reached could be higher than 100%.
All biomethane emissions are compared to standard TTW and WTT values for diesel and natural gas. The assumed TTW values are 18.9 gCO2e/MJ and 11.4 gCO2e/MJ for diesel and fossil gas, respectively, based on average EU figures from [41]. The corresponding WTT values are 73.6 gCO2e/MJ and 57.5 gCO2e/MJ. The calculation of total emissions also includes the contribution of electric buses. In this case, only WTT emissions are considered, since they do not cause tailpipe emissions. A WTT emission factor of 79.0 gCO2e/MJ is assumed, starting from figures presented in [33] and incorporating the effect of a 90% charging efficiency. When assessing the effect of the electricity carbon intensity evolution in Italy by 2030, as further discussed in the next section, this indicator is expected to decrease to 31.2 gCO2e/MJ (again, using values from [33] and including a 90% charging efficiency).
2.5. Comparison of Alternative Scenarios
A total of four scenarios have been compared to evaluate the different levels at which biomethane could contribute to urban bus decarbonization. The reference scenario (Scenario 0) estimates the fuel consumption and emissions of the current fleet, based on the assumptions explained in the previous sections. The diesel, CNG and electric buses are based on the 2018 fleet data, to be consistent with the availability of fuel consumption data.
Then, three different levels of penetration of biomethane are compared. The first level, in Scenario 1, is the use of biomethane in the current fleet of CNG buses by substituting the fossil natural gas that is currently in use. This is the easiest scenario, as it requires a very limited investment. Under the current policy mechanism in Italy, biomethane could be injected into the natural gas grid by producers, and end users can virtually use it by buying green certificates. At the same time, if producers are located far from the grid, a direct transportation of biomethane to the final users in compressed or liquefied form could be a better option. This detail is beyond the scope of this analysis (assuming the emissions related to the compressed biomethane option).
In the second level of penetration, presented in Scenario 2, the current fleet of diesel buses is totally substituted with CNG buses running on biomethane. The (limited) number of electric buses are not substituted, and they remain in operation. This scenario aims at evaluating the maximum contribution of biomethane and compares the highest level of biomethane demand against its potential production on the region.
The current investment plan of the city of Turin includes an important share of new electric buses, supported by national incentives related to the EU Recovery Fund. The public transport operator estimates that by 2026, a total of 81% of the offered passenger-km will be relying on electric buses. Thus, in the last scenario (Scenario 3), electric buses are assumed to reach the expected level, and the remainder of the service is provided by biomethane (while in the hypothesis of the public transport operator, this share is supplied by 14% of CNG buses and 5% of diesel buses). This scenario allows us to evaluate how a mixed contribution of electricity and biomethane buses perform against a full biomethane penetration.
A summary of the distribution of annual offered pkm is reported in Table 3.
3. Results
3.1. Calculation of Biomethane Consumption in Urban Buses
Around one third of the bus fleet in Turin is already relying on compressed natural gas. Monthly operational data of the bus fleet in Turin for 2018 have been collected by [34]. Available information for the CNG buses includes the fuel consumption (expressed on a mass basis) and the total distance operated for each bus type. The CNG bus fleet in Turin is based on four different types of buses, for a total of almost 270 buses as of 2018 (see Table 1). To compare the performance of the different buses, it is possible to consider the maximum passenger capacity of each bus class to calculate the specific natural gas consumption expressed in kg per 100 seat-km (corresponding to passenger-km at full capacity). The specific consumption calculated on a monthly basis for the four bus types are reported in Figure 2.
Data show an important variability, both across bus types and across months. On average, the difference between one bus type and another seems to remain quite constant, although there are some anomalies, especially in the last quarter of the year. Gas consumption can be related to a number of factors, including the average passenger load, the average speed (which is related to the level of congestion), the need for cooling onboard, and other auxiliary services. However, the differences from one month to another do not seem to be comparable for each bus family, so it is hard to find the main causes of variability without further investigation.
Monthly specific natural gas consumption values range from 0.44 to 0.69 kg/100 pkm. Considering annual values for each bus type, the specific consumption ranges from −6% to +16% of the nominal fuel consumption reported in the datasheets. However, the weighted average consumption of the entire fleet, equal to 0.570 kg/100 pkm, is only 1% higher than the nominal value. Considering a low calorific value of 14.4 kWh/kg for natural gas, the specific fuel consumption can be expressed as 8.22 kWh/100 pkm (considering 100% passenger load).
This figure is used to estimate the biomethane demand related to the bus fleet, under the assumption that the chemical composition of biomethane can be considered similar to fossil natural gas. The actual composition of both fuels shows some variability, but average values represent an acceptable approximation for the purpose of this study.
A similar analysis has been performed on diesel buses, considering four types of buses that are comparable to the CNG buses presented above. The weighted average consumption of diesel buses is 0.473 L/100 pkm, and it is 3% higher than the nominal value. Considering a low calorific value of 10.3 kWh/L for diesel, the specific fuel consumption is 4.88 kWh/100 pkm (considering 100% passenger load). The same analysis for the electric fleet leads to a specific fuel consumption of 1.43 kWh/100 pkm, which is 1% higher than the nominal value. However, in this case the number of electric vehicles in operation is quite limited and may not be directly comparable with the other two powertrains.
3.2. Biomethane Potential Demand for Urban Buses
Depending on the scenario that is considered, the biomethane demand of the urban bus fleet in Turin is estimated by considering average fuel consumption data from the real operation of CNG buses.
Scenario 1 represents the substitution of the fossil gas used in the current fleet with biomethane. In this case, the estimated annual consumption is equal to 86.4 GWh, which corresponds to 8.9 million cubic meters. The annual demand increases to 30.1 million cubic meters, or 292.0 GWh, if substituting all the CNG and diesel buses (Scenario 2), which is the highest demand among the cases considered in this study. The last case, in Scenario 3, where a very high penetration of electric buses is evaluated, would require only 5.9 million cubic meters of biomethane, or 57.0 GWh. This value is the lowest of the three cases under analysis, due to the very high contribution of battery electric vehicles considered in the scenario.
A summary of the energy consumption of urban buses in the different scenarios is reported in Table 4.
The results of the analysis show an important variability of demand across the scenarios, highlighting the potential range of biomethane supply that would be needed. For this reason, a clear strategy is required for a correct planning of the future demand and the matching with the production potential, which will be discussed in the next section. Moreover, the estimated demand is also used to estimate the total potential emissions savings in the three scenarios.
3.3. Biomethane Production Potential
A preliminary assessment of the biomethane potential can be estimated by considering the current production of biogas via anaerobic digestion in the province of Turin. The conversion of the current biogas plants operating in the area, with the assumptions described in Section 2.3, could lead to a total biomethane production capacity of around 13,900 m3/h, equal to 118 million m3 per year.
The production potential is therefore much higher than the estimated demand of the bus fleet in the different scenarios. The estimated demand for urban buses remains limited from 5% to 26% of the maximum production potential, depending on the scenario. However, it is important to remark that other transport segments may also consume biomethane, including private cars, trucks and shipping. Some of these applications may also lead to higher CO2 emission savings compared to urban buses, depending on the technology that is substituted by biomethane.
This result can be compared to other available data at different levels. A recent analysis estimates the maximum potential of biomethane production from manure in the province, which is equal to 66 million m3 per year [43]. No information is available regarding other potential feedstocks with this geographical focus. Considering the national level, a recent estimate of the 2030 biomethane potential in Italy is 5.8 billion m3 [44], although other sources provide higher estimates. Scaling this number to the Turin province based on the current biogas installed power (which equals to 4.2% of the total national capacity) would lead to an estimate of 244 million m3, around twice the estimated potential from current biogas plants. However, this is a strong approximation, as a reliable estimate of the provincial potential would require a dedicated analysis, based on the availability of the different feedstocks that could be exploited.
3.4. Estimation of CO2 Emission Savings
The first comparison of emission savings in the three scenarios is based on the most conservative assumptions—i.e., the current electricity mix—and without considering the emissions credits from manure (that would incorporate the emissions savings related to the avoided manure disposal, as described in the methodology section). As reported in Figure 3, the estimated WTW emissions of the reference scenario (Scenario 0) reach 62.4 kt of CO2e, of which around two thirds are caused by diesel buses and the remaining third by CNG buses running on fossil gas (electric buses sum up to less than 1% of the total). The TTW emissions account for 80% of the total, as usually happens for transport systems based on fossil fuels.
The substitution of the current fossil gas use with biomethane would save around 26% of the total emissions, without the need for important investments on the bus fleet (Scenario 1). A stronger intervention that aims at also substituting diesel vehicles will push emissions savings to 71% of the total (Scenario 2). Scenario 3 shows instead the benefits of a strong electrification of the bus fleet (estimated at 81% of the total offered pkm, according to a strategy by the public transport operator), coupled with biomethane for the remaining part of the trips, would increase emissions savings to 75%.
The figures show that around 25% of emission savings could be reached with minimum investment in the bus fleet. The other two scenarios that are considered show comparable emissions savings, which are around the triple compared to Scenario 1, but require an important investment in the renovation of the bus fleet and in the energy supply infrastructure. In the case of Scenario 3, this would also require the installation of an important amount of charging stations for the electric buses. An evaluation of potential technical limitations and barriers is beyond the scope of this work, but should also be considered when comparing the effectiveness of these scenarios.
The CO2 emissions of the different powertrains and scenarios could also be expressed with respect to transported passengers to make them comparable with other studies and other transport modes. There is currently no information on the load factor of urban buses in Turin due to the lack of specific measurements. For this reason, two reference load factors are assumed: a high load factor, equal to 80% of the total bus capacity, which is representative of the peak hours, and a load factor of 20% to account for the average use of urban buses. The average load factor is assumed based on a comparison of Italian statistics on urban public transport in 2018, comparing estimated pkm and offered pkm. Using these assumptions, the specific emissions per each powertrain and scenario are reported in Figure 4.
The results show that the current average WTW CO2 emissions of urban buses in Turin (Scenario 0) are 85.5 gCO2/pkm, decreasing to 21.4 gCO2/pkm during peak hours. These values result from the combination of diesel and fossil gas powertains. The other three scenarios, with different levels of biomethane and electric buses penetration, show specific emissions of 63.4 gCO2/pkm, 25.0 gCO2/pkm and 21.3 gCO2/pkm for Scenarios 1, 2 and 3, respectively. These values are comparable to other studies in the literature. A recent review of several WTW studies [45] reports that urban buses running on diesel have specific WTW emissions in the range 55–112 gCO2/pkm (average 87 gCO2/pkm, median 93 gCO2/pkm).
The results that have been presented are considering the current average electricity carbon intensity in Italy, and the additional emissions savings related to manure credits are not considered. The combined effect of these two additional assumptions is reported in Figure 5 as a sensitivity analysis to assess the variation on the main results.
The results of Figure 5 show that the decreasing carbon intensity of the electricity by 2030 would have positive effects in terms of emissions savings. This effect alone would increase savings from 26% to 27% in Scenario 1, from 71% to 76% in Scenario 2 and from 75% to 88% in Scenario 3. The highest effect is noticeable in this last scenario, as decreasing electricity carbon intensity leads to higher emissions savings for electric buses than for biomethane buses. Also, when considering the 2030 electricity carbon intensity, Scenario 3 shows the highest savings, and the difference from Scenario 3 and Scenario 2 is even higher compared to the previous results.
On the other hand, when considering the emissions credits related to the use of wet manure for biomethane production, Scenario 2 becomes the best solution to maximize emissions savings. In fact, savings go beyond 100% with both electricity carbon intensity levels. This is of course related to the fact that additional emissions are saved when using biomethane, which has thus an equivalent negative emission factor. This effect should be considered carefully, as a higher energy consumption would lead to higher emission savings, representing a strong barrier to energy efficiency measures. An example could be the use of CNG hybrid buses, whose decrease in fuel consumption would paradoxically decrease emissions savings. Nevertheless, it is important to remember that biomethane potential remains limited, and the available resources should thus be used in the most effective way.
4. Discussion
The results of the analysis show the important emission savings that could be achieved by biomethane. Although this work has been focused on urban public transport, biomethane is a finite resource that could also be used for other applications in compressed or liquefied form. In particular, liquefied biomethane could represent an interesting option for coaches and trucks, thanks to the better efficiency and range that could be reached. These segments are currently seeing a gradual penetration of fossil LNG as an alternative to diesel, and in some (limited) cases, they are being fueled with biomethane. The liquefaction of biomethane requires additional energy consumption, leading to more climate emissions. At the same time, it could represent an interesting option for production sites that are far from the natural gas grid, and during the liquefaction process, the carbon dioxide contained in the biogas could be easily separated in liquid form and supplied for a range of applications (including the food industry).
As already mentioned in the previous sections, the current standard decarbonization option in buses is the direct electrification with battery electric vehicles. Although electric and biomethane vehicles are often put in competition with each other, they could also be seen as complementary solutions. Biomethane buses could be used in routes that require long mileage and are not suitable for electric vehicles, as current batteries would not allow an entire day of operation without recharging. Moreover, a diversified bus fleet would also provide a useful redundancy in cases of problems on the supply of one of the fuels (e.g., commodity prices, supply chain disruptions, etc.).
Current urban buses have started using biomethane in powertrains designed for fossil natural gas, which has a lower share of CH4 and a part of C2–C4 hydrocarbons. As shown in [46], biomethane consumption is comparable to natural gas, although [14] remarks that it could perform differently in some specific conditions, and thus, the development of specific engine designs may improve performance and reduce fuel consumption and emissions. Moreover, some companies are evaluating the possibility of developing hybrid powertrains, which in the case of fossil natural gas can decrease fuel consumption and emissions by up to 16% [47]. This could further improve the effectiveness of biomethane in substitution for traditional fossil fuels. Similarly, liquefied biomethane could also represent an interesting option, especially for interurban public transport. Some companies are already providing some commercial models of LNG coaches that could be fueled with biomethane. However, their current level of maturity is much lower than the CNG buses.
The diffusion of biomethane in the transport sector, just like for direct electrification, would shift the focus from tailpipe emissions to the previous steps of the supply chain. To ensure the minimization of climate emissions throughout the supply chain, it is important to focus on specific feedstocks. In the EU, the RED directive [42] is gradually limiting the types of feedstocks that are allowed by excluding those that compete with food and feed and fixing minimum thresholds of emission savings compared to fossil reference alternatives. Priority should be given to wastes, both from agricultural processes and urban wastes, as well as to double crop cultures that can maximize the use of the soil and ensure also other benefits to the agriculture.
The results of the sensitivity analysis show how the carbon intensity of the electricity mix and the consideration of emission credits from wet manure can affect the estimation of emissions savings and the comparison across scenarios. The strongest effect is due to the choice of considering additional emission savings from wet manure. This approach is quite common in the literature [41], but this is of course meaningful only when manure would not have been used for other purposes. This is not always easy to demonstrate, and for this reason, these additional emissions are not always considered when assessing climate benefits of biomethane.
This analysis has been focused on energy and climate impacts, and an economic assessment will be developed in a future work. However, it is important to acknowledge that economic and financial sustainability is crucial to support the deployment of any technology. Available studies in the literature show that biomethane production costs are often higher than natural gas market prices in different world regions. When considering the Italian context, some recent studies [48,49] report a range of production cost between 0.54 and 0.78 €/Sm3, depending on the size of the plant and the type of distribution. Rotunno et al. [48] focuses on a biomethane plant of 120 Sm3/h, and their results include a production cost of 0.54 €/Sm3 for biomethane supplied to the natural gas grid, and 0.73 €/Sm3 for compressed biomethane for transport applications. The production cost is related to the plant size: for a plant output of 250 Sm3/h (i.e., around the double of the previous one), production costs decrease by 17% for grid injection and 23% for CNG for transport. These values are generally higher than the average price of fossil natural gas, although the significant rise in gas prices in Europe in 2022 due to the Ukraine war has demonstrated the volatility of the market. Conversely, biomethane production costs are less vulnerable to strong market variations. However, these comparisons do not take into account climate externalities. Business plans for biomethane urban buses would need to incorporate the benefits of emissions savings in terms of carbon pricing, depending on the specific situation that is applicable or expected (e.g., emissions trading system, carbon taxation, other incentives).
The approach presented in this analysis includes some assumptions and limitations that are related to the data availability for the specific case. Fuel consumption data supporting this analysis is based on CNG buses, and although different research papers report a similar consumption for biomethane [46,50], some authors show that using biomethane could in some cases increase fuel consumption [14]. This should thus be verified with operational data. Moreover, it is assumed that the diesel buses that will be substituted are on average operating on similar routes compared to CNG buses, but this assumption is justified by the relevant number of CNG buses operating in the city that already represent an important share of the total bus fleet.
Finally, the scenarios considered in this analysis are specifically focused on biomethane, although Scenario 3 incorporates the potential electrification of an important part of the bus fleet that is planned for the next years (also relying on specific national public incentives). Also, there is currently a higher share of electric buses compared to the situation for which the data were available (year 2018). Energy consumption data of the electric bus fleet in 2018 are used for the evaluation of Scenario 3 and also if there is the risk of slightly overestimating specific energy consumption when compared with the current generation of electric buses. Nevertheless, this assumption does not affect the significance of the final results since the impact on total figures is likely to remain limited.
5. Conclusions
This paper presents an analysis of the potential contribution of biomethane in decarbonizing urban public transport. The results show the emission savings that can be achieved compared to the current CNG and diesel buses, based on a specific case study—the city of Turin—and exploits the availability of real fuel consumption data for the existing bus fleet.
Results show that biomethane is an effective solution to decrease WTW emissions in urban bus fleets. Emission savings using conservative assumptions are in the range of 26% to 71%, depending on the share of the bus fleet that could be substituted (and even higher in some sensitivity assumptions), and increase to 75% when biomethane buses and electric buses are deployed together. Average emissions per pkm could decrease from a current level of 85.5 gCO2/pkm to 21.3–63.4 gCO2/pkm depending on the penetration of biomethane and electric buses. These results could be further improved by developing policies aiming at increasing the average occupancy of urban buses, which remain limited, especially outside of peak hours.
Moreover, the feedstock mix for the production of biomethane is a key parameter in the estimation of emissions savings considering the entire supply chain of the fuel. For this reason, it is important to support the most effective feedstocks, as is already being done by the EU regulation that sets minimum levels of emissions savings for transport biofuels. Additional incentives to support the solutions with the highest emission savings could further push producers to minimize emissions throughout the supply chain. Another important parameter, as demonstrated by the results of this study, is the carbon intensity of the electricity consumed in the different stages of the supply chain.
Urban buses running on biomethane currently have higher costs compared to traditional fossil-based vehicles. However, as confirmed by the results of this study, potential climate emissions savings are significant. A proper accounting of these emissions savings and their pricing would thus be the basis for supporting the development of decarbonization technologies. In this respect, a policy support towards alternative low-carbon solutions (e.g., biomethane, electric buses, hydrogen buses) should aim at prioritizing the cheapest solution to decarbonize public transport. To support such an evaluation, standard methods and procedures to assess emissions savings should be adopted, ideally at the international or national level. These schemes could then be applied by cities to reach decarbonization targets.
In tandem with the analysis of the potential demand, an evaluation of the biomethane production potential is needed by guaranteeing the use of sustainable feedstocks in accordance with EU and other international standards. The match between demand and supply is crucial to ensure the optimal use of local resources. While this analysis presents a case study focused on urban public transport, it is important that decarbonization policies are organized in a coherent framework across final sectors to allocate available resources in the most profitable applications.
Funding
This research received no external funding.
Data Availability Statement
Data are available upon request.
Conflicts of Interest
The author declares no conflict of interest.
Abbreviations
The following abbreviations are used in this manuscript:
| CNG | compressed natural gas |
| EU | European Union |
| GPS | Global Positioning System |
| JRC | Joint Research Centre |
| LNG | liquefied natural gas |
| MSW | municipal solid waste |
| RED | Renewable Energy Directive |
| TTW | tank-to-wheels |
| WTT | well-to-tank |
| WTW | well-to-wheels |
References
- Crippa, M.; Janssens-Maenhout, G.; Guizzardi, D.; Galmarini, S. EU effect: Exporting emission standards for vehicles through the global market economy. J. Environ. Manag. 2016, 183, 959–971. [Google Scholar] [CrossRef]
- Park, J.; Shin, M.; Lee, J.; Lee, J. Estimating the effectiveness of vehicle emission regulations for reducing NOx from light-duty vehicles in Korea using on-road measurements. Sci. Total Environ. 2021, 767, 144250. [Google Scholar] [CrossRef]
- Thiel, C.; Nijs, W.; Simoes, S.; Schmidt, J.; van Zyl, A.; Schmid, E. The impact of the EU car CO2 regulation on the energy system and the role of electro-mobility to achieve transport decarbonisation. Energy Policy 2016, 96, 153–166. [Google Scholar] [CrossRef]
- Noussan, M.; Hafner, M.; Tagliapietra, S. Policies to Decarbonize the Transport Sector. In The Future of Transport between Digitalization and Decarbonization: Trends, Strategies and Effects on Energy Consumption; Springer International Publishing: Cham, Switzerland, 2020; pp. 71–112. [Google Scholar] [CrossRef]
- Rodman Oprešnik, S.; Seljak, T.; Vihar, R.; Gerbec, M.; Katrašnik, T. Real-World Fuel Consumption, Fuel Cost and Exhaust Emissions of Different Bus Powertrain Technologies. Energies 2018, 11, 2160. [Google Scholar] [CrossRef]
- Olawepo, J.O.; Chen, L.W.A. Health Benefits from Upgrading Public Buses for Cleaner Air: A Case Study of Clark County, Nevada and the United States. Int. J. Environ. Res. Public Health 2019, 16, 720. [Google Scholar] [CrossRef]
- Guo, J.; Ge, Y.; Hao, L.; Tan, J.; Li, J.; Feng, X. On-road measurement of regulated pollutants from diesel and CNG buses with urea selective catalytic reduction systems. Atmos. Environ. 2014, 99, 1–9. [Google Scholar] [CrossRef]
- Rosero, F.; Fonseca, N.; López, J.M.; Casanova, J. Effects of passenger load, road grade, and congestion level on real-world fuel consumption and emissions from compressed natural gas and diesel urban buses. Appl. Energy 2021, 282, 116195. [Google Scholar] [CrossRef]
- Prussi, M.; Padella, M.; Conton, M.; Postma, E.; Lonza, L. Review of technologies for biomethane production and assessment of Eu transport share in 2030. J. Clean. Prod. 2019, 222, 565–572. [Google Scholar] [CrossRef]
- Topal, O.; Nakir, I. Total Cost of Ownership Based Economic Analysis of Diesel, CNG and Electric Bus Concepts for the Public Transport in Istanbul City. Energies 2018, 11, 2369. [Google Scholar] [CrossRef]
- Lajunen, A.; Lipman, T. Lifecycle cost assessment and carbon dioxide emissions of diesel, natural gas, hybrid electric, fuel cell hybrid and electric transit buses. Energy 2016, 106, 329–342. [Google Scholar] [CrossRef]
- Kivekäs, K.; Lajunen, A.; Vepsäläinen, J.; Tammi, K. City Bus Powertrain Comparison: Driving Cycle Variation and Passenger Load Sensitivity Analysis. Energies 2018, 11, 1755. [Google Scholar] [CrossRef]
- Muñoz, P.; Franceschini, E.A.; Levitan, D.; Rodriguez, C.R.; Humana, T.; Correa Perelmuter, G. Comparative analysis of cost, emissions and fuel consumption of diesel, natural gas, electric and hydrogen urban buses. Energy Convers. Manag. 2022, 257, 115412. [Google Scholar] [CrossRef]
- Lee, S.; Yi, U.H.; Jang, H.; Park, C.; Kim, C. Evaluation of emission characteristics of a stoichiometric natural gas engine fueled with compressed natural gas and biomethane. Energy 2021, 220, 119766. [Google Scholar] [CrossRef]
- Bordelanne, O.; Montero, M.; Bravin, F.; Prieur-Vernat, A.; Oliveti-Selmi, O.; Pierre, H.; Papadopoulo, M.; Muller, T. Biomethane CNG hybrid: A reduction by more than 80% of the greenhouse gases emissions compared to gasoline. J. Nat. Gas Sci. Eng. 2011, 3, 617–624. [Google Scholar] [CrossRef]
- Goulding, D.; Power, N. Which is the preferable biogas utilisation technology for anaerobic digestion of agricultural crops in Ireland: Biogas to CHP or biomethane as a transport fuel? Renew. Energy 2013, 53, 121–131. [Google Scholar] [CrossRef]
- Madhusudhanan, A.K.; Na, X.; Boies, A.; Cebon, D. Modelling and evaluation of a biomethane truck for transport performance and cost. Transp. Res. Part Transp. Environ. 2020, 87, 102530. [Google Scholar] [CrossRef]
- Gustafsson, M.; Svensson, N. Cleaner heavy transports—Environmental and economic analysis of liquefied natural gas and biomethane. J. Clean. Prod. 2021, 278, 123535. [Google Scholar] [CrossRef]
- Sales Silva, S.T.; Barros, R.M.; Silva dos Santos, I.F.; Maria de Cassia Crispim, A.; Tiago Filho, G.L.; Silva Lora, E.E. Technical and economic evaluation of using biomethane from sanitary landfills for supplying vehicles in the Southeastern region of Brazil. Renew. Energy 2022, 196, 1142–1157. [Google Scholar] [CrossRef]
- Keogh, N.; Corr, D.; O’Shea, R.; Monaghan, R. The gas grid as a vector for regional decarbonisation - a techno economic case study for biomethane injection and natural gas heavy goods vehicles. Appl. Energy 2022, 323, 119590. [Google Scholar] [CrossRef]
- Singh, P.; Kalamdhad, A.S. Biomethane plants based on municipal solid waste and wastewater and its impact on vehicle sector in India—An Environmental-economic-resource assessment. Environ. Technol. Innov. 2022, 26, 102330. [Google Scholar] [CrossRef]
- Chan Gutiérrez, E.; Wall, D.M.; O’Shea, R.; Novelo, R.M.; Gómez, M.M.; Murphy, J.D. An economic and carbon analysis of biomethane production from food waste to be used as a transport fuel in Mexico. J. Clean. Prod. 2018, 196, 852–862. [Google Scholar] [CrossRef]
- Nadaleti, W.C.; Martins, R.; Lourenço, V.; Przybyla, G.; Bariccatti, R.; Souza, S.; Manzano-Agugliaro, F.; Sunny, N. A pioneering study of biomethane and hydrogen production from the wine industry in Brazil: Pollutant emissions, electricity generation and urban bus fleet supply. Int. J. Hydrogen Energy 2021, 46, 19180–19201. [Google Scholar] [CrossRef]
- Rajak, U.; Verma, T.N.; Allamraju, K.V.; Kumar, R.; Le, Q.H.; Pugazhendhi, A. Effects of different biofuels and their mixtures with diesel fuel on diesel engine performance and exhausts. Sci. Total Environ. 2023, 903, 166501. [Google Scholar] [CrossRef] [PubMed]
- Hosseini, S.H.; Tsolakis, A.; Alagumalai, A.; Mahian, O.; Lam, S.S.; Pan, J.; Peng, W.; Tabatabaei, M.; Aghbashlo, M. Use of hydrogen in dual-fuel diesel engines. Prog. Energy Combust. Sci. 2023, 98, 101100. [Google Scholar] [CrossRef]
- Nguyen, V.N.; Nayak, S.K.; Le, H.S.; Kowalski, J.; Deepanraj, B.; Duong, X.Q.; Truong, T.H.; Tran, V.D.; Cao, D.N.; Nguyen, P.Q.P. Performance and emission characteristics of diesel engines running on gaseous fuels in dual-fuel mode. Int. J. Hydrogen Energy 2023, 49, 868–909. [Google Scholar] [CrossRef]
- Vadivelu, T.; Ramanujam, L.; Ravi, R.; Vijayalakshmi, S.K.; Ezhilchandran, M. An Exploratory Study of Direct Injection (DI) Diesel Engine Performance Using CNSL—Ethanol Biodiesel Blends with Hydrogen. Energies 2023, 16, 415. [Google Scholar] [CrossRef]
- Dahlgren, S.; Ammenberg, J. Sustainability Assessment of Public Transport, Part II—Applying a Multi-Criteria Assessment Method to Compare Different Bus Technologies. Sustainability 2021, 13, 1273. [Google Scholar] [CrossRef]
- Mutter, A. Obduracy and Change in Urban Transport—Understanding Competition Between Sustainable Fuels in Swedish Municipalities. Sustainability 2019, 11, 6092. [Google Scholar] [CrossRef]
- Agenzia della Mobilità Piemontese. Indagine 2022 Sulla Mobilità delle Persone e Sulla Qualità dei Trasporti Nella Regione Piemonte. 2023. Available online: https://mtm.torino.it/wp-content/uploads/2023/07/IMQ_2022_Risultati_04-10-2023.pdf (accessed on 27 October 2023).
- ISTAT. Ambiente Urbano—Anno 2021, Tavole Mobilità Urbana. 2023. Available online: https://www.istat.it/it/archivio/286822 (accessed on 28 October 2023).
- Legambiente. Mal’Aria di Città. Cambio di Passo Cercasi. 2023. Available online: https://www.legambiente.it/wp-content/uploads/2021/11/Rapporto_Malaria_2023.pdf (accessed on 28 October 2023).
- Noussan, M.; Negro, V.; Prussi, M.; Chiaramonti, D. The potential role of biomethane for the decarbonization of transport: An analysis of 2030 scenarios in Italy. Appl. Energy 2024, 355, 122322. [Google Scholar] [CrossRef]
- Dutto, A. Tesi di Laurea Magistrale—Analisi dei Dati di Consumo ai Fini Della Diagnosi Energetica del Sito Virtuale di GTT. Master’s Thesis, Politecnico di Torino, Turin, Italy, 2019. [Google Scholar]
- GTT. Parco Veicoli—Schede Tecniche. 2021. Available online: https://www.gtt.to.it/cms/risorse/gruppo/veicoli/parco_veicoli_tpl.pdf (accessed on 29 October 2023).
- GSE. Atlaimpianti. 2023. Available online: https://atla.gse.it/atlaimpianti/project/Atlaimpianti_Internet.html (accessed on 15 October 2023).
- European Biogas Association. Biomethane Map 2021. 2023. Available online: https://www.europeanbiogas.eu/biomethane-map-2021/ (accessed on 28 October 2023).
- GSE. Biometano—Graduatoria Bando 1 DM 15/09/2022. 2023. Available online: https://www.gse.it/servizi-per-te/attuazione-misure-pnrr/produzione-di-biometano/graduatorie (accessed on 28 October 2023).
- Barbera, E.; Menegon, S.; Banzato, D.; D’Alpaos, C.; Bertucco, A. From biogas to biomethane: A process simulation-based techno-economic comparison of different upgrading technologies in the Italian context. Renew. Energy 2019, 135, 663–673. [Google Scholar] [CrossRef]
- Cucchiella, F.; D’Adamo, I.; Gastaldi, M. An economic analysis of biogas-biomethane chain from animal residues in Italy. J. Clean. Prod. 2019, 230, 888–897. [Google Scholar] [CrossRef]
- Prussi, M.; Yugo, M.; Prada, L.D.; Padella, M.; Edwards, R.; Lonza, L. JEC Well-to-Tank Report v5; Scientific Analysis or Review, Policy Assessment, Technical Guidance KJ-NA-30269-EN-N (Online); Publications Office of the European Union: Luxembourg, 2020. [CrossRef]
- Directive (EU) 2018/2001 of the European Parliament and of the Council of 11 December 2018 on the Promotion of the Use of Energy from Renewable Sources (Recast)—Document 32018L2001. 2018. Available online: http://data.europa.eu/eli/dir/2018/2001/oj (accessed on 4 July 2023).
- Chiabrando, A. Il Contributo Degli Allevamenti al Bilancio Energetico Torinese. 2023. Available online: https://www.youtube.com/playlist?list=PLw_2BybgDghLtQ5lgr94q7Lf2kpj3Onz- (accessed on 28 October 2023).
- European Commission. Biomethane Country Fiche—Italy. 2023. Available online: https://energy.ec.europa.eu/system/files/2023-09/Biomethane_fiche_IT_web.pdf (accessed on 28 October 2023).
- Noussan, M.; Campisi, E.; Jarre, M. Carbon Intensity of Passenger Transport Modes: A Review of Emission Factors, Their Variability and the Main Drivers. Sustainability 2022, 14, 10652. [Google Scholar] [CrossRef]
- Cignini, F.; Genovese, A.; Ortenzi, F.; Valentini, S.; Caprioli, A. Performance and Emissions Comparison between Biomethane and Natural Gas Fuel in Passenger Vehicles. E3S Web Conf. 2020, 197, 08019. [Google Scholar] [CrossRef]
- IVECO. IVECO BUS Unveils the URBANWAY Hybrid CNG 18-m Long, the Ideal Urban Transport Solution for Sustainable Mobility. 2022. Available online: https://www.ivecogroup.com/media/brand_press_releases/2022/EMEA-(English)/Iveco-Bus/iveco_bus_unveils_the_urbanway_hybrid_cng_18-m_long_the_ideal_urban_transport_solution_for_sustainable_mobility (accessed on 8 November 2023).
- Rotunno, P.; Lanzini, A.; Leone, P. Energy and economic analysis of a water scrubbing based biogas upgrading process for biomethane injection into the gas grid or use as transportation fuel. Renew. Energy 2017, 102, 417–432. [Google Scholar] [CrossRef]
- D’Adamo, I.; Ribichini, M.; Tsagarakis, K.P. Biomethane as an energy resource for achieving sustainable production: Economic assessments and policy implications. Sustain. Prod. Consum. 2023, 35, 13–27. [Google Scholar] [CrossRef]
- Cignini, F.; Genovese, A.; Ortenzi, F.; Valentini, S.; Caprioli, A. Performance and Emissions Comparison between Biomethane and Natural Gas Fuel in Passenger Vehicles: Results of the third testing campaign. J. Phys. Conf. Ser. 2022, 2385, 012061. [Google Scholar] [CrossRef]
Figure 1.
Biogas power plants in operation in the province of Turin. (Data from [36]).
Figure 1.
Biogas power plants in operation in the province of Turin. (Data from [36]).
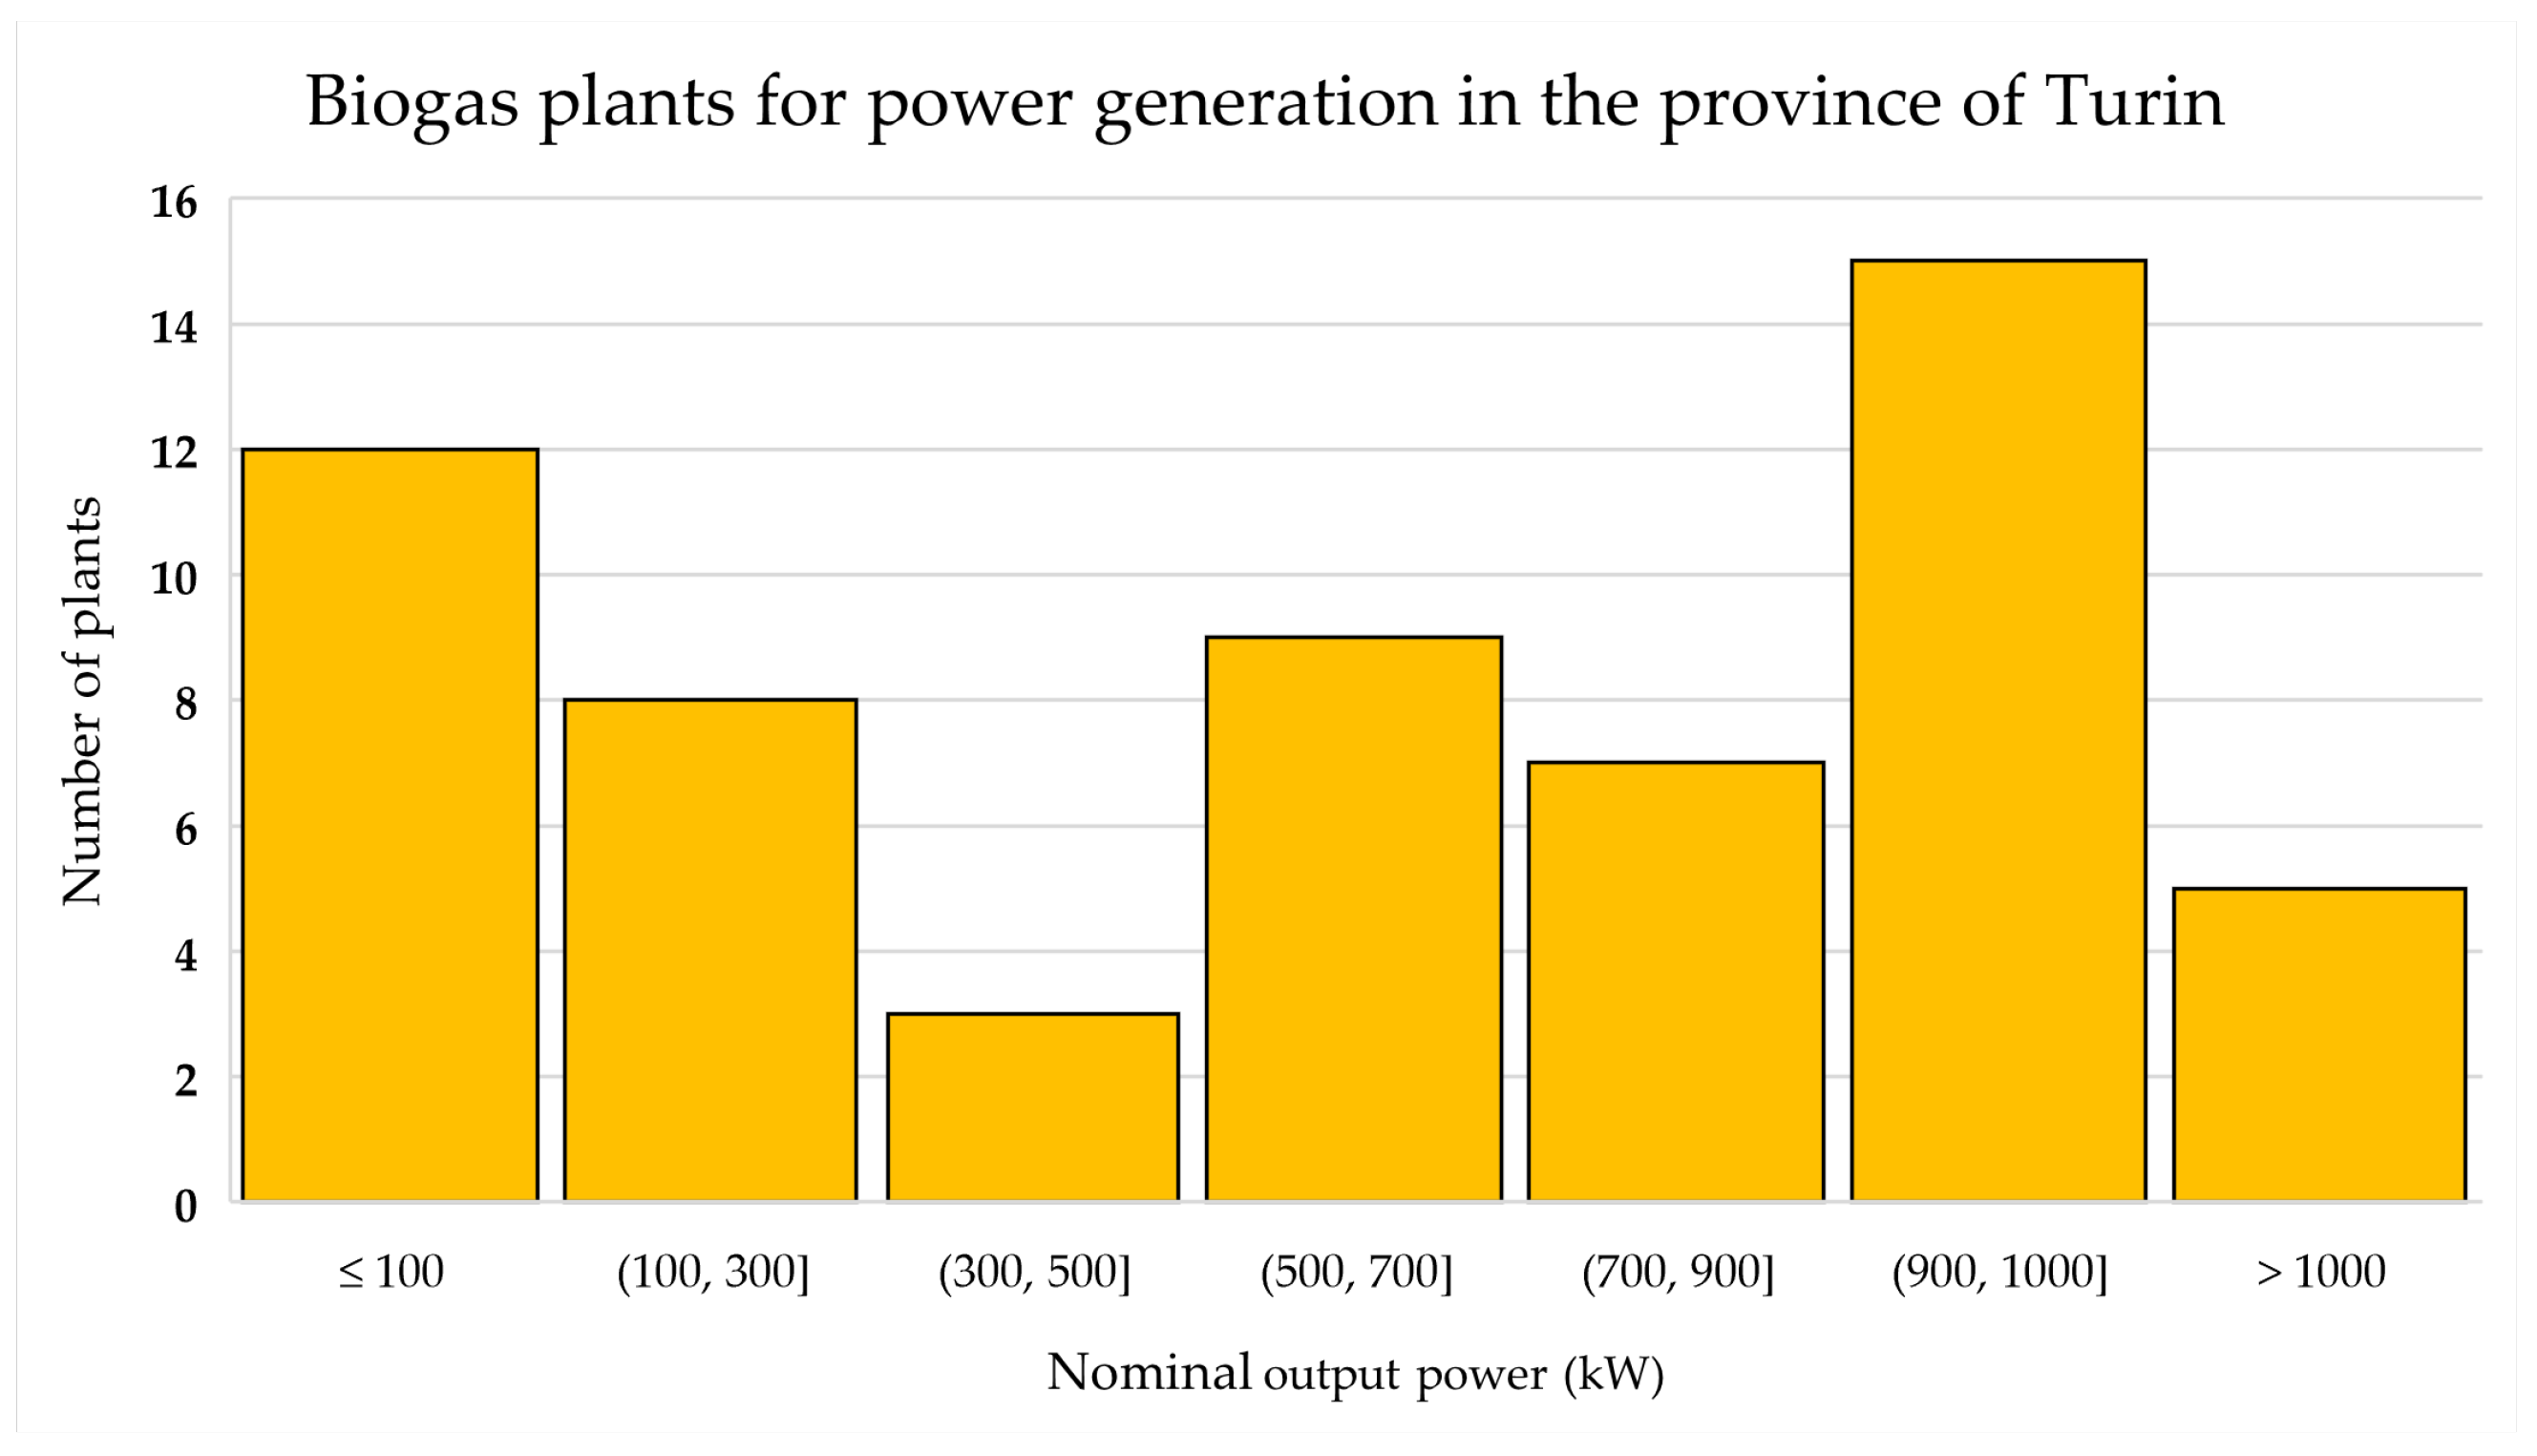
Figure 2.
Estimation of specific consumption for the CNG urban bus fleet in Turin. Monthly data for 2018, pkm are estimated considering maximum bus capacity. (Author’s calculations on data from [34]).
Figure 2.
Estimation of specific consumption for the CNG urban bus fleet in Turin. Monthly data for 2018, pkm are estimated considering maximum bus capacity. (Author’s calculations on data from [34]).

Figure 3.
Estimation of CO2 emission savings in the analyzed scenarios (no manure credits, 2021 Italian electricity mix).
Figure 3.
Estimation of CO2 emission savings in the analyzed scenarios (no manure credits, 2021 Italian electricity mix).

Figure 4.
Estimation of specific CO2 emissions per pkm considering peak (80%) and average (20%) load factors.
Figure 4.
Estimation of specific CO2 emissions per pkm considering peak (80%) and average (20%) load factors.

Figure 5.
Sensitivity analysis of CO2 emission savings in the analyzed scenarios with or without manure credits, and using 2021 and 2030 Italian electricity mixes.
Figure 5.
Sensitivity analysis of CO2 emission savings in the analyzed scenarios with or without manure credits, and using 2021 and 2030 Italian electricity mixes.


Table 1.
Main characteristics of the CNG bus fleet in operation in Turin in 2018. Data from [34].
Table 1.
Main characteristics of the CNG bus fleet in operation in Turin in 2018. Data from [34].
| Type | Model | Length (m) | Passengers | Fuel Cons. (kg/km) | Fleet |
|---|---|---|---|---|---|
| 1 | IRISBUS CITELIS | 18 | 147 | 0.64 | 4 |
| 2 | IRISBUS 491E.18.31 | 18 | 143 | 0.67 | 94 |
| 3 | IVECO 491E.12.24 | 12 | 90 | 0.60 | 82 |
| 4 | IRISBUS 491E.12.27 | 12 | 94 | 0.56 | 87 |
Table 2.
Additional technical characteristics of the CNG bus fleet in operation in Turin in 2018. Data from [35].
Table 2.
Additional technical characteristics of the CNG bus fleet in operation in Turin in 2018. Data from [35].
| Type | Engine Power (kW; CV) | Engine Size (cm3) | Max Torque (Nm) | Empty Weight (t) | Full Weight (t) |
|---|---|---|---|---|---|
| 1 | 243 kW (330 CV) | 7790 | 1100 (@1100 rpm) | 18.20 | 30.00 |
| 2 | 228 kW (310 CV) | 9500 | 1200 (@1200 rpm) | 18.29 | 27.95 |
| 3 | 177 kW (240 CV) | 9500 | 1020 (@1200 rpm) | 12.52 | 18.58 |
| 4 | 200 kW (270 CV) | 7790 | 1100 (@1100 rpm) | 12.60 | 18.99 |
Table 3.
Distribution of the total annual pkm offered across different powertrains for each scenario (values in billion offered pkm).
Table 3.
Distribution of the total annual pkm offered across different powertrains for each scenario (values in billion offered pkm).
| Gpkm | Diesel | Fossil Gas | Biomethane | Electric |
|---|---|---|---|---|
| Scenario 0 | 2.5 | 1.1 | - | 0.1 |
| Scenario 1 | 2.5 | - | 1.1 | 0.1 |
| Scenario 2 | - | - | 3.6 | 0.1 |
| Scenario 3 | - | - | 0.7 | 3.0 |
Table 4.
Annual energy consumption across different powertrains for each scenario (values in GWh).
| GWh | Diesel | Fossil Gas | Biomethane | Electric |
|---|---|---|---|---|
| Scenario 0 | 121.9 | 86.4 | - | 1.4 |
| Scenario 1 | 121.9 | - | 86.4 | 1.4 |
| Scenario 2 | - | - | 292.0 | 1.4 |
| Scenario 3 | - | - | 57.0 | 42.4 |
Disclaimer/Publisher’s Note: The statements, opinions and data contained in all publications are solely those of the individual author(s) and contributor(s) and not of MDPI and/or the editor(s). MDPI and/or the editor(s) disclaim responsibility for any injury to people or property resulting from any ideas, methods, instructions or products referred to in the content. |
© 2023 by the author. Licensee MDPI, Basel, Switzerland. This article is an open access article distributed under the terms and conditions of the Creative Commons Attribution (CC BY) license (https://creativecommons.org/licenses/by/4.0/).
Share and Cite
MDPI and ACS Style
Noussan, M. The Use of Biomethane in Internal Combustion Engines for Public Transport Decarbonization: A Case Study. Energies 2023, 16, 7995. https://doi.org/10.3390/en16247995
AMA Style
Noussan M. The Use of Biomethane in Internal Combustion Engines for Public Transport Decarbonization: A Case Study. Energies. 2023; 16(24):7995. https://doi.org/10.3390/en16247995
Chicago/Turabian StyleNoussan, Michel. 2023. "The Use of Biomethane in Internal Combustion Engines for Public Transport Decarbonization: A Case Study" Energies 16, no. 24: 7995. https://doi.org/10.3390/en16247995
Note that from the first issue of 2016, this journal uses article numbers instead of page numbers. See further details here.