Abstract
In recent years, there has been a growing demand for multipurpose drones that can handle surveillance, environmental monitoring, and urgent deliveries. This trend has spurred the need for increased power and longer flight times for drones. Hence, many researchers introduced various hybrid systems to enhance endurance. In particular, a hybrid system that integrates solar cells, fuel cells, and batteries can substantially enhance a drone’s endurance. However, linking multiple power sources necessitates a control strategy that prioritizes safety and durability. It is also essential to analyze the control characteristics of each component as the dynamic behavior of individual components, coupled with environmental factors, significantly impacts the overall dynamic characteristics of drone systems. This study introduces a PEMFC–battery drone model. The model’s dynamic characteristics can be evaluated based on changes in environmental conditions and the control strategies of primary components. The validity of this model is confirmed by analyzing the dynamic characteristics of drone systems. As a result, the MRAC logic applied to the flight-level control and thrust motor of the drone was found to amplify the characteristics of the underlying PI and IP controllers. These control characteristics can lead to the development of control strategies for improving the flight performance or power durability of the aircraft by being properly applied to the flight environment of the drone.
1. Introduction
1.1. Research Background
Polymer electrolyte membrane fuel cells (PEMFCs) are increasingly adopted in various mobility sectors, including automobiles, ships, and aviation, owing to their high efficiency, simplicity, and stability, which facilitates long-term operations of 40,000 h or more [1,2,3,4]. In particular, as PEMFCs find broader application in multipurpose uncrewed aerial vehicles (UAVs)—particularly in urban air mobility (UAM) considered as the next-generation transportation—the significance of energy management systems (EMS) has attracted attention [4,5]. Unlike traditional battery-powered UAVs, PEMFC-based UAVs generate electricity directly from hydrogen. Hence, devising efficient EMS for hybrid propulsion has taken on heightened importance as ensuring a stable power supply and prolonged flight endurance becomes feasible with the use of auxiliary power sources [5,6,7].
A battery-based UAV, subjected to four primary forces—thrust, drag, lift, and gravity—experiences significant power consumption due to its sustained high-load flight and has a shorter operational duration due to the limited scope of regenerative braking. While stacking multiple batteries has been suggested as a solution to these limitations, this approach can decrease power density beyond a certain energy threshold, as both the available energy capacity and the system’s weight substantially increase [8]. Conversely, when viewed more specifically than the broader EMS, a PEMFC–battery propulsion system boasts system stability and enhanced power density. This is because it can utilize multiple power sources and exercise control through a power management system (PMS). Nevertheless, there are key challenges to consider. Firstly, there exists an inversely proportional relationship between the power and efficiency of fuel cells. In particular, system efficiency might decline if the fuel cell’s power surpasses that required to maintain the battery’s state of charge (SOC). Secondly, the dynamic control performance of primary components via the PMS significantly influences the system’s dynamic characteristics and efficiency. Without efficient control of the key components and the system as a whole, the overall system’s stability and efficiency might suffer. Lastly, sudden power fluctuations can impair the longevity of both the fuel cell and the battery. In particular, fuel cells face a heightened risk of damage, especially to the membrane, when their power output experiences abrupt changes. This can lead to reduced system efficiency due to energy loss or a dip in fuel cell voltage.
For these reasons, a PMS should be designed to enhance the stability and efficiency of a PEMFC battery propulsion system. Additionally, there should be an analysis of the dynamic characteristics of both the components and system based on a power-split strategy (PSS).
1.2. Literature Review
Extensive research has been undertaken on diverse hybrid systems to enhance the power consumption and operation time of UAVs. Nishizawa et al. [9] proposed a direct hybrid system using fuel cells and batteries for aviation applications. Their experiments demonstrated the feasibility of battery charging in this system, suggesting its potential as a simplified configuration for UAVs. Lee et al. [10] explored the pros and cons of active versus passive PMS in a hybrid system that includes a fuel cell, battery, and solar cell. Their findings revealed that their active PMS consistently maintained the battery’s SOC, while the passive PMS did so with some constraints. In this case, the energy loss due to the extra device in the active PMS was 4.7% greater. However, it is pointed out as a limitation that passive and active PMS were analyzed under different conditions. Gang et al. [11] introduced a hybrid UAV system using a fuel cell and a solar cell. Their innovative switching control for the solid-state relay bolstered the reliability of the power supply system and cut fuel usage. They also advanced the idea of a high-endurance UAV system via the battery’s charging and discharging cycles. Gong et al. [12] proposed a hybrid UAV system that amalgamated a fuel cell, battery, and supercapacitor. They suggested that the lifespan of the fuel cell and UAV’s endurance could be augmented by enabling the battery to offer boost power, with the supercapacitor addressing abrupt load shifts.
However, most of the previous studies investigated power supply and distribution strategies by PMS [9,10,11,12,13,14,15,16,17,18], but they did not consider the fact that the independent control performance of the major components constituting the system can significantly affect the dynamic characteristics of the drone system.
1.3. Motivation and Novelty
Although hydrogen offers high specific energy, making it suitable for extended flights, its low specific power is considered a drawback. Hence, a PEMFC-based propulsion system should integrate an auxiliary power source with a high specific power. This integration necessitates the precise management of the output from each power source via a PSS [12]. It should also incorporate diverse strategies, whether rule-based, optimization-based, or anchored in machine learning [19]. Additionally, when determining power capacity, considerations should include the battery’s charge and discharge rates and the UAV’s cumulative power output in relation to power operations [20]. In a hybrid system, each power source is governed by a distinct controller. These controllers can utilize low-level controls, such as PI or IP, or more advanced strategies such as fuzzy logic (FL), model predictive control (MPC), and model reference adaptive control (MRAC) [21,22,23]. The choice of control logic is pivotal, given its influence on the UAV system’s dynamic attributes, and must be tailored to the specific flight environment. Notably, components such as air supply and moisture control significantly impact the dynamic performance of fuel cells. By optimizing these components, the entire system’s performance can be elevated [24,25,26]. In addition, the relatively slow operating speed of the fuel supply system, compared to the electrochemical reaction, can cause the degradation of the membrane of the fuel cell during sudden load changes.
Therefore, based on the UAV’s intended use, it is essential to design a robust controller that swiftly reacts to sudden changes in output or external disturbances. However, executing extensive tests on UAV flight conditions, individual component control logic, or determining the optimal capacity of the hybrid power system presents challenges. This emphasizes the urgency to first develop a simulation model that can precisely forecast and scrutinize UAV output.
In this study, a PEMFC–battery hybrid UAV system model is developed based on the battery-powered agricultural UAV. Furthermore, the dynamic characteristics of the UAV system are analyzed in terms of flight conditions and control logic of the flight-level controller and thrust motor model, which are the major components of the drone. With respect to the analysis, rule-based PSS based on battery SOC is applied to manage the power split of the hybrid system [27], while PI-, IP-, and PI-based MRAC are applied for primary components. Given that privately used UAVs are commonly referred to as drones, henceforth, UAVs are referred to as drones.
The remaining parts of this paper are organized as follows: Section 2 introduces the model development process for each component of the agricultural drone model, which can analyze the dynamic characteristics of the system by applying various control logic. Section 3 explains control logic applied to major components of the drone system, and the power split strategy of hybrid power. In Section 4, the flight conditions of the drone for simulation are described, and the dynamic characteristics of the system caused by the control logic applied to the flight-level controller and thrust motor are compared and analyzed. Lastly, Section 5 summarizes and organizes the previously conducted research process and results.
2. Configuration and Modeling of the Drone System
2.1. Modeling of Drone Components
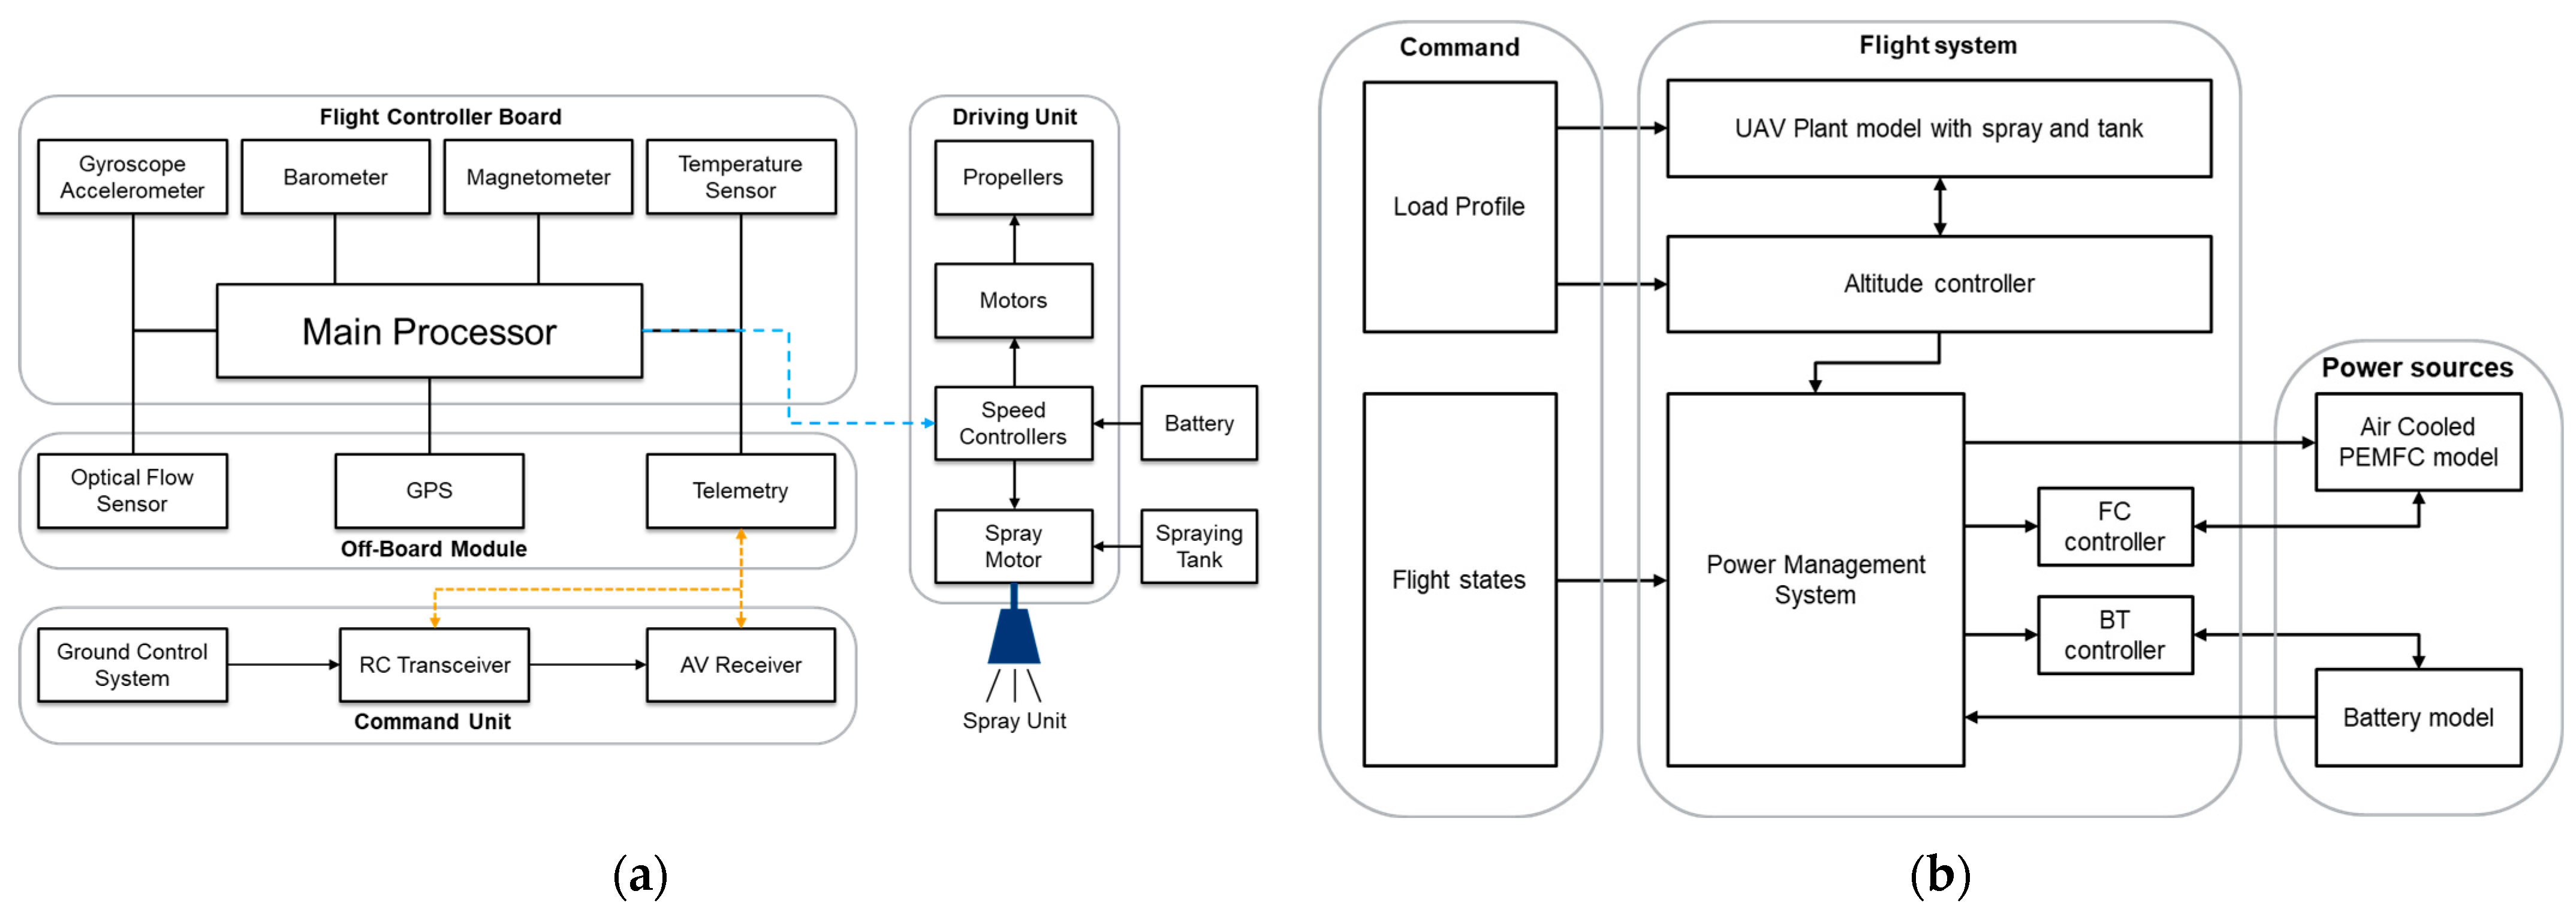
Before developing a hybrid drone system, major component models were developed using Lookup Table of Matlab/Simulink® R2023a based on mathematical equations and manufacturer data. A general remote control drone system comprises a command unit, including onboard flight control system and ground control system, as well as driving and auxiliary units [28,29,30]. Figure 1a shows the configuration of the system employed in this study, which includes hybrid power structure [31] and sprayer [32]. For the actual analytical model, the model is simplified, as shown in Figure 1b, by excluding less significant components.
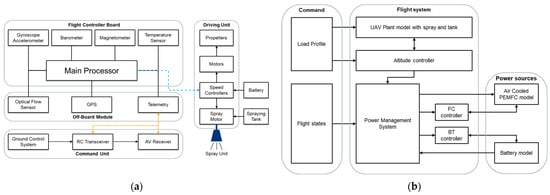
Figure 1.
Schematics of the drone system of (a) real drone system with battery and (b) simplified drone system with battery and PEMFC.
Key components, which are essential for analyzing the system’s dynamic characteristics, are the PEMFC, air supply, cooling fan, battery, thrust motor, sub-actuator (DC pump), and DC/DC converter. Additionally, for the purposes of simulating load changes and integrating component models, an altitude calculator and controller are included.
2.1.1. PEMFC
PEMFC is an essential unit for improving endurance, and it can be distinguished into flow-through anode, recirculation anode, dead-end anode, and dead-end anode with recirculation according to the fuel supply strategy [33]. This study developed a PEMFC model of dead-end anode and open cathode type [34,35].
- Electrical model for fuel cell
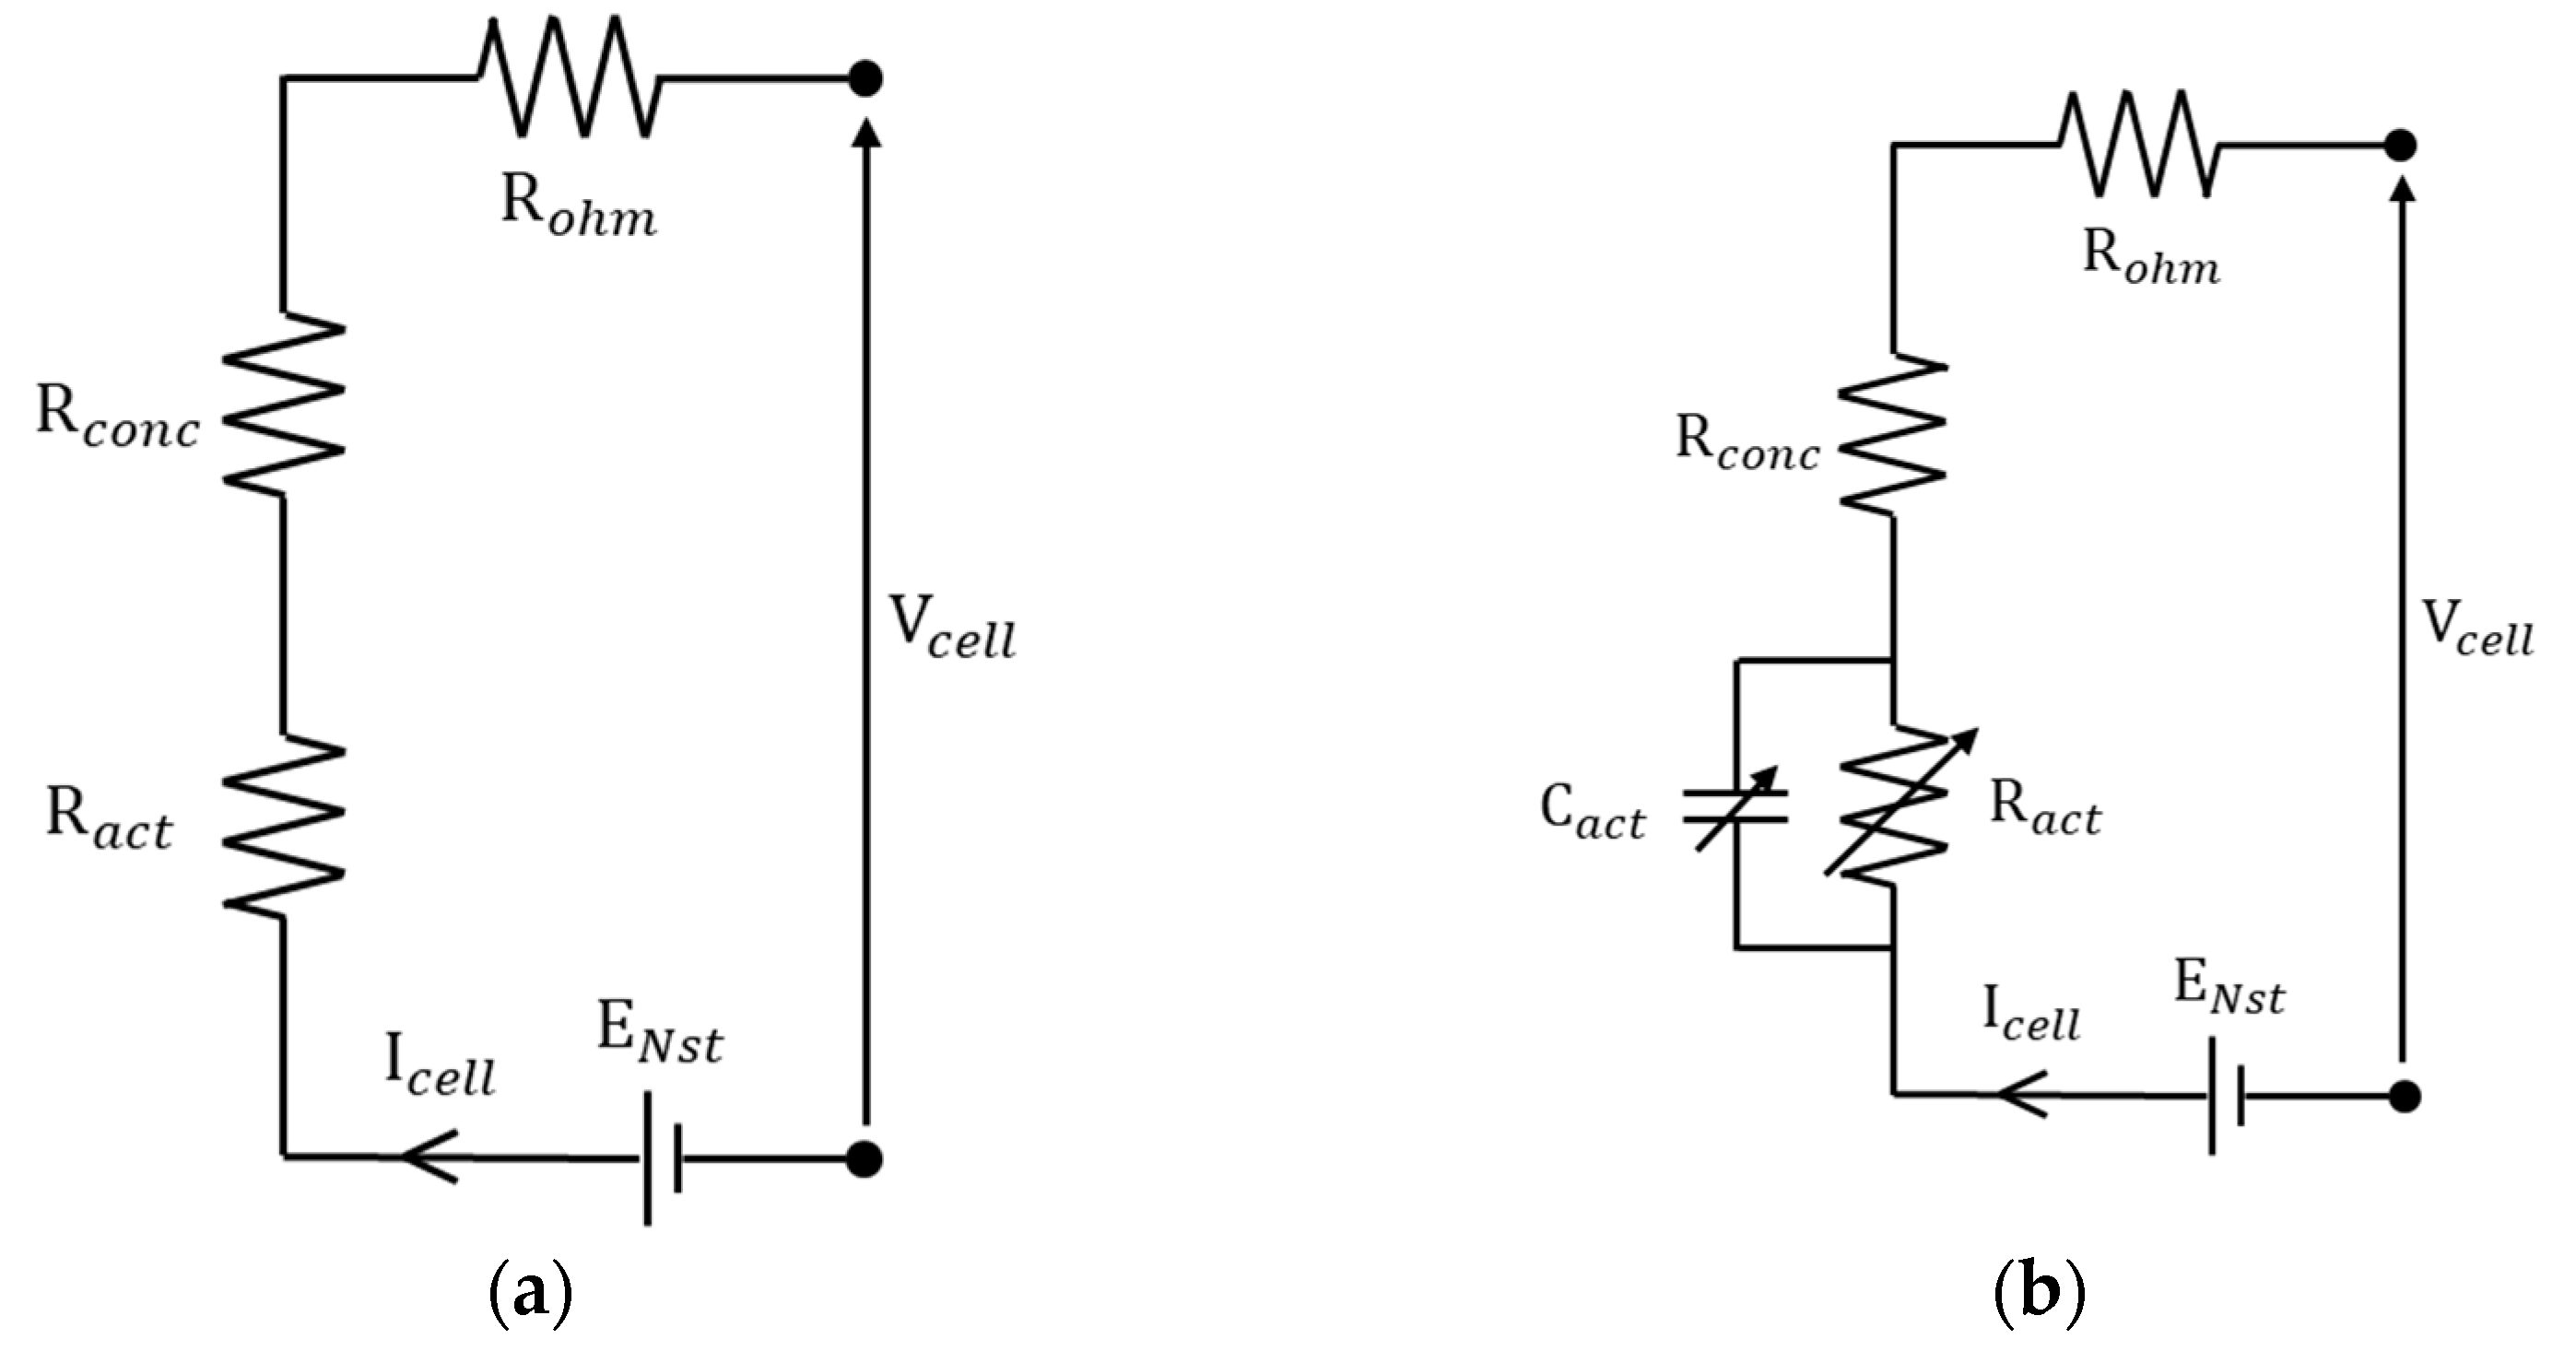
A PEMFC model is generally composed of electrical model and thermal model in which the electrical model is designed based on equivalent electrical circuit (EEC), as shown in Figure 2 [34,36].

Figure 2.
EECs of PEMFC: (a) without ; (b) with . Note: = Nernst voltage, = cell current, = ohmic resistance, = activation resistance, = concentration resistance, = voltage of fuel cell.
In this study, an electrical model was developed based on Figure 2a where the cell voltage is calculated using Equation (1). Here, , , and are represented as voltage drops, each corresponding to ohmic loss, activation loss, and concentration loss, respectively. These factors are recognized as having a significant influence on the efficiency of the PEMFC.
The first term in Equation (1), , denotes the reference voltage of a cell affected by reference potential ( = 1.229 V), temperature, and pressure in standard conditions (298.15 K and 1 atm), and it can be calculated using Equation (2) [35].
where denotes stack temperature, while and denote partial pressures of hydrogen and oxygen generated in the electrode [34,35,36,37,38].
The second term in Equation (1), , is a voltage drop, which occurs when proton passes through membrane. It is calculated, as shown in Equation (3), using resistance and cell’s current based on Ohm’s law.
where denotes the current flowing in the stack, denotes specific resistance when proton passes through membrane, and denotes contact resistance generated when stacking unit cells. Furthermore, is assumed to be constant, while and denote water content and activation area of the cell.
The third term in Equation (1), , denotes potential above a certain level required for activating electrode of fuel cell, and it is also termed activation overvoltage. Furthermore, is affected by stack temperature, oxygen concentration, and stack current; thus, it is expressed as a polynomial function of various factors [35,36,37,38]. However, in this study, it is expressed using Equation (5), which is proposed in Ref. [34].
where denotes a gas constant, denotes a transfer coefficient, denotes Faraday’s constant, and denotes exchange current density.
The final term in Equation (1), , denotes the voltage drop, which occurs when current density is high. Typically, power in fuel cells increases until a certain level of current density and then abruptly decreases above the threshold current density. This is mostly due to concentration gradient, which occurs from supply of and chemical reaction between hydrogen and oxygen [39]. This type of loss can be expressed electrically, as shown in Equation (6), while the final voltage of fuel cell stack can be expressed in Equation (7). Furthermore, PEMFC output is adjusted via parallel layout, and the related parameters of the electrical model are listed in Table 1.
where and denote the limiting current flowing in the cell and number of cells, respectively.

Table 1.
Parameters for PEMFC electrical model [34].
- Thermal model for fuel cell
As shown in the electrical model, the stack’s voltage is affected by temperature. Temperature is typically regulated using a cooling system, which can employ air, liquid, or phase change methods [40]. In this study, forced air-cooling via a fan was adopted. The thermal balance of this air-cooling system can be represented as depicted in Equation (8).
The first term in Equation (8), , is the heat generated from electrochemical reaction of the stack, and it can be calculated using Equation (9).
The second term in Equation (8), , is dissipated heat via forced convection by fan, and it can be calculated using Equation (10).
where , , and denote the air density, volume flow rate of the air, the specific heat of the air, and the ambient temperature of the air, respectively.
The third term in Equation (8), , is dissipated heat through natural convection, and it can be calculated using Equation (11).
where h and denote the convective heat transfer coefficient and stack’s equivalent heat transfer area, respectively.
The final term in Equation (8), , is dissipated heat generated when water inside the stack is converted from liquid to gas, and it can be calculated using Equation (12).
where and denote the water density and latent heat of evaporation, respectively, and denotes the empirical coefficient, denoting the rate at which produced water transitions to evaporation.
The stack temperature, according to the deduced equations, and the law of conservation of energy can be expressed, as shown in Equation (13). Furthermore, the design parameters of the thermal model are presented in Table 2.
where denotes the mass of a stack, and denotes the specific heat of the stack.
Table 2.
Parameters for PEMFC thermal model [34].
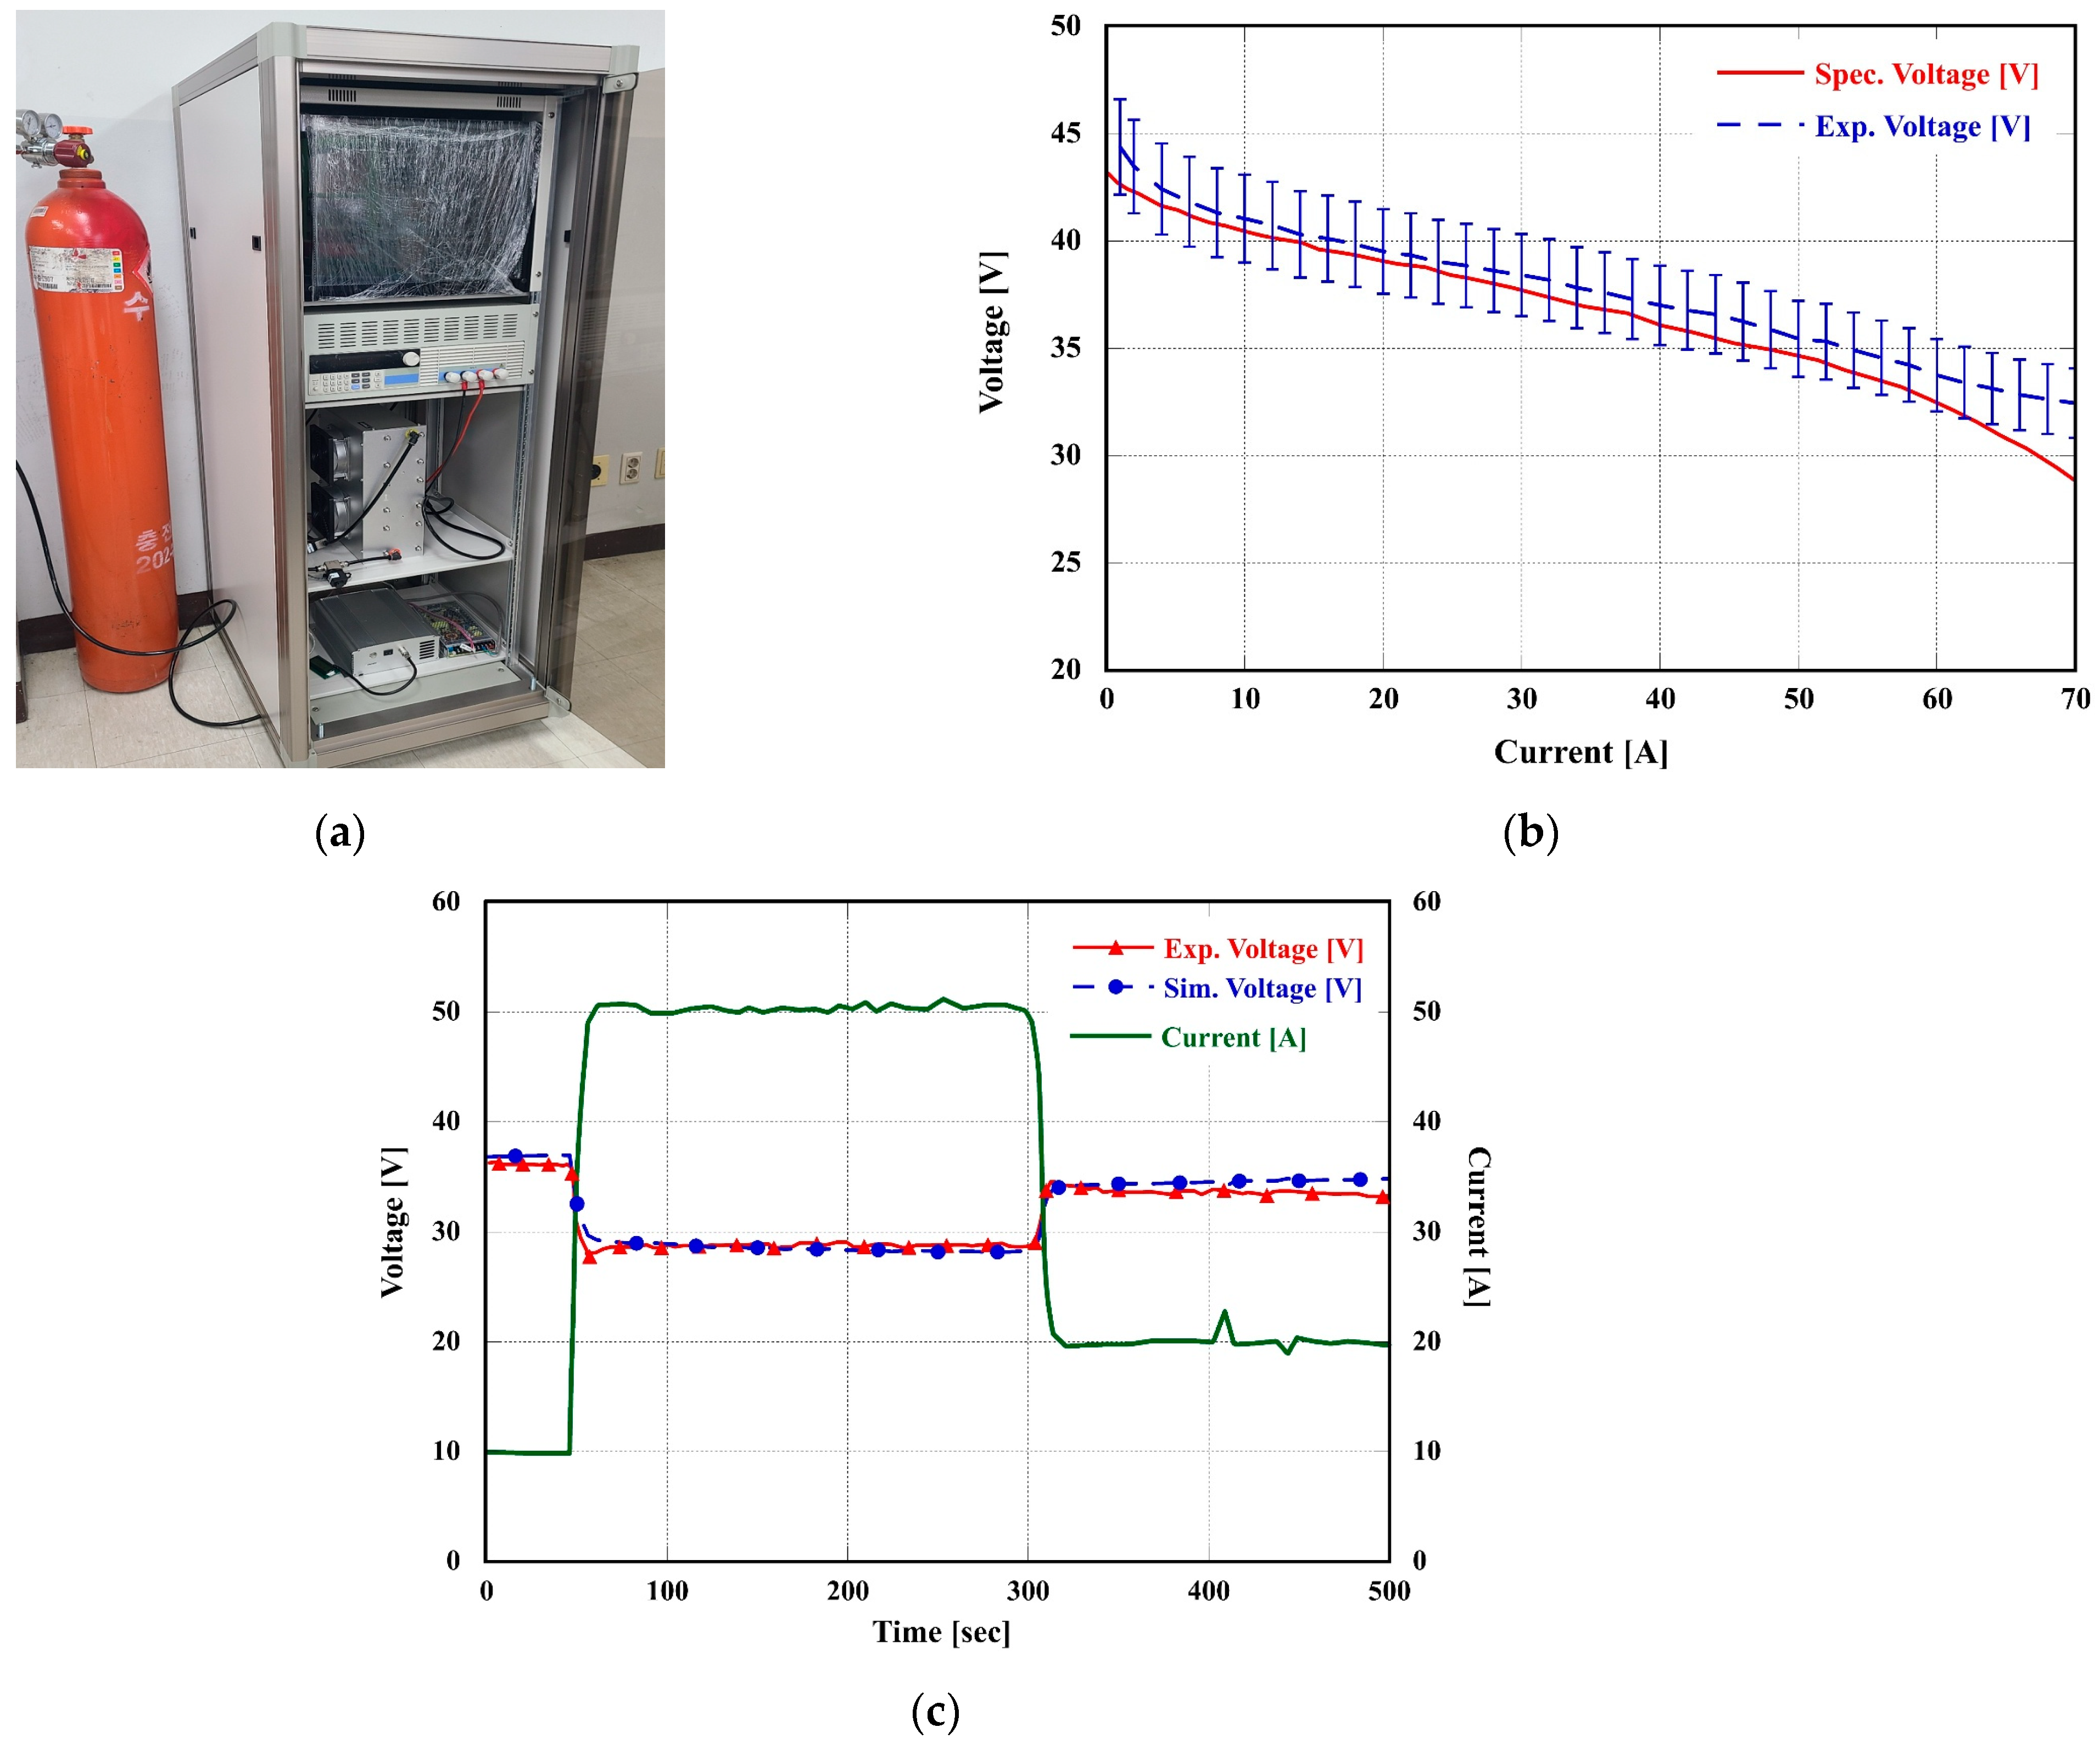
For examining consistency of the stack model developed in this study, the manufacturer’s data and results of the developed PEMFC model were compared using 2 kW air-cooled open-cathode type PEMFC experiment equipment [34]. The experiment equipment is shown in Figure 3a, and the experiment results are illustrated in Figure 3b. The results demonstrate that the error rate of polarization curves was within ±5% up to 60 A. Furthermore, the current profile in Ref. [33] was applied for cross-validating the PEMFC model, and it was confirmed that the voltage error rate of the PEMFC model was within ±5%.
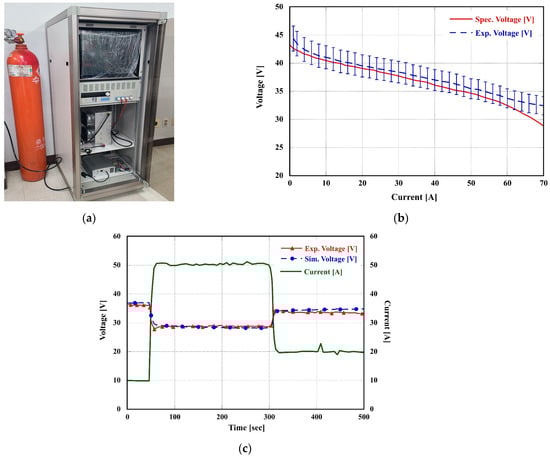
Figure 3.
Verification of the open-cathode PEMFC [34]: (a) test bench; (b) polarization curves; (c) I–V curves through the current profile.
2.1.2. Air Supply and Cooling Fan
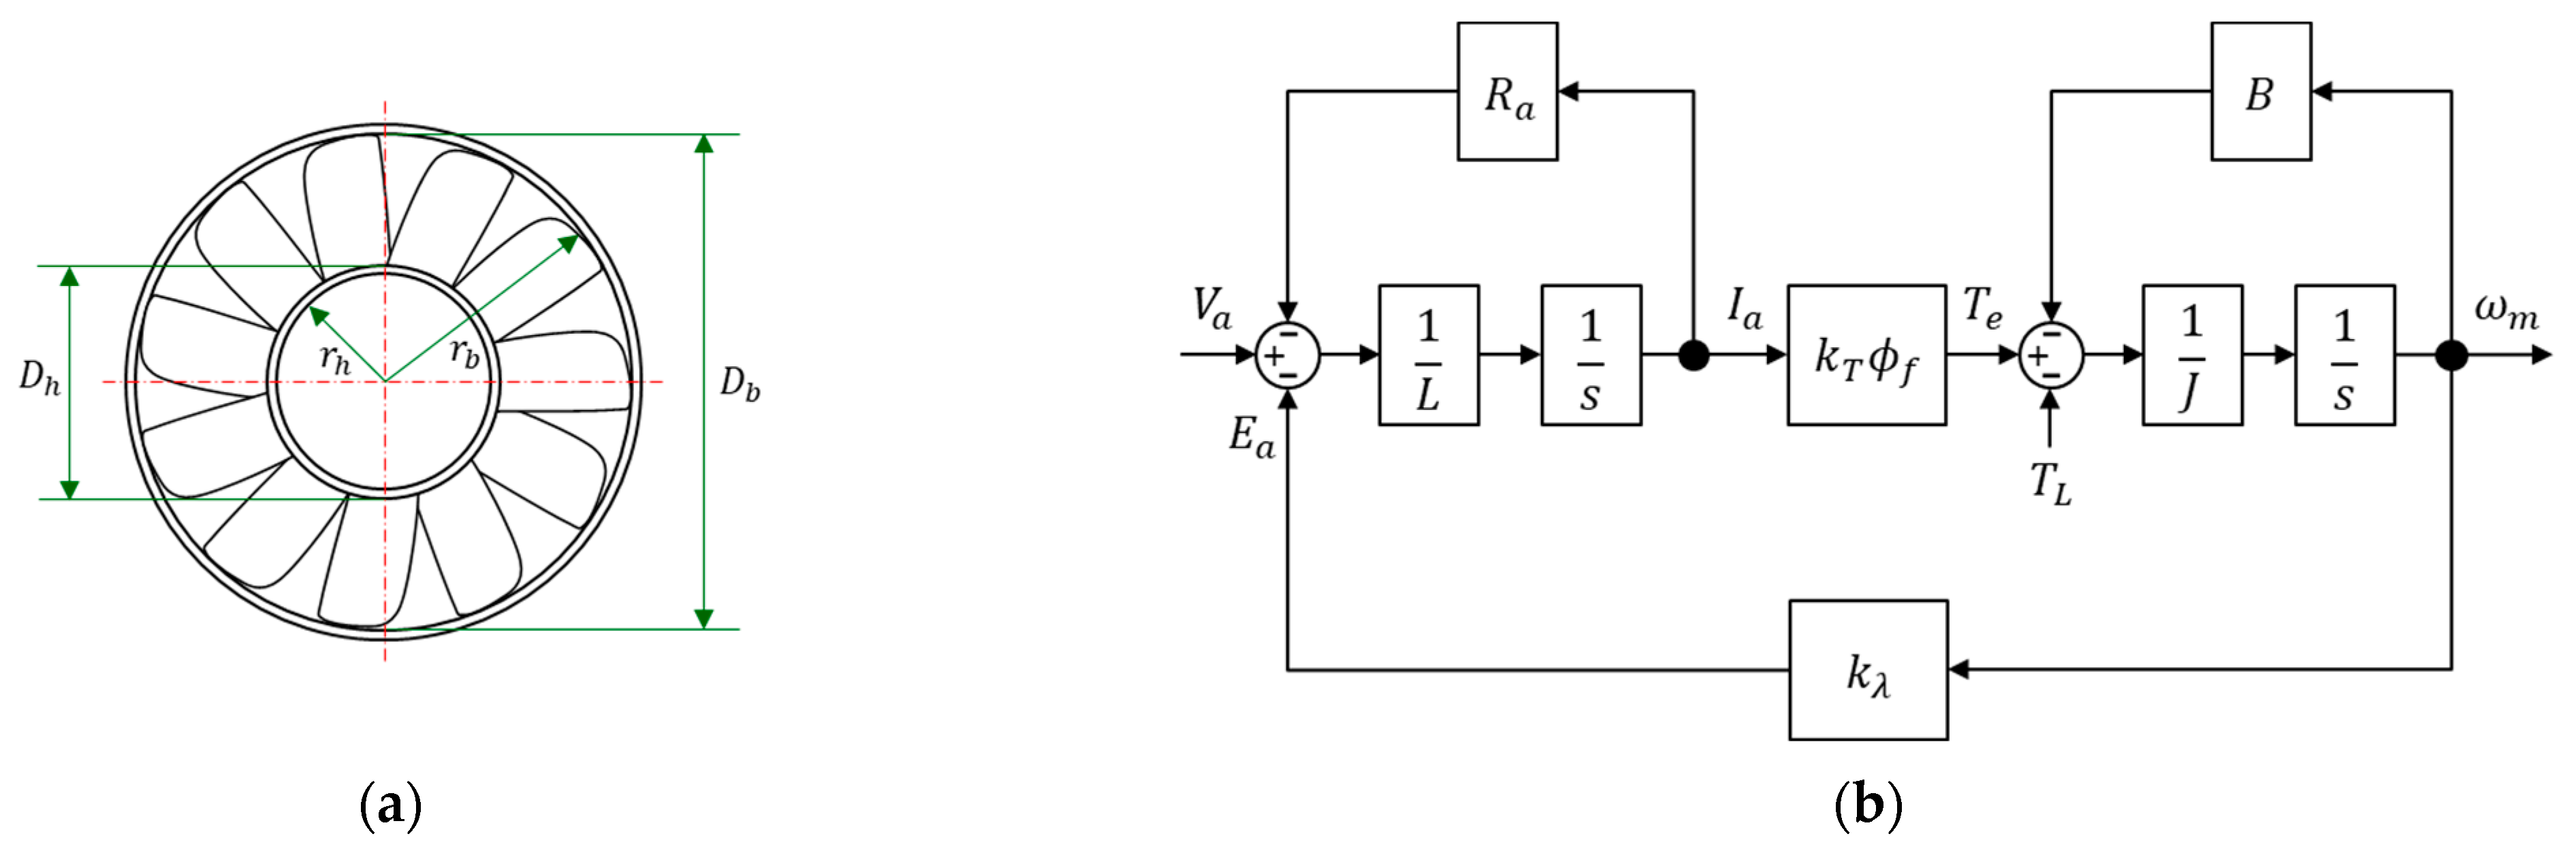
An air-cooled, open-cathode type PEMFC system offers a straightforward design, coupled with the benefits of lightweight and reduced volume due to the oxygen supply facilitated by a fan. This makes it particularly suited for compact drone systems [41]. In line with this, a fan model is developed in this study based on the manufacturer’s performance data presented in Table 3 and blade shape illustrated in Figure 4a. A dynamic model of mechanical/motor systems, depicted in Figure 4b, is used for the DC motor driving the blade rotation.
Table 3.
Specifications of the DC fan.
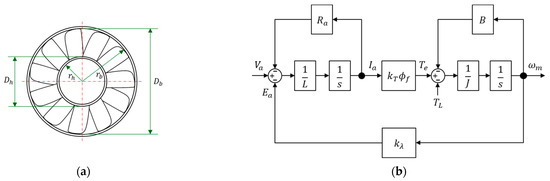
Figure 4.
Fan modeling for PEMFC: (a) blade and hub shape; (b) motor dynamic model.
The generated air flow (), when the fan is operated, can be calculated using Equations (14)–(17) based on the shape information of the blade and hub diameter [41,42].
where denotes the effective area of the fan, denotes the inlet velocity of air, denotes the flow rate coefficient, and denote blade tip and hub radius, respectively, denotes the fan speed, denotes the hub ratio coefficient, and denotes the hub ratio.
The first term in Equation (17), , is the fluid angle, which is calculated based on the tangential speed vector of the blade and vector, and it is used as a design variable during data fitting between the experiment result and model. The values calculated using the equation are shown in Table 4.
Table 4.
Fluid angle to fan speeds.
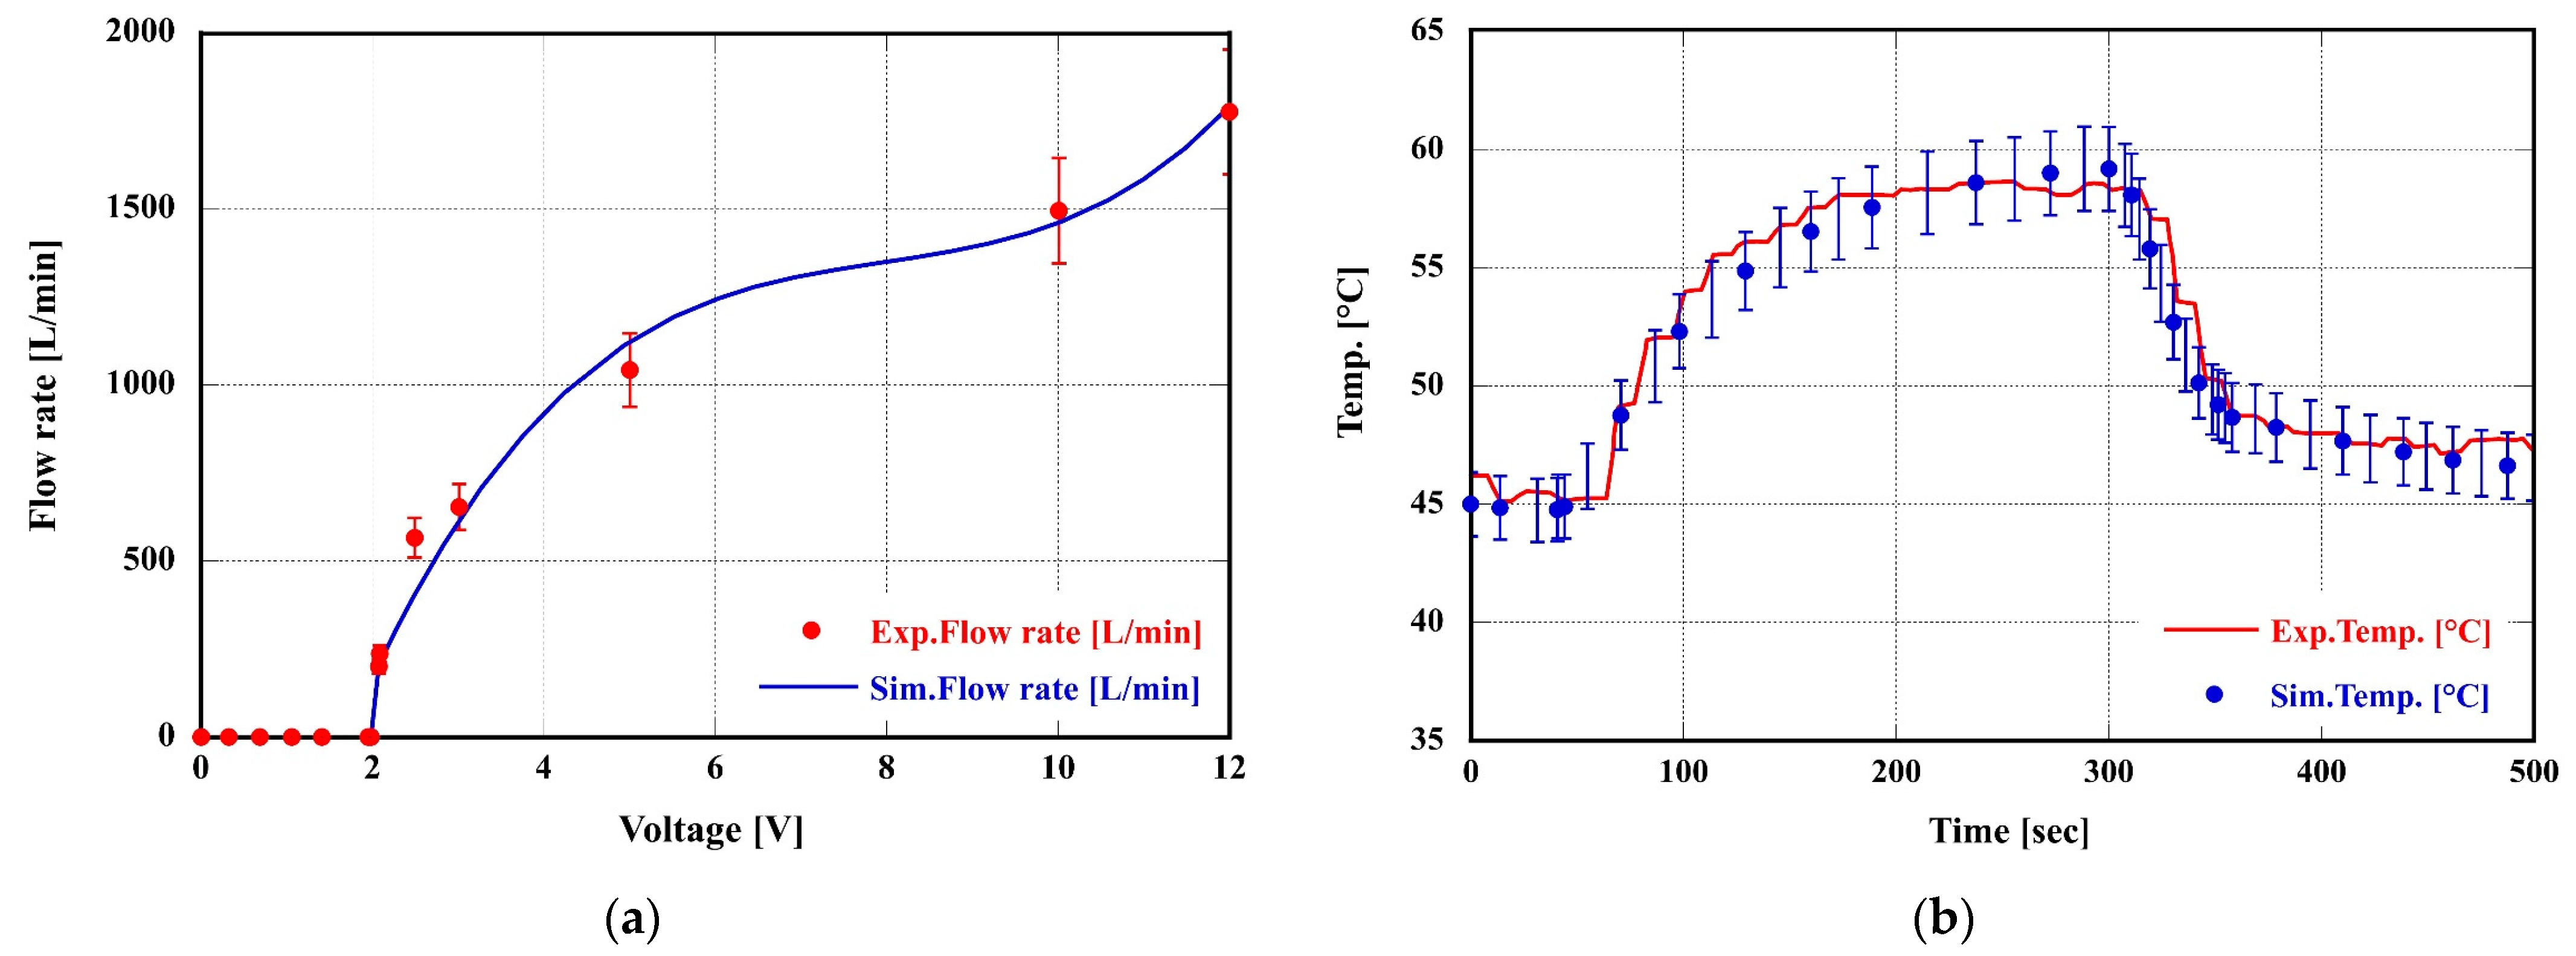
The integrated PEMFC and fan model were verified using the temperature data of PEMFC and fan flow rate according to voltage provided in Ref. [34]. As shown in Figure 5a, the flow error rate is within ±10%, and the temperature error rate of PEMFC is within ±3%, excluding the flow rate between 2 V and 3 V.

Figure 5.
Verification of PEMFC model with added fan: (a) air volume flow rate of the fan; (b) PEMFC temperature.
2.1.3. Battery
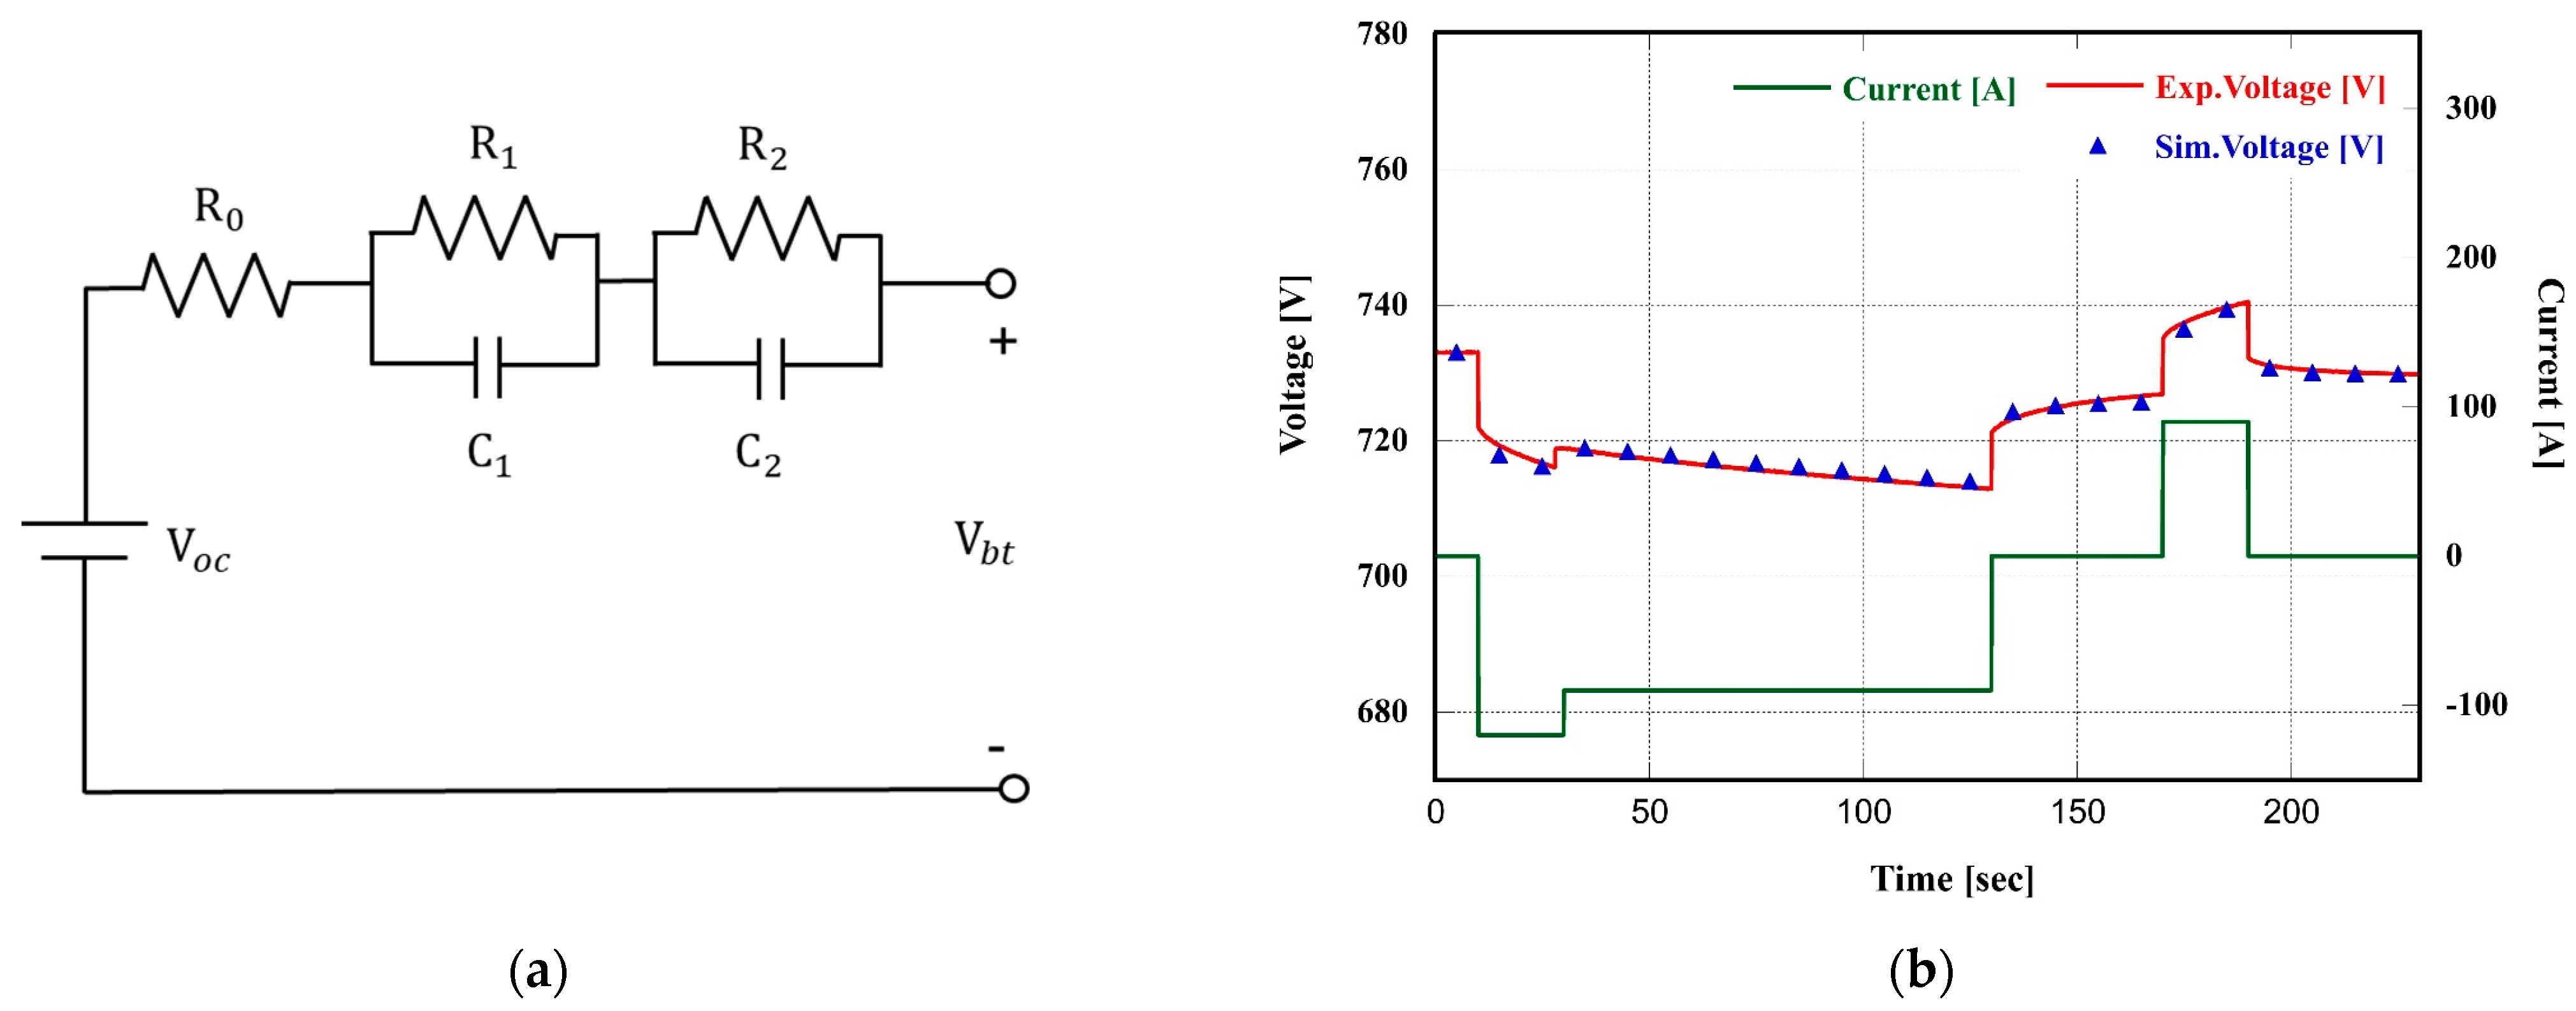
The battery model is developed in this study based on a 2−RC equivalent circuit [43], as shown in Figure 6a, and the experiment data of a battery for electrical vehicle are utilized to simulate charging and discharging tendency. Figure 6b shows the output voltage result of the prototype battery model. The battery voltage of equivalent circuit () is calculated using Equation (18), and the developed prototype model is downsized to complete the battery model for drones. The specifications and configuration of the battery cell are shown in Table 5.
where denotes open-circuit voltage of the battery, while and denote time constants by first and second R–C.
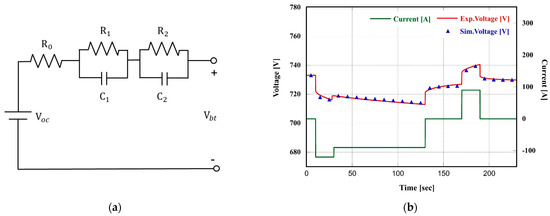
Figure 6.
Verification of battery model: (a) applied 2–RC equivalent circuit; (b) developed battery model output voltage.
Table 5.
Specifications of a battery cell for drone.
2.1.4. Thrust Motors
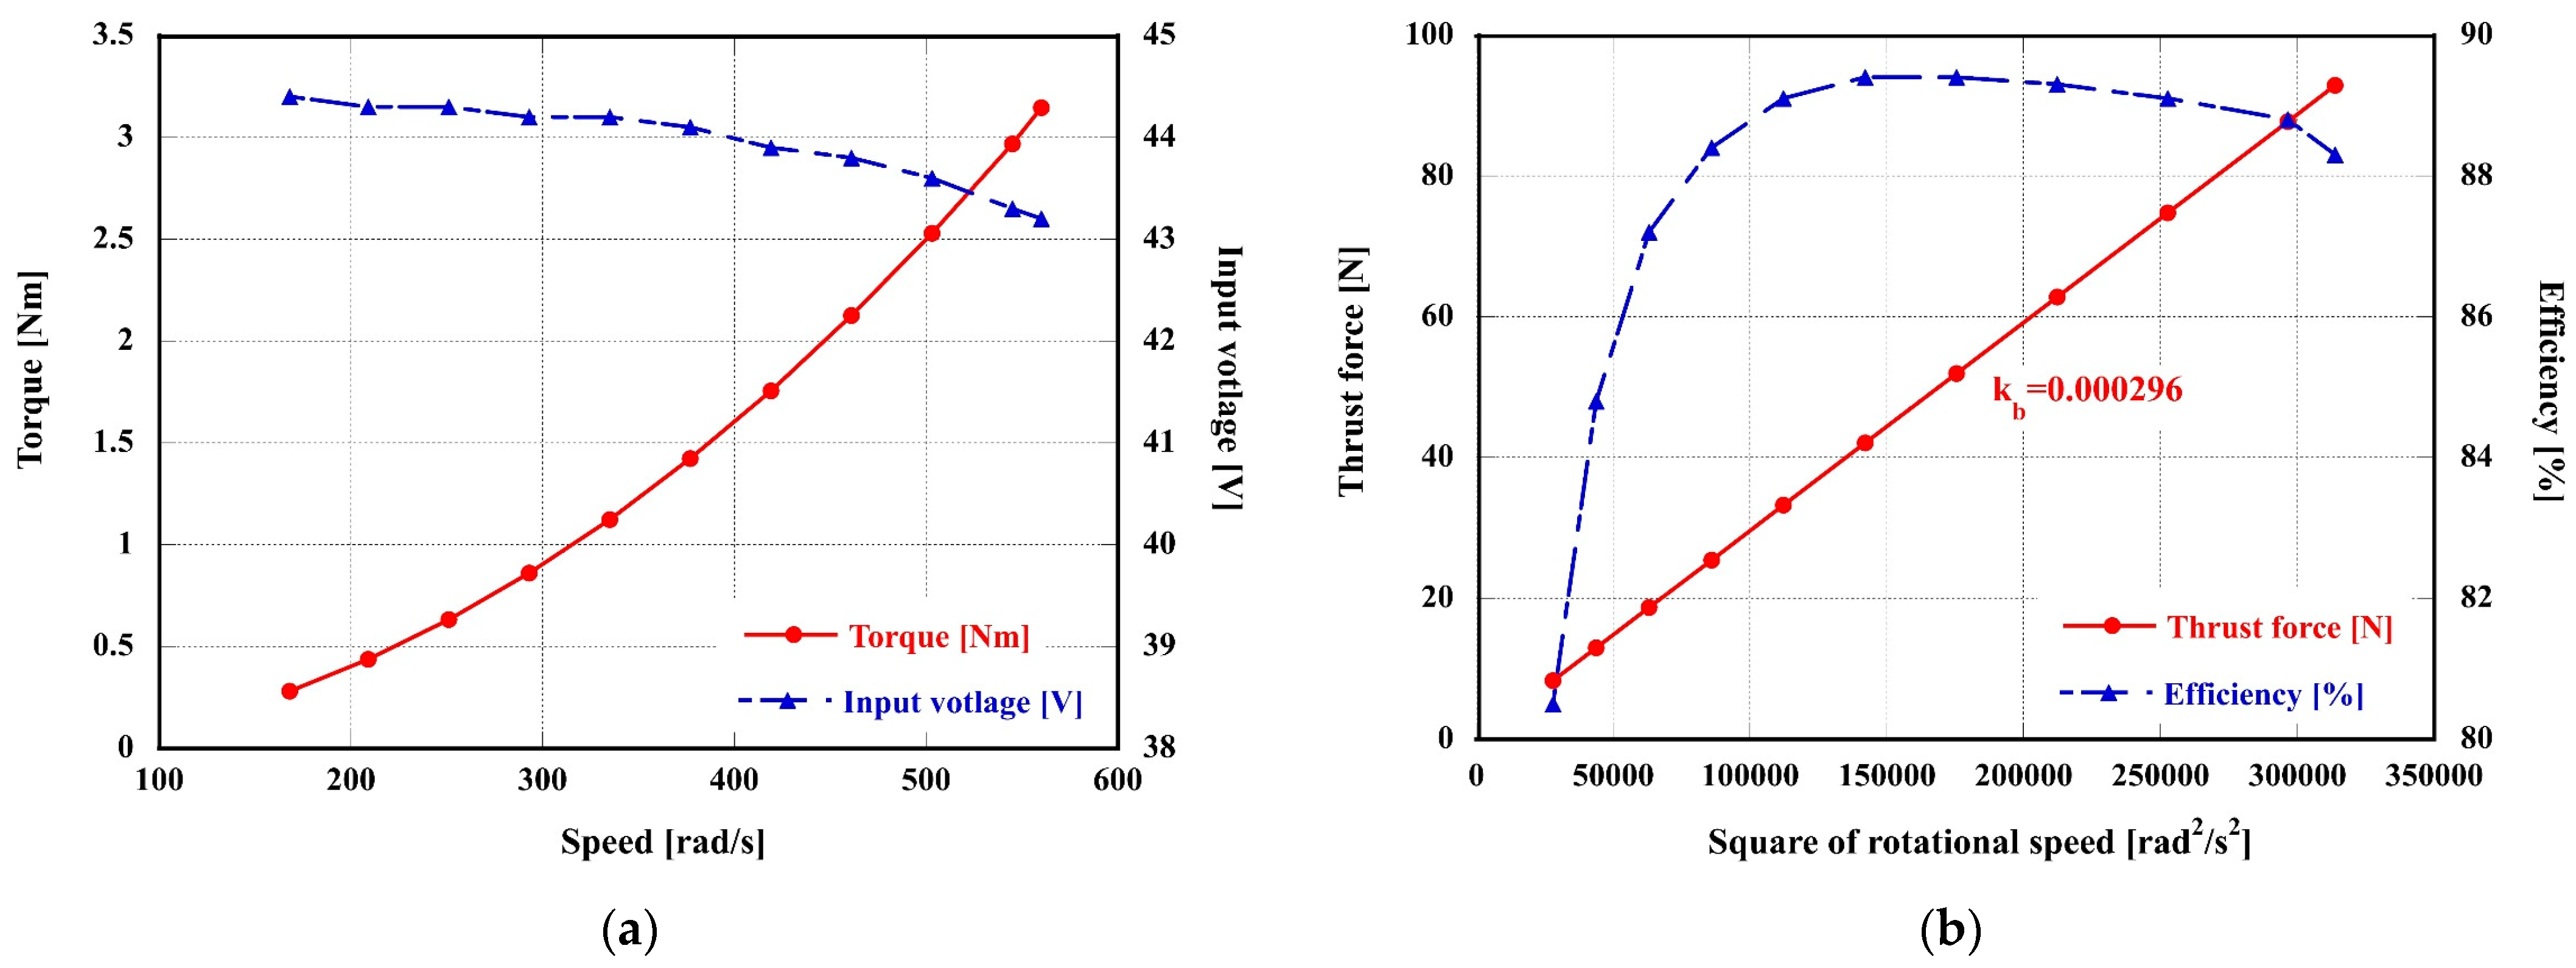
The thrust motor, utilized in drones, accounts for the highest power consumption among all system components. To simulate dynamic characteristics that mirror actual characteristics, data from the manufacturer are essential. In this study, a thrust motor is modeled, as depicted in Figure 7a, utilizing the input voltage and torque in relation to the speed of the blade-mounted thrust motor. The force of the thrust motor () is proportional to the square of the motor speed , as illustrated by Equation (19). This relationship is further represented in Figure 7b.
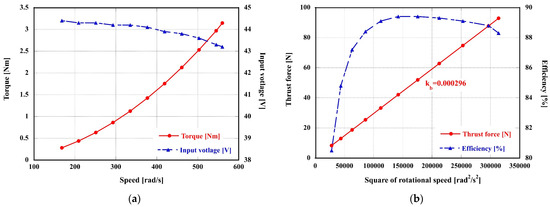
Figure 7.
Thrust motor specifications (Dualsky XM9010HD-13 with MRP 24″): (a) speed–torque–voltage curves; (b) speed–force–efficiency curves.
2.1.5. Sub-Actuator (Pump)
An actual agricultural done is equipped with a storage tank and pump, and this structural characteristic provides the two methods of utilization as follows: First, dynamic characteristics of a system can be analyzed with respect to the changes in the drone weight by consistently adjusting tank capacity and spraying amount. Second, shipment drones can be simulated by implementing instantaneous loss of mass. Therefore, a sub-actuator capable of these features is developed based on the specification data shown in Table 6 and dynamic model shown in Figure 4b.
Table 6.
Specifications of sub-actuator (pump).
2.1.6. DC-DC Converter
Given that electrical output characteristics of the converter are not examined in this study, the converter model is configured to generate system voltage by outputting a duty ratio through a PI controller. Here, the nominal voltage (44 V) of the thrust motor is assumed as the reference voltage of the system. To ensure that the voltage of fuel cell and battery () is constantly maintained at the system voltage (), the output voltage equation of a buck-boost converter was applied as shown in Equation (20).
2.2. Integrated Drone System Model
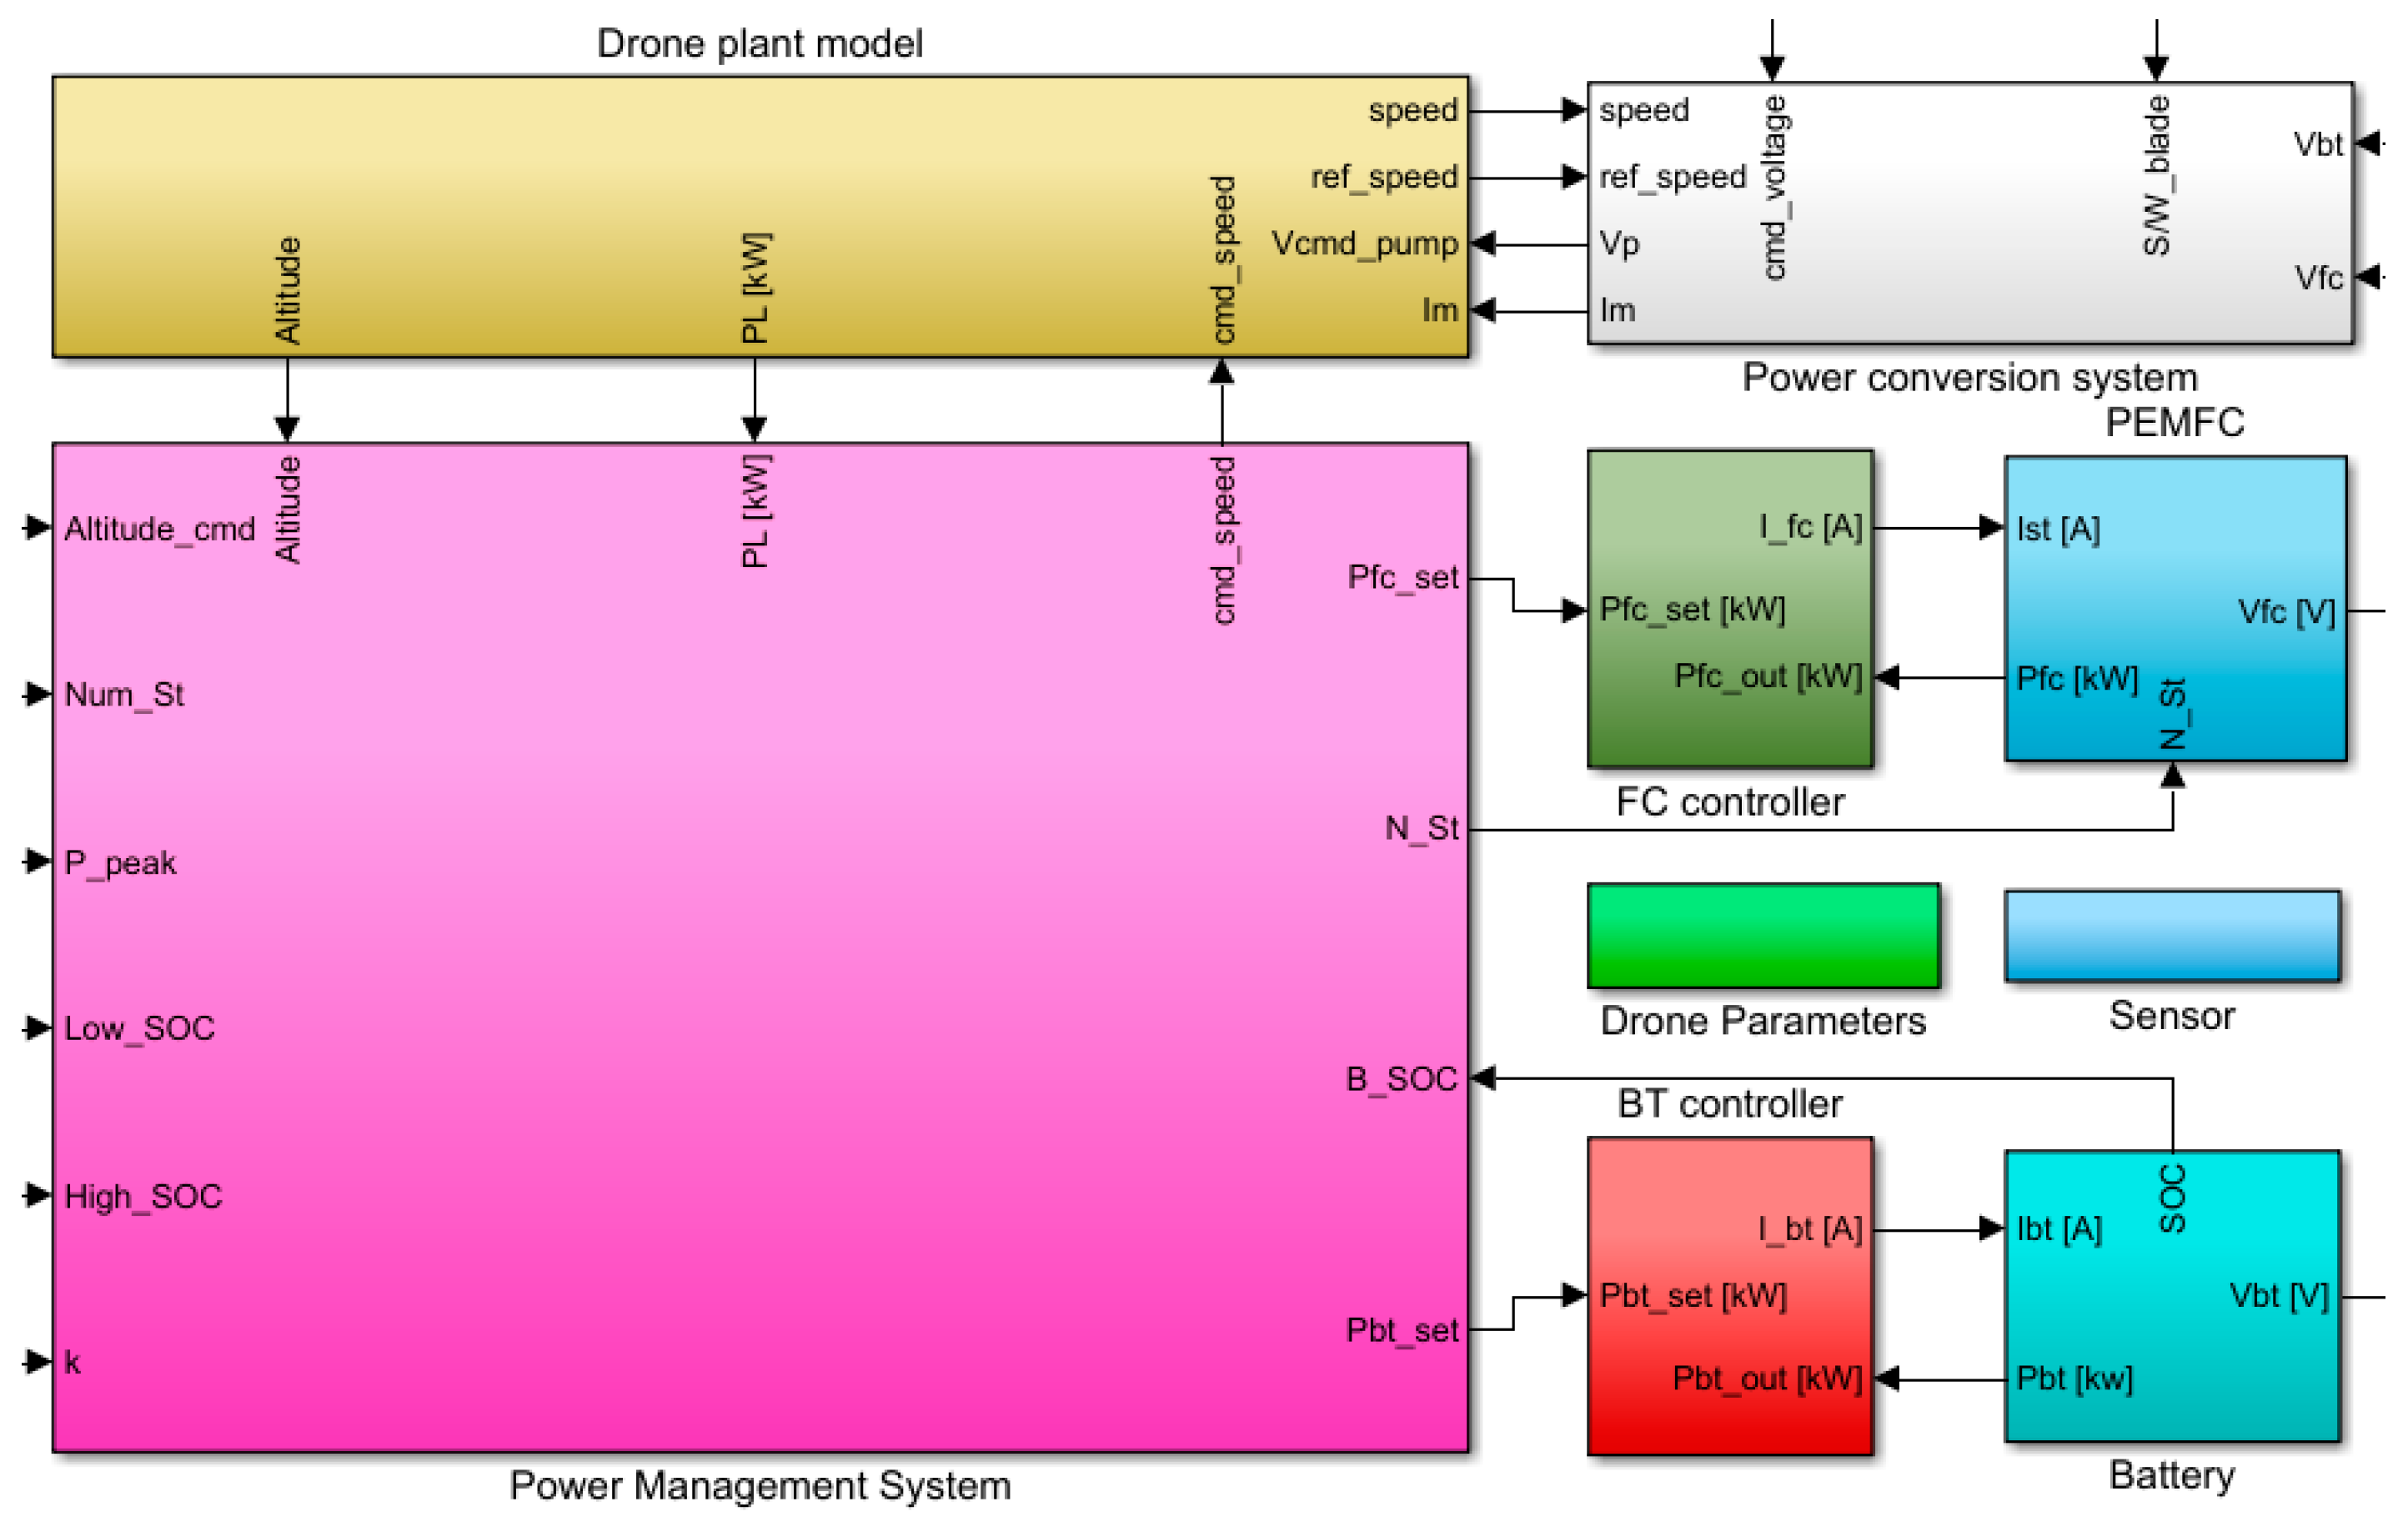
To combine the separately developed components into a unified system, an integrated controller, mirroring the function of the microprocessor in Figure 1a, is essential. This controller primarily conducts the feedback control of the outputs of components vital for system operation. In this study, the integrated controller was designed for the drone’s flight-level control, and models for the altitude calculator and controller were also incorporated. Moreover, the PEMFC–battery power source model was developed as a fully active battery/fuel cell hybrid type [18]. The final model of the integrated hybrid drone system is presented in Figure 8.
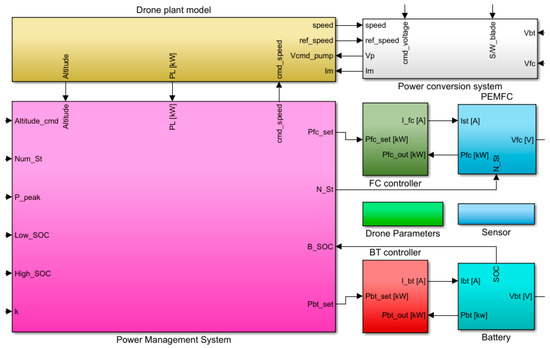
Figure 8.
Integrated drone system model.
3. Power-Split Strategy
3.1. Control Logic for Components
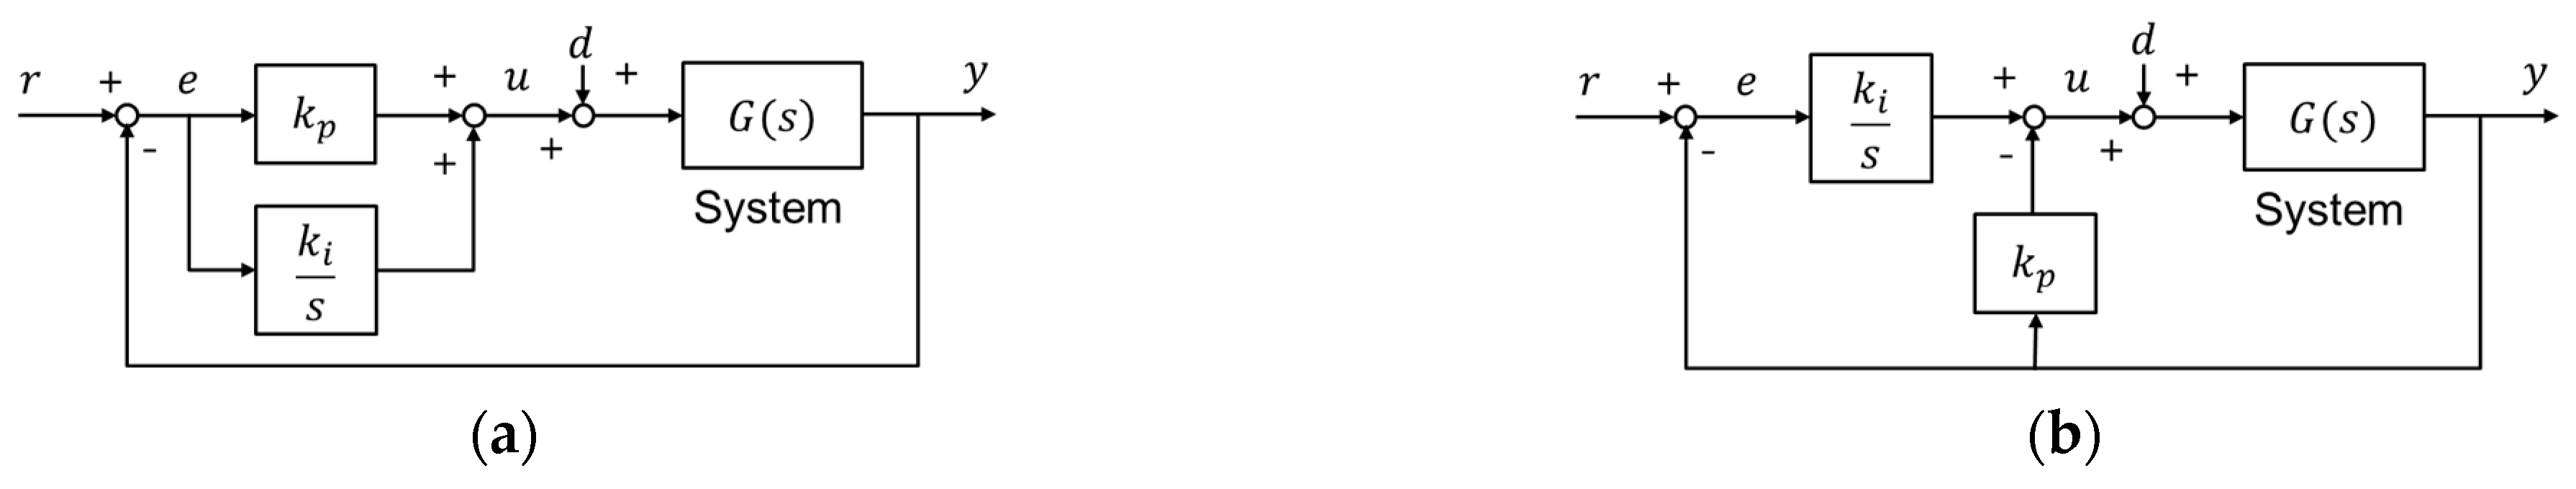
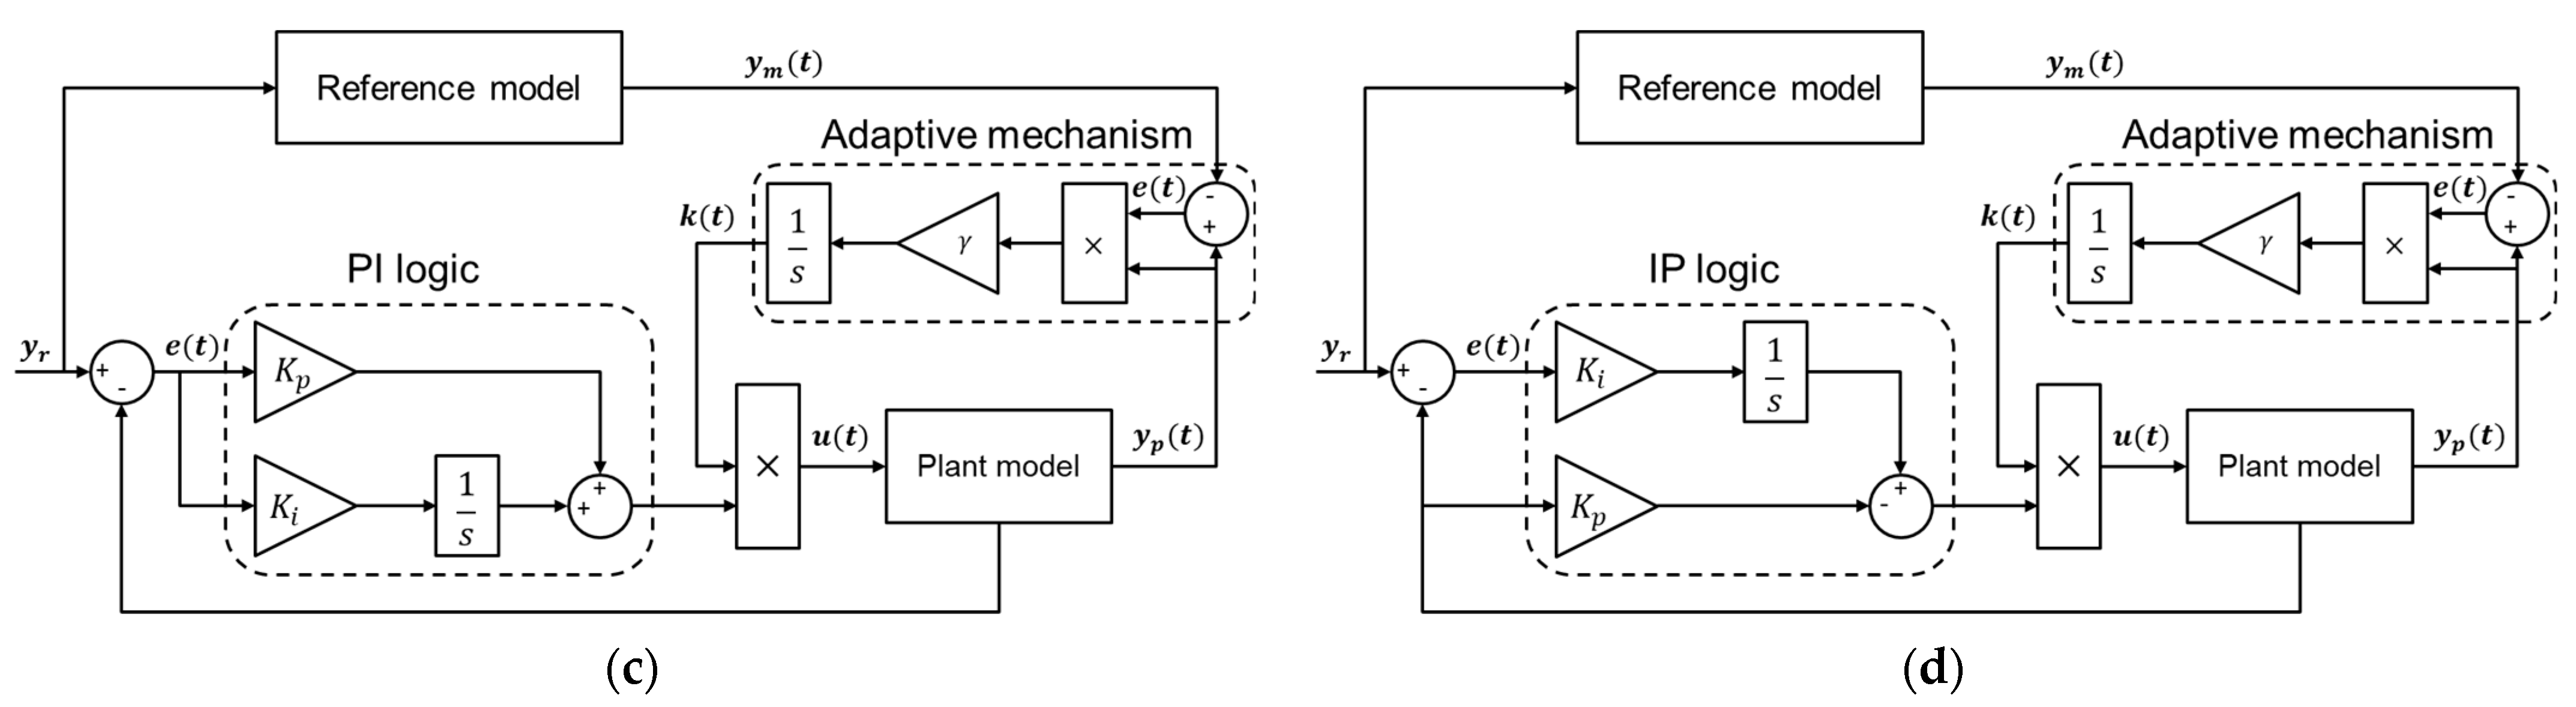
Proportional control plays a dominant role in a commonly used PI controller, in which a simple structure facilitates the understanding of users, but convergence accuracy may be degraded depending on the proficiency in tuning gains and limited control bandwidth of a system [23,44,45,46,47,48,49]. In an IP controller, where derivative control plays a dominant role, the structure is similar to the PI controller, and there is less fluctuation in control output due to relatively smaller overshoot and undershoot. However, convergence speed is rather slow in general [44,45]. FL and MPC result in high control accuracies but are difficult to use as they require the knowledge and experience of experts. In particular, MPC entails limitations at low computing power because it involves a relatively greater computation amount [21,22,46,47,48,49]. Similarly, MRAC, with its various topologies and need for designing a reference model, can be as challenging to design as MPC because it necessitates expert-level knowledge [23]. Although other controllers, based on rules or neural networks, exist, in this study, the dynamic characteristics of the drone system were analyzed using a total of four control logics, which integrate MRAC based on PI and IP control, as depicted in Figure 9.


Figure 9.
Control block diagram for drone: (a) PI control; (b) IP control; (c) PI−based MRAC; (d) IP−based MRAC.
3.2. Rule-Based Power Split Strategy
An active control-based hybrid power system uses a power converter to control the input and output of each power source. PEMFC controls output power, while the battery is controlled considering input power delivered from PEMFC and output power required by the system. Given that there can be on/off states of each power source, rule-based PSS has been devised based on battery SOC and the drone’s flight state, as shown in Figure 10.
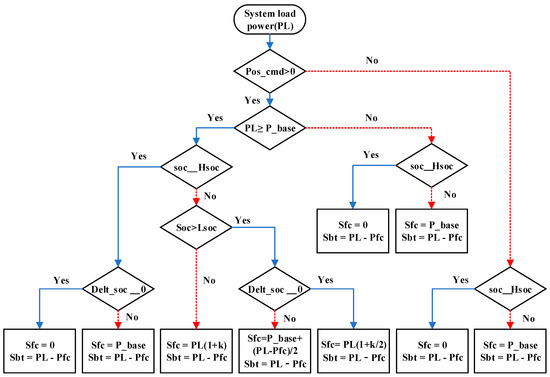
Figure 10.
Rule-based PSS for drone hybrid PMS.
Pos_cmd denotes a variable for discerning the flight state of the drone, while Delt_soc denotes a variable for discerning the charging and discharging state of the battery. Furthermore, P_base denotes the base power of a fuel cell for power-split selected within the effective output section of a fuel cell. Finally, Hsoc and Lsoc denote high- and low-limit SOC values, respectively, acting as thresholds for the charging and discharging commands of the battery.
4. Simulation Results and Discussion
4.1. Simulation Conditions
The dynamic characteristics of the drone system model can significantly vary depending on PSS, payload, thrust motor controller, and the characteristics of a parent controller for tracking the load profile. Therefore, control logic for analyzing the dynamic characteristics of the drone system can be arranged into four cases per load profile, totaling eight cases. The four cases configured by combining the logic presented in Figure 9 are as follows: PI control based on PI-controlled thrust motor (PI/PI), PI control based on PI-MRAC controlled thrust motor (PI/PI-MRAC), IP control based on PI-controlled thrust motor (IP/PI), and IP control based on PI-MRAC-controlled thrust motor (IP/PI-MRAC). The gain of each control logic and transfer function of the reference model are presented in Table 7.
Table 7.
Gain and transfer functions for control logic.
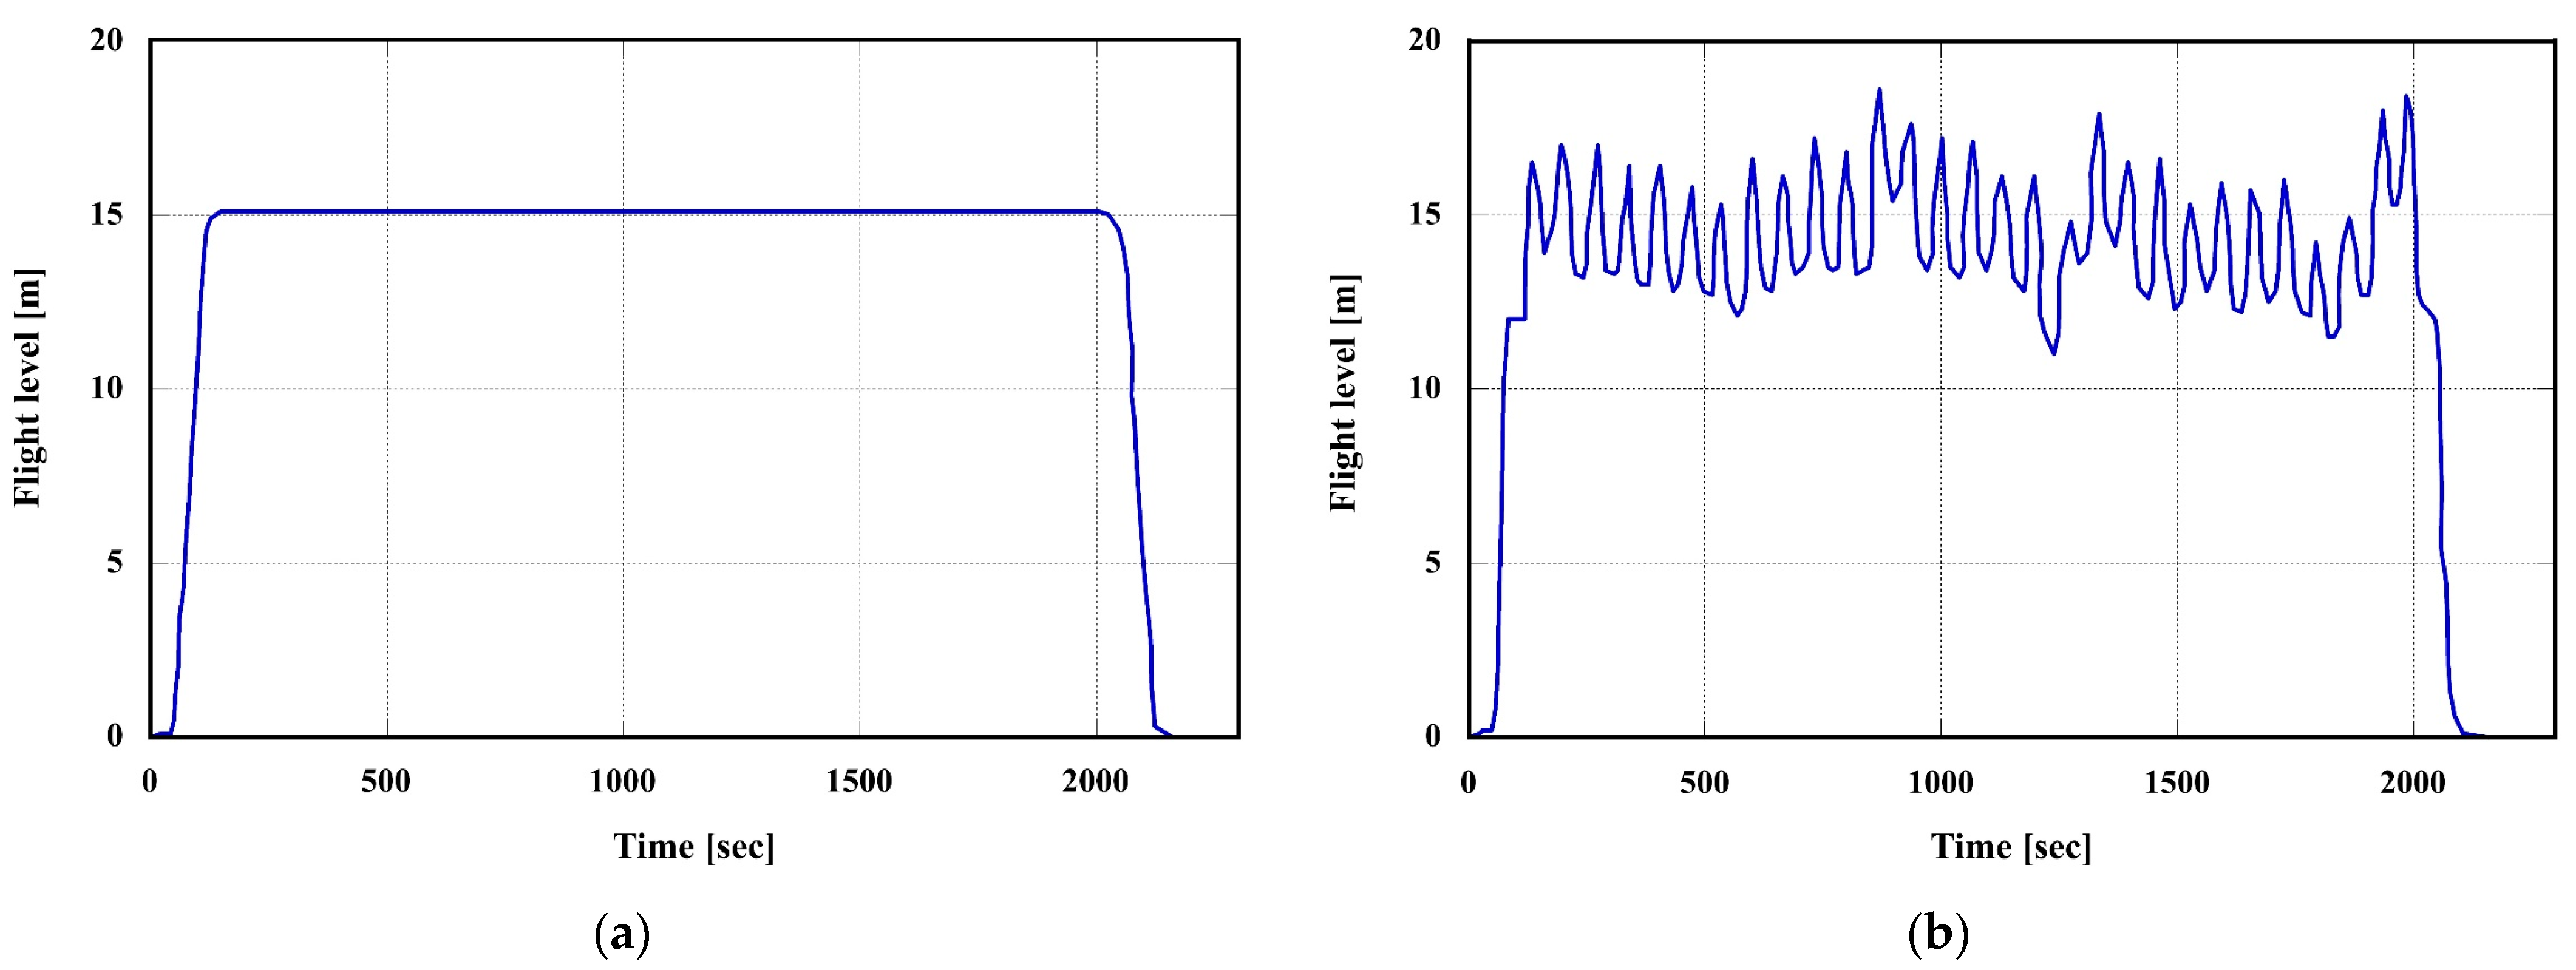
As shown in Figure 11, smooth and rough mission profiles are applied to simulate the load state of the drone [8]. The drone’s weight, set output of PEMFC, and battery capacity required for performing the simulation are listed in Table 8. NVIDIA DGX STATION (Future Automotive Intelligent Electronics Core Technology Center) was utilized to perform the simulation.
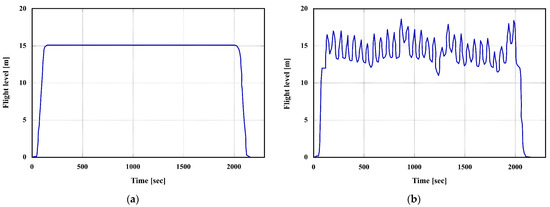
Figure 11.
Applied load profiles for drone: (a) smooth mission; (b) rough mission.
Table 8.
Simulation conditions for the drone system model.
4.2. Flight-Level Dynamic Characteristics in Transient State
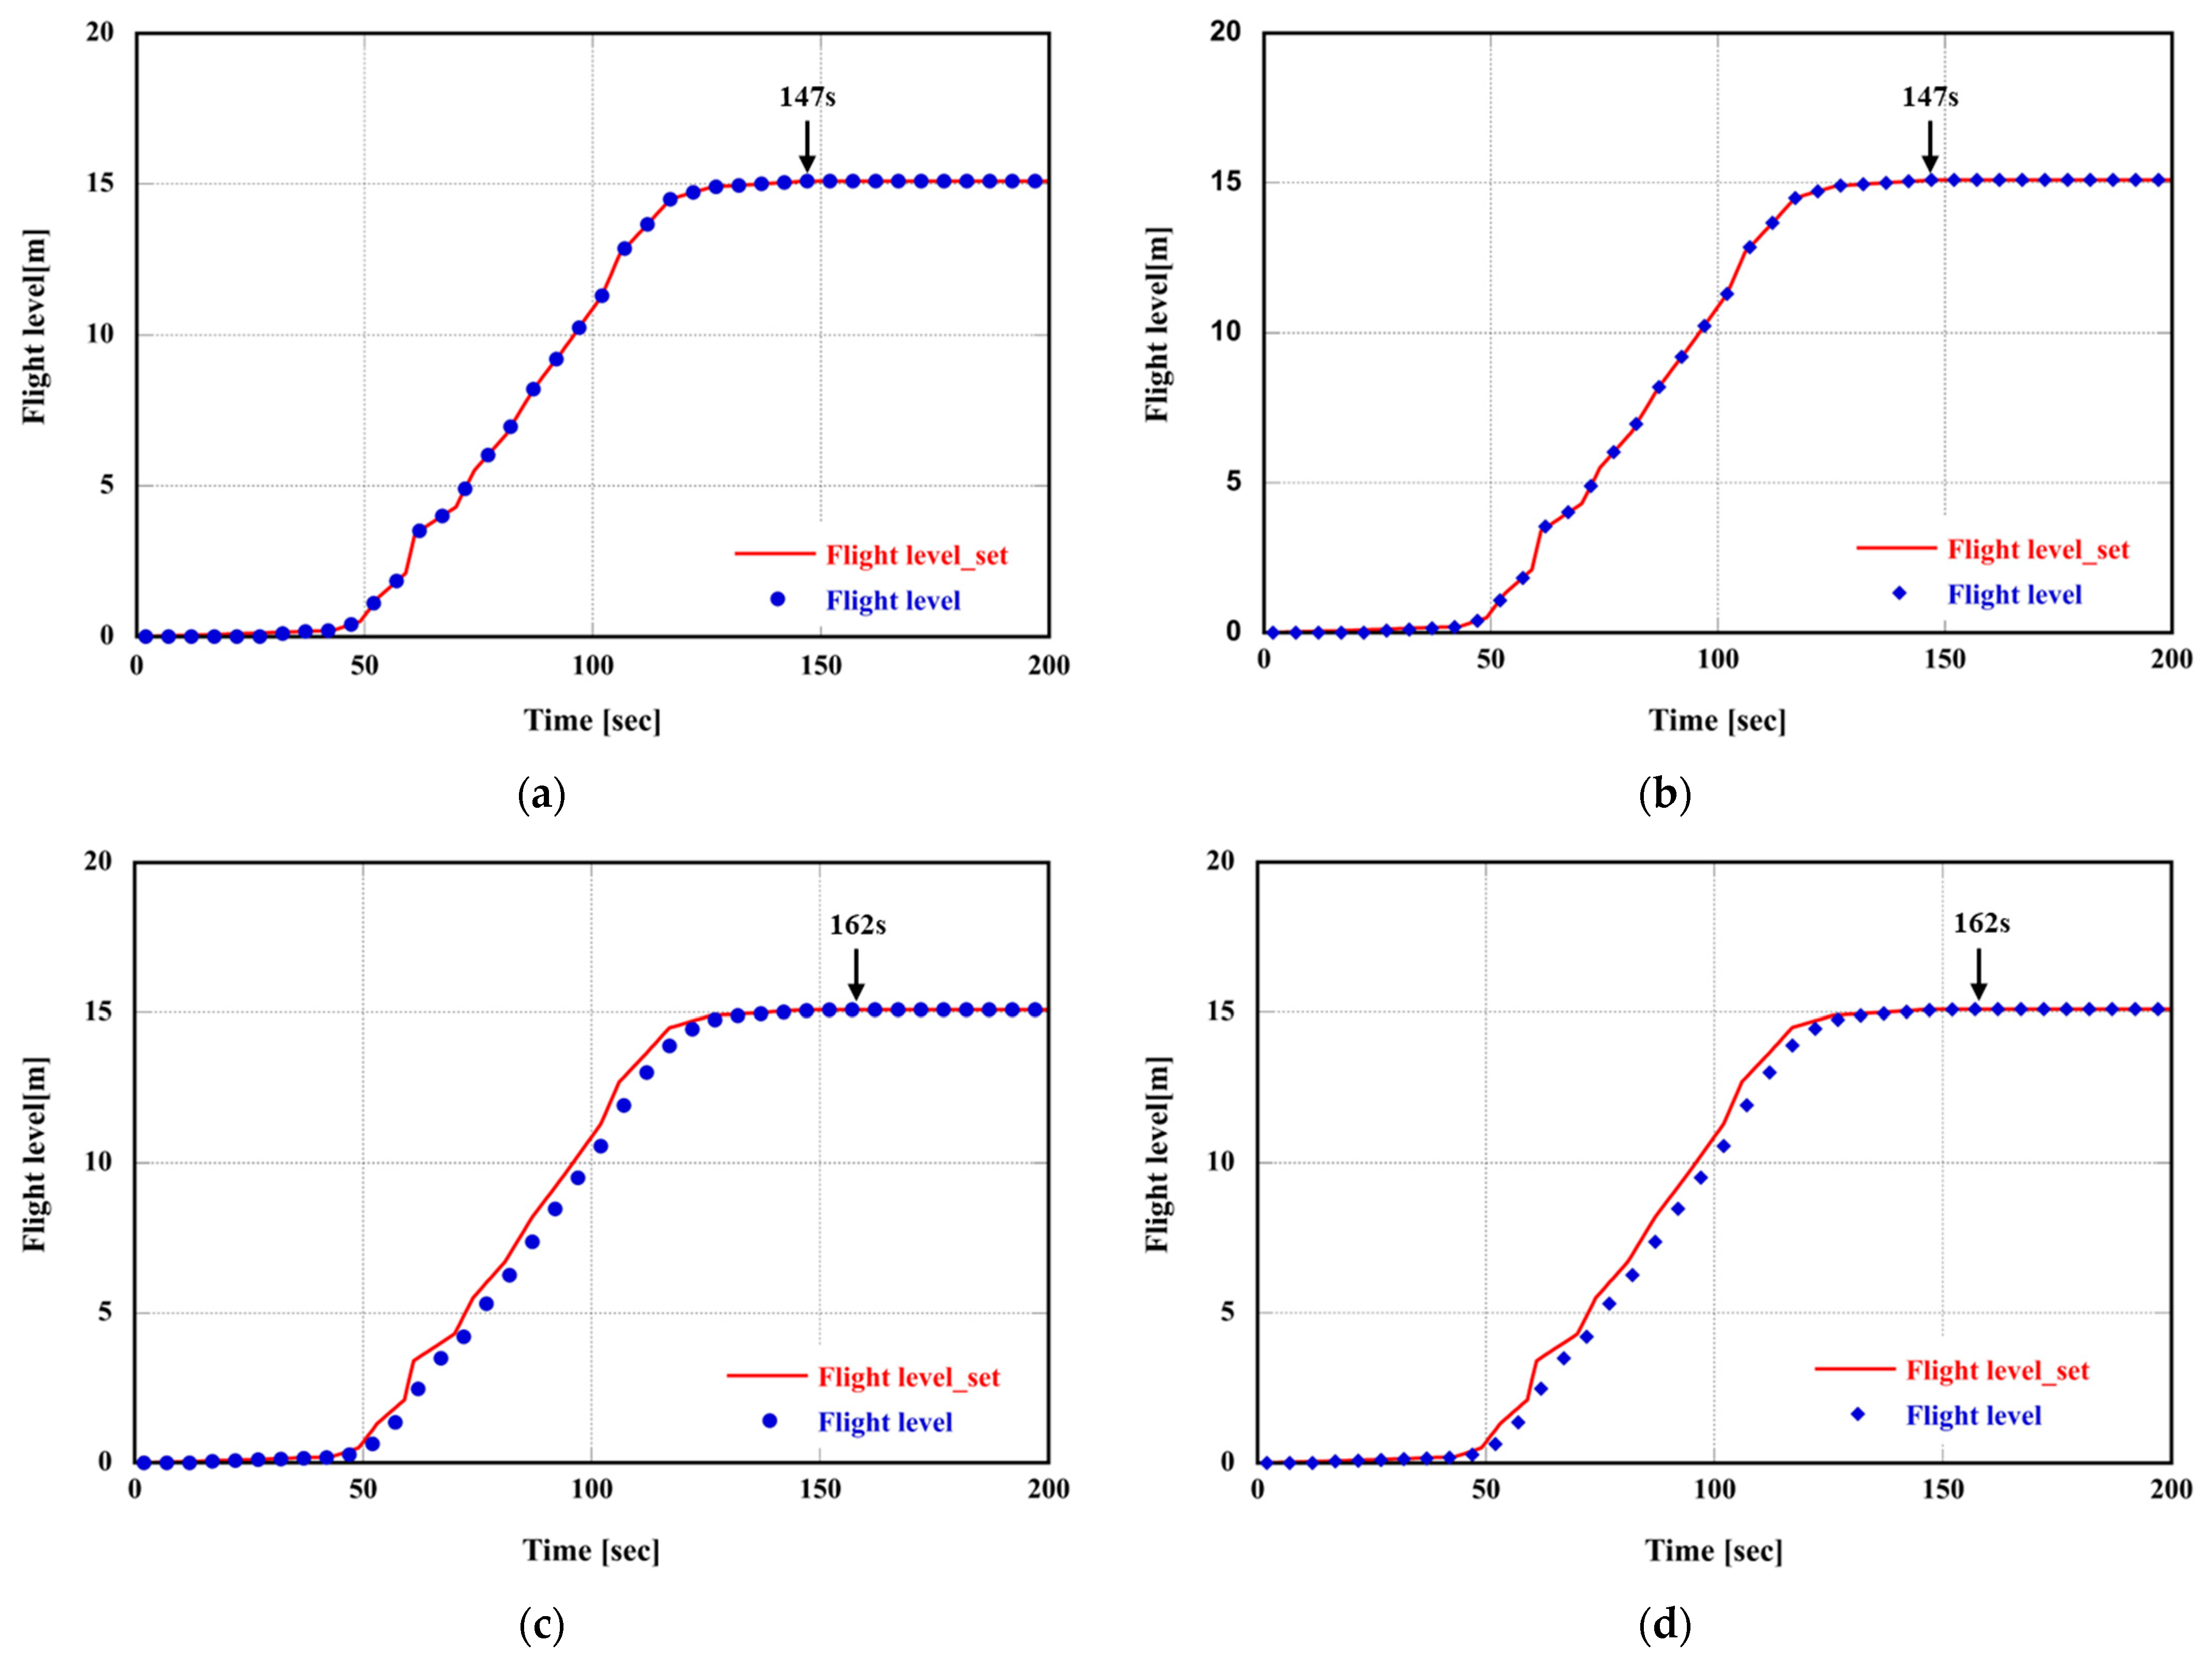
First, the simulation was performed by applying a smooth mission profile. Here, the simulation was performed in the transient section between 0 and 200 s because observing the output changes in a steady state is not particularly insightful. Hence, PI-based control logic reaches the normal state at 147 s, as shown in Figure 12a,b, while IP-based control logic reaches the normal state at 162 s, as shown in Figure 12c,d, thereby exhibiting a slower response speed. However, the time for the flight level to reach the normal state for MRAC logic did not show significant changes.
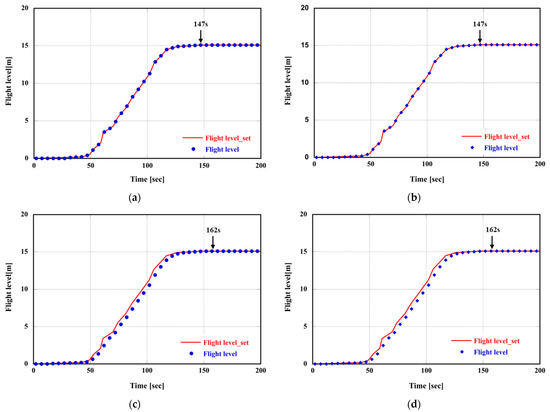
Figure 12.
Flight-level control for different logical combinations on smooth mission: (a) PI/PI; (b) PI/PI-MRAC; (c) IP/PI; (d) IP/PI-MRAC.
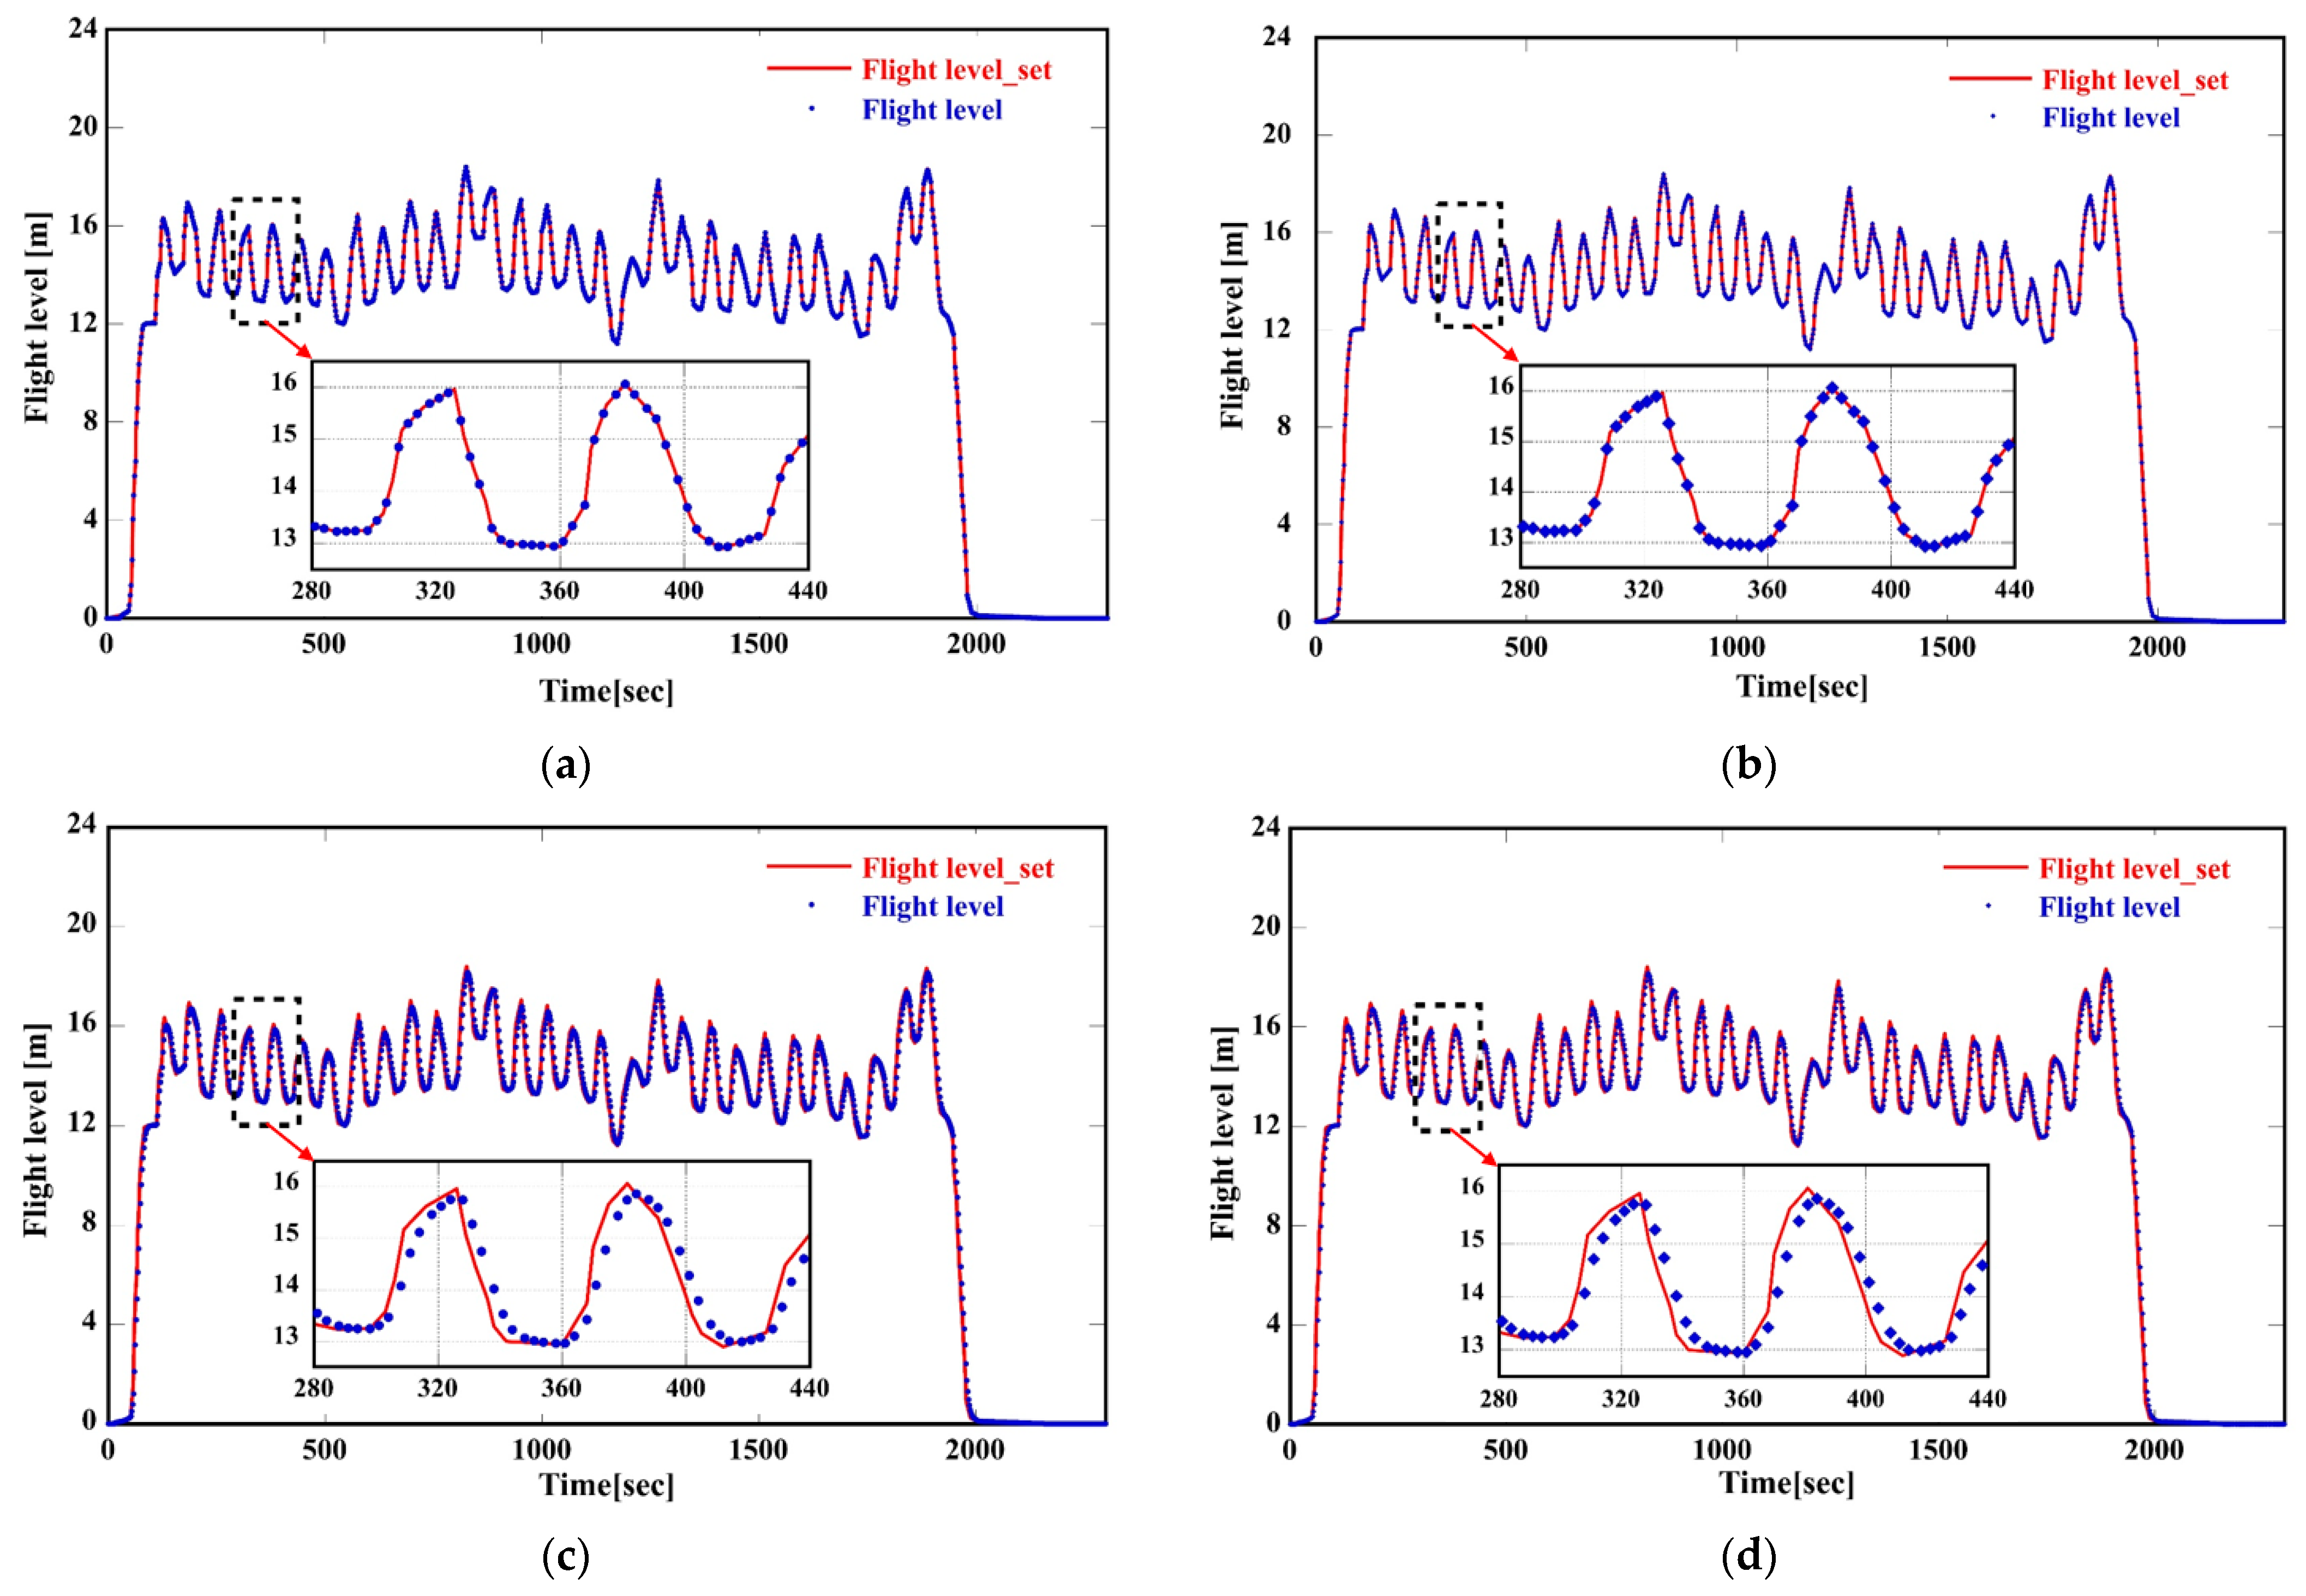
Then, the simulation is performed by applying a rough mission profile, and the dynamic characteristics of a flight level for each control logic are illustrated in Figure 13. Similar to the results shown in Figure 12, a fast tracking speed is observed in Figure 13a,b, where PI logic is applied, whereas a relatively slower tracing speed due to time delay is observed in Figure 13c,d where IP logic is applied. Furthermore, given that dynamic characteristics in Figure 13b–d, where MRAC is applied, are difficult to observe in a wide time range of 2300 s, other performance indicators are required.
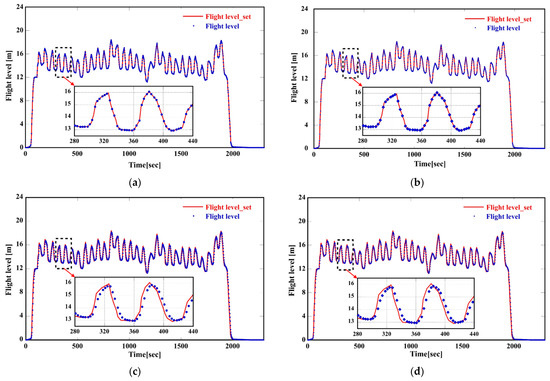
Figure 13.
Flight-level control for different logical combinations on rough mission: (a) PI/PI; (b) PI/PI-MRAC; (c) IP/PI; (d) IP/PI-MRAC.
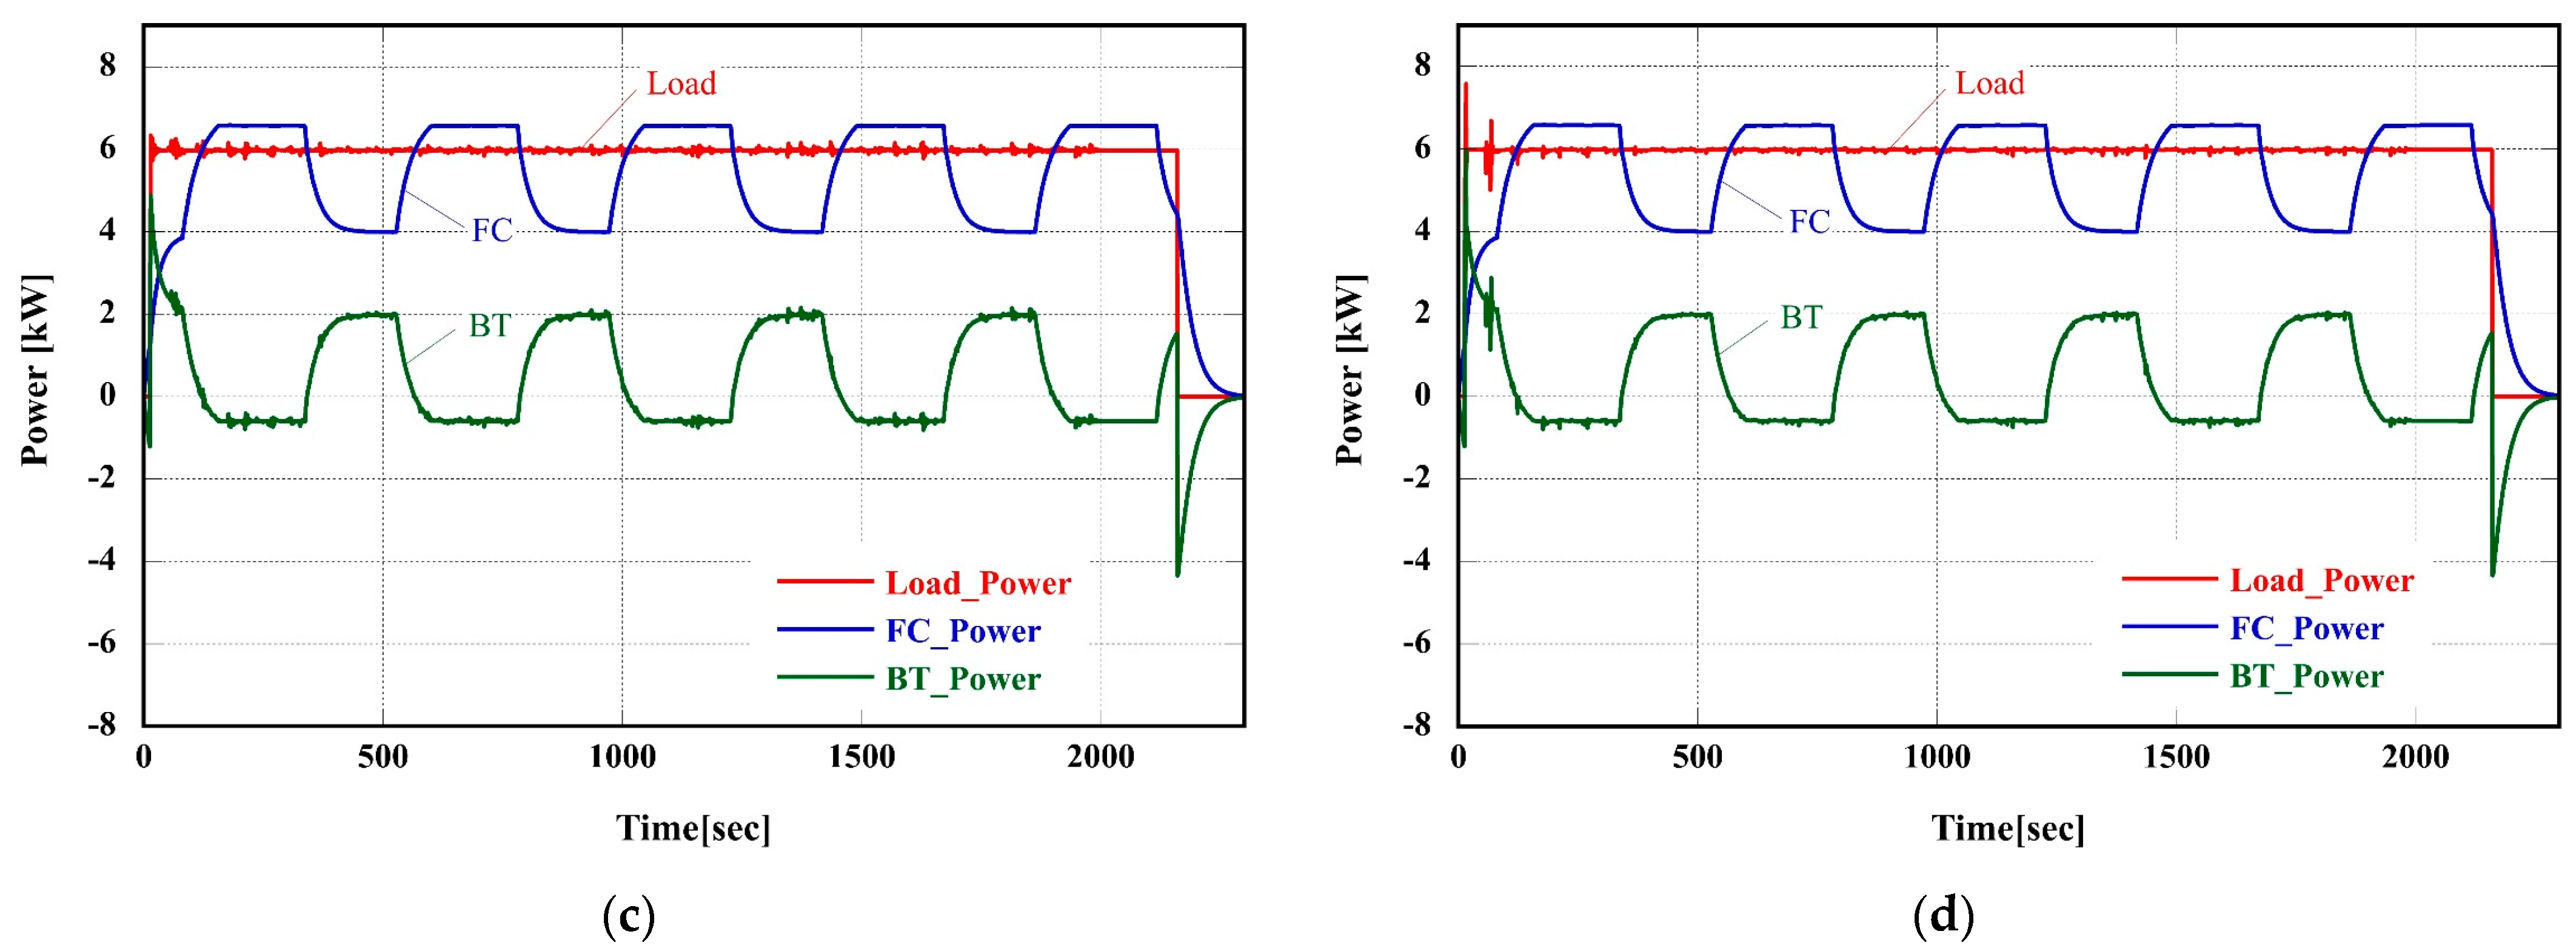
4.3. Power Dynamic Characteristics
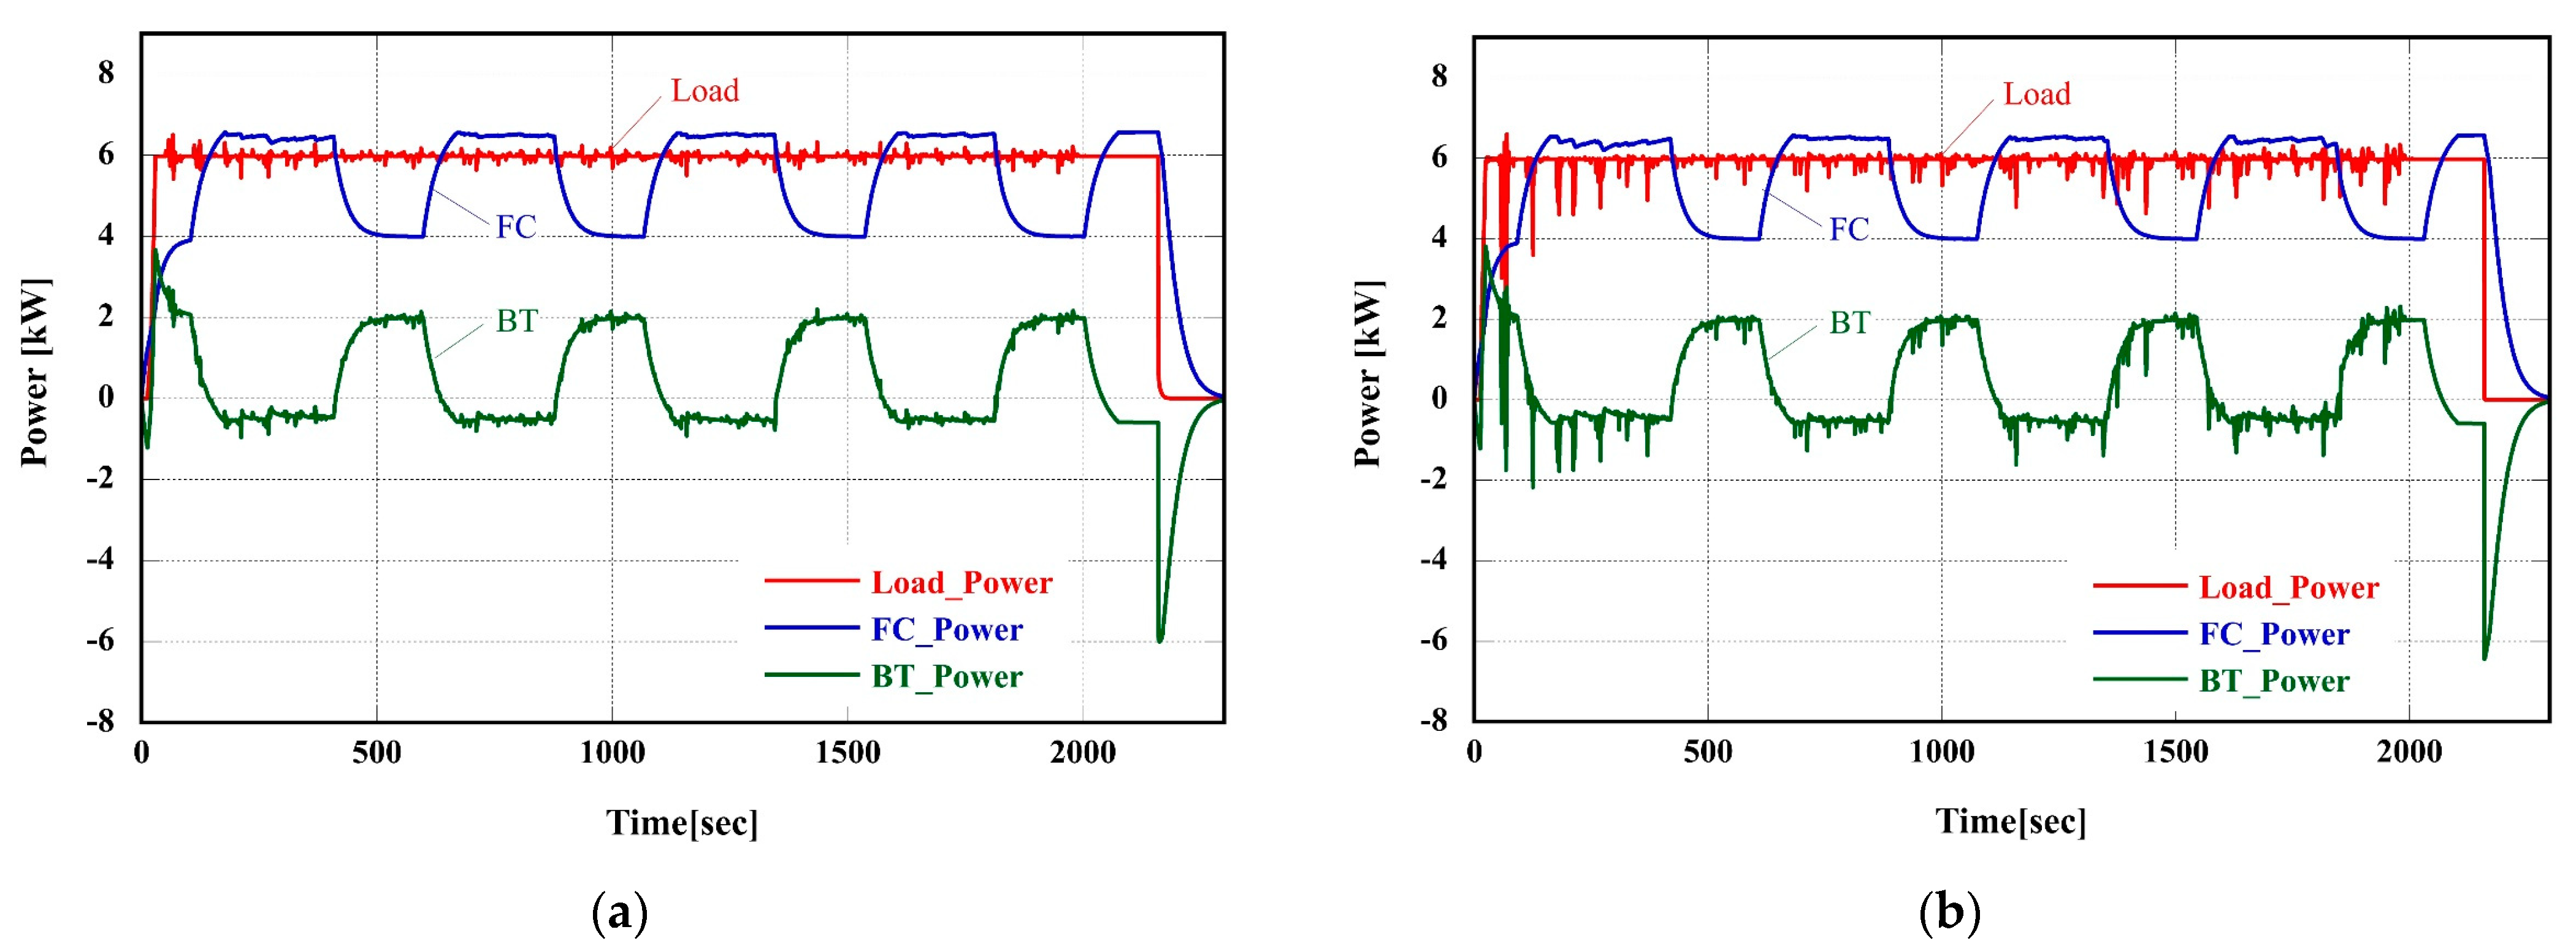
To investigate the power dynamic characteristics based on each control logic, the load power and output power of the PEMFC and battery are analyzed, as depicted in Figure 14. As evident in Figure 14b, the load power experiences the most pronounced fluctuation with PI/PI-MRAC, a trend clearly manifested in the battery output signal. Moreover, the fluctuations are most significant and frequent in the sequence of PI/PI, IP/PI, and IP/PI-MRAC. Notably, when IP/PI-MRAC is utilized, the load change characteristics remain consistently stable to the highest extent across all ranges.
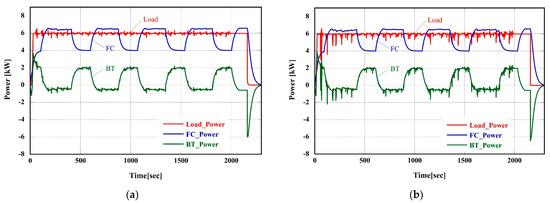
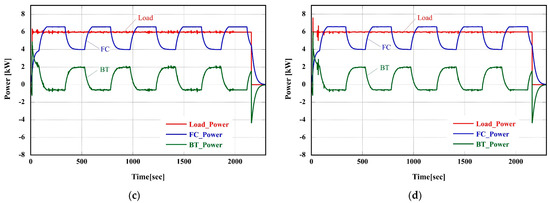
Figure 14.
Power dynamic characteristics on rough mission: (a) PI/PI; (b) PI/PI−MRAC; (c) IP/PI; (d) IP/PI−MRAC.
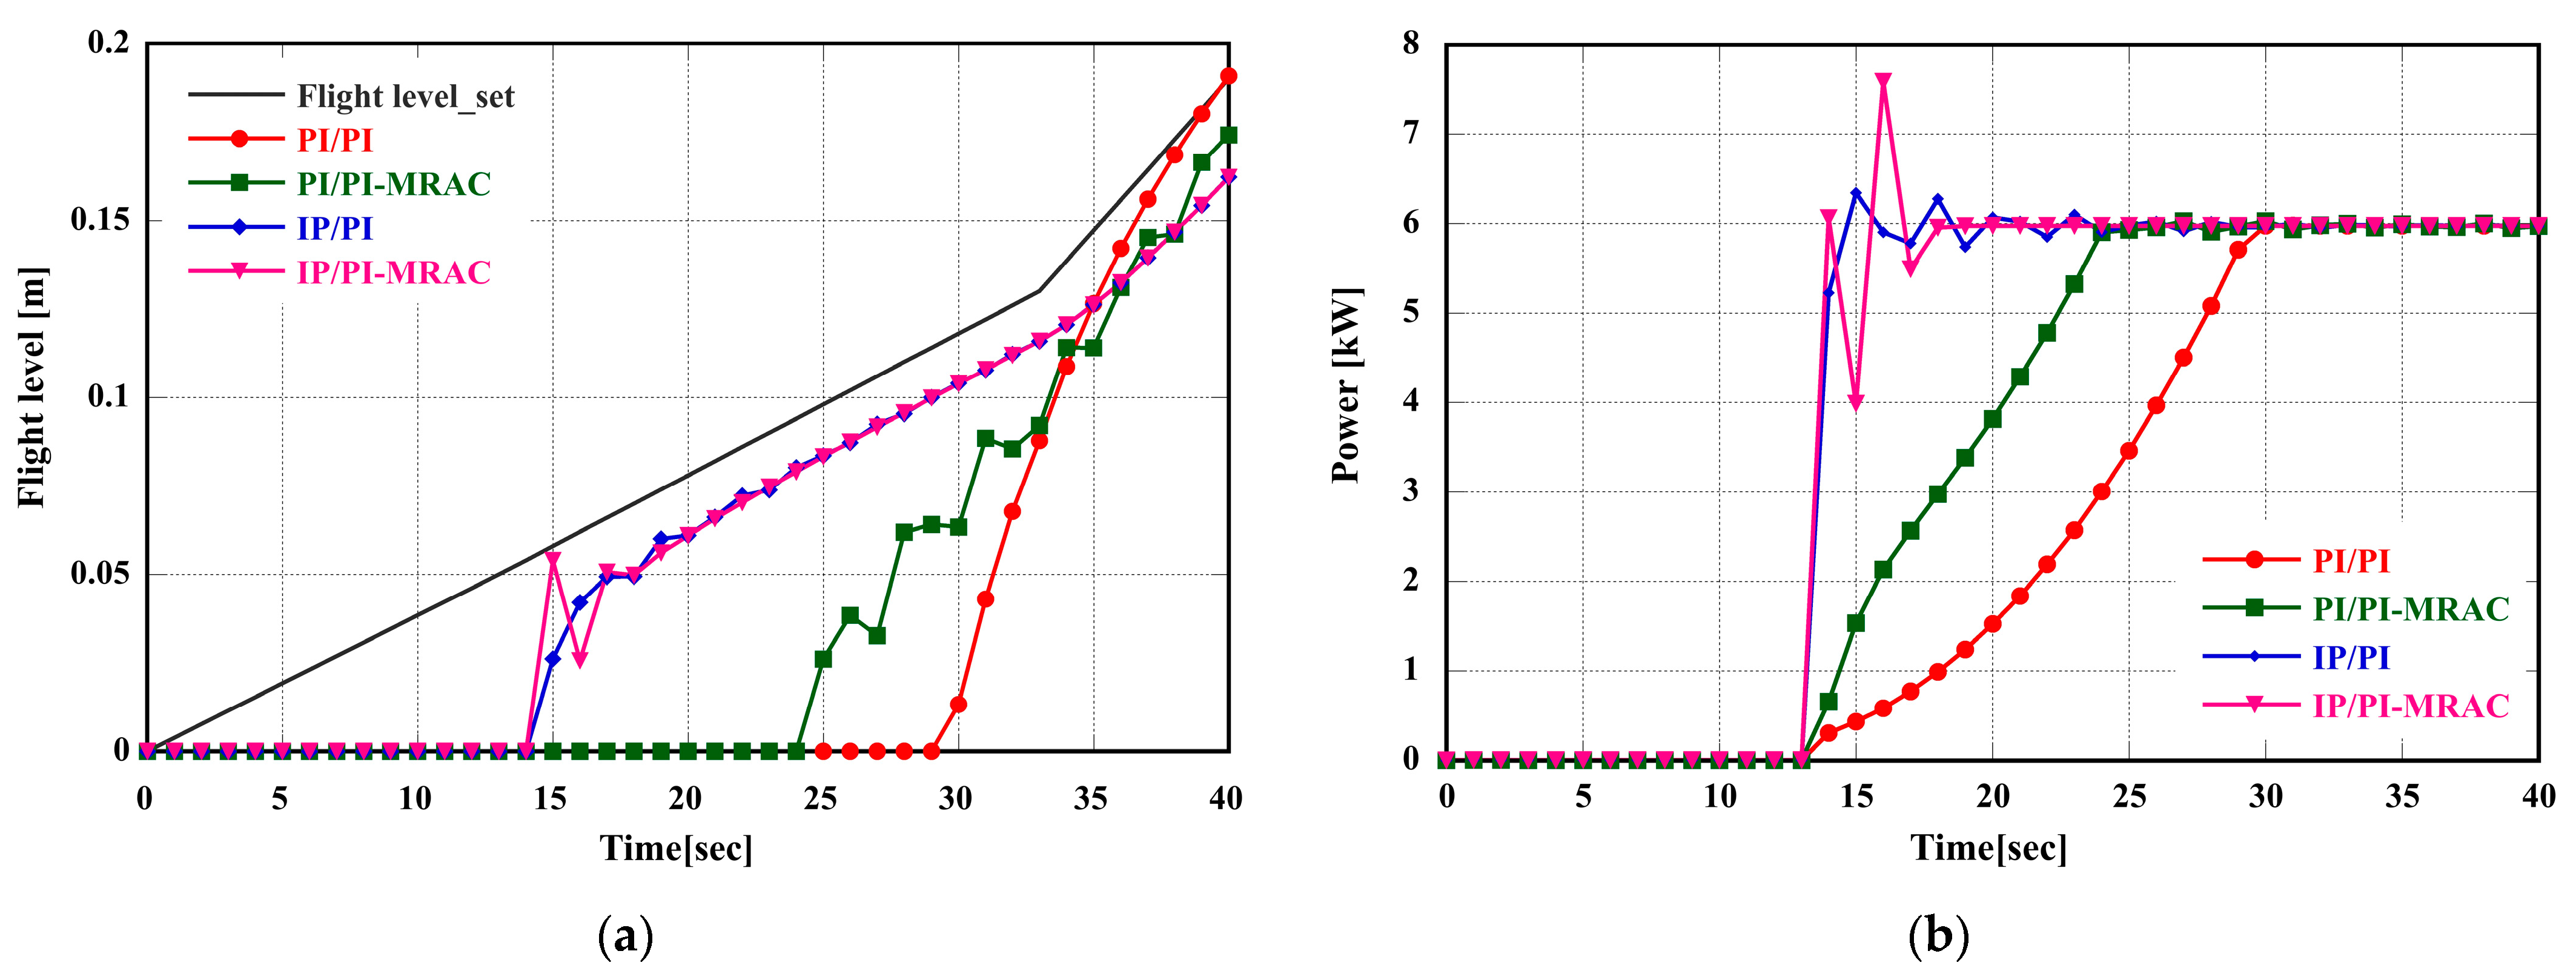
4.4. Discussion
Given that dynamic changes in each control logic are difficult to observe in a wide time range, the changes in flight level and output power in the initial operation section (0–40 s) are illustrated in Figure 14. As a result, the output fluctuation in Figure 14b is evidently larger when PI/PI-MRAC is applied. This is attributed to the fast tracking speed of PI/PI-MRAC, which takes only 10 s to reach from 0 to about 0.125 m, as shown in Figure 15a, and a faster reaction of the power with PI/PI-MRAC compared to PI/PI, as depicted in Figure 15b. In a similar manner, variations in flight level and load power in IP/PI display a comparable trend. However, significant fluctuations are curtailed due to the change-suppressive qualities of the IP control logic. Conversely, IP/PI-MRAC ensures the load power’s overshoot and undershoot remain within the standard operational parameters via rapid adaptive control.
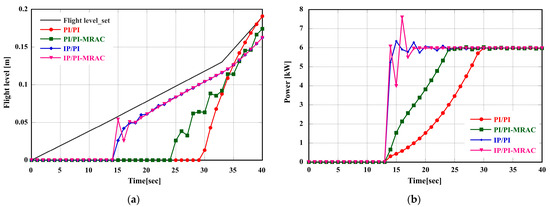
Figure 15.
Comparison of dynamic response for different control logics: (a) flight-level response; (b) load power response.
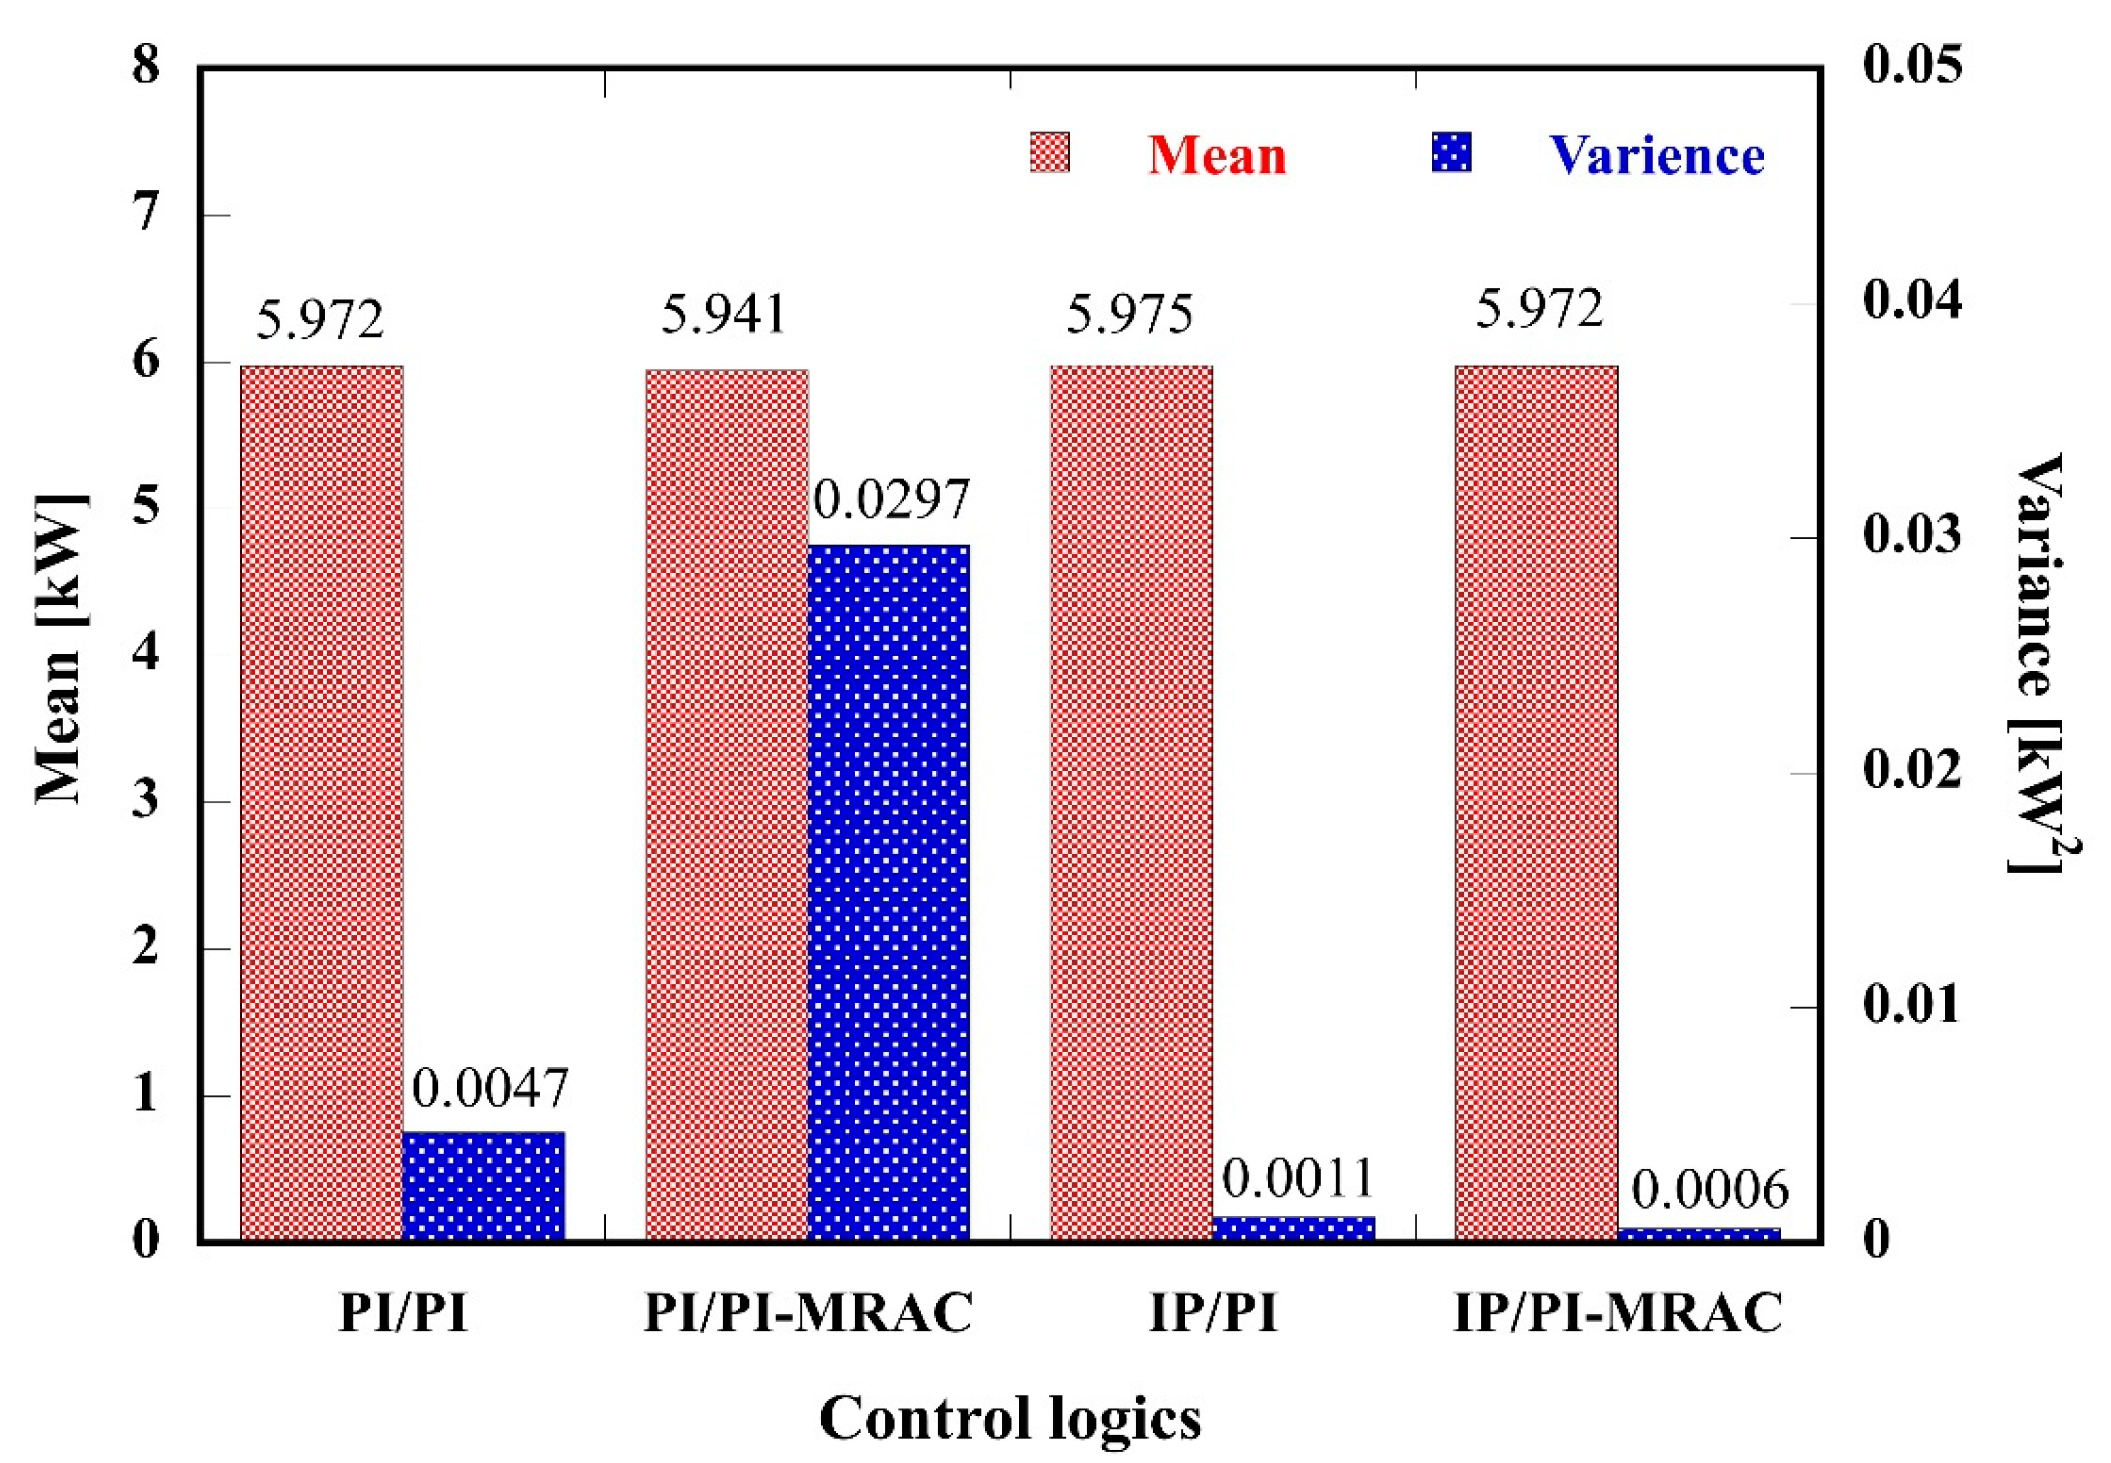
Based on the results presented in Section 4.2 and Section 4.3, PI-based control is capable of quick response to changes, whereas IP-based control demonstrates an effective suppression of changes. Furthermore, the effects due to the adaptive mechanism of MRAC logic are examined via the changes in load power. For quantitatively analyzing the performance of each control logic, analysis of variance (ANOVA) was applied to analyze the load power from 100 s to 1950 s. As shown in Figure 16, the mean value of load power is between 5.941 kW and 5.975 kW, while the variance is between 0.0008 kW2 and 0.0297 kW2. Therefore, these results confirm that the average power consumption for each control logic does not differ significantly. Furthermore, the variance, which can be used to compare the size of load variations relatively, was the largest in PI/PI-MRAC. In addition, the variance is relatively large when the logic applied to the flight-level controller is PI. These facts suggest that the flight-level controller is the unit that is greatly affected by the system’s dynamic characteristics depending on the control algorithm. Notably, in Figure 16, the characteristics of the base control logic are strengthened even for the same gain when MRAC logic is applied. Dynamic characteristics, on the other hand, are substantially affected by control logic, gain, as well as the reference model. Thus, different results can be shown if control conditions differ.
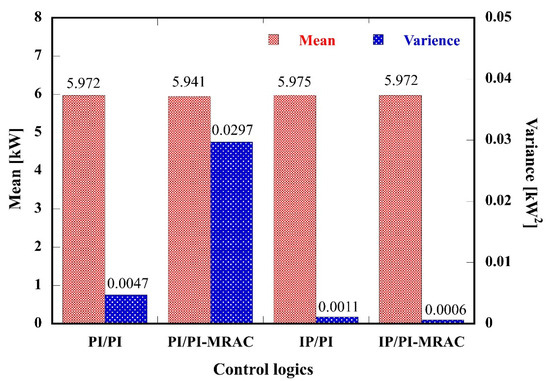
Figure 16.
Analysis of variance (ANOVA) of power.
4.5. Contribution
In summary, the PEMFC–battery drone model, developed in this study, holds promise for evaluating control logic and establishing specifications for air mobility systems. Notably, this research stands out by enabling predictions of a system’s dynamic characteristics through the analysis of control tracking features presented in Figure 13 and Figure 14 and the examination of load power signals depicted in Figure 15 and Figure 16. Furthermore, it streamlines the process of discerning the attributes of each power source within a hybrid propulsion system and aids in the development and validation of PSS.
5. Conclusions
In this study, a PEMFC–battery drone system model was developed for analyzing the effects of dynamic characteristics of major components constituting a drone system on the overall system. Furthermore, this study analyzed the dynamic characteristics of the system by applying four combinations of control logic for flight-level control and thrust motor speed control, as well as the PSS required to operate the hybrid power. The results can be summarized as follows:
- PI, IP, and PI-MRAC logic were applied to the flight-level controller and thrust motor, which are major components that greatly affect the dynamic characteristics of the drone system. Additionally, the gain value of the base control logic was maintained consistently to examine the impact of MRAC logic.
- For simulating the flight conditions of the drone, both a smooth mission and a rough mission were selected for the load profile, and a total of eight combinations of control logic was applied for the simulation. The dynamic characteristics of the system were examined from 0 to 200 s for the smooth mission and from 100 to 1950 s for the rough mission.
- In the smooth mission profile analysis, the flight-level signal indicated that PI-based control logic required 147 s to stabilize, while IP-based logic required 162 s. This suggests that the PI control logic possesses superior dynamic characteristics. However, in the context of the rough mission profile, the IP-based control logic effectively smoothed flight-level transitions by curbing abrupt load shifts. This, in turn, mitigated sudden load power changes, offering advantages for the power lifespan and durability of drone systems.
- For quantitatively comparing dynamic characteristics with respect to control logic, ANOVA was performed for output signals of load power presented the results in Section 4.3, which varied from 100 s to 1950 s. The findings revealed that PI/PI-MRAC had the lowest average power consumption at 5.941 kW. However, it exhibited the most significant dynamic fluctuations with a variance of 0.0297 kW2. Conversely, IP/PI-MRAC displayed the least variance at 0.0008 kW2, attributable to the enhanced stabilizing effect of the IP logic on output variations.
Therefore, as confirmed in this study, it was found that the control logic of the main components that make up the system can significantly change the dynamic characteristics of the drone system. These results can be used to conduct research on the system output density of air mobility that can be performed in the future, as well as the improvement of the durability of the power source. However, additional experimental research is needed to improve the accuracy of simulation results using a drone system model under actual conditions.
Author Contributions
Model design, Methodology, Software, Writing—original draft, D.H.; Second supervision, Writing—modification draft, Writing—review and editing, S.H.; First supervision, Writing—modification draft, Writing—review and editing, J.H. All authors have read and agreed to the published version of the manuscript.
Funding
This research study was supported by “Regional Innovation Strategy (RIS)” through the National Research Foundation of Korea (NRF) funded by the Ministry of Education (MOE) (2021RIS-004) and by the Technology Innovation Program (00144016) funded by the Ministry of Trade, Industry and Energy (MOTIE, Republic of Korea).
Data Availability Statement
Data are contained within the article.
Conflicts of Interest
The authors declare no conflict of interest.
References
- Petrone, R.; Steiner, N.Y.; Hissel, D.; Pera, M.C.; Zerhouni, N.; Jemei, S.; Hemmer, S.; Bouwman, R. Ageing integration in PEMFC range extender model for on-board prognostic applications. In Proceedings of the 2018 IEEE Vehicle Power and Propulsion Conference (VPPC), Chicago, IL, USA, 27–30 August 2018; pp. 1–4. [Google Scholar]
- Pourrahmani, H.; Yavarinasab, A.; Siavashi, M.; Matian, M. A review on the proton exchange membrane fuel cells (PEMFCs) water/thermal management: From theory to the current challenges and real-time fault diagnosis methods. Energy Rev. 2022, 1, 100002. [Google Scholar] [CrossRef]
- Ghenai, C.; Bettayeb, M.; Brdjanin, B.; Hamid, A.K. Hybrid solar PV/PEM fuel Cell/Diesel Generator power system for cruise ship: A case study in Stockholm, Sweden. Case Stud. Therm. Eng. 2019, 14, 100497. [Google Scholar] [CrossRef]
- Bayrak, Z.U.; Kaya, U.; Oksuztepe, E. Investigation of PEMFC performance for cruising hybrid powered fixed-wing electric UAV in different temperatures. Int. J. Hydrogen Energy 2020, 45, 7036–7045. [Google Scholar] [CrossRef]
- Boukoberine, M.N.; Zhou, Z.; Benbouzid, M. A critical review on unmanned aerial vehicles power supply and energy management: Solutions, strategies, and prospects. Appl. Energy 2019, 255, 113823. [Google Scholar] [CrossRef]
- Elouarouar, S.; Medromi, H. Multi-Rotors Unmanned Aerial Vehicles Power Supply and Energy Management. In E3S Web of Conferences; EDP Sciences: Les Ulis, France, 2022; Volume 336, p. 00068. [Google Scholar]
- Tao, L.E.I.; Zhou, Y.A.N.G.; Zicun, L.I.N.; Zhang, X. State of art on energy management strategy for hybrid-powered unmanned aerial vehicle. Chin. J. Aeronaut. 2019, 32, 1488–1503. [Google Scholar]
- Donateo, T.; Ficarella, A.; Spedicato, L.; Arista, A.; Ferraro, M. A new approach to calculating endurance in electric flight and comparing fuel cells and batteries. Appl. Energy 2017, 187, 807–819. [Google Scholar] [CrossRef]
- Nishizawa, A.; Kallo, J.; Garrot, O.; Weiss-Ungethüm, J. Fuel cell and Li-ion battery direct hybridization system for aircraft applications. J. Power Source 2013, 222, 294–300. [Google Scholar] [CrossRef]
- Lee, B.; Kwon, S.; Park, P.; Kim, K. Active power management system for an unmanned aerial vehicle powered by solar cells, a fuel cell, and batteries. IEEE Trans. Aerosp. Electron. Syst. 2014, 50, 3167–3177. [Google Scholar] [CrossRef]
- Gang, B.G.; Kim, H.; Kwon, S. Ground simulation of a hybrid power strategy using fuel cells and solar cells for high-endurance unmanned aerial vehicles. Energy 2017, 141, 1547–1554. [Google Scholar] [CrossRef]
- Gong, A.; MacNeill, R.; Verstraete, D.; Palmer, J.L. Analysis of a fuel-cell/battery/supercapacitor hybrid propulsion system for a UAV using a hardware-in-the-loop flight simulator. In Proceedings of the 2018 AIAA/IEEE Electric Aircraft Technologies Symposium (EATS), Cincinnati, OH, USA, 9–11 July 2018; pp. 1–17. [Google Scholar]
- Motapon, S.N.; Dessaint, L.A.; Al-Haddad, K. A comparative study of energy management schemes for a fuel-cell hybrid emergency power system of more-electric aircraft. IEEE Trans. Ind. Electron. 2013, 61, 1320–1334. [Google Scholar] [CrossRef]
- Sun, L.; Feng, K.; Chapman, C.; Zhang, N. An adaptive power-split strategy for battery–supercapacitor powertrain—Design, simulation, and experiment. IEEE Trans. Power Electron. 2017, 32, 9364–9375. [Google Scholar] [CrossRef]
- Yang, Z.; Lei, T.; Lin, Z.; Fu, H.; Zhang, X. The testing platform of hybrid electric power system for a fuel cell unmanned aerial vehicle. In Proceedings of the 2018 IEEE International Conference on Electrical Systems for Aircraft, Railway, Ship Propulsion and Road Vehicles & International Transportation Electrification Conference (ESARS-ITEC), Nottingham, UK, 7–9 November 2018; pp. 1–8. [Google Scholar]
- Zhang, X.; Liu, L.; Dai, Y.; Lu, T. Experimental investigation on the online fuzzy energy management of hybrid fuel cell/battery power system for UAVs. Int. J. Hydrogen Energy 2018, 43, 10094–10103. [Google Scholar] [CrossRef]
- Gang, B.G.; Kwon, S. Design of an energy management technique for high endurance unmanned aerial vehicles powered by fuel and solar cell systems. Int. J. Hydrogen Energy 2018, 43, 9787–9796. [Google Scholar] [CrossRef]
- Kim, Y.; Han, J.; Yu, S. Establishment of energy management strategy of 50 kW PEMFC hybrid system. Energy Rep. 2023, 9, 2745–2756. [Google Scholar] [CrossRef]
- Zhang, C.; Qiu, Y.; Chen, J.; Li, Y.; Liu, Z.; Liu, Y.; Zhang, J.; Hwa, C.S. A comprehensive review of electrochemical hybrid power supply systems and intelligent energy managements for unmanned aerial vehicles in public services. Energy AI 2022, 9, 100175. [Google Scholar] [CrossRef]
- Feroldi, D.; Carignano, M. Sizing for fuel cell/supercapacitor hybrid vehicles based on stochastic driving cycles. Appl. Energy 2016, 183, 645–658. [Google Scholar] [CrossRef]
- Yilmaz, U.; Kircay, A.; Borekci, S. PV system fuzzy logic MPPT method and PI control as a charge controller. Renew. Sustain. Energy Rev. 2018, 81, 994–1001. [Google Scholar] [CrossRef]
- Heydari, R.; Gheisarnejad, M.; Khooban, M.H.; Dragicevic, T.; Blaabjerg, F. Robust and fast voltage-source-converter (VSC) control for naval shipboard microgrids. IEEE Trans. Power Electron. 2019, 34, 8299–8303. [Google Scholar] [CrossRef]
- Yanarates, C.; Zhou, Z. Design and cascade PI controller-based robust model reference adaptive control of DC-DC boost converter. IEEE Access 2022, 10, 44909–44922. [Google Scholar] [CrossRef]
- Zhao, D.; Xia, L.; Dang, H.; Wu, Z.; Li, H. Design and control of air supply system for PEMFC UAV based on dynamic decoupling strategy. Energy Convers. Manag. 2022, 253, 115159. [Google Scholar] [CrossRef]
- Vu, H.N.; Le Tri, D.T.; Nguyen, H.L.; Kim, Y.; Yu, S. Multifunctional bypass valve for water management and surge protection in a proton-exchange membrane fuel cell supply-air system. Energy 2023, 278, 127696. [Google Scholar] [CrossRef]
- Choi, Y.; Nguyen, X.L.; Choi, S.; Yu, S. 3D computational fluid dynamics-based analysis of water transfer characteristics of hollow fiber membrane for gas-to-gas membrane humidifier. Sustain. Energy Technol. Assess. 2023, 57, 103308. [Google Scholar] [CrossRef]
- Yun, H.; Liu, S.; Zhao, Y.; Xie, J.; Liu, C.; Hou, Z.; Wang, K. Energy management for fuel cell hybrid vehicles based on a stiffness coefficient model. Int. J. Hydrogen Energy 2015, 40, 633–641. [Google Scholar] [CrossRef]
- Kim, S.G.; Lee, E.; Hong, I.P.; Yook, J.G. Review of intentional electromagnetic interference on UAV sensor modules and experimental study. Sensors 2022, 22, 2384. [Google Scholar] [CrossRef]
- Kangunde, V.; Jamisola, R.S.; Theophilus, E.K. A review on drones controlled in real-time. Int. J. Dyn. Control. 2021, 9, 1832–1846. [Google Scholar] [CrossRef]
- Lukmana, M.A.; Nurhadi, H. Preliminary study on unmanned aerial vehicle (uav) quadcopter using pid controller. In Proceedings of the 2015 International Conference on Advanced Mechatronics, Intelligent Manufacture, and Industrial Automation (ICAMIMIA), Surabaya, Indonesia, 15–17 October 2015; pp. 34–37. [Google Scholar]
- Gao, L.; Jiang, Z.; Dougal, R.A. An actively controlled fuel cell/battery hybrid to meet pulsed power demands. J. Power Sources 2004, 130, 202–207. [Google Scholar] [CrossRef]
- Rao, V.P.S.; Rao, G.S. Design and modelling of an affordable uav based pesticide sprayer in agriculture applications. In Proceedings of the 2019 Fifth International Conference on Electrical Energy Systems (ICEES), Chennai, India, 21–22 February 2019; pp. 1–4. [Google Scholar]
- Kurnia, J.C.; Sasmito, A.P.; Shamim, T. Advances in proton exchange membrane fuel cell with dead-end anode operation: A review. Appl. Energy 2019, 252, 113416. [Google Scholar] [CrossRef]
- Mahjoubi, C.; Olivier, J.C.; Skander-Mustapha, S.; Machmoum, M.; Slama-Belkhodja, I. An improved thermal control of open cathode proton exchange membrane fuel cell. Int. J. Hydrogen Energy 2019, 44, 11332–11345. [Google Scholar] [CrossRef]
- Zhang, B.; Lin, F.; Zhang, C.; Liao, R.; Wang, Y.X. Design and implementation of model predictive control for an open-cathode fuel cell thermal management system. Renew. Energy 2020, 154, 1014–1024. [Google Scholar] [CrossRef]
- Wang, Y.X.; Yu, D.H.; Chen, S.A.; Kim, Y.B. Robust DC/DC converter control for polymer electrolyte membrane fuel cell application. J. Power Source 2014, 261, 292–305. [Google Scholar] [CrossRef]
- Amphlett, J.C.; Baumert, R.M.; Mann, R.F.; Peppley, B.A.; Roberge, P.R.; Rodrigues, A. Parametric modelling of the performance of a 5-kW proton-exchange membrane fuel cell stack. J. Power Source 1994, 49, 349–356. [Google Scholar] [CrossRef]
- Mann, R.F.; Amphlett, J.C.; Hooper, M.A.; Jensen, H.M.; Peppley, B.A.; Roberge, P.R. Development and application of a generalized steady-state electrochemical model for a PEM fuel cell. J. Power Source 2000, 86, 173–180. [Google Scholar] [CrossRef]
- Wang, C.; Nehrir, M.H.; Shaw, S.R. Dynamic models and model validation for PEM fuel cells using electrical circuits. IEEE Trans. Energy Convers. 2005, 20, 442–451. [Google Scholar] [CrossRef]
- Fly, A.; Thring, R.H. A comparison of evaporative and liquid cooling methods for fuel cell vehicles. Int. J. Hydrogen Energy 2016, 41, 14217–14229. [Google Scholar] [CrossRef]
- Wang, T.; Jagarwal, A.; Wagner, J.R.; Fadel, G. Optimization of an automotive radiator fan array operation to reduce power consumption. IEEE/ASME Trans. Mechatron. 2014, 20, 2359–2369. [Google Scholar] [CrossRef]
- Keklikoğlu, H.Ö. Design, Construction and Performance Evaluation of Axial Flow Fans. Master’s Thesis, Middle East Technical University, Ankara, Turkey, 2019. [Google Scholar]
- Liu, D.; Wang, X.; Zhang, M.; Gong, M. SOC estimation of lithium battery based on N-2RC model in electric vehicle. In Proceedings of the 2019 Chinese Control And Decision Conference (CCDC), Nanchang, China, 3–5 June 2019; pp. 2916–2921. [Google Scholar]
- Nandam, P.K.; Sen, P.C. A comparative study of proportional-integral (PI) and integral-proportional (IP) controllers for dc motor drives. Int. J. Control 1986, 44, 283–297. [Google Scholar] [CrossRef]
- Bhatti, S.A.; Malik, S.A.; Daraz, A. Comparison of PI and IP controller by using Ziegler-Nichols tuning method for speed control of DC motor. In Proceedings of the 2016 International Conference on Intelligent Systems Engineering (ICISE), Islamabad, Pakistan, 15–17 January 2016; pp. 330–334. [Google Scholar]
- Ahmed, A.H.; Abd El Samie, B.K.; Ali, A.M. Comparison between fuzzy logic and PI control for the speed of BLDC motor. Int. J. Power Electron. Drive Syst. 2018, 9, 1116–1123. [Google Scholar] [CrossRef]
- Khuntia, S.R.; Mohanty, K.B.; Panda, S.; Ardil, C. A Comparative Study of PI, IP, Fuzzy and Neuro-Fuzzy Controllers for Speed Control of DC Motor Drive. Int. J. Electr. Syst. Sci. Eng. 2009, 5, 714–718. [Google Scholar]
- Salem, F.; Mosaad, M.I. A comparison between MPC and optimal PID controllers: Case studies. In Proceedings of the Michael Faraday IET International Summit 2015, Kolkata, India, 12–13 September 2015; pp. 59–65. [Google Scholar]
- Shehu, I.A.; Wahab, N.A. Applications of MPC and PI controls for liquid level control in coupled-tank systems. In Proceedings of the 2016 IEEE International Conference on Automatic Control and Intelligent Systems (I2CACIS), Selangor, Malaysia, 22 October 2016; pp. 119–124. [Google Scholar]

Disclaimer/Publisher’s Note: The statements, opinions and data contained in all publications are solely those of the individual author(s) and contributor(s) and not of MDPI and/or the editor(s). MDPI and/or the editor(s) disclaim responsibility for any injury to people or property resulting from any ideas, methods, instructions or products referred to in the content. |
© 2023 by the authors. Licensee MDPI, Basel, Switzerland. This article is an open access article distributed under the terms and conditions of the Creative Commons Attribution (CC BY) license (https://creativecommons.org/licenses/by/4.0/).