Abstract
The original system, designed as a combination structure of a linear machine and a wireless power transmission transformer, was designed to overcome the limitations of the wired power supply method used for working robots and transportation equipment in existing smart factories, and improvements in magnetic coupling and power transfer efficiency are needed. In this work, we study the efficiency improvement of a system that can supply wireless power to track-type transportation equipment. For this purpose, electromagnetic properties such as magnetic equivalent resistance, inductance, magnetic coupling rate, and core loss are analyzed using the finite element method. In addition, the results of magnetic field finite element analysis are applied in electrical equivalent circuit modeling to analyze the voltage transfer ratio and input/output characteristics of a CLLC resonant converter designed for wireless power transmission. The efficiency improvements of the proposed model are verified through a comparison of experimental and simulation results after fabricating a prototype. From the results of this study, a more optimized wireless power transmission system design based on the analysis results from an electromagnetic perspective can be realized to improve the efficiency of wireless power transmission.
1. Introduction
Recently, transportation systems in smart factories have been showing problems such as sparks, dust, and restrictions on movement paths due to the wired cable method. In addition, replacement of electrical parts and high maintenance costs are required owing to wear and tear caused by mechanical friction.
Wireless power transfer systems are being widely utilized as a solution to address these issues as shown in Figure 1. Wireless power transfer technology can be applied in various transportation systems within smart factories, including stoppers and automated guided vehicles, to create a clean and unrestricted transportation environment without limitations on the mobility of the systems [1,2,3]. It can significantly contribute to establishing a clean and unobstructed transportation environment within the smart factory.

Figure 1.
Evolution of integrated wireless power supply system from wired power supply.
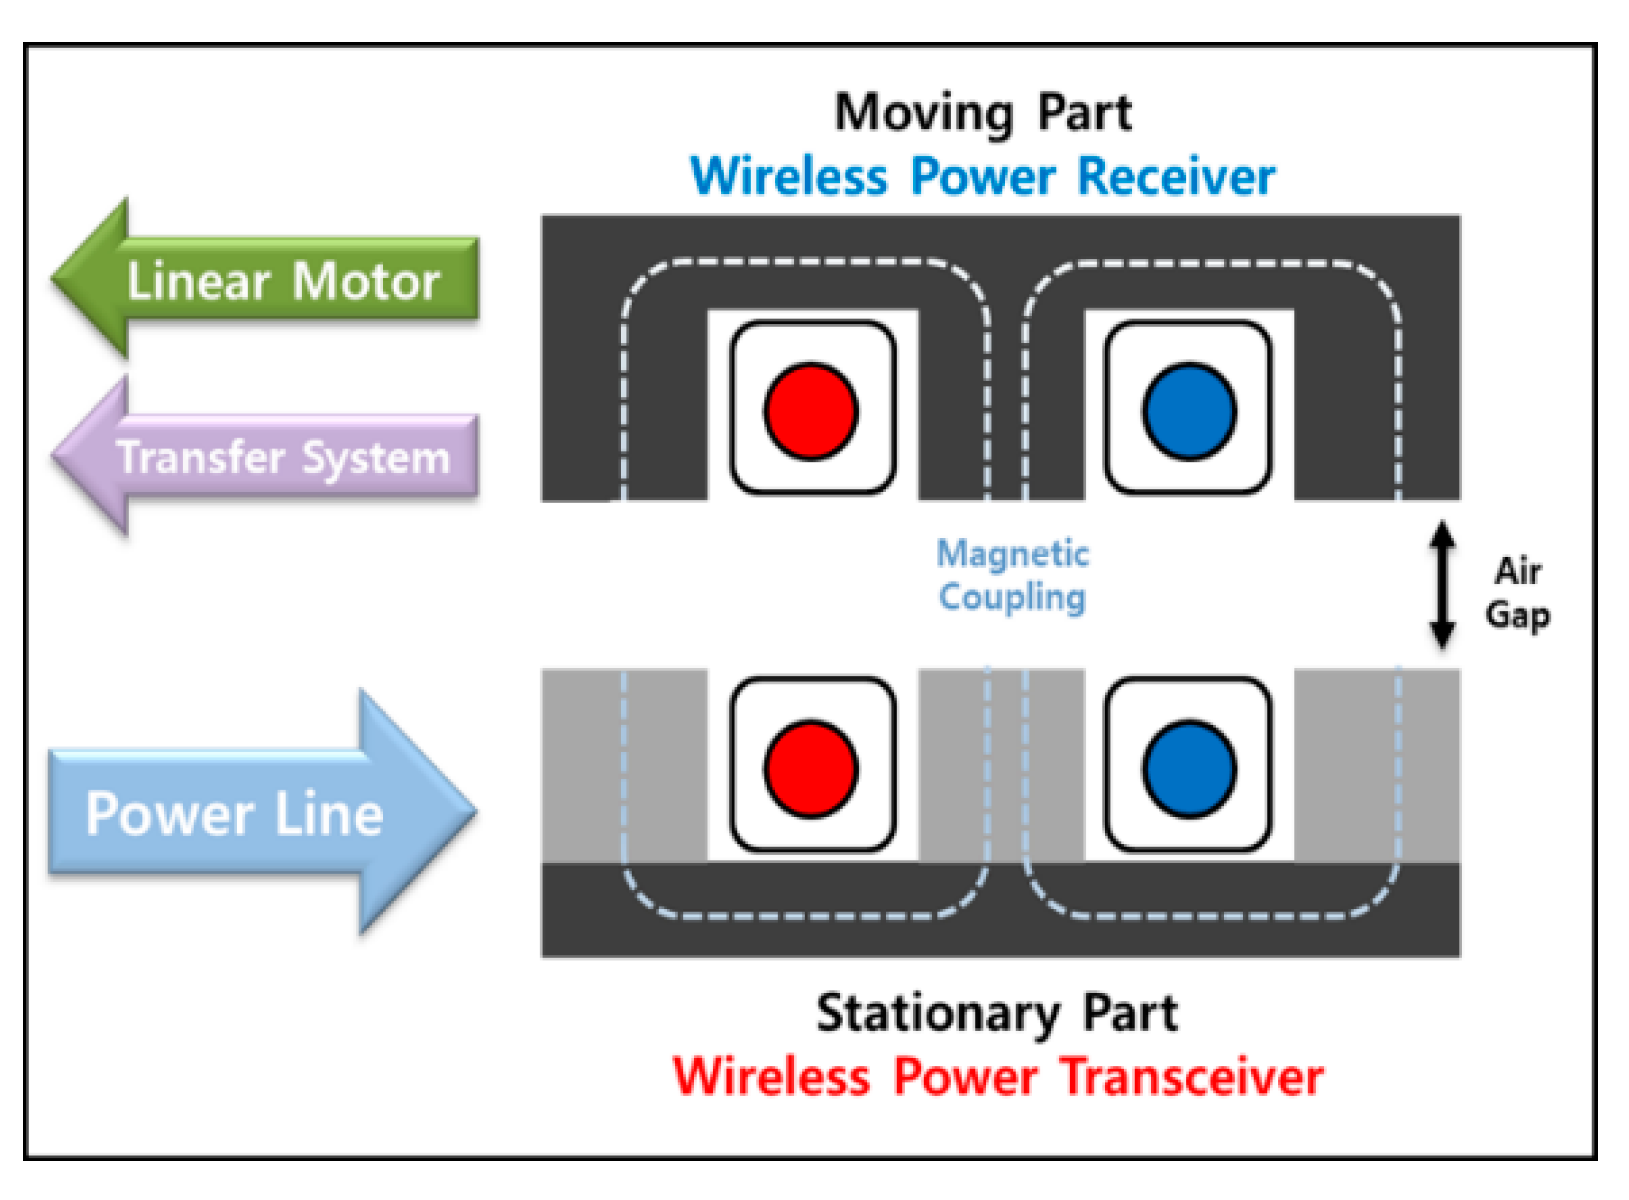
In this background, the technology of a contactless power transmission system was developed that combines the structure of a linear motor, which is responsible for the transportation of manufacturing robots in a smart factory, and a contactless transformer that supplies wireless power as shown in Figure 2. At the time of initial design, the main goal was to design an integrated structure through combination. However, due to the high iron loss of the Silicon Steel NGO iron core, which is generally used in linear motors, the limited wireless power transmission driving frequency, and the low coupling coefficient due to the length of the receiver being about 1/10 of the length of the transmitter, power transmission efficiency has been decreased. Therefore, it is necessary to separate a magnetic flux path of the linear motor and wireless power supply, and a power conversion topology is applied to cancel the leakage inductance component that appears due to the length difference between the transmitter and the receiver through LC resonance.

Figure 2.
Configuration of the WPT system.
In this work, we studied the efficiency improvement of wireless power transmission systems that can be applied to the aforementioned transportation systems. To achieve this, a comparison was made between the existing system designed through previous research [4,5,6] and a proposed model using a finite element analysis (FEA) of electromagnetic field characteristics based on the magnetic equivalent circuit. A new model was designed to address the limitations of magnetic coupling and the issues of high core losses faced by the original system which resulted in output degradation. Furthermore, parameters such as core losses and inductance were applied to circuit modeling according to the magnetic equivalent circuit and magnetic field FEA of a contactless transformer. This was done to utilize them in the design of power conversion systems for wireless power transmission (WPT).
The results obtained from experiments with the designed prototype were compared with those of simulations to verify the impact of incorporating the results of the electromagnetic equivalent circuit-based FEA of electromagnetic field characteristics and circuit modeling into the overall system for output efficiency improvement. Finally, a model was designed that improved the power transfer efficiency of the WPT system compared to the existing system by improving magnetic characteristics such as magnetic coupling, core loss, and magnetic flux transfer ratio.
2. The Magnetic Field Analysis of the WPT System Using FEA
2.1. The Configuration of the WPT Model
Because the contactless transformer of the WPT system covered herein has a nonstandard structural form of transmitter and receiver, the inductance and magnetic field characteristics were analyzed through the finite element method. On the basis of previous research [4,6,7], magnetic equivalent circuit analysis and magnetic field characteristics analysis were performed for the proposed model.
2.1.1. The Magnetic Equivalent Circuit Analysis of the Original Model
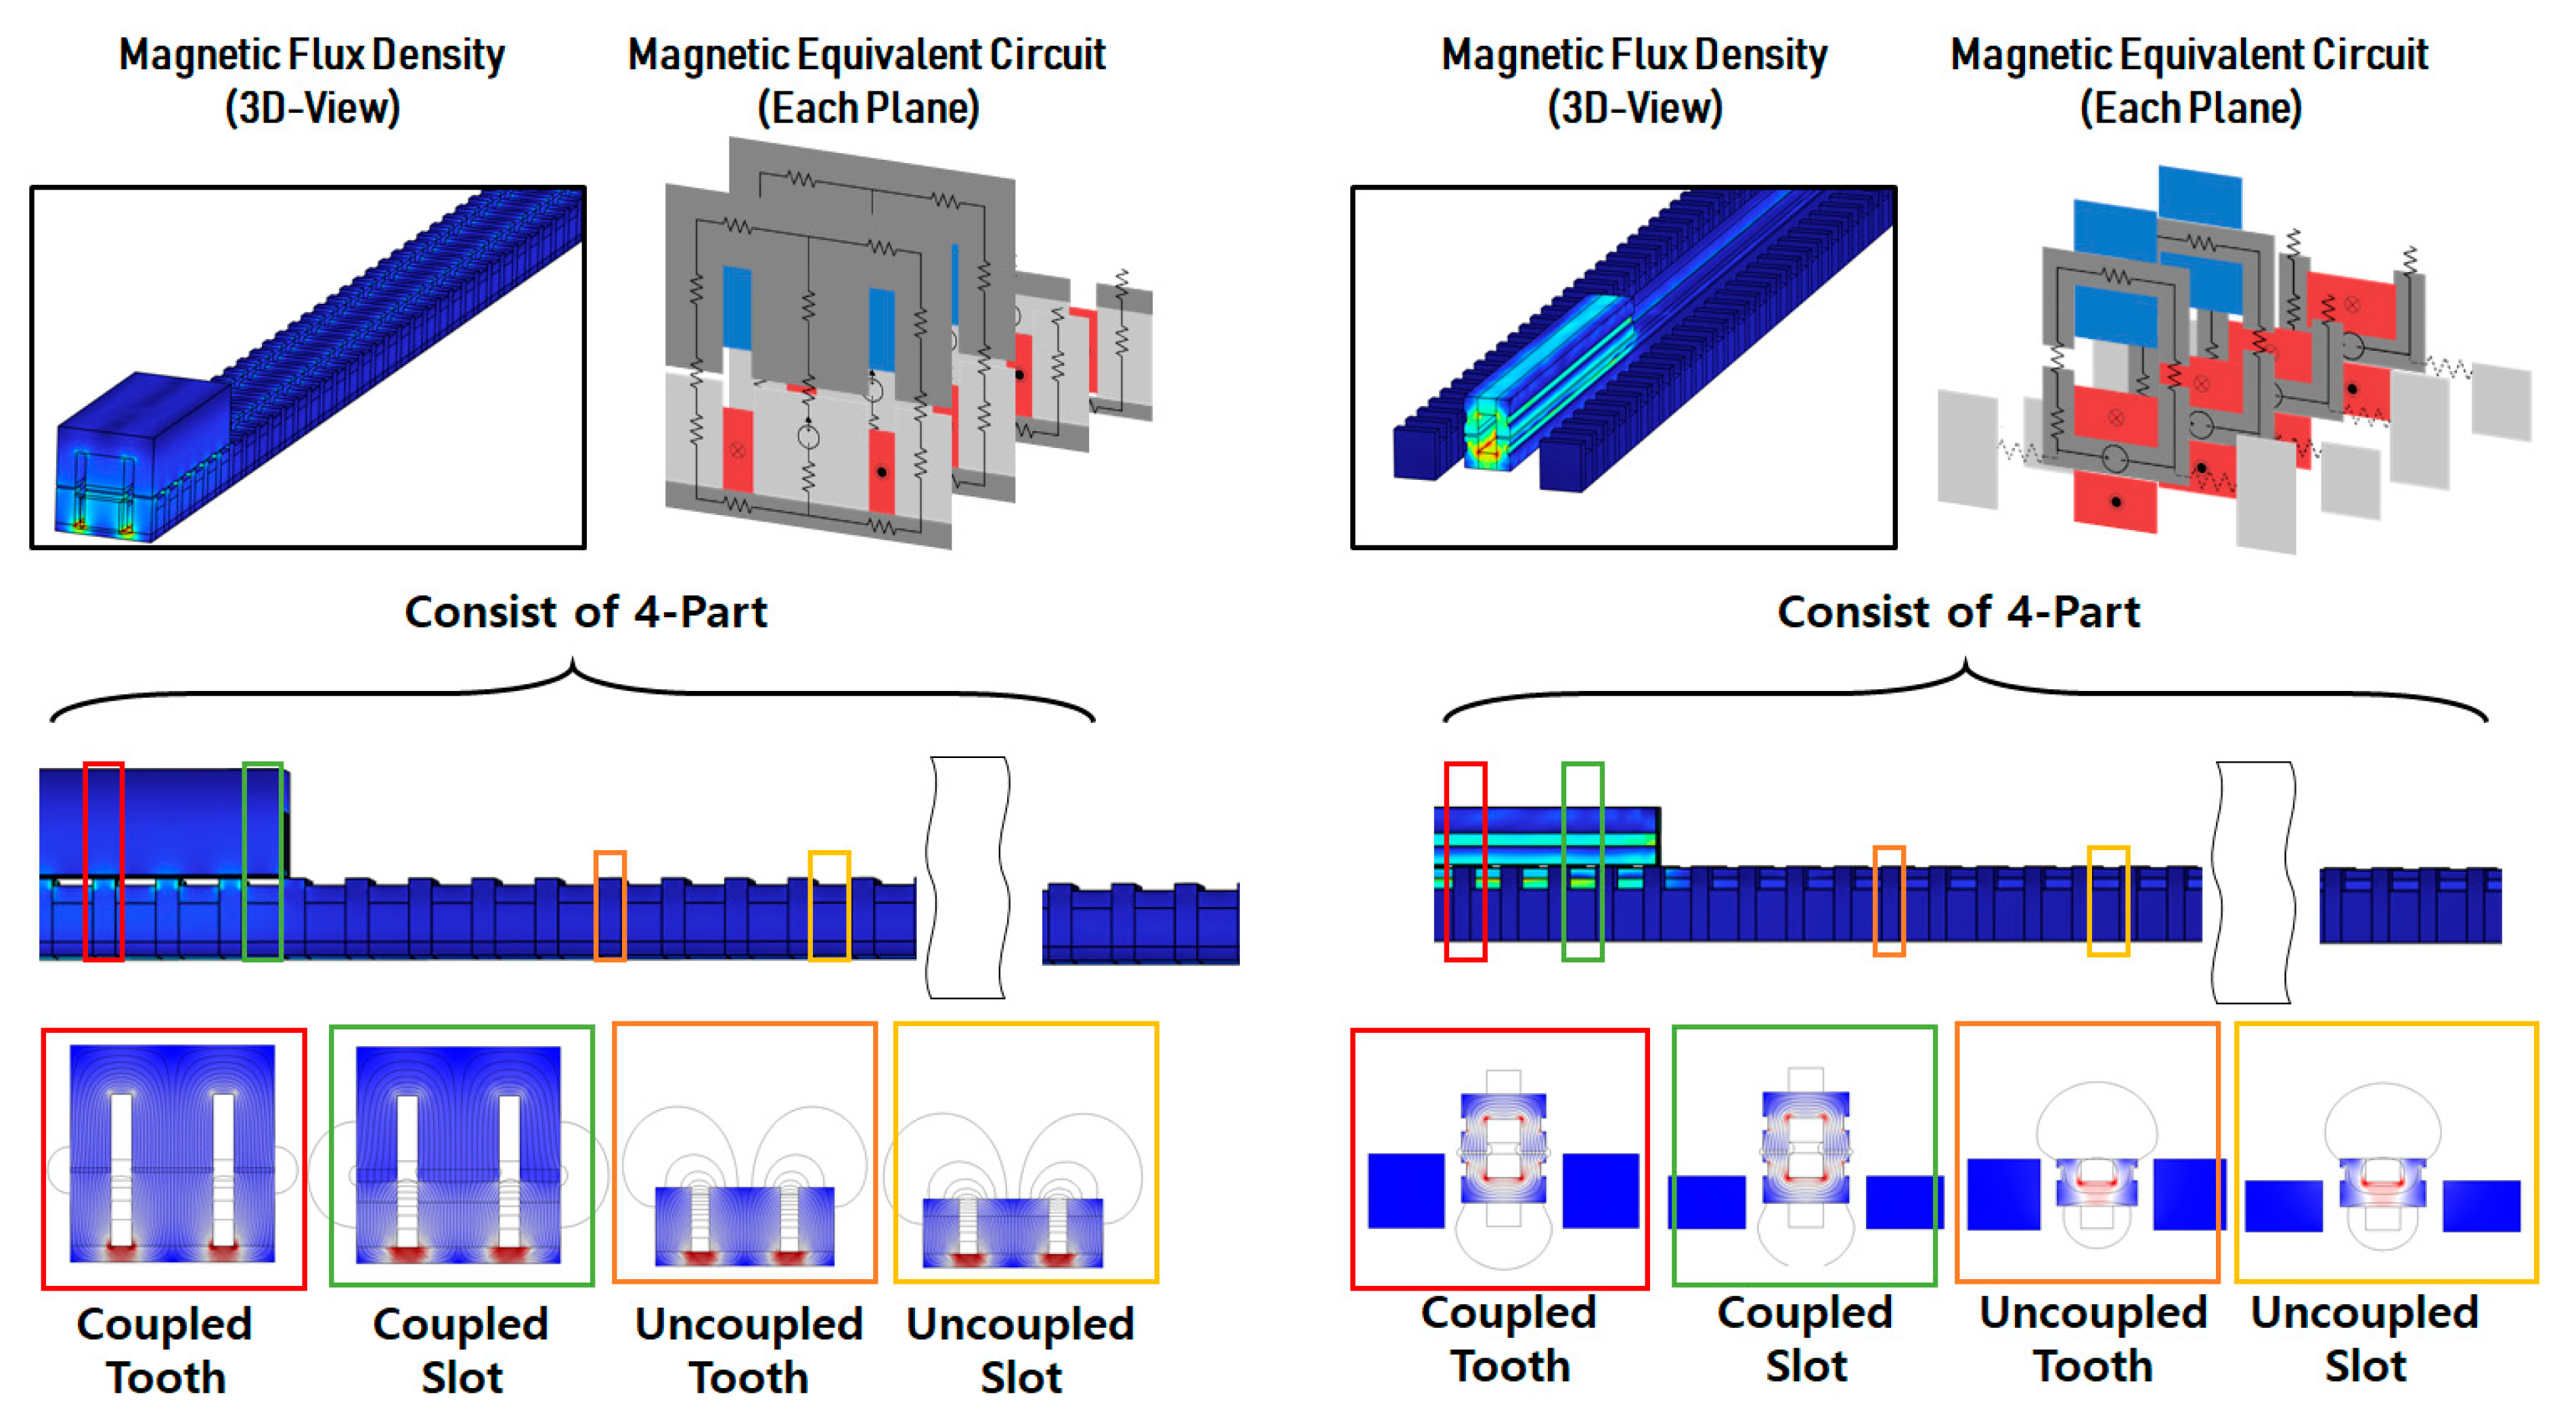
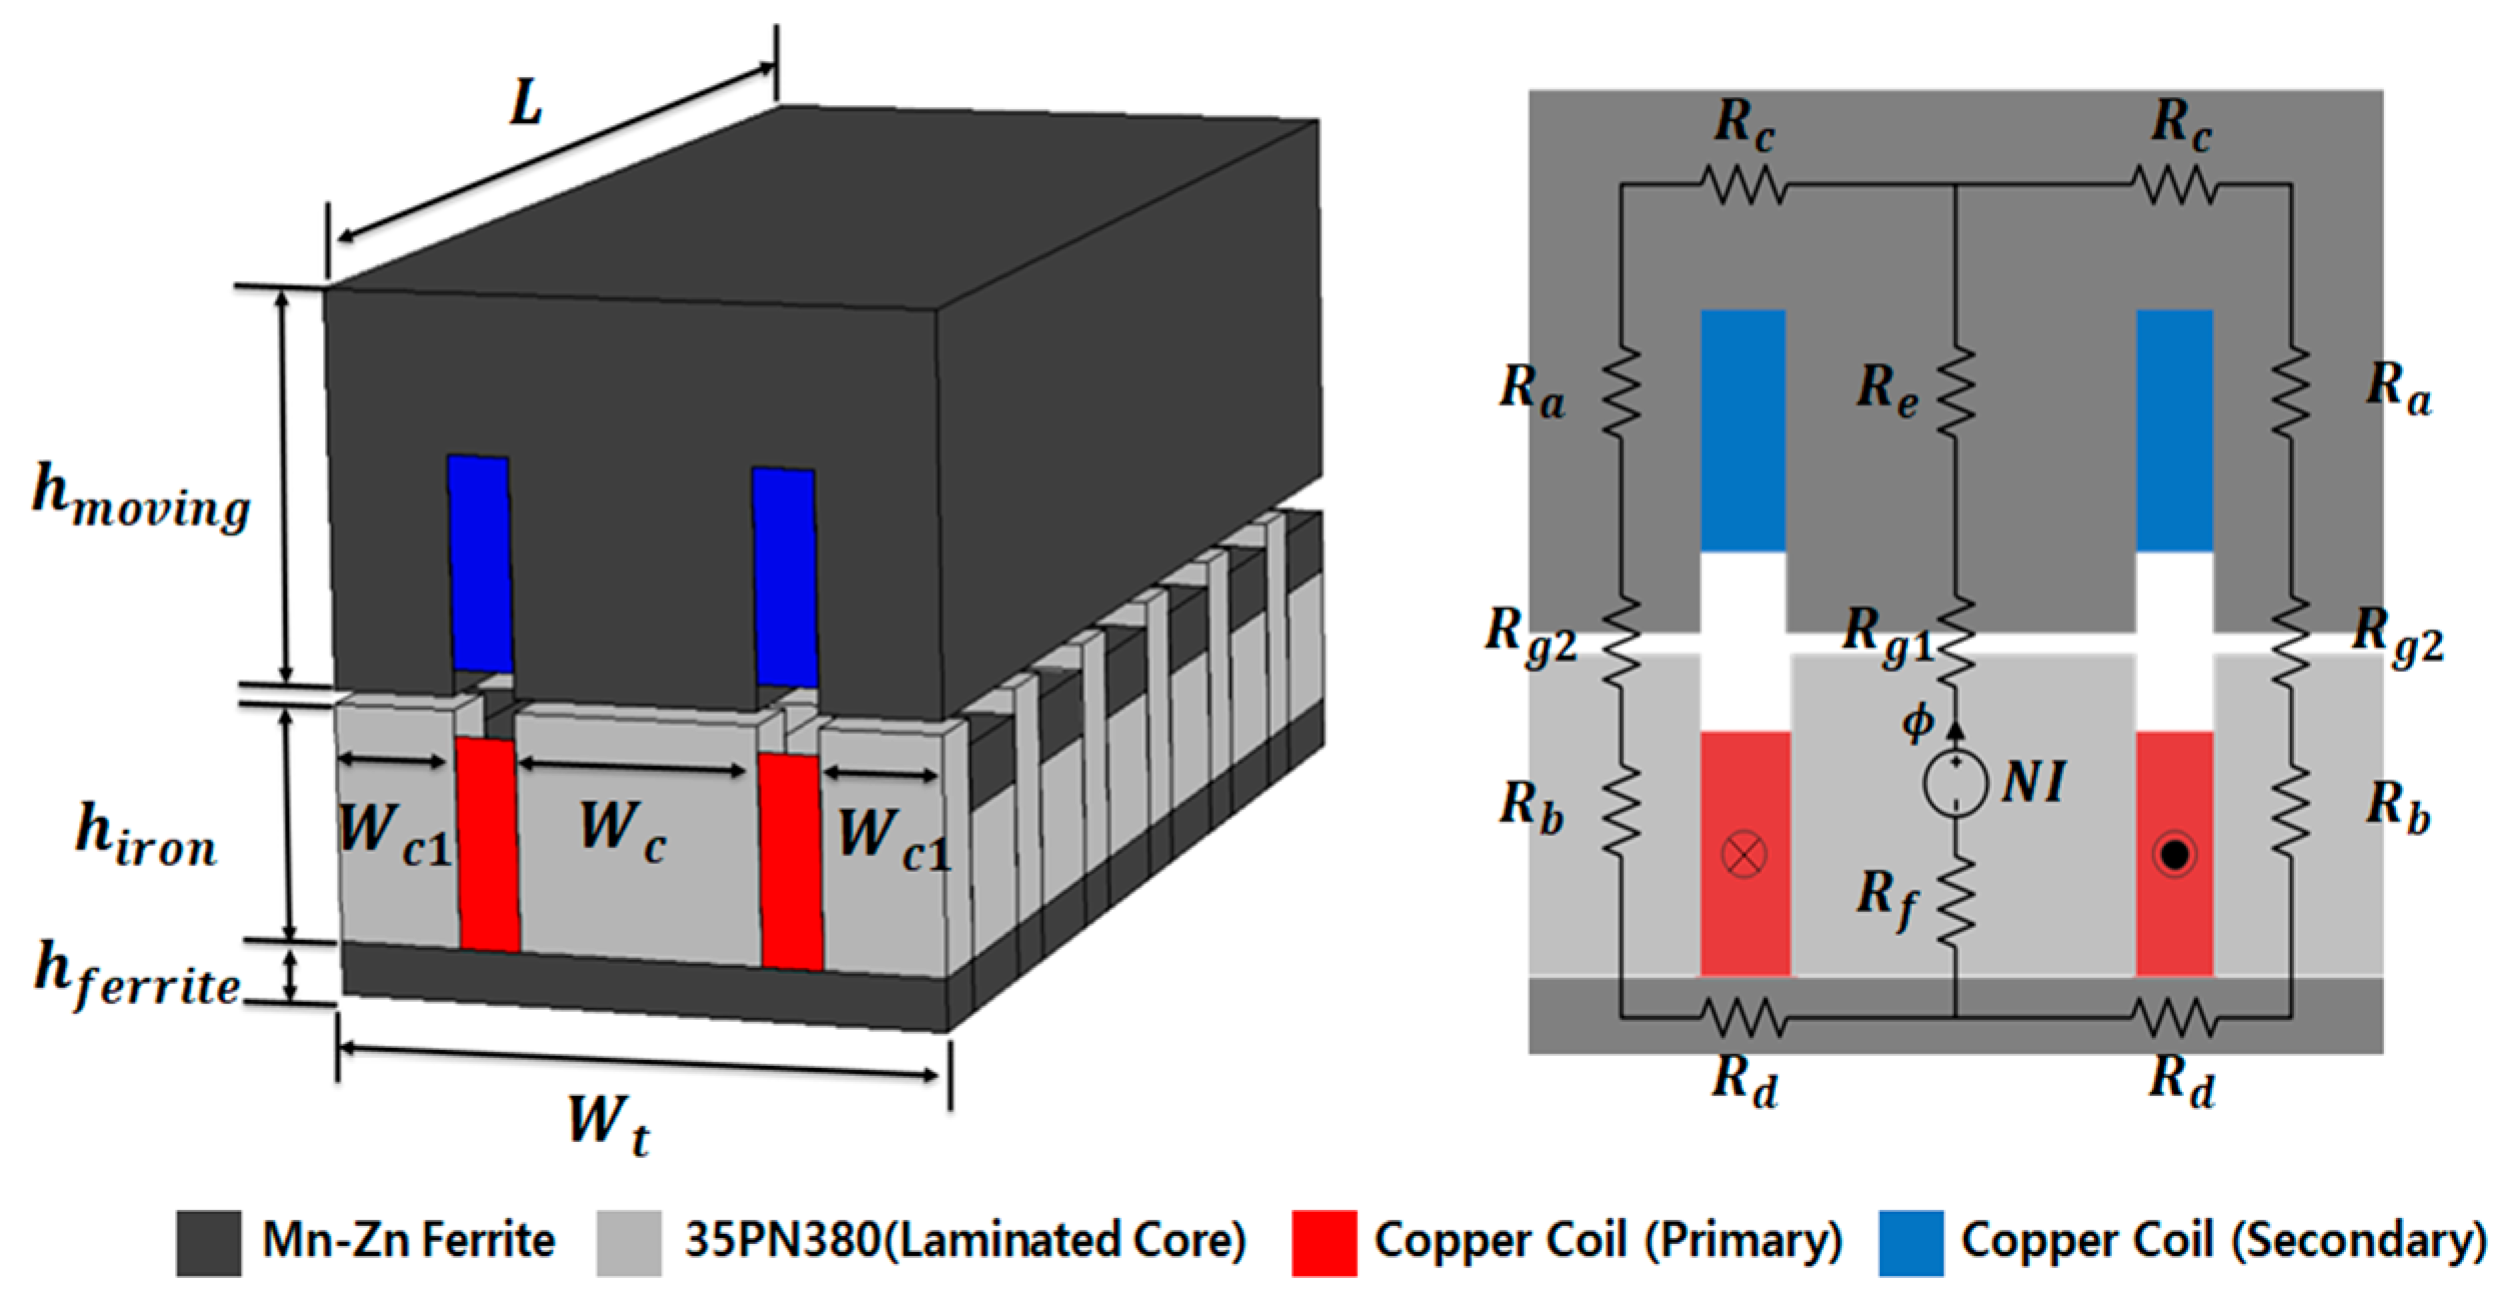
The shape and magnetic equivalent circuit of the original model are shown in Figure 3 and Figure 4. It represents only the portion that is magnetically coupled within the entire system. As shown in Figure 3, it comprises four cross-sectional forms. When constructing a magnetic equivalent circuit based on the two-dimensional (2D) plane of the front part as shown in Figure 4, the resulting magnetic equivalent resistance is given by Equation (1):
where Rg1 denotes the magnetic resistance of the central air gap of the iron core, Rg2 represents the magnetic resistance of the left and right air gaps between the stator and moving core, Ra is the magnetic resistance of the moving core, and Rb is the magnetic resistance of the stator core. However, as the relative permeability of the iron core of the stator and moving core is much greater than the relative permeability of the air gap (μr = 1 for air), the calculation was performed by ignoring the magnetic resistance of the iron core [8]. The contactless transformer for WPT presented herein has an E-core shape that is symmetric with respect to the central point of the iron core. Therefore, when a closed circuit is formed in a magnetic circuit, the magnetic resistance in the central air gap is 1/2 of the magnetic resistance in the outer air gap. The detailed dimensions of the original model are given in Table 1.
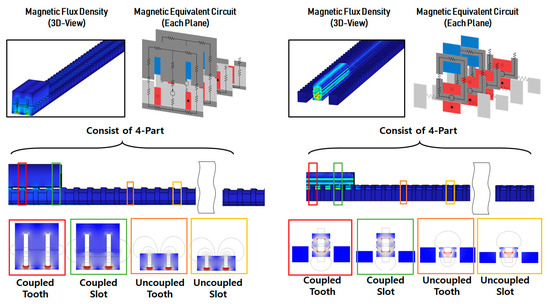
Figure 3.
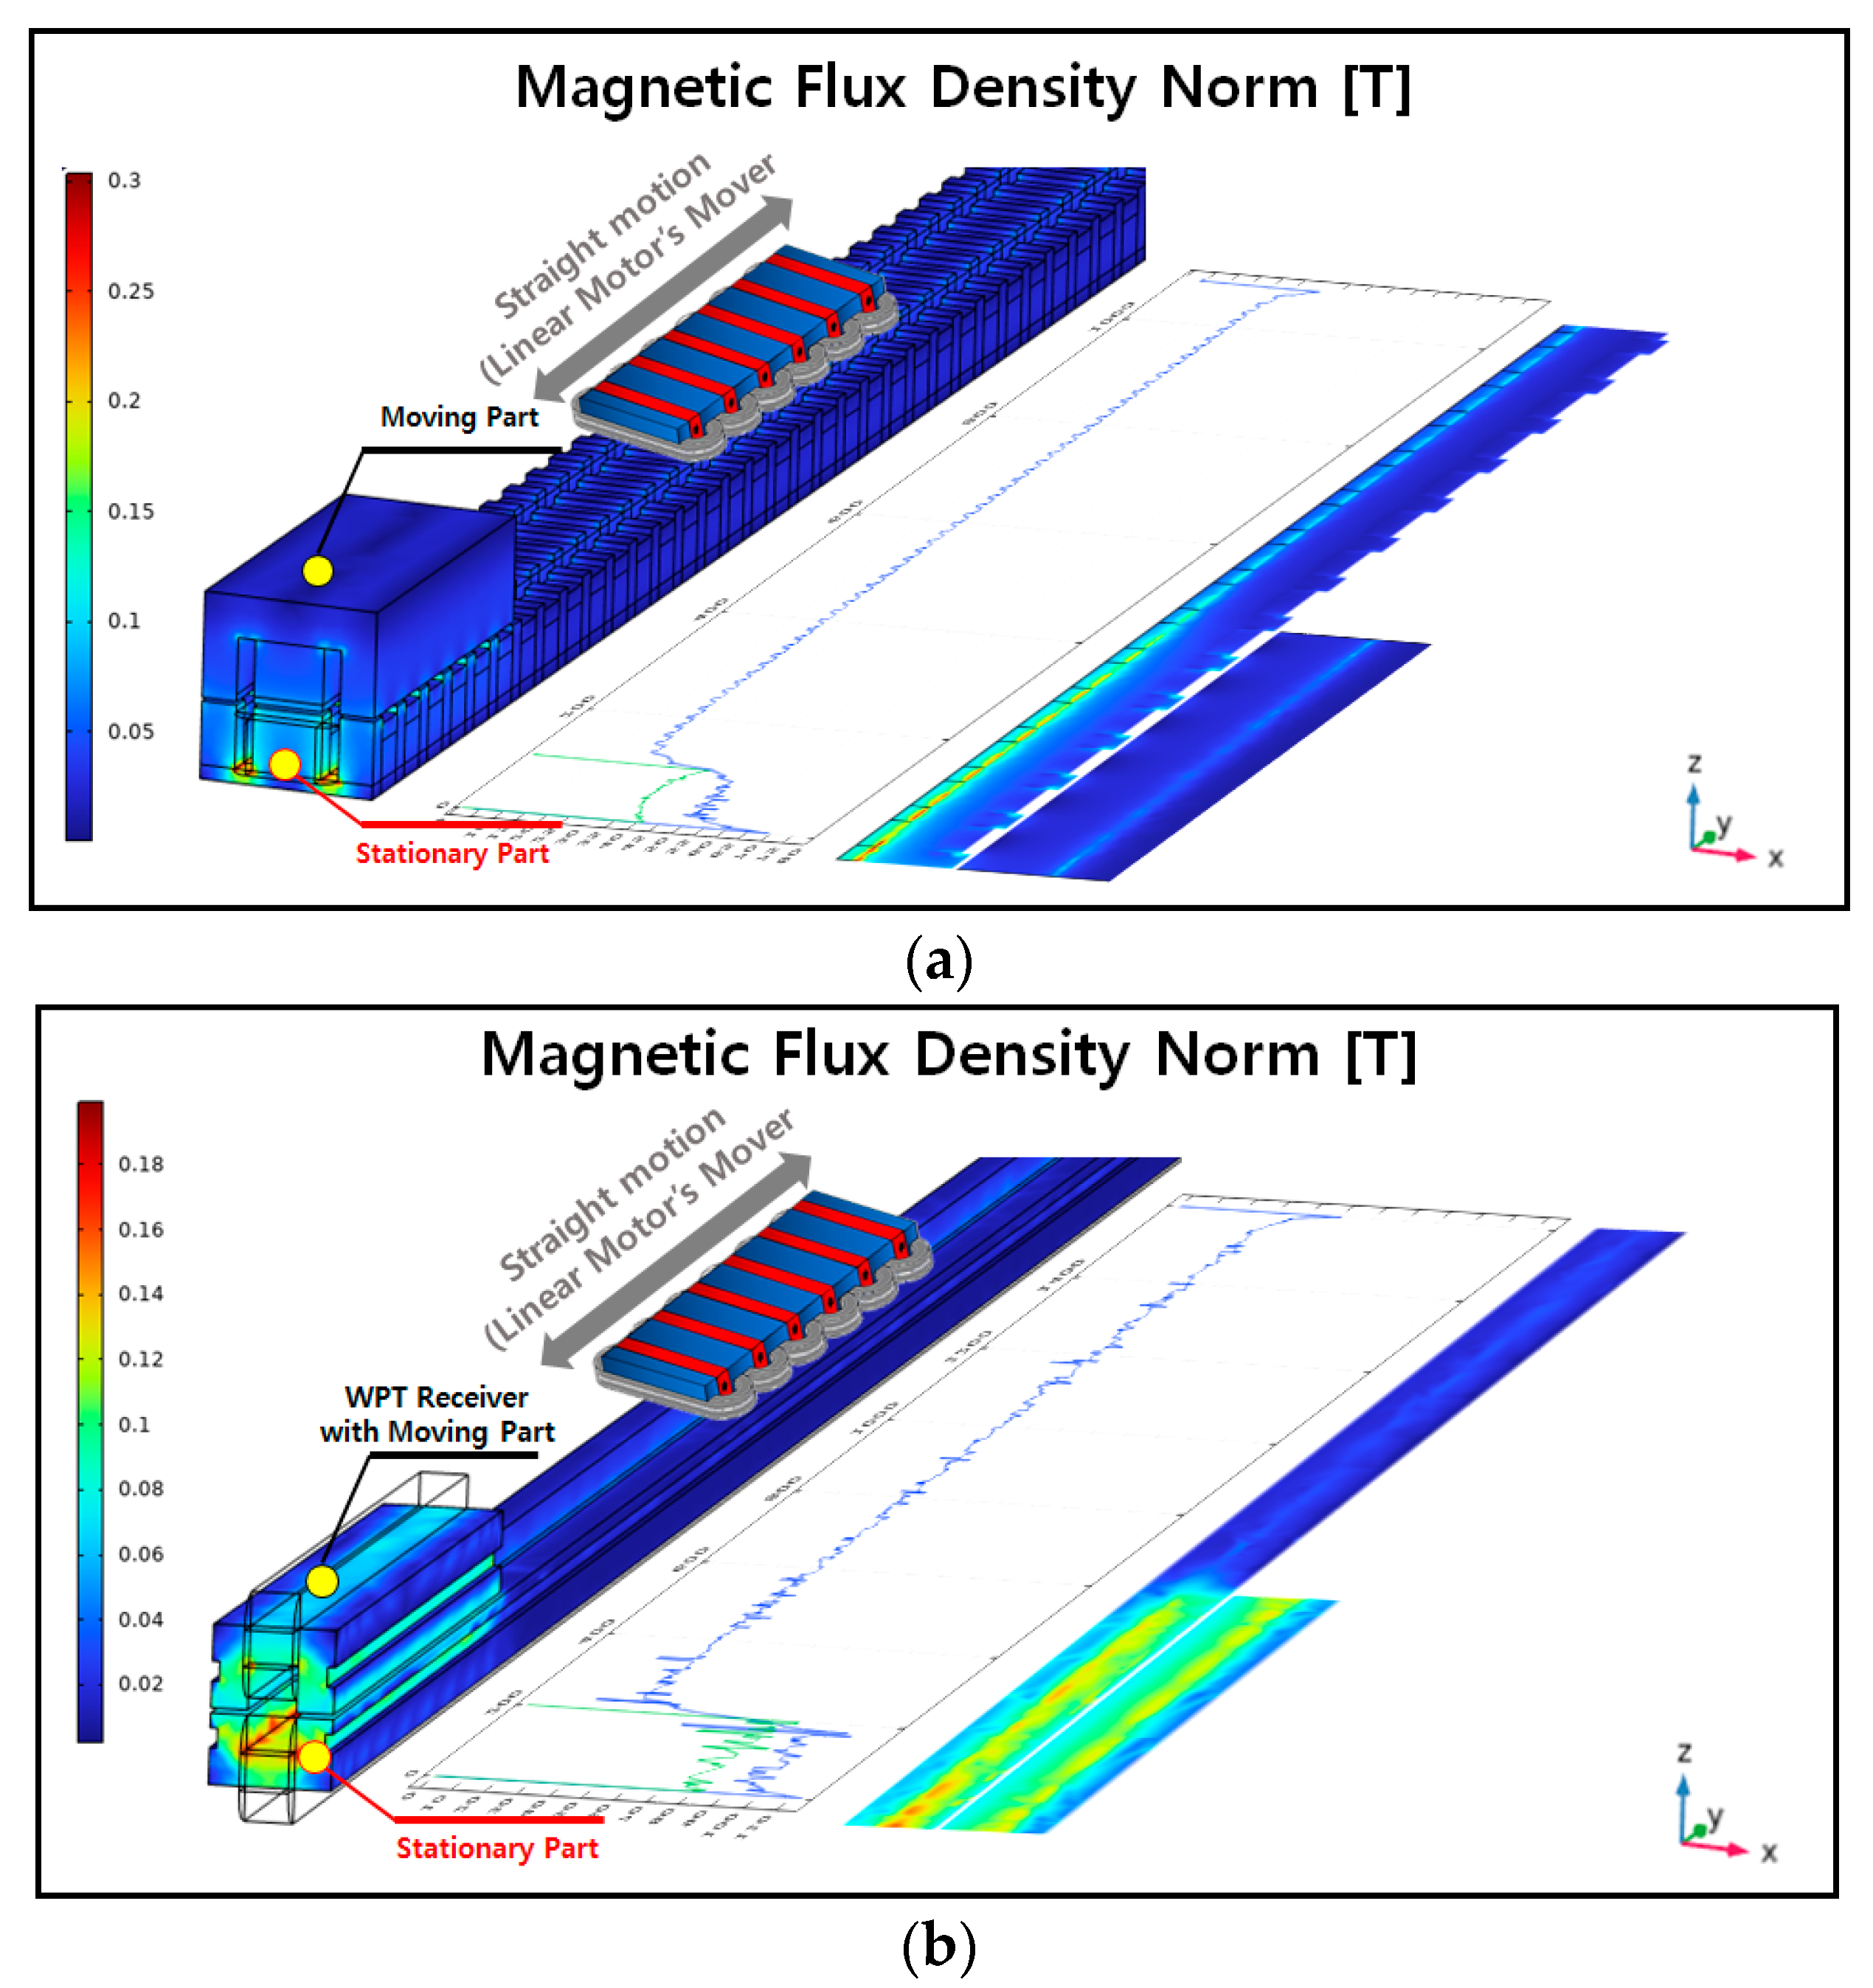
Magnetic field characteristics and configuration of the WPT model.
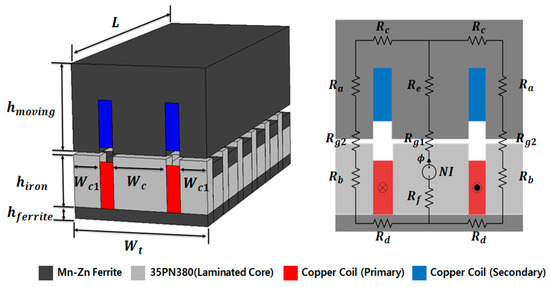
Figure 4.
Shape and magnetic equivalent circuit of the original model.

Table 1.
Design specifications of the original model.
2.1.2. The Magnetic Equivalent Circuit Analysis of the Proposed Model
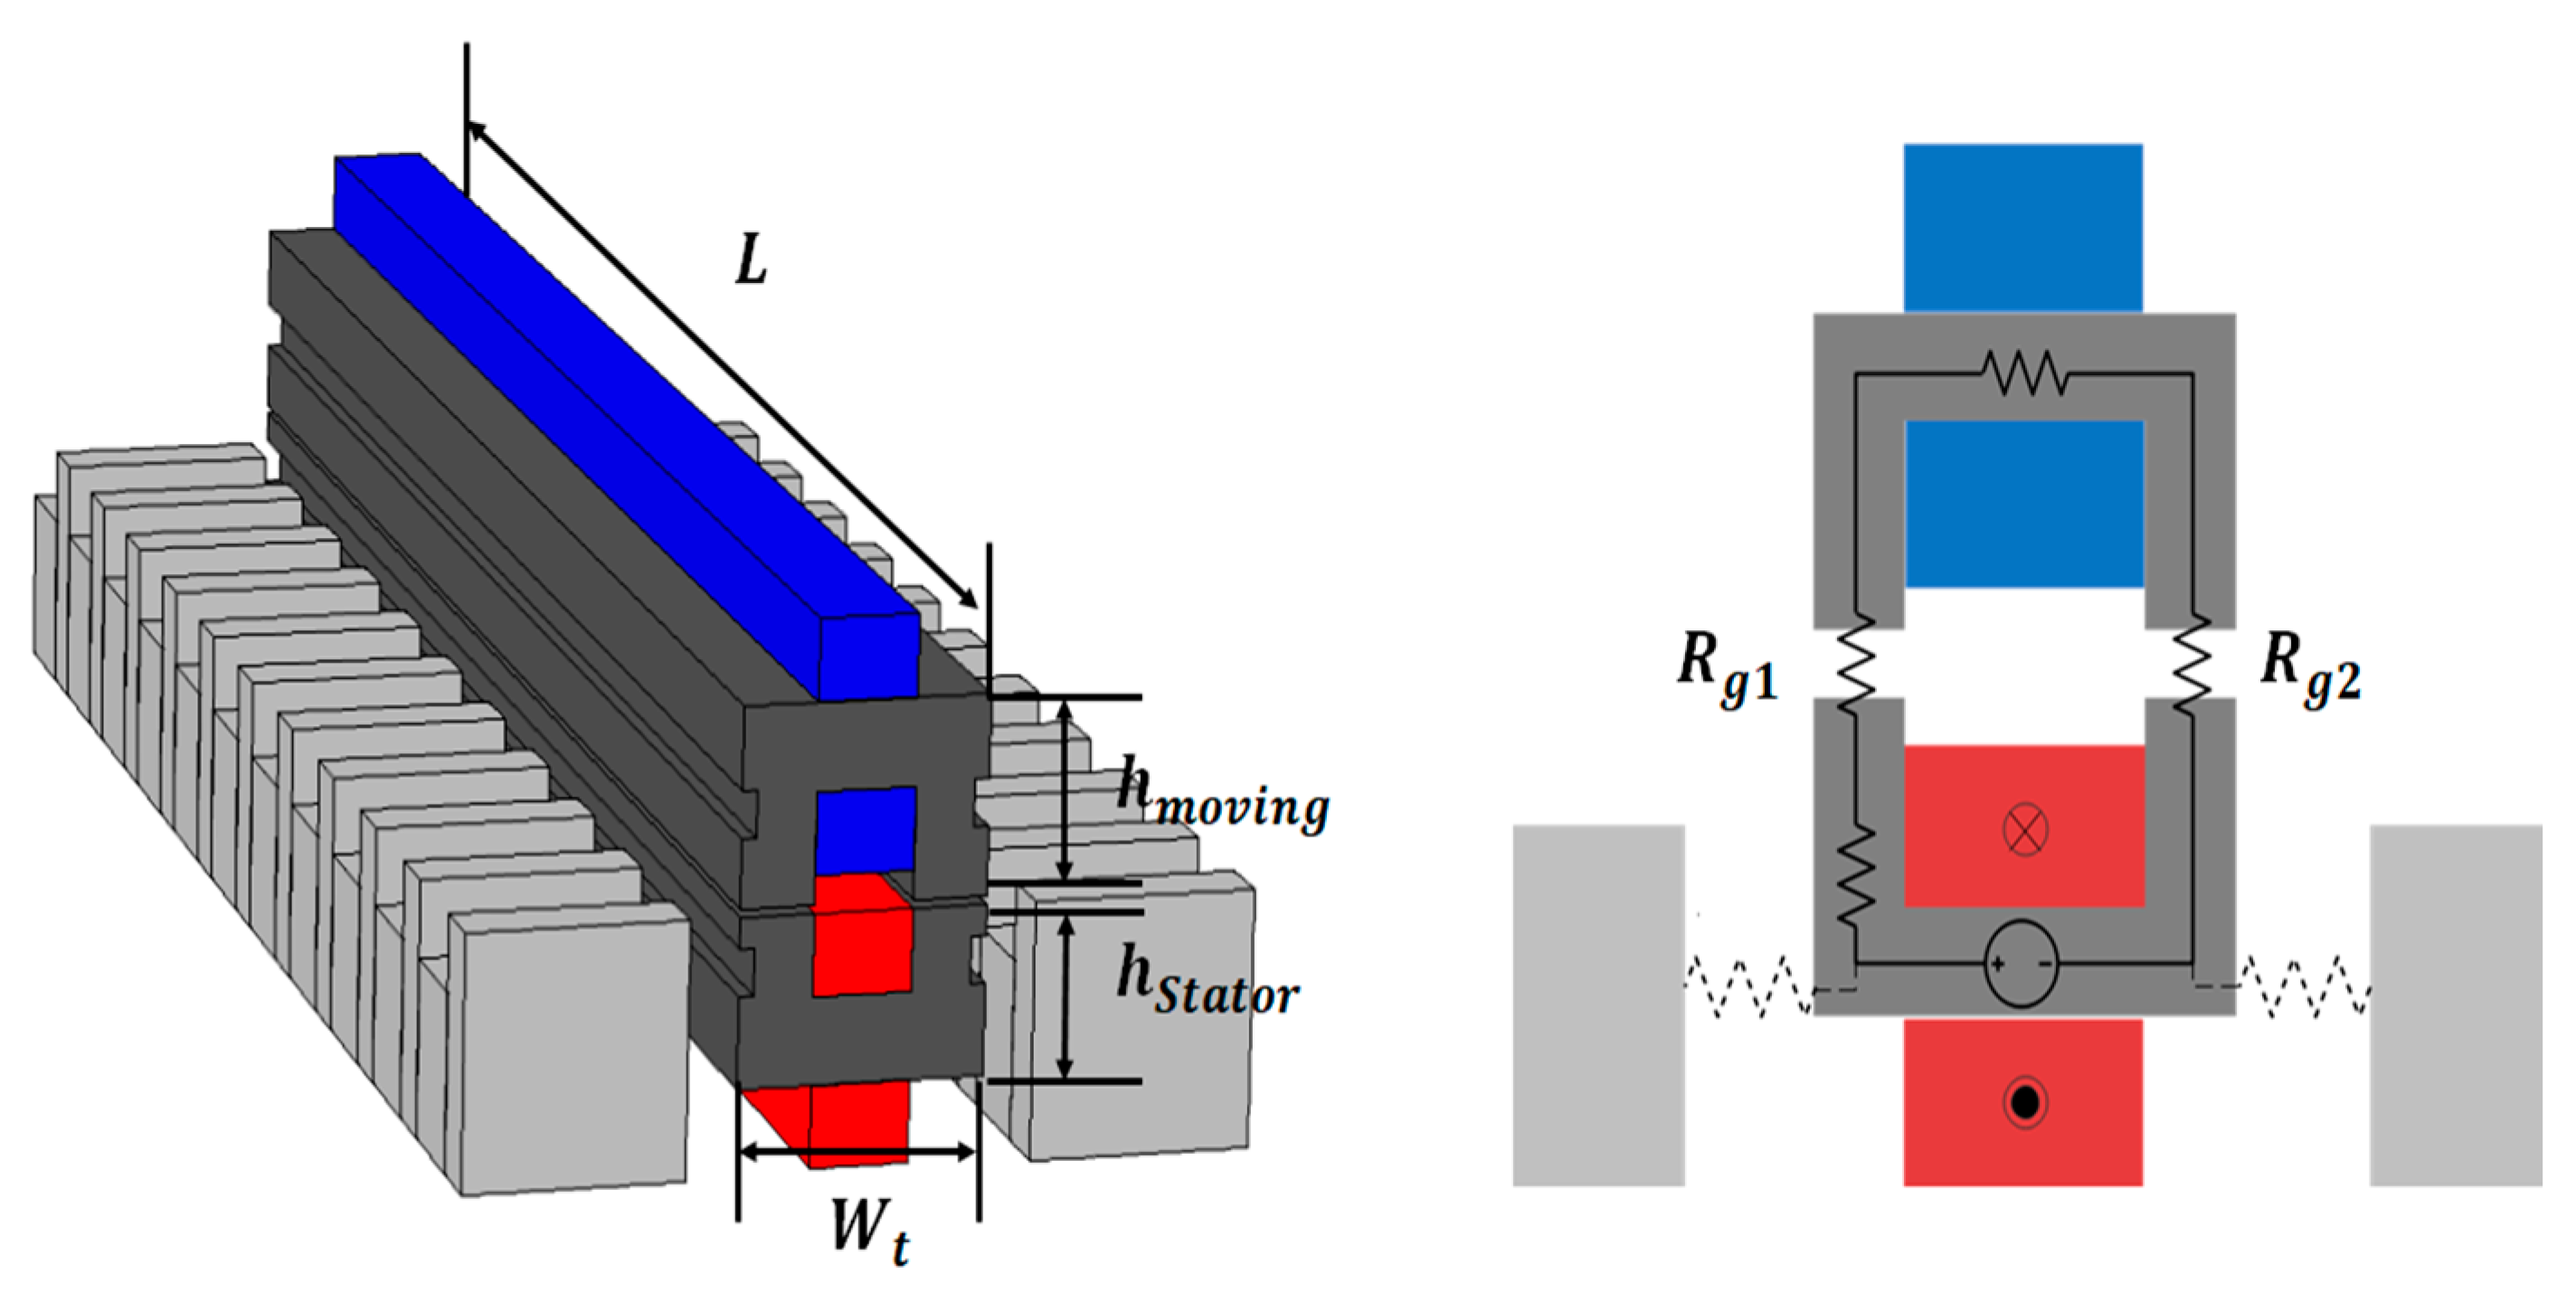
The magnetic resistance for the proposed model was calculated similarly to the derivation of magnetic resistance based on the shape and magnetic equivalent circuit of the original model. The proposed model is shown in Figure 5.
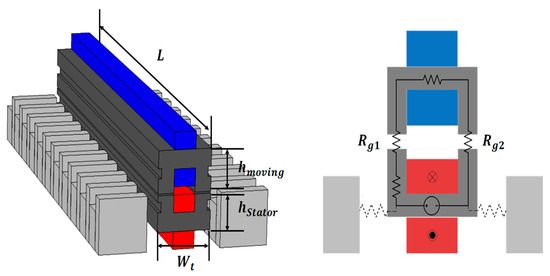
Figure 5.
Shape and magnetic equivalent circuit of the proposed model.
Because the original model has an E-core shape, the magnetic flux path is symmetric about the central axis. However, in the case of the proposed model, to reduce the influence of magnetic flux leakage, the length of the air gap was shortened. Further, the cross-sectional area was increased to design the magnetic resistance to be approximately twice as much compared to that in the original model. Therefore, the same magnetomotive (electromotive) force can be satisfied with less magnetic flux (excitation current) than in the original model. The overall magnetic equivalent resistance (Req) of the proposed model can be approximated as Equation (3):
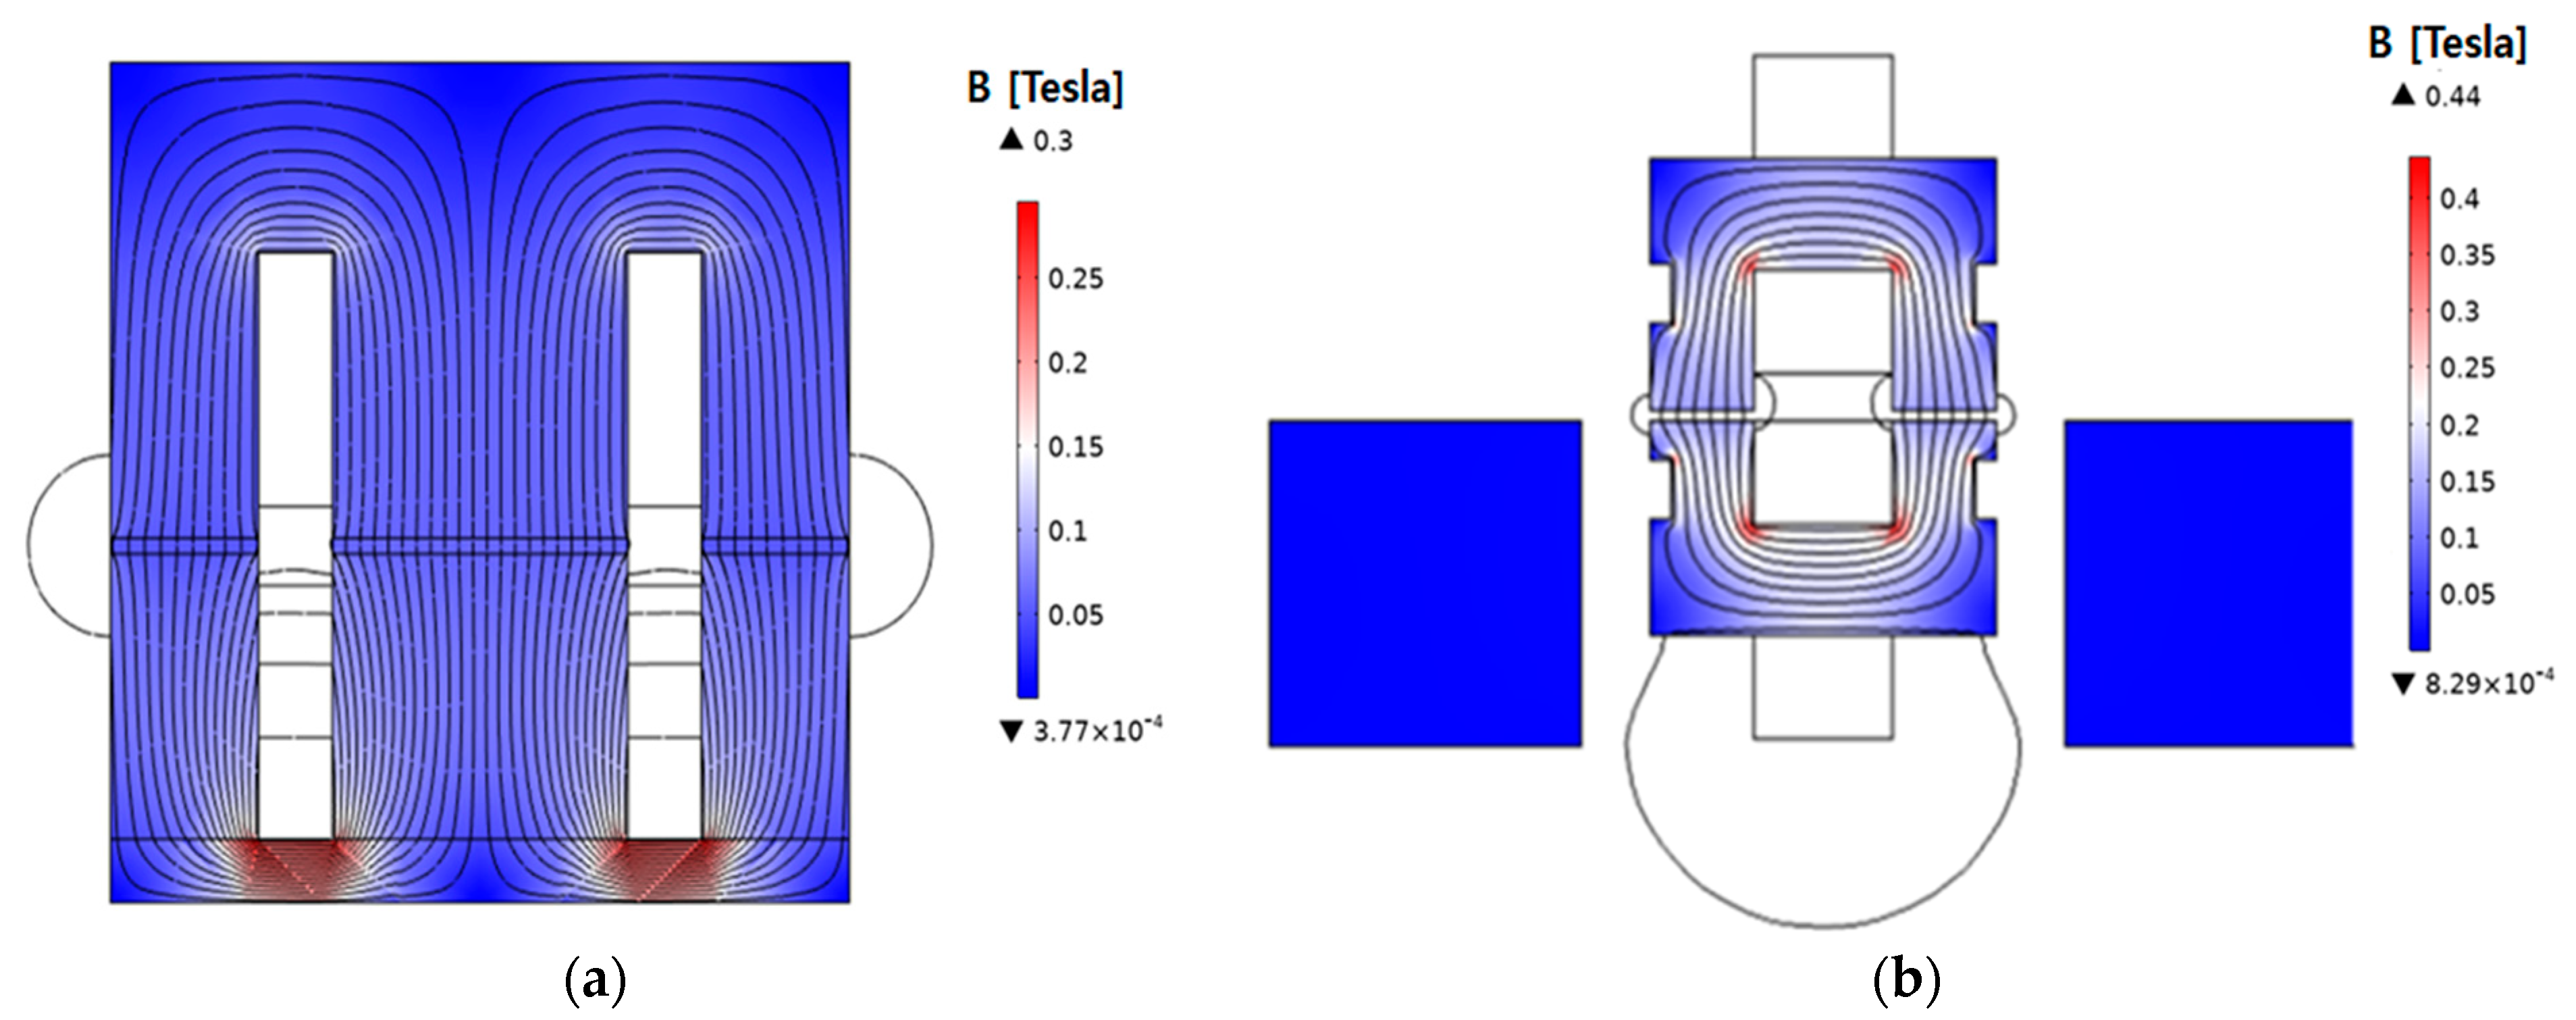
Because of the E-core structure, the original model has its magnetic flux path divided into both sides around the center. This division of magnetic flux results in a concentration of magnetic flux at the point where it branches. This tendency can be observed in the magnetic flux density distribution shown in Figure 6.
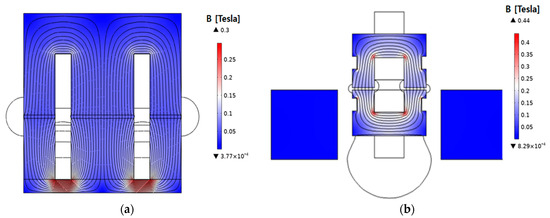
Figure 6.
Magnetic flux density distribution with finite element stationary analysis: (a) original model; (b) proposed model.
Consequently, this point exhibits a relatively high magnetic flux density, leading to a nonuniform magnetic flux distribution. Additionally, higher core losses can be induced in regions where the magnetic flux is concentrated. However, the proposed model features a symmetric configuration of the stator and moving core, resulting in a more uniform magnetic path with a reduced concentration of magnetic flux at specific points.
By contrast, the magnetic path in the proposed model is more uniform and does not lead to a significant concentration of magnetic flux. The magnetic coupling part shown in Figure 3 can be divided into the strongly magnetically coupled and uncoupled regions. It is also structured with teeth and slots to generate linear thrust in the linear motor. Accordingly, the magnetic resistance in the model was designed to be higher to restrict excessive magnetic flux and improve the efficiency of WPT. The detailed dimensions of the proposed model are given in Table 2.

Table 2.
Design specifications of the proposed model.
The magnetic equivalent resistances (Req) of the magnetic equivalent circuits can be obtained through magnetic field FEA. The magnetic equivalent resistances for each cross-section are summarized in Table 3. The FEA of the magnetic field is based on Maxwell’s equations, and the magnetic flux density can be defined using the magnetic vector potential. The magnetic field passing through a surface S can be calculated using Equation (4). By using the calculated magnetic field, FEA was employed to derive the magnetic equivalent resistances for each cross-section [9,10,11]

Table 3.
Comparison of magnetic equivalent resistance between original and proposed models.
The magnetic equivalent resistances listed in Table 3 were calculated under the condition of the same primary current of 5 A based on the specifications provided in Table 1 and Table 2. When setting the primary current condition, the coil’s filling factor and current density were taken into account during the design of the original model.
2.2. The FEM Analysis of Magnetic Coupling Characteristics
The fundamental principle of WPT systems is to transfer power in the form of magnetic energy between the transmitter and receiver through magnetic coupling as shown in Figure 7. Therefore, to assess the performance of WPT, it is necessary to examine specific indicators related to magnetic coupling and the efficiency of magnetic flux delivery. Accordingly, we aimed to evaluate the improvement in magnetic coupling and the resulting efficiency of magnetic flux delivery by enhancing the magnetic equivalent circuit and magnetic flux path.
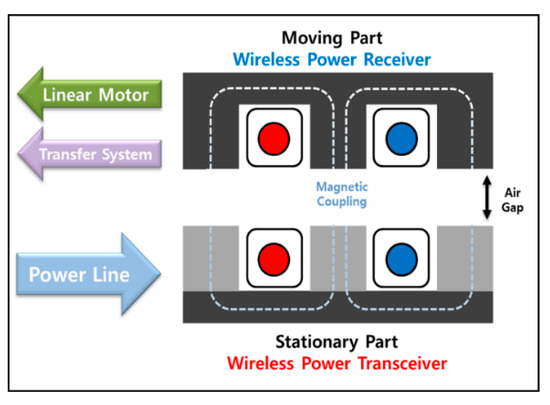
Figure 7.
Magnetic coupling and energy transfer elements of the WPT coupler.
The magnetic flux density in the three-dimensional (3D) shapes of the original and proposed models under the same primary current conditions is shown in Figure 8.
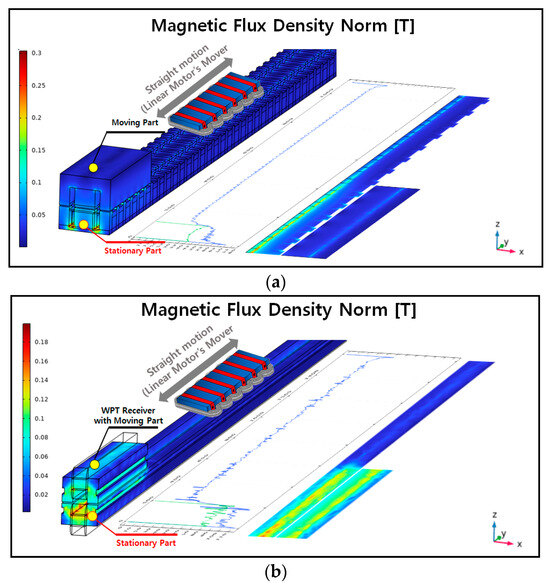
Figure 8.
Magnetic flux density distribution between the transmitter and receiver (3D, zy-plane): (a) original model; (b) proposed model.
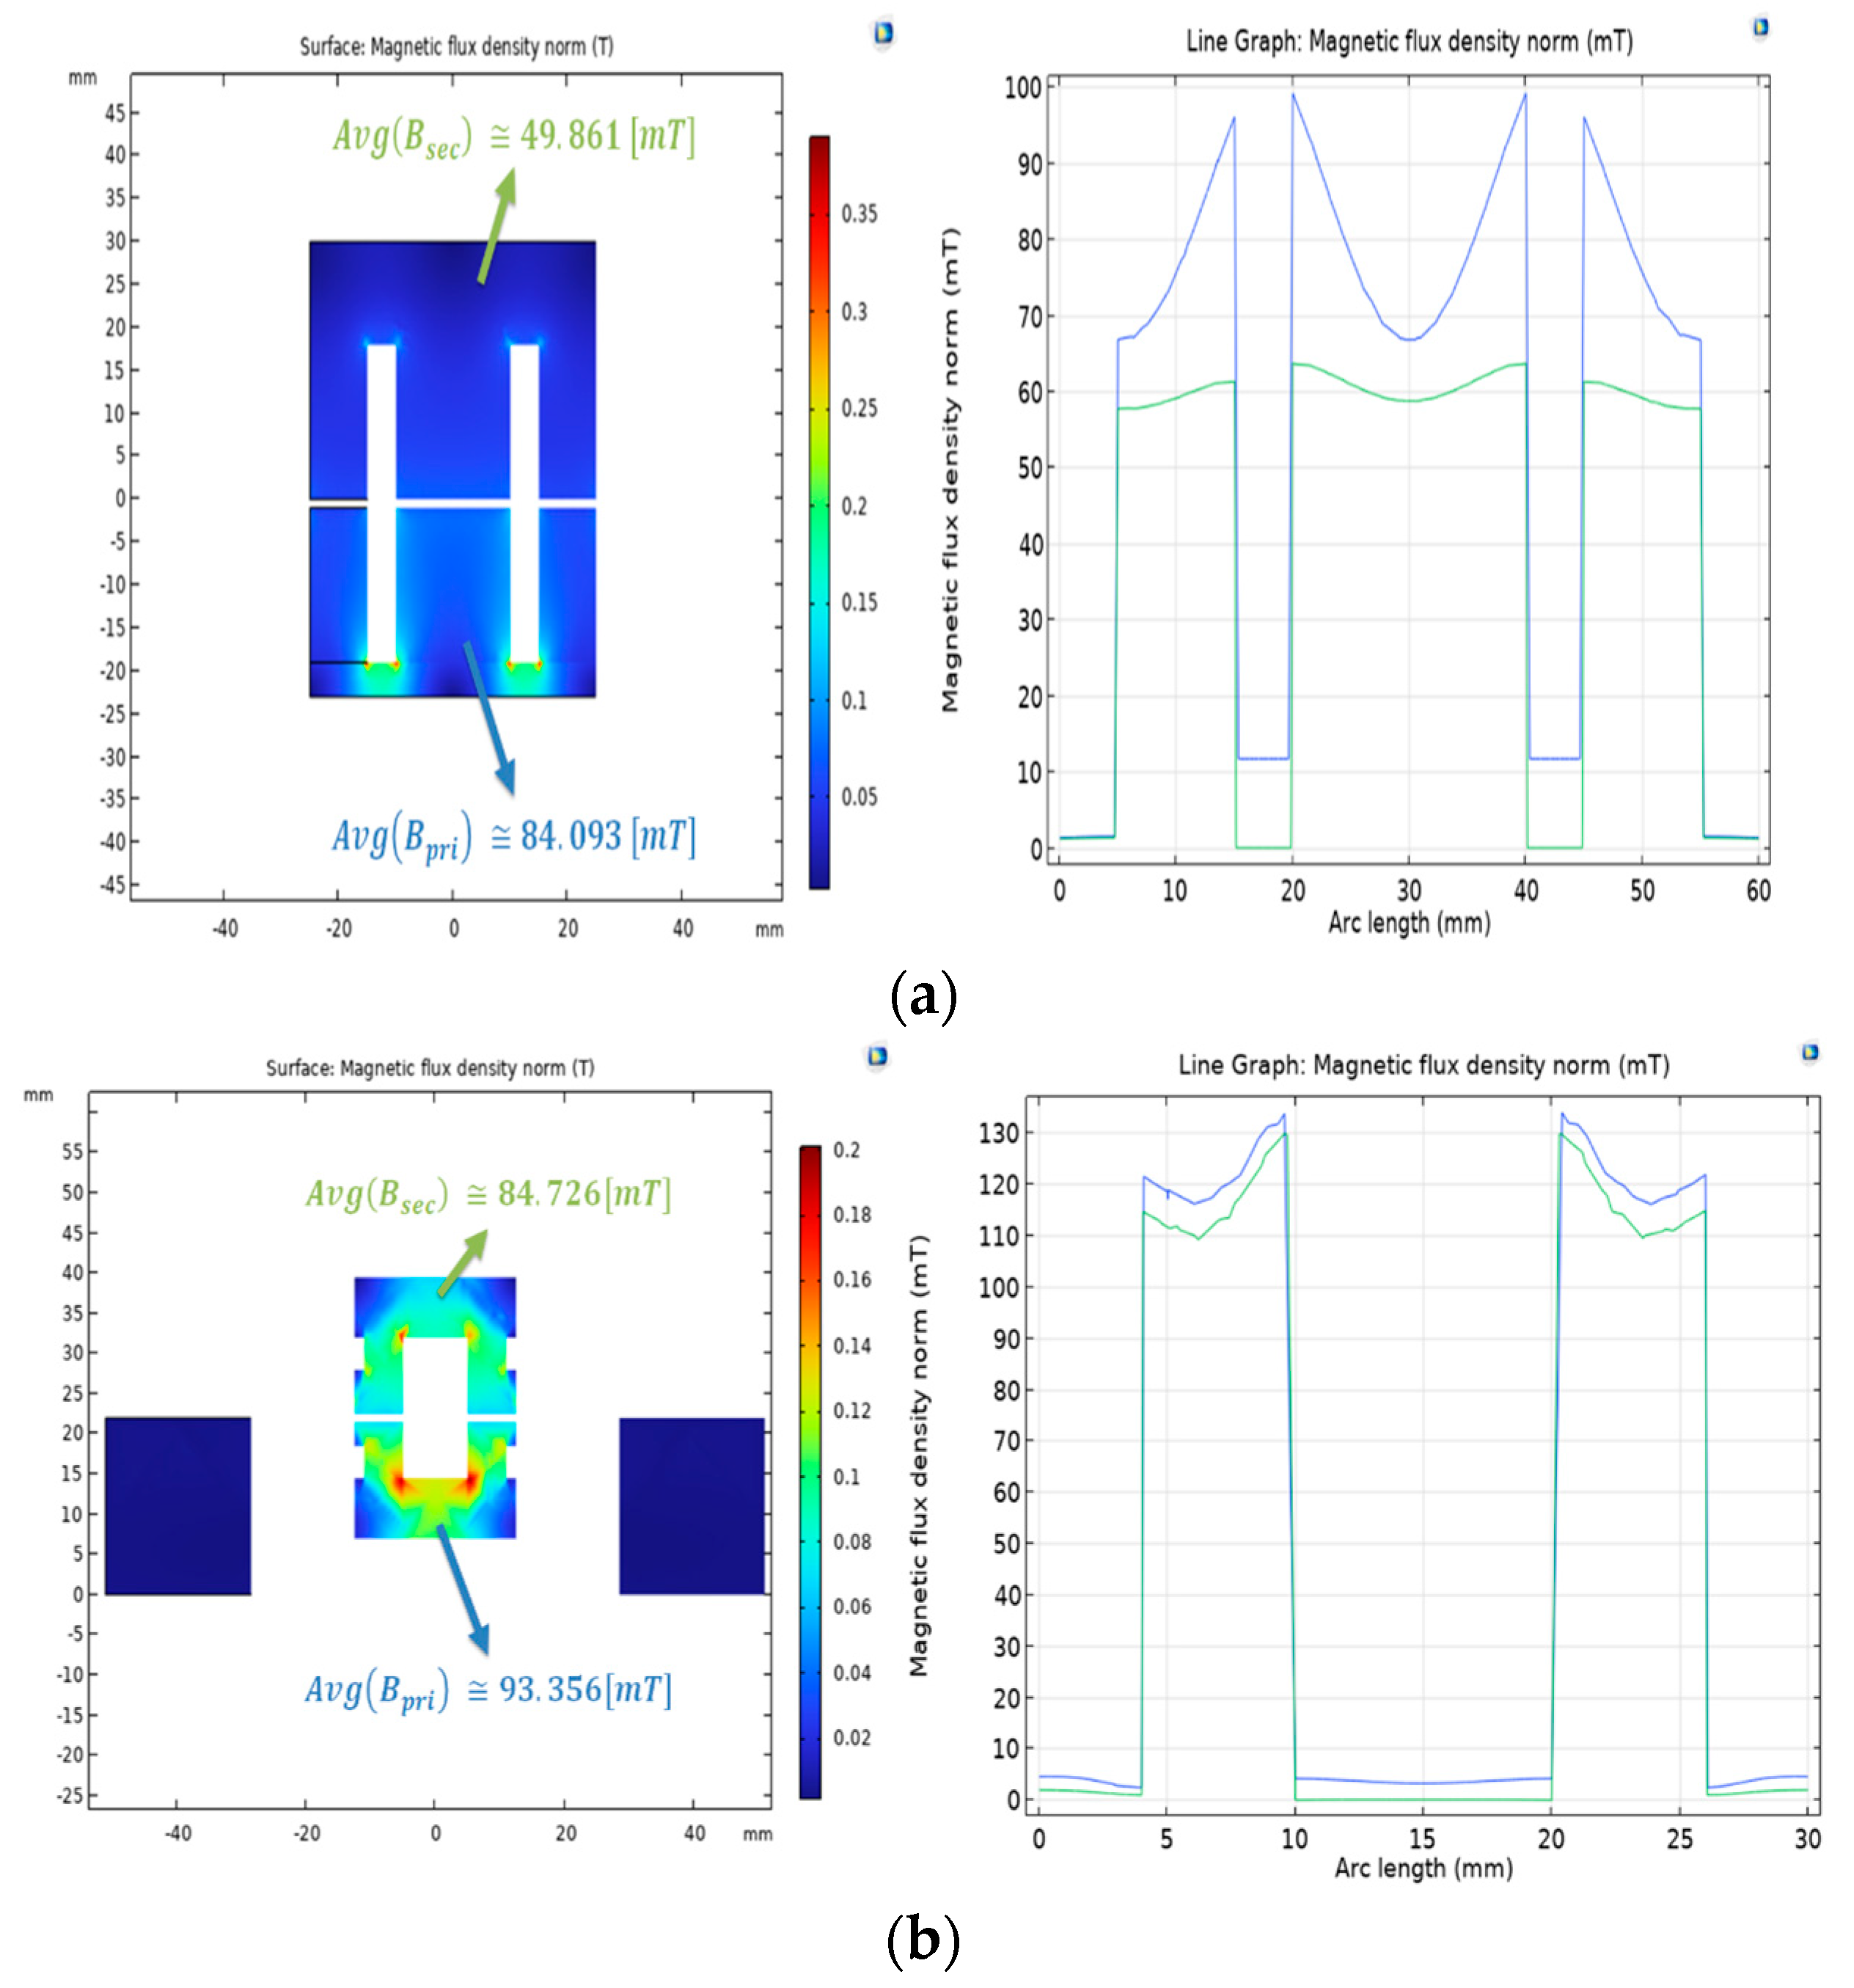
The line graph in the longitudinal direction illustrates the trend of magnetic flux generated in the stator core by the primary current, which is then delivered to the moving core. Additionally, the magnetic flux density in the zy-plane cross-section illustrates the trend of magnetic flux generated by the transmitter and distributed to the receiver. Furthermore, we analyzed the magnetic flux density delivered from the transmitter to the receiver in the magnetically coupled part. This could be observed through the magnetic flux density distribution in the xz-plane as depicted in Figure 9.
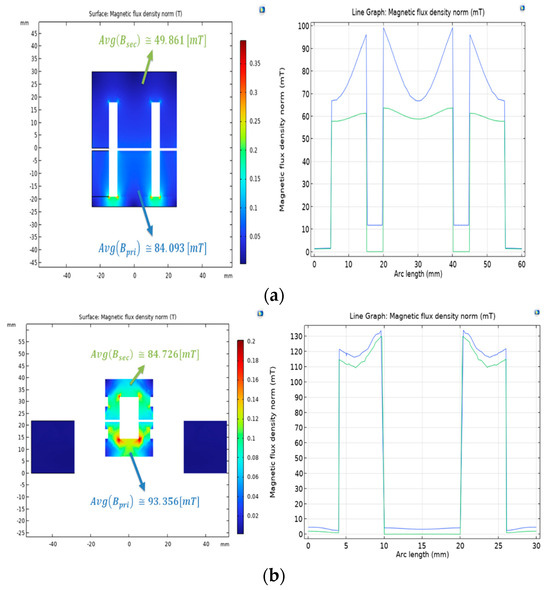
Figure 9.
Magnetic flux density distribution between the transmitter and receiver (2D, xz-plane): (a) original model; (b) proposed model.
Under the same excitation current conditions, the stationary FEA results showed that the average magnetic flux density in the transmitter for the original model was 84.093 [mT], while the average magnetic flux density in the receiver was 49.861 [mT]. For the proposed model, the average magnetic flux density in the transmitter was 93.356 [mT], and that in the receiver was 84.726 [mT].
The comparison of indicators related to the magnetic flux for each model is summarized in Table 4. This comparison enabled us to observe higher values for magnetic flux delivery efficiency in the proposed model. A higher magnetic flux delivery efficiency implies a stronger magnetic coupling and a higher proportion of mutual inductance in the total inductance. represents the average magnetic flux density in the stator core, through which the magnetic flux generated by the primary side excitation current is delivered, while represents the average magnetic flux density in the receiver. This indicates that improving the magnetic equivalent circuit in the original model results in better uniformity in magnetic flux density and minimizes the effect of leaked magnetic flux, leading to a higher coupling coefficient in the wireless power transfer system.

Table 4.
Comparison of magnetic field analysis results for each model.
Meanwhile, as described herein, magnetic energy through magnetic field FEA can be utilized as a calculation method to derive the inductance of a nonstandard transformer [6].
where B is the magnetic flux density vector and H is the magnetic field vector. Accordingly, the inductance was derived by a magnetic field energy calculation through FEA simulation of the magnetic field; the results are presented in Table 5. In addition, each inductance in Table 5 was verified against the results of FEA simulation through a comparison with the actual measured value using an LCR meter.

Table 5.
Comparison of inductance results for each model.
Thus, the proposed model had nearly the same total inductance as the original model; however, the mutual inductance and coupling coefficient increased by ~60%. Additionally, the magnetic flux delivery efficiency from the transmitter to the receiver increased by ~53.2%, from a maximum of 0.592 to 0.907. This improvement in magnetic coupling from a magnetic perspective led to a decrease in voltage/current stress in the resonant network when analyzed from the subsequent electrical equivalent circuit perspective. This outcome, in turn, could be expected to enhance the overall system efficiency, as it results in reduced current for the same input power.
2.3. FEA for Core Loss Model Caculation
There are various methods for calculating the core loss of a transformer. The Steinmetz [12] and Berotti [13] equations are commonly used to estimate the loss in a transformer. However, the WPT transformer discussed herein has a nonstandard structural shape for both the transmitter and receiver components, with cores of different materials. Furthermore, the mentioned loss-calculation approaches often require the determination of coefficients through experimental data, which could be challenging. Therefore, in this work, we utilized the material characteristics of the core and B-H curve information to calculate the loss model by FEA [14]. Core loss can be largely divided into hysteresis loss, eddy current loss, and copper loss. In the FEA, hysteresis loss and eddy current loss of the contactless transformer were considered. The eddy current loss in the transformer losses can be derived from the losses due to Joule heating as defined by Equation (6):
We performed the magnetic field FEA using Ampere’s law and Maxwell’s equations. Therefore, to interpret the loss model of the transformer, frequency domain analysis was conducted according to the smallest unit of magnetic field analysis, the magnetic vector potential (). Meanwhile, in the time domain analysis, hysteresis loss can be derived from magnetic field intensity and magnetic flux density as described by Equation (7) [15]:
By using the above analysis and calculation, the loss per unit density was calculated for the core loss of the WPT models. When Equations (6) and (7) are transferred to the frequency domain, they can be expressed as Equation (8) [16]:
where, is the total electromagnetic loss density, which is the sum of the electric loss density () and the magnetic loss density ().
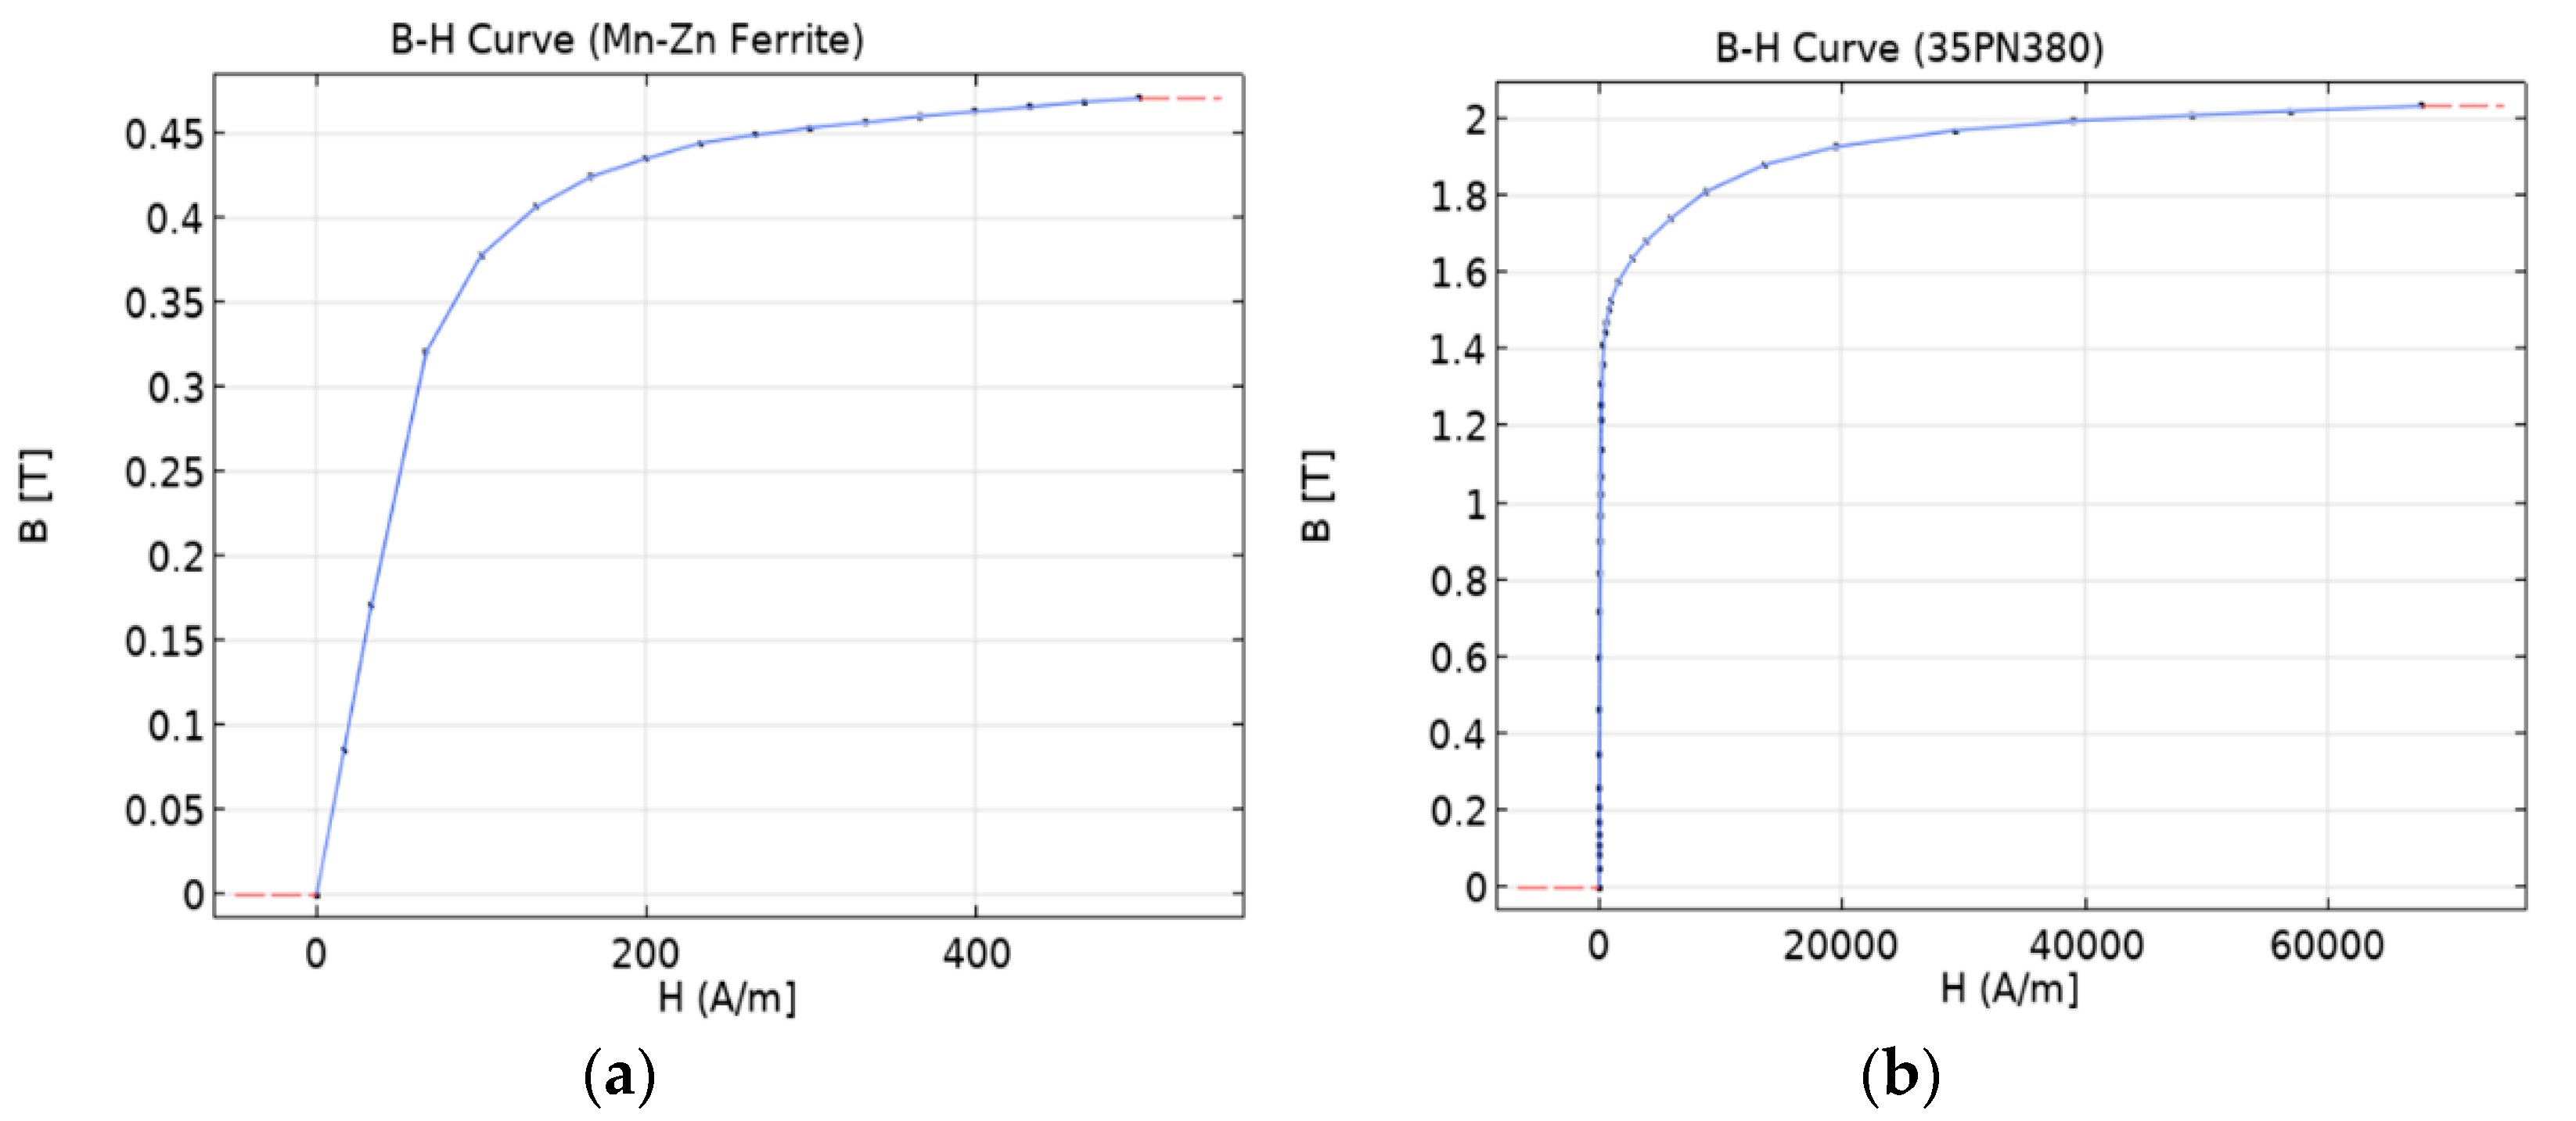
The fundamental components of the WPT model’s core comprise two materials: 35PN380 laminated steel plate and Mn-Zn ferrite powder. Figure 10 depicts the B-H curves for each material in the core. Additionally, the material properties used in the FEA are listed in Table 6.
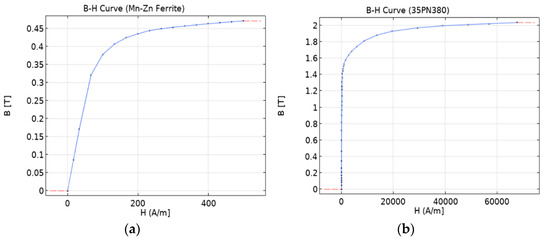
Figure 10.
B-H curve of the core material: (a) Mn-Zn alloy powder ferrite; (b) silicon steel NGO 35PN380.

Table 6.
Properties of core and coil materials.
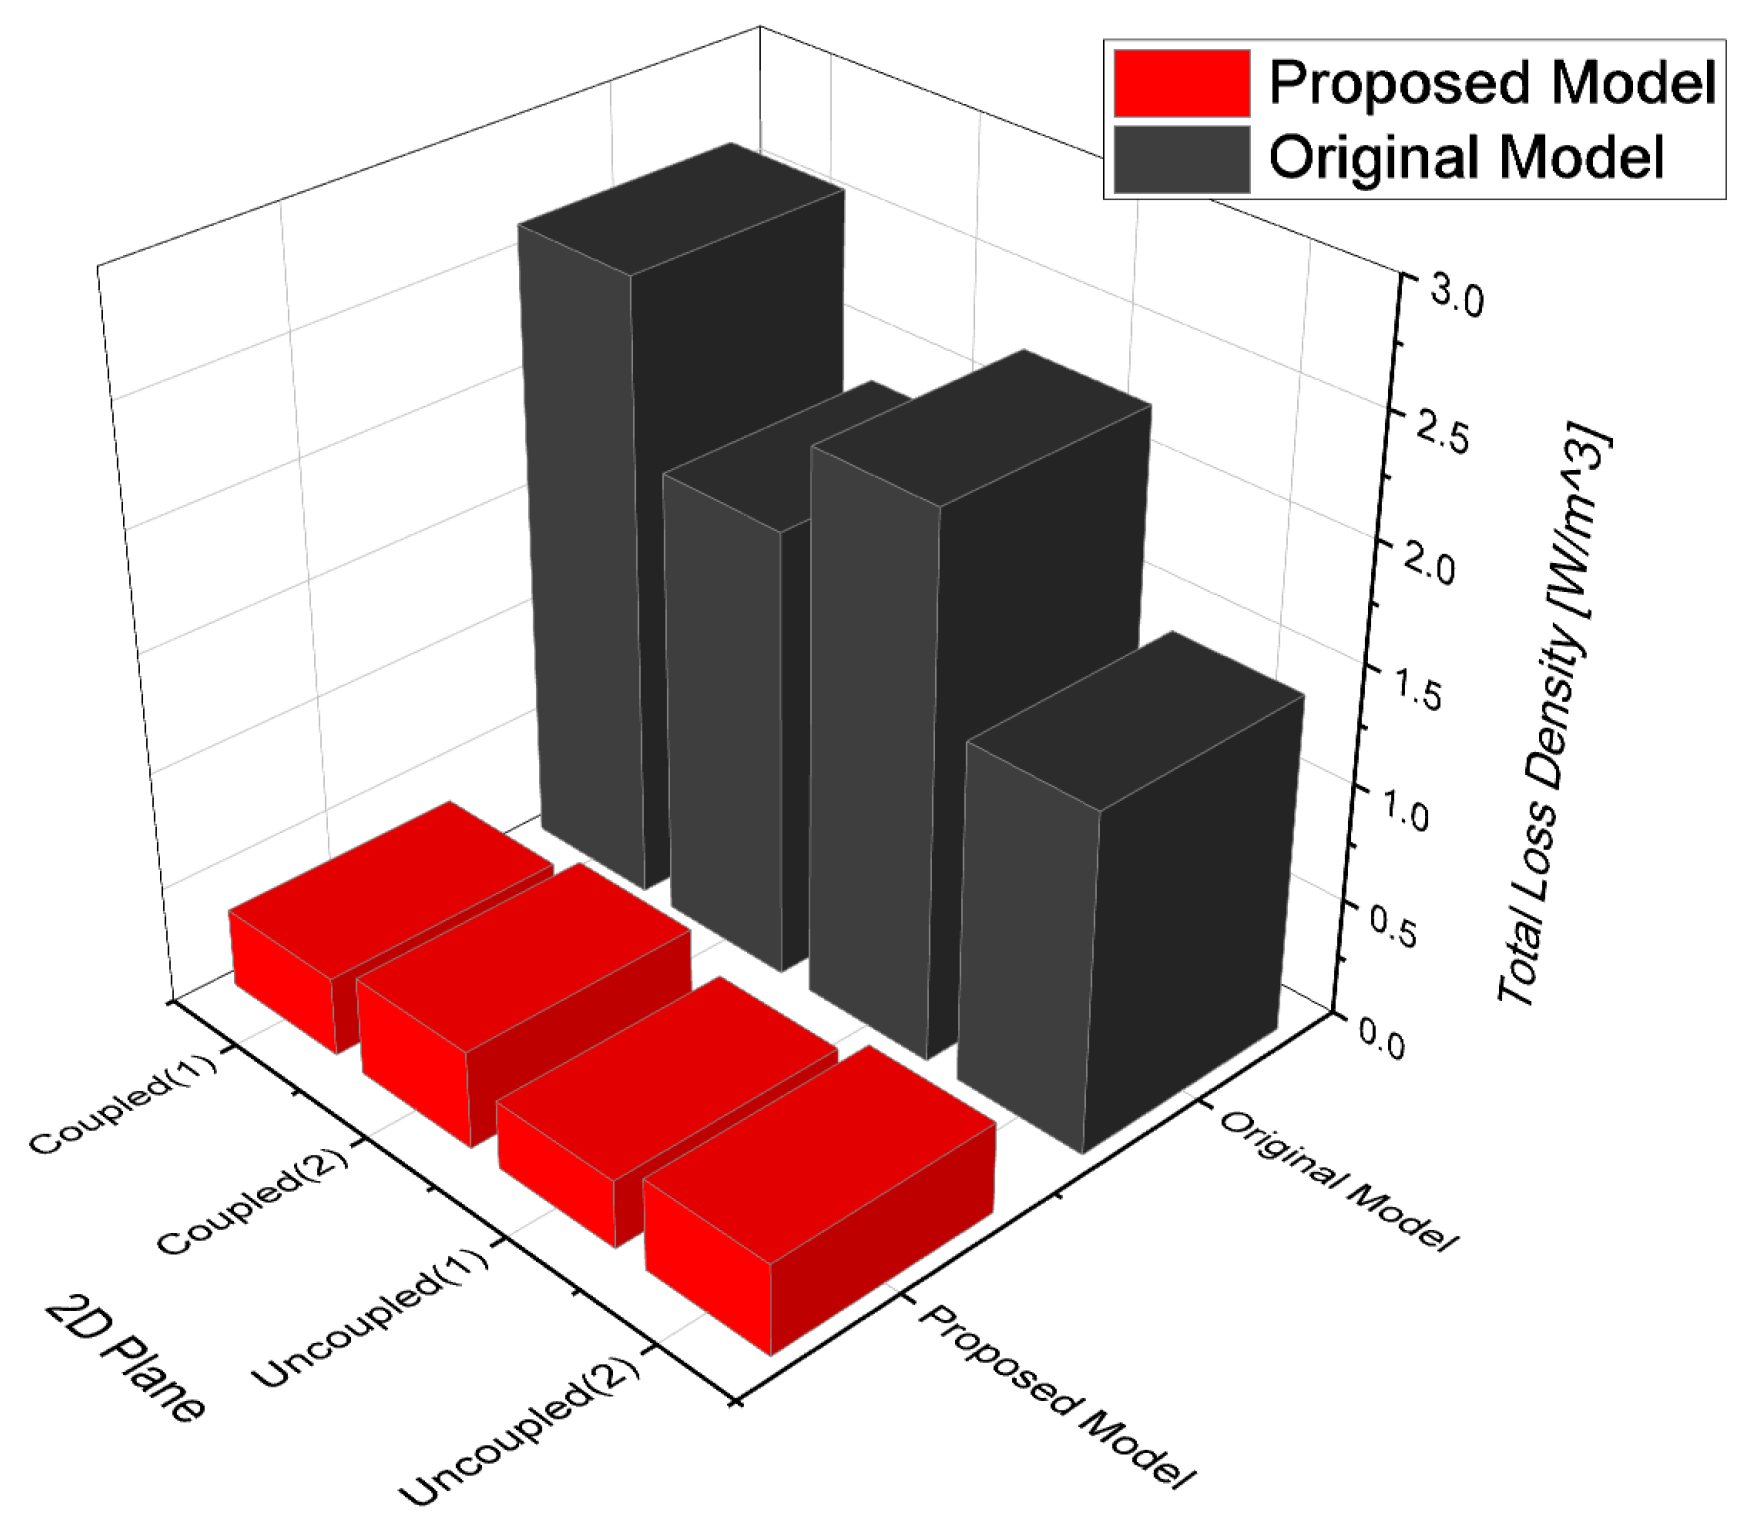
By considering these material properties and B-H curve conditions, the core loss per unit density [W/] of each model was calculated through FEA in the frequency domain as shown in Figure 11.
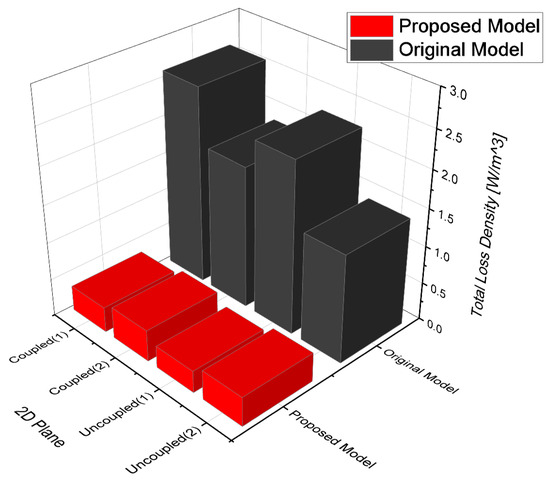
Figure 11.
Core loss per unit density for each model.
The average [] calculated in the 2D plane was integrated by area, and the core loss for the entire model was calculated according to Equation (9) by considering the depth corresponding to each domain in the total 3D model:
The WPT part can be broadly divided into a magnetically coupled part and an uncoupled part. The iron loss for each part is presented in Table 7 and Table 8.

Table 7.
FEA results of core loss in the original model in the 2D plane.

Table 8.
FEA results of core loss in the proposed model @2D plane.
An examination of the core loss per unit density in Figure 11 reveals that the core loss in the coupled region tends to be higher compared to that in the uncoupled region for a single area. However, in terms of overall model indicators, the core loss in the uncoupled region appears to be higher. This is because in both the original and proposed models, the stator core part is longer, and the laminated core, which has a high core loss, is absent in the moving part.
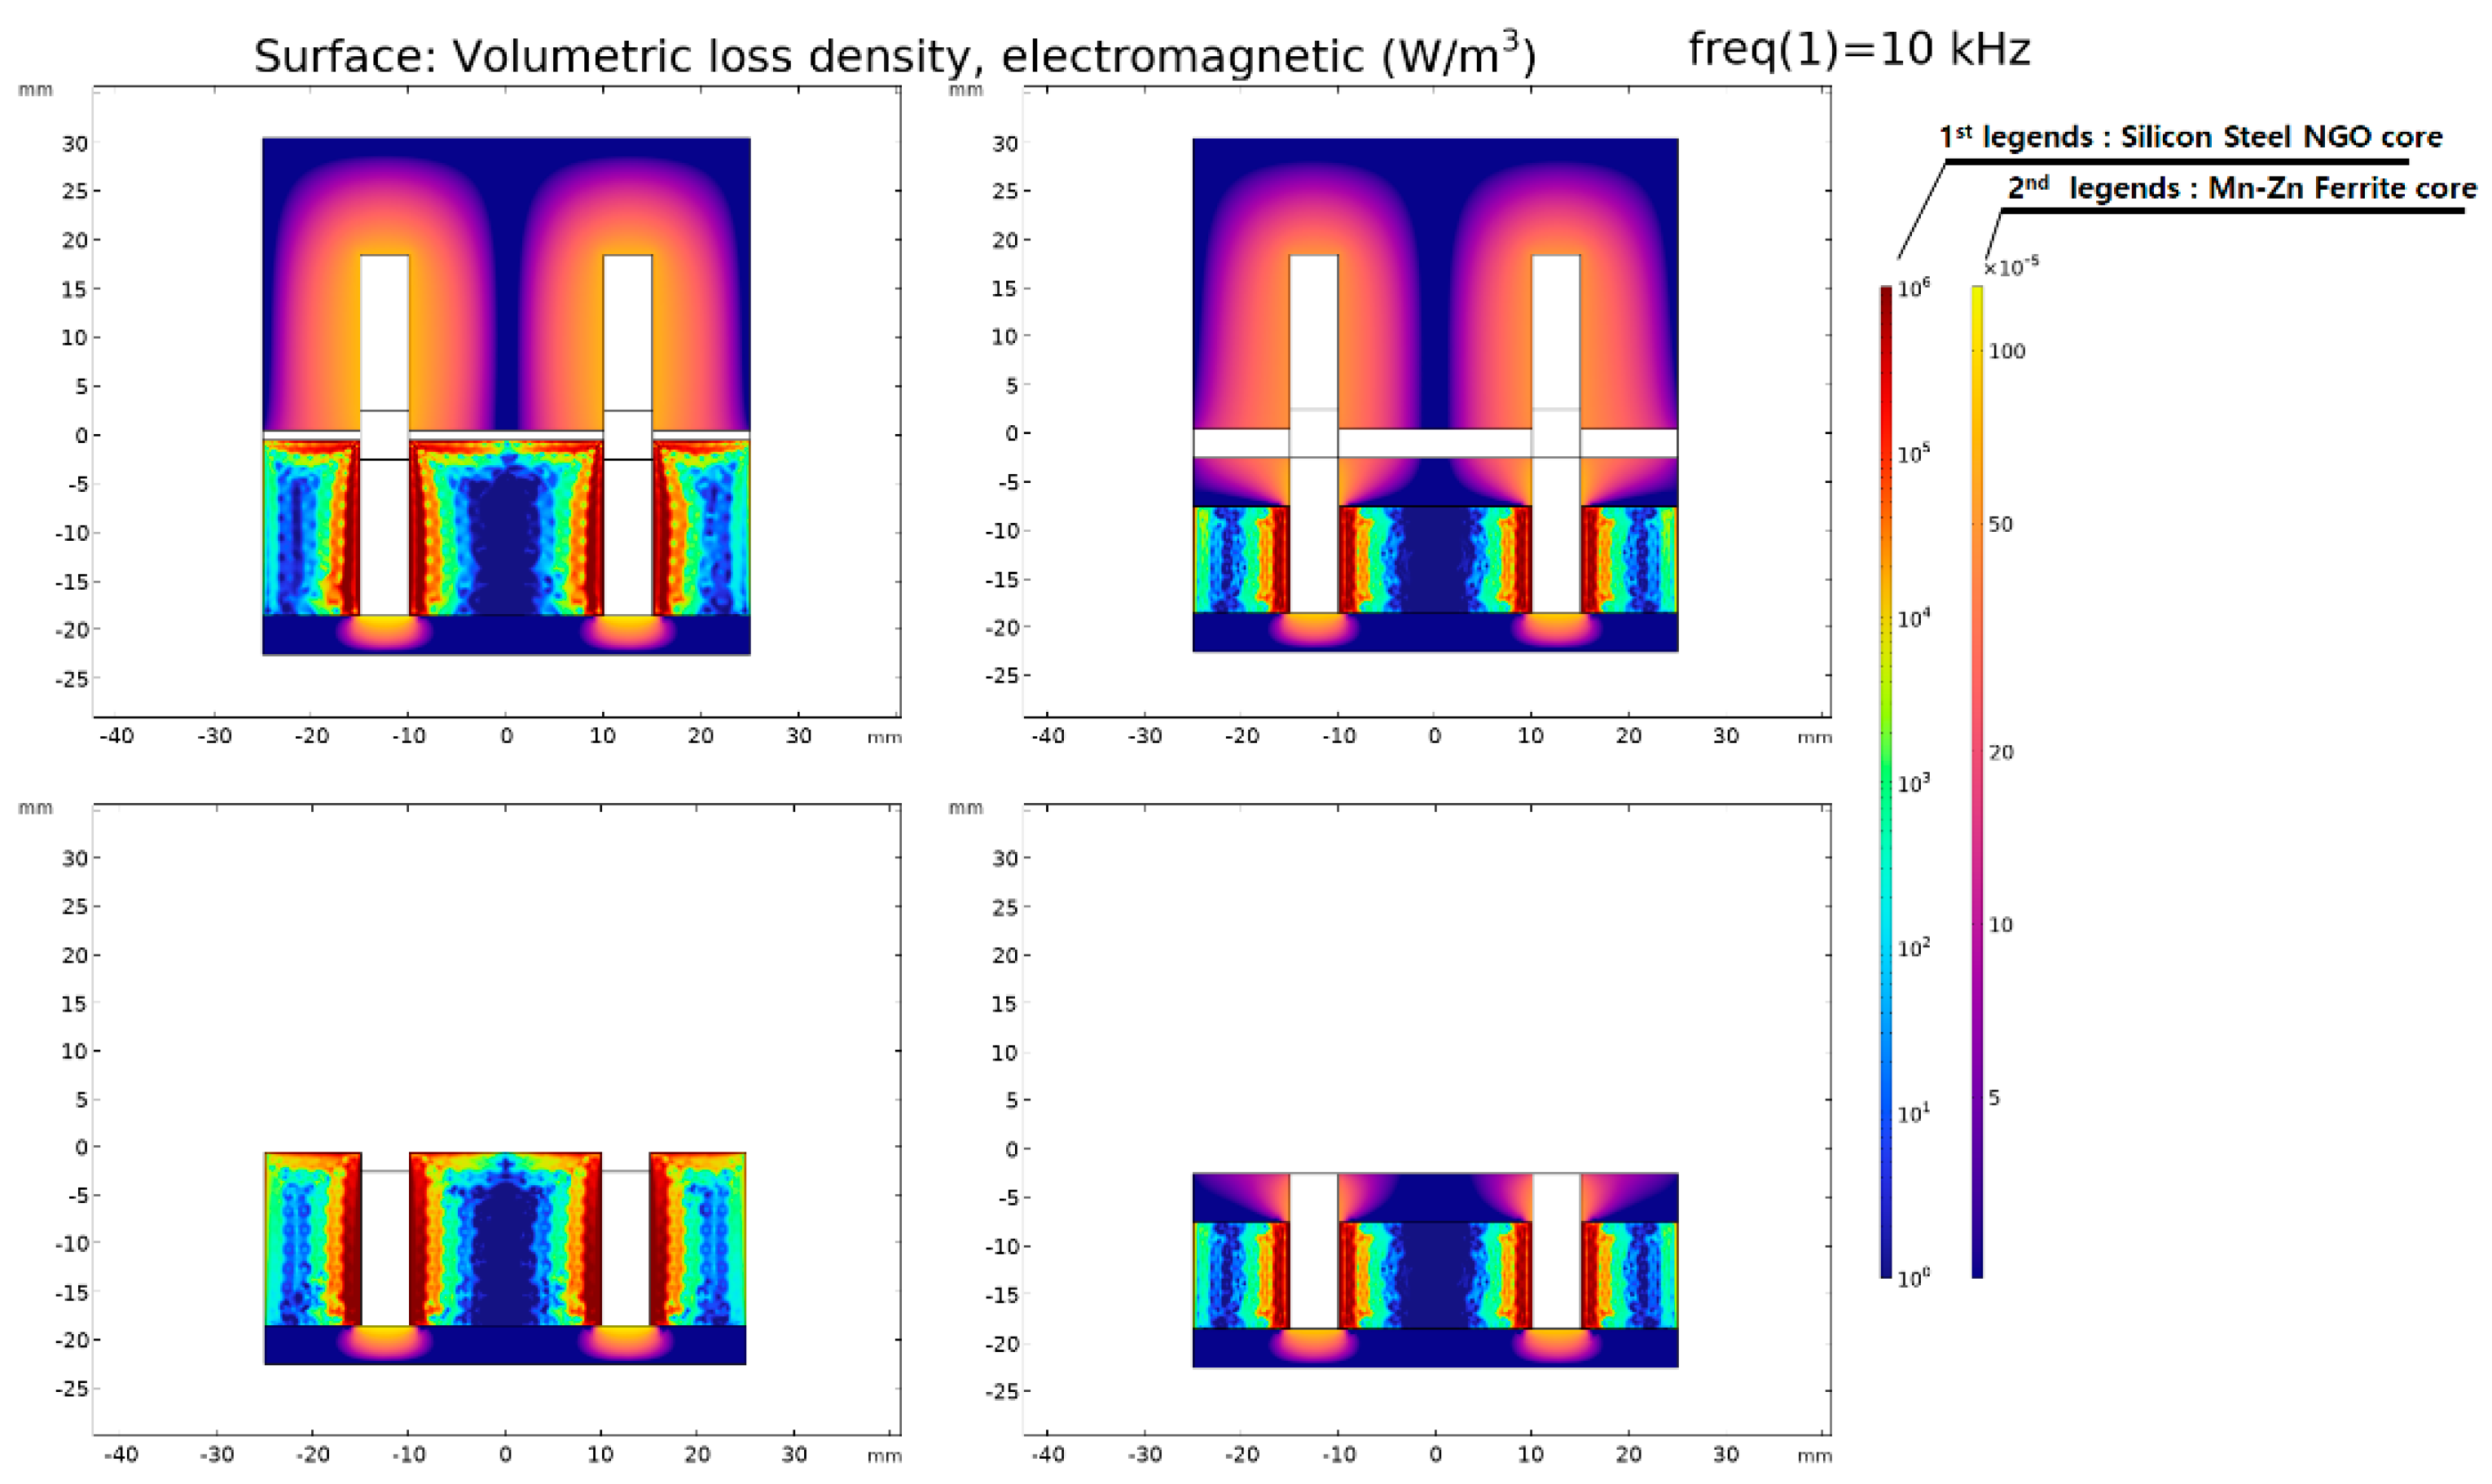
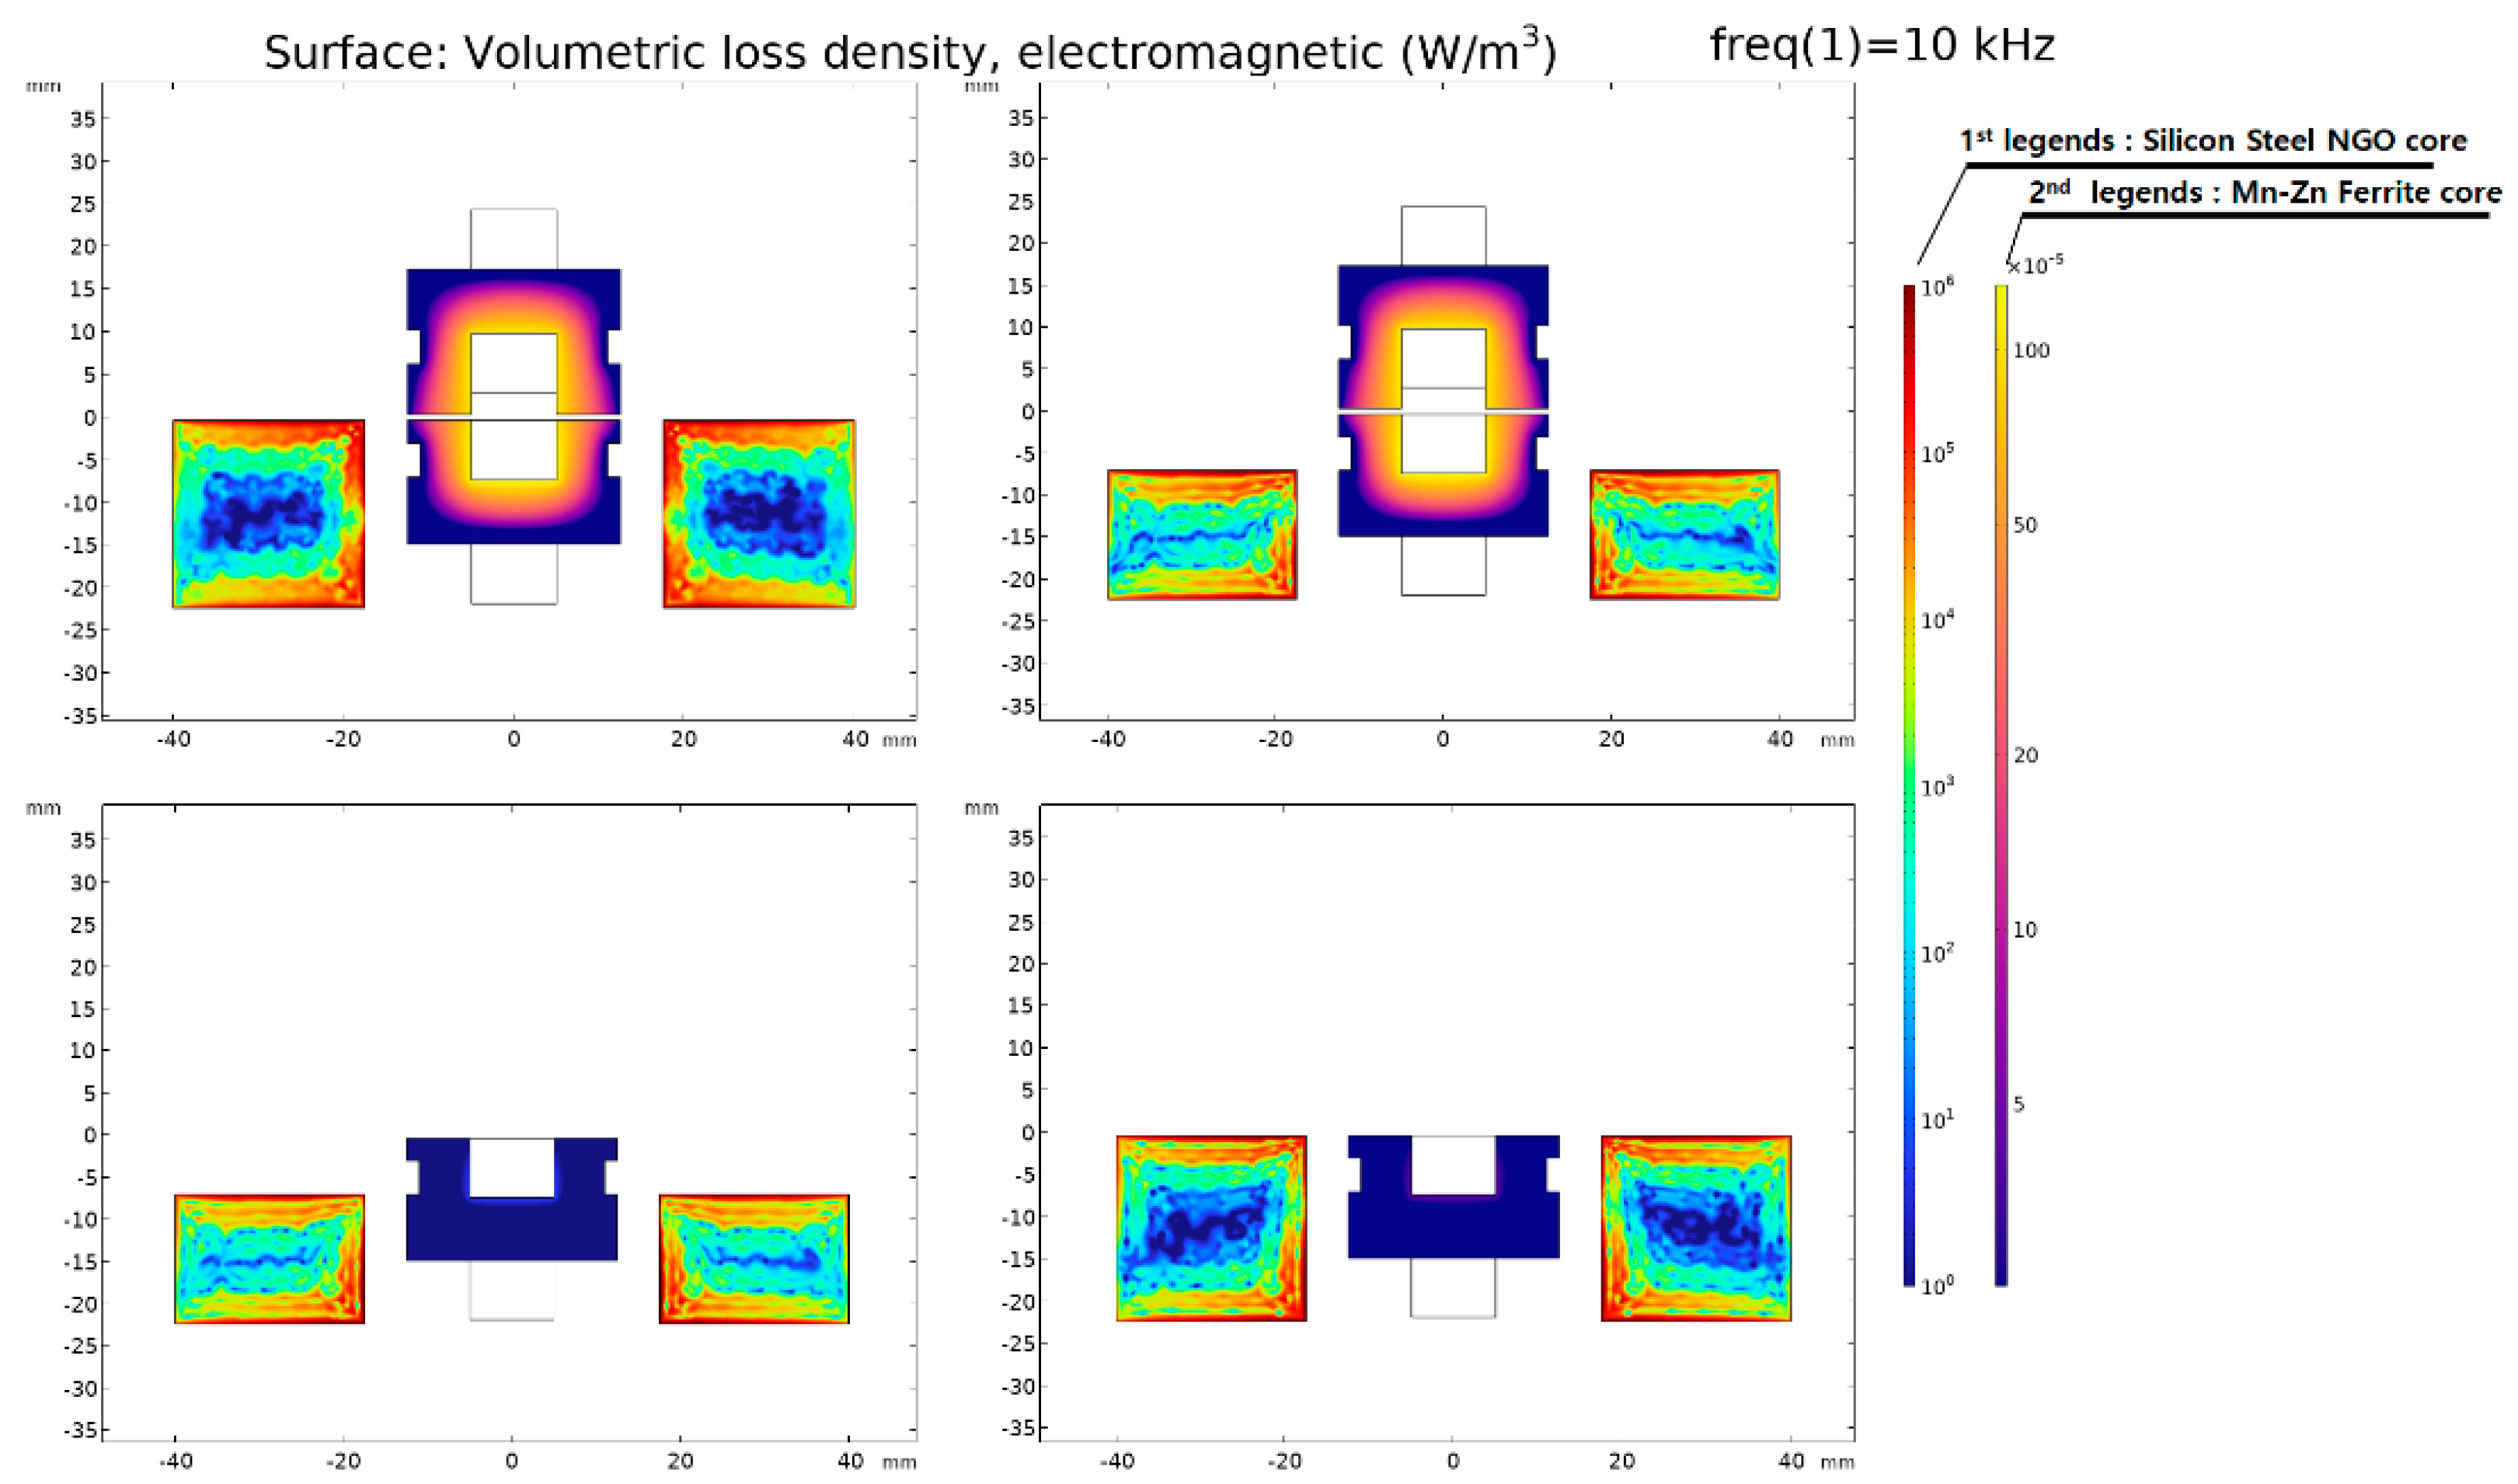
Figure 12 and Figure 13 display the distribution of for each model. In Figure 12 and Figure 13, the first legend is an indicator of the core loss density of Silicon Steel NGO (35PN380), and the second legend is an indicator of the core loss density of Mn-Zn Ferrite. The ferrite core has a relatively low electrical conductivity () compared to silicon steel (35PN380), and as observed in Figure 10, its influence on magnetic saturation is relatively low. Consequently, the total electromagnetic loss density is significantly lower. In other words, the core loss in WPT primarily occurs in the laminated core. Therefore, the surface plot legend is specified to distinguish between them, and to facilitate a comparison between the models, the same data range is applied.
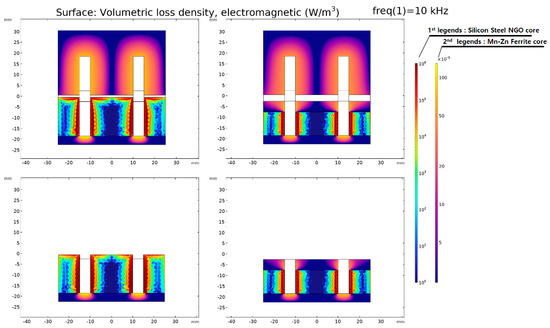
Figure 12.
Electromagnetic loss density distribution of the original model.
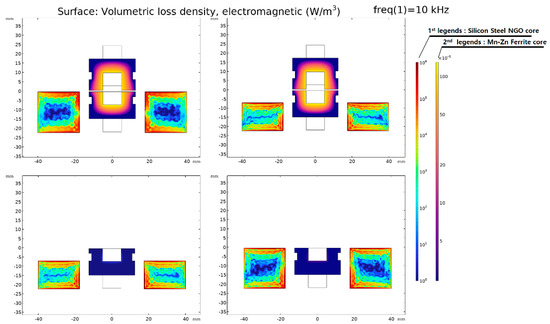
Figure 13.
Electromagnetic loss density distribution of the proposed model.
Furthermore, when we analyze the core loss, as specified in Table 7 and Table 8, it can be divided into hysteresis loss and eddy current loss. The impact of hysteresis loss and eddy current loss is predominant owing to the high σ of the laminated core and the passage of the magnetic flux generated by the primary current. However, the impact of the primary magnetic flux on the laminated core was minimized by designing the separation of the core structure, and it could be confirmed from the magnetic equivalent circuit and the magnetic flux density distribution. Evidently, most of the core loss is attributable to the laminated iron core, with the influence of eddy current loss being more pronounced than hysteresis loss, as shown in Figure 13.
The core loss of the proposed model was reduced by ~81% compared to the original model. A WPT system based on magnetic resonance operates in a band of several tens of kilohertz. However, there is a limit to the expansion of the operating frequency band owing to the core loss that increases in proportion to the frequency. To solve this problem, a magnetic equivalent circuit was created by separating the core. This enabled an increase in the operating frequency of the power conversion system within the range where power loss could be used because of the reduction of iron loss. Accordingly, it could be suitable for the application of a clean system with further reduced noise through frequency driving above the audible frequency of 20 kHz.
3. Power Converter System Characteristics and Experiment Result Analysis
3.1. Subsection Electrical System Structure and the Comparison of Excitation Current for Each Model
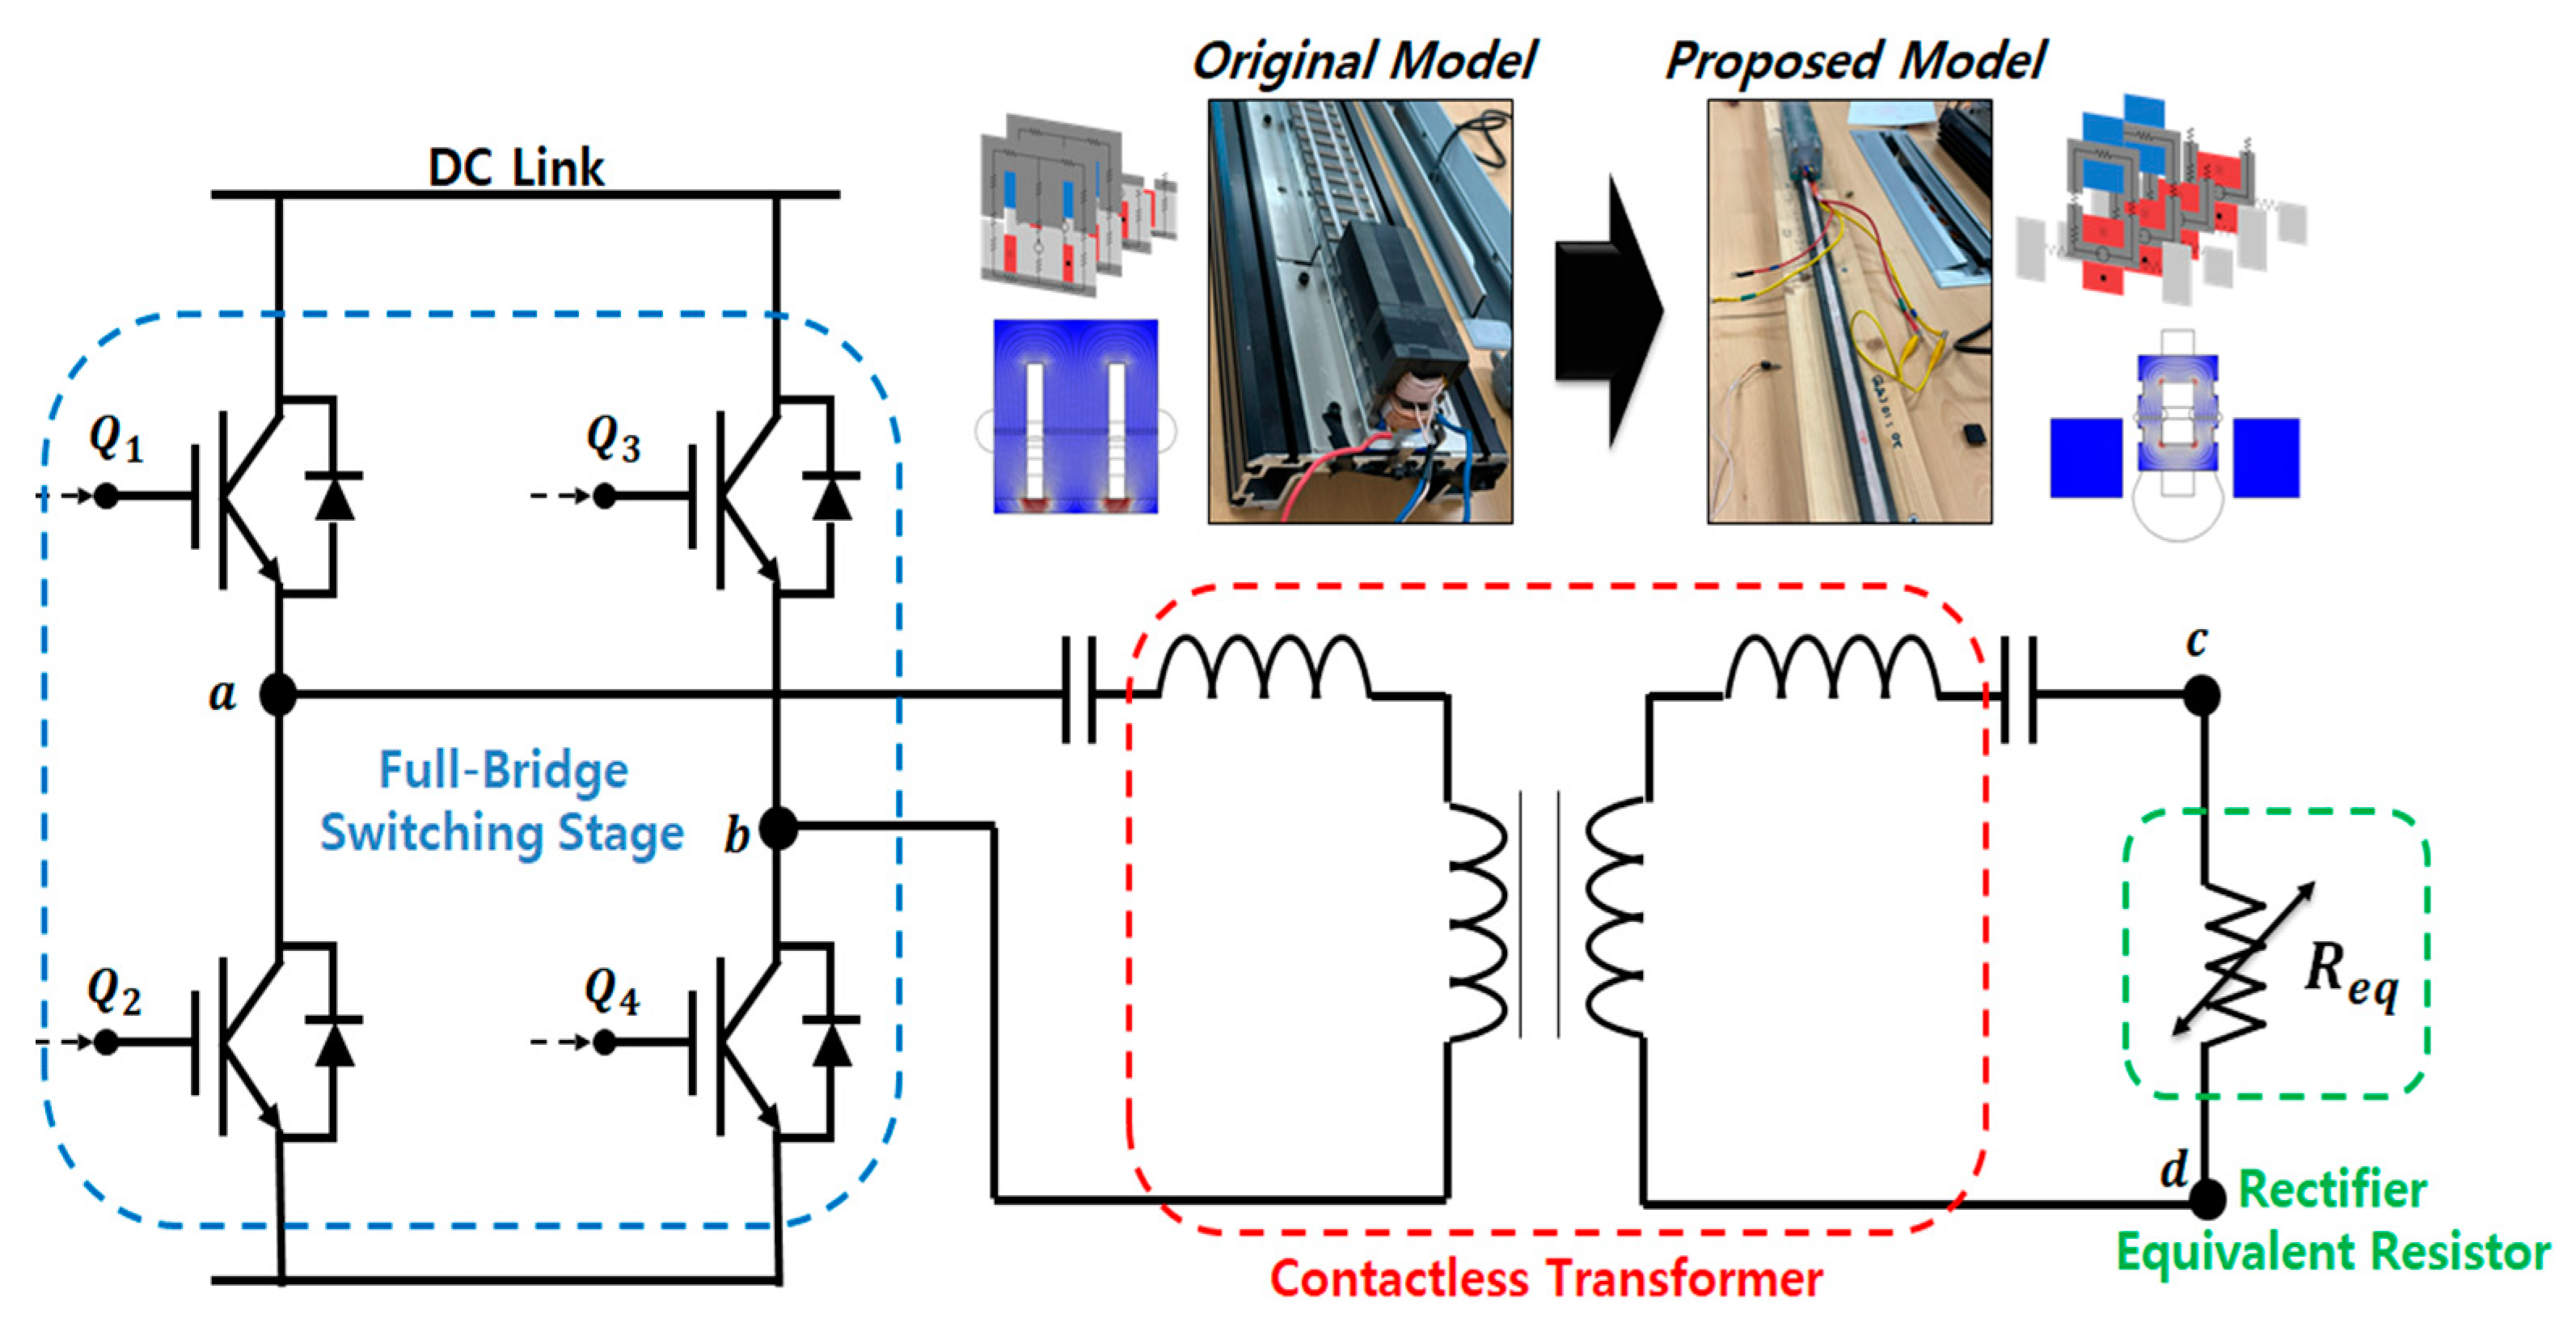
In this work, we aimed to apply the coupled inductor equivalent circuit to the WPT system discussed. We intended to address improvements in the electrical circuit according to the results of magnetic field FEA. The model previously examined through magnetostatic FEA corresponds to the contactless transformer part responsible for magnetic energy transmission and electrical isolation in the entire system. The structure of a power converter designed for wireless power transfer using electrical LC resonance is illustrated in Figure 14.
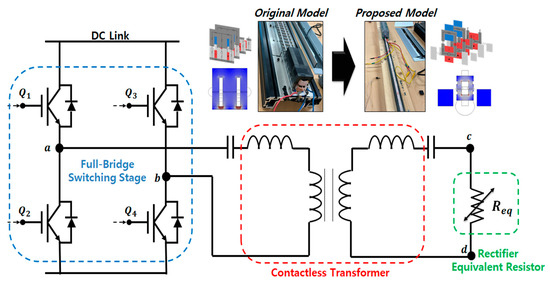
Figure 14.
CLLC resonant converter configuration of the WPT system.
3.2. The First Harmonic Analysis of the CLLC Resonant Converter in the WPT System
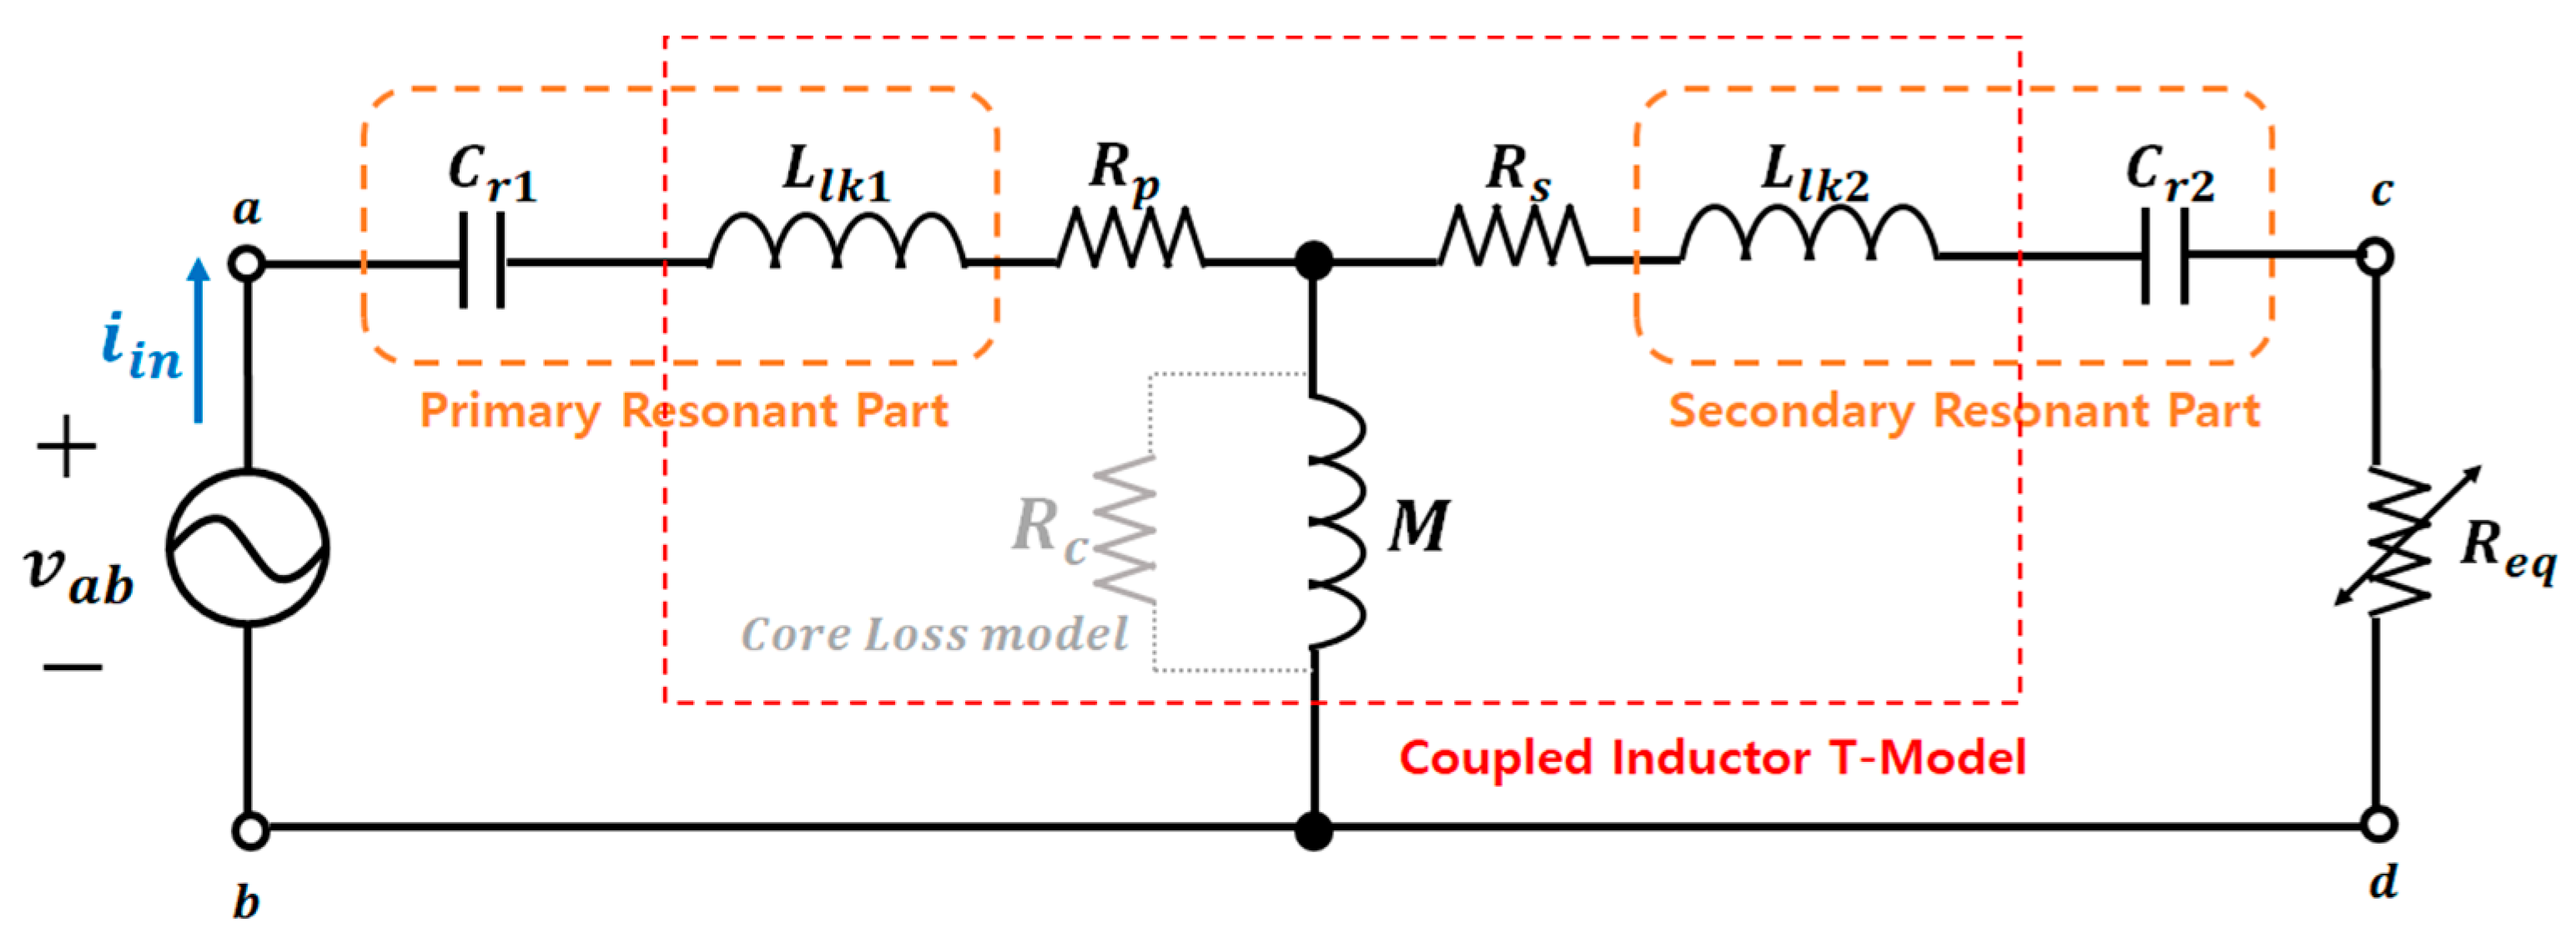
Figure 15 illustrates the LCCL resonant network utilized in a power conversion circuit of the WPT system [17,18]. The switching topology of the power conversion circuit is designed with a full-bridge structure, with the pole voltage of each switching arm applied to the resonant network. The contactless transformer that enables WPT through magnetic coupling is equivalently modeled as a T-model from a coupled inductor perspective. By focusing on designing a resonant network, the aim is to counteract the effects of voltage drop on leakage inductance by using LC series resonance in this section.
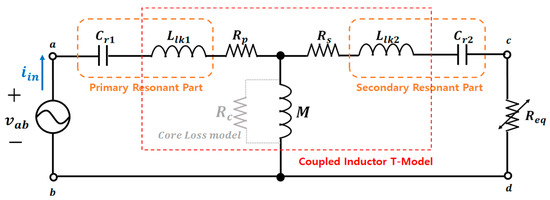
Figure 15.
Resonant network configuration in the WPT system.
To analyze the operational characteristics of the resonant converter, the commonly used first harmonic analysis) was applied [19]. represents the fundamental component of the square-wave voltage applied to the resonant network owing to the operation of the full-bridge inverter. Further, is the equivalent load resistance that transforms the secondary side’s rectifier stage into the primary side. Additionally, the core loss obtained from the FEA results was applied to the core loss resistor () modeling in the circuit.
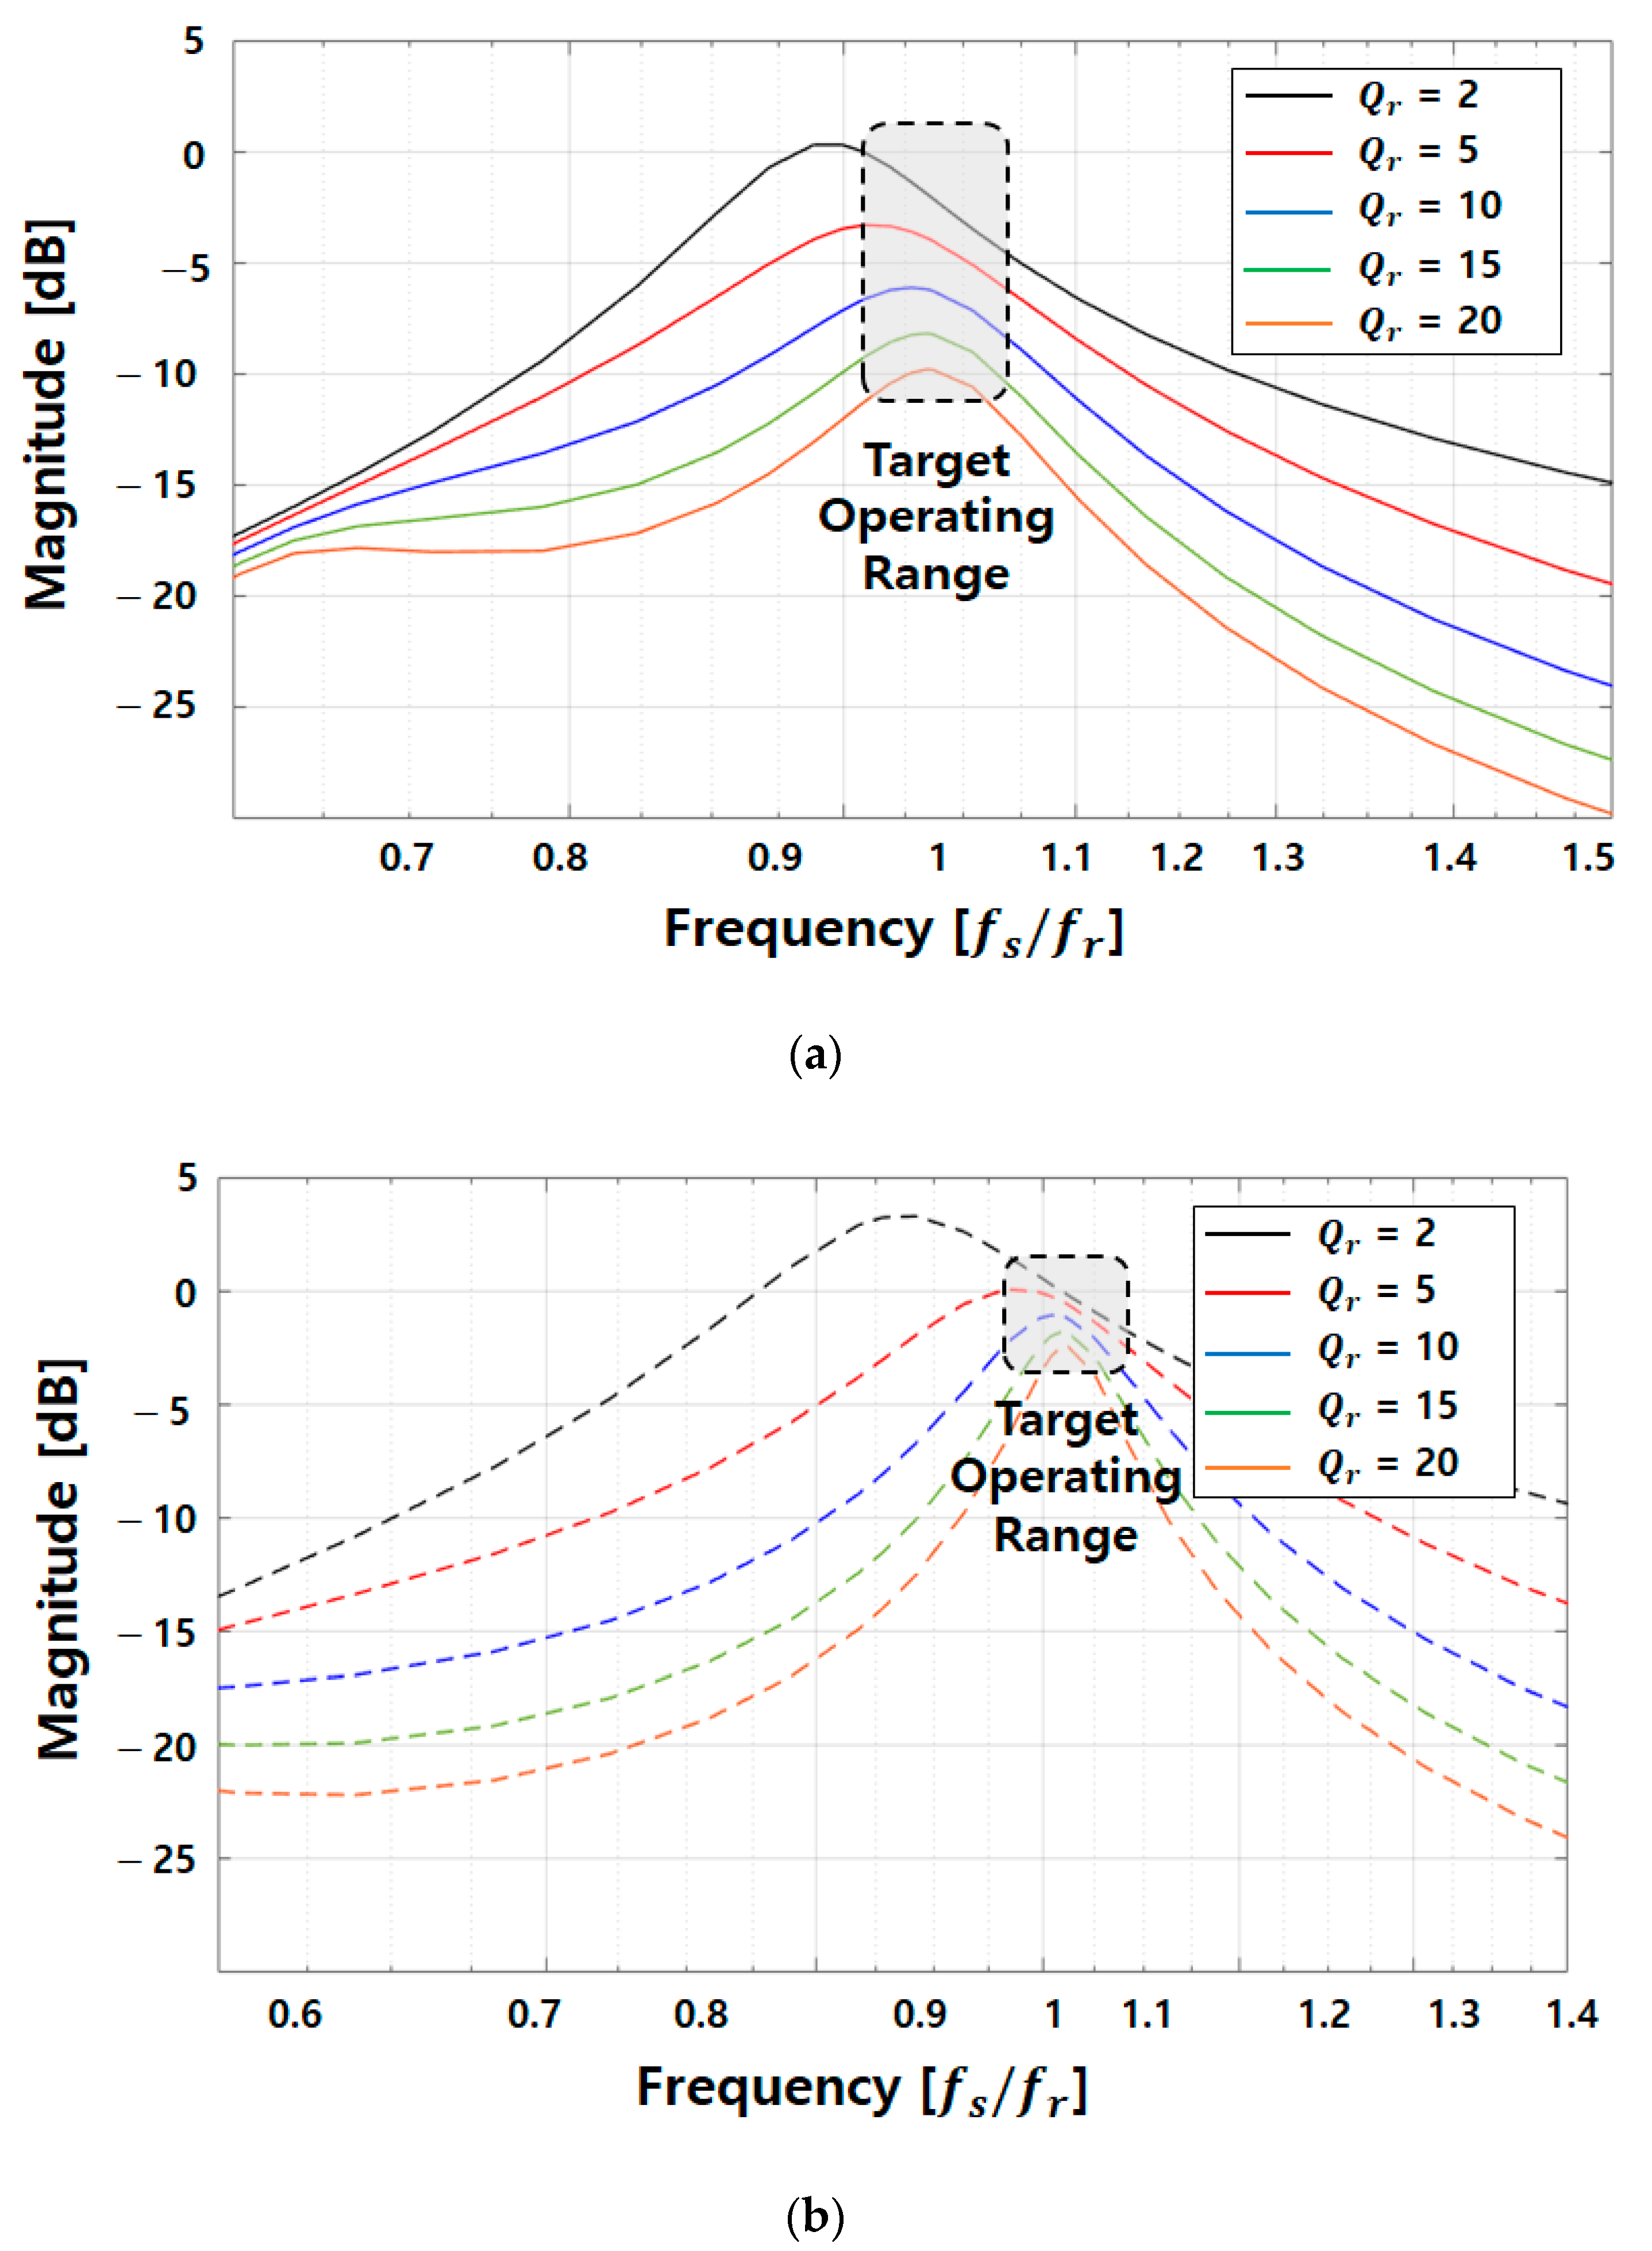
where represents the resonance impedance on the primary side, is the resonance impedance on the secondary side, and is the excitation impedance [20]. Each resonance impedance was set to have the same resonant frequency () by normalizing the switching frequency with respect to the resonant frequency. The voltage gain of the WPT system based on this setting is presented in a Bode plot in Figure 16.
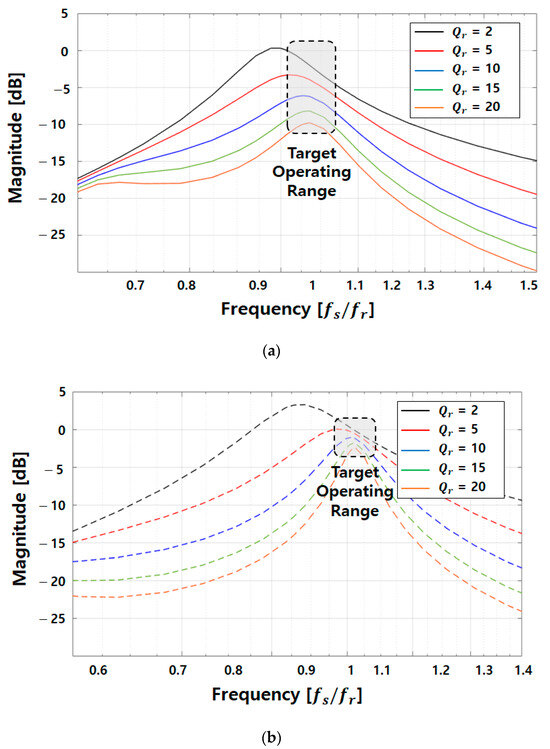
Figure 16.
Voltage gain curve and normalized frequency at different Q values: (a) original model; (b) proposed model.
The frequency axis was normalized with respect to the resonant frequency, and the varying values under different load conditions were compared under constant conditions. Moreover, the WPT system was designed to achieve 1:1 voltage transfer using the LCCL resonant network, and the target operating range corresponded to the resonant frequency or frequencies close to it for both primary- and secondary-side LC resonances.
In this way, by incorporating the core loss and inductance derived from FEA into circuit modeling, the improvements were analyzed from an electrical circuit perspective. According to the operating principles of a transformer, as the load increases, the primary-side load current () increases. Therefore, under the same electromotive force conditions, the core loss current in the original model is higher compared to that in the proposed model. Consequently, power loss and efficiency degradation are more pronounced.
3.3. Experiment and Simulation Analysis
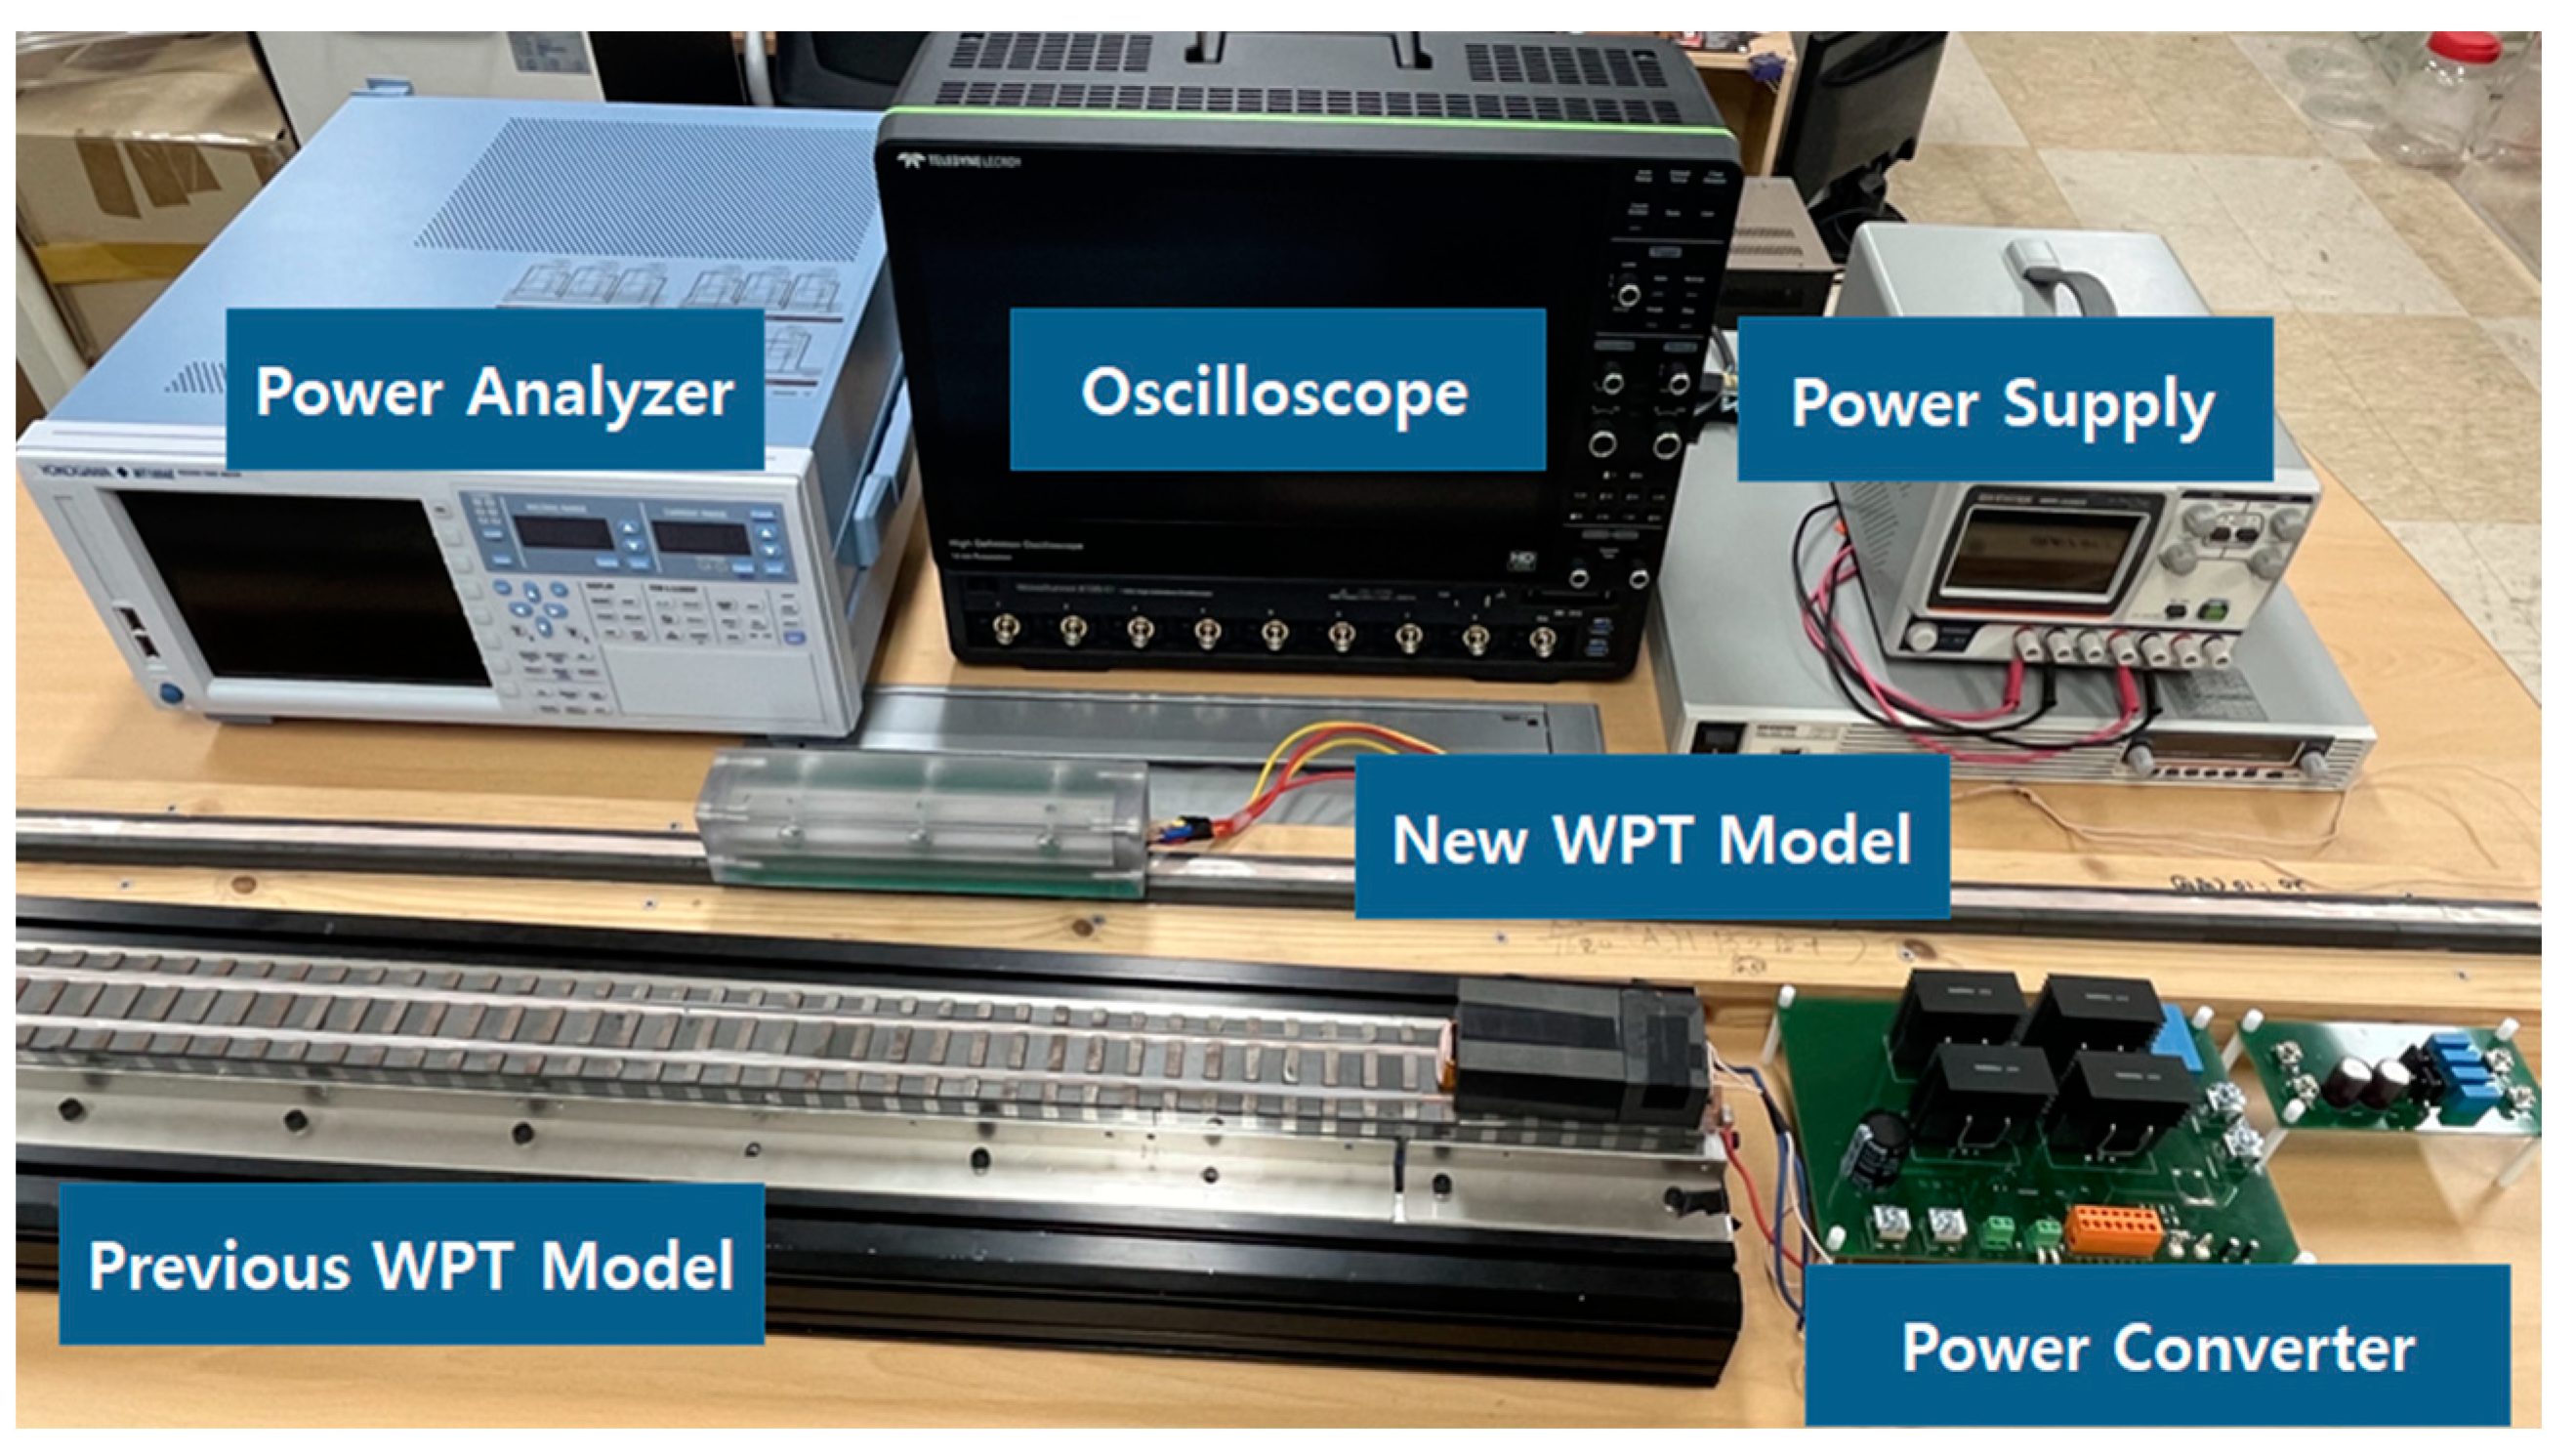
On the basis of the aforementioned analysis, experiments were conducted with a prototype considering different load conditions and operating switching frequencies. The experimental setup is depicted in Figure 17.
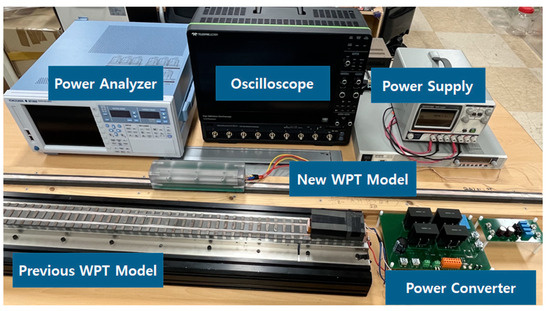
Figure 17.
Experimental configuration with original and proposed WPT models.
Under the same conditions, tests were performed by replacing only the contactless transformer part responsible for wireless power transfer in both the original and proposed models. The experimental conditions in this work were based on a 1:1 voltage transfer with an input DC Link voltage of 100 [V]. In the setup, it was assumed that load currents of 1, 2, and 3 [A] could flow from an output voltage of 100 [V], and resistive loads were set accordingly.
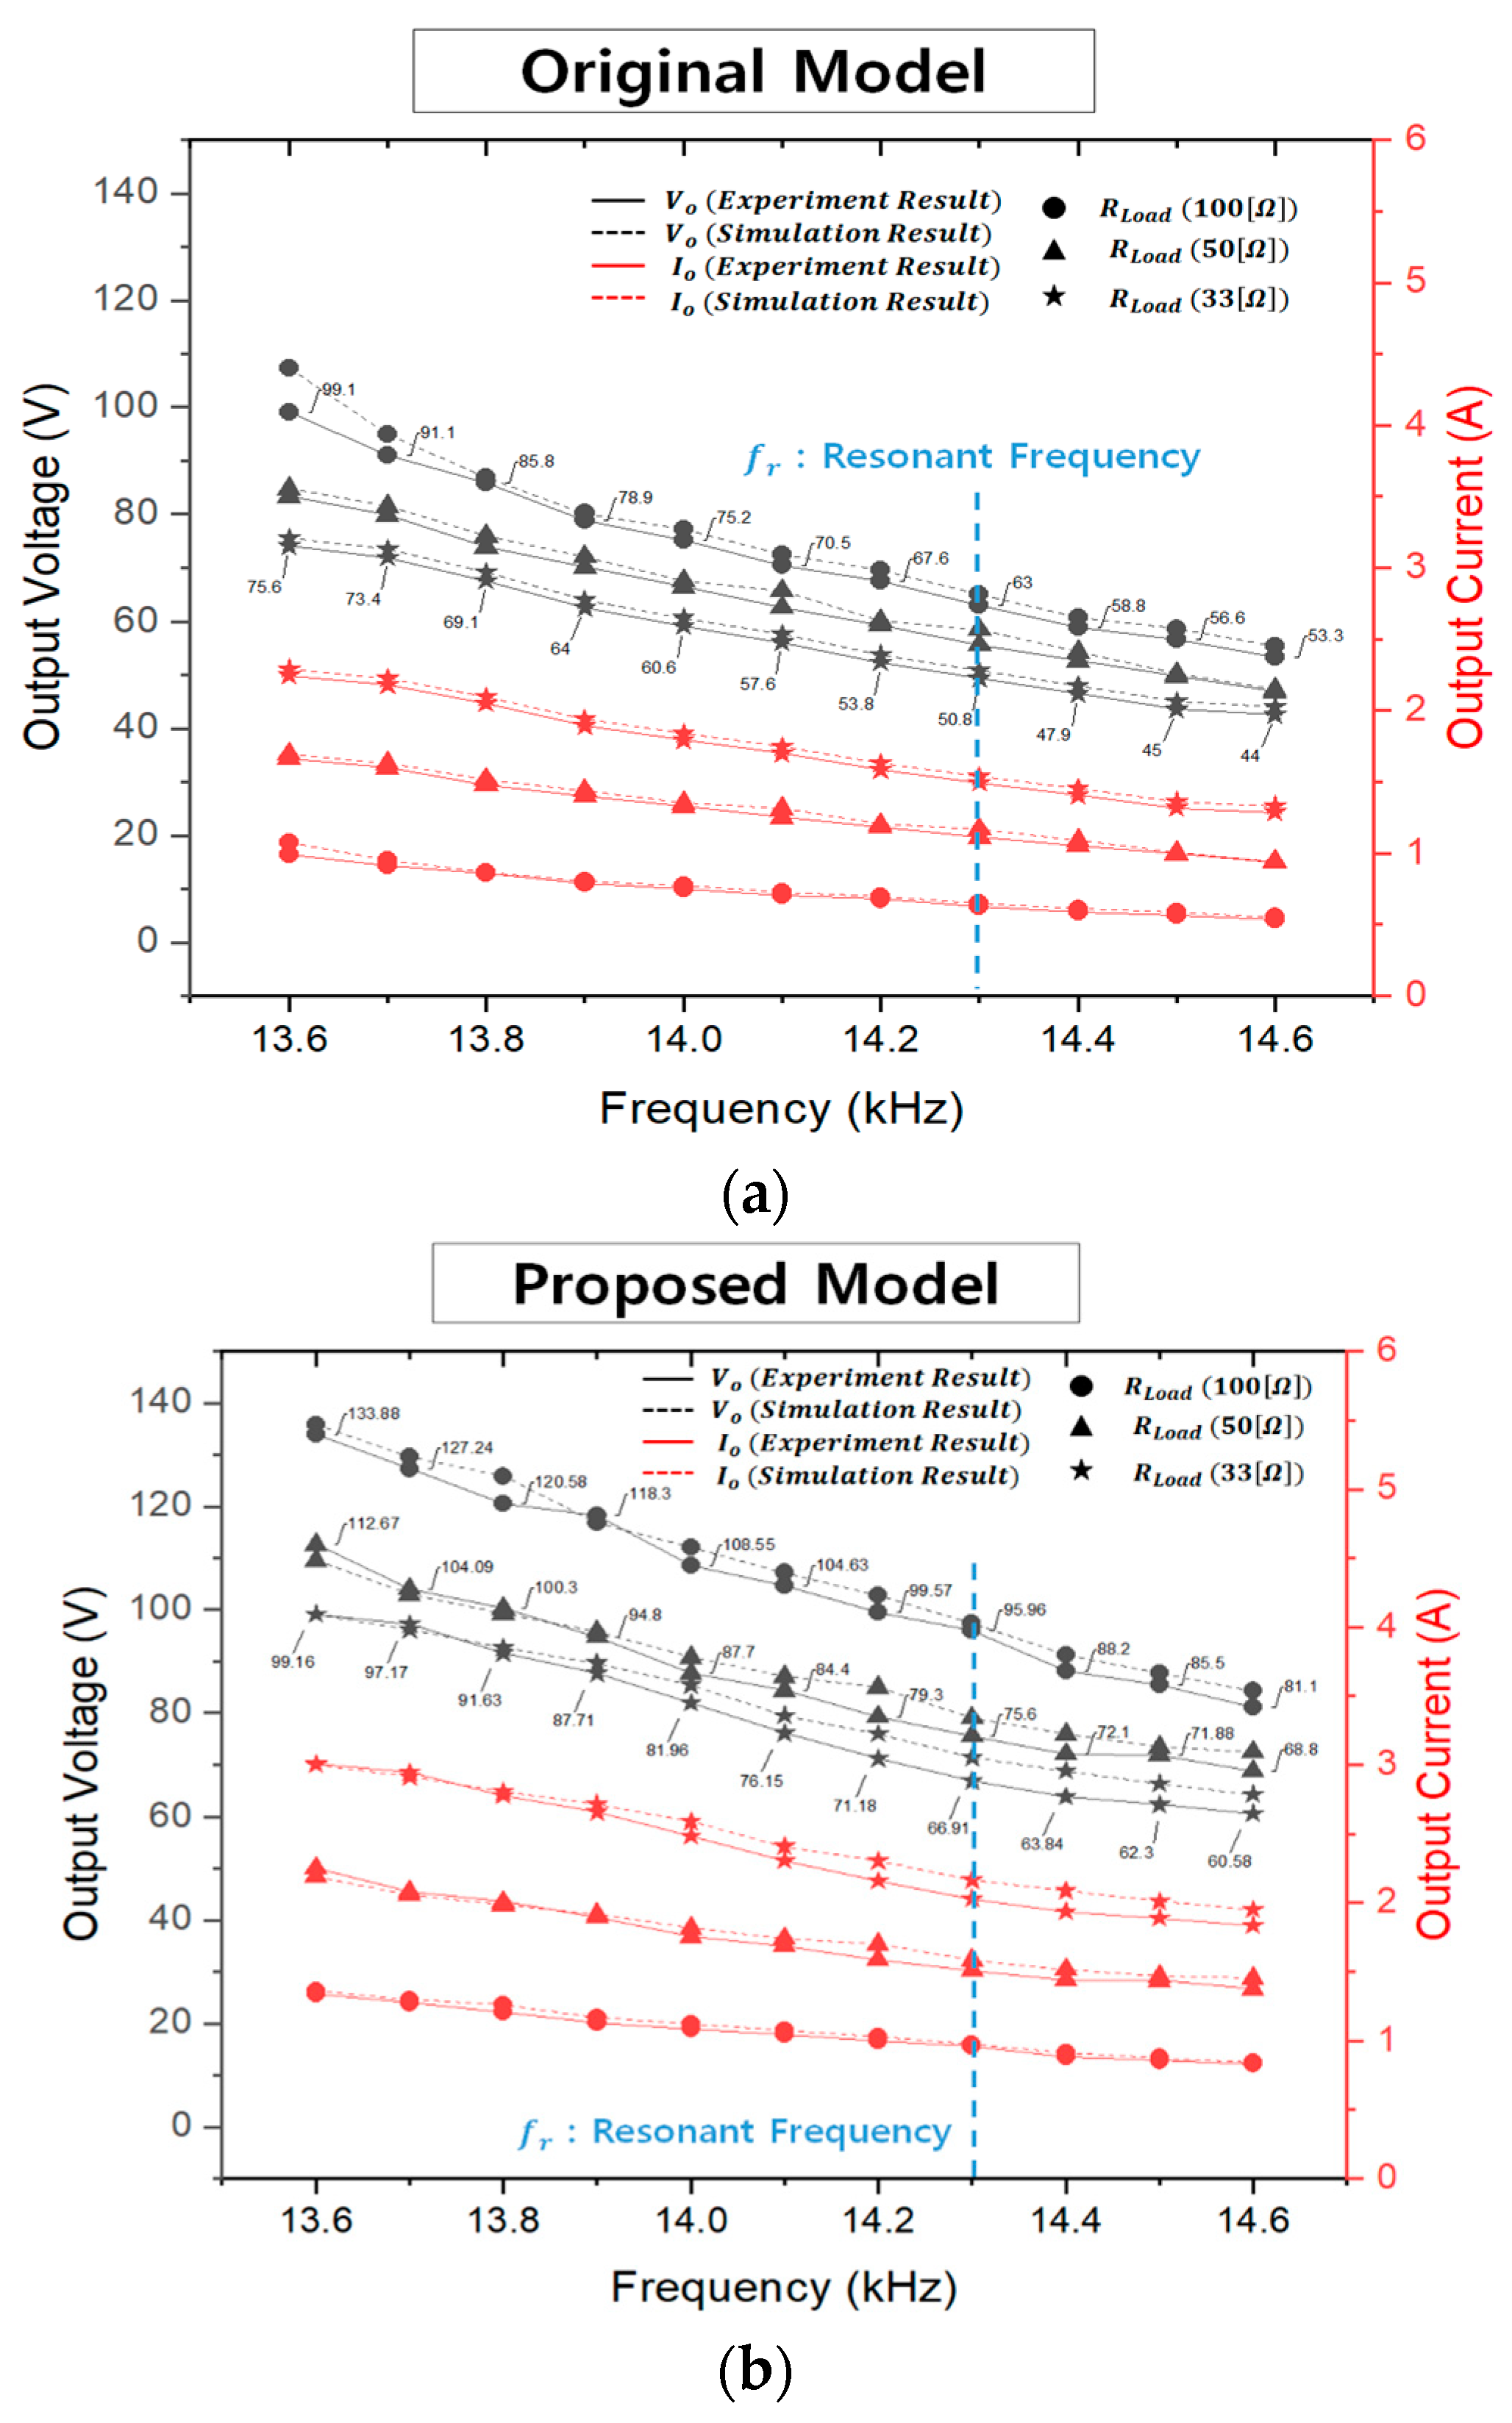
Furthermore, measurements of the output voltage and output current were taken over a range of ~1 kHz centered around the resonant frequency (4.3 kHz). These experimental data were then compared and validated against simulation results. A detailed comparison of these results is presented in Figure 18, which shows that the output specifications of the proposed model are higher than those of the original model under the same load conditions. This can be attributed to the various output degradation factors in the original model as indicated by the electromagnetic equivalent circuit-based analysis results described earlier.
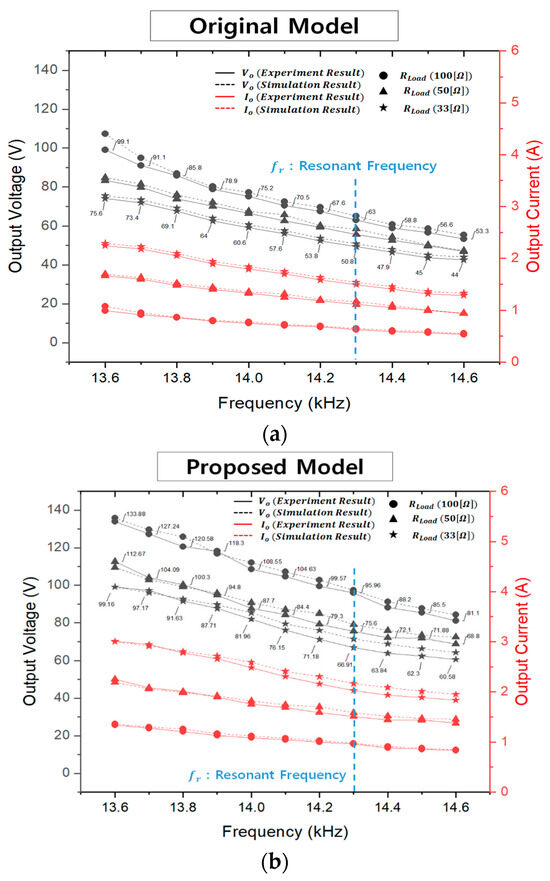
Figure 18.
Comparison of experiment and simulation results according to load conditions: (a) original model; (b) proposed model.
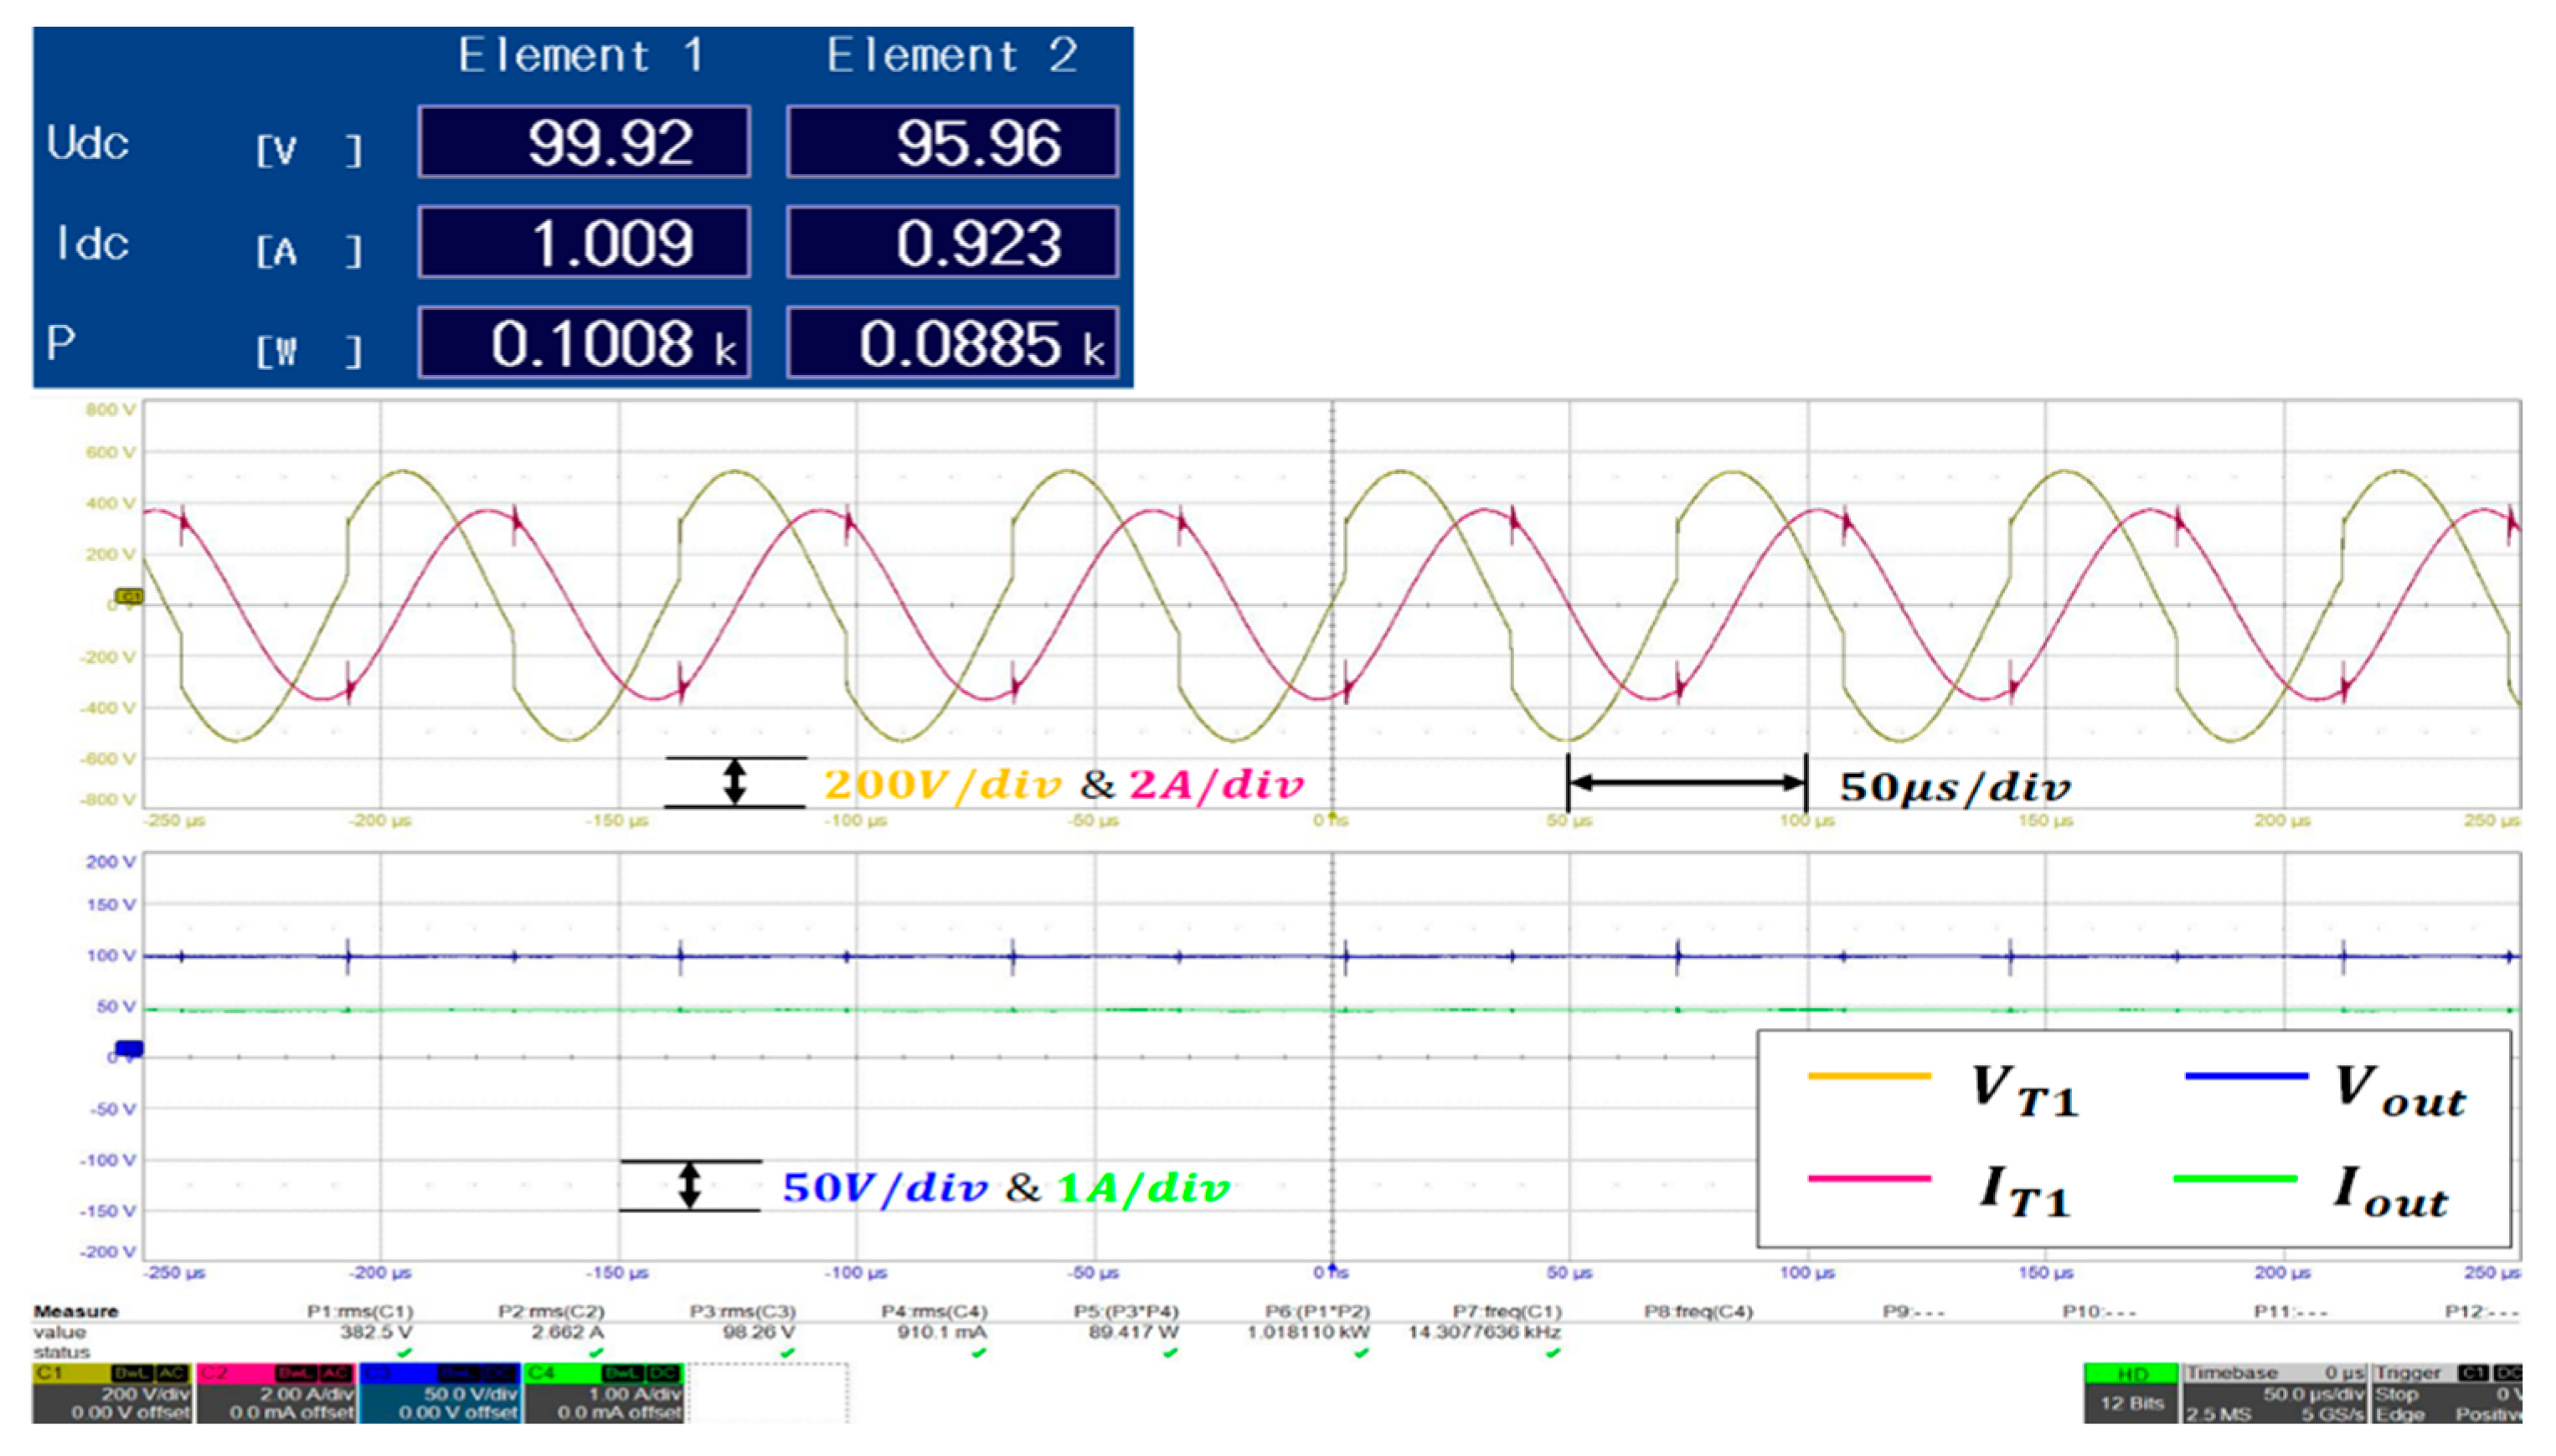
Among the experimental results, the output waveform for the operating frequency and load conditions that represent the maximum efficiency is presented in Figure 19. In this case, Element 1 corresponds to a power (W) of ~100.8 [W] according to the input voltage and current, while Element 2 represents a power of ~88.5 [W] depending on the output voltage and current. Specifically, at a load current of ~1 [A], the system exhibits a maximum efficiency of 87.8%, and the operating frequency at this point corresponds to the resonant frequency of 14.3 [kHz].
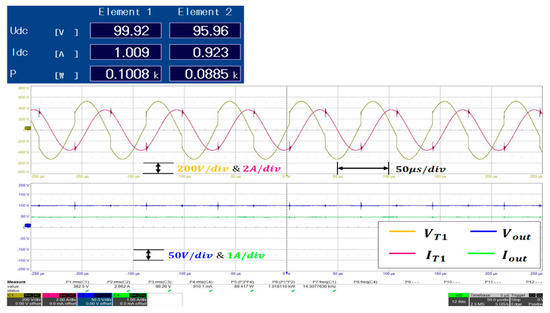
Figure 19.
Experimental waveforms of the output voltage and current at the resonant frequency.
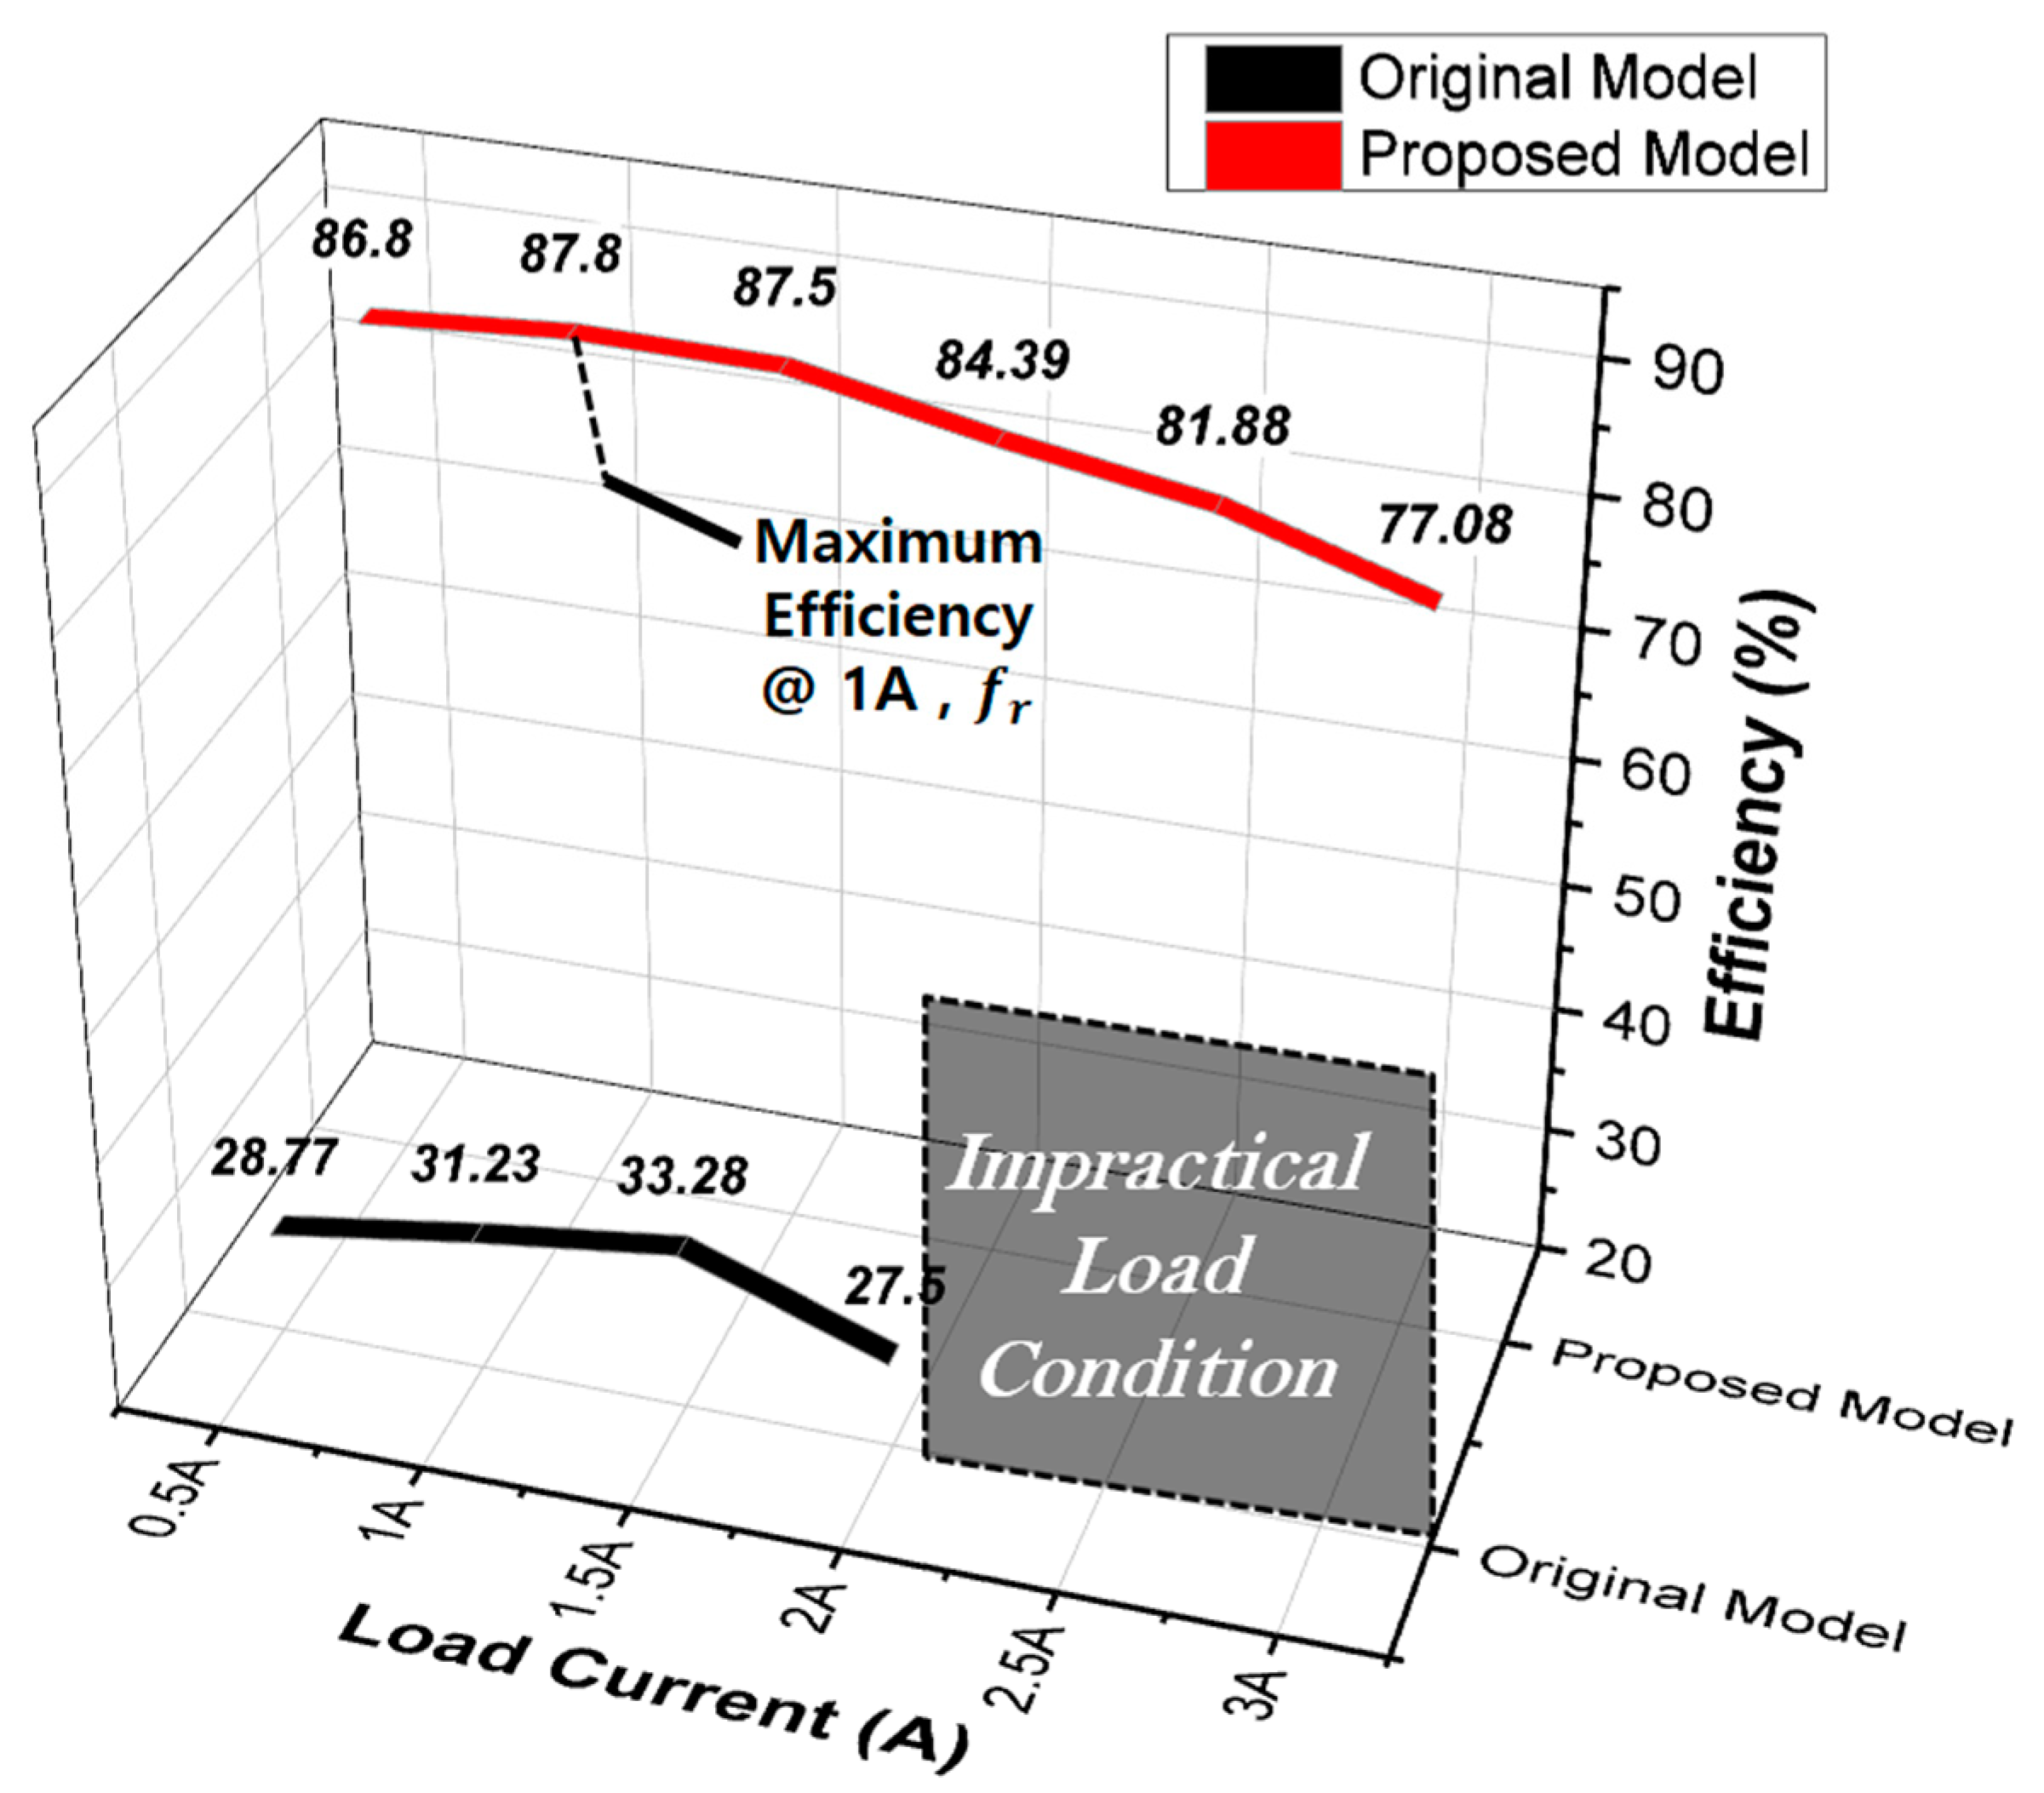
Furthermore, the efficiency results between the input and output for different load currents are presented in Figure 20. In the original model, achieving 1:1 voltage transfer according to load conditions was difficult even with frequency adjustments. However, with the proposed model, it was confirmed that through frequency adjustments, the output voltage could meet the WPT specifications even with a maximum load current of 3 [A], where the output voltage remained at 99.16 [V]. Additionally, for regions where the impact of voltage drop at higher load currents became significant in the original model, making it unable to meet the output specifications, efficiency calculations were omitted. This trend due to impractical load conditions in the original model is illustrated in Figure 20.
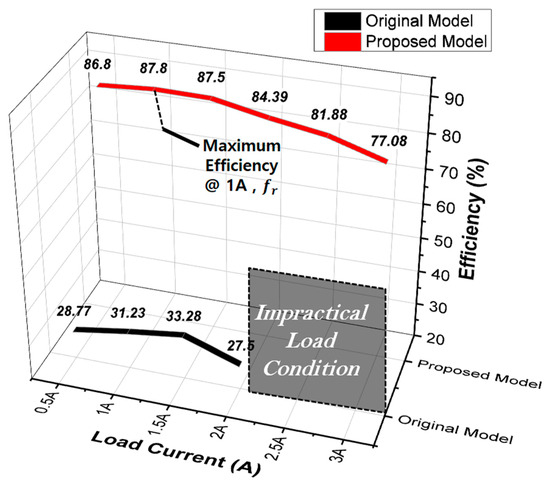
Figure 20.
Comparison of efficiency according to the load current conditions for each model.
Summarizing the implications of Figure 16, Figure 18 and Figure 20, in terms of the electrical aspect of wireless power transfer, adopting the CLLC topology enables 1:1 voltage transfer with a voltage gain of 0 dB around the resonance frequency. The original model shows a voltage gain of approximately −10 [dB] at Qr = 20 due to high core losses and a low coupling coefficient, and a severe voltage drop occurs as the load increases. However, the proposed model exhibits a voltage gain of about −2.5 [dB] at Qr = 20 as shown in Figure 16b, securing approximately twice the voltage gain compared to the original model. The Q values for the three resistive load conditions in Figure 16 are 1.136, 2.22, and 3.37 for the proposed model, meaning it maintains output stability even under higher load conditions than the original model. Additionally, the proposed model has higher voltage and current compared to the original model at the same operating frequency as shown in Figure 18. Furthermore, in the case of the proposed model, under the 33 [Ω] condition with a load current of 3 [A] based on 100 [V] output voltage, it achieves an output voltage of 99.16 [V] at approximately 13.6 [kHz]. Therefore, it confirms the ability to satisfy the desired output voltage conditions through frequency adjustment control. The original model exhibits efficiency only up to 2 [A] load current conditions in Figure 20. This is the reason why the original model cannot satisfy the desired electrical power at any operating frequency above 2 [A]. However, the proposed model can meet the specified output requirements up to 3 [A], and the efficiency for each load current condition can be observed in Figure 20.
Ultimately, the proposed model achieved a maximum output efficiency of 87.8%, which was ~163% higher than the original model’s maximum output efficiency of 33.28%.
4. Conclusions
In this work, we focused on the efficiency improvement of the power delivery component, the contactless transformer model, for a wireless power supply system used in track-type transportation equipment. To achieve this, magnetic equivalent circuit analysis and electromagnetic field FEA were conducted for the transformer model used in wireless power transfer. The study involved comparing and analyzing the magnetic equivalent resistance, magnetic coupling, and core losses of each model with the aim of enhancing the performance of wireless power transfer. To achieve this, the study involved improving the region of magnetic saturation observed in the original model from the perspective of magnetic equivalent circuits and FEM magnetic field characteristic analysis. The aim was to design a uniform magnetic path with an approximately two-times increase in magnetic equivalent resistance. In other words, the design allowed satisfying the same magnetic force with less magnetic saturation, thereby reducing the impact of magnetic saturation. Furthermore, the design of the proposed model was based on FEA results regarding core loss, resulting in an ~81% reduction compared to the original model.
On the basis of these results, the improvements in efficiency were incorporated into the simulation of the CLLC resonant converter for wireless power transfer. To validate the electronic characteristic analysis results and circuit modeling reflecting the efficiency improvement in the proposed model compared to the original model, experiments and simulation results were compared.
The magnetic equivalent circuit design and magnetic characteristic analysis conducted to enhance wireless power transfer efficiency were applied to electrical circuit modeling, and the results were confirmed through experiments. The proposed model achieved a maximum output efficiency of 87.8%, which was ~2.6 times higher than the original model’s maximum output efficiency of 33.28%. Additionally, the design aimed to achieve a more stable 1:1 voltage transfer ratio under the same input power conditions.
From the research results, it is expected that the analysis results from both electrical and magnetic perspectives, integrated into the design phase, will contribute to more optimized wireless power transfer system designs in the future, enhancing the overall efficiency of power transmission.
Author Contributions
Conceptualization, C.J. and T.K.; methodology, C.J.; software, C.J.; validation, C.J.; formal analysis, C.J.; writing—original draft preparation, C.J.; writing—review and editing, C.J.; visualization, C.J.; supervision, T.K. All authors have read and agreed to the published version of the manuscript.
Funding
This research is funded by the Financial Program for Student-Directed Creative Research at Changwon National University in 2023.
Data Availability Statement
Data are contained within the article.
Conflicts of Interest
The authors declare no conflict of interest.
References
- Chen, W.; Liu, J.; Chen, S.; Zhang, L. Energy Shaping Control for Wireless Power Transfer System in Automatic Guided Vehicles. Energies 2020, 13, 2959. [Google Scholar] [CrossRef]
- Van Mulders, J.; Delabie, D.; Lecluyse, C.; Buyle, C.; Callebaut, G.; Van der Perre, L.; De Strycker, L. Wireless Power Transfer: Systems, Circuits, Standards, and Use Cases. Sensors 2022, 22, 5573. [Google Scholar] [CrossRef] [PubMed]
- Lee, T.-S.; Huang, S.-J.; Wu, M.-J. Enhancement of Wireless Power Transfer for Automated Guided Vehicles Considering Disturbance Suppression. IEEE Access 2023, 11, 21508–21518. [Google Scholar] [CrossRef]
- Woo, H.; Park, J.-H.; Joo, C.; Ahn, H.; Kang, D.; Kim, T. Analysis of the Transformer Characteristics for an Integration System with a Wireless Power Transfer Device and Linear Motor. Energies 2021, 14, 6769. [Google Scholar] [CrossRef]
- Lee, J.Y.; Lee, I.J.; Kim, J.W.; Chang, J.H.; Kang, D.H.; Chung, S.U.; Hong, J.P. Contactless power transfer system combined with linear electric machine. In Proceedings of the 2007 International Conference on Electrical Machines and Systems (ICEMS), Seoul, Republic of Korea, 8–11 October 2007; pp. 1544–1548. [Google Scholar] [CrossRef]
- Joo, C.; Ahn, H.; Kim, T. A Study on the Design and Analysis of High Frequency Coil Shape for Contactless Power Transmission System Combined with Transfer System. J. Korea Ind. Inf. Syst. Res. 2021, 26, 41–54. [Google Scholar]
- Woo, H.; Park, J.-H.; Joo, C.; Ahn, H.; Kang, D.; Kim, T. Design of Wireless Power Transfer in Integration System of Wireless Power Transfer and Linear Motor; The Transactions of the Korean Institute of Electrical Engineers (KIEE): Seoul, Republic of Korea, 2020; pp. 40–44. [Google Scholar]
- Kang, J.; Ahn, J.; Kim, H.; Oh, S.; Lee, J.; Kim, C. A Study on the Levitation Force of Maglev Logistics Transport System Based on Magnetic Equivalent Circuits Considering the Fringing Effect; The Transaction of the Korean Institute of Electrical Engineers: Seoul, Republic of Korea, 2020; Volume 69P, pp. 243–247. [Google Scholar] [CrossRef]
- Bhatnagar, V.P. A Complete Course in ISC Physics; Pitambar Publishing: New Delhi, India, 1997; ISBN 978-81-209-0202-2. [Google Scholar]
- Veltman, A.; Pulle, D.W.J.; de Doncker, R.W. Fundamentals of Electrical Drivers, Power Systems; Springer International Publishing: Cham, Switzerland, 2016; ISBN 978-3-319-29409-4. [Google Scholar]
- Pavlek, M.; Donic, T. Simulation study of inductive heating of molybdenum sheet suited for rapid prototypes of rigid components of transport systems. ScienceDirect 2019, 40, 449–455. [Google Scholar] [CrossRef]
- Steinmetz, C.P. On the law of hysteresis. Proc. IEEE 1984, 72, 197–221. [Google Scholar] [CrossRef]
- Bertotti, G. General properties of power losses in soft ferromagnetic materials. IEEE Trans. Magn. 1988, 24, 621–630. [Google Scholar] [CrossRef]
- Westad, S. Loss Analysis in Laminated Iron Cores Using COMSOL Multiphysics and LiveLink for Matlab, NTNU. 2018. Available online: https://hdl.handle.net/11250/2574467 (accessed on 22 November 2018).
- Wick, M.; Jüttner, M.; Rucker, W.M. Harmonic balanced Jiles-Atherton hysteresis implementation for finite element simulation. COMPEL—Int. J. Comput. Math. Electr. Electron. Eng. 2017, 36, 1386–1395. [Google Scholar] [CrossRef]
- Wen, S.; Chen, F.; Xu, W.; Xiu, Z.; Xiu, L.; Yi, Y.; Xiao, J.; Jian, Y. Numerical Study of Electromagnetic Loss and Heat Transfer in an Oil-Immersed Transformer. Math. Probl. Eng. 2020, 2020, 6514650. [Google Scholar] [CrossRef]
- Deshmukh, S.; Iqbal, A.; Islam, S.; Khan, I.; Marzband, M.; Rahman, S.; Al-Wahedi, A.M. Review on classification of resonant converters for electric vehicle application. Energy Rep. 2022, 8, 1091–1113. [Google Scholar] [CrossRef]
- Kang, M.-H.; Joo, D.-M.; Woo, D.-G.; Lee, B.-K. Design of Resonant Network of SP topology for Wireless Power Transfer System. In Proceedings of the KIPE Conference 2015, Seoul, Republic of Korea, 1–5 June 2015; pp. 38–39. [Google Scholar]
- Jin, N.-Z.; Feng, Y.; Chen, Z.-Y.; Wu, X.-G. Bidirectional CLLLC Resonant Converter Based on Frequency-Conversion and Phase-Shift Hybrid Control. Electronics 2023, 12, 1605. [Google Scholar] [CrossRef]
- Shin, Y.; Ah, S. Principle of Power Transfer between Coils and the Method of Selecting Resonant Topologies in a Wireless Power Transfer System. J. Korean Inst. Electromagn. Eng. Sci. 2022, 33, 509–524. [Google Scholar] [CrossRef]
Disclaimer/Publisher’s Note: The statements, opinions and data contained in all publications are solely those of the individual author(s) and contributor(s) and not of MDPI and/or the editor(s). MDPI and/or the editor(s) disclaim responsibility for any injury to people or property resulting from any ideas, methods, instructions or products referred to in the content. |
© 2023 by the authors. Licensee MDPI, Basel, Switzerland. This article is an open access article distributed under the terms and conditions of the Creative Commons Attribution (CC BY) license (https://creativecommons.org/licenses/by/4.0/).


