Decomposition Analysis of Regional Electricity Consumption Drivers Considering Carbon Emission Constraints: A Comparison of Guangdong and Yunnan Provinces in China
Abstract
:1. Introduction
2. Literature Review
3. Methods and Data Sources
3.1. Decomposition Modeling of Electricity Consumption Drivers
3.1.1. LMDI Decomposition Model of Electricity Consumption in Industrial Sector
3.1.2. LMDI Decomposition Model of Electricity Consumption in Residential Sector
3.2. Data Sources
4. Results and Discussion
4.1. Historical Trends in Electricity Consumption
4.2. Cumulative Effects of Drivers
4.3. Year-to-Year Effects of Drivers
4.4. Decomposition Analysis of Drivers by Subsector
4.4.1. Relationship between Driver Changes and Corresponding Effects
4.4.2. Electrification Level Effect
4.4.3. Energy Consumption Intensity Effect
4.4.4. Carbon Emission Intensity Effect
4.4.5. Industrial Structure Effect
4.4.6. Labor Productivity Level Effect and Residential Income Per Capita Effect
4.4.7. Population-Related Effects
4.4.8. Spatial Difference in Effect by Subsector
5. Conclusions and Policy Implications
5.1. Conclusions
- (1)
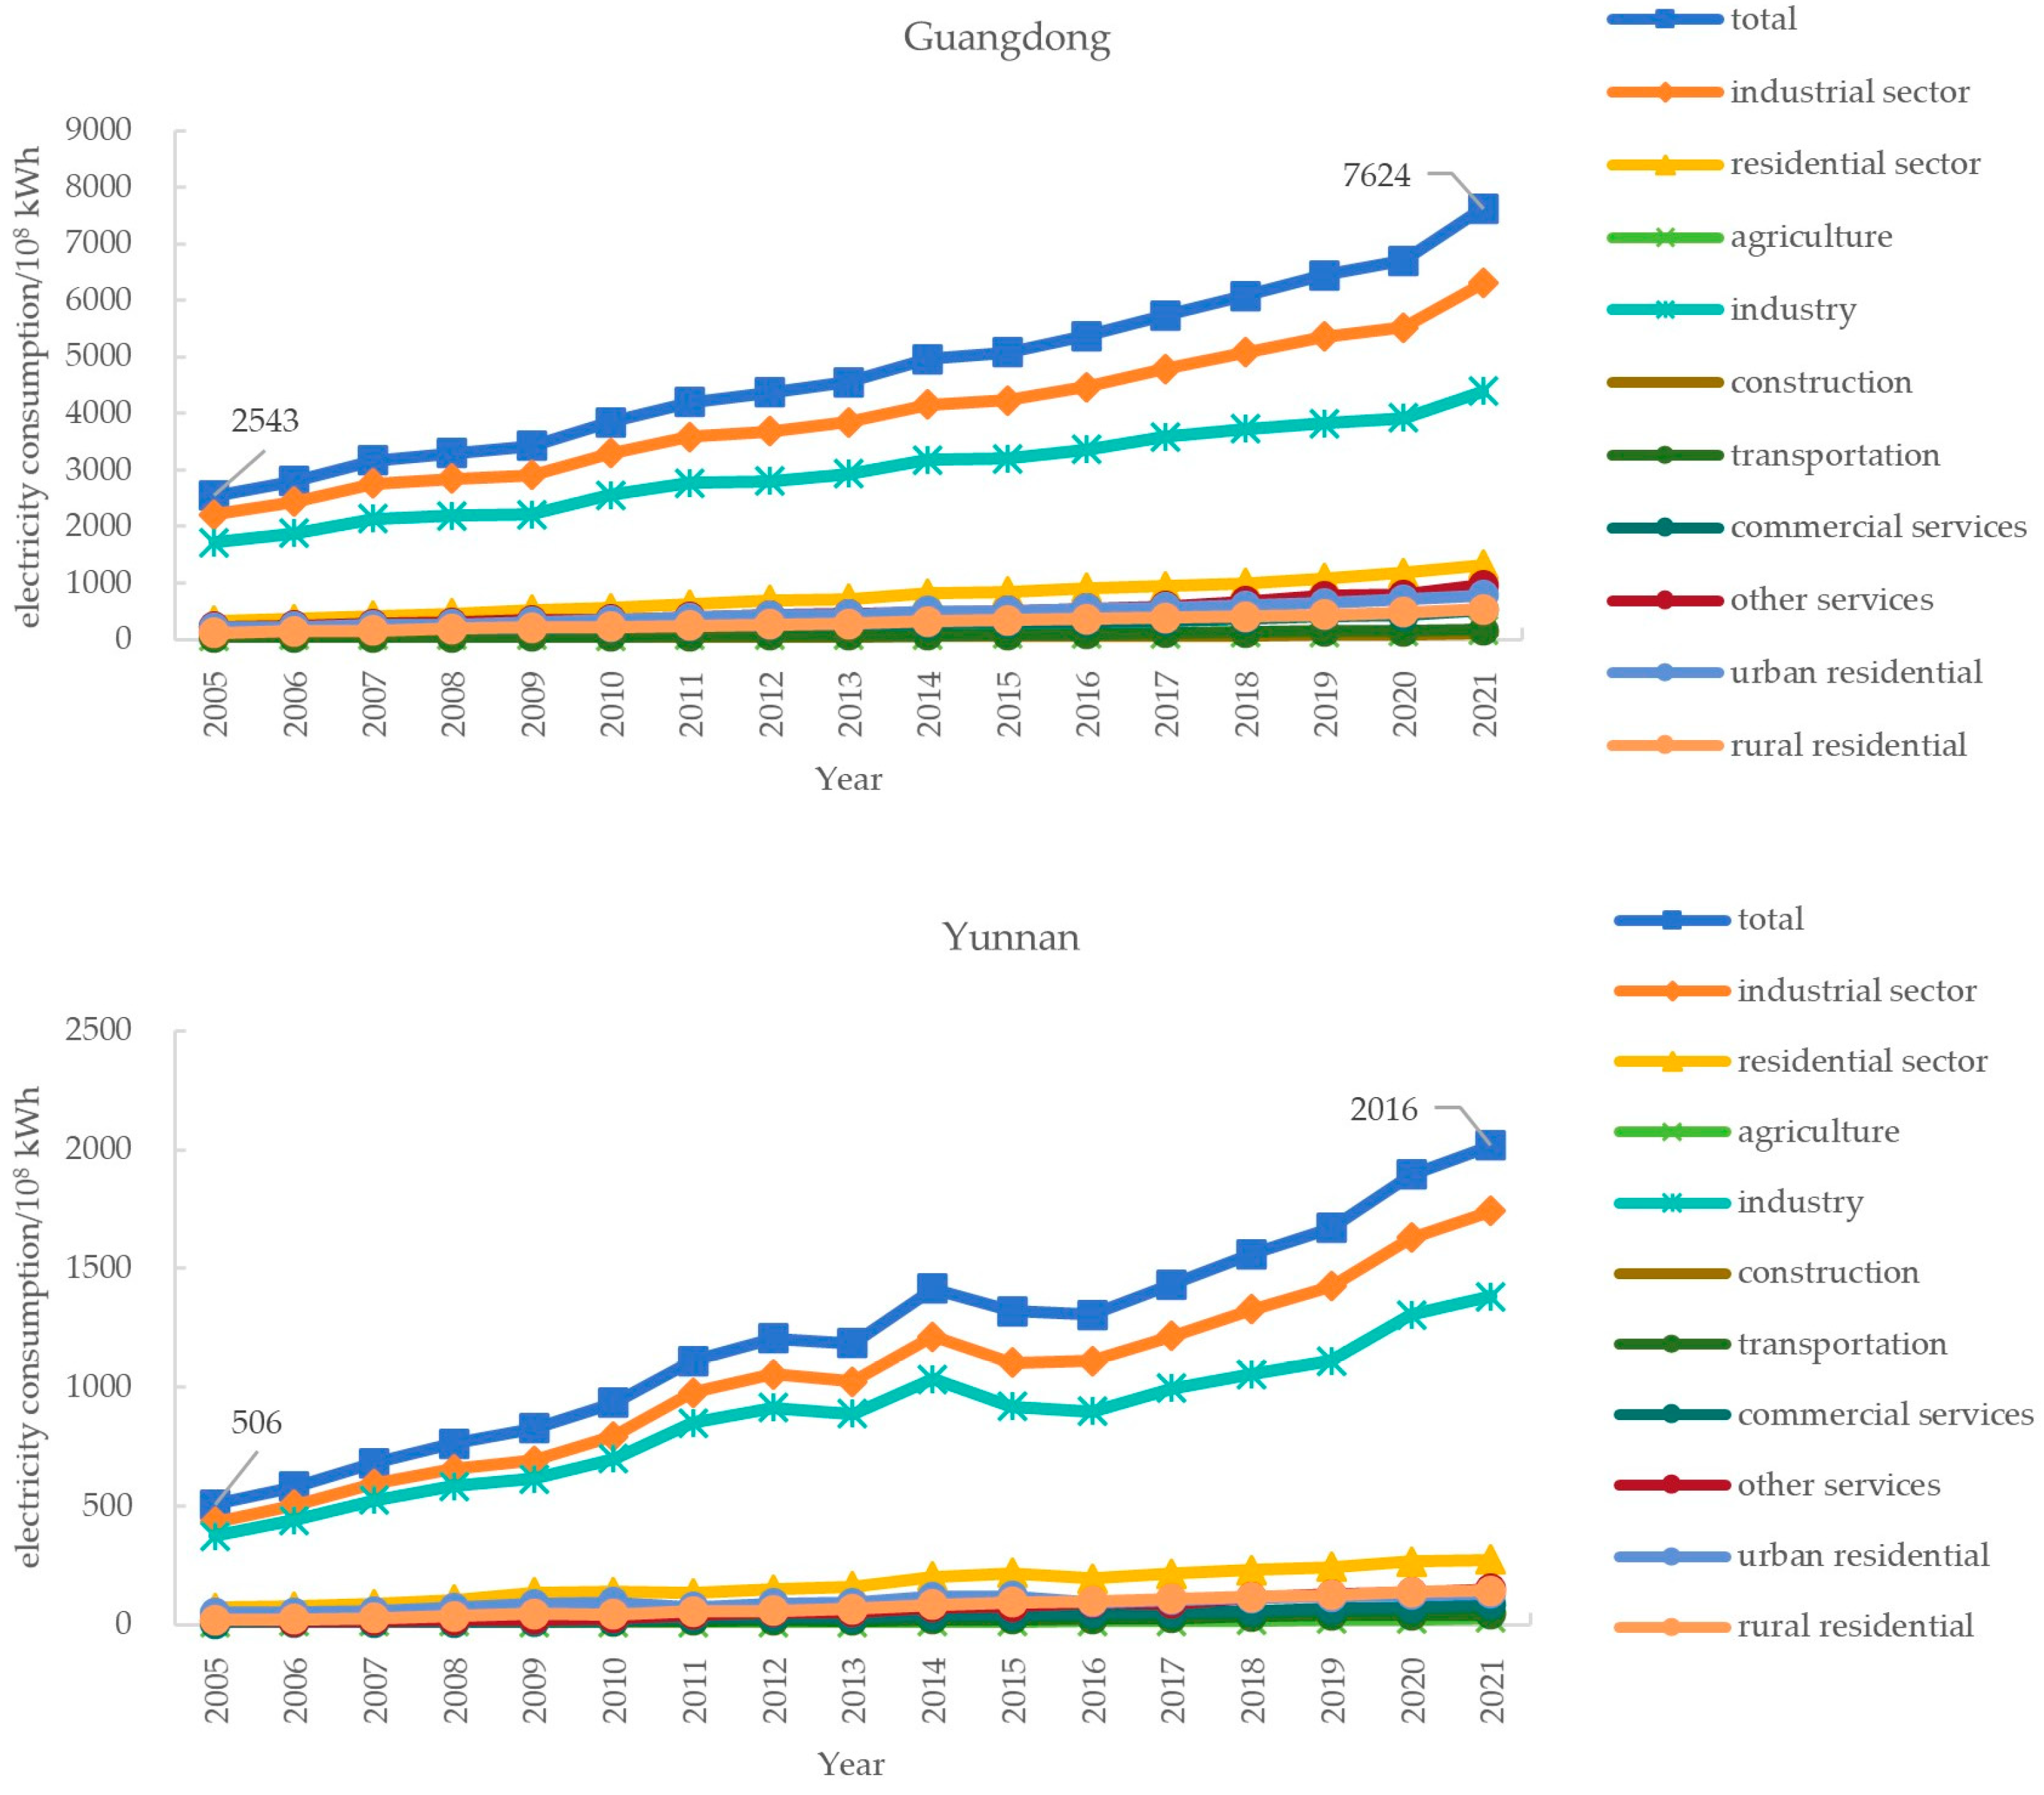
- During the period of 2005–2021, the total final electricity consumption growth in Guangdong (5093 × 108 kWh) is much higher than that in Yunnan (1510 × 108 kWh), but the average annual growth rate in Guangdong (7.1%) is lower than Yunnan (9.0%). The industrial sector accounted for a primary share of total final electricity consumption relative to the residential sector, and the share of industrial electricity consumption went down slowly in Guangdong and fluctuated in Yunnan. In addition, the growth of industry subsector electricity consumption is the main contributor to growth in total final electricity consumption, but the share of industry subsector electricity consumption went down slowly both in Guangdong and Yunnan;
- (2)
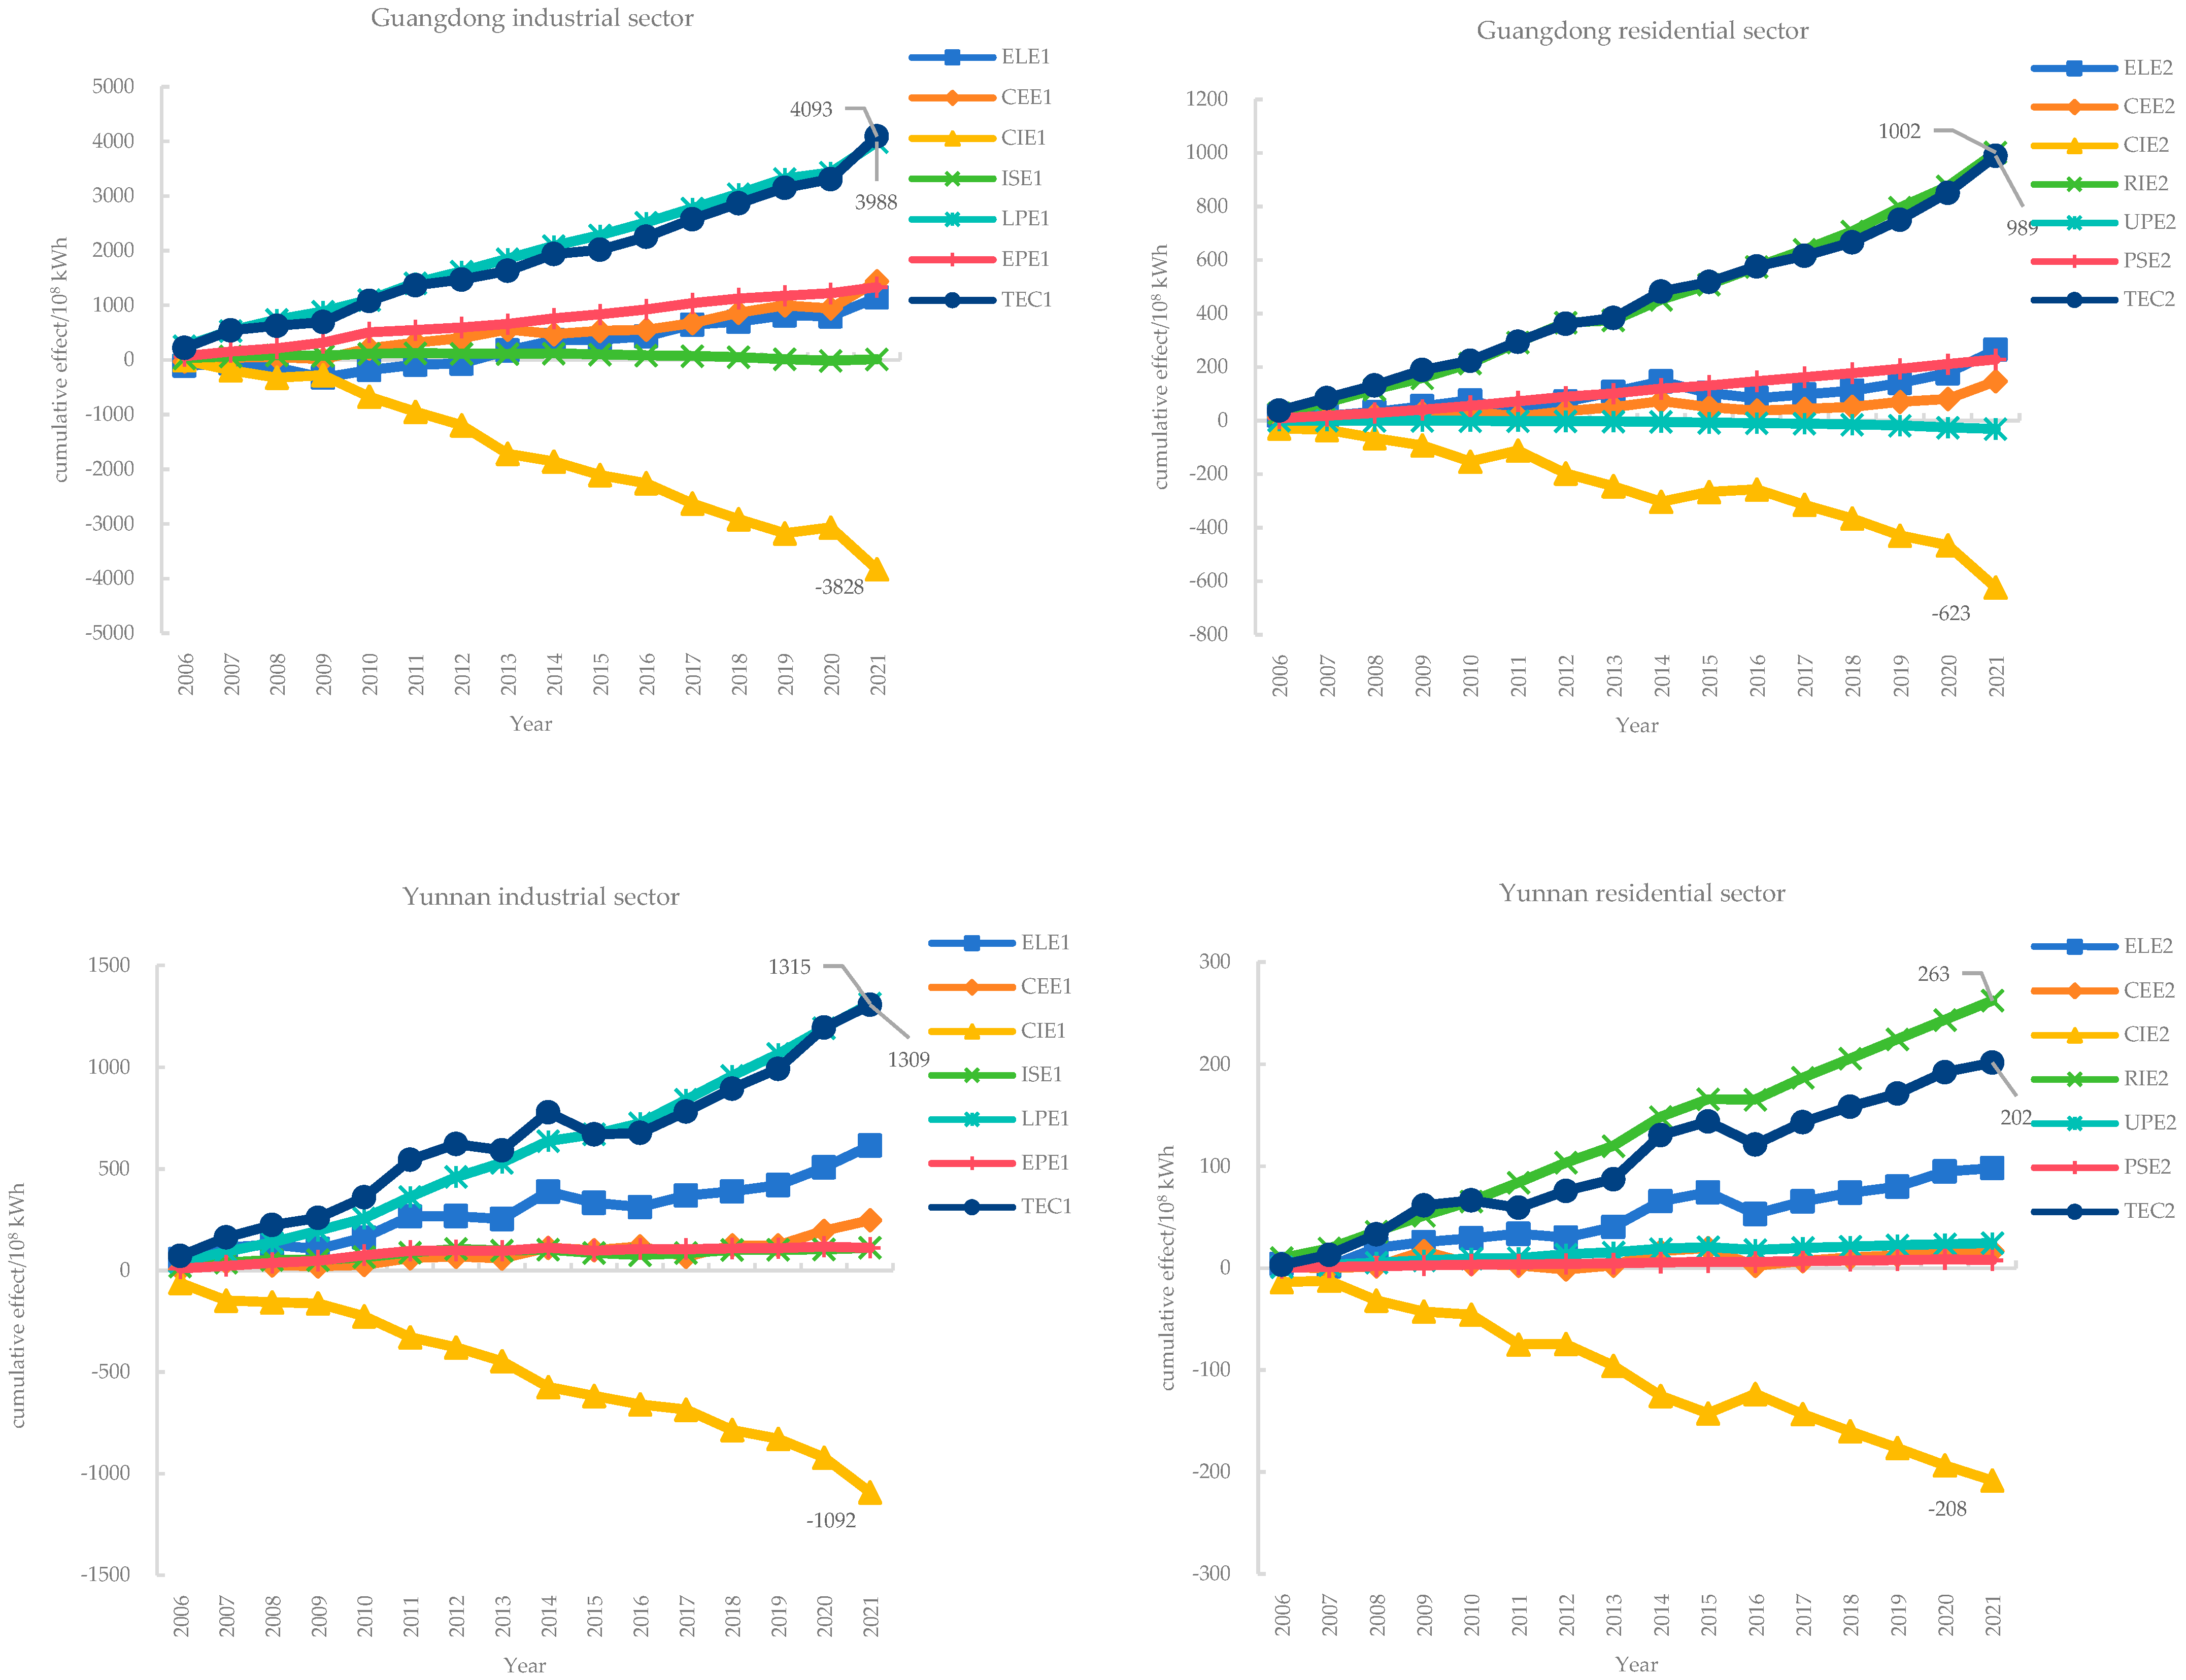
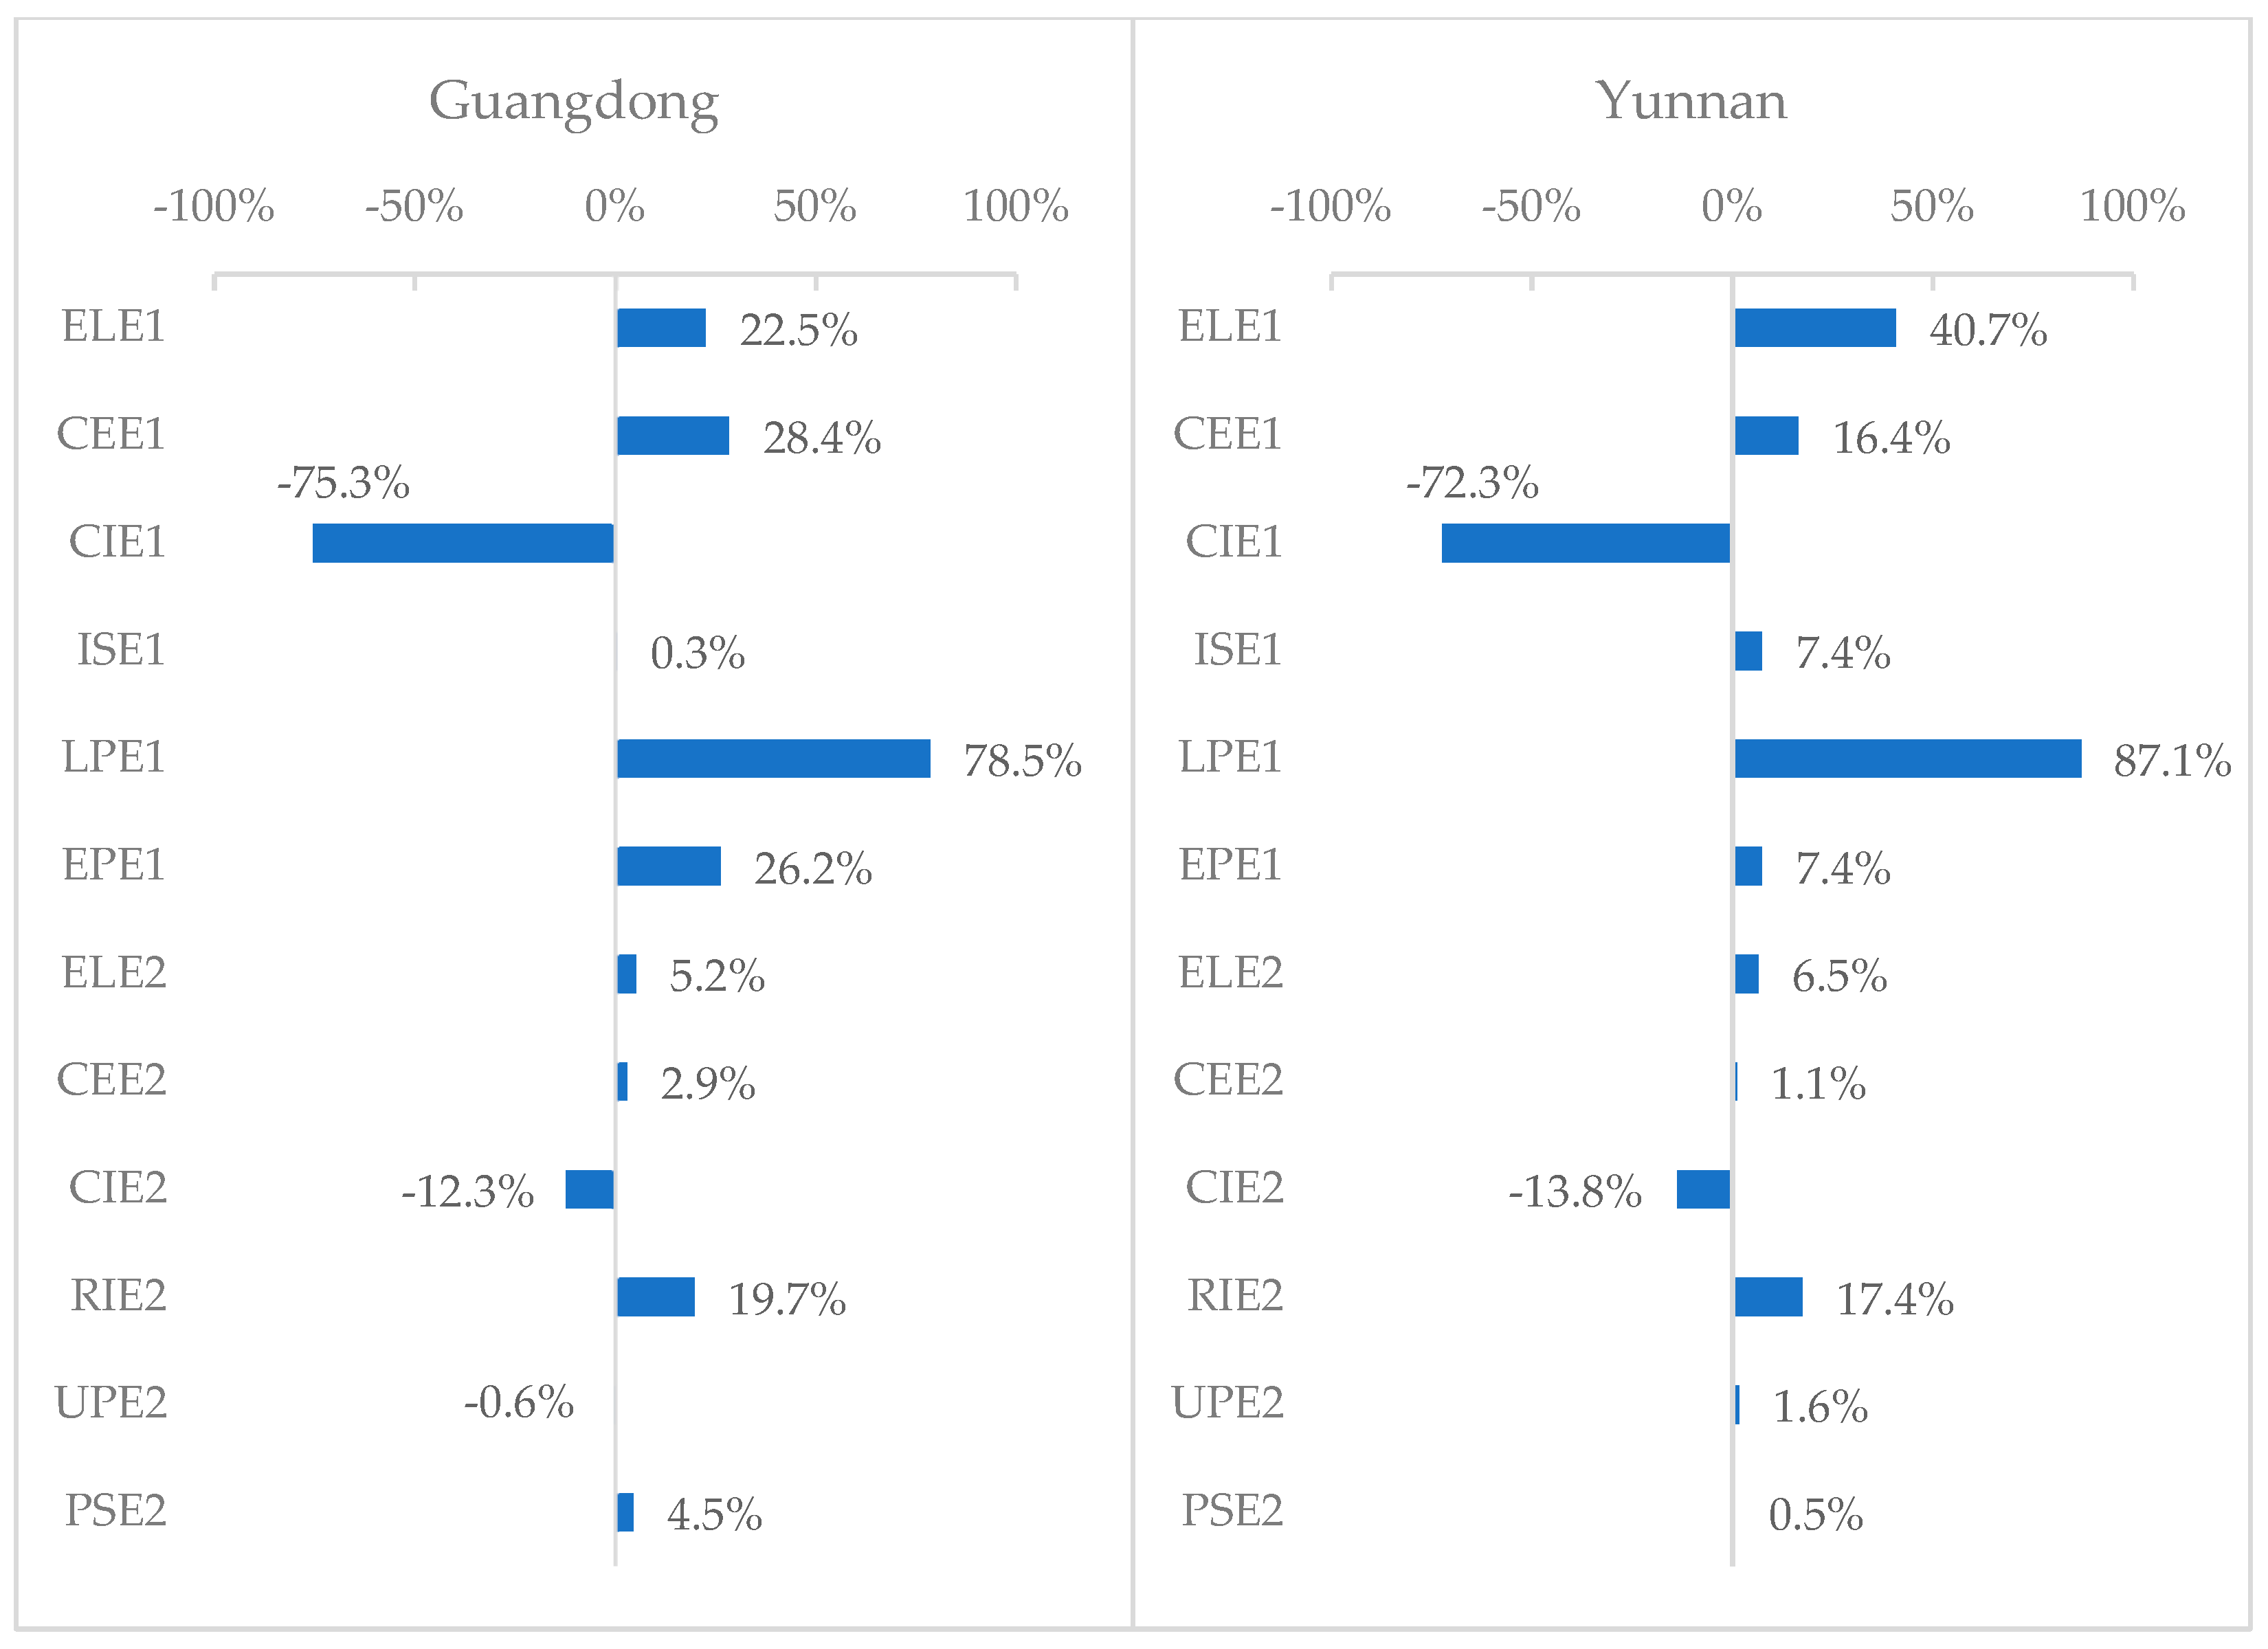
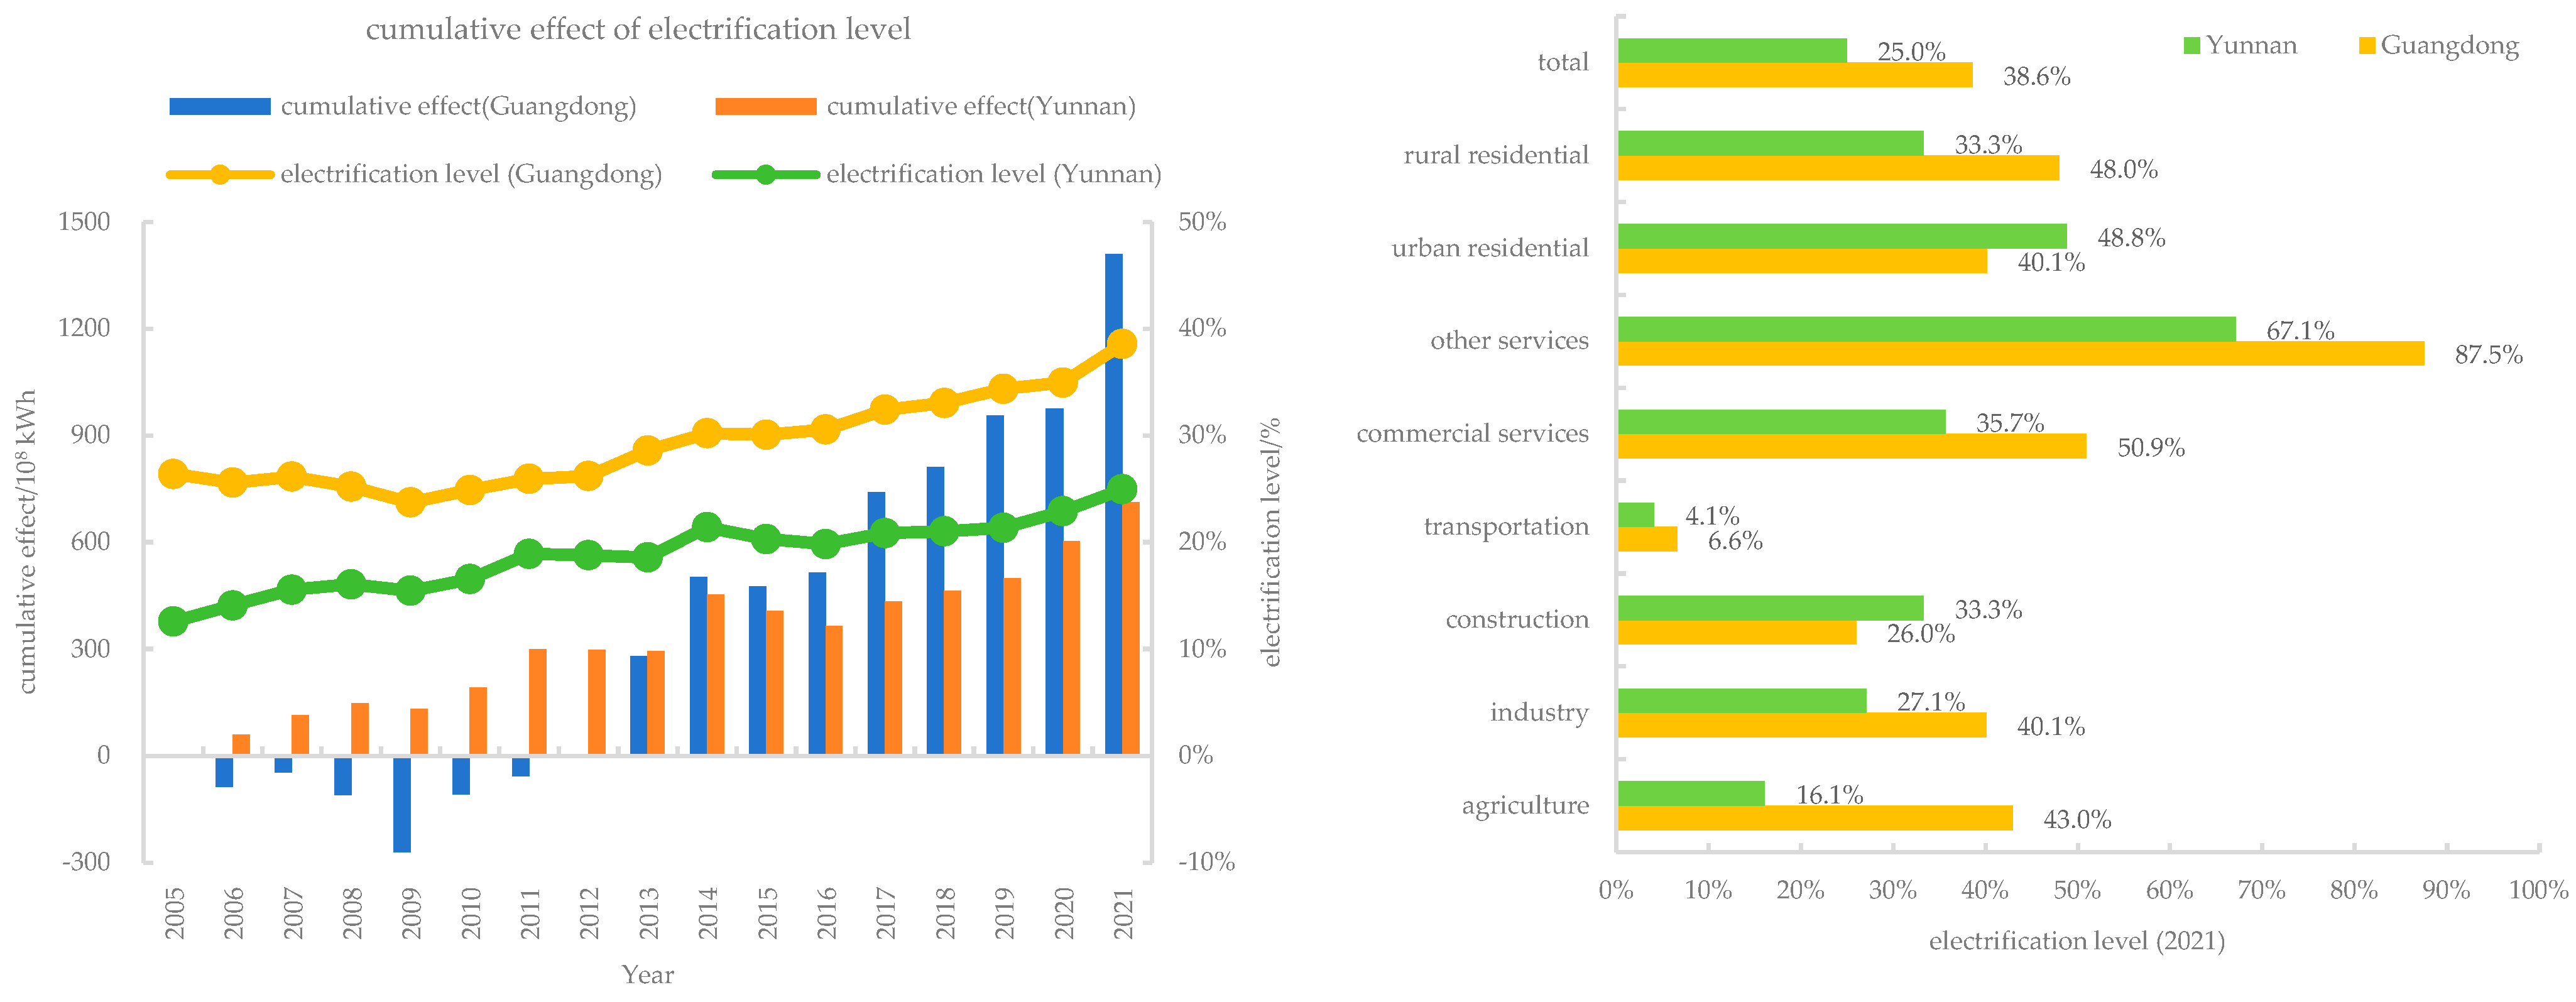
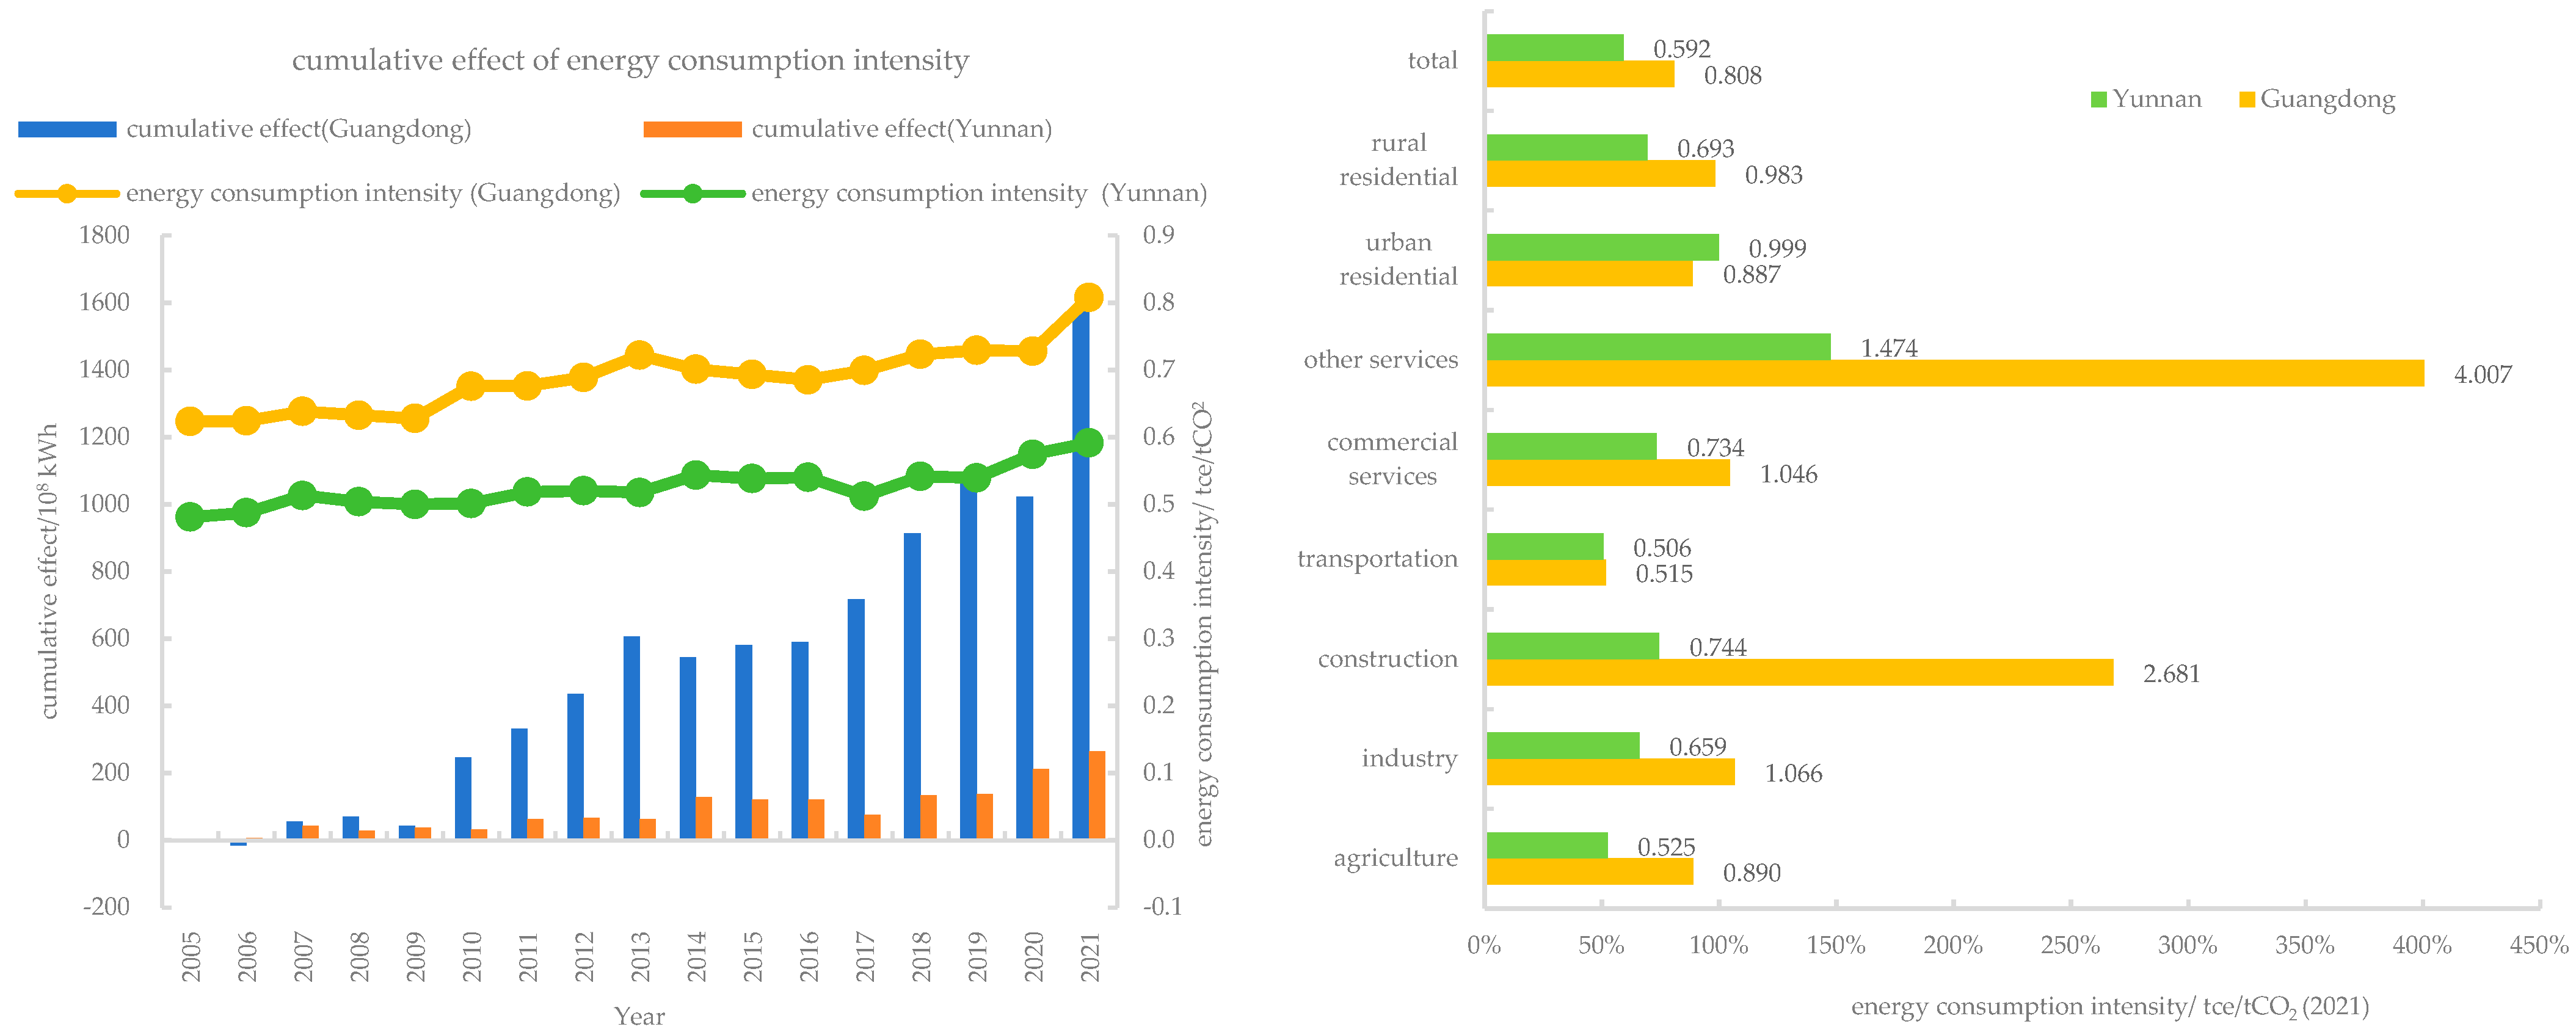
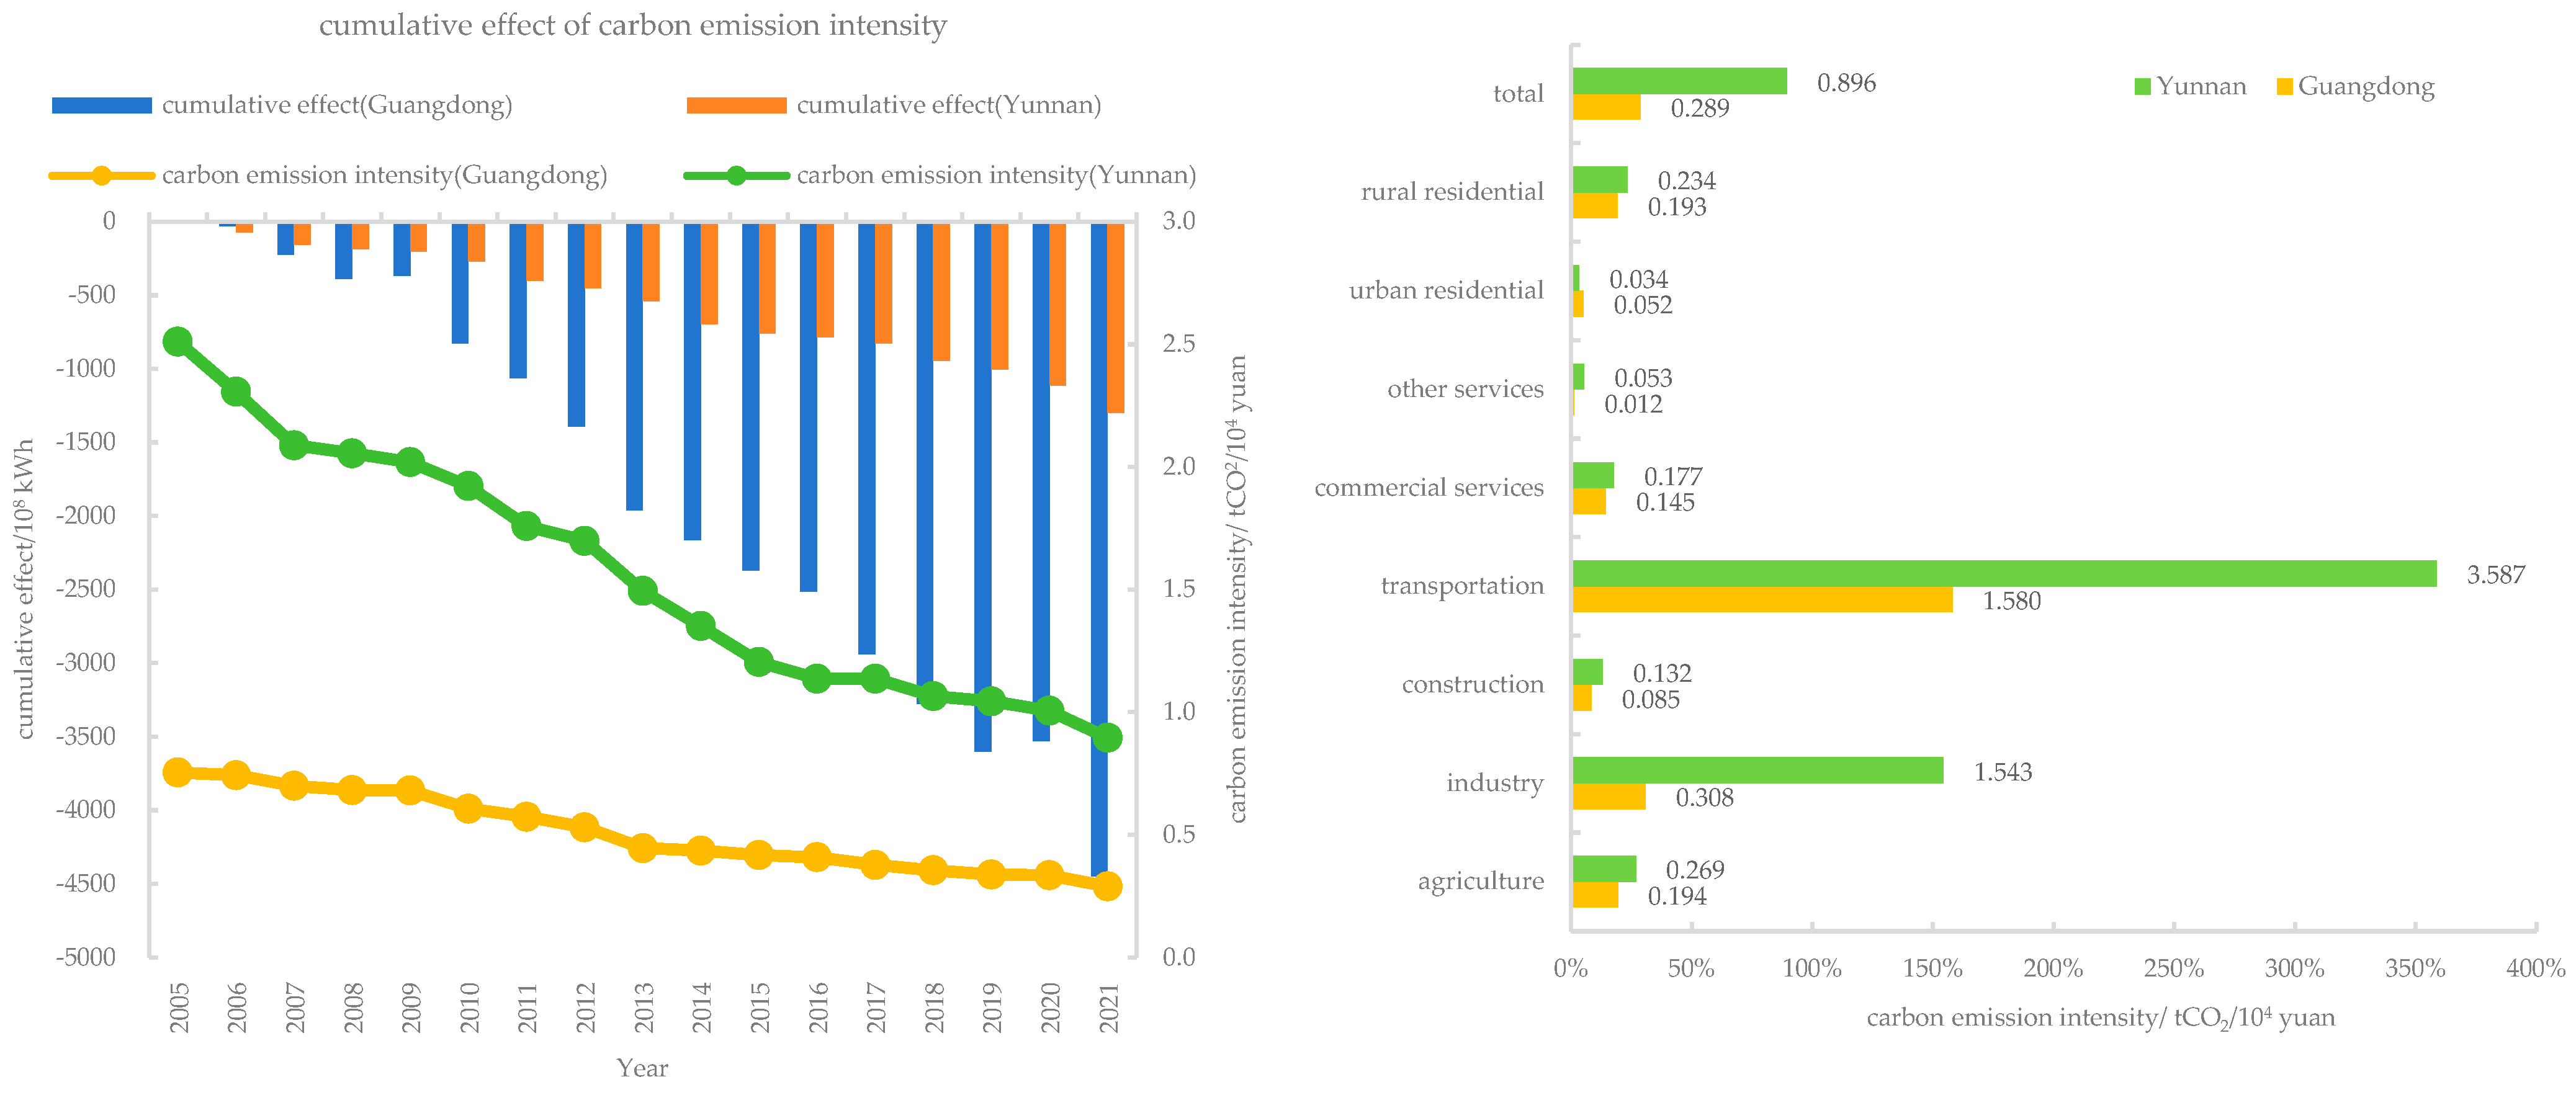
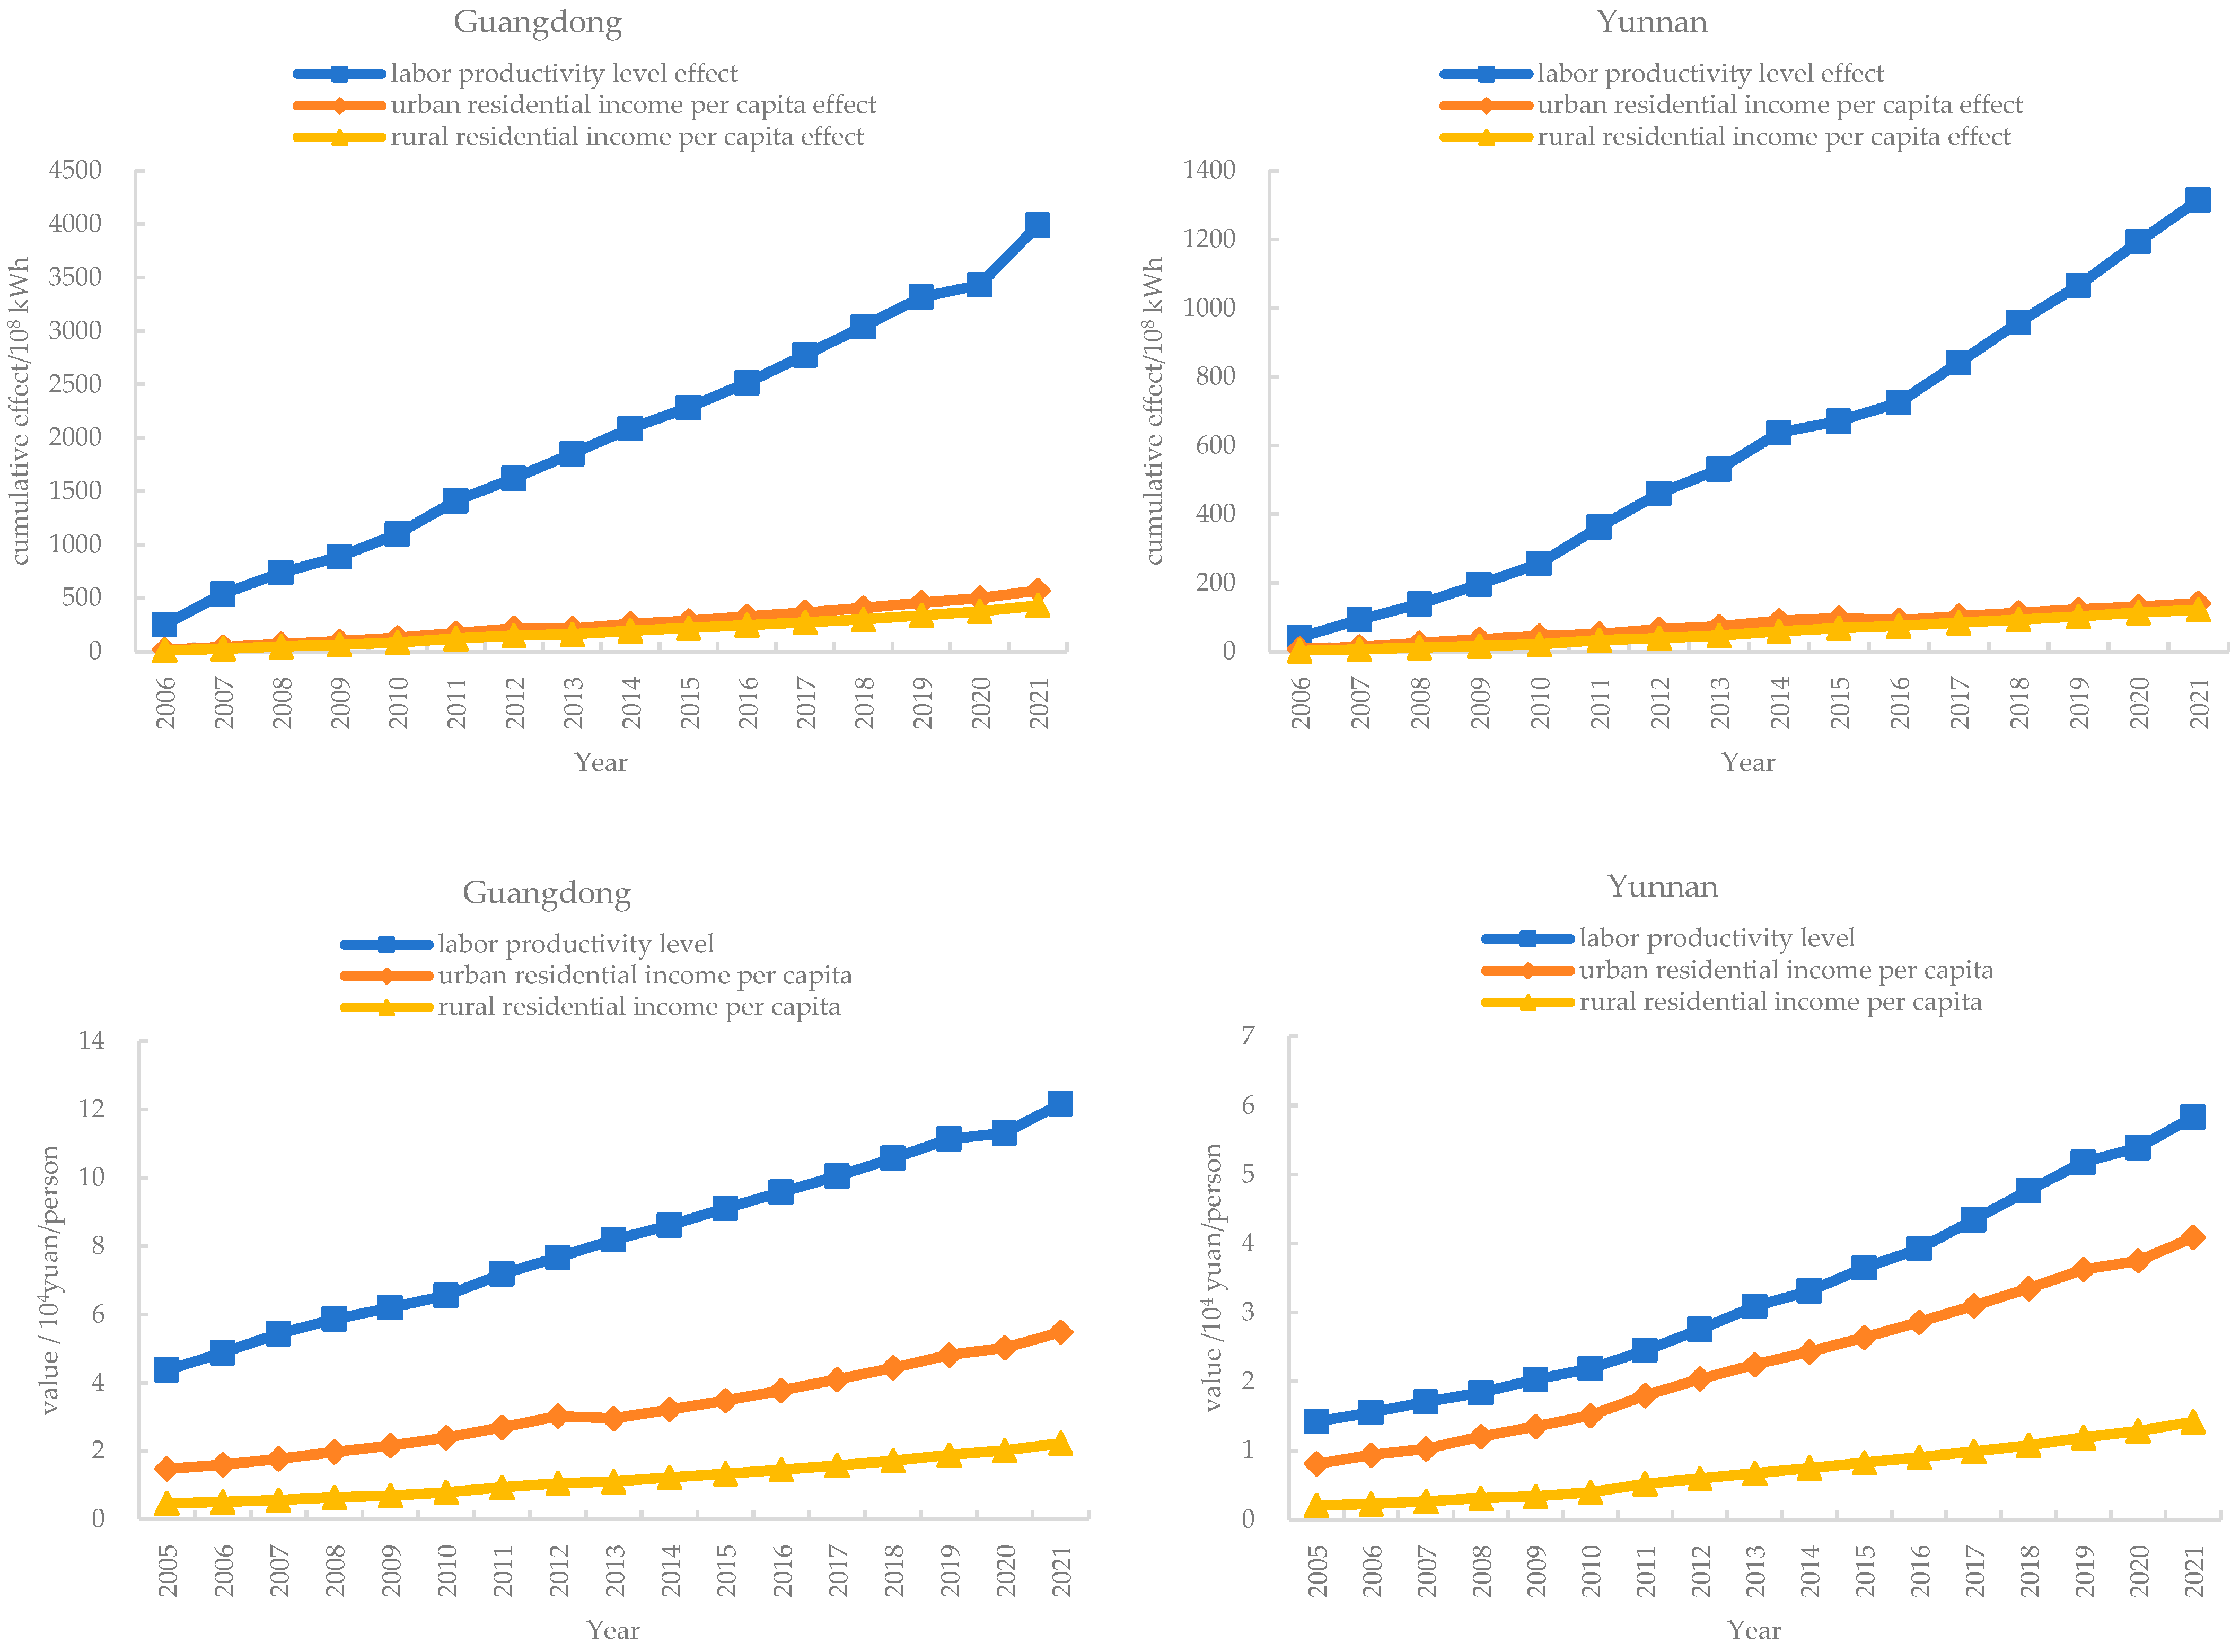
- Except for the carbon emission intensity effect and urban–rural population structure effect, all other cumulative effects contributed to the growth of total final electricity consumption in Guangdong and Yunnan during 2005–2021. The industrial labor productivity level effect is the primary driver that increases total final electricity consumption (Guangdong: 3988 × 108 kWh or 78.5%, Yunnan: 1315 × 108 kWh or 87.1%), and industrial carbon emission intensity effect is the primary driver that decreases total final electricity consumption (Guangdong: −3828 × 108 or −75.3%, Yunnan: −1092 × 108 kWh or −72.3%). The industrial energy consumption intensity effect and employed population size effect are the second and third drivers that increase industrial electricity consumption in Guangdong, while the industrial electrification level effect and industrial energy consumption intensity effect are the second and third drivers that increase industrial electricity consumption in Yunnan. The industrial structure effect in Guangdong shows an upward and then a downward trend, while in Yunnan, it shows an upward trend during 2005–2021;
- (3)
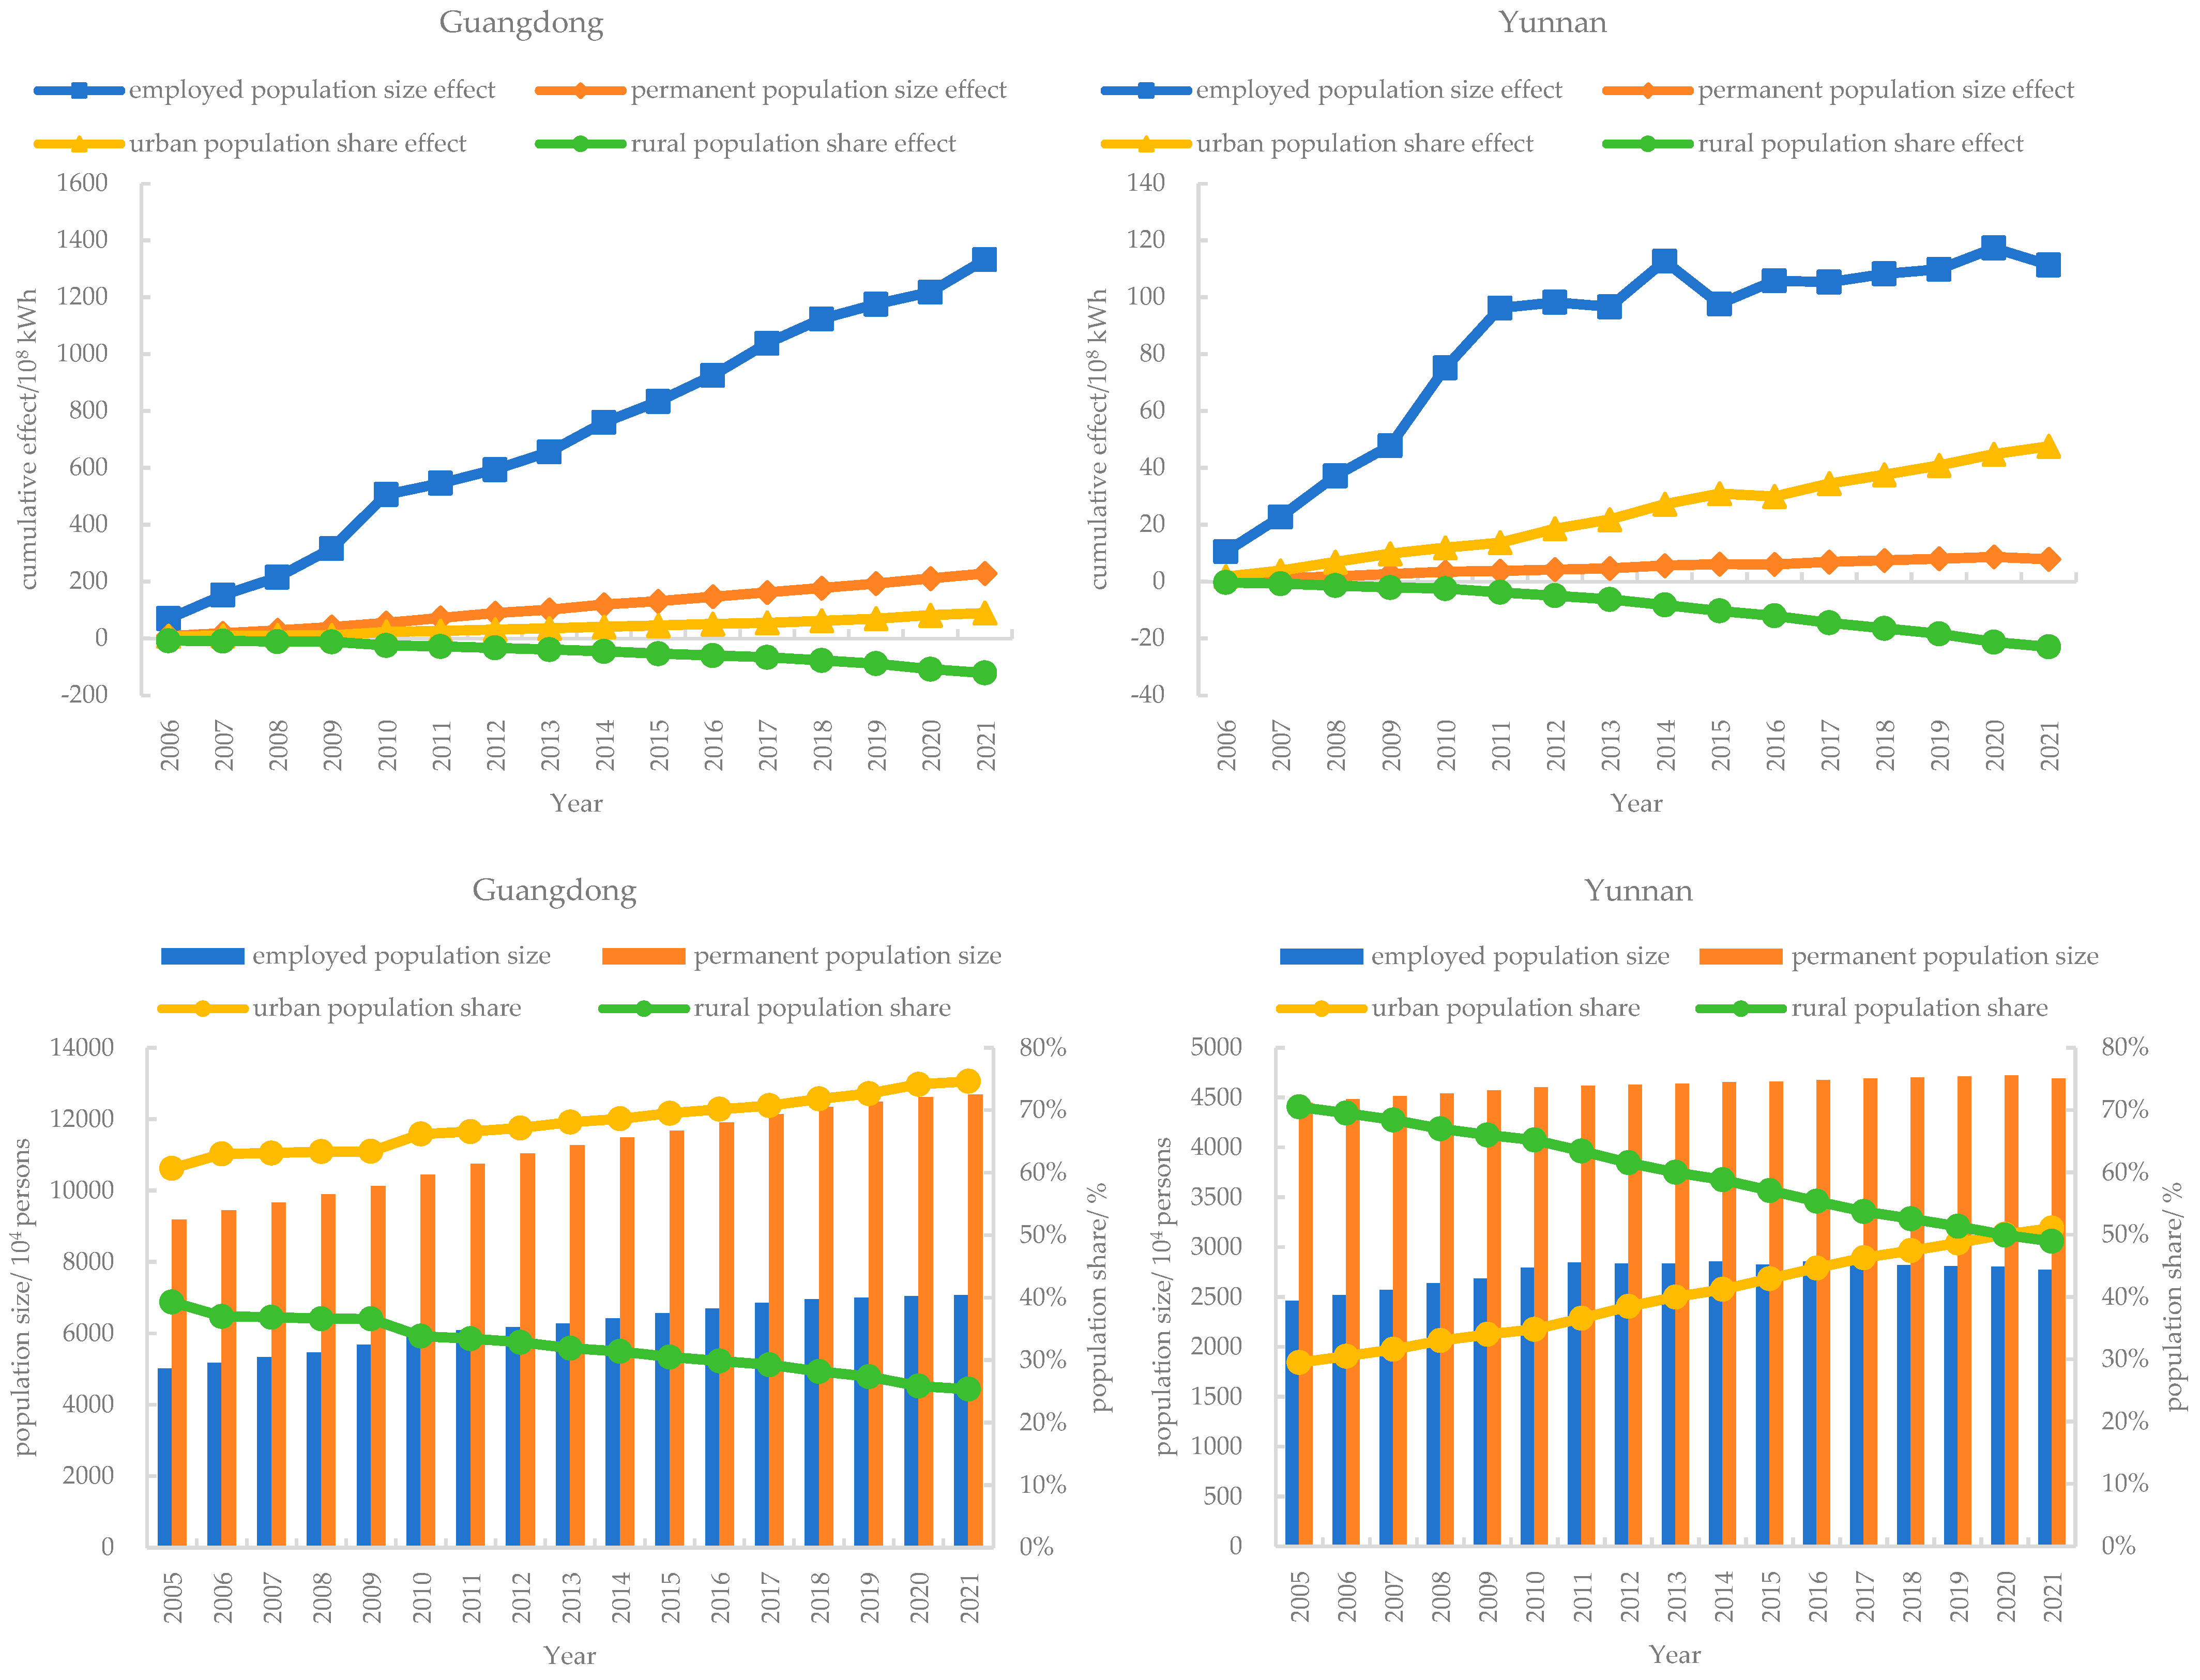
- In the residential sector, the residential income per capita effect and residential electrification level effect are the primary and secondary drivers that increase residential electricity consumption during 2005–2021, while the residential carbon emission intensity effect is the primary driver that reduces residential electricity consumption both in Guangdong and Yunnan. The urban–rural population structure effect was a negative contribution of −30.7 × 10⁸ kWh (−0.6%) in Guangdong, while a positive contribution of 24.7 × 10⁸ kWh (1.6%) in Yunnan. This is mainly caused by the differences in the urbanization process and urban–rural electricity consumption between the two provinces;
- (4)
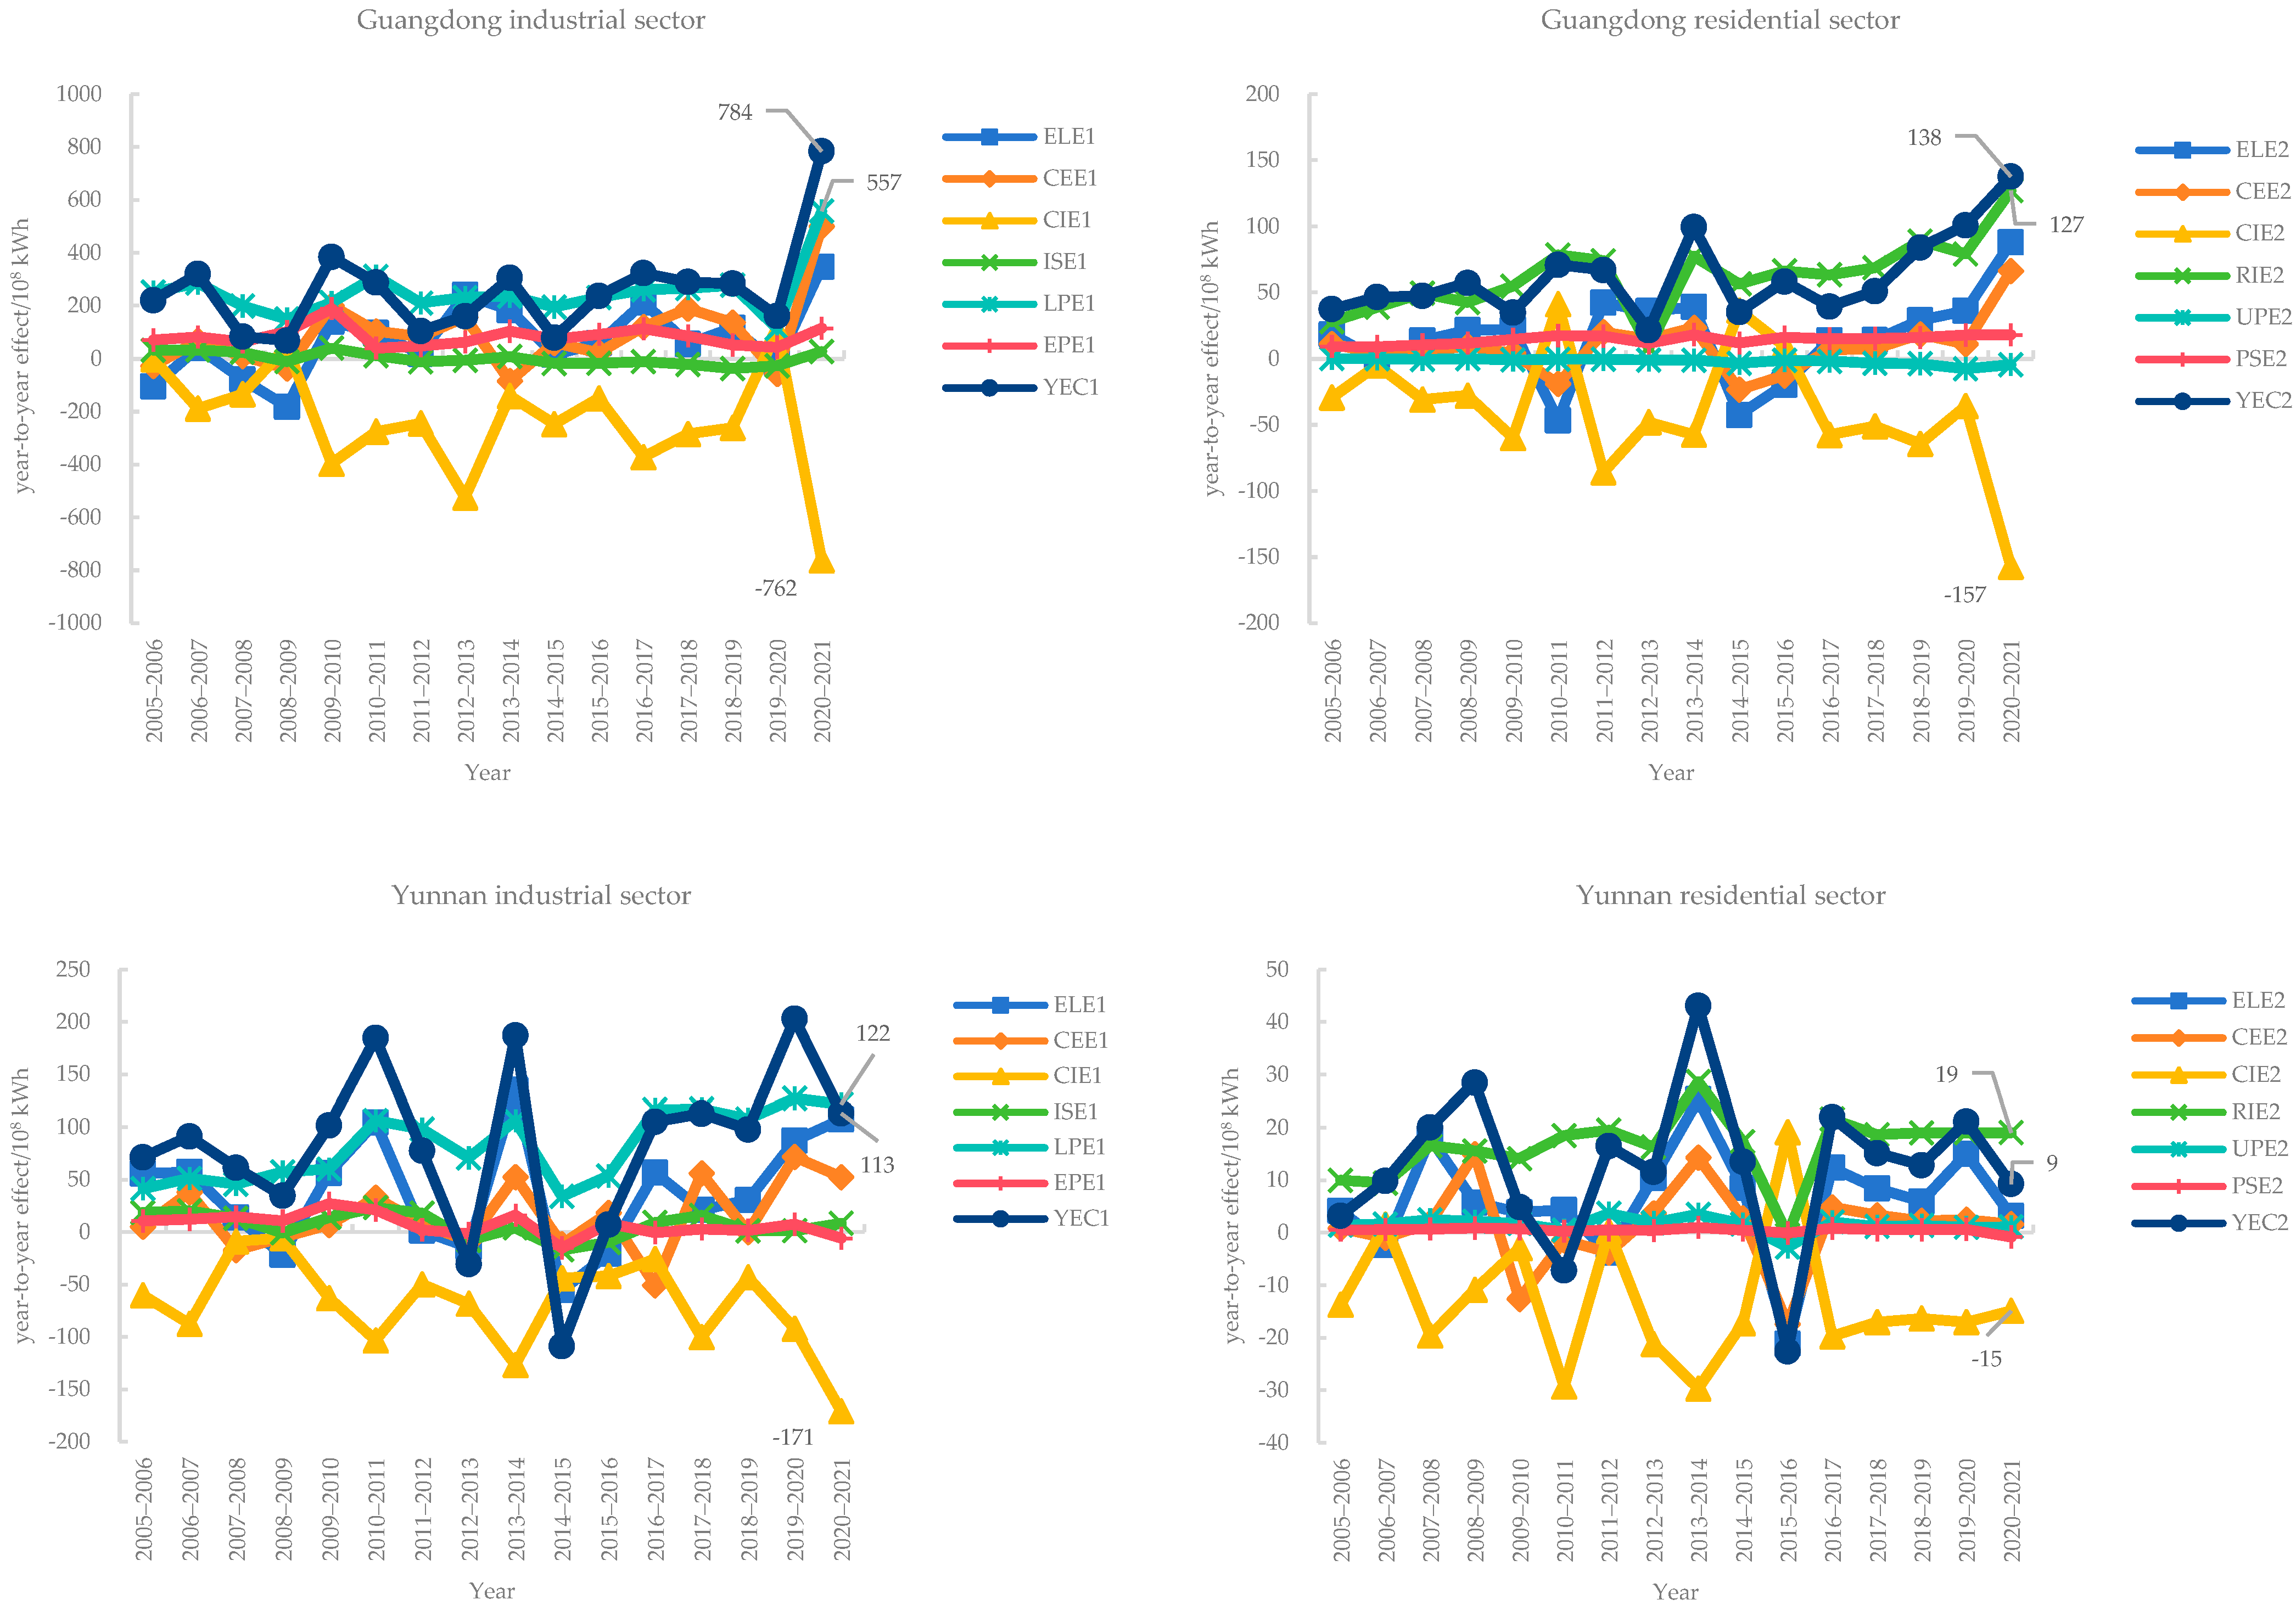
- As the drivers change, the year-to-year effects of each driver fluctuate up and down both in Guangdong and Yunnan from 2005 to 2021. The year-to-year effect of each driver by subsector is overall positively correlated with the year-to-year change in the corresponding driver, i.e., the increase in driver promotes electricity consumption, while the decrease in driver inhibits electricity consumption. Carbon emission intensity and rural population share generally decrease from year to year, with the corresponding effect being a decrease in electricity consumption, while other effects generally increase electricity consumption;
- (5)
- The total difference in effect between Guangdong and Yunnan was 3571 × 108 kWh, of which 2784 × 108 kWh (78.0%) for the industrial sector and 787 × 108 kWh (22.0%) for the residential sector and the industrial labor productivity level effect. The largest positive difference lies in the industrial labor productivity level effect, which widens the gap in electricity consumption by 2673 × 108. The largest negative difference lies in the industrial carbon emission intensity effect, which narrows the gap in electricity consumption by −2737 × 108 kWh, mainly caused by the industry subsector (−2186 × 108 kWh). The difference in each effect between the two provinces is mainly determined by change in the corresponding driver and change in subsectoral electricity consumption. The average effect of change in driver varies considerably across different subsectors, helping to understand the difference in effect between Guangdong and Yunnan.
5.2. Policy Implications
- (1)
- A high share of industrial electricity consumption in Guangdong and Yunnan needs to be rationalized. With further industrialization, urbanization, and intelligence development, electricity consumption will still increase significantly. The expected continued improvement in the living standards of the residents foretells that there is little room for a reduction in electricity consumption in the residential sector. Therefore, controlling industrial electricity consumption is a priority, such as using more efficient electrical equipment, optimizing production processes, and upgrading production technology. The residential sector also needs to implement locally adapted tariff policies to scientifically manage electricity consumption to avoid wastage;
- (2)
- Increasing the electrification level in sectors with a high share of fossil energy consumption is urgent. Guangdong is the largest province in terms of energy consumption and carbon emissions. Yunnan’s end-use energy consumption has a high proportion of fossil energy consumption, and its overall electrification level is much lower than Guangdong’s. In the context of the carbon-neutral strategy, both provinces are under tremendous pressure to control energy consumption and reduce carbon emissions. Further promoting the implementation of an electricity substitution policy can be less effective for final fossil energy consumption and improve the electrification level in industry, transportation, construction, and other sectors. The electrification rate has more room for improvement in Yunnan;
- (3)
- Improving technology and reducing carbon emission intensity is fundamental. The improvement of labor productivity will increase economic output and electricity consumption. However, improving technology can optimize energy management and economic structure and control energy-intensive industries to lower energy consumption and electricity consumption intensity. Compared to Guangdong, Yunnan’s carbon emission intensity has a lot of room to decline in industry and transportation. Guangdong should rely on its strong economic strength and talent advantage to strengthen the research investment and the application of advanced technologies and further optimize the structure of energy production and consumption to increase the share of low-carbon electricity. In addition, it is necessary to enhance public awareness of energy saving, low carbon, and environmental protection.
5.3. Limitation and Future Research
Author Contributions
Funding
Data Availability Statement
Conflicts of Interest
Appendix A
| Year | Agriculture | Industry | Construction | Transportation | Commercial Services | Other Services | Urban Residential | Rural Residential |
|---|---|---|---|---|---|---|---|---|
| 2005 | 500.54 | 9634.34 | 142.11 | 3762.60 | 510.18 | 145.30 | 1321.26 | 532.12 |
| 2006 | 427.87 | 11,656.03 | 153.02 | 3868.02 | 567.85 | 145.69 | 1419.48 | 502.02 |
| 2007 | 378.59 | 12,505.43 | 168.24 | 4263.49 | 649.77 | 165.47 | 1629.72 | 542.05 |
| 2008 | 390.58 | 13,675.78 | 154.53 | 4596.10 | 616.60 | 150.95 | 1673.24 | 618.73 |
| 2009 | 392.07 | 15,202.03 | 177.85 | 4816.74 | 818.48 | 161.08 | 1736.97 | 665.07 |
| 2010 | 405.68 | 14,721.58 | 192.68 | 5309.77 | 846.40 | 173.47 | 1664.64 | 732.72 |
| 2011 | 419.28 | 14,783.01 | 203.93 | 5448.02 | 885.17 | 183.77 | 2132.86 | 1021.13 |
| 2012 | 428.96 | 14,539.45 | 210.25 | 5664.91 | 969.85 | 184.76 | 2073.19 | 1014.46 |
| 2013 | 439.69 | 12,330.90 | 218.25 | 5488.15 | 1285.49 | 217.52 | 2013.23 | 890.03 |
| 2014 | 452.30 | 13,258.39 | 223.31 | 5747.96 | 1177.93 | 224.30 | 2081.99 | 928.02 |
| 2015 | 469.58 | 12,963.01 | 190.43 | 6279.50 | 1225.16 | 247.83 | 2424.00 | 1138.65 |
| 2016 | 517.40 | 13,041.44 | 219.34 | 6703.92 | 1350.63 | 298.09 | 2765.70 | 1308.50 |
| 2017 | 497.14 | 12,620.13 | 225.51 | 6794.97 | 1398.82 | 309.54 | 2808.11 | 1319.89 |
| 2018 | 493.06 | 12,534.06 | 227.81 | 6924.76 | 1391.27 | 317.68 | 2877.04 | 1352.05 |
| 2019 | 477.02 | 12,884.86 | 207.44 | 7015.23 | 1144.25 | 286.25 | 2834.72 | 1452.36 |
| 2020 | 528.92 | 13,890.87 | 205.10 | 6150.76 | 1173.96 | 290.52 | 2910.48 | 1527.46 |
| 2021 | 507.82 | 12,633.79 | 199.34 | 5903.57 | 1201.28 | 336.77 | 2708.40 | 1387.22 |
| Year | Agriculture | Industry | Construction | Transportation | Commercial Services | Other Services | Urban Residential | Rural Residential |
|---|---|---|---|---|---|---|---|---|
| 2005 | 385.71 | 6418.54 | 102.97 | 1064.14 | 66.82 | 88.75 | 170.37 | 482.79 |
| 2006 | 396.77 | 6528.10 | 114.04 | 1203.21 | 66.88 | 90.88 | 170.32 | 446.34 |
| 2007 | 409.11 | 6500.91 | 113.16 | 1303.71 | 83.05 | 67.69 | 210.86 | 474.29 |
| 2008 | 408.38 | 7163.88 | 160.86 | 1339.62 | 120.37 | 120.12 | 212.13 | 449.01 |
| 2009 | 430.41 | 8038.40 | 175.81 | 1374.26 | 159.98 | 113.28 | 227.93 | 470.55 |
| 2010 | 442.24 | 8306.95 | 201.64 | 1724.90 | 188.51 | 127.95 | 268.81 | 485.28 |
| 2011 | 405.87 | 8574.91 | 256.14 | 1844.25 | 225.51 | 128.51 | 218.45 | 588.59 |
| 2012 | 412.50 | 9222.86 | 240.67 | 1970.62 | 307.35 | 171.36 | 284.80 | 653.28 |
| 2013 | 407.52 | 9143.48 | 240.14 | 1867.05 | 344.49 | 184.88 | 275.44 | 622.74 |
| 2014 | 440.27 | 8635.20 | 236.11 | 2111.80 | 253.72 | 215.98 | 261.72 | 641.27 |
| 2015 | 495.13 | 8061.62 | 247.58 | 2043.91 | 399.11 | 229.99 | 259.89 | 659.06 |
| 2016 | 451.30 | 8256.18 | 261.33 | 2138.98 | 382.47 | 178.25 | 312.07 | 754.53 |
| 2017 | 462.84 | 9454.23 | 270.41 | 2184.95 | 380.15 | 180.15 | 324.64 | 721.24 |
| 2018 | 459.55 | 9506.62 | 269.73 | 2454.90 | 394.98 | 198.74 | 327.18 | 721.60 |
| 2019 | 449.77 | 10,151.85 | 273.91 | 2672.77 | 399.01 | 200.85 | 340.66 | 708.06 |
| 2020 | 457.23 | 10,297.63 | 253.46 | 2538.50 | 343.55 | 222.21 | 318.75 | 776.29 |
| 2021 | 433.00 | 9507.47 | 247.52 | 2618.45 | 401.07 | 187.99 | 333.15 | 761.46 |
| Year | Industrial Sector | ||||||
|---|---|---|---|---|---|---|---|
| ELE1 | CEE1 | CIE1 | ISE1 | LPE1 | EPE1 | YEC1 | |
| 2005–2006 | −105.16 | −27.28 | −0.98 | 32.10 | 252.10 | 70.17 | 220.96 |
| 2006–2007 | 41.16 | 67.43 | −188.70 | 32.51 | 285.50 | 81.99 | 319.90 |
| 2007–2008 | −77.88 | 9.70 | −134.70 | 24.01 | 199.16 | 62.90 | 83.19 |
| 2008–2009 | −181.53 | −37.28 | 47.38 | −11.27 | 149.72 | 101.50 | 68.51 |
| 2009–2010 | 139.21 | 200.13 | −396.40 | 40.06 | 212.04 | 189.17 | 384.22 |
| 2010–2011 | 97.53 | 103.30 | −275.91 | 11.32 | 311.20 | 40.08 | 287.53 |
| 2011–2012 | 18.70 | 83.48 | −244.43 | −11.45 | 210.35 | 48.02 | 104.68 |
| 2012–2013 | 241.31 | 156.47 | −523.98 | −6.25 | 230.93 | 62.37 | 160.85 |
| 2013–2014 | 183.70 | −84.31 | −140.92 | 7.35 | 236.42 | 103.36 | 305.60 |
| 2014–2015 | 15.19 | 59.87 | −247.15 | −17.84 | 195.04 | 73.90 | 79.01 |
| 2015–2016 | 58.38 | 21.93 | −149.45 | −17.11 | 231.41 | 91.62 | 236.78 |
| 2016–2017 | 212.69 | 120.23 | −371.87 | −11.29 | 260.17 | 112.97 | 322.91 |
| 2017–2018 | 55.82 | 189.10 | −284.48 | −21.73 | 265.49 | 85.42 | 289.61 |
| 2018–2019 | 116.18 | 136.48 | −261.11 | −37.03 | 277.15 | 51.75 | 283.41 |
| 2019–2020 | −17.67 | −57.40 | 106.19 | −26.93 | 114.23 | 42.86 | 161.28 |
| 2020–2021 | 346.70 | 500.15 | −761.99 | 27.24 | 557.45 | 114.73 | 784.29 |
| Year | Residential Sector | ||||||
| ELE2 | CEE2 | CIE2 | RIE2 | UPE2 | PSE2 | YEC2 | |
| 2005–2006 | 18.42 | 11.04 | −29.42 | 27.93 | 0.20 | 9.24 | 37.39 |
| 2006–2007 | −0.58 | 4.29 | −4.97 | 38.90 | −0.04 | 8.99 | 46.59 |
| 2007–2008 | 13.76 | 5.29 | −30.84 | 49.42 | −0.63 | 10.39 | 47.39 |
| 2008–2009 | 21.47 | 9.48 | −27.83 | 42.48 | −0.01 | 11.67 | 57.26 |
| 2009–2010 | 22.14 | 4.02 | −59.79 | 54.78 | −0.95 | 14.47 | 34.67 |
| 2010–2011 | −46.51 | −19.05 | 41.12 | 78.42 | −0.46 | 17.43 | 70.95 |
| 2011–2012 | 42.24 | 20.02 | −85.89 | 74.03 | −0.42 | 16.97 | 66.95 |
| 2012–2013 | 35.92 | 14.71 | −48.03 | 8.32 | −1.11 | 11.73 | 21.55 |
| 2013–2014 | 39.04 | 23.36 | −57.39 | 77.47 | −1.09 | 18.07 | 99.47 |
| 2014–2015 | −42.58 | −23.43 | 36.39 | 56.47 | −3.54 | 11.82 | 35.12 |
| 2015–2016 | −19.74 | −12.73 | 9.59 | 66.25 | −1.33 | 16.26 | 58.29 |
| 2016–2017 | 13.72 | 6.71 | −57.49 | 63.36 | −1.92 | 15.00 | 39.37 |
| 2017–2018 | 14.09 | 7.46 | −51.12 | 68.77 | −3.45 | 15.26 | 51.01 |
| 2018–2019 | 29.01 | 18.40 | −64.34 | 88.94 | −3.90 | 15.89 | 83.99 |
| 2019–2020 | 36.19 | 11.02 | −35.83 | 79.22 | −7.54 | 17.80 | 100.85 |
| 2020–2021 | 87.93 | 66.40 | −157.25 | 127.14 | −4.48 | 18.03 | 137.77 |
| Year | Industrial Sector | ||||||
|---|---|---|---|---|---|---|---|
| ELE1 | CEE1 | CIE1 | ISE1 | LPE1 | EPE1 | YEC1 | |
| 2005–2006 | 55.70 | 5.30 | −60.28 | 18.77 | 41.34 | 10.54 | 71.38 |
| 2006–2007 | 57.28 | 37.97 | −87.48 | 20.09 | 51.20 | 12.17 | 91.23 |
| 2007–2008 | 14.06 | −17.30 | −8.85 | 13.26 | 45.69 | 14.48 | 61.35 |
| 2008–2009 | −21.65 | −5.08 | −5.82 | −0.81 | 57.30 | 10.62 | 34.56 |
| 2009–2010 | 56.40 | 6.90 | −63.04 | 13.86 | 60.12 | 27.31 | 101.55 |
| 2010–2011 | 104.60 | 32.72 | −103.27 | 23.31 | 106.17 | 21.04 | 184.58 |
| 2011–2012 | 1.34 | 7.70 | −49.83 | 18.10 | 98.14 | 2.07 | 77.51 |
| 2012–2013 | −14.54 | −8.83 | −68.31 | −8.04 | 70.80 | −1.61 | −30.53 |
| 2013–2014 | 135.14 | 52.50 | −126.63 | 3.91 | 106.11 | 16.09 | 187.14 |
| 2014–2015 | −55.50 | −11.48 | −43.87 | −16.89 | 34.03 | −15.10 | −108.80 |
| 2015–2016 | −21.03 | 18.33 | −41.96 | −9.84 | 53.52 | 8.20 | 7.23 |
| 2016–2017 | 56.59 | −50.84 | −25.71 | 9.15 | 116.44 | −0.52 | 105.10 |
| 2017–2018 | 21.13 | 56.01 | −100.33 | 15.85 | 117.21 | 2.91 | 112.77 |
| 2018–2019 | 30.54 | −0.01 | −43.20 | 1.16 | 107.69 | 1.60 | 97.78 |
| 2019–2020 | 87.13 | 71.90 | −92.17 | 1.24 | 127.34 | 7.49 | 202.92 |
| 2020–2021 | 107.33 | 52.45 | −171.00 | 8.41 | 121.79 | −5.92 | 113.06 |
| Year | Residential Sector | ||||||
| ELE2 | CEE2 | CIE2 | RIE2 | UPE2 | PSE2 | YEC2 | |
| 2005–2006 | 4.15 | 0.86 | −13.72 | 9.96 | 1.43 | 0.55 | 3.23 |
| 2006–2007 | −2.36 | −0.98 | 1.53 | 9.43 | 1.66 | 0.58 | 9.87 |
| 2007–2008 | 18.03 | 1.87 | −19.56 | 16.54 | 2.44 | 0.70 | 20.01 |
| 2008–2009 | 5.74 | 14.97 | −10.85 | 15.55 | 2.19 | 0.87 | 28.47 |
| 2009–2010 | 3.88 | −12.62 | −2.94 | 14.09 | 1.74 | 0.74 | 4.89 |
| 2010–2011 | 4.31 | −1.44 | −29.28 | 18.48 | 0.49 | 0.27 | −7.17 |
| 2011–2012 | −3.80 | −3.77 | 0.35 | 19.51 | 3.67 | 0.51 | 16.47 |
| 2012–2013 | 10.44 | 3.70 | −21.20 | 16.31 | 1.89 | 0.41 | 11.55 |
| 2013–2014 | 25.32 | 14.27 | −29.67 | 28.66 | 3.49 | 1.00 | 43.08 |
| 2014–2015 | 8.55 | 2.77 | −17.24 | 17.31 | 1.64 | 0.48 | 13.51 |
| 2015–2016 | −21.12 | −17.40 | 19.16 | −0.44 | −2.73 | −0.07 | −22.60 |
| 2016–2017 | 12.34 | 4.84 | −19.70 | 21.59 | 2.06 | 0.83 | 21.97 |
| 2017–2018 | 8.43 | 3.34 | −17.01 | 18.64 | 1.17 | 0.56 | 15.13 |
| 2018–2019 | 5.95 | 2.26 | −16.33 | 19.00 | 1.38 | 0.57 | 12.83 |
| 2019–2020 | 14.98 | 2.48 | −17.01 | 18.98 | 1.03 | 0.65 | 21.11 |
| 2020–2021 | 3.22 | 1.63 | −14.88 | 19.03 | 1.10 | −0.83 | 9.27 |
References
- UNFCCC. Secretariat. Synthesis Report of the Technical Dialogue of the First Global Stocktake. Available online: https://unfccc.int/documents/631600 (accessed on 27 October 2023).
- Lv, T.; Pi, D.; Deng, X.; Hou, X.; Xu, J.; Wang, L. Spatiotemporal Evolution and Influencing Factors of Electricity Consumption in the Yangtze River Delta Region. Energies 2022, 15, 1753. [Google Scholar] [CrossRef]
- Lin, B.; Omoju, O.E.; Okonkwo, J.U. Factors Influencing Renewable Electricity Consumption in China. Renew. Sustain. Energy Rev. 2016, 55, 687–696. [Google Scholar] [CrossRef]
- Wen, H.; Liang, W.; Lee, C.C. China’s Progress toward Sustainable Development in Pursuit of Carbon Neutrality: Regional Differences and Dynamic Evolution. Environ. Impact Assess. Rev. 2023, 98, 106959. [Google Scholar] [CrossRef]
- He, Y.; Xing, Y.; Zeng, X.; Ji, Y.; Hou, H.; Zhang, Y.; Zhu, Z. Factors Influencing Carbon Emissions from China’s Electricity Industry: Analysis Using the Combination of LMDI and K-means Clustering. Environ. Impact Assess. Rev. 2022, 93, 106724. [Google Scholar] [CrossRef]
- Yuan, Y.; Suk, S. Decomposition Analysis and Trend Prediction of Energy-Consumption CO2 Emissions in China’s Yangtze River Delta Region. Energies 2023, 16, 4510. [Google Scholar] [CrossRef]
- Guangdong Statistical Yearbook. Available online: http://www.stats.gd.gov.cn/gdtjnj/index.html (accessed on 27 October 2023).
- Yunnan Statistical Yearbook. Available online: http://www.http://stats.yn.gov.cn/tjsj/tjnj (accessed on 27 October 2023).
- Wang, H.; Zhou, P. Assessing Global CO2 Emission Inequality from Consumption Perspective: An Index Decomposition Analysis. Ecol. Econ. 2018, 154, 257–271. [Google Scholar] [CrossRef]
- Wang, H.; Ang, B.W.; Su, B. Assessing Drivers of Economy-wide Energy Use and Emissions: IDA Versus SDA. Energy Policy 2017, 107, 585–599. [Google Scholar] [CrossRef]
- Wang, H.; Ang, B.W.; Zhou, P. Decomposing Aggregate CO2 Emission Changes with Heterogeneity: An Extended Production-theoretical Approach. Energy J. 2018, 39, 59–79. [Google Scholar] [CrossRef]
- Ang, B.W.; Liu, F.L. A New Energy Decomposition Method: Perfect in Decomposition and Consistent in Aggregation. Energy 2001, 26, 537–548. [Google Scholar] [CrossRef]
- Ang, B.W.; Liu, N. Handling Zero Values in the Logarithmic Mean Divisia Index Decomposition Approach. Energy Policy 2007, 35, 238–246. [Google Scholar] [CrossRef]
- Ang, B.W. Decomposition Analysis for Policymaking in Energy: Which is the Preferred Method? Energy Policy 2004, 32, 1131–1139. [Google Scholar] [CrossRef]
- Ang, B.W. The LMDI Approach to Decomposition Analysis: A Practical Guide. Energy Policy 2005, 33, 867–871. [Google Scholar] [CrossRef]
- Yang, X.; Xu, H.; Su, B. Factor Decomposition for Global and National Aggregate Energy Intensity Change During 2000–2014. Energy 2022, 254, 124347. [Google Scholar] [CrossRef]
- Liu, M.; Zhang, X.; Zhang, M.; Feng, Y.; Liu, Y.; Wen, J.; Liu, L. Influencing Factors of Carbon Emissions in Transportation Industry Based on CD Function and LMDI Decomposition Model: China as an Example. Environ. Impact Assess. Rev. 2021, 90, 106623. [Google Scholar] [CrossRef]
- Chen, J.; Wang, P.; Cui, L.; Huang, S.; Song, M. Decomposition and Decoupling Analysis of CO2 Emissions in OECD. Appl. Energy 2018, 231, 937–950. [Google Scholar] [CrossRef]
- Dong, K.; Hochman, G.; Timilsina, G.R. Do Drivers of CO2 Emission Growth Alter Overtime and by the Stage of Economic Development? Energy Policy 2020, 140, 111420. [Google Scholar] [CrossRef]
- Wang, Q.; Wang, X.W. Moving to Economic Growth Without Water Demand Growth—A Decomposition Analysis of Decoupling from Economic Growth and Water Use in 31 Provinces of China. Sci. Total Environ. 2020, 726, 138362. [Google Scholar] [CrossRef]
- Zhang, C.J.; Zhao, Y.; Shi, C.F.; Chiu, Y. Can China Achieve its Water Use Peaking in 2030? A Scenario Analysis Based on LMDI and Monte Carlo Method. J. Clean. Prod. 2021, 278, 123214. [Google Scholar] [CrossRef]
- Long, H.Y.; Lin, B.Q.; Ou, Y.T.; Chen, Q. Spatio-temporal Analysis of Driving Factors of Water Resources Consumption in China. Sci. Total Environ. 2019, 690, 1321–1330. [Google Scholar] [CrossRef]
- Luo, Y.; Zeng, W.; Wang, Y.; Li, D.; Hu, X.; Zhang, H. A Hybrid Approach for Examining the Drivers of Energy Consumption in Shanghai. Renew. Sustain. Energy Rev. 2021, 151, 111571. [Google Scholar] [CrossRef]
- Tenaw, D. Decomposition and Macroeconomic Drivers of Energy Intensity: The Case of Ethiopia. Energy Strategy Rev. 2021, 35, 100641. [Google Scholar] [CrossRef]
- Zhou, Q.; Fu, C.; Ni, H.; Gong, L. What are the Main Factors that Influence China’s Energy Intensity? —Based on Aggregate and Firm-level Data. Energy Rep. 2021, 7, 2737–2750. [Google Scholar] [CrossRef]
- Zhang, C.; Su, B.; Zhou, K.L.; Yang, S.L. Analysis of Electricity Consumption in China (1990–2016) Using Index Decomposition and Decoupling Approach. J. Clean. Prod. 2019, 209, 224–235. [Google Scholar] [CrossRef]
- Wang, Y.; Liu, Y.Z.; Huang, L.Q.; Zhang, Q.Y.; Gao, W.; Sun, Q.; Li, X. Decomposition the Driving Force of Regional Electricity Consumption in Japan from 2001 to 2015. Appl. Energy 2022, 308, 118365. [Google Scholar] [CrossRef]
- Lin, B.; Raza, M.Y. Analysis of Electricity Consumption in Pakistan Using Index Decomposition and Decoupling Approach. Energy 2021, 214, 118888. [Google Scholar] [CrossRef]
- Praene, J.P.; Rasamoelina, R.M.; Ayagapin, L. Past and Prospective Electricity Scenarios in Madagascar: The Role of Government Energy Policies. Renew. Sustain. Energy Rev. 2021, 149, 111321. [Google Scholar] [CrossRef]
- Fang, D.; Hao, P.; Hao, J. Study of the Influence Mechanism of China’s Electricity Consumption Based on Multi-period ST-LMDI Model. Energy 2019, 170, 730–743. [Google Scholar] [CrossRef]
- Fang, D.; Hao, P.; Yu, Q.; Wang, J. The Impacts of Electricity Consumption in China’s Key Economic Regions. Appl. Energy 2020, 267, 115078. [Google Scholar] [CrossRef]
- Park, J.; Jin, T.; Lee, S.; Woo, J. Industrial Electrification and Efficiency: Decomposition Evidence from the Korean Industrial Sector. Energies 2021, 14, 5120. [Google Scholar] [CrossRef]
- Shi, C.; Zhao, Y.; Zhang, C.; Pang, Q.; Chen, Q.; Li, A. Research on the Driving Effect of Production Electricity Consumption Changes in the Yangtze River Economic Zone-Based on Regional and Industrial Perspectives. Energy 2022, 238, 121635. [Google Scholar] [CrossRef]
- Huang, Y.H. Examining Impact Factors of Residential Electricity Consumption in Taiwan Using Index Decomposition Analysis Based on End-use Level Data. Energy 2020, 213, 119067. [Google Scholar] [CrossRef]
- Meng, M.; Wang, L.; Shang, W. Decomposition and Forecasting Analysis of China’s Household Electricity Consumption Using Three-dimensional Decomposition and Hybrid Trend Extrapolation Models. Energy 2018, 165, 143–152. [Google Scholar] [CrossRef]
- Zhang, C.J.; Wang, Y.Z.; Xu, J.R.; Shi, C.F. What Factors Drive the Temporal-spatial Differences of Electricity Consumption in the Yangtze River Delta Region of China. Environ. Impact Assess. Rev. 2023, 103, 107247. [Google Scholar] [CrossRef]
- Kaya, Y. Impact of Carbon Dioxide Emission Control on GNP Growth: Interpretation of Proposed Scenarios; Intergovernmental Panel on Climate Change/Response Strategies Working Group: Geneva, Switzerland, 1989; Volume 13, pp. 20–33. [Google Scholar]
- Ang, B.W. LMDI Decomposition Approach: A Guide for Implementation. Energy Policy 2015, 86, 233–238. [Google Scholar] [CrossRef]
- National Bureau of Statistics of China. China Energy Statistical Yearbook (2006–2022); China Statistics Press: Beijing, China, 2022.
- Shan, Y.; Huang, Q.; Guan, D.; Hubacek, K. China CO2 Emission Accounts 2016–2017. Sci. Data 2020, 7, 54. [Google Scholar] [CrossRef] [PubMed]



| Abbreviated Name | Effect | Abbreviated Name | Effect |
|---|---|---|---|
| ELE1 | industrial electrification level effect | ELE2 | residential electrification level effect |
| CEE1 | industrial energy consumption intensity effect | CEE2 | residential energy consumption intensity effect |
| CIE1 | industrial carbon emissions intensity effect | CIE2 | residential carbon emissions intensity effect |
| ISE1 | industrial structure effect | RIE2 | residential income per capita effect |
| LPE1 | labor productivity level effect | UPE2 | urban–rural population structure effect |
| EPE1 | employed population size effect | PSE2 | permanent population size effect |
| TEC1 | cumulative effect in the industrial sector | TEC2 | cumulative effect in the residential sector |
| YEC1 | year-to-year effect in the industrial sector | YEC2 | year-to-year effect in the residential sector |
| Province | Year | ELE1 | CEE1 | CIE1 | ISE1 | LPE1 | EPE1 | TEC1 |
|---|---|---|---|---|---|---|---|---|
| Guangdong | 2005–2010 | −184 | 213 | −673 | 117 | 1099 | 506 | 1077 |
| 2005–2015 | 372 | 532 | −2106 | 101 | 2282 | 833 | 2014 | |
| 2005–2020 | 798 | 942 | −3067 | −14 | 3431 | 1218 | 3308 | |
| 2005–2021 | 1144 | 1442 | −3828 | 14 | 3988 | 1333 | 4093 | |
| Yunnan | 2005–2010 | 162 | 28 | −225 | 65 | 256 | 75 | 360 |
| 2005–2015 | 333 | 100 | −617 | 86 | 671 | 98 | 670 | |
| 2005–2020 | 507 | 196 | −921 | 103 | 1193 | 117 | 1196 | |
| 2005–2021 | 615 | 248 | −1092 | 112 | 1315 | 111 | 1309 |
| Province | Year | ELE2 | CEE2 | CIE2 | RIE2 | UPE2 | PSE2 | TEC2 |
|---|---|---|---|---|---|---|---|---|
| Guangdong | 2005–2010 | 75 | 34 | −153 | 214 | −1.4 | 55 | 223 |
| 2005–2015 | 103 | 50 | −267 | 508 | −8.1 | 131 | 517 | |
| 2005–2020 | 177 | 81 | −466 | 875 | −26 | 211 | 851 | |
| 2005–2021 | 265 | 147 | −623 | 1002 | −31 | 229 | 989 | |
| Yunnan | 2005–2010 | 29 | 4 | −46 | 66 | 9.5 | 3.4 | 66 |
| 2005–2015 | 74 | 20 | −143 | 166 | 21 | 6.1 | 144 | |
| 2005–2020 | 95 | 15 | −193 | 244 | 24 | 8.7 | 192 | |
| 2005–2021 | 98 | 17 | −208 | 263 | 25 | 7.8 | 202 |
| Effect | Province | Agriculture | Industry | Construction | Transportation | Commercial Services | Other Services | Urban Residential | Rural Residential | Total |
|---|---|---|---|---|---|---|---|---|---|---|
| ELE | Guangdong | 57 | 914 | −25 | 93 | 51 | 54 | 174 | 91 | 1409 |
| Yunnan | 22 | 508 | 13 | 4 | 29 | 37 | 10 | 88 | 713 | |
| CEE | Guangdong | 35 | 987 | 81 | 4 | 64 | 271 | 88 | 59 | 1589 |
| Yunnan | −3.3 | 195 | 7 | 0.3 | 7 | 43 | 10 | 6 | 265 | |
| CIE | Guangdong | −64 | −3181 | −45 | −69 | −144 | −326 | −489 | −134 | −4452 |
| Yunnan | −14 | −995 | −28 | −16 | 0.8 | −40 | −135 | −74 | −1300 | |
| ISE1 | Guangdong | −77 | 62 | −23 | −4 | −8 | 63 | 14 | ||
| Yunnan | −11 | 117 | 12 | −1.1 | 6 | −12 | 112 | |||
| RIE2 | Guangdong | 572 | 430 | 1002 | ||||||
| Yunnan | 141 | 122 | 263 | |||||||
| UPE2 | Guangdong | 90 | −121 | −31 | ||||||
| Yunnan | 48 | −23 | 25 |
| Driver | Change | Province | Agriculture | Industry | Construction | Transportation | Commercial Services | Other Services | Urban Residential | Rural Residential | Total |
|---|---|---|---|---|---|---|---|---|---|---|---|
| electrification level | +1% | Guangdong | 3.2 | 83.1 | 2.1 | 20.5 | 6.4 | 6.0 | 13.2 | 6.7 | |
| Yunnan | 1.9 | 38.9 | 0.9 | 7.2 | 1.2 | 1.3 | 1.9 | 3.5 | |||
| energy consumption intensity | +0.1 tc/tCO2 | Guangdong | 13.8 | 316.2 | 4.3 | 15.7 | 31.7 | 16.1 | 54.3 | 31.1 | |
| Yunnan | 3.0 | 132.4 | 3.7 | 5.4 | 4.0 | 6.1 | 9.2 | 9.5 | |||
| carbon emission intensity | −0.1 tCO2/104 yuan | Guangdong | −39.1 | −502.2 | −54.5 | −3.1 | −160.2 | −2953.5 | −452.4 | −110.9 | |
| Yunnan | −4.2 | −24.5 | −9.5 | −0.6 | −14.7 | −90.7 | −106.3 | −14.2 | |||
| industrial structure | +1% | Guangdong | 23.3 | 60.5 | 20.3 | 17.8 | 30.5 | 16.3 | |||
| Yunnan | 1.2 | 21.8 | 2.6 | 5.9 | 2.0 | 2.8 | |||||
| labor productivity level | +104 yuan/person | Guangdong | 511.4 | ||||||||
| Yunnan | 298.1 | ||||||||||
| residential income per capita | +104 yuan/person | Guangdong | 142.6 | 244.2 | |||||||
| Yunnan | 42.9 | 100.2 | |||||||||
| urban–rural population structure | +1% | Guangdong | 6.5 | 8.7 | |||||||
| Yunnan | 2.2 | 1.1 | |||||||||
| employed population size | +104 persons | Guangdong | 0.65 | ||||||||
| Yunnan | 0.36 | ||||||||||
| permanent population | +104 persons | Guangdong | 0.07 | ||||||||
| Yunnan | 0.03 |
Disclaimer/Publisher’s Note: The statements, opinions and data contained in all publications are solely those of the individual author(s) and contributor(s) and not of MDPI and/or the editor(s). MDPI and/or the editor(s) disclaim responsibility for any injury to people or property resulting from any ideas, methods, instructions or products referred to in the content. |
© 2023 by the authors. Licensee MDPI, Basel, Switzerland. This article is an open access article distributed under the terms and conditions of the Creative Commons Attribution (CC BY) license (https://creativecommons.org/licenses/by/4.0/).
Share and Cite
Chen, H.; Liu, S.; Kuang, Y.; Shu, J.; Ma, Z. Decomposition Analysis of Regional Electricity Consumption Drivers Considering Carbon Emission Constraints: A Comparison of Guangdong and Yunnan Provinces in China. Energies 2023, 16, 8052. https://doi.org/10.3390/en16248052
Chen H, Liu S, Kuang Y, Shu J, Ma Z. Decomposition Analysis of Regional Electricity Consumption Drivers Considering Carbon Emission Constraints: A Comparison of Guangdong and Yunnan Provinces in China. Energies. 2023; 16(24):8052. https://doi.org/10.3390/en16248052
Chicago/Turabian StyleChen, Haobo, Shangyu Liu, Yaoqiu Kuang, Jie Shu, and Zetao Ma. 2023. "Decomposition Analysis of Regional Electricity Consumption Drivers Considering Carbon Emission Constraints: A Comparison of Guangdong and Yunnan Provinces in China" Energies 16, no. 24: 8052. https://doi.org/10.3390/en16248052
APA StyleChen, H., Liu, S., Kuang, Y., Shu, J., & Ma, Z. (2023). Decomposition Analysis of Regional Electricity Consumption Drivers Considering Carbon Emission Constraints: A Comparison of Guangdong and Yunnan Provinces in China. Energies, 16(24), 8052. https://doi.org/10.3390/en16248052


