Article

A New Vehicle-Specific Power Model for the Estimation of Hybrid Vehicle Emissions

1
Faculty of Electrical Engineering, Mechanical Engineering and Naval Architecture, University of Split, R. Boškovića 32, 21000 Split, Croatia
2
Faculty of Mechanical Engineering and Naval Architecture, University of Zagreb, Ivana Lučića 5, 10000 Zagreb, Croatia
*
Author to whom correspondence should be addressed.
Energies 2023, 16(24), 8094; https://doi.org/10.3390/en16248094
Submission received: 4 November 2023 / Revised: 3 December 2023 / Accepted: 6 December 2023 / Published: 15 December 2023

Abstract

:
Hybrid electric vehicles are certainly one of the key solutions for improving fuel efficiency and reducing emissions, especially in terms of special vehicles and with the use of CO2-neutral fuels. Determining the energy management strategy and finding the optimal solution with regard to the aforementioned goals remains one of the main challenges in the design of HEVs. This paper presents a new vehicle modeling method, with an emphasis on HEVs, which is based on the frequency analysis of emissions and consumption according to the current specific traction power of the vehicle. An evaluation of the newly introduced model in the RDE, NEDC and WLTP cycle was performed, and the results were compared with the standard verified vehicle model that was created in AVL’s CruiseM R2021.2 software package. Positive traction energies have positive deviations of between 0.35% and 2.85%. The largest deviation in CO2 emissions was recorded for the HEV model in the RDE cycle and in the non-hybrid model in the WLTP cycle and were 3.79% and 4.4%, respectively. All other combinations of cycle and vehicles had deviations of up to about 1%. As expected, the largest relative deviations were recorded for NOx emissions and ranged from 0.13% to 9.62% for HEVs in the WLTP cycle.

1. Introduction

The constant increase in transport needs and the desire for sustainability is forcing vehicle manufacturers towards significant reductions in harmful exhaust emissions and emissions of greenhouse gases, especially carbon dioxide. Several countries, especially EU members and some US states, want to restrict the sale of new passenger vehicles fueled by fossil fuels [1,2]; however, this ban policy has proven difficult to implement in less developed parts of the world with inadequate infrastructure [3]. The EU plans to reduce CO2 emissions to 95 g/km for new passenger vehicles by 2025 [4], an additional reduction of 17% is planned between 2025 and 2030, and a reduction of 37.5% from 2030 onwards [5]. In the last 15 years, high-speed internal combustion engines have achieved very high efficiency, diesel engines achieve peak mechanical efficiency of over 40% [6], but it is still questionable whether they will be able to satisfy newly proposed Euro 7 standard [7,8] as stand-alone powertrains [9]. The main reason for this is the inefficient energy management that is due to the absence of regenerative braking and the large drop in efficiency at low loads for which the engine operates in a low efficiency region. Hybrid electric vehicles (HEVs) combine the advantages of EVs and standard vehicles, they have a high degree of flexibility as well as the ability to meet a wider range of driving requirements [10]. The most significant advantage over standard vehicles powered solely by an ICE is the ability to save energy from regenerative braking and store excess energy by shifting the engine operating region towards that of a higher efficiency, as well as the use of smaller, lighter, and simpler single-range ICEs. Additionally, the ever-present possibility of choosing different operating parameters of the ICE enables better emission control management and almost completely solves the problems associated with their use [11]. The most significant advantage of HEVs compared with fully electric vehicles (EVs) is their superior range over a single charge and their fast refueling, which is achieved by using chemical energy instead of electrical [12]. Hybrid electric vehicles together form a key solution for increasing efficiency and lowering emissions and a viable strategy for developing countries> This is particularly so with the use of environmentally friendly, synthetic CO2-neutral fuels at an affordable price [13] or with the use of alternative fuels, such as LPG, which have significantly lower emissions and a lower CO2 footprint [14]. Such power trains will certainly find their application in heavy trucks for long distances, special purpose vehicles or off-road and military vehicles [15,16]. The share of hybrid vehicles, with all levels of hybridization, from plug-in and full hybrid electric vehicles to mild hybrid vehicles, is predicted to be over 36% by 2030 [17]. The above indicated advantages are made possible due to the high complexity of the HEV system, which is also the biggest challenge both in terms of the number of installed systems and in terms of finding the optimal control method [18,19,20]. The use of multiple energy sources and the high complexity of the HEV drive system require a more complex high-level control system. This, in turn, requires complex modeling methods with highly demanding models in terms of the user and in computation [21,22,23]. Various approaches to the modeling of hybrid road vehicles have been developed and, according to the literature, we are able to distinguish kinematic (backward), quasi-static (forward) and dynamic approaches [24,25]. The optimal solution depends on the specifics of the application, but in most cases the energy management strategy (EMS) is a compromise between minimizing energy consumption and exhaust gas emissions [26], increasing the durability of components such as batteries, meeting power requirements, and ensuring vehicle performance and comfort [27]. Each of these requirements depend on a large number of parameters and it is very difficult and impractical to cover them all in one model. Because of these reasons, the authors in the relevant literature mainly observe, in detail, the influence of certain specific parameters on one of the aforementioned requirements. In [28], an EMS plug-in HEV bus was proposed based on an equivalent consumption minimization strategy by using real-time traffic information described by the average speed, average acceleration, and standard deviation of speed for different road sections. In [29], a method based on gear shift control was proposed in order to improve further research on the relationship between different road sections and vehicle driving conditions and gears. In [28,29] steady-state map-based ICE models were used, which are an efficient solution to the estimation of fuel consumption. In contrast with consumption models that do not depend heavily on transient behaviors, emission models are much more sensitive to them. Due to its complexity, the usual way of modeling a complete HEV does not include complex and detailed ICE emission models, but relies on lower-level models that include steady-state emission maps that introduce a certain emission estimation error [30]. Modal vehicle specific power (VSP) analysis is also used in fuel consumption and emissions estimations. Unlike most consumption models that depend on steady-state maps, in [31] a fuel consumption model for passenger cars was developed that includes an analysis of the influence of transient loads. Such an analysis gives an essential advantage when estimating emissions. In [32], a VSP model of a full HEV was built with 14 modes by measuring emissions and consumption using a PEMS device, the model was then validated in an NEDC cycle by which the vehicle is type approved. This used a simplified universal definition of vehicle specific power according to [33], one which simplifies the model but also reduces the accuracy. The deviation of the model from the certified data according to the NEDC protocol was for fuel consumption −3.2%, for CO emission +18.1% and for NOx emission 26.2%.
Modal VSP analysis is used to form incomplete models of HEVs, mainly for the assessment of the total vehicle fuel consumption and emissions of the ICE on its own and of HEVs in different driving conditions. This is because they do not apply the energy flows necessary for the creation of a complete model that enables the application of an appropriate management strategy, i.e., the assessment of the maximum hybridization efficiency. Additionally, the definition of modal emissions as flow per unit of time in relation to modal emissions per unit of energy introduces additional error into the model. The main goal of this paper was to present a new model of a hybrid vehicle based on modal analysis of vehicle consumption, emissions and energy flows. Because it takes into account transitory events, this approach should allow for a faster and simpler arrival at the pre-set HEV optimization target, especially for the emission objective. The model can also be used as a guideline for a standard time-based model that leads to an optimal solution, avoiding local minima. The model was based on real vehicle emissions, fuel and energy consumption data which were recorded in real driving conditions according to the Real Driving Emissions (RDE) rules, which are today a mandatory segment of the type approval process. Validation and result comparison was undertaken with regard to standard time-based CruiseM model results.

2. Materials and Methods

First, a non-hybrid vehicle model was created and validated in AVL’s CruiseM R2021.2 software package. CruiseM is a versatile system simulation tool supporting model-based development across various domains, such as engine, flow, aftertreatment, driveline, electrics, and hydraulics. It enables efficient multi-physics system simulation through a flexible, multi-level modeling approach and has interfaces with third-party tools via the functional mock-up interface (FMI) standard [34]. The software addresses complex areas in vehicle development, including electrical networks, thermoregulation systems, mechanical and thermodynamic systems, and control tasks. For battery electric vehicles, it aids in answering critical questions about battery packs, thermal management, electric motors, transmission coordination, and operating strategies. Benefits include easy-to-parameterize models for concept studies, and the ability to study interrelationships between domains, to control calibration in a virtual environment, and to serve as a starting point for detailed 3D simulations in order to evaluate component requirements. The purpose of the non-hybrid model created in CruiseM was to check the accuracy of the newly introduced VSP frequency model in different tested conditions and cycles. A new VSP model was developed based on the specific power of the vehicle, and frequency analysis. The CruiseM model was based on maps of consumption and emissions which were obtained with chassis dynamometer in laboratory conditions. The vehicle models were validated with obtained parameters under RDE driving cycle. The next step was the hybridization of both models into a parallel hybrid architecture under equal conditions. The CruiseM model was used as a control model. At the end, the obtained results of the newly developed VSP frequency model and the time domain CruiseM model were compared. The comparison was made on a non-hybrid and hybrid vehicle in RDE, NEDC and WLTC cycles.

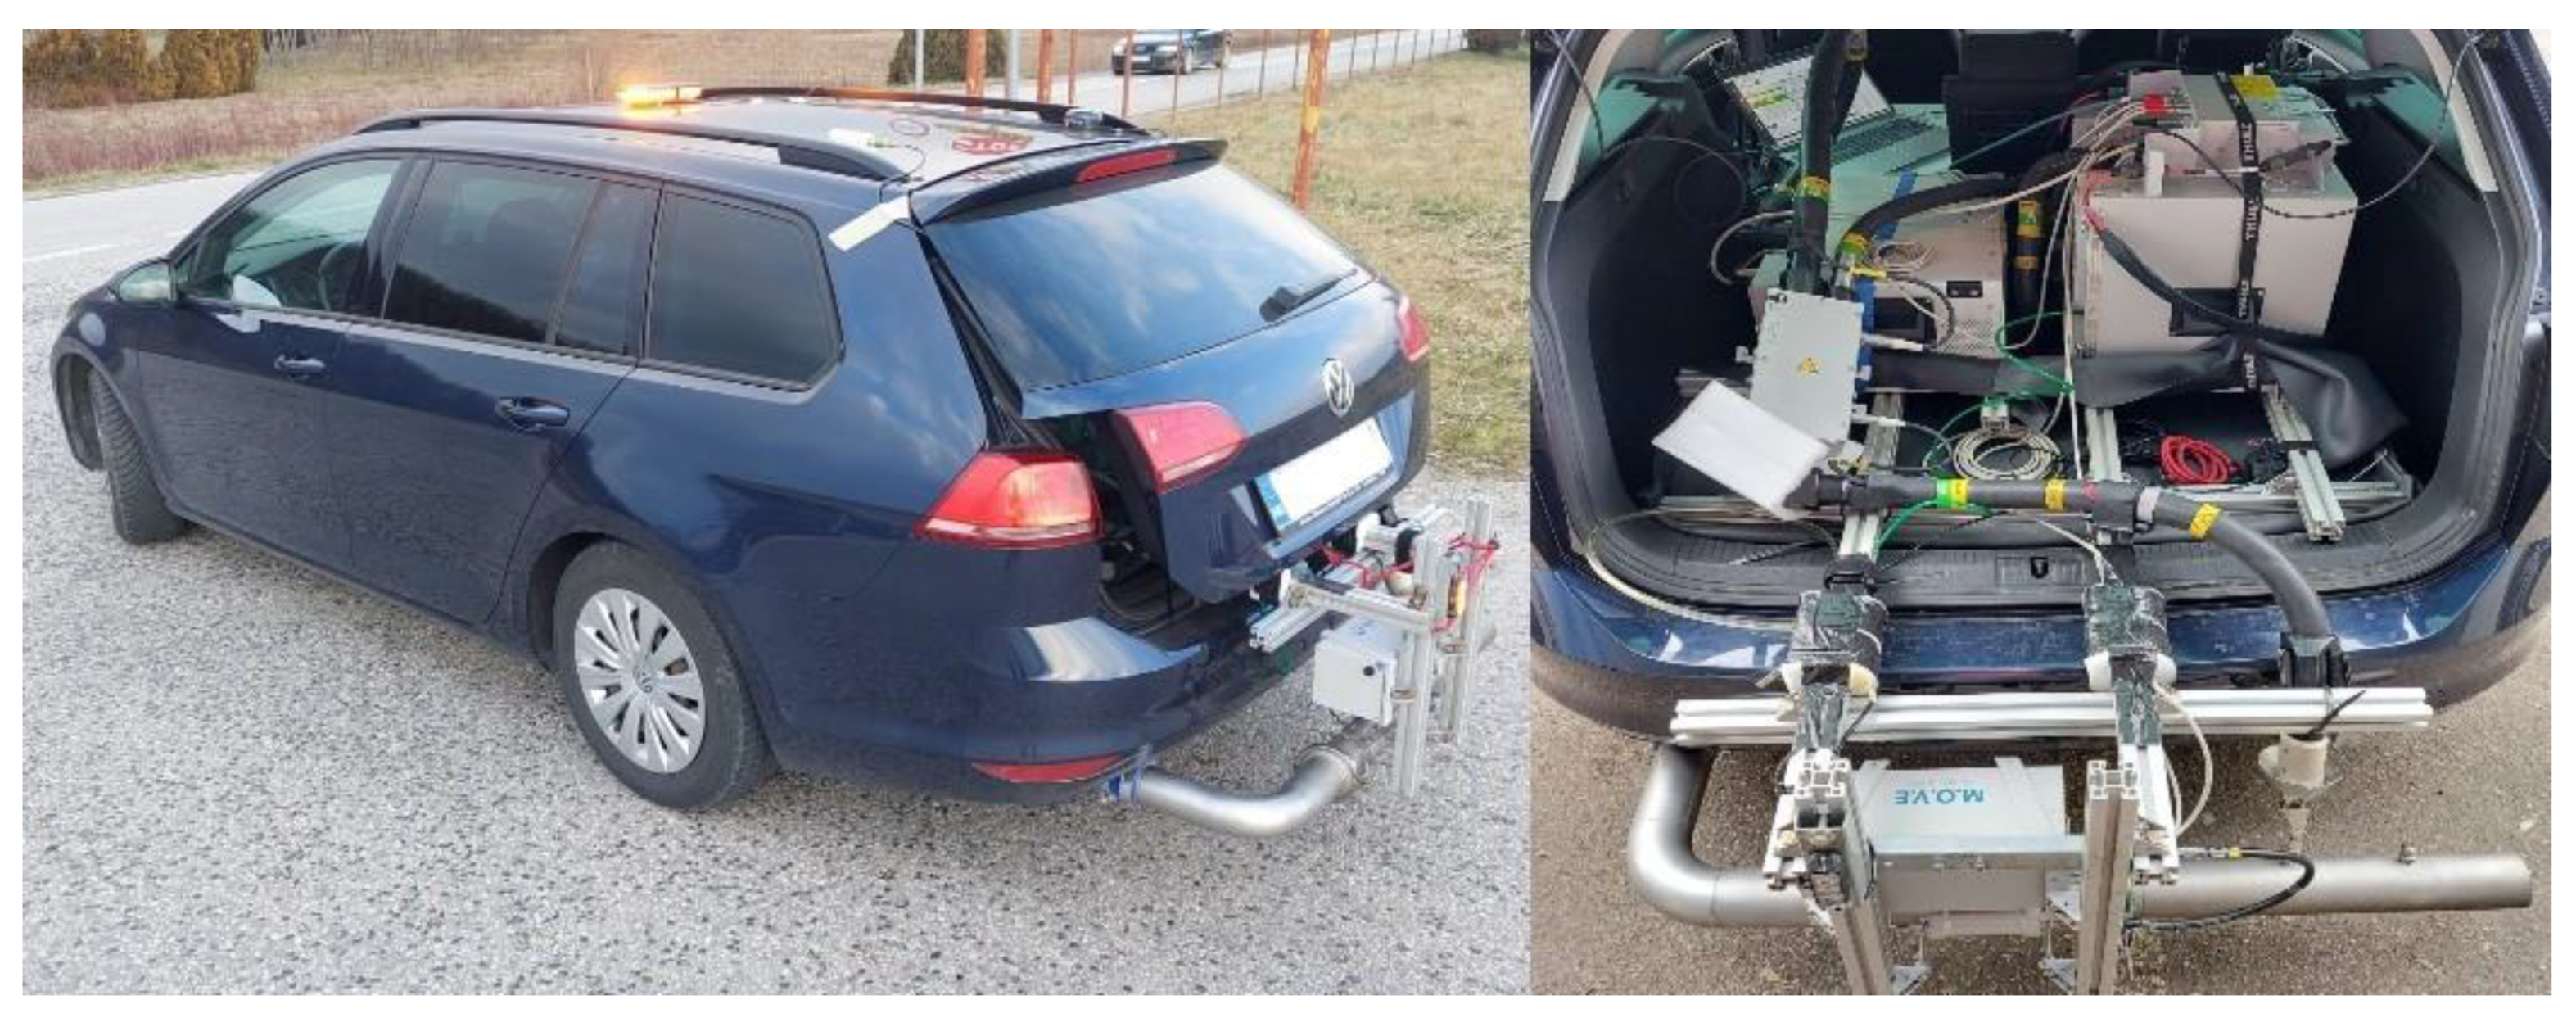
2.1. Measurement and Equipment

The portable emissions measurement system (PEMS) AVL M.O.V.E. was installed on a test vehicle for the purpose of measuring emissions of carbon dioxide and other pollutants in real driving conditions. This system continuously monitors and records vehicle emissions data. The PEMS device is composed of several basic parts that are interconnected and controlled by a central computer. More detailed information about the AVL M.O.V.E. measuring instrument is shown in Table 1.
To diminish impact on the driving dynamics, the majority of equipment was installed in the trunk of the vehicle: gas analyzers, solid particle counter, and central computer with battery. Exhaust gas mass flow meter, GPS receiver and meteorological station for monitoring atmospheric conditions were installed outside. A photo of the vehicle with all the measuring equipment is shown in Figure 1. Measurements of current power, consumption and emissions were recorded along an 87 km long route that meets the RDE measurement criteria, and all measurements were performed according to the RDE test procedure. The calibration of the measuring instruments was performed before the start of the measurement and after the measurement was completed. Continuous power measurement was carried out via OBD diagnostics, whose power values were previously calibrated on a chassis dynamometer at several operating points throughout the entire engine operating range. The emission maps and consumption maps that were used in the creation of the time domain CruiseM model were obtained by measuring emissions and consumption on the chassis test bed at different engine loads and speeds. In all laboratory measurements, a MAHA LPS 3000 chassis dynamometer was used, equipment was sourced from MAHA Maschinenbau Haldenwang GmbH & Co. KG, Haldenwang, Germany. The vehicle was type approved according to the EURO6b standard [35], based on the laboratory NEDC test cycle and is powered by a 1.6 L diesel engine with a maximum power of 77 kW with EGR, DOC and DPF antipollution systems and a 5 speed manual gearbox. Coast-down analysis was used to determine the resistances of the vehicle. This was obtained by recording the speed from the OBD system with a resolution of 1 s. The measured speed from the OBD was previously calibrated with the GPS system.
The vehicle model was created in the CruiseM software package with a quasi-static approach, which starts from the driver’s request to follow a predetermined speed pattern or driving cycle, with a schematic representation shown in Figure 2. The request is transmitted to the drive system via the appropriate regulator and accelerator pedal which has its own characteristics and transient response. The torque is transmitted to the transmission system, which has its own gear ratios and losses all the way to the wheels and which needs to achieve the necessary torque or driving force to meet the required velocity pattern. This approach gives particularly good results in CO2 emissions, consumption estimation as well as NOx emissions estimation [24].
The next step was the modelling of a full hybrid vehicle with a parallel configuration. An identical model was also used in the simulation of a non-hybrid vehicle with the exclusion of the components marked blue in Figure 3. As measurements were taken with a moderate driving style, the transverse and vertical dynamics have negligible influence on fuel consumption and emissions, so the vehicle dynamics model was reduced to solely reflect longitudinal dynamics. The vehicle resistance forces were defined as a function of the vehicle speed, by a polynomial of second degree (1) obtained from the coast down analysis [36]. The vehicle drag force equation is defined as:
f 0 + f 1 × v + f 2 × v 2 = T M d v d t
where parameter f0 is the free term, f1 is the linear component and f2 is the quadratic component.
The internal combustion engine was modeled as a black box based on the corresponding consumption or CO2 maps and NOx maps, which give the correlation of the corresponding emissions with the engine current operating point. Engine maps were also obtained by testing on chassis test bed sweeping the entire operating range. The engine is controlled by desired load from a controller. Engine limits were determined by the maximum torque as a function of rotation speed. The motoring torque losses were set up with an interpolation curve depending on the rotation speed. A classic gearbox with five forward gears was modeled, with the same transmission ratios as the physical gearbox. The efficiency and the moments of inertia were held constant. The vehicle powertrain contains two clutches, the first (separator) serves to separate the ICE from the rest of the powertrain and the second is a standard clutch for coupling power devices with the transmission. The separator enables one to connect/disconnect the ICE to/from the whole system according to the applied HEV strategy (e.g., e-drive, e-brake regeneration, etc.). In addition, a transmission controller is required for gear up-/downshifting as well as actuating both clutches. Both clutches are driven by thrust force and modeled with the following parameters: maximum torque, moment of inertia and “clutch release” dependence characteristic on thrust force.
A 48 V electric drive system was used, which consists of a battery, a power consumer and an electric machine (EM) that is mechanically connected between two clutches. The EM is modeled as a basic quasi-static model that instantly responds to the torque demand. The characteristics of EM are defined in both working quadrants separately. The maximum torque limit is defined in generator and motor mode depending on the rotation speed as well as the efficiency characteristics with an additional parameter of the operating voltage. The drive control calculates the e-motor load signal in both traction and recuperation conditions, by modifying the cockpit output signals. If the braking effect of the e-motor torque is below the driver’s request in terms of equivalent brake pressure, then the mechanical brakes are supplied with pressure. The HEV controller contains a basic state machine which smoothly applies different hybrid strategies according to the current driving situation. A baseline management strategy was chosen according to the rules and which does not have the ability to adapt to different driving conditions [37]. Consequently, change of control parameters during testing in different cycles was undertaken manually. For an easier comparison of fuel and energy consumption between different models, the charge sustain mode was used, which requires the battery to be equally charged at the beginning and at the end of each testing cycle.

2.2. VSP Model

Vehicle specific power (VSP) is defined as a ratio of the instantaneous power to the vehicle’s mass and is used to overcome the vehicle’s resistances, including rolling and aerodynamic resistances, and kinetic and potential energies (2) [33]:
V S P = d d t K E + P E + F r o l l · v + F a e r o · v m = d d t K E + P E + F r e s · v m        = d d t 1 2 m · v 2 + m g h + f 0 + f 1 · v + f 2 · v 2 · v m
All vehicle resistances, including rolling resistances, are also defined by longitudinal dynamics as in the classic Cruise M model in which moments of inertia are approximated with a 3% increase in vehicle mass [38]. The total traction energy is calculated according to:
E t r = 0 T m V S P d t
The mathematical description of the vehicle’s specific power (2) is the basis for the model of the current traction power or energy consumption. This model was created using a kinematic or backward approach that starts from the end components of the vehicle, i.e., the wheels, which require a certain torque to follow the cycle. The schematic representation of the backward model is shown in Figure 4, the flow of information or requests is opposite to the flow of energy. The movement of the vehicle absolutely coincides with the cycle being followed, so an additional condition is added which takes into account whether the vehicle can meet the power request at every point of the driving cycle.
The VSP model is a discrete model formed by frequency analysis of measured emissions and consumption within certain power ranges or classes. The starting assumption is that the amount of each emission per unit of traction energy is always equal within the observed power class, regardless of the driving cycle. More accurate results are obtained by using a larger number of small ranges classes, but a large number of classes increases the complexity of data processing. The power classes are determined according to the power binning method within EU regulation 2016/427 [39], which gives normalized values of their power ranges. Some changes were introduced in classes 2 and 3. The change in the 2nd class refers to the division into its positive and negative parts separately, and class 3 is divided into two equal parts in order to increase the accuracy of the model. The denormalized values of power class ranges for the tested vehicle are shown in Table 2.
The bin classification is undertaken according to the limits specified in Table 2, and according to the conditions of maximum and minimum traction power according to (4):
P c , j   l o w e r   b o u n d < P w h e e l   P c , j   u p p e r   b o u n d   
m x , j = a l l   k   i n   c l a s s   j m x , k
The traction energy of the j class is calculated according to (6):
W t r , j = m v e h i c l e a l l   k   i n   c l a s s   j V S P t r , k t k
The value of individual emissions per unit of traction energy of the j class is equal to the ratio of the total amount of emissions of the grade and its total traction energy (7):
m ˙ x , j = m x , j W t r , j = a l l   k   i n   c l a s s   j m x , k a l l   k   i n   c l a s s   j P t r , k t k = a l l   k   i n   c l a s s   j m x , k m v e h i c l e a l l   k   i n   c l a s s   j V S P t r , k t k
The distribution of emissions and energy by power classes during the testing in real driving conditions are shown in diagram in Figure 5. The energy shares of the classes are expressed in percentages relative to the total positive traction energy.
The total amount of emissions and consumption is obtained by summing the emissions of all individual classes, i.e., the product of specific emissions and the traction energy coming from the internal combustion engine, according to (8):
M x = j m x , j = j m ˙ x , j W t r , j
When modelling a non-hybrid vehicle, all power classes were calculated in the assessment of complete cycle emissions. The main point of hybrid vehicles, including this hybrid vehicle model, is to use the most favorable operation regions for each available power source, according to a defined objective function that usually evaluates emissions and consumption. Traction energy of the j-class produced by an internal combustion engine is given in (9):
W t r , j = w t r , j + w m w a , j γ j w s t o r e d '
where wtr,j represents the total traction energy of j class that the engine would generate without hybrid drivetrain components, and wmwa,j represents the additional mechanical energy due to the shift of the operating region of the engine to the more favorable class. Stored energy w s t o r e d ' (10) consists of the regenerative braking energy Wbr and the stored energy of the engine produced by moving operating region Ws,mwa
w s t o r e d ' = η g η s t η m α η g b 2 η f 2 W b r + η g b η f W s , m w a
Inserting Equation (10) into Equation (9) gives Equation (11):
  W t r , j = w t r , j + w m w p , j γ j η g η s t η m α η g b 2 η f 2 W b r + η g b η f W s , m w a
The energy flows are based on the flow diagram from [40], with slightly modified labels and definitions of all energy sources and sinks with regard to the drive shaft. The objective function is the minimum product of certain emissions and associated weighting factors (12):
J = A M C O 2 + B M N O x + C M P N + D M C O
Due to the limitations of the classic CruiseM model, only CO2, fuel consumption and NOx emissions were retained, and the objective function (13) preferred only the minimization of consumption and CO2 emissions:
J = A M C O 2 = j m ˙ C O 2 , j W t r , j
Inserting Equation (11) into Equation (13) gives Equation (14):
J = A j m ˙ C O 2 , j w t r , j + W m w p , j γ j η g η s t η m α η g b 2 η f 2 W b r η g b η f W s , m w a  
The total stored engine moving operating region energy is obtained by multiplying power differences between the engine’s average j-class power, Pe,j, and the required traction power, j-th class, with the engine’s operating time, Tj,mwa (15):
W s , m w a = j T j , m w a ( P e , j P j )
The total recuperated energy from braking is obtained by the sum of the braking energies of all individual classes (16):
W b r = j W b r , j

3. Results and Discussion

3.1. Vehicle Models

Based on emission measurements and other relevant parameters, a CruiseM model, as well as a new frequency model of a non-hybrid vehicle was created. The vehicle energy balance and the main conversion pathways of chemical energy derived from the fuel are shown in the diagram in Figure 6 below:
The overall efficiency of the internal combustion engine in the test conditions of the vehicle was quite high, over 32%, but it should be emphasized that the efficiency in city driving conditions is far lower and in certain conditions falls below 10%, while the maximum engine efficiency is around 42%. This difference shows the utility of the hybrid drive, which has the ability to move the load point towards the higher efficiency. Of the total traction energy, 84% was spent on overcoming the vehicle’s resistances and that part of the energy is irreversible, while the rest was spent on vehicle braking which can be returned to the system through regenerative braking. The testing was carried out on roads without a significant change in altitude and in conditions of moderate traffic, which resulted in more uniform driving with only 16% reversible energy. The distribution of emissions and traction energy according to power classes is shown in a bar graph in Figure 5, where all energy values are shown relative to the total positive traction energy of the RDE cycle, while emissions are shown as a percentage of the total emissions generated during the cycle. The relevant parameters for the comparison of the VSP non-hybrid model and CruiseM non-hybrid vehicle model are presented in Table 3.
The distance and emissions of the VSP non-hybrid model match the measured data perfectly because the model was calculated using those parameters. Positive and negative traction energy deviate from the measured values because they are calculated via Equation (2) based on current specific power. The distance deviation of the CruiseM model is a consequence of the forward approach, which controls velocity using a PI regulator. In this approach the driving cycle is not perfectly followed because it considers system response time. Deviations of positive traction energy, distance, consumption and CO2 emissions are within 1% of actual values. Only the relative negative traction energy significantly deviates between the two models, while the absolute deviation is small due to the small value of negative traction energy. The reason for this deviation is the same as for the distance deviation.

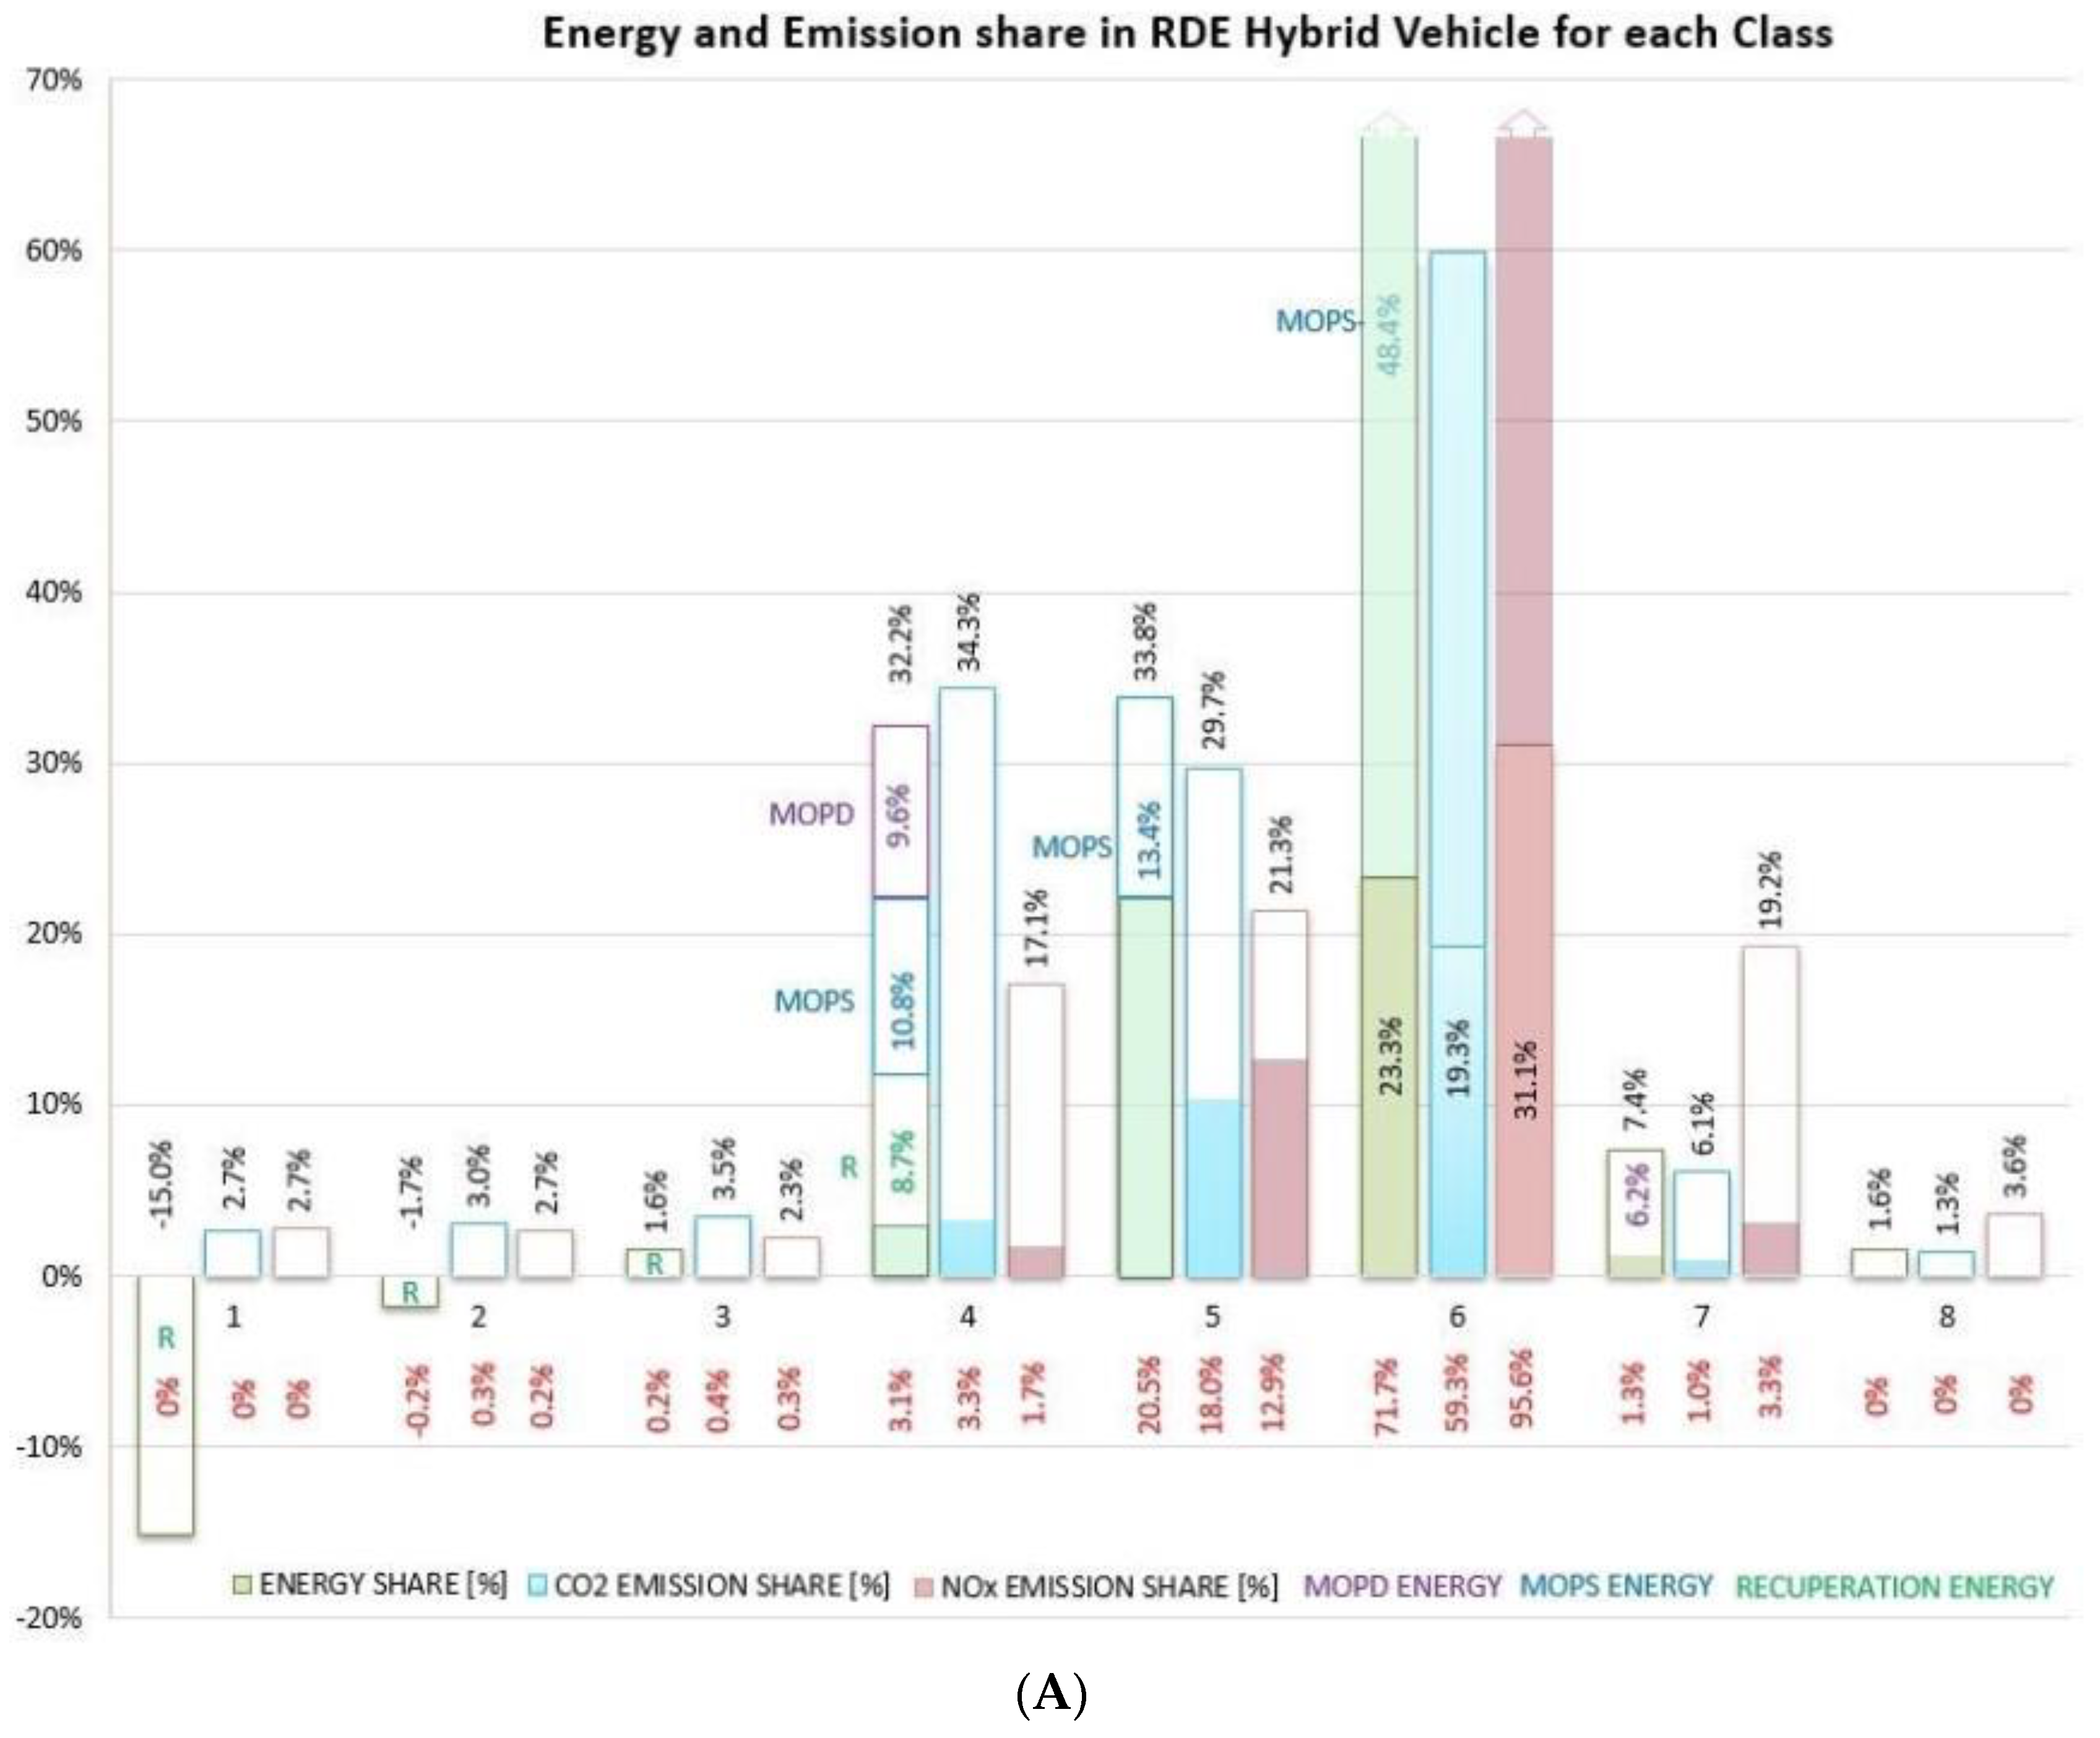
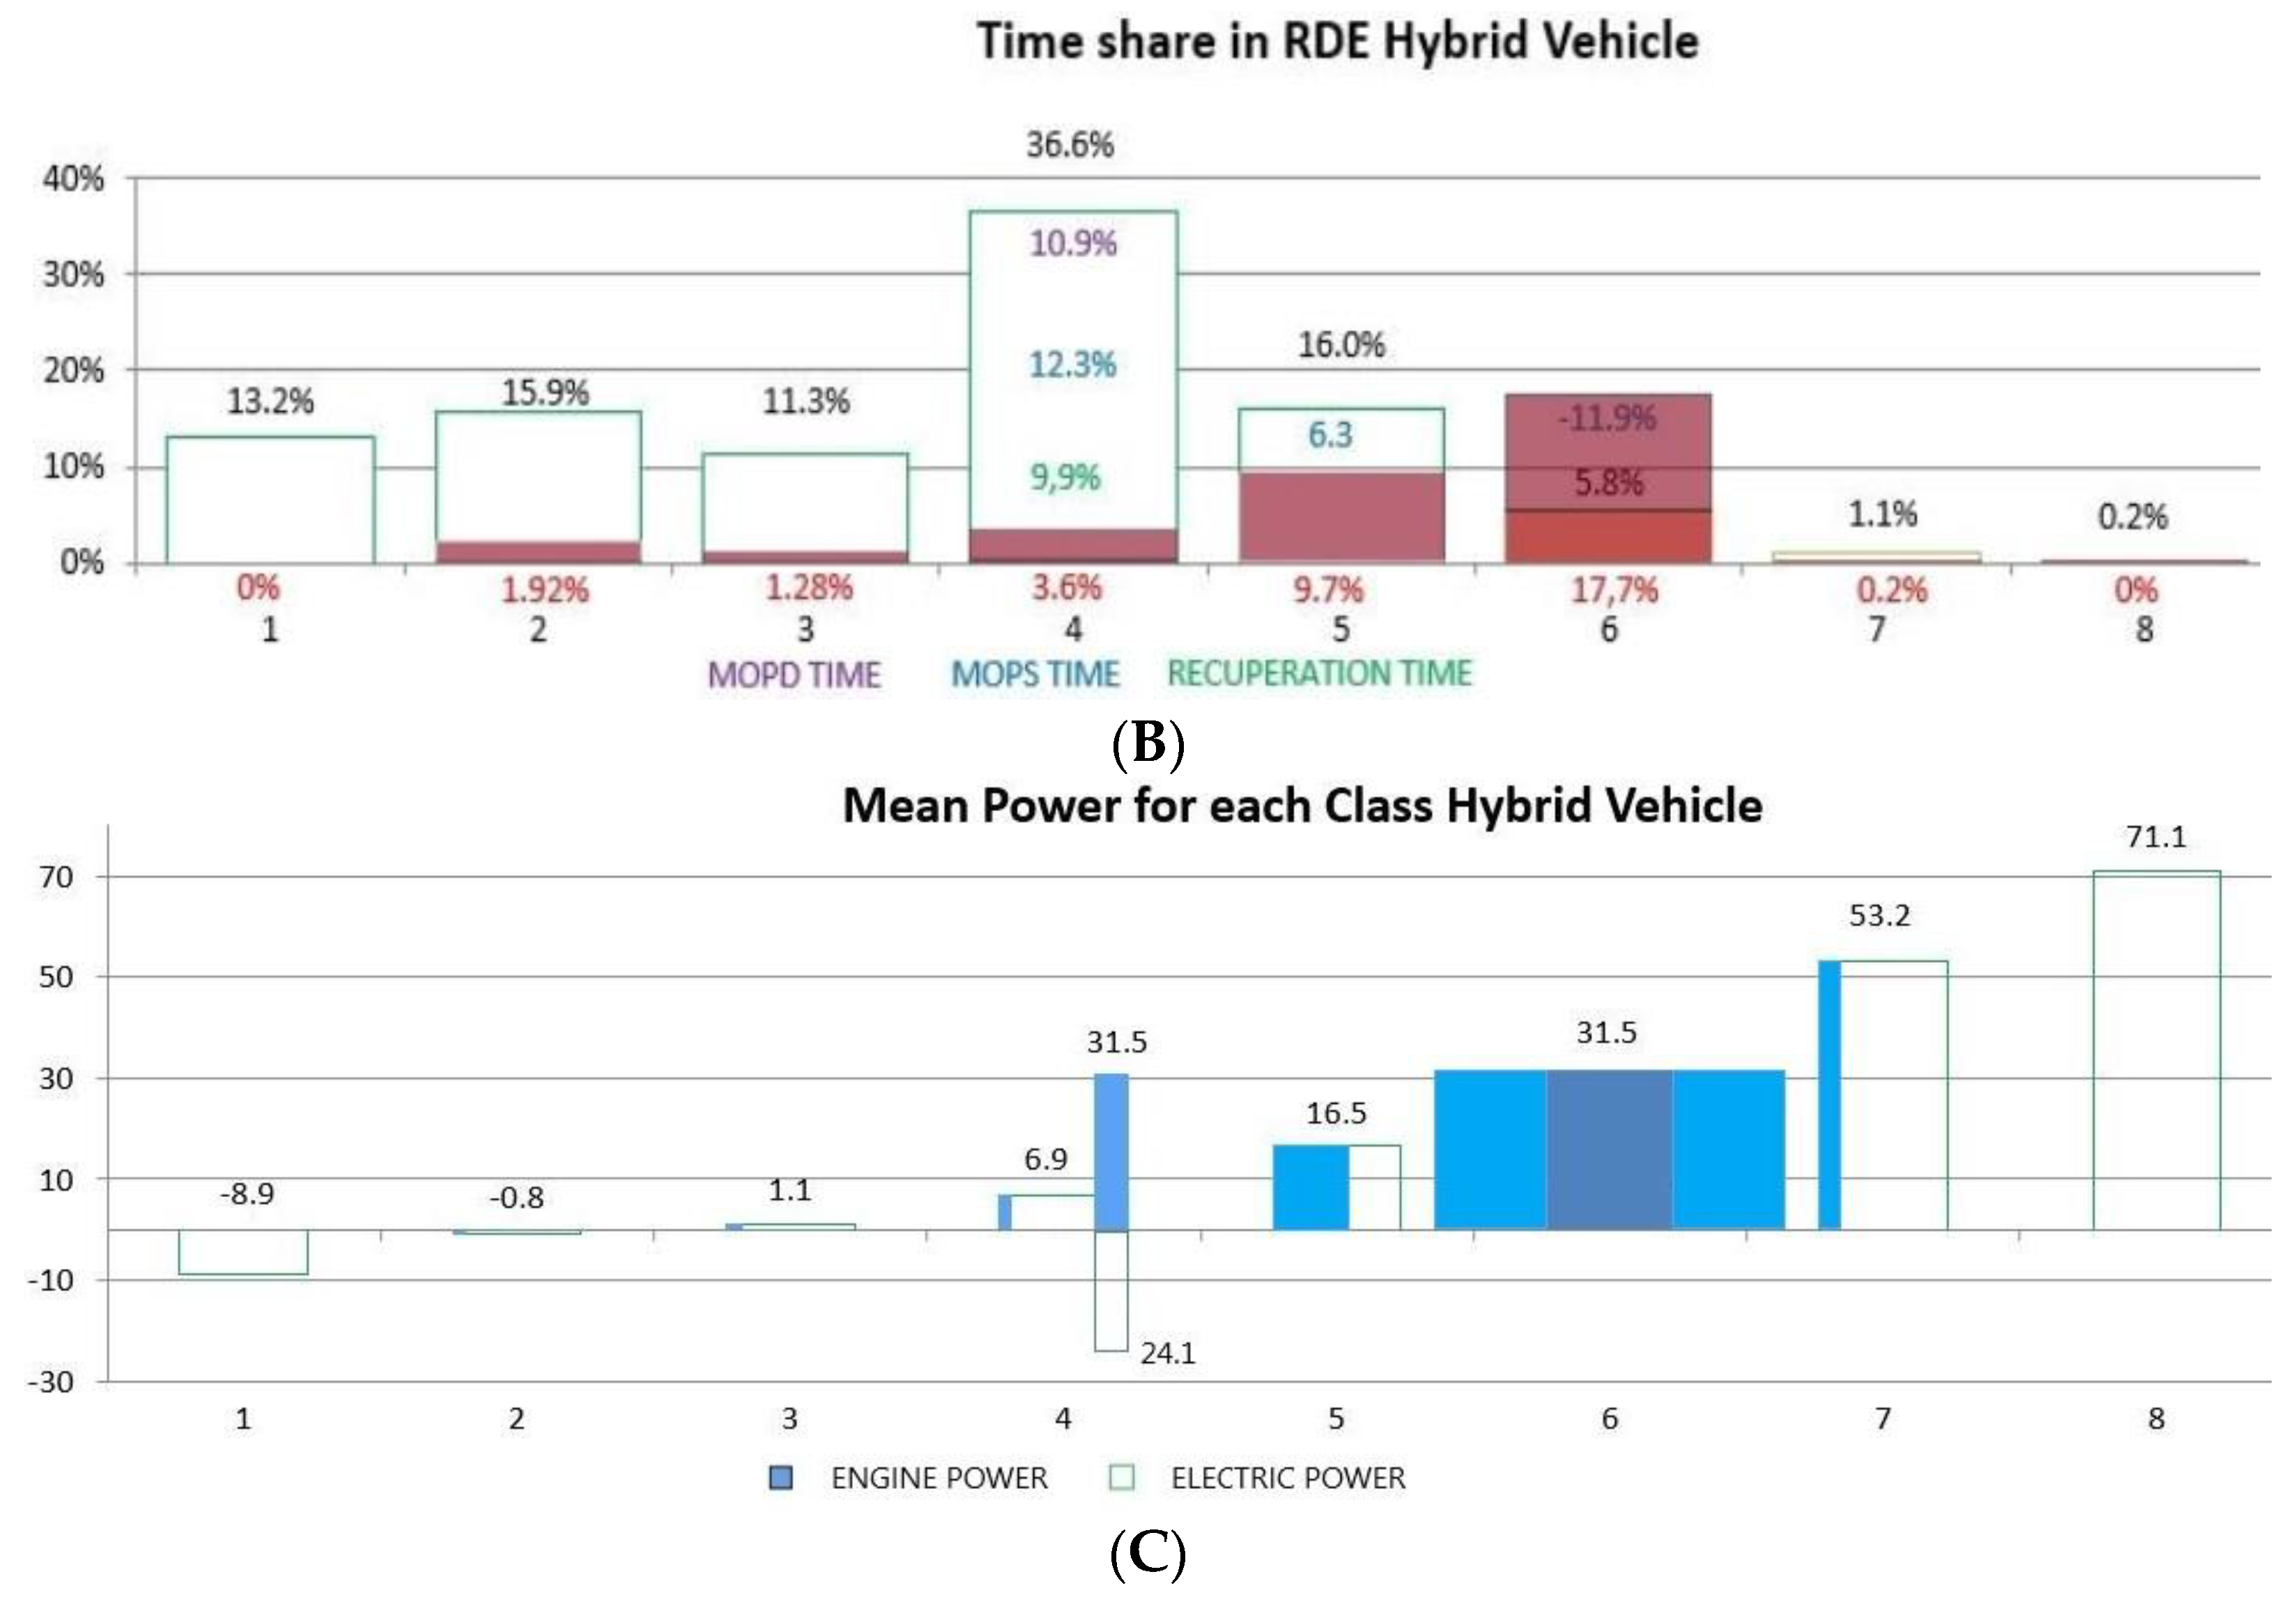
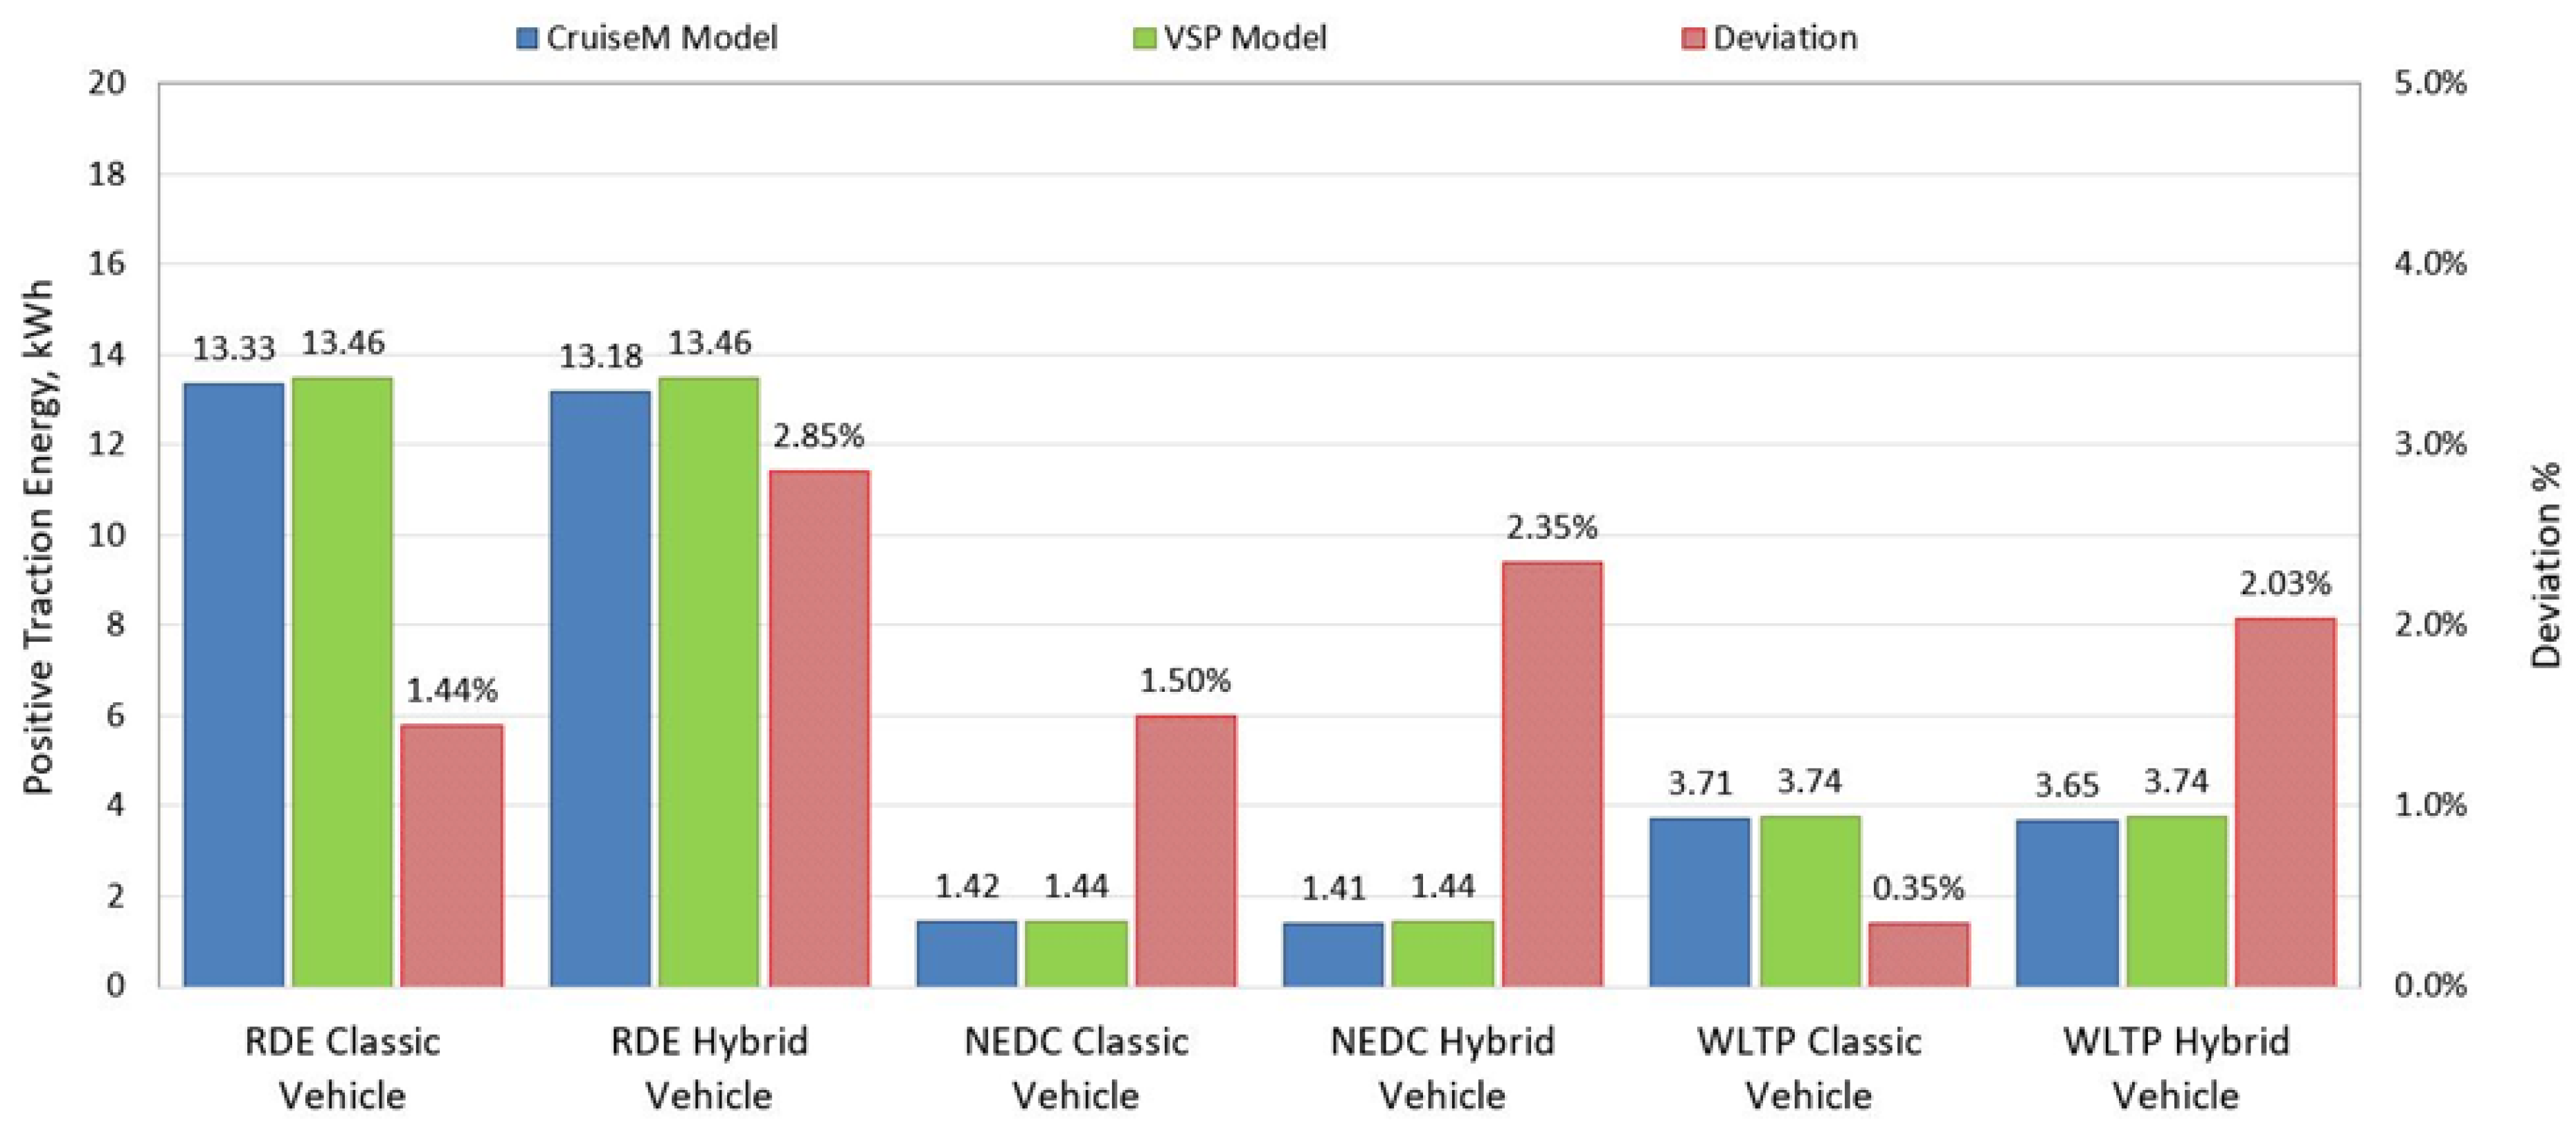
3.2. Testing of Hybrid and VSP Vehicle Models in RDE, NEDC and WLTC Driving Cycles

Both hybrid models were tested and compared using standard cycles: the RDE cycle, which is identical to the already performed measurement; the NEDC cycle, which is outdated by today’s standards; and the WLTC cycle, which has gradually replaced NEDC. The CruiseM model is optimized based on a set of simple rules described with global objective function. The VSP model works in the frequency domain, so it does not have the possibility of real-time optimization, but the same rules can be used to compare these two models. In this case, the primary goal is to compare the two models so that the VSP frequency model follows the conditions of the CruiseM model. The objective function is a minimization of CO2 emissions or consumption, so the optimization prefers medium and higher power classes in which the internal combustion engine works more efficiently. On the other hand, the highest classes generate high NOx emissions, which in this case are not penalized because they are not covered by the objective function (14). The distribution of traction energy, emissions, and consumption for the hybrid vehicle under the RDE cycle is graphically depicted in Figure 7A using a bar chart.
All emissions and energy shares are expressed relative to the emissions of a non-hybrid vehicle and to the positive traction energy of each cycle. Classes 1 and 2 have a negative traction power where any engine operation is generally unnecessary, but regenerative braking is possible. The internal combustion engine remains switched on in class 2 only 1.92% of the time, as shown in Figure 7B, and consumes 0.2% of the total traction energy, as shown in Figure 7A. This small amount of energy consumption is not the most optimal solution from an energy point of view, but is a consequence of replicating the energy management strategy of the CruiseM model.
Class 3 represents the lowest values of positive traction power with a mean power of 1.1 kW, as shown in Figure 7C. This engine’s operating region is very inefficient, so the goal is to completely eliminate the engine’s work and replace that energy with stored regenerative braking energy. Similar to the CruiseM model The engine remained in operation for only 1.28% of the operation time compared with the 11.3% of the total operation time of the non-hybrid vehicle, as shown in Figure 7B and generated 0.2% of the total traction energy, as shown in Figure 7A. In class 3, the vehicle emits 0.4% instead of the initial 3.5% of CO2 emissions and 0.3% of NOx emissions instead of the initial 2.3%.
Class 4 has a slightly higher average power of 6.9 kW but is still deep in the inefficient region in terms of consumption and CO2 emissions. With a hybrid drive, it would also be desirable to completely eliminate the operation of the engine in this region, but the engine remains on for 3.6% of the total driving time, as in Figure 7B, generating 3.1% of the total traction energy. Class 4 contains 32.2% of the total traction energy, where 8.7% of the energy was gained from regenerative braking. The remaining 20.4% was obtained by moving the operating region of the engine to the more efficient class 6. Of the 20.4% of the mentioned energy, 9.6% was obtained directly from the internal combustion engine operating in a higher class and this is marked in Figure 7A as moving operating point direct (MOPD), while 10.8% is obtained from stored energy from the battery, which is generated as the excess engine energy gained from the moving engine operating point, marked on the graph as moving operating point stored (MOPS). Considering the time shares of individual classes, as in Figure 7C, the engine works only 3.6% of the time with the power of the original class, it works 10.9% of the time with the average power of the preferred 6th class, and in the remaining time the vehicle is powered by energy from the battery, 9.9% from regenerative braking and 12.3% from MOPS. In class 4, the vehicle emits 3.3% instead of the initial 34.3% of CO2 emissions and 1.7% of NOx emissions instead of the initial 17.1%.
In class 5, 20.5% of the energy comes from the internal combustion engine, while the remaining 13.4% is used from the battery and gained through MOPS. The engine generates 18% of CO2 emissions instead of the initial 29.7% and 12.9% of NOx emissions instead of the initial 21.3%. Class 6 is the preferred choice given its engine efficiency, so the share of internal combustion engine energy increases in favor of other classes from 23.3% to 71.7% of the total initial traction energy. At the same time, the CO2 emissions of class 6 increase from 19.3% to 29.3% of initial total CO2 emissions, while NOx emissions increase from 31.1% to 95.6%.
Class 7 also belongs to the less efficient region, compared with class 6, and engine energy covers only 1.3% of the initial required 7.4%. This 1.3% of the traction energy also results from the CruiseM model energy management strategy. The total CO2 emissions of the hybrid vehicle were reduced from 6.1% to 1%, while NOx emissions were reduced from 19.2% to 3.3%. The bar diagram in Figure 8 shows the respective comparative results of the vehicle travelled distance for the VSP and CruiseM models of hybrid and non-hybrid vehicles in RDE, NEDC and WLTP cycles. In contrast with Table 3, where the deviations are expressed in relation to the measured values of the RDE cycle, the following bar diagrams show the deviations between the VSP and CruiseM models.
As mentioned above, the cause of the deviation between the two models lies in the different modeling approaches. The VSP was created as a backward model that perfectly follows the given speed profile, while the deviation of the travelled distance of the CruiseM model is a consequence of the forward approach, which in this case includes the PI regulator. Despite the different approaches, the maximum deviation of the travelled distance is less than 0.7%, which is a more than acceptable result. In the RDE cycle, the travelled distance of both models deviates the most, −0.69% for the hybrid model, and −0.48% for the non-hybrid model. Better results were achieved with laboratory cycles compared with the RDE cycle. One of the important reasons is certainly the influence of altitude, which laboratory cycles cannot replicate. In the NEDC cycle, the travelled distance of classic vehicles differs by 0.29% for a non-hybrid vehicle and 0.13% for a hybrid vehicle. The smallest deviations, of 0.05% for the non-hybrid vehicle and 0.04% for the hybrid vehicle, were recorded in the WLTP cycle. Although the deviations in the travelled distance are small, they were taken into account as a corrective factor when comparing other parameters. The bar graphs in Figure 9 and Figure 10 show the comparative results of the positive and negative traction energies required for the vehicle to overcome the test driving cycles for different cycles. The differences that arise in the traction energies are also a consequence of the forward model, i.e., the settings of the PI regulator. The largest deviation of positive traction energy was recorded between RDE models of hybrid vehicles at 2.85%. Relative deviations of negative traction energies are significantly higher due to small absolute amounts, but the absolute amounts are small and acceptable considering the impact on emissions and consumption. The largest relative deviation of negative traction energies is shown by the non-hybrid vehicle model in the WLTP cycle of over 8%, but on an absolute scale only 0.07 kWh.
The comparison of CO2 emissions and fuel consumption is shown in the bar diagrams in Figure 11 and Figure 12. CO2 emissions are expressed in absolute values i.e., in grams that are corrected according to the travelled distance, while consumption is traditionally expressed in liters per 100 km. The most significant deviations were recorded for the hybrid vehicle model in RDE conditions at 3.79% and for the non-hybrid vehicle model in the WLTP cycle at 4.4%. If we compare the results according to cycles, the NEDC cycle in both modelled vehicles, hybrid and classic, gives deviations slightly higher than 1%. The CruiseM model was used as a reference, but it is possible that this model also causes some deviations because it does not include transients.
The reason for the good overlap between the results of the NEDC cycle lies in the cycle itself, with constant accelerations where the classic CruiseM model, which is based on consumption and emission maps, approximates the real situation relatively well due to a reduced influence of transient phenomena.
Because the vehicle is type approved according to the Euro 6b standard, which includes testing in laboratory conditions according to the NEDC cycle, it is possible to compare the results with the type approved values. The declared value of CO2 emissions in the NEDC cycle for the tested vehicle is 102 g/km, while the value of CO2 emissions of the modelled vehicle is slightly less than 111 g/km. A deviation of 8.8% was expected, considering that the type approval procedure at that time was performed on a “golden vehicle” which gave significantly better results than the tested one. All of the results derived from the hybrid models were achieved by following the strategy of the CruiseM model based on set of rules. However, the best result was achieved by optimizing the VSP hybrid model without taking into account the CruiseM strategy, which, in terms of CO2 emissions, gives about 4% better results than those shown in Figure 12, and would put this vehicle inside the legal limit of 95 g of CO2 emissions in real conditions.
The absolute amounts and corrected deviations of NOx emissions of both models applied to different cycles are shown by the bar graph in Figure 13. The deviations of NOx emissions are, on average, slightly higher than CO2 emissions and fuel consumption, primarily due to the larger possible deviations of the classic map-based CruiseM model that does not include transients. Transient phenomena in the assessment of NOx emissions have a greater impact due to the way that NOx emissions are regulated through exhaust gas recirculation [11].
The largest deviations of NOx emissions, of 9.62%, are shown with the hybrid vehicle models in the WLTP cycle, while the same models in the NEDC and RDE cycles show deviations slightly higher than 6%. The non-hybrid vehicle models in the RDE, NEDC and WLTP conditions differ by 0.13%, 2.53% and 6.07%, respectively. Larger deviations in the WLTP cycle, especially in NOx emissions, are expected due to extremely dynamic driving.

4. Conclusions

This paper presents a VSP model based on frequency analysis, which represents a new way of modeling primarily hybrid, but also classic non-hybrid vehicles. A comparison of two independent models, VSP and one made in CruiseM, was performed in order to prove the usefulness of the much simpler VSP model with the possibility of obtaining results with similar accuracy. Positive and negative traction energies data, which are necessary to follow the desired cycle, as well as CO2 emissions data, fuel consumption and NOx emissions, were analyzed and compared. First, the VSP model was tested on a hybrid vehicle under RDE conditions following the same rule-based strategy as the CruiseM model. Furthermore, the energy balance calculation is presented in detail, as well as the calculation of the corresponding CO2 and NOx emissions for each individual class. All hybrid modes time shares, as well as the shares of individual traction energy components and average ICE power, are graphically presented and classified into the necessary traction power classes. Absolute comparative data are presented graphically with all deviations expressed relatively with a correction according to the travelled distances. The deviations of the travelled distances are very low, with the highest value of 0.69% for the hybrid vehicle and the RDE cycle. The causes of the deviations lie in the different modeling approaches, a backward approach for the VSP model and a forward approach for the CruiseM model, where the PI controller causes slight deviations. All positive traction energies have positive deviations in the VSP model of between 0.35% for the WLTP model of the non-hybrid vehicle to a maximum of 2.85% for the RDE hybrid model. The deviations of the negative traction energy are relatively higher, up to 8.38%, which is expected because of their small absolute values compared with the total positive traction energy, so they have negligible impact to the overall results. The most important elements of the comparison of the two models are CO2 emissions and fuel consumption, where the biggest deviation of the results was recorded for the hybrid model of the vehicle in RDE cycle conditions of 3.79% and for the non-hybrid vehicle model in WLTP conditions of 4.4%. All other combinations of cycles and models give deviations of about 1%, which is an excellent result that directly proves the reliability of the model. The best result obtained by optimizing the VSP model of the hybrid vehicle in RDE conditions, independently of the CruiseM model, is about 4% better relative to the result obtained following the CruiseM strategy. This outcome means that this vehicle would reach the legally prescribed, penalty-free limit of 95 g/km under real-world conditions. Regarding the results of the comparison of NOx emissions, the deviations are somewhat larger compared with CO2 emissions and consumption. The largest deviations of NOx emissions, of 9.62%, are shown by the hybrid vehicle models in the WLTP cycle, while the same models in the NEDC and RDE cycles show deviations slightly higher than 6%. The models of non-hybrid vehicles in the RDE, NEDC and WLTP conditions differ by 0.13%, 2.53% and 6.07%, respectively. Larger deviations of these emissions are expected due to the reduced performance of the CruiseM model when predicting the NOx emissions that are controlled by the EGR system, which in turn is very sensitive to transient phenomena that are not described by this model. This research has shown very good results for the simpler VSP model when predicting fuel consumption and CO2 and NOx emissions without using complex time domain models which require great skills and complex algorithms to realize real objective functions. Another problem of the time domain model is that it sometimes gets stuck in local minima without finding an optimal global solution, so there is also the possibility to use the VSP model as a control mechanism for the time domain model. Such a model enables a much simpler definition of the objective function, and thus also enables the simplification of the optimization of complex energy management systems such as hybrid propulsion systems. Future research should be directed towards determining the influence of various parameters of the VSP model on its accuracy, especially the selection of the number of classes and their ranges. The possibility of expanding the model in a multidimensional domain should also be investigated, i.e., that it should be expanded with additional influential parameters.

Author Contributions

Conceptualization, A.K.; methodology, A.K.; software, A.K., T.V. and A.V.; validation, A.K., T.V. and A.V.; formal analysis, A.K., T.V., G.R. and A.V.; investigation, A.K., T.V. and G.R.; resources, A.K., T.V., G.R. and A.V.; data curation, A.K. and T.V.; original draft preparation, A.K.; writing, A.K., T.V. and G.R.; visualization, A.K.; supervision, G.R.; project administration, G.R.; funding acquisition, G.R. All authors have read and agreed to the published version of the manuscript.

Funding

This work has been fully supported by the Croatian Science Foundation under the project IP-2020-02-6249.

Data Availability Statement

The data used in this study are reported in the paper figures and tables.

Acknowledgments

The authors would like to thank the Faculty of Mechanical Engineering and Naval Architecture from Zagreb for their contribution to the experimental research and AVL, Graz for software support.

Conflicts of Interest

The authors declare no conflict of interest.

Abbreviations

DOCDiesel oxidation catalyst
DPFDiesel particulate filter
EGRExhaust gas recirculation
EMElectric machine
EMSEnergy management strategy
EVElectric vehicle
GPSGlobal position system
HEVHybrid electric vehicle
ICEInternal combustion engine
KEKinetic energy
LPGLiquid petroleum gas
NEDCNew European driving cycle
OBDOn-board diagnostics
PEPotential energy
PEMSPortable emission measurement system
RDEReal driving emission
TMTechnical mass
VSPVehicle specific power
WLTPWorldwide harmonized light vehicle test procedure
f0, f1, f2Coast down analyses free factor, linear factor, quadratic factor
EtrTraction energy
FaeroAerodynamics resistance force
FrollRolling resistance force
FresResistance force
hHeight
mMass
MxTotal mass of x emission
mx,jMass of x emission in j power class
mx,kMass of x emission in k interval
Pc,jPower j-class
Pe,jEngine power j-class
PwheelWheel power
Tj,mwaj class engine ICE operating time
vVelocity
WbrBraking energy
wmwa,jMechanical energy due to the shift of the ICE operating region
Ws,mwaTotal stored energy due to the shift of the ICE operating region
Wtr,jTraction energy from ICE in class j
wtr,jDrive shaft traction energy in class j
αRegenerative braking factor
γjStored energy share in class j
ηg, ηst, ηmGenerator, storage, motor efficiency
ηgb, ηfGearbox, final drive efficiency

References

  1. News European Parliament. EU Ban on the Sale of New Petrol and Diesel Cars from 2035 Explained. Available online: https://www.europarl.europa.eu/news/en/headlines/economy/20221019STO44572/eu-ban-on-sale-of-new-petrol-and-diesel-cars-from-2035-explained (accessed on 26 August 2023).
  2. Regulation (EU) 2023/851 of the European Parliament and of the Council of 19 April 2023. Available online: https://eur-lex.europa.eu/eli/reg/2023/851 (accessed on 5 December 2023).
  3. Mali, B.; Shrestha, A.; Chapagain, A.; Bishwokarma, R.; Kumar, P.; Gonzalez-Longatt, F. Challenges in the penetration of electric vehicles in developing countries with a focus on Nepal. Renew. Energy Focus 2022, 40, 1–12. [Google Scholar] [CrossRef]
  4. Ktistakis, M.A.; Pavlovic, J.; Fontaras, G. Sampling Approaches for Road Vehicle Fuel Consumption Monitoring; EUR 30420 EN; Publications Office of the European Union: Luxembourg, 2021; ISBN 978-92-76-23986-4. [Google Scholar] [CrossRef]
  5. Regulation (EU) 2019/631 of the European Parliament and of the Council of 17 April 2019 Setting CO2 Emission Performance Standards for New Passenger Cars and for New Light Commercial Vehicles, and Repealing Regulations (EC) No 443/2009 and (EU) No 510/2011. 2019. Available online: http://data.europa.eu/eli/reg/2019/631/oj (accessed on 5 December 2023).
  6. Takaishi, T.; Numata, A.; Nakano, R.; Sakaguchi, K. Approach to High Efficiency Diesel and Gas Engines. Mitsubishi Heavy Ind. Rev. 2008, 45, 21–24. [Google Scholar]
  7. Regulation of the European Parliament and of the Council on Type-Approval of Motor Vehicles and Engines and of Systems, Components and Separate Technical Units Intended for such Vehicles, with Respect to Their Emissions and Battery Durability (Euro 7) and Repealing Regulations (EC) No 715/2007 and (EC) No 595/2009. Available online: https://ec.europa.eu/transparency/documents-register/api/files/COM(2022)586_0/090166e5f39c64d8?rendition=false (accessed on 5 December 2023).
  8. Annexes (1–6) to the Proposal for a Regulation of the European Parliament and the Council on Type-Approval of Motor Vehicles and Engines and of Systems, Components and Separate Technical Units Intended for Such Vehicles, with Respect to Their Emissions and Battery Durability (Euro 7) and Repealing Regulations (EC) No 715/2007 and (EC) No 595/2009. Available online: https://ec.europa.eu/transparency/documents-register/api/files/COM(2022)586_1/090166e5f39c64bb?rendition=false (accessed on 5 December 2023).
  9. Maurer, R.; Kossioris, T.; Sterlepper, S.; Günther, M.; Pischinger, S. Achieving Zero-Impact Emissions with a Gasoline Passenger Car. Atmosphere 2023, 14, 313. [Google Scholar] [CrossRef]
  10. Morgan, J.P. Driving into 2025: The Future of Electric Vehicles. Available online: https://www.jpmorgan.com/insights/global-research/autos/electric-vehicles (accessed on 25 May 2022).
  11. Kozina, A.; Radica, G.; Nižetić, S. Analysis of methods towards reduction of harmful pollutants from diesel engines. J. Clean. Prod. 2020, 262, 121105. [Google Scholar] [CrossRef]
  12. Reshma, S.; Samuel, E.R.; Unnikrishnan, A. A Review of various internal combustion engine and electric propulsion in hybrid electric vehicles. In Proceedings of the 2019 2nd International Conference on Intelligent Computing, Instrumentation and Control Technologies (ICICICT), Kannur, India, 5–6 July 2019; IEEE: Piscataway, NJ, USA, 2019; Volume 1, pp. 316–321. [Google Scholar]
  13. Ravi, S.S.; Mazumder, J.; Sun, J.; Brace, C.; Turner, J.W. Techno-Economic assessment of synthetic E-Fuels derived from atmospheric CO2 and green hydrogen. Energy Convers. Manag. 2023, 291, 117271. [Google Scholar] [CrossRef]
  14. Vučetić, A.; Sraga, V.; Bućan, B.; Ormuž, K.; Šagi, G.; Ilinčić, P.; Lulić, Z. Real Driving Emission from Vehicle Fuelled by Petrol and Liquefied Petroleum Gas (LPG). Cogn. Sustain. 2022, 1, 1–8. [Google Scholar] [CrossRef]
  15. Medževeprytė, U.K.; Makaras, R.; Lukoševičius, V.; Kilikevičius, S. Application and Efficiency of a Series-Hybrid Drive for Agricultural Use Based on a Modified Version of the World Harmonized Transient Cycle. Energies 2023, 16, 5379. [Google Scholar] [CrossRef]
  16. Schulze, S.; Feyerl, G.; Pischinger, S. Advanced ECMS for hybrid electric heavy-duty trucks with predictive battery discharge and adaptive operating strategy under real driving conditions. Energies 2023, 16, 5171. [Google Scholar] [CrossRef]
  17. Kampker, A.; Offermanns, C.; Heimes, H.; Bi, P. Meta-analysis on the Market Development of Electrified Vehicles. ATZ Worldw. 2021, 123, 58–63. [Google Scholar] [CrossRef]
  18. Sabri, M.; Danapalasingam, K.A.; Rahmat, M.F. A review on hybrid electric vehicles architecture and energy management strategies. Renew. Sustain. Energy Rev. 2016, 53, 1433–1442. [Google Scholar] [CrossRef]
  19. Bayindir, K.Ç.; Gözüküçük, M.A.; Teke, A. A comprehensive overview of hybrid electric vehicle: Powertrain configurations, powertrain control techniques and electronic control units. Energy Convers. Manag. 2011, 52, 1305–1313. [Google Scholar] [CrossRef]
  20. Zhang, P.; Yan, F.; Du, C. A comprehensive analysis of energy management strategies for hybrid electric vehicles based on bibliometrics. Renew. Sustain. Energy Rev. 2015, 48, 88–104. [Google Scholar] [CrossRef]
  21. Salmasi, F.R. Control strategies for hybrid electric vehicles: Evolution, classification, comparison, and future trends. IEEE Trans. Veh. Technol. 2007, 56, 2393–2404. [Google Scholar] [CrossRef]
  22. Ali, A.M.; Söffker, D. Towards optimal power management of hybrid electric vehicles in real-time: A review on methods, challenges, and state-of-the-art solutions. Energies 2018, 11, 476. [Google Scholar] [CrossRef]
  23. Liu, W. Introduction to Hybrid Vehicle System Modeling and Control; John Wiley & Sons: Hoboken, NJ, USA, 2013. [Google Scholar]
  24. Enang, W.; Bannister, C. Modelling and control of hybrid electric vehicles (A comprehensive review). Renew. Sustain. Energy Rev. 2017, 74, 1210–1239. [Google Scholar] [CrossRef]
  25. Chan, C.C.; Bouscayrol, A.; Chen, K. Electric, hybrid, and fuel-cell vehicles: Architectures and modeling. IEEE Trans. Veh. Technol. 2009, 59, 589–598. [Google Scholar] [CrossRef]
  26. Onori, S.; Serrao, L.; Rizzoni, G. Hybrid Electric Vehicles: Energy Management Strategies; Springer: Berlin/Heidelberg, Germany, 2016. [Google Scholar]
  27. Tran, D.-D.; Vafaeipour, M.; El Baghdadi, M.; Barrero, R.; Van Mierlo, J.; Hegazy, O. Thorough state-of-the-art analysis of electric and hybrid vehicle powertrains: Topologies and integrated energy management strategies. Renew. Sustain. Energy Rev. 2020, 119, 109596. [Google Scholar] [CrossRef]
  28. Sun, X.; Cao, Y.; Jin, Z.; Tian, X.; Xue, M. An adaptive ECMS based on traffic information for plug-in hybrid electric buses. IEEE Trans. Ind. Electron. 2022, 70, 9248–9259. [Google Scholar] [CrossRef]
  29. Sun, X.; Jin, Z.; Xue, M.; Tian, X. Adaptive ECMS with Gear Shift Control by Grey Wolf Optimization Algorithm and Neural Network for Plug-in Hybrid Electric Buses. IEEE Trans. Ind. Electron. 2023, 71, 667–677. [Google Scholar] [CrossRef]
  30. Ciesla, C.; Keribar, R.; Morel, T. Engine/Powertrain/Vehicle Modeling Tool Applicable to All Stages of the Design Process; SAE Technical Paper; SAE International: Warrendale, PA, USA, 2000; ISSN 0148-7191. [Google Scholar]
  31. Zhou, M.; Jin, H. Development of a transient fuel consumption model. Transp. Res. Part D Transp. Environ. 2017, 51, 82–93. [Google Scholar] [CrossRef]
  32. Duarte, G.; Varella, R.A.; Gonçalves, G.; Farias, T. Effect of battery state of charge on fuel use and pollutant emissions of a full hybrid electric light duty vehicle. J. Power Source 2014, 246, 377–386. [Google Scholar] [CrossRef]
  33. Jimenez-Palacios, J.L. Understanding and Quantifying Motor Vehicle Emissions with Vehicle Specific Power and TILDAS Remote Sensing; Massachusetts Institute of Technology: Cambridge, MA, USA, 1998. [Google Scholar]
  34. Functional Mock-Up Interface Specification. Available online: https://fmi-standard.org (accessed on 5 December 2023).
  35. Commission Regulation (EU) No 459/2012 of 29 May 2012 amending Regulation (EC) No 15/2007 of the European Parliament and of the Council and Commission Regulation (EC) No 692/2008 as Regards Emissions from Light Passenger and Commercial Vehicles (Euro 6) Text with EEA Relevance. Available online: https://eur-lex.europa.eu/eli/reg/2012/459/oj (accessed on 5 December 2023).
  36. Preda, I.; Covaciu, D.; Ciolan, G. Coast Down Test–Theoretical and Experimental Approach; Transilvania University Press: Braşov, Romania, 2010. [Google Scholar]
  37. Zhang, F.; Wang, L.; Coskun, S.; Pang, H.; Cui, Y.; Xi, J. Energy management strategies for hybrid electric vehicles: Review, classification, comparison, and outlook. Energies 2020, 13, 3352. [Google Scholar] [CrossRef]
  38. Lee, J.; Nelson, D.J. Rotating inertia impact on propulsion and regenerative braking for electric motor driven vehicles. In Proceedings of the 2005 IEEE Vehicle Power and Propulsion Conference, Chicago, IL, USA, 7 September 2005; IEEE: Piscataway, NJ, USA, 2005; p. 7. [Google Scholar]
  39. Commission Regulation (EU) 2016/427; Amending Regulation (EC) No 692/2008 as Regards Emissions from Light Passenger and Commercial Vehicles (Euro 6). 2016. Available online: https://eur-lex.europa.eu/legal-content/EN/TXT/?uri=CELEX%3A32016R0427 (accessed on 5 December 2023).
  40. Kozina, A.; Radica, G.; Nižetić, S. Hybrid Vehicles Emissions Assessment. In Proceedings of the 2021 6th International Conference on Smart and Sustainable Technologies (SpliTech), Bol and Split, Croatia, 8–11 September 2021; IEEE: Piscataway, NJ, USA, 2021; pp. 1–5. [Google Scholar]
Figure 1. Test vehicle with built-in measuring equipment.
Energies 16 08094 g001
Figure 2. Schematic representation of the quasi-static or forward model of the vehicle.
Energies 16 08094 g002
Figure 3. Schematic representation of the CruiseM vehicle model.
Energies 16 08094 g003
Figure 4. Schematic representation of the kinematic or backward model of the vehicle.
Energies 16 08094 g004
Figure 5. Class distribution of traction energy, CO2 emissions and NOx emissions during the RDE route.
Energies 16 08094 g005
Figure 6. Vehicle energy balance.
Energies 16 08094 g006
Figure 7. (A) Energy distribution and emissions of the VSP hybrid model in the RDE cycle. (B) Time shares of power classes. (C) Mean power for each class hybrid vehicle.
Energies 16 08094 g007aEnergies 16 08094 g007b
Figure 8. Comparison of distances covered for different models and cycles.
Energies 16 08094 g008
Figure 9. Comparison of positive traction energies for different models and cycles.
Energies 16 08094 g009
Figure 10. Comparison of negative traction energies for different models and cycles.
Energies 16 08094 g010
Figure 11. Comparison of consumption per 100 km for different models and cycles.
Energies 16 08094 g011
Figure 12. Comparison of CO2 emissions for different models and cycles.
Energies 16 08094 g012
Figure 13. Comparison of NOx emissions for different models and cycles.
Energies 16 08094 g013
Table 1. Technical features of PEMS devices.
AnalyzerNO/NO2 and CO/CO2/N2OTHC/CH4Particle Counter
Measuring methodNon-Dispersive Ultra Violet-NDUV Non-Dispersive Infra Red-NDIRFlame Ionization Detector-FIDAdvanced diffusion
charger
Measuring rangeNO: 0–5000 ppmTHC: 0–30,000 ppmC1~1500–~2.5 × 10⁷ #/cm3
NO2: 0–2500 ppm
CO: 0–5% vol.
CO2: 0–20% vol.CH4: 0–10,000 ppmC1
N2O: 0–2000 ppm
Zero Drift/8 hNO/NO2: 2 ppm±5 ppm C1/8 h
CO: 20 ppm
CO2: 0.1% vol.
N2O: 20 ppm
Accuracy 0.3% FS
Table 2. Power classes for the modelled vehicle.
Power Class No.Pc,j (kW) fromPc,j (kW) to
1−∞−2.368
2−2.3680.000
30.0002.368
42.36811.840
511.84023.680
623.68044.992
744.99266.304
866.304
Table 3. The relevant parameters for the comparison of the VSP and CruiseM models.
Classic VehicleRDE CycleRDE (1/km)Deviation
MeasuredCruiseMVSPMeasuredCruiseMVSPCruiseMCruiseM (%)VSPVSP (%)
Distance (km)86.2186.6386.211.0001.0051.0000.0050.48%0.0000.00%
Positive traction energy (kWh)13.3713.3313.460.1550.1540.156−0.0350.22%0.0920.69%
Negative traction energy (kWh)−2.14−2.22−2.27−0.0248−0.0256−0.0263−0.0803.26%−0.1306.08%
CO2 emission (g)10,54010,55610,540122.2121.9122.216.259−0.33%0.0000.00%
NOx emission (mg)39,80640,05139,806461.7462.3461.7245.1360.13%0.0000.00%
Consumption (kg)3.3663.3713.3660.0390.0390.0390.005−0.33%0.0000.00%
Disclaimer/Publisher’s Note: The statements, opinions and data contained in all publications are solely those of the individual author(s) and contributor(s) and not of MDPI and/or the editor(s). MDPI and/or the editor(s) disclaim responsibility for any injury to people or property resulting from any ideas, methods, instructions or products referred to in the content.

