Article

Power Planning for a Reliable Southern African Regional Grid

by
Nomihla Wandile Ndlela
*,
Innocent Ewean Davidson
and
Katleho Moloi
Department of Electrical Power Engineering, Durban University of Technology, Durban 4000, South Africa
*
Author to whom correspondence should be addressed.
Energies 2023, 16(3), 1028; https://doi.org/10.3390/en16031028
Submission received: 5 December 2022 / Revised: 12 January 2023 / Accepted: 14 January 2023 / Published: 17 January 2023
(This article belongs to the Section F1: Electrical Power System)

Abstract

:
Southern Africa has suffered from multiple power disruptions in the past decade due to inadequate electrical generation capacity, as well as load developments in locations that were not suitably planned for. Southern African countries are able to have reliable, sustainable, and efficient electrical power grids. The use of power interconnections for exchange power, especially for long-distance transmission networks, is important. Installing a suitable high-voltage alternating current (HVAC) with a high-voltage direct current (HVdc) will improve the active–reactive power compensation when transmitting electrical power over long distances (when transmitting bulk power is possible). Flexible alternating current transmission system (FACTS) devices are typically combinations of shunt and series converters. These approaches are capable of improving the power stability and voltage while allowing power to be transferred with minimal losses to an alternating current transmission system for the power exchange. In this article, two HVDC line-commutated converter (LCC) links, i.e., Angola–Namibia and Aggeneys–Kokerboom, were applied to minimize losses from 2657.43 to 2120.91 MW, with power setpoints of 1000 and 600 MW, respectively. The 2500 and 475 MVAr SVCs were used to control the voltage instabilities at Namibia and Mozambique substations, respectively. The use of HVdc to reduce losses and FACTS devices to enhance controllability and power transfer is extremely effective, particularly in long transmission lines transporting bulk power.

1. Introduction

The Southern African Power Pool (SAPP) was established in August 1995 during the Southern African Development Community (SADC) summit in Johannesburg, South Africa, where SADC member governments, except Mauritius, signed an inter-governmental formal agreement for the establishment of a regional electricity power pool known as the Southern African Power Pool (SAPP) [1,2]. There are roughly 180 million inhabitants in the Southern African region [3]. Out of roughly 76 GW of installed capacity, South Africa has around 59 GW [4,5,6]. Access to electricity extends the useable hours of the day and improves people’s health, safety, financial inclusion, and economic activities. Regardless of the significance of electricity, according to the most recent data from [5], 771 million people do not have access to power globally. The great majority (578 million people) in Sub-Saharan Africa (SSA) lack access to electricity. At the end of 2019, only 48% of the population in SSA had access to electricity, with more than half of the region falling below this average [7,8]. In the last decade, Southern Africa has experienced electrical shortages. This was partially due to the poor electrical power supply networks in the countries involved, as well as load developments in areas that were not sufficiently planned for. This resulted in the formation of organizations (e.g., SADC and SAPP) having similar objectives in promoting regional development and economic improvement [9,10]. The SAPP’s goal is to deliver a reliable and cost-effective power supply to the customers of each SAPP member while maintaining an acceptable usage of natural resources and minimal impact on the environment [11]. Electricity demand in the SAPP’s 12 contiguous nations is expected to double by 2040. They account for almost 40 percent of the overall electrical consumption in Africa. The problem is to fulfill this expanding demand while reducing greenhouse gas emissions [12]. Theft and vandalism of power infrastructures cost SAPP member utilities millions of dollars. The downturn in economic activity in several SAPP countries as a result of COVID-19 limitations has aggravated this problem [13]. Figure 1 shows the projected power interconnections of the SAPP. Angola, Malawi, and Tanzania are currently not connected to the SAPP but there are proposed interconnections (as shown in Figure 1).
An interconnection occurs when two or more electric utilities with power lines physically link. This improves the efficiency of the country’s existing electrical power networks and enables the better use of environmentally sustainable generation sources [14]. HVDC transmission techniques are economical regarding long-distance power transmission and the interconnection of various networks operating at various voltages and frequencies [15]. References [16,17,18] discuss several technological benefits of connected systems, such as trading benefits, reliability benefits, and competitive benefits. Most importantly, in the event of a generator breakdown or unplanned outage, power utilities pool their operating reserves. Voltage support is supplied by the cooperative use of reactive power support resources to interconnected utilities.

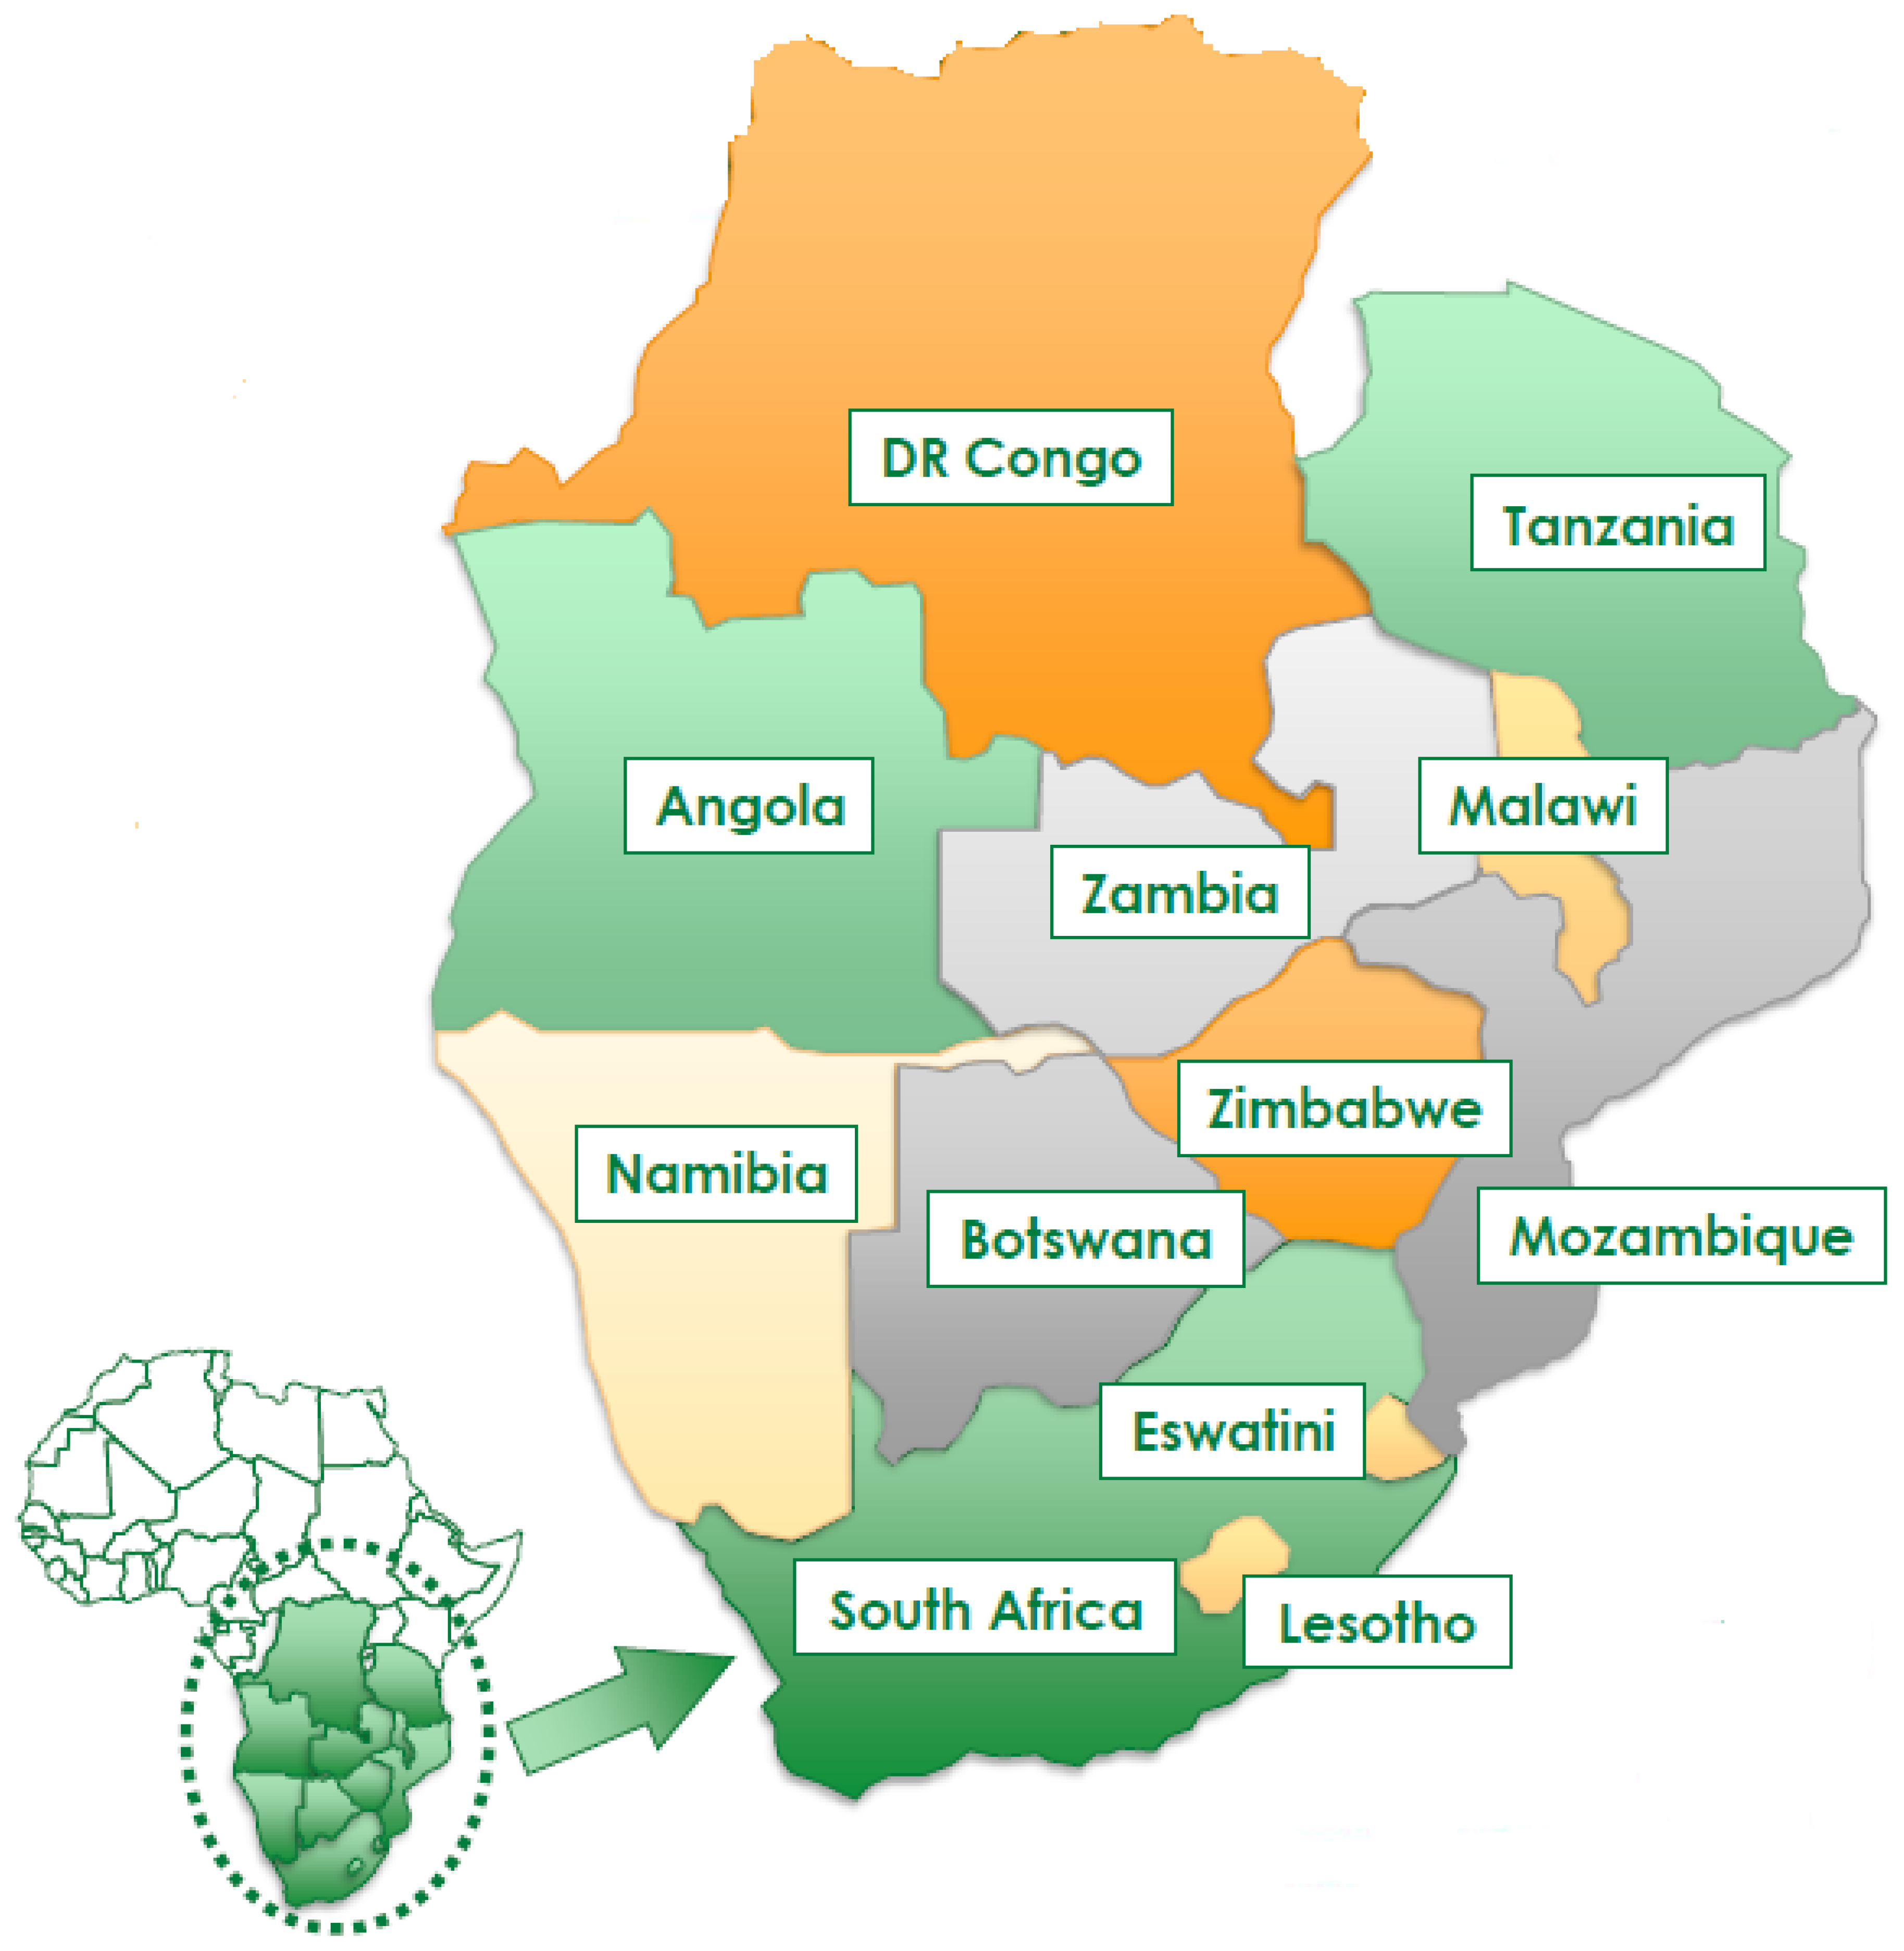
2. Southern African Region Overview

To build a durable southern regional electrical power grid, it is necessary to first understand the existing Southern African Power Pool, including its features, purpose, limitations, opportunities, and obstacles. The SAPP region consists of twelve countries as shown in Figure 2. Angola, Botswana, Lesotho, Malawi, Mozambique, Namibia, South Africa, Swaziland (Eswatini), Zambia, Zimbabwe, Democratic Republic of Congo (DRC), and Tanzania are among the countries presented. Tanzania is also part of the EAPP and DRC is also a member of the CAPP and EAPP [19]. Approximately 93% of Africa’s coal is produced in South Africa [3,20]. Mozambique has 19 GW of hydroelectric potential, 23 TW of solar potential, about 130 Tcf of natural gas, and 20 billion tons of coal reserves; it is rich in resources in the Southern African region [21,22]. Angola is one of Africa’s leading oil producers [5]. Less than 10% of Malawians have access to power [4]. Namibia and Swaziland receive power through South Africa and Mozambique whereas Zambia produces 95% of its power from hydropower and Zimbabwe relies mostly on fuel.
It is critical to present the South African power plant since it contributes significantly to the installed capacity of the Southern African grid as shown in Table 1. Table 2 summarizes the existing resources available in each country, allowing us to determine the installed capacity in each country [4,5,6]. As a result of rising trading volumes, additional sub-markets for power trade, and expanded membership, the SAPP has matured over time [23]. Southern Africa today has approximately 74 GW of built capacity compared to an unevenly distributed demand of approximately 58 GW.
Table 3 shows the power demand of each country and the current access to electricity [4,5,6]. Based on the information presented in Table 2, South Africa has the highest power demand followed by Angola; this is due to the growing population and industrialization. Lesotho has the least power demand, which is 155 MW, followed by Swaziland. South Africa has 95% electricity access, maintaining the highest position in the Southern African region. Malawi has the least access to the power demand amount. Despite having the lowest power demand, Lesotho has greater access than countries such as Malawi, Mozambique, Zambia, and Zimbabwe, which have 11, 29, 31, and 41.9%, respectively.

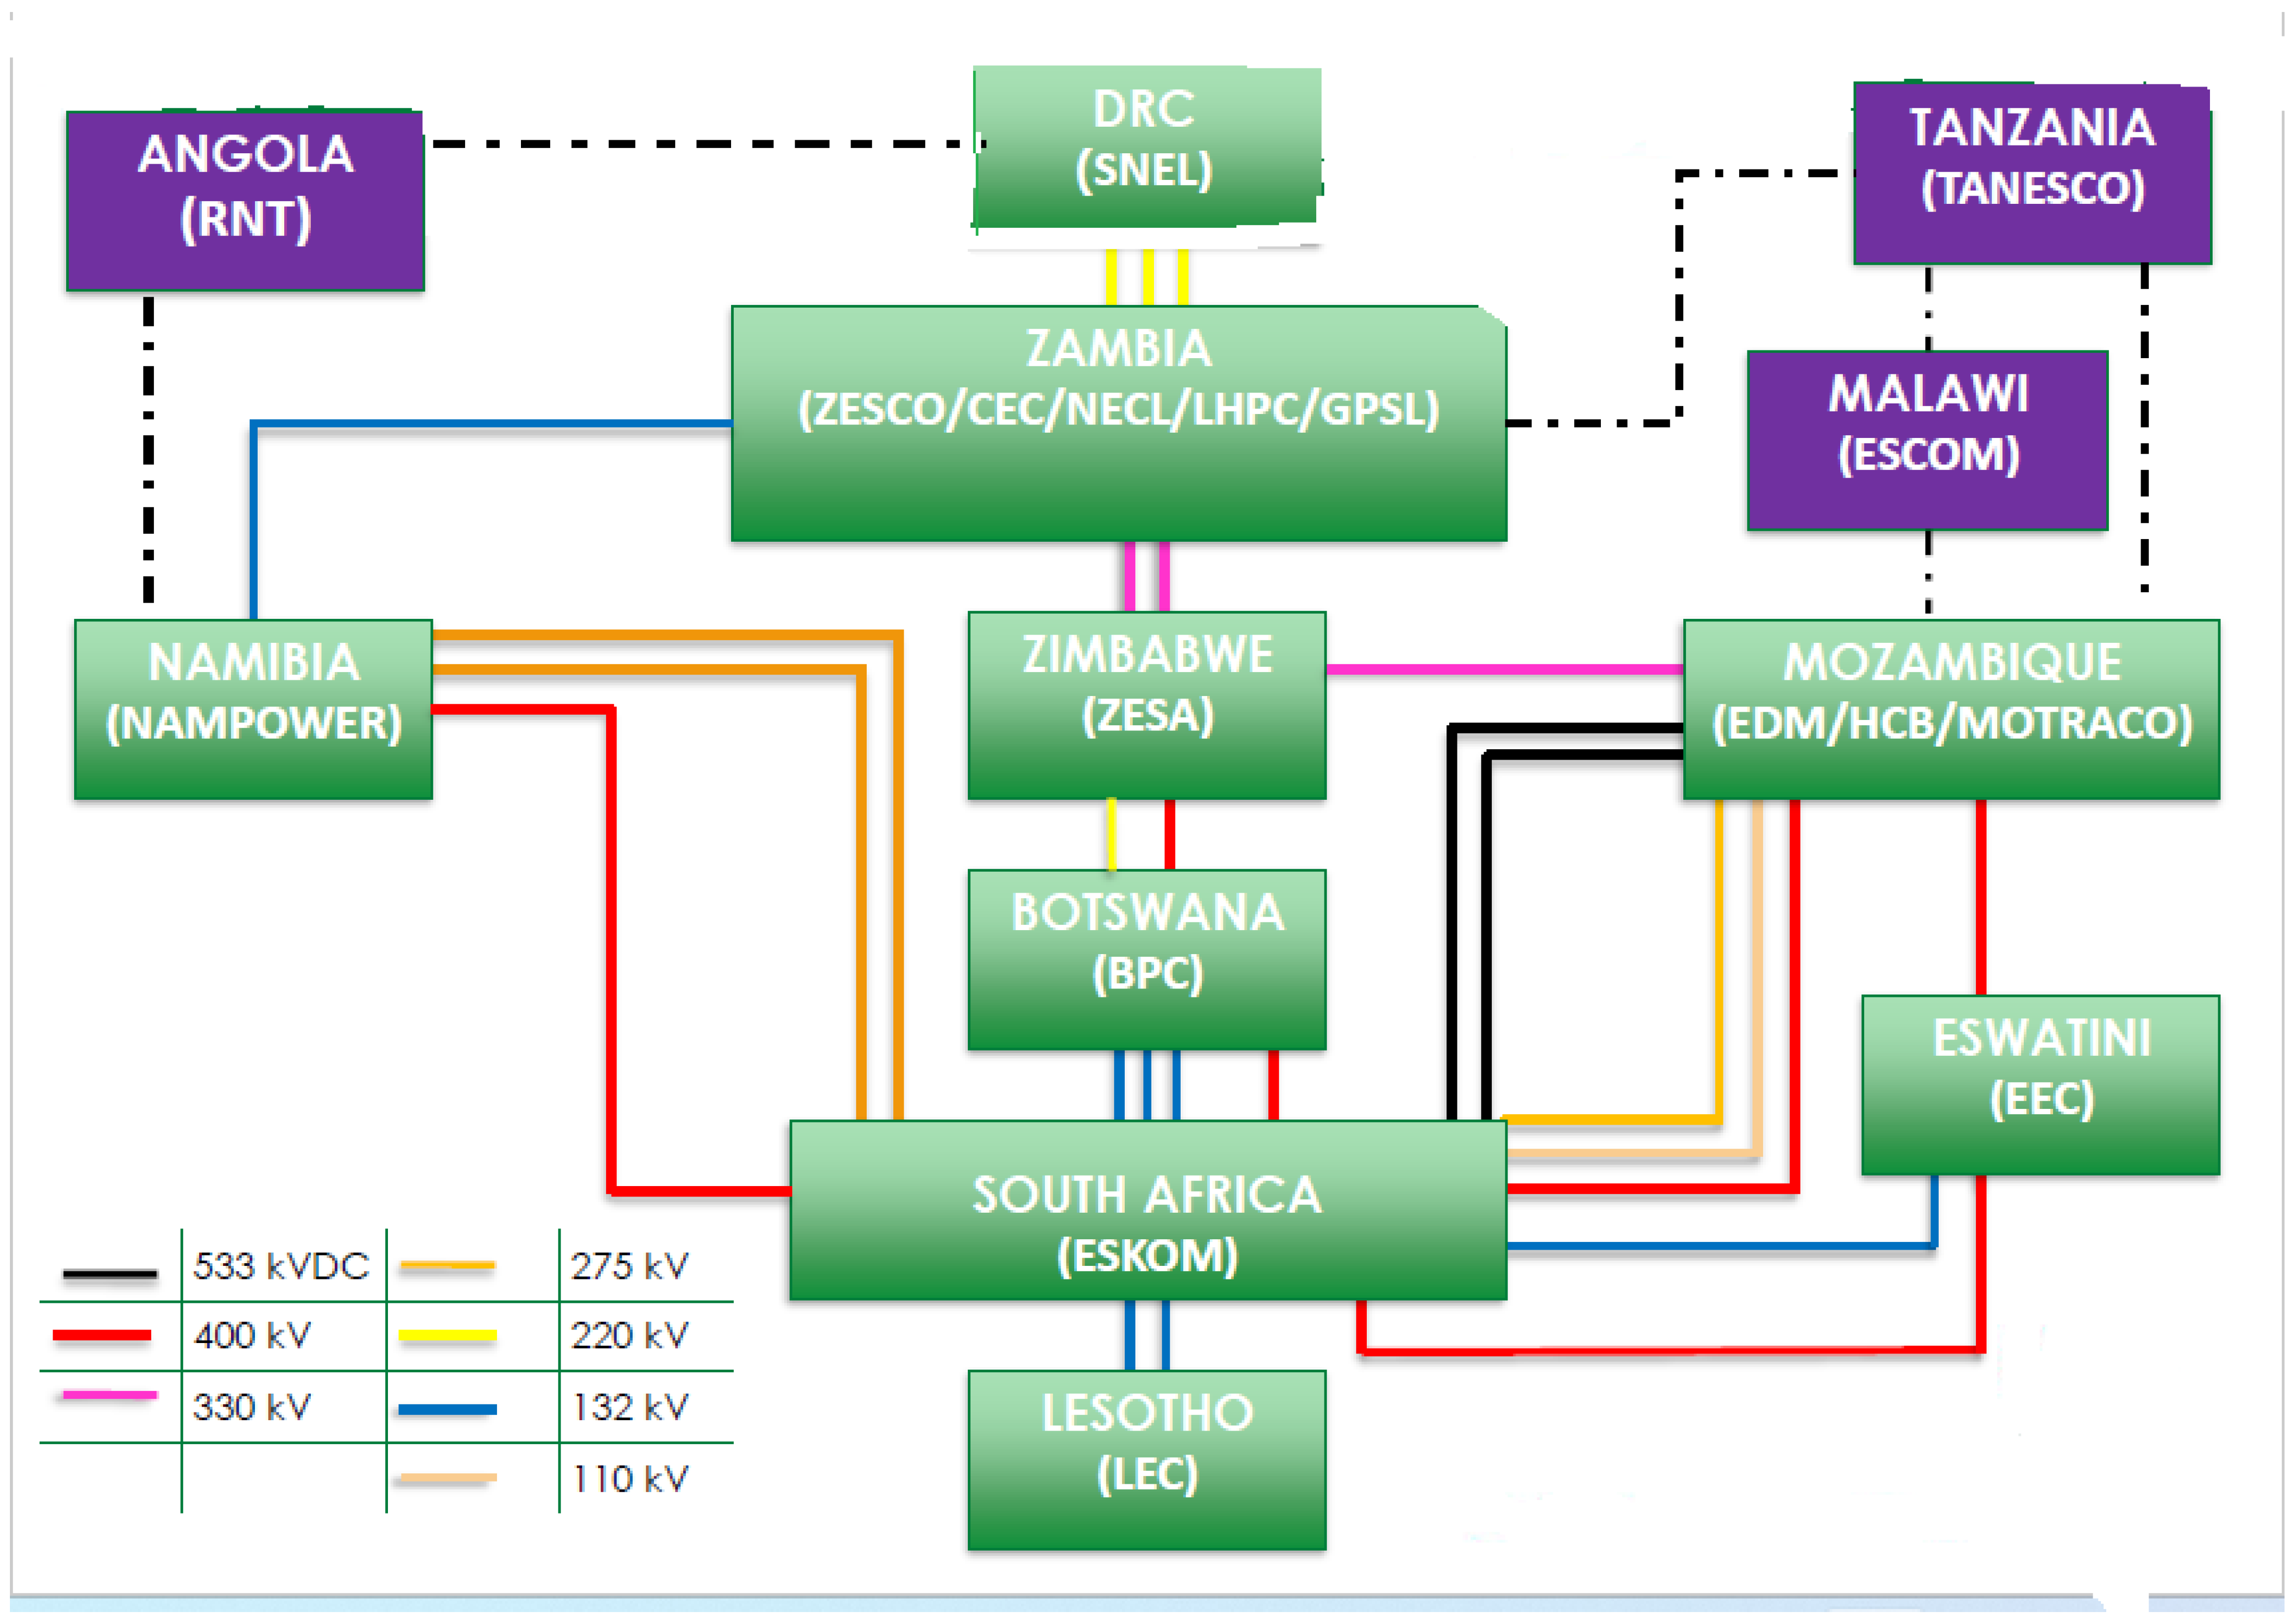
2.1. Power Interconnection

Present transmission lines link the DRC to the Republic of South Africa (RSA) via Zimbabwe and Zambia and other proposed lines connect the DRC to the RSA via Namibia and Angola. These lines have massive economic impacts on the total cost of operating the Southern Africa power pool. The purpose of constantly modifying the pool was to produce a more efficient regional power distribution system. The justification for power exchange involves the distribution of energy sources within the region [24].

2.2. Power System Reliability

The concept of “system reliability” refers to a network’s ability to produce adequate, reliable, and consistent power to an electricity network [25]. In the context of a power system, the phrase “steady-state security” relates to an instantaneous disturbance that is the result of time and the system’s resilience to incoming disturbances. Monitoring, information management, automation, the introduction of smart grids, and the deployment of innovative technologies are just a few of the ways used to assure and improve system stability. As a result, all busbar voltages must be kept within 5% of their nominal voltage. In an emergency, no device should be overloaded over 105% capacity. Nevertheless, a 15% overvoltage for 5 s and a 20% overvoltage for 1 s are acceptable [26].

2.3. HVDC Line-Commutated Converter (LCC) Link

Power systems rely heavily on their generating, transmission, and distribution networks [27]. However, voltage source converter (VSC)-based HVDC schemes are preferable for long-distance and multi-terminal HVDC grids. Nevertheless, LCC high-voltage direct current (HVDC) schemes can be employed for massive networks over long distances with bulk MW ratings for voltage control with reactive power [28]. HVDC technology is optimal for the super grid’s efficient operational controls, addressing the generation of intermittency complications, and, thereby, improving the built-in redundancy capacity [29,30].

2.4. FACTS Features

The power interconnection concept regarding the network of Southern African countries is complicated, causing issues in supplying the growing electricity demand while maintaining reasonable electricity prices for consumers. As a result of the transmission, network expansion system stability is decreasing, and there is a greater chance of shutdowns and cascading failures [31]. FACTS devices are proposed for use in the Southern African Regional Grid (SARG) to advance the transmission system’s integrity while also improving the excellence of electricity transmission capability [32]. FACTS devices increase the power transmission rate by 20 to 30 percent to control power flow, boost power system stability, maintain flexible system operations, decrease flickering, and encourage effective use of present grid infrastructure [33,34]. The static var compensator (SVC), which is a feature of FACTS, was utilized in this research to manage the system’s voltage [35].
The study contains thorough mathematical modeling and the standard principle of the SARG load flow study employing HVAC with FACTS devices and an HVdc transmission line. The SAPP has created system planning criteria that must be followed during the inter-utility planning procedure and will also apply to the model creation and simulation of this project [36]. The system planning was designed to meet the minimum SAPP standards and to provide reliable, efficient, and cost-effective movements of electrical power from generators to load centers. This is the planning criteria that is used to simulate the Southern African region. In any case, the transmission system may evolve for several purposes, including (but not limited to):
  • Existing network reconfiguration, decommissioning, and optimization.
  • Differences in customer requirements or network infrastructure.
  • The installation of new transmission substations or the refurbishment of a current transmission system connection.
  • The accumulative effects of the several above-mentioned developments.

3. Methodology

The model used in the study was created utilizing the tool DigSilent PowerFactory and network data were gathered as shown in Table 1, Table 2 and Table 3 throughout the design process. As demonstrated in Figure 3 and Figure 4. Figure 5 illustrates the entire planned Southern African regional grid model. the single-line diagrams for each Southern African country were constructed independently to display the installed capacity and power demand for each country, as seen in Figure 6 and Figure 7, where the power demand is depicted as the load. Using the gathered raw data, the data specifications of each component, notably power transformers, transmission lines, generators, and loads, were entered. The single-line network was subsequently interconnected to create one mega Southern African Region as shown in Figure 8. The transmission voltages of the network model included 11, 110, 132, 220, 275, 330, and 400 kV. The thermal ratings of the components and the voltage ratings of the busbars are established in the DigSilent PowerFactory in accordance with the SAPP standards. The overloading of components, such as generators, transmission lines, and transformers, is represented by the colors depicted in the little box in Figure 6. To ensure network reliability, some restrictions apply. For example, the voltage should be kept within the nominal range of 95 to 105%; the overloaded components, which include generators, must be prevented, and component thermal loading must be kept within the range of (80–100%) [37]. The Newton–Raphson method was used in this investigation to examine the load flow in a network.
Dividing the load current by the rate current yields thermal loading.
t h e r m a l . l o a d i n g = I l o a d I r a t e d × 100 %
Accordingly, the load current per phase is evaluated using Equation (2).
I l = S l 3 ϕ 3 V l
The DC current for the HVDC LCC connection is as follows:
I d c = V d c cos α V d c cos δ R l + R r + R i
V a c is the alternating current voltage, V d c is the direct current voltage, I d c is the direct current, α is the firing angle, δ is the extinction delay angles, R l is the resistor from the loop, R r is the resistor from the rectifier, and R i is the resistor from the inverter.
Whereby
V d c = 3 2 π V a c
We utilize the rate V a c to obtain V d c of the DC transmission line.
The SAPP network was developed under the guidance of a robust grid, which is a must for any grid; the features of a reliable power grid are outlined below.
  • The network must be capable of withstanding the loss of a single transmission line.
  • Permit voltage in each system busbar.
  • Transformers, generators, and transmission lines, for instance, should not be overloaded.
  • At all times, the generating capacity must exceed the load demand.
  • Capable of maintaining stability in the event of a short circuit.
  • It should be able to endure a generator failure.
Numerous disruptions or power outages are evident signs of an unstable electric grid [38]. Interconnected power grids are commonly regarded as relatively secure and reliable, but due to their complexity and unforeseen occurrences, such as inadequate connections, human mistakes, malfunctions, and failure in the protective strategy lead to a cascade tripping in the system [14].

4. Discussion of Results

The Southern African region was built separately using DigSilent PowerFactory software, with each substation portrayed as a substation that was ultimately interconnected to form one mega substation for the whole Southern African region. All models were created in accordance with the IEEE voltage and thermal criteria given in the following figures. Figure 3 depicts the Mozambique utility power grid interconnected at various voltage levels. Mozambique is connected to South Africa and Swaziland, which are existing interconnections in the SAPP, and it is also connected to Zimbabwe and Malawi, which are proposed interconnections to be added to the SAPP. These power interconnections are used in this study to increase power access in the Southern African region.
Figure 4 shows the South Africa network model, which is interconnected to five countries: Lesotho, Botswana, Swaziland, Mozambique, and Namibia. These power interconnections are all SAPP interconnections utilized in the Southern African region to demonstrate how the power exchange may be done in the Southern African region to fulfill the region’s growing demand and deliver nearly 100% electricity access. This was done to all of the Southern African countries.
After all of the southern African countries had been built, they were connected to form one mega Southern African substation, as illustrated in Figure 5. All of the interconnections in Figure 5 are existing and proposed transmission lines (TL) in the SAPP. The proposed interconnections in the SAPP are Angola–Nampower TL, Malawi–Mozambique TL, and Malawi–Zambia TL, which are included in this Southern African Project to increase the power exchange in the region.
Figure 6 depicts the Lesotho network model when it was operational as a single network with a peak demand of 155 MW. As stated in Table 2, 70.3 of the 73 MW installed capacity has been generated in the Lesotho network where 155 MW is the country’s demand and 84 MW is the shortage of power in the country.
Figure 7 illustrates the South African network model when operating as an individual network with a peak demand of 46,678 MW and a reserve capacity of 10,422 MW, which can be used for power exchange. This can be used in the event of increased demand in the Southern African region, and once again for developing countries that are already struggling to meet their countries’ power demands.
Figure 8 shows the entire Southern African Regional network, in which all developing countries import electricity from other countries, and countries with adequate power can export power to countries in need of power. Figure 8 illustrates how power interconnection might improve the availability of electricity for all Southern African countries. For example, Lesotho receives 66.2 and 18.5 MW from South Africa to meet its peak demand of 155 MW. Malawi produces 394 MW from two generators to meet the demand of 470 MW through the electrical interconnection. Mozambique exports 380.3 MW and Malawi receives 303.9 MW due to line losses. Malawi consumes 76 MW and exports 227.9 MW to Zambia as illustrated in Figure 8. All surplus electricity is transmitted to the South Africa substation, which serves as a reference substation. The country interconnector displays the active power (P) in all of the country’s interconnected lines, as well as the reactive power (Q), exported power, and imported power of that country.
The Southern Africa Network concept shown in Figure 9 includes two HVdc LCC links connected to the Angola–Namibia TL and Aries–Kokerboom TL to minimize losses associated with long-distance bulk power transmission. The power setpoint for the Angola–Nampower interconnection is 1000 MW in the HVdc link from Angola, Namibia receives 967 MW, Angola–Namibia TL exports 1983 MW, and Namibia receives 1333.5 MW, which means that Namibia is now receiving 2301.4 MW. In Figure 8, Angola–Namibia TL exports 2963 MW to Namibia but Namibia receives only 1414.7 MW. The power setpoint for the Angola–Nampower interconnection is 1000 MW in the HVdc link from Angola, Namibia receives 967 MW, Angola–Namibia TL exports 1983 MW, and Namibia receives 1333.5 MW, which means Namibia is now receiving 2301.4 MW. In Figure 8, Angola–Namibia TL exports 2963 MW to Namibia but only receives 1414.7 MW.
The voltage instability is shown in Figure 10 in both the 400 and 220 kV sub-transmissions of Namibia SS, where the voltage drops from 400 to 377.6 kV, which results in a drop from 1 to 0.94 p.u, threatening the network’s reliability, and on the 220 kV sub-transmission, where the voltage dips to 212.2 kV.
Additionally, Figure 11 illustrates the voltage instability involved with the 330 kV sub-transmission in Mozambique’s electric network where the voltage rises from 330 to 347.2 kV, causing the voltage p.u to rise from 1 to 1.5 p.u.
As illustrated in Figure 12, the static var structure is introduced to manage some of the reactive power, which helps stabilize the grid. As a result, the 400 kV sub-transmission now has 390.5 and 220 kV, which increases the grid’s stability. The NamPower 400 kV sub-transmission uses 2500 MVAr SVC to control some of the reactive power to improve the voltage instability.
Figure 13 illustrates the static var system in action on the Mozambique 330 kV busbar where the voltage is reduced to 334.6 from 347.2 kV in Figure 10. The 500 MVAr SVC is used to manage some of the reactive power in the Mozambique 330 kV busbar; this contributes significantly to the grid’s stability.
Figure 14 shows the complete model of the Southern African power network as explained in Figure 8, which exchanges power with developing countries. The complete model includes an HVdc LCC link that works in conjunction with HVAC to minimize line losses, as well as an SVC that controls reactive power and improves the voltages that are connected to the bus bar with the SVS. As seen in Figure 9, Figure 12 and Figure 13, the complete model employs two 2500 and 500 MVAr SVCs to minimize voltage instability by regulating some of the reactive power and enhancing the power transfer. To minimize losses, the whole model additionally includes two HVdc LCCs in Angola–Namibia TL and Aries–Kokerboom in addition to the HVAC TL with setpoints of 1000 and 600 MW, respectively. The complete model shows minimal losses of 2272 MW, as indicated in Figure A3, compared to 2657.43 MW in Figure A1, which corresponds to Figure 8. In conclusion, the complete model depicts a Southern African Region network with minimal losses due to the use of the HVdc LCC and enhanced voltage stability through the use of SVC, which improves power transfer since the objective is to trade electricity with the disadvantaged Southern African nations.
Table 4 illustrates the Southern African Regional grid busbar voltage profiles for three circumstances: (a) the HVAC transmission line busbar voltage profile, (b) the busbar voltage profile for SARG when the HVdc-LCC is employed to reduce losses in a long-distance transmission line carrying bulk power, and (c) a voltage busbar profile for a model that includes an HVdc-LCC and an SVC.
Table 5 illustrates the transmission line loading for a variety of scenarios: (a) when examining the load flow between the Southern African Regional Grid (SARG) and all HVAC lines; (b) when the load flow study is performed with two HVdc-LCCs between Nampower–Angola and Aggeneys–Kokerboom; and (c) when a load flow study is performed on the SARG network with two HVdc-LCCs and an SVC in the 330 kV Mozambique busbar and 400 kV Namibia busbar.
Table 6 illustrates the transmission line losses under three separate conditions: (a) when the SARG network load flow analysis is performed on all HVAC lines; (b) when the load flow analysis is performed utilizing HVDC-LCC links. In Nampower–Angola TL and Aggeneys–Kokerboom TL, losses decrease from 2665 to 2120 MW as demonstrated in Figure A1 and Figure A2, respectively; (c) when the analysis is performed utilizing both SVC and HVDC-LCC systems.

5. Conclusions

The primary goal of this research is to trade power within Southern African countries particularly those without access to electricity with minimal losses while also ensuring grid reliability. The SARG network was constructed with the DigSilent PowerFactory. Each country model was created individually and then combined to form the SARG network. This study performed power planning for a Southern African grid using existing and proposed power interconnections. Three TL lines were added to the existing SAPP as proposed TL lines. These lines included Nampower–Angola TL, Malawi–Mozambique TL, and Malawi–Zambia TL. The lines connect Angola and Malawi to the power grid. All developing countries that were unable to meet their peak demands were able to import electricity from other countries. HVdc LCC links were utilized to decrease losses and a static var system was employed to increase grid stability.
The network model was initially simulated with all of the HVAC transmission lines, and the total losses were calculated to be 2657.43 MW, as shown in Figure A1. In Angola, two HVdc LCCs were used: Nampower TL and Aggeneys–Kokerboom TL, with 1000 and 600 MW setpoints, respectively. This led to a loss reduction of 2120.91 MW as illustrated in Figure A2. Figure 12 and Figure 13 show the applications of the SVC in Namibia’s 400 kV busbar and Mozambique’s 330 kV busbar to improve voltage stability. The complete model is shown in Figure 14 with minimum losses, improved voltage stability, and power transfer to all of the Southern African countries, which provide 100% electricity availability. This research may also be utilized to effectively connect the whole African continent with five regions to exchange power with minimal losses.

Author Contributions

Conceptualization, N.W.N. and I.E.D.; methodology, N.W.N. and I.E.D.; software, N.W.N. and I.E.D.; validation N.W.N. and I.E.D.; formal analysis, N.W.N.; investigation, N.W.N.; resources, I.E.D.; data curation, N.W.N. and I.E.D.; writing—original draft preparation, N.W.N.; writing—review and editing, K.M.; visualization, K.M.; supervision, I.E.D.; project administration I.E.D.; funding acquisition, I.E.D. All authors have read and agreed to the published version of the manuscript.

Funding

This research received no external funding.

Data Availability Statement

Not applicable.

Acknowledgments

The authors thank the Durban University of Technology Smart Grid Research Center for their assistance.

Conflicts of Interest

The authors declare no conflict of interest.

Appendix A

Figure A1. Southern African Regional Grid model base case summary for an HVAC load flow analysis, showing system losses and the total number of network equipment, including busbars, transformers, loads, and generators.
Energies 16 01028 g0a1
Figure A2. Southern African Regional grid network model with base case summary of HVAC with an HVDC link load flow analysis shows the losses incurred as a result of the LCC-HVDC link impact.
Energies 16 01028 g0a2
Figure A3. Southern African Regional grid network model with the base case summary of HVAC with the HVDC connection and SVC load flow analysis exhibiting line losses and improved voltage management that enhances grid reliability.
Energies 16 01028 g0a3

References

  1. Blyden, B.; Davidson, I. Energizing Africa’s emerging economy. IEEE Power Energy Mag. 2005, 3, 24–31. [Google Scholar] [CrossRef]
  2. Musaba, L. The development of the SAPP competitive electricity market. In Proceedings of the 2005 IEEE Power Engineering Society Inaugural Conference and Exposition in Africa, Durban, South Africa, 11–15 July 2005; pp. 188–194. [Google Scholar]
  3. Ndlela, N.W.; Davidson, I.E. Power Planning for a Smart Integrated African Super-Grid. In Proceedings of the 2022 30th Southern African Universities Power Engineering Conference (SAUPEC), Durban, South Africa, 25–27 January 2022; pp. 1–6. [Google Scholar]
  4. U.S.A Government-Led Partnership. Power Africa Fact Sheet; United State Agency for International Development (USAID): Washington, DC, USA, 2013. Available online: https://www.usaid.gov/powerafrica/countries (accessed on 16 April 2020).
  5. U.S Energy Information Administration. Energy Information Administration Independent Statistics and Analysis: Washington, DC 20585. 1995. Available online: https://www.eia.gov/international/analysis/country/ARE?scr=email (accessed on 6 May 2020).
  6. Eskom. Generation. Available online: https://www.eskom.co.za/eskom-divisions/gx/ (accessed on 3 February 2022).
  7. Valickova, P.; Elms, N. Potential gains from regional integration to reduce costs of electricity supply and access in Southern Africa. Energy Sustain. Dev. 2021, 62, 82–100. [Google Scholar] [CrossRef]
  8. Jha, P.; Schmidt, S. State of biofuel development in sub-Saharan Africa: How far sustainable? Renew. Sustain. Energy Rev. 2021, 150, 111432. [Google Scholar] [CrossRef]
  9. Mwale, S.J.; Davidson, I.E. Security analysis of electric power supply in SADC region. In Proceedings of the 2013 Africon, Pointe aux Piments, Mauritius, 9–12 September 2013; pp. 1–6. [Google Scholar]
  10. Mwale, S.J.T.; Davidson, I.E. A Steady-State Contingency Analysis of the SADC Regional Grid Using the N-1 Criterion. J. Energy Power Eng. 2015, 9, 479–485. [Google Scholar]
  11. Muntschick, J. The Southern African Development Community (SADC) and the European Union (EU): Regionalism and External Influence; Springer: Berlin/Heidelberg, Germany, 2018. [Google Scholar]
  12. Chowdhury, A.K.; Deshmukh, R.; Wu, G.C.; Uppal, A.; Mileva, A.; Curry, T.; Armstrong, L.; Galelli, S.; Ndhlukula, K. Enabling a low-carbon electricity system for Southern Africa. Joule 2022, 6, 1826–1844. [Google Scholar] [CrossRef]
  13. Southern African Power Pool. Energising the Region for Economic Development; SAPP: Harare, Zimbabwe, 2022. [Google Scholar]
  14. Zimba, S.K.; Nyamutswa, I.; Chikova, A. Islanding power systems to minimize impact of system disturbances in Southern African Power Pool. In Proceedings of the 2017 IEEE AFRICON, Cape Town, South Africa, 18–20 September 2017; pp. 1107–1112. [Google Scholar]
  15. Korompili, A.; Wu, Q.; Zhao, H. Review of VSC HVDC connection for offshore wind power integration. Renew. Sustain. Energy Rev. 2016, 59, 1405–1414. [Google Scholar] [CrossRef] [Green Version]
  16. Steinbacher, K.; Schult, H.; Jörling, K.; Fichter, I.T.; Staschus, K.; Schröder, J.; Lenkowski, A.; Germany, N.E. Cross-Border Cooperation for Interconnections and Electricity Trade; Guidehouse: Chicago, IL, USA, 2019. [Google Scholar]
  17. Hammons, T.; Blyden, B.K.; Calitz, A.C.; Gulstone, A.B.; Isekemanga, E.; Johnstone, R.; Paluku, K.; Simang, N.-N.; Taher, F. African electricity infrastructure interconnections and electricity exchanges. IEEE Trans. Energy Convers. 2000, 15, 470–480. [Google Scholar] [CrossRef]
  18. Grigsby, L.L. Power System Stability and Control. In The Electric Power Engineering Handbook, 3rd ed.; CRC Press: Boca Raton, FL, USA, 2017; p. 7. [Google Scholar] [CrossRef]
  19. Nalule, V.R. Regionalism in Addressing Energy Access Challenges. In Energy Poverty and Access Challenges in Sub-Saharan Africa; Palgrave Macmillan: Cham, Switzerland, 2019; pp. 41–89. [Google Scholar]
  20. Wright, J.G.; Van Coller, J. System adequacy in the Southern African Power Pool: A case for capacity mechanisms. J. Energy South. Afr. 2018, 29, 37–50. [Google Scholar] [CrossRef] [Green Version]
  21. Procesi, M.; Marini, L.; Cinti, D.; Sciarra, A.; Basile, P.; Mazzoni, T.; Zarlenga, F. Preliminary Fluid Geochemical Survey in Tete Province and Prospective Development of Geothermics in Mozambique. Geotherm. Energy 2022, 10, 2. [Google Scholar] [CrossRef]
  22. El Yaziji, I. Analysis of Future Energy Scenarios for Mozambique Based on an Integrated Energy-Economy System Optimization Model; Politecnico di Milano: Milan, Italy, 2021. [Google Scholar]
  23. Turkson, J.; Wohlgemuth, N. Power sector reform and distributed generation in sub-Saharan Africa. Energy Policy 2001, 29, 135–145. [Google Scholar] [CrossRef]
  24. O’Leary, D.; Charpentier, J.; Minogue, D. Promoting Regional Power Trade: The Southern African Power Pool; World Bank Group: Washington, DC, USA, 1998; p. 4. [Google Scholar]
  25. Willis, H.L.; Scott, W.G. Distributed Power Generation: Planning and Evaluation; CRC Press: Boca Raton, FL, USA, 2018. [Google Scholar]
  26. Mwale, S.; Davidson, I. SADC Power Grid Reliability—A Steady-state Contingency Analysis and Strategic HVDC Interconnections Using the N-1 Criterion. In Proceedings of the 2nd International Symposium on Energy Challenges and Mechanics, Aberdeen, UK, 21–22 August 2019; pp. 19–21. [Google Scholar]
  27. Zhao, Q.; García-González, J.; García-Cerrada, A.; Renedo, J.; Rouco, L. HVDC in the Future Power Systems. In Transmission Expansion Planning: The Network Challenges of the Energy Transition; Springer: Berlin/Heidelberg, Germany, 2021; pp. 117–151. [Google Scholar]
  28. Xue, Y.; Kong, D.; Song, Z.; Hamidi, V.; Zhang, X.-P. Development of an Advanced LCC-HVDC Model for Transmission System. In Proceedings of the 11th IET International Conference on AC and DC Power Transmission, Birmingham, UK, 10–12 February 2015; pp. 1–5. [Google Scholar]
  29. Blarke, M.B.; Jenkins, B.M. SuperGrid or SmartGrid: Competing strategies for large-scale integration of intermittent renewables? Energy Policy 2013, 58, 381–390. [Google Scholar] [CrossRef]
  30. Arestova, A.; Sidorkin, Y. The use of wind farms and virtual power plants for emergency control in the future smart super grids. In Proceedings of the 2011 6th International Forum on Strategic Technology, Harbin, China, 22–24 August 2011; pp. 437–442. [Google Scholar]
  31. Noor, S.; Yang, W.; Guo, M.; van Dam, K.H.; Wang, X. Energy demand side management within micro-grid networks enhanced by blockchain. Appl. Energy 2018, 228, 1385–1398. [Google Scholar] [CrossRef]
  32. Bansal, R. Power System Protection in Smart Grid Environment, 1st ed.; CRC Press: Boca Raton, FL, USA; London, UK; New York, NY, USA, 2019. [Google Scholar]
  33. Nadeem, M.; Imran, K.; Khattak, A.; Ulasyar, A.; Pal, A.; Zeb, M.Z.; Khan, A.N.; Padhee, M. Optimal placement, sizing and coordination of FACTS devices in transmission network using whale optimization algorithm. Energies 2020, 13, 753. [Google Scholar] [CrossRef] [Green Version]
  34. Sudeep, G.; Suryanarayanareddy, V. Improvement of Voltage Stability by Placing UPFC using fuzzy Logic. Int. Res. J. Eng. Technol. (IRJET) 2019, 6, 2106–2112. [Google Scholar]
  35. Kincic, S.; Wan, X.T.; McGillis, D.T.; Chandra, A.; Ooi, B.-T.; Galiana, F.D.; Joos, G. Voltage support by distributed static VAr systems (SVS). IEEE Trans. Power Deliv. 2005, 20, 1541–1549. [Google Scholar] [CrossRef]
  36. Mwale, S.J.T. The Southern African Power Pool (SAPP) Steady State Security Assessment Using Contigency Analysis, Master of Science in Electrical Engineering; Department of Electrical Engineering, University of KwaZulu-Natal: Durban, South Africa, 2015. [Google Scholar]
  37. SAPP. SAPP Transmission Planning Criteria. 2012. Available online: https://www.sacreee.org/sites/default/files/training/files/SAPP%20Transmission%20Planning%20Criteria_JAN%202012.pdf (accessed on 12 January 2023).
  38. Tao, S.; Zhang, Y.; Yuan, M.; Zhang, R.; Xu, Z.; Sun, Y. Behavioral Economics Optimized Renewable Power Grid: A Case Study of Household Energy Storage. Energies 2021, 14, 4154. [Google Scholar] [CrossRef]
Figure 1. Existing and future interconnections of the SAPP.
Energies 16 01028 g001
Figure 2. Regional map of Southern Africa.
Energies 16 01028 g002
Figure 3. Proposed power system network model in Mozambique.
Energies 16 01028 g003
Figure 4. South Africa proposed a network model.
Energies 16 01028 g004
Figure 5. Southern African regional proposed network model.
Energies 16 01028 g005
Figure 6. Lesotho network model.
Energies 16 01028 g006
Figure 7. South Africa power system network model.
Energies 16 01028 g007
Figure 8. Southern African regional grid network model.
Energies 16 01028 g008
Figure 9. Southern African Region with HVdc LCC link.
Energies 16 01028 g009
Figure 10. Voltage instability in the Namibia electric network.
Energies 16 01028 g010
Figure 11. Voltage instability in the Mozambique electric network.
Energies 16 01028 g011
Figure 12. Namibia power network with the static var system.
Energies 16 01028 g012
Figure 13. Mozambique power utility with the static var system.
Energies 16 01028 g013
Figure 14. Complete power model with HVDC LCC and the static var system.
Energies 16 01028 g014
Table 1. South Africa Power Plant.
Coal-Fired PlantsInstalled Capacity (MW)HydroelectricityInstalled Capacity (MW)
Arnot2100Conventional hydro stations
Camden1561Gariep360
Duvha3600Vanderkloof240
Grootvelei1200Pumped storage schemes
Hendrina2000Drakensberg1000
Kendal4116Palmiet400
Komati1000Ingula1332
Kriel2850Other hydropower Stations
Lethabo3708Colley Wobbles42
Majuba4110Second Falls11
Matimba3990First Falls6
Matla3600Ncora2.4
Tutuka3654Other renewable energy stations
Medupi4800Sere Wind Facility106
Kusile3200
Gas/Liquid turbine stations Nuclear
Acacia171Koeberg1840
Port Rex171
Ankerlig1327
Gourikwa740
Independent Power Producers (Solar and Wind)5027
Total Installed Capacity (existing)58,108.4
Eskom Planned capacity additions (Kusile units 5 & 6)1600
Source: Eskom Website, power Africa FACT SHEET, EIA.
Table 2. SAPP countries and their installed capacities in MW.
CountryThermalGasHydroSolarNuclearWindOilDieselTotal
(MW)
South Africa45,48924093393.4232318402323 57,777.4
Angola 2435901.4635 951366410.46
Mozambique800 220640 3046
Botswana822 1.3 70893.3
Lesotho 72.670.305 72.975
Malawi 370.35 36406.35
Namibia120 332163 46.4661.4
Swaziland 78.1 78.1
Zambia405 2294.554 8.852762.35
Zimbabwe1130 1140 2270
Total48,766265215,788.482616.61840232395297.2574,378.36
Table 3. Power demand and current electricity access in the Southern African region.
CountryPower Demand (MW)Current Access (%)
South Africa46,67895
Angola3378.6545
Mozambique1650.529
Botswana70256
Lesotho15544.64
Malawi47011
Namibia60056
Swaziland22387
Zambia230031
Zimbabwe220041.9
Table 4. Different busbar voltage profiles for the SARG network.
Busbar Name(a) HVAC (p.u)(b) HVDC Link (p.u)(c) HVDC & SVC (p.u)
Angola 11 kV1.001.001.00
Angola 400 kV1.011.001.00
Namibia 11 kV1.001.001.00
Namibia 220 kV1.020.960.99
Namibia 400 kV0.940.940.98
South Africa 11 kV1.001.001.00
South Africa 275 kV1.001.001.00
South Africa 132 kV1.001.001.00
South Africa 220 kV1.000.991.00
South Africa 400 kV0.990.991.00
South Africa 110 kV1.001.001.00
Lesotho 11 kV1.001.001.00
Lesotho 132 kV1.001.001.00
Botswana 11 kV1.001.001.00
Botswana 400 kV1.001.001.00
Botswana 220 kV1.001.001.00
Botswana 132 kV1.001.001.00
Swaziland 11 kV1.001.001.00
Swaziland 400 kV1.001.001.00
Swaziland 132 kV1.001.001.00
Mozambique 11 kV1.001.001.00
Mozambique 400 kV1.011.011.01
Mozambique 330 kV1.051.051.01
Mozambique 275 kV1.011.001.00
Mozambique 110 kV1.001.001.00
Malawi 11 kV1.001.001.00
Malawi 400 kV1.001.001.00
Zimbabwe 11 kV1.001.001.00
Zimbabwe 400 kV1.001.000.99
Zimbabwe 330 kV1.001.001.00
Zimbabwe 220 kV0.990.990.98
Zambia 11 kV1.001.001.00
Zambia 400 kV1.001.001.00
Zambia 330 kV1.001.000.99
Table 5. Different transmission line loading profiles for the SARG network.
Transmission Line Name(a) HVAC (%)(b) HVDC (%)(c) HVDC & SVC (%)
Aggeneys–Kokerboom28.8026.7724.82
Aggeneys–Harib35.6933.1830.76
Angola–Nampower41.7927.5533.35
Aries–Kokerboom76.4287.2161.56
Arnot–Maputo5.825.624.22
Bulawayo–Francistown40.6640.6758.31
Camden–Edwaleni3.273.762.37
Derderport–Dwaalboom4.915.238.59
Edwaleni II–Maputo7.737.955.46
Gaborone–Spitskop 132 kV4.244.517.40
Gaborone–Spitskop 132 kV4.234.517.40
Insukamini–Phokoje19.5419.5428.39
Kariba North–Karia South45.2345.2150.41
Kariba North–Kariba South II45.2345.2150.41
Komatipoort–Corumana2.782.401.18
Komatipoort–Infulene6.475.502.48
Malawi–Mozambique21.8422.1834.04
Malawi–Zambia16.9917.0523.52
Normandie–Nhlanganao2.591.331.80
Phokoje–Matimba TL6.947.412.00
Songo–Apollo6.055.844.39
Songo–Bindura25.3025.5548.42
Tweespruit–Maseru5.094.934.11
Tweespruit–Maseru (1)7.757.506.25
Table 6. Different transmission line loss profiles for the SARG network.
Transmission Line Name(a) HVAC (MW)(b) HVDC Link (MW)(c) HVDC & SVC (MW)
Aggeneys–Kokerboom45.318.733.7
Aggeneys–Harib98.240.673
Angola–Nampower1448.3629.5922.8
Aries–Kokerboom772.61006.2201.3
Arnot–Maputo3.73.42
Bulawayo–Francistown29.629.760.9
Camden–Edwaleni0.70.90.4
Derderport–Dwaalboom5.305.916.1
Edwaleni II–Maputo4.004.32
Gaborone–Spitskop 132 kV2.803.28.7
Insukamini–Phokoje36.536.577.2
Kariba North–Karia South00000.1
Kariba North–Kariba South II00000.1
Komatipoort–Corumana0.70.60.1
Komatipoort–Infulene3.82.70.6
Malawi–Mozambique76.478.8185.7
Malawi–Zambia60.761.1116.3
Normandie–Nhlanganao0.100
Phokoje–Matimba TL43.850.7131.3
Songo–Apollo0.80.80.4
Songo–Bindura2020.373.1
Tweespruit–Maseru0.40.80.6
Tweespruit–Maseru (1)0.90.40.2
HVDC LCC Angola–Nampower-32.132.1
HVDC LCC Aggeneys–Kokerboom-25.225.2
Total
Disclaimer/Publisher’s Note: The statements, opinions and data contained in all publications are solely those of the individual author(s) and contributor(s) and not of MDPI and/or the editor(s). MDPI and/or the editor(s) disclaim responsibility for any injury to people or property resulting from any ideas, methods, instructions or products referred to in the content.

