Article

Testing and Modeling of Vehicle Li-Ion Battery Module with Prismatic Cells under Abuse Conditions

1
Hopkins Extreme Materials Institute, Johns Hopkins University, Baltimore, MD 21218, USA
2
Department of Mechanical Engineering, Johns Hopkins University, Baltimore, MD 21218, USA
3
Ralph S. O’Connor Sustainable Energy Institute, Johns Hopkins University, Baltimore, MD 21218, USA
4
Department of Aerospace Engineering, Embry-Riddle Aeronautical University, Daytona Beach, FL 32114, USA
5
Department of High Voltage Battery System, Ford Motor Company, Dearborn, MI 48121, USA
*
Author to whom correspondence should be addressed.
Energies 2023, 16(3), 1055; https://doi.org/10.3390/en16031055
Submission received: 1 November 2022 / Revised: 2 January 2023 / Accepted: 10 January 2023 / Published: 18 January 2023
(This article belongs to the Section D2: Electrochem: Batteries, Fuel Cells, Capacitors)

Abstract

:
The damage behavior of Li-ion vehicle battery modules with prismatic cells has been investigated through mechanical experiments and numerical simulations. The modules were subjected to quasi-static indentation using a V-shaped stainless-steel wedge along three orthogonal directions. One higher speed test was also performed. Force and voltage were measured as a function of displacement to monitor damage during loading. A detailed finite element (FE) model was developed to simulate force-displacement with very good comparison to experimental results. Based on the FE model, energy absorption contributions of four major component groups were analyzed along with detailed effects of enclosure weld defects. Analysis indicates the steel parts absorbed significant amounts of energy irrespective of indentation direction. The welds connecting the side plates were the weak link in the protective structure. Increasing the thickness of the steel plates could help absorb more energy.

1. Introduction

Li-ion batteries are a common power source for current electric vehicles (EV). Safety of these batteries and preventing damage to them is critical since it can result in more rapid performance degradation, fire and explosion, environmental risk, etc. Most Li-ion batteries used for EVs contain pouch, cylindrical, or prismatic cells. Typical pouch cells are made from multiple layers of anodes, separators, and cathodes, stacked together and enclosed within a thin, electrically insulated, aluminum laminate composite pouch. With cylindrical cells, a long anode/separator/cathode/separator layer is rolled to form a multilayer jellyroll and enclosed in a cylindrical casing. For prismatic cells, several of the above jellyrolls are compressed, stacked, and enclosed in an aluminum casing. For all three types, anodes, separators, and cathodes are immersed in electrolytes and electrically connected.
There have been a large number of studies involving the safety of Li-ion batteries. Liu et al. [1] reviewed the importance of safety and mechanical abuse of Li-ion batteries. Early efforts [2,3,4] on mechanical abuse of pouch cell type batteries under quasi-static conditions revealed several interesting aspects of battery behavior. Wang et al. [3] reported thinning of the separator as a cause for short-circuit during mechanical indentation. Chung et al. [4] reported that, under indentation loading, the cells failed with inclined cracks irrespective of punch size and type. While quasi-static tests reveal important information, the batteries show significant differences when loaded dynamically. For example, Zhu et al. [5] observed that cells with and without electrolytes behave differently under dynamic conditions. Kisters et al. [6] reported that presence of the liquid electrolytes created a pressure gradient inside the cell under dynamic conditions causing dry and wet cells to behave dissimilarly. Li-ion batteries exhibit a non-linear monotonic relation between loading speed and initial peak force [7]. Most prior studies have involved pouch and cylindrical cells, although prismatic cells exhibit similar behavior under mechanical abuse [8,9,10,11]. The non-linear monotonic behavior is attributed to battery component materials/structure. Consider that the cells are multi-layered and composed of metal foils with granular coatings (anodes and cathodes) with numerous polymeric separators between them. Studies [12,13] have shown that the separators exhibit complex strain-rate sensitive behavior which in turn influences cell-loading behavior. Consider that polymers are generally more sensitive to loading rate than many other materials. There have been several experimental and numerical investigations seeking to understand and comprehend underlying failure mechanisms. The experiments tend to be delicate, with most components enclosed, making it difficult to observe interior deformation and damage in situ. The simulations are complicated, with a need to accommodate differences in deformation amongst the layers, complex boundary conditions, short circuiting, heat generation, electrolyte flow, gas swelling, cracking, etc. Researchers have sought to address these issues by developing constitutive relationships using calibrated material parameters [2,14,15]. Efforts have also been made to better understand the underlying mechanisms of failure and short-circuiting through multi-physics modelling [16,17,18,19]. Please refer to Zhu et al. [20] for a mechanical modeling review.
To date, most mechanical studies involving Li-ion batteries have been focused on the cell level with module level investigations remaining sparse. Xia et al. [21] studied impact tests on a battery module made from pouch cells, considering several different cases by varying indenter shape, impact speed, state-of-charge (SOC), and battery orientation. It was observed that when impacted along the pouch cell stacking direction, indenters damaged the internal cell layers which eventually led to thermal runaway. However, along the non-stack orientation, indenters damaged the module but without thermal runaway. Kalnaus et al. [22] studied indentation of pouch cell modules using a spherical shape indenter at various speeds. They reported significant stiffening of the initial force-displacement curve when decreasing peak force and decreasing penetration distance to short-circuit reduced as speed increased. In situ observation using x-ray computed tomography revealed that cracks formed within the cells even at lower penetration depths as speed increased. Zhu et al. [23] also studied indentation of pouch cell modules using hemispherical and V-shaped wedge punches. The hemispherical punch required more force to deform the module than the wedge because of higher localized material densification. To date, most module studies have focused on pouch cell types; however, studies on prismatic cell studies have also been limited. Deng et al. [24] studied the impact of pouch and prismatic cell modules using two different indenters (sphere and cylinder) and three different directions. Loading force and the critical displacement (i.e., penetration to short-circuit) were influenced by the cell form factor and indenter shape.
For the present work, prismatic cell Li-ion battery modules were indented using a V-shaped stainless-steel wedge, the same as previously used to indent pouch cell modules [23]. The modules were subjected to quasi-static indentation at 0.05 mm/s along three orthogonal directions. A higher speed test at 50 mm/s was also performed to observe the strain-rate effect. Force and voltage were measured as a function of displacement to monitor damage during loading. Finite element (FE) models were developed and analyzed using commercial LS-DYNA (LSTC/ANSYS, Livermore, CA, USA) solver. The FE model force-displacement showed a very good comparison to experimental results. It provided insights into energy absorbing contributions of individual Li-ion battery module components as well as design/fabrication defects.

2. Battery Module

A prismatic cell Li-ion battery module is shown in Figure 1a. It has 13.2 kg mass and consists of six 1.9 kg prismatic cells connected in series. The rated capacity of the battery is 63 Ah with nominal voltage of 21 V. A typical prismatic cell and jellyroll are shown in Figure 1b; each cell contains four stacked jellyroll layers. The cathodes are made of Lithiated NMC (Nickel, Manganese, and Cobalt) coated onto aluminum alloy foil, and anodes made of graphite coated onto copper alloy foil. The separators are made from microporous polypropylene (PP) films. The overall dimensions of the module are 306 mm × 176 mm × 150 mm. The battery modules consist mainly of four component groups. The first of which is six prismatic cells, each containing four stacked jellyroll layers, connected in parallel, and enclosed within an aluminum-based alloy housing structure. The second is a top c-section beam made of stainless steel. It has a right-angle ventilation pipe passing through it and is welded to ~1.5 mm thick sidewall mounting brackets with vehicle mounting bolt holes. The third is the protective side plates made from four ~0.7 mm thick stainless-steel sheets, which are all welded together at their edges. It surrounds the sidewall mounting brackets and cells on four sides. The fourth is several polymer and electrical connectivity structures: Orange/black plastic electrical covers/pathways; soft light blue rubber gaskets/seals to control and channel vented cell gas into the ventilation pipe; various electrical wiring and connectors. Prior to indentation testing, battery modules were initially discharged to less than 1 V using an electrical resistive heating element immersed in tap water. A very low SOC helps prevent thermal runaway, fire, explosion, etc. making the abuse tests much safer. Because voltage recovers after initial discharging, additional monitored discharge events were necessary to achieve a reasonably stable recovered voltage of less than about 11 V. Some voltage is needed to help identify damage and short-circuiting, yet SOC power remains low.

3. Experimental Procedure

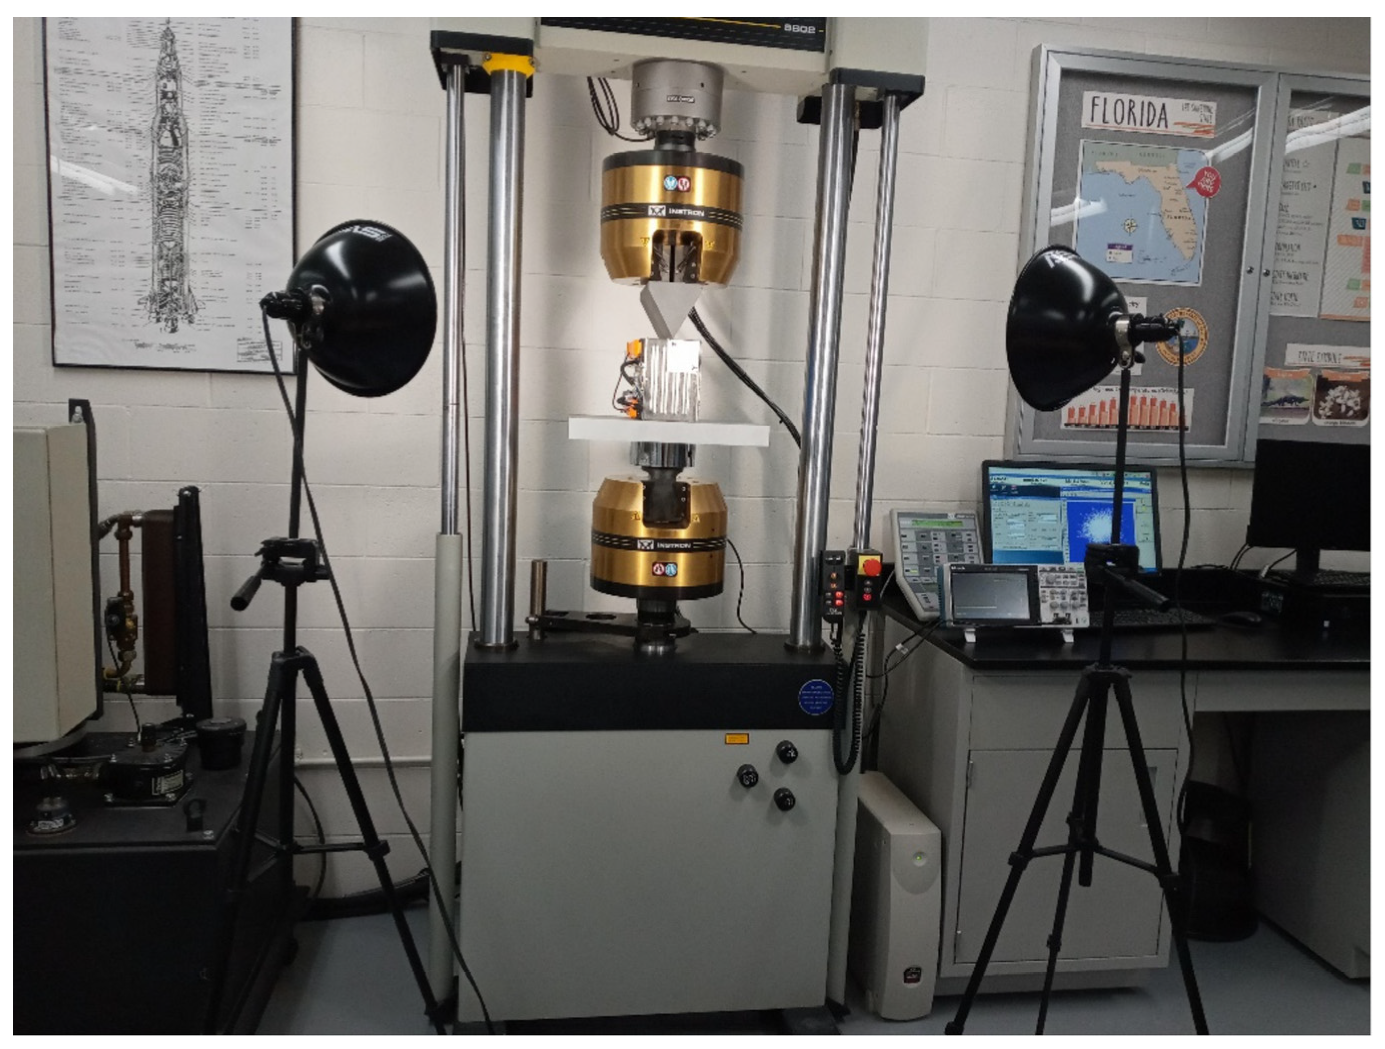
The experimental setup is shown in Figure 2. Li-ion battery modules were subjected to indentation using a V-shaped wedge, Figure 1c and Figure 2. An Instron (Norwood, MA, USA) 8802 servohydraulic test system applied the indentation loads. A 150 mm DIA compression platen held up thick Al alloy 6061 base module support plate(s); the wedge was attached by gripping its threaded rod connector. The actuator speed was 0.05 mm/s or 50 mm/s and the force-time sampling rate was 0.125 kS/s. A Tektronix (Beaverton, OR, USA) TBS 2102 Digital Oscilloscope recorded battery module voltage at 0.125 kS/s (same as Instron 8802 rate for convenient file merging). Manual triggering was sufficient for the lower speed tests. Two tripods mounted with 3500 K (which matched 3500 K overhead room lighting and camera white balance settings) LED light sources were used for enhanced lighting. Digital photographs were recorded using a tripod mounted 32.5 Megapixel Canon (Tokyo, Japan) 90D digital camera with Canon EF-S 18–135 mm f/3.5–5.6 IS USM DSLR zoom lens. The photographs started at 0 mm and continued every 10 mm actuator displacement until test end. Maximum actuator displacement was 100 mm owing to test machine range limit. For the higher rate test, channel 1 of the digital oscilloscope recorded battery module voltage while channel 2 was needed for quick triggering. The 10-mV threshold trigger signal was initiated by dynamic motion of a PCB Piezotronics (Depew, NY, USA) model 353B03 quartz shear ICP® accelerometer hot glued to the lower grip of the test machine and connected to a model 482C15 ICP® sensor signal conditioner. Before and after photographs were recorded. Indentations were performed for three different orthogonal directions. Along x direction with wedge edge parallel to z direction (Case 1); along y direction with wedge edge parallel to x direction (Case 2); and along z direction with wedge edge parallel to x direction (Case 3). These three scenarios were carried out at the lower speed of 0.05 mm/s. A higher speed test at 50 mm/s was also conducted along x direction with wedge edge parallel to z (Case 1H). Test details are summarized in Table 1.

4. Numerical Model

Finite element (FE) models were developed to simulate the indentation tests in order to gain insight into battery module damage behavior for different scenarios. For the modeling work, CAD models were built using CATIA (V5, Dassault Systèmes, Waltham, MA, USA) and FE meshed with Hypermesh (V12.0, Altair, Troy, MI, USA). The simulation solver was LS-DYNA explicit (R13_MPP, ANSYS/LSTC, Livermore, CA, USA).

4.1. Parts Geometry Modeling

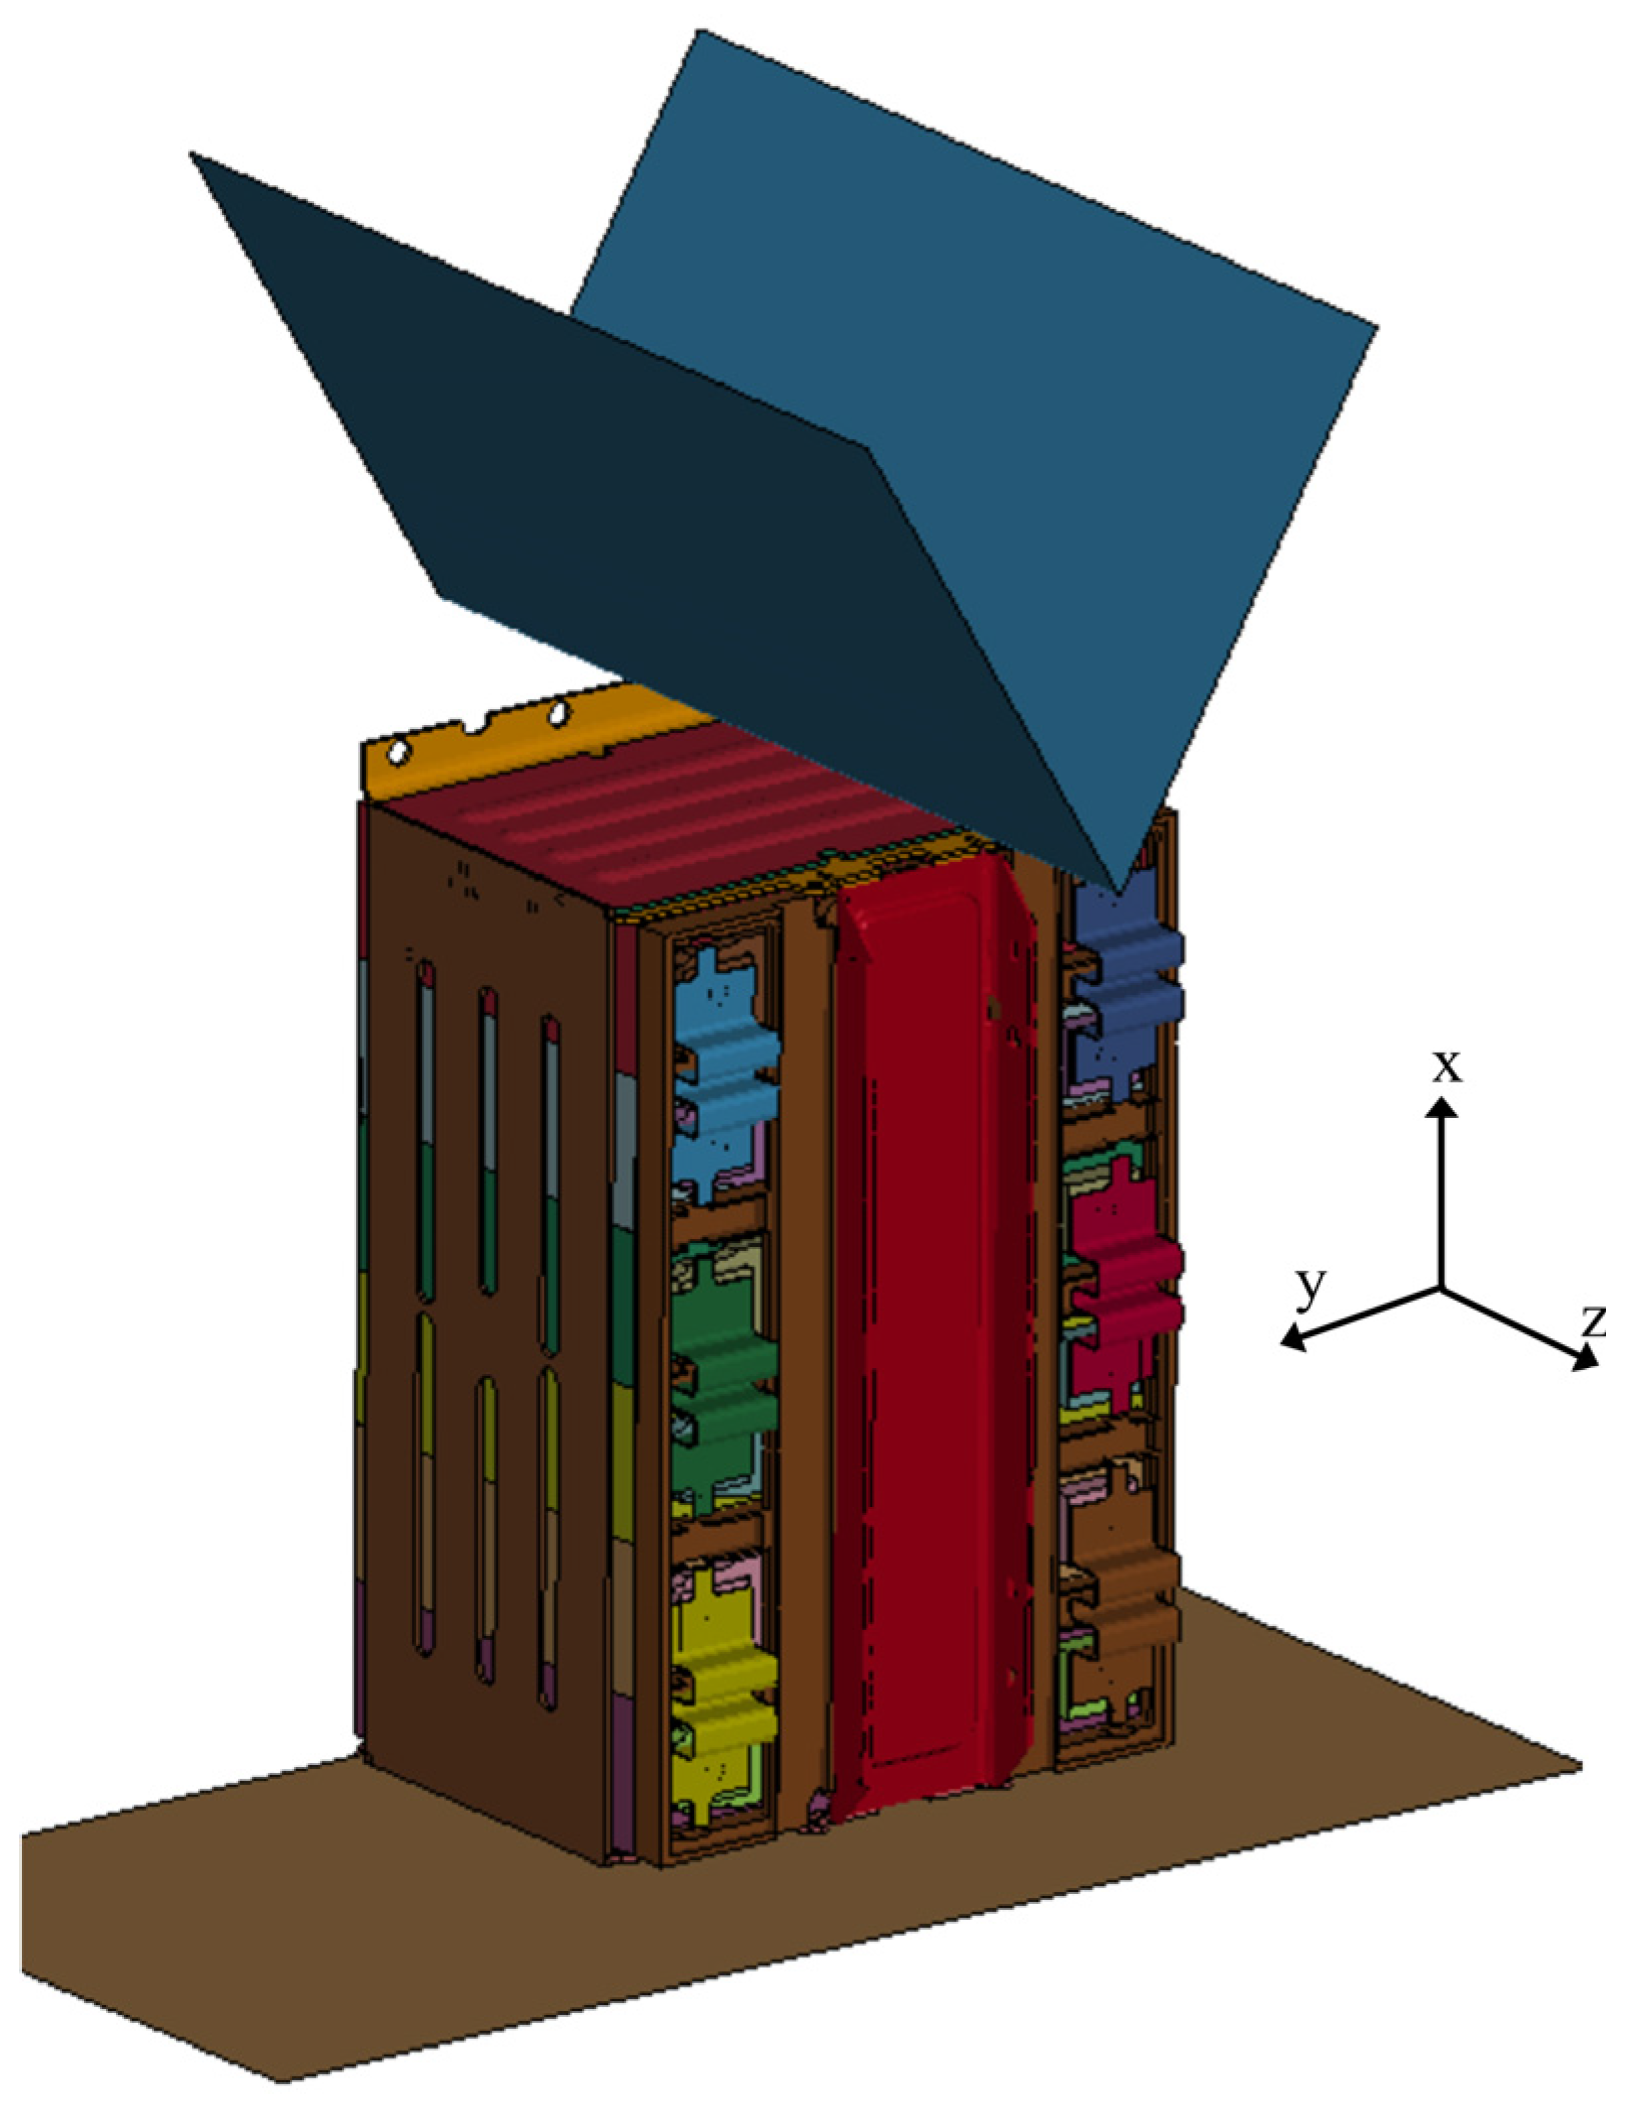
CAD models of battery module parts were built through reverse engineering. Jellyroll layers within the cell were modeled as homogeneous solid parts; investigating microscopic deformation and failure of differing jellyroll components (cathode, anode, and separator) was not the focus of this work. Cells of the battery module studied here have been subjected to detailed analysis experimentally and numerically [7]. The detailed validation can be seen in [7] and is not repeated in this paper. The V-shaped stainless-steel wedge was modelled as a rigid shell. The top right angle ventilation pipe passing through c-section beam was not considered in the model nor were electrical connectivity wires due to their limited load bearing contribution to overall module structural response. The FE model of the Li-ion battery module and wedge is shown in Figure 3. Details of the mesh used for individual parts are shown in Table 2. The finite element model is reasonably well detailed considering the large number of differing parts, materials, properties, and connectivity. Electrolyte fluid motion, gassing, pressure, heating, voltage changes, short-circuiting, etc. were beyond the scope of this work.

4.2. Boundary Conditions and Contacts

A prescribed motion was assigned to the wedge which controlled its movement along the indentation direction. The Li-ion battery module was modeled as supported by a fully-fixed rigid plate. The welds fastening the side plates were modelled using CONSTRAINED_TIE-BREAK with plastic strain as the failure criterion. Here, failure strain was found by adjusting between 0.01 to 0.10 (i.e., 1–10%) using trial and error to generate FE results that best matched the experimental results. ERODING_SURFACE_TO_SURFACE contact with SOFT = 1 was assigned between jellyrolls and their surrounding aluminum alloy casings to model the erosion effect jellyrolls undergo during failure. AUTOMATIC_SURFACE_TO_SURFACE contact was used for the V-shaped wedge and other module parts. Aluminum bus bars connecting cell terminals for series cell electrical connections were tied to the cells using TIED_SURFACE_TO_SURFACE contact.

4.3. Material Models

The exterior module protective structures and c-section beam were made of stainless steel while cell covers were made of an aluminum based alloy. MAT_PIECEWISE_LINEAR_PLASTICITY (MAT_024) material model was used for stainless steel and the plastic parts. The cell covers were modelled using MAT_SIMPLIFIED_JOHNSON_COOK_ORTHOTROPIC (MAT_099). The constitutive material law for this model is expressed as:
σ y = A + B ε - p n [ 1 + C l n ε ˙ * ]
where σ y is yield strength, ε - p is plastic strain, and ε ˙ * is effective strain rate. A, B, C, and n are model parameters. Details of the material parameters are shown in Table 3. Jellyrolls were simplified as homogenous solids and modeled as a foam-like material using MAT_CRUSHABLE_FOAM model (MAT_063) since they are a porous medium. This material law has been frequently applied to model Li-ion battery jellyrolls [25]. Material properties of jellyroll were obtained from our prior compression tests [26]. The density, Young’s modulus, Poisson’s ratio, and tensile stress cutoff values used in the foam model were 2.3 g/cm3, 0.5 GPa, 0.01, and 0.025 GPa, respectively. Hourglass type 4 was used to minimize the hourglass energy. For the higher speed indentation test (case 1H), strain rate related parameters, C = 0.9 /ms and P = 4.6 [27], for the Cowper-Symonds model (Equation (2)), were added to the stainless-steel parts.
β = 1 + ε ˙ C 1 P
where β is scaling factor for yield strength and ε ˙ is strain rate. C and P are material constants.

5. Experimental Results and Numerical Model Comparison

In this section, results obtained from the experiments and the FE model are compared in terms of deformation mode, force-displacement response, and short-circuit/jellyroll damage behavior. The comparison is summarized in Table 1.

5.1. Case 1

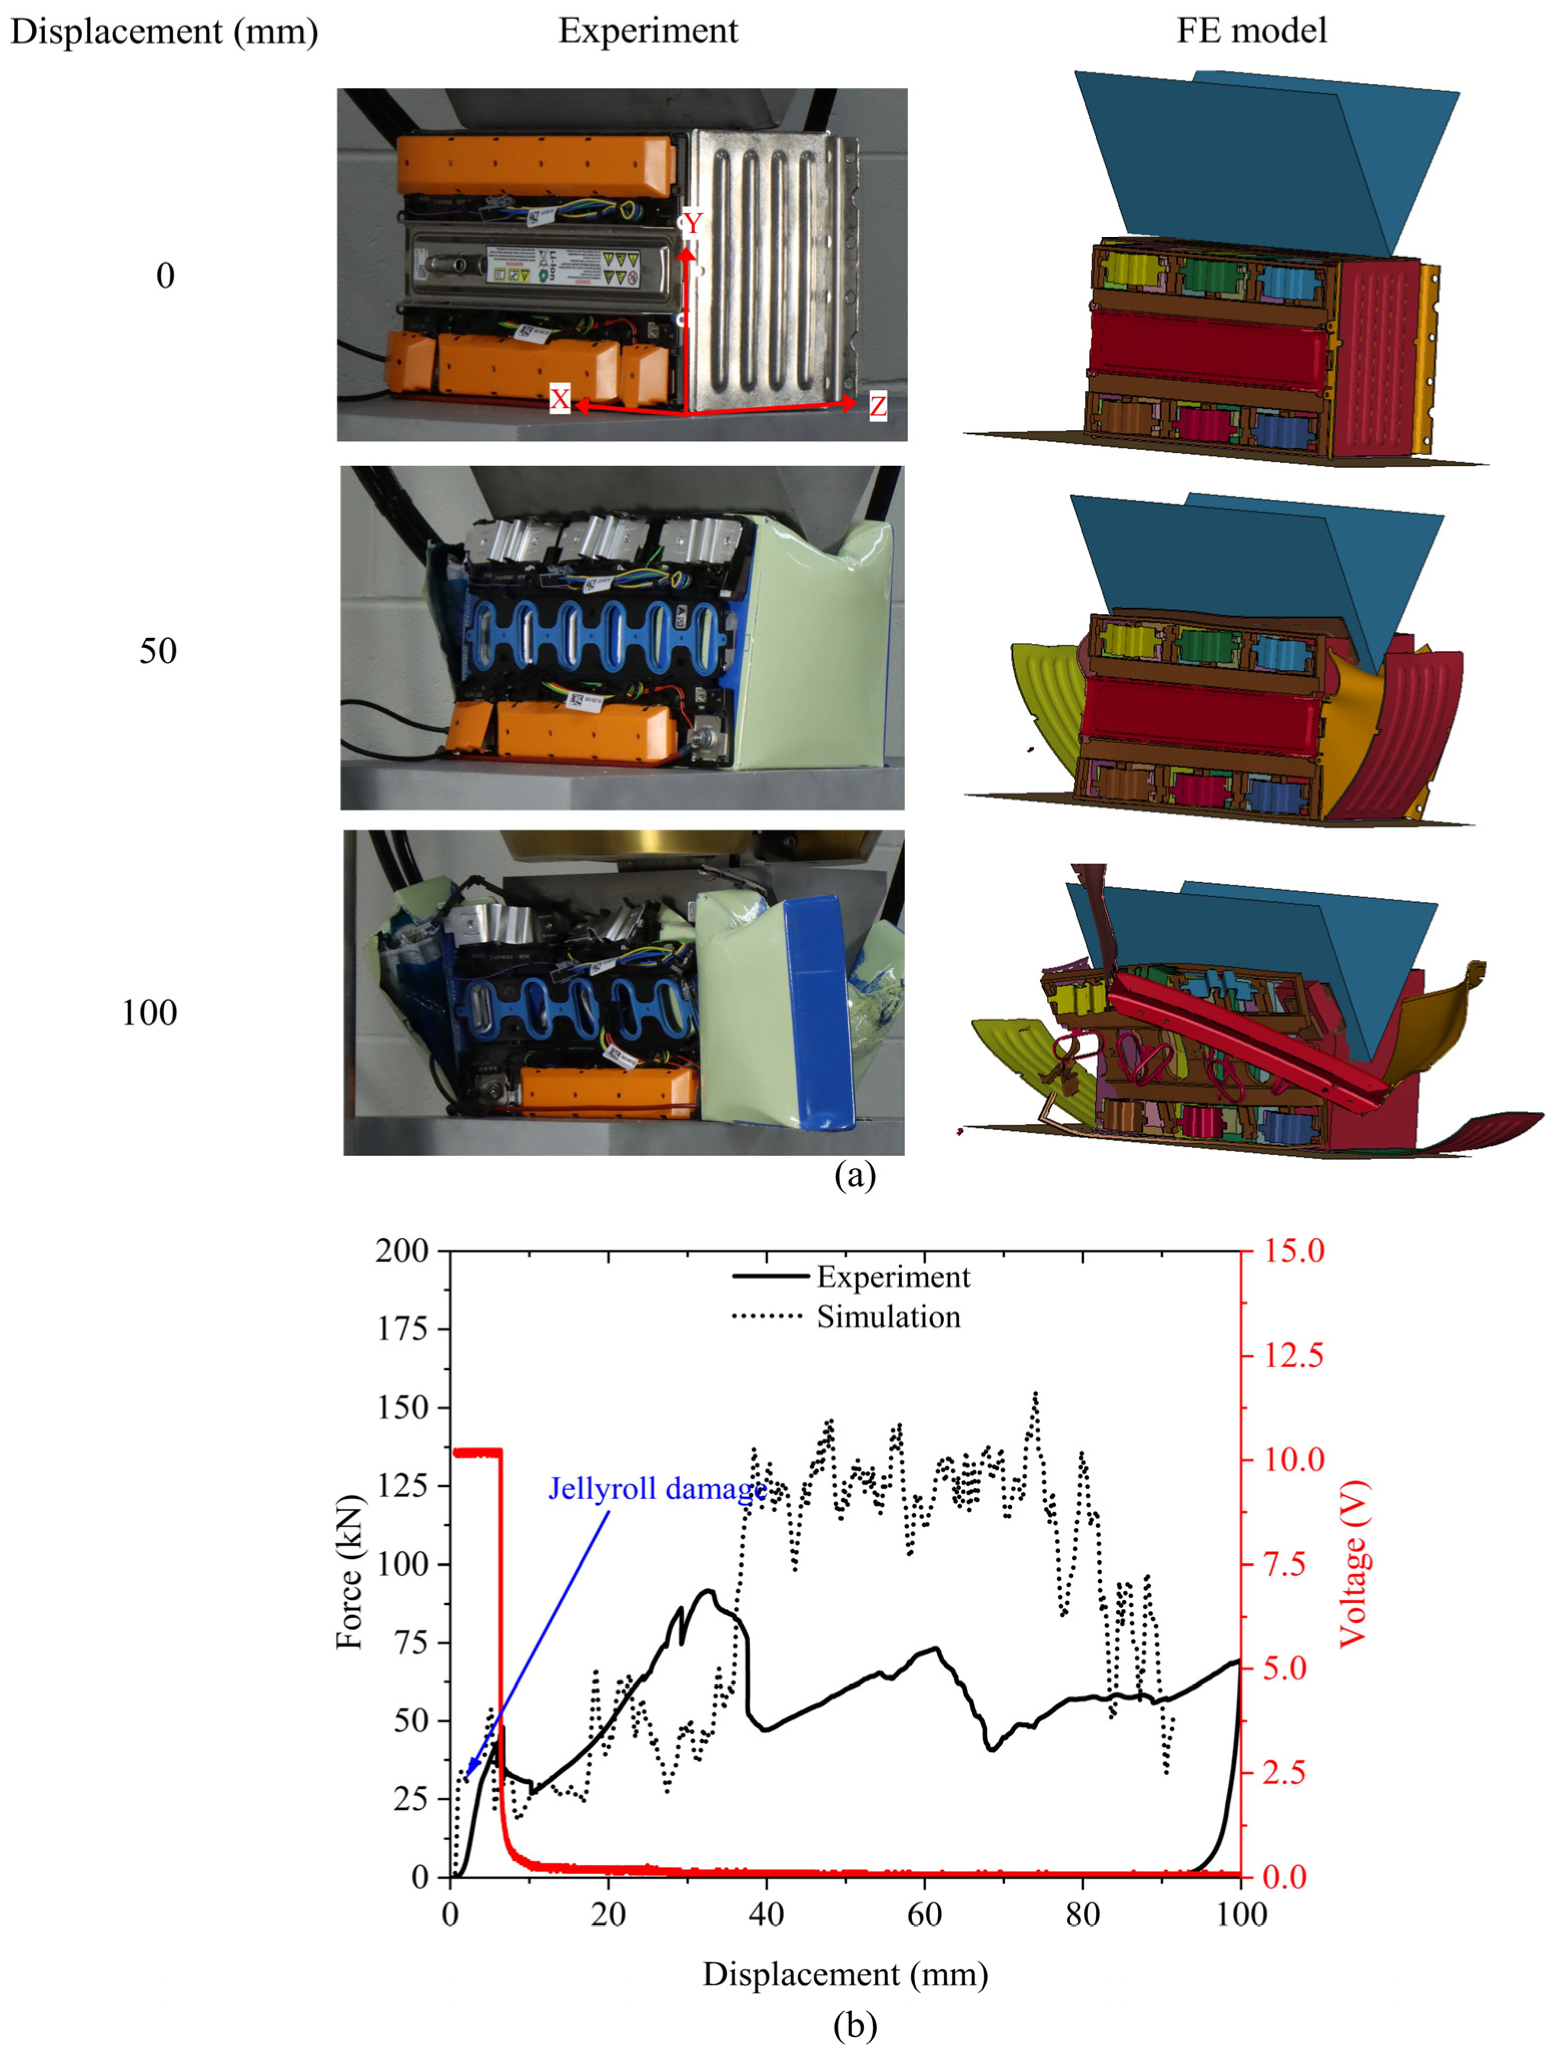
Figure 4 shows experimental and FE deformations along with force-displacement voltage curve responses for indentation along x direction with wedge edge parallel to z direction. Initially, the stainless-steel side plate on top bends. At 25 mm, welds connecting these side plates to the other side plates crack and fail. The now bent and disconnected side plate follow the wedge contour during further indentation. The first cell nearest the wedge does so as well. This can be observed at 50 mm, in both the experiment and FE model, Figure 4a. The first cell was eventually split into two halves by test end at 100 mm. The wedge penetrated the second cell, but the displacement was not deep enough to fully split it. The top c-section beam, and plastic parts were also split by the wedge while the protective side sheets were pushed out and away. The FE model predicted deformation details quite well.
The initial peak forces obtained from the experiment and the FE model were 57 kN and 59 kN, respectively (Figure 4b). Experimentally obtained voltage drop (initiation of short-circuit) and peak force occurred at nearly the same displacement indicating that peak force corresponds to initiation of severe jellyroll damage. FE model simulations revealed nearly the same initial behavior. This indicates that the FE model can predict battery damage and corresponding short-circuit failure reasonably. The second voltage drop at 50 mm is due to jellyroll damage in the second cell. Though the FE model predicted the initial peak force, deformations, and jellyroll damage quite well, there is discrepancy during later stages of the test. This could be due to complex interactions between battery module components during the very severe and abusive damage which cannot be completely captured by the current numerical model.

5.2. Case 2

Figure 5 shows experimental and FE deformations along with force-displacement responses for indentation along y direction with wedge edge parallel to x direction. Experimental voltage responses are also shown. Here, the wedge cut all cells simultaneously. During initial penetration, welds fastening the side sheets cracked and failed. Then, two of the side sheets along with the top c-section beam and mounting bracket sheets came off. The absence of the protective side plates can be seen at 50 mm, Figure 5a. Lateral expansion of the cells during indentation probably contributed to this. Discharged cells often expand or bulge when released from the stainless-steel compression band, and additional loading seems to exacerbate this. The bulging cannot be predicted by the current FE model, and this is likely contributing to discrepancy in the predicted deformations. At 100 mm, the end cells were pushed away. Again, lateral forces generated by bulged inner cells probably contributed to this.
The initial peak forces obtained from the experiment and FE model were 48 kN and 54 kN, respectively (Figure 5b). Experimentally obtained rapid voltage drop (initiation of short-circuit) and peak force occurred at nearly the same displacement, indicating that peak force corresponds to initiation of severe jellyroll damage. FE model simulations revealed nearly the same initial behavior signifying that the FE model is good at predicting the approximate point of short-circuit. After the initial peak, force values predicted by the FE model simulation deviates from experimental results along with deformation discrepancy. The experimentally observed bulging, sliding, and expulsion of end cells produced lower force values than the FE model simulation which did not predict this. After the initial deformation, the cells started bulging and moved out of the wedge indentation area. The bulge on the cell can be observed at 100 mm displacement (Figure 5a). We believe the bulge formation could be partially caused by gasses generated inside the cells during short-circuit which could not be simulated in mechanical FE model. With the FE model, all cells were indented throughout the loading which resulted in higher force values than experimentally observed.

5.3. Case 3

Figure 6 shows experimental and FE deformations along with force-displacement responses for indentation along z direction with wedge edge parallel to x direction. Experimental voltage responses are also shown. The top c-section beam was subjected to bending with parts beneath it also deforming. Although the FE model did not account for the ventilation pipe, it predicted the small deformations well.
Force obtained from the experiment and FE model increased almost linearly with increasing displacement, Figure 6b. Experimentally obtained rapid voltage drop (initiation of short-circuit) occurred at about 8 mm displacement corresponding to initiation of severe jellyroll damage. FE model simulations revealed nearly the same initial behavior, again signifying that the FE model is good at predicting the approximate point of short-circuit. At about 28 mm, load increases rapidly to reach the 250 kN loadcell limit immediately unloading the module. The sudden rapid increase is believed to be instrumentation and control system issues and not realistic; therefore it is not shown here. This direction and wedge edge orientation is very strong; c-section fully loaded, mounting bracket, and compression band side sheets loaded, compression band welds intact.

5.4. Case 1H

Figure 7 shows force-displacement-voltage responses for indentation along x direction with wedge edge parallel to z direction, but at 50 mm/s to investigate dynamic effects. Deformations observed for this case are very similar to Case 1. But force values were significantly higher due to the strain-rate effect. The initial peak force at the higher speed is 70% more at 1000 times the loading speed. Mean force (defined as the average of force values between initial peak force and force till 100 mm displacement) obtained at 50 mm/s was 77.6 kN, significantly higher than the mean force of 38.9 kN obtained at 0.05 mm/s (case 1). Initial slope of the force-displacement curve for high-speed and low-speed cases was 5.5 kN/mm and 3.4 kN/mm, respectively. The FE model reasonably predicted the overall trend of the force. The difference in initial peak force obtained from experiments and the FE model is only about 10%. The short-circuit occurred just after the initial peak indicating severe jellyroll damage. Since the deformation mode for this case (Case 1H) is almost the same with the scenario of low-speed indentation (Case 1), it is not shown here.

6. Discussion

6.1. Energy Absorption of Individual Parts

To analyze safety performance of the Li-ion battery module, energy absorbed by several parts of the module were calculated using FE results. Four major component group parts were considered and compared; jellyrolls, cell cover, and stainless-steel parts (including top c-section beam, sidewall mounting brackets, and side plates), as well as plastics and aluminum alloy strips connecting cells. Figure 8 shows the energy absorption (EA) and mass specific energy absorption (SEA) for Cases 1–3. The total energy absorbed during these x, y, and z direction indentations were 10.4 kJ, 19.6 kJ, and 2.9 kJ, respectively.
For x direction (Case 1), the steel parts absorbed 73% of the total energy. Jellyrolls and cell covers absorbed about 2 kJ and 0.7 kJ, respectively. As shown in Figure 4a, one of the mounting brackets and side plates deformed severely; these two parts contributed to 61% of the total energy. Out of the six cells, only the top two cells nearest to the wedge deformed substantially, which explains their relatively low contribution to energy absorption. Looking at the SEA of all parts, the stainless-steel parts had significantly higher values than the others. Jellyrolls exhibited the lowest SEA.
For y direction (Case 2), jellyrolls, cell cover, and steel parts absorbed almost equal amounts of energy, about 6.5 kJ each. Unlike the x direction indentation (Case 1), there is only one side plate between the wedge and cells. The mounting bracket sheets were initially struck on their edges, but then came off early on when the welds cracked and failed. This explains the low contribution of steel parts for this loading direction. The protection offered by the side plates and mounting bracket sheets is very limited since their participation only occurred early on. However, cell cover and the jellyrolls deformed significantly leading to most of the energy absorption. The SEA of jellyrolls, cell casings, and steel parts were 0.4 kJ/kg, 2.9 kJ/kg, and 1.7 kJ/kg, respectively. The aluminum alloy cell casings exhibited better SEA than stainless-steel parts for this case.
For z direction loading (Case 3), the stainless-steel parts and cell casings absorbed about 41% and 36% of the total energy, respectively. Along this direction, the wedge initially struck the top c-section beam before deforming other parts. All cells beneath the top c-section beam deformed, so they both (cell covers and jellyrolls) are expected to absorb significant energy. Cell cover exhibited the highest SEA of 0.47 kJ/kg and jellyrolls exhibited the lowest SEA of 0.034 kJ/kg. It is to be noted that the total experimental indentation along this direction was about 30 mm. For these cases, jellyrolls were much more severely deformed. Further indentation for Case 3 could have increased the jellyroll contribution significantly. But during the experiment, the test was stopped due to loadcell overload.
A common observation for all three cases is that the stainless-steel parts contribute to energy absorption significantly when they get loaded. However, if the welds connecting them fail early on during indentation, they act as a weak link in the protective structure. Improving the welding quality and strength may improve energy absorption, and thus, the safety of the battery module.

6.2. Effect of Welding Strength

Findings in Section 5.1 highlighted the dominated contribution of stainless-steel parts to the overall structural response of indented Li-ion battery modules. Since the stainless-steel parts are welded together, it is important to further investigate the effect of welding strength on force-displacement responses.
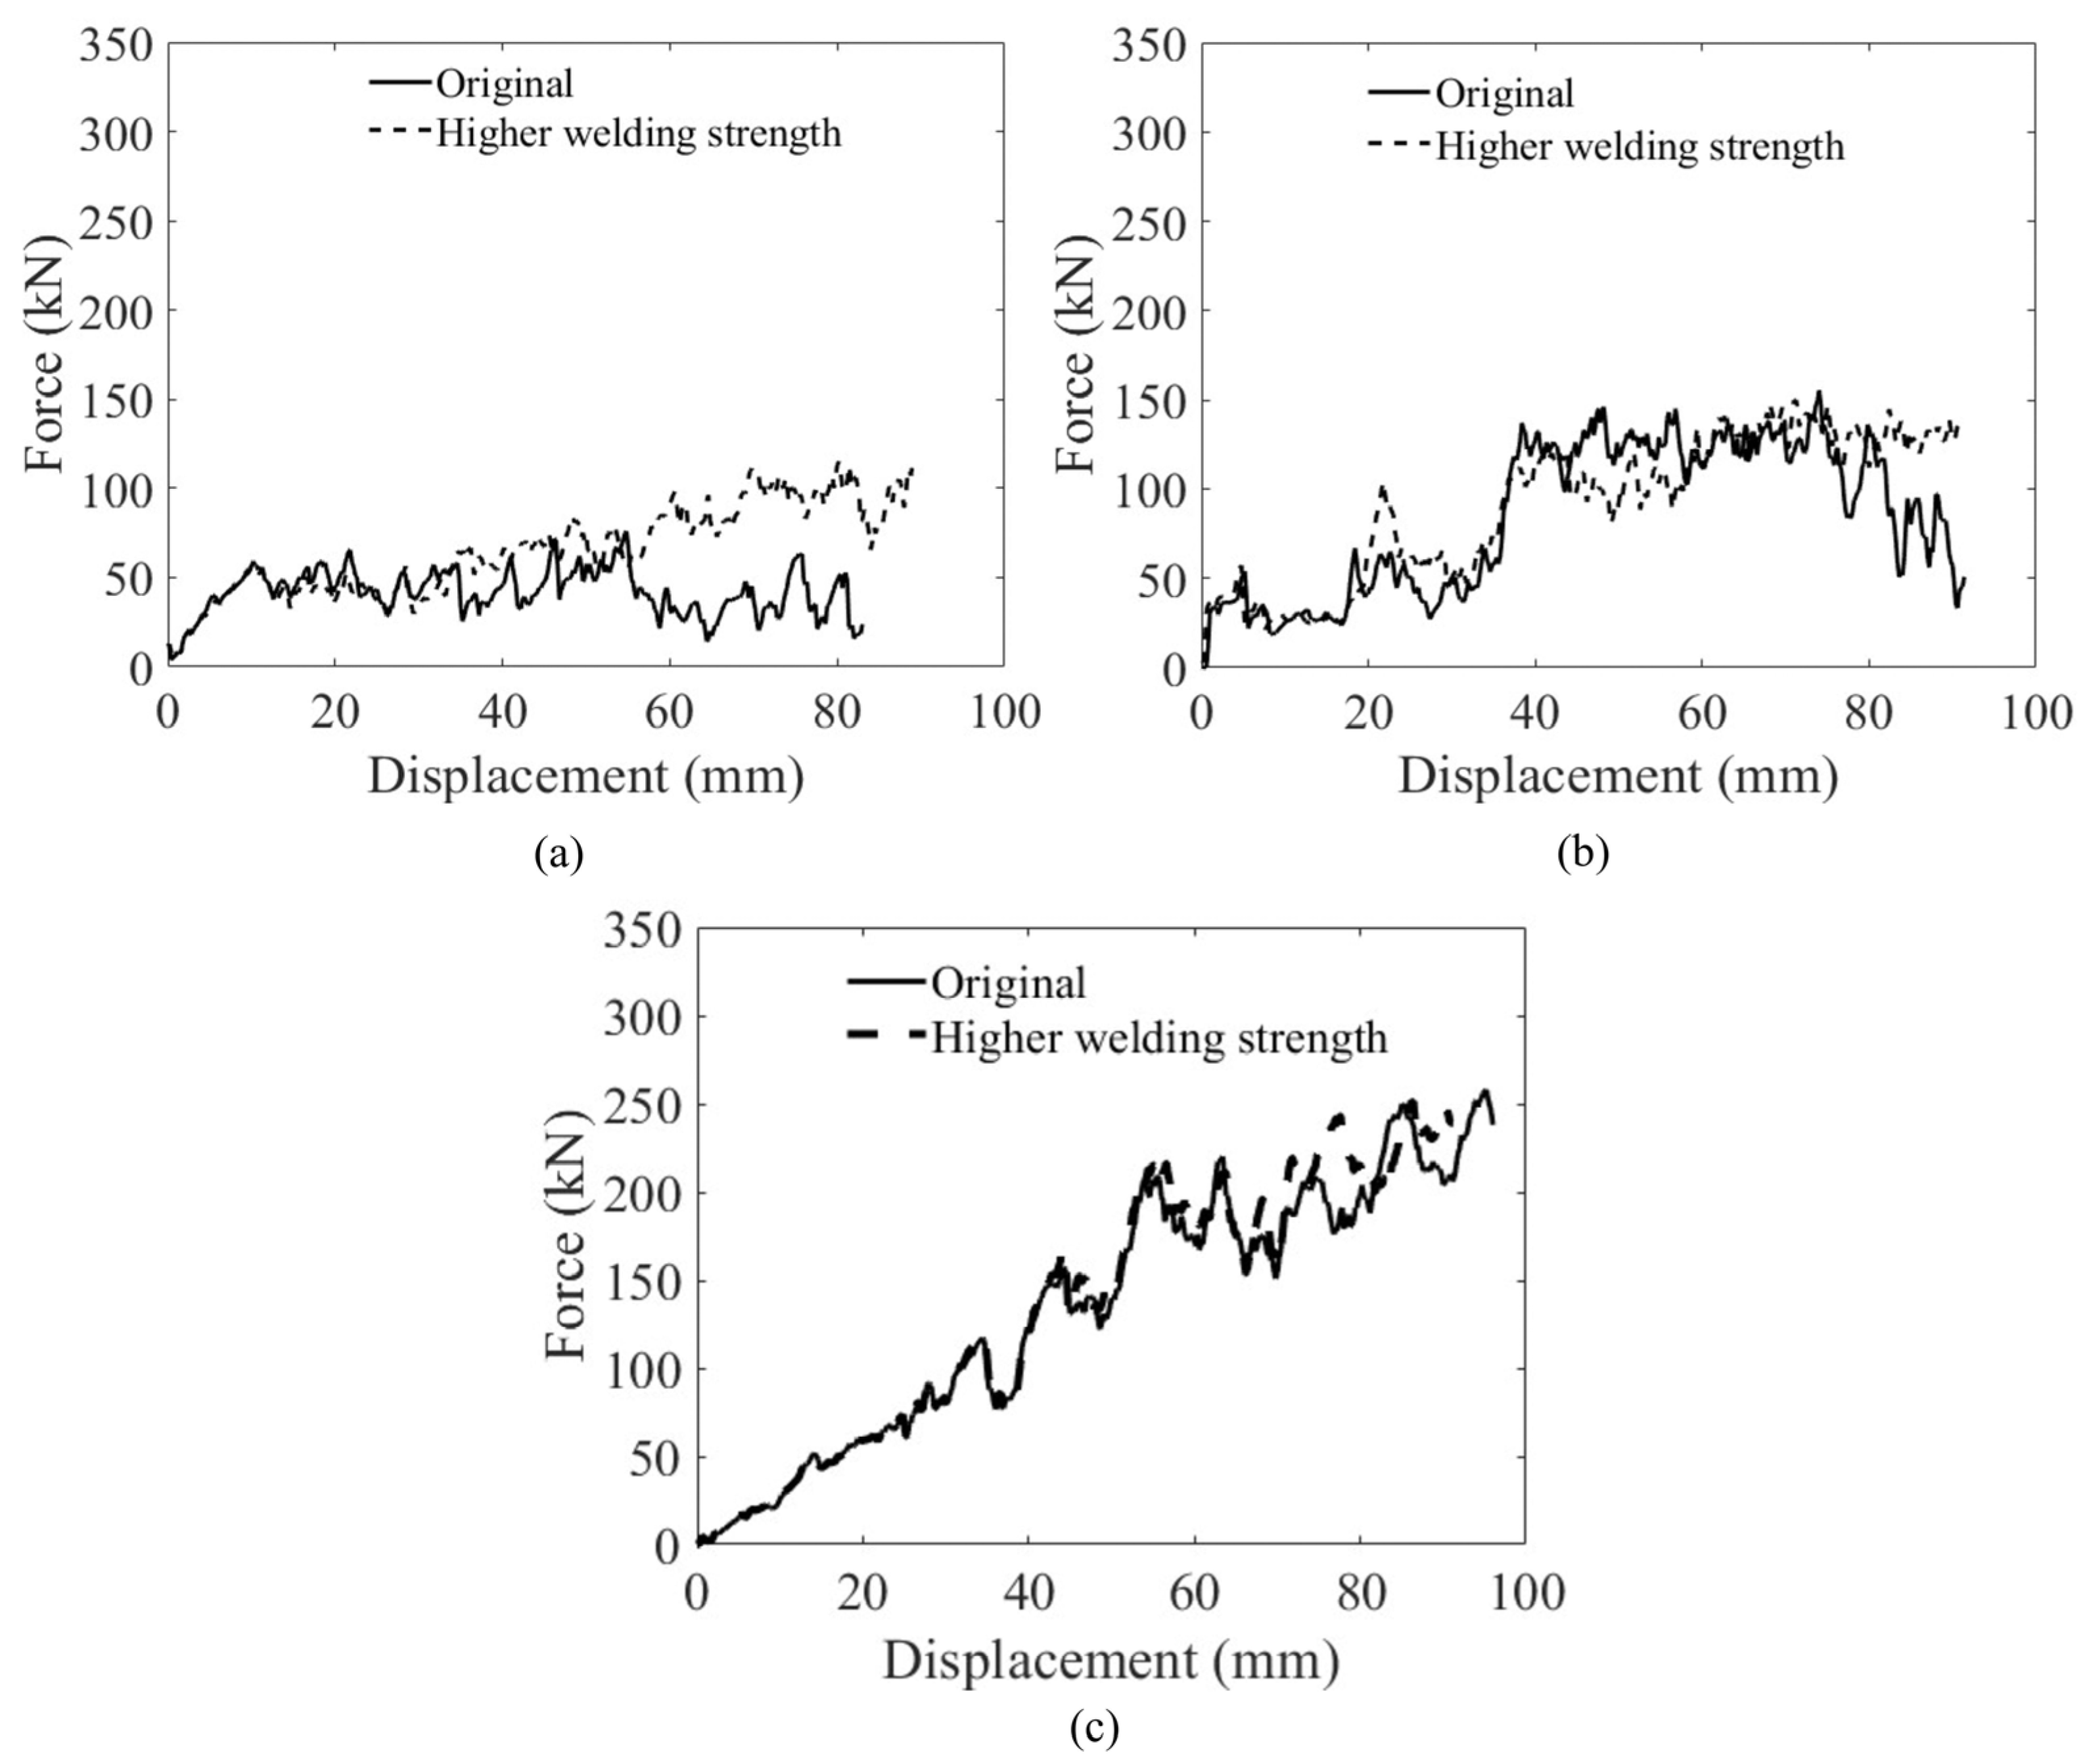
Here, weld-failure strain was increased to 0.50 (50%) for all three cases to observe performance differences. Recall, the earlier model simulations used 0.01 to 0.10 (i.e., 1–10%).
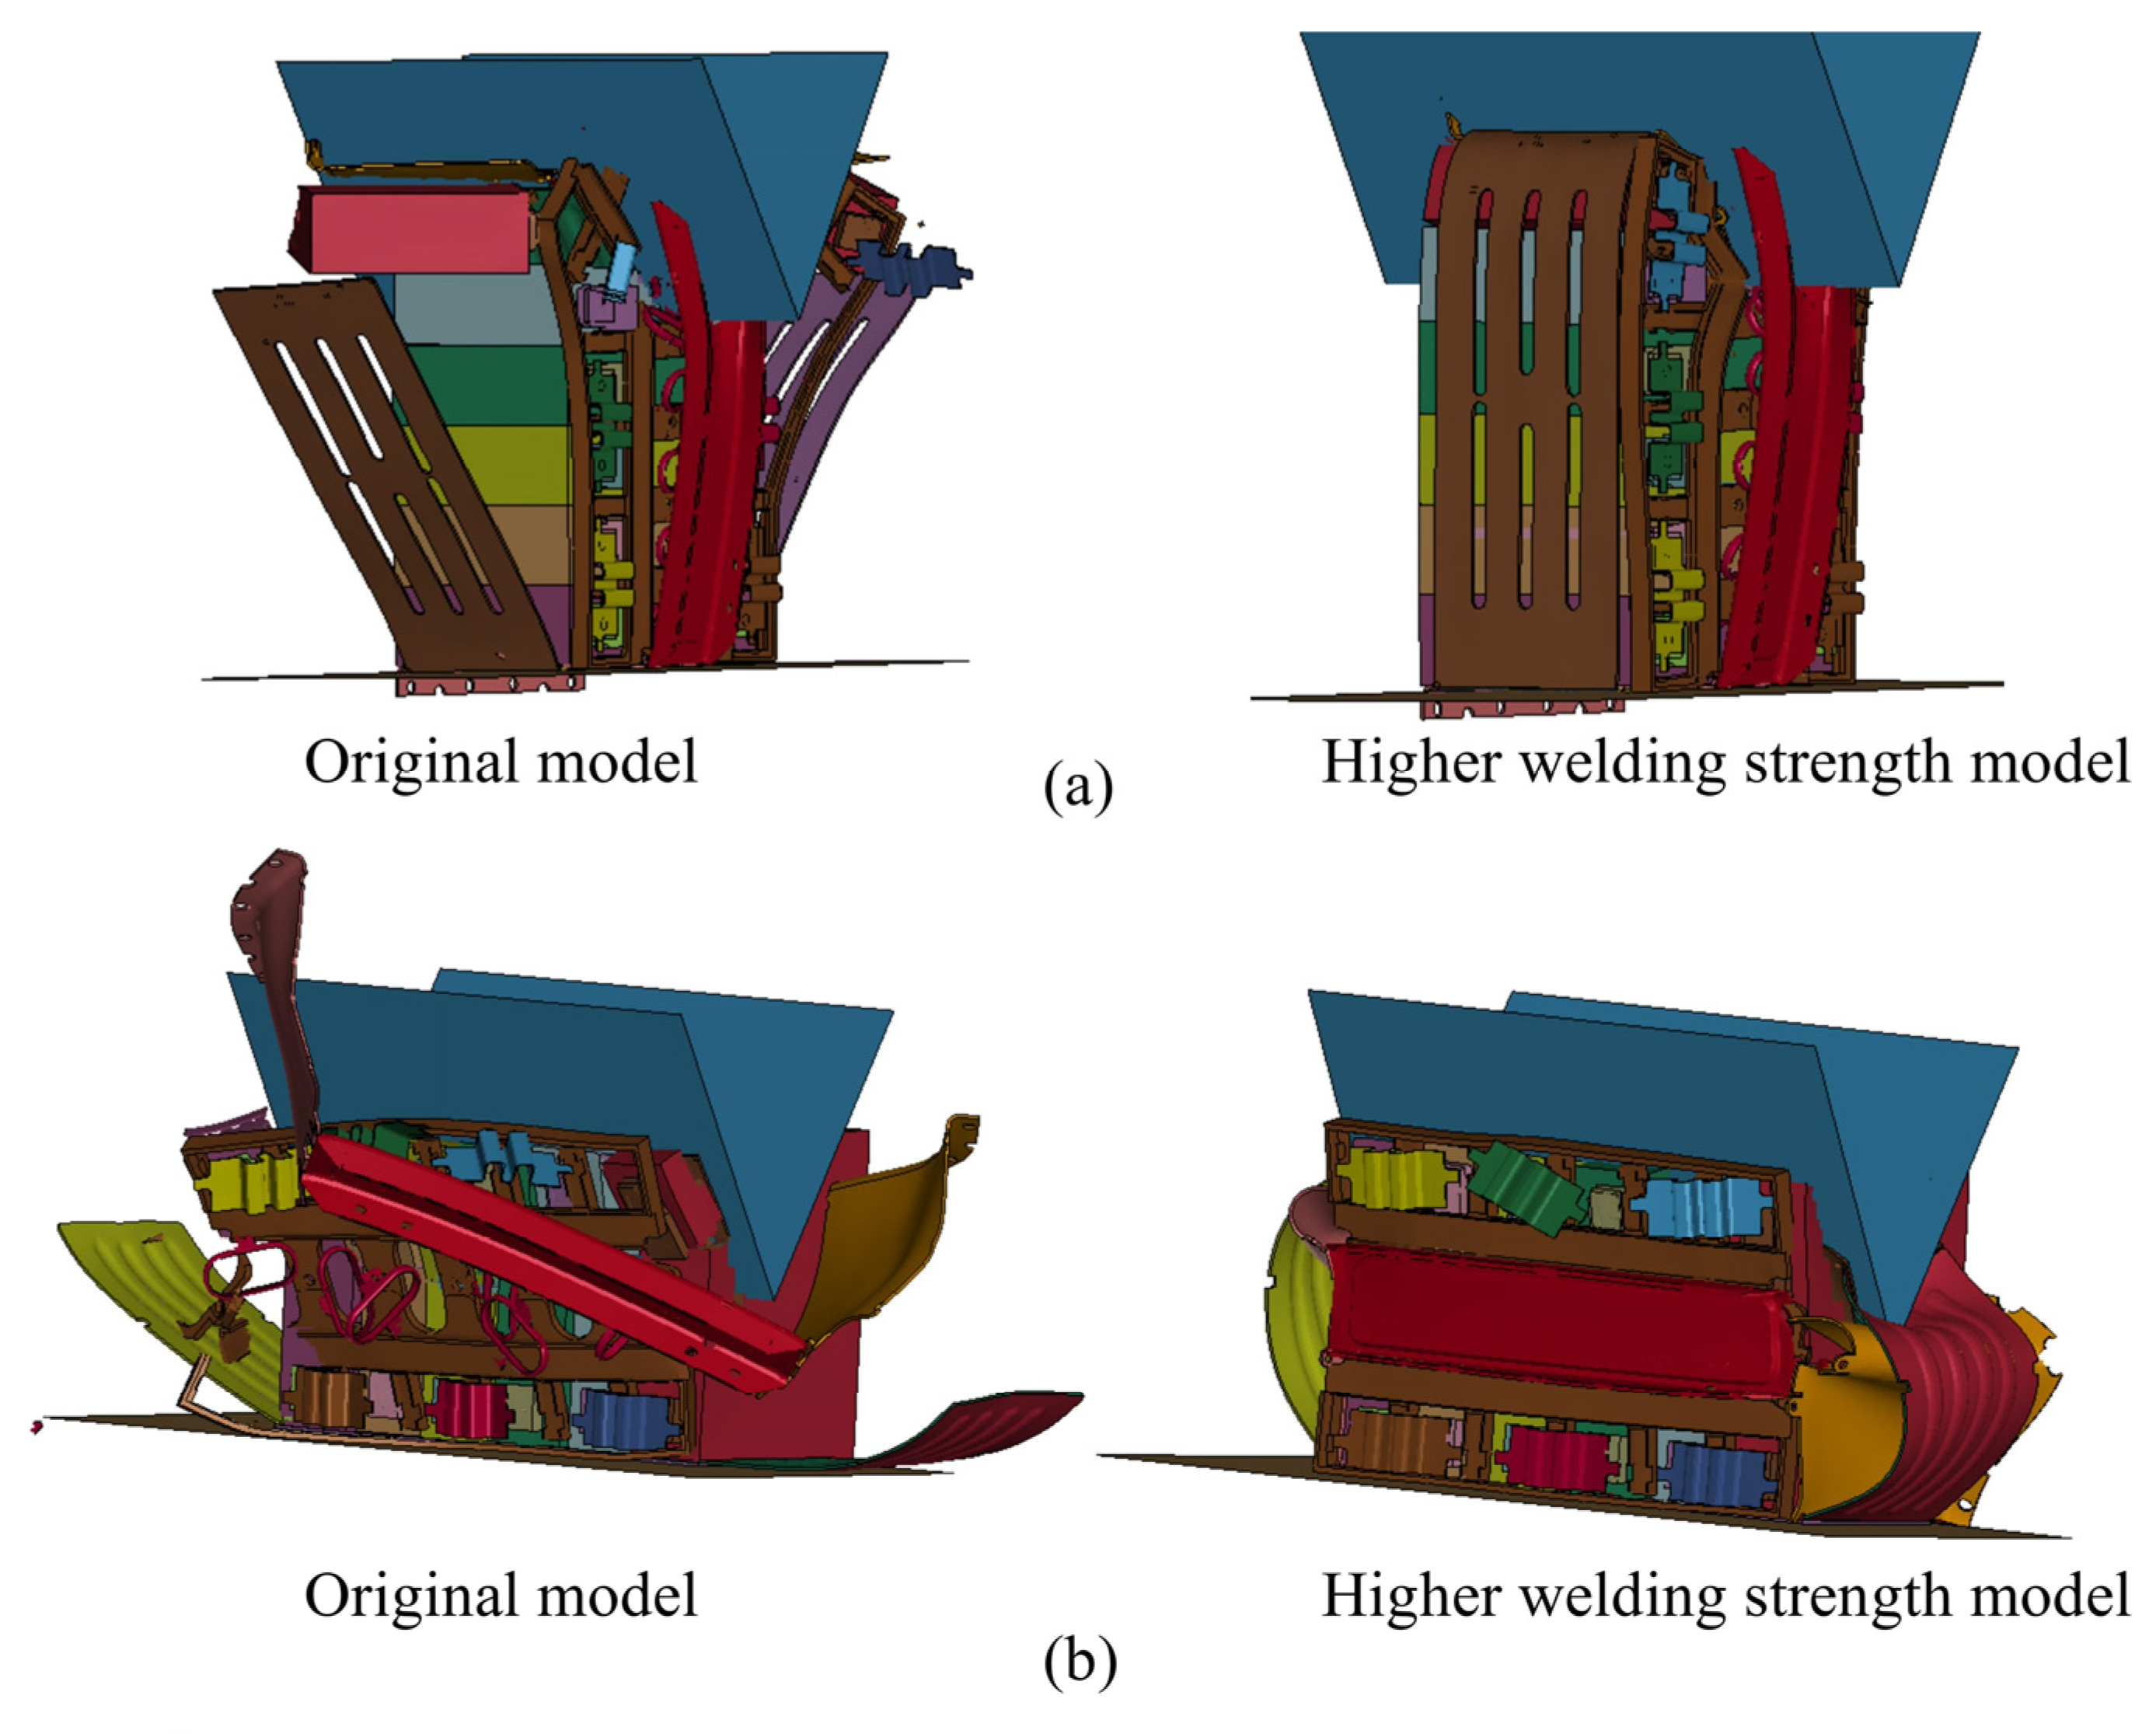
The FE model simulated module damage modes with original and increased welding strength for Cases 1–3 are compared in Figure 9. For indentation along x direction, Case 1 (Figure 9a), the first cell was split into two halves and moved to sides in the original model. Whereas increasing the welding strength caused the stainless steel to hold damaged cells within the protective structure which increased the force during later stages of indentation (after 50 mm) as seen in Figure 10a. Although higher overall energy absorption can be achieved by increasing welding strength, the initial peak which previously corresponded to short circuit initiation has not changed.
For indentation along y direction, Case 2 (Figure 9b and Figure 10b), increasing the weld-failure strain prevented the mounting bracket from coming off the battery module. It can be seen in Figure 9b that the top c-section beam and the sidewall mounting bracket sheets moved away from the battery module for the original model, but not for the model with higher weld-failure strength. The top c-section beam and the sidewall mounting bracket sheets remain inside the side plates. The force-displacement curves are shown in Figure 10b. It can be seen that increased weld-failure strength does not have much effect on force values until about 80 mm deformation. Though increasing the weld strength prevented the c-section and the sidewall mounting from moving away, it did not influence force as much as jellyroll and cell covers contribute to the force significantly.
For indentation along z direction, Case 3 (Figure 9c and Figure 10c), total indentation depth was increased to approximately 100 mm to further analyze the results. It can be seen in Figure 9c that welds joining the stainless-steel side plates in the original model failed and the side plates came off. For increased weld-failure strength, the welds did not fail. However, the wedge pushed the plates to the sides where they became virtually ineffective, and penetrated remaining parts of the module. Due to this, there is little difference in the FE modeled force-displacement curves (Figure 10c).

6.3. Summary and Safety Design Consideration

Based on the experiments and FE analysis, the following points should be noted for Li-ion battery module safety design:
  • Indentation along y and z directions could cause immediate large voltage drop because all of the cells can be subjected to deformation nearly simultaneously. As observed during the experiment, Case 2, bulging of the cells can be facilitated due to generation of gases at low voltage within the cells. This can become a source of fire during a crash.
  • The presence of a sidewall mounting bracket and side plates provides protection for impact along x direction compared to y direction. The effective thickness of the stainless-steel plates between the wedge and cells along x direction is 2.3 mm. However, the side plates between the wedge and cells along y direction are merely 0.7 mm thick. Better energy absorption might be observed by increasing their thickness.
  • As discussed in Section 5.2, improving the weld-failure strain connecting the stainless-steel side plates can improve the energy absorbed by the protective structure, but does not bring much change regarding initiation of short-circuiting.
  • Replacing the monolithic cover plate with sandwich structures with two metal face sheets and a low-density core material like foam could improve the safety of the battery module. The sandwich cover plates could significantly reduce the peak impact force and delay the short circuit. A detailed discussion on this design can be seen in Zhu and Logakannan [28].

7. Outlook

Due to the limited number of battery modules available, only two velocities were tested. Therefore, no comprehensive correlation between loading rate and peak force could be established. In addition, the dynamic tests were only conducted in the x direction of module while the wedge edge was parallel to z. More comprehensive dynamic tests and analyses will be performed in future work. The results from the current study will be useful to design the battery packs used in the EV. However, the installation and interaction between battery packs is beyond the scope of this work and will be considered in the future.

8. Conclusions

A prismatic battery cell module was indented using a V-shaped stainless-steel wedge along three orthogonal directions at 0.05 mm/s. Along x direction, an additional indentation test at 50 mm/s was performed to study the strain-rate effect. Finite element models using commercial LS-DYNA were used to model the behavior. The model simulation results were compared to experimental deformations and force-displacements. They matched reasonably well. Analysis of FE results revealed that stainless-steel parts absorbed significant energy during indentation. They absorbed 72%, 33%, and 41% for indentation along x, y, and z directions, respectively. The presence of a sidewall mounting bracket and side plates provides protection for impact. Indention along y and z directions damaged all cells nearly simultaneously which caused a nearly immediate large drop in voltage. For all cases, welds connecting the side plates together fail early on during deformation. The FE model was altered by using a higher weld-failure strain. The results showed that improving the welds provides better energy absorption for indentation mostly along x direction.

Author Contributions

Conceptualization, F.Z., D.S. and J.D.; methodology, K.P.L., F.Z., D.S., S.X. and J.D.; software, K.P.L. and F.Z.; validation, K.P.L., F.Z., D.S. and J.D.; formal analysis, K.P.L., F.Z. and D.S.; investigation, K.P.L., F.Z., D.S. and S.X.; resources, F.Z. and D.S.; data curation, K.P.L., F.Z., D.S. and S.X.; writing—original draft preparation, K.P.L.; writing—review and editing, F.Z., D.S., S.X. and J.D.; visualization, K.P.L.; supervision, F.Z. and D.S.; project administration, F.Z. and S.K.; funding acquisition, F.Z. and D.S. All authors have read and agreed to the published version of the manuscript.

Funding

This work is funded by Ford Motor Company through a University research program and Hopkins Extreme Materials Institute (HEMI) through a Seed Grant. The financial support is gratefully acknowledged. Professor Sypeck acknowledges the National Science Foundation for the Instron servohydraulic test system, ERAU for numerous small equipment and supplies.

Data Availability Statement

The data presented in this study is partially available on request from the corresponding author. The data is not publicly available due to the requirement of sponsor.

Acknowledgments

The authors would like to acknowledge the assistance from ERAU students S. Xu (co-author), B. de Bruns, O. Ajimobi, X. Wang, M. Chotoo, A. Chika, K. Maurer, A. Patil, and F. Stephen.

Conflicts of Interest

The authors declare no conflict of interest.

References

  1. Liu, B.; Jia, Y.; Yuan, C.; Wang, L.; Gao, X.; Yin, S.; Xu, J. Safety Issues and Mechanisms of Lithium-Ion Battery Cell upon Mechanical Abusive Loading: A Review. Energy Storage Mater. 2020, 24, 85–112. [Google Scholar] [CrossRef]
  2. Sahraei, E.; Hill, R.; Wierzbicki, T. Calibration and Finite Element Simulation of Pouch Lithium-Ion Batteries for Mechanical Integrity. J. Power Sources 2012, 201, 307–321. [Google Scholar] [CrossRef]
  3. Wang, H.; Kumar, A.; Simunovic, S.; Allu, S.; Kalnaus, S.; Turner, J.A.; Helmers, J.C.; Rules, E.T.; Winchester, C.S.; Gorney, P. Progressive Mechanical Indentation of Large-Format Li-Ion Cells. J. Power Sources 2017, 341, 156–164. [Google Scholar] [CrossRef] [Green Version]
  4. Chung, S.H.; Tancogne-Dejean, T.; Zhu, J.; Luo, H.; Wierzbicki, T. Failure in Lithium-Ion Batteries under Transverse Indentation Loading. J. Power Sources 2018, 389, 148–159. [Google Scholar] [CrossRef]
  5. Zhu, J.; Luo, H.; Li, W.; Gao, T.; Xia, Y.; Wierzbicki, T. Mechanism of Strengthening of Battery Resistance under Dynamic Loading. Int. J. Impact Eng. 2019, 131, 78–84. [Google Scholar] [CrossRef]
  6. Kisters, T.; Kuder, J.; Töpel, A.; Langkemper, R.; Nau, S.; Schopferer, S. Strain-Rate Dependence of the Failure Behavior of Lithium-Ion Pouch Cells under Impact Loading. J. Energy Storage 2021, 41, 102901. [Google Scholar] [CrossRef]
  7. Tancogne-Dejean, T.; Grolleau, V.; Mohr, D. Strain Rate Dependent Plasticity of Lithium-Ion Pouch Cells: Experiments and Simulations. Int. J. Impact Eng. 2022, 159, 104048. [Google Scholar] [CrossRef]
  8. Zhu, F.; Zhou, R.; Sypeck, D.; Deng, J.; Bae, C. Failure Behavior of Prismatic Li-Ion Battery Cells under Abuse Loading Condition–A Combined Experimental and Computational Study. J. Energy Storage 2022, 48, 103969. [Google Scholar] [CrossRef]
  9. Deng, J.; Smith, I.; Bae, C.; Rairigh, P.; Miller, T.; Surampudi, B.; L’Eplattenier, P.; Caldichoury, I. Impact Modeling and Testing of Pouch and Prismatic Cells. J. Electrochem. Soc. 2020, 167, 090550. [Google Scholar] [CrossRef]
  10. Kotter, P.; Kisters, T.; Schleicher, A. Dynamic Impact Tests to Characterize the Crashworthiness of Large-Format Lithium-Ion Cells. J. Energy Storage 2019, 26, 100948. [Google Scholar] [CrossRef]
  11. Chen, X.; Wang, T.; Zhang, Y.; Ji, H.; Ji, Y.; Yuan, Q. Dynamic Mechanical Behavior of Prismatic Lithium-ion Battery upon Impact. Int. J. Energy Res. 2019, 43, 7421–7432. [Google Scholar] [CrossRef]
  12. Kalnaus, S.; Wang, Y.; Turner, J.A. Mechanical Behavior and Failure Mechanisms of Li-Ion Battery Separators. J. Power Sources 2017, 348, 255–263. [Google Scholar] [CrossRef] [Green Version]
  13. Xu, J.; Wang, L.; Guan, J.; Yin, S. Coupled Effect of Strain Rate and Solvent on Dynamic Mechanical Behaviors of Separators in Lithium Ion Batteries. Mater. Des. 2016, 95, 319–328. [Google Scholar] [CrossRef]
  14. Zhu, J.; Li, W.; Wierzbicki, T.; Xia, Y.; Harding, J. Deformation and Failure of Lithium-Ion Batteries Treated as a Discrete Layered Structure. Int. J. Plast. 2019, 121, 293–311. [Google Scholar] [CrossRef]
  15. Zhang, C.; Xu, J.; Cao, L.; Wu, Z.; Santhanagopalan, S. Constitutive Behavior and Progressive Mechanical Failure of Electrodes in Lithium-Ion Batteries. J. Power Sources 2017, 357, 126–137. [Google Scholar] [CrossRef]
  16. Duan, X.; Wang, H.; Jia, Y.; Wang, L.; Liu, B.; Xu, J. A Multiphysics Understanding of Internal Short Circuit Mechanisms in Lithium-Ion Batteries upon Mechanical Stress Abuse. Energy Storage Mater. 2022, 45, 667–679. [Google Scholar] [CrossRef]
  17. Lee, D.-C.; Kim, C.-W. Two-Way Nonlinear Mechanical-Electrochemical-Thermal Coupled Analysis Method to Predict Thermal Runaway of Lithium-Ion Battery Cells Caused by Quasi-Static Indentation. J. Power Sources 2020, 475, 228678. [Google Scholar] [CrossRef]
  18. Zhou, M.; Hu, L.; Chen, S.; Zhao, X. Different Mechanical-Electrochemical Coupled Failure Mechanism and Safety Evaluation of Lithium-Ion Pouch Cells under Dynamic and Quasi-Static Mechanical Abuse. J. Power Sources 2021, 497, 229897. [Google Scholar] [CrossRef]
  19. Yiding, L.; Wenwei, W.; Cheng, L.; Xiaoguang, Y.; Fenghao, Z. Multi-Physics Safety Model Based on Structure Damage for Lithium-Ion Battery under Mechanical Abuse. J. Clean. Prod. 2020, 277, 124094. [Google Scholar] [CrossRef]
  20. Zhu, J.; Wierzbicki, T.; Li, W. A Review of Safety-Focused Mechanical Modeling of Commercial Lithium-Ion Batteries. J. Power Sources 2018, 378, 153–168. [Google Scholar] [CrossRef]
  21. Xia, Y.; Chen, G.; Zhou, Q.; Shi, X.; Shi, F. Failure Behaviours of 100% SOC Lithium-Ion Battery Modules under Different Impact Loading Conditions. Eng. Fail. Anal. 2017, 82, 149–160. [Google Scholar] [CrossRef]
  22. Kalnaus, S.; Wang, H.; Watkins, T.R.; Simunovic, S.; Sengupta, A. Features of Mechanical Behavior of EV Battery Modules under High Deformation Rate. Extrem. Mech. Lett. 2019, 32, 100550. [Google Scholar] [CrossRef]
  23. Zhu, F.; Du, X.; Lei, J.; Audisio, L.; Sypeck, D. Experimental Study on the Crushing Behaviour of Lithium-Ion Battery Modules. Int. J. Crashworthiness 2021, 26, 598–607. [Google Scholar] [CrossRef]
  24. Deng, J.; Smith, I.; Bae, C.; Rairigh, P.; Miller, T.; Surampudi, B. Communication—Impact Behaviors of Pouch and Prismatic Battery Modules. J. Electrochem. Soc. 2021, 168, 020520. [Google Scholar] [CrossRef]
  25. Deng, J.; Bae, C.; Miller, T.; L’Eplattenier, P.; Bateau-Meyer, S. Accelerate Battery Safety Simulations Using Composite Tshell Elements. J. Electrochem. Soc. 2018, 165, A3067–A3076. [Google Scholar] [CrossRef]
  26. Logakannan, K.P.; Zhu, F.; Speck, D.; Deng, J.; Kim, S. Dynamic Indentation of Prismatic Li-Ion Battery Cells. Proc. Mater. Today Proc. 2022; under review. [Google Scholar]
  27. Jia, S.; Tan, Q.; Ye, J.; Zhu, Z.; Jiang, Z. Experiments on Dynamic Mechanical Properties of Austenitic Stainless Steel S30408 and S31608. J. Constr. Steel Res. 2021, 179, 106556. [Google Scholar] [CrossRef]
  28. Zhu, F.; Logakannan, K. Crash Safety Design for Lithium-Ion Vehicle Battery Module with Machine Learning. SAE Int. J. Adv. Curr. Prac. Mobil. 2022, 4, 1667–1677. [Google Scholar] [CrossRef]
Figure 1. (a) Li-ion battery module details with directions marked; (b) Typical prismatic cell (top) and jellyroll (bottom); and (c) V-shaped stainless-steel wedge used for indentation.
Energies 16 01055 g001
Figure 2. Experimental setup for quasi-static Li-ion battery indentation tests. The tripod mounted digital camera is situated nearby. A piezoelectric accelerometer with sensor signal conditioner was later added for the higher speed test.
Energies 16 01055 g002
Figure 3. FE model of the battery module with wedge indenter and base support.
Energies 16 01055 g003
Figure 4. Experimental and FE model simulation for Case 1 (0.05 mm/s quasi-static indentation of battery module along x direction with wedge edge parallel to z direction): (a) Module deformations; (b) Force-displacement responses (black) and experimental voltage responses (red).
Energies 16 01055 g004
Figure 5. Experimental and FE model simulation for Case 2 (0.05 mm/s quasi-static indentation of battery module along y direction with wedge edge parallel to x direction): (a) Module deformations; (b) Force-displacement responses (black) and experimental voltage responses (red).
Energies 16 01055 g005
Figure 6. Experimental and FE model simulation for Case 3 (0.05 mm/s quasi-static indentation of battery module along z direction with wedge edge parallel to x direction): (a) Module deformations; (b) Force-displacement responses (black) and experimental voltage responses (red).
Energies 16 01055 g006
Figure 7. Force-displacement responses (black) and experimental voltage responses (red) obtained from experimental and FE model simulation for Case 1H (50 mm/s higher speed indentation of battery module along x direction with wedge edge parallel to z direction).
Energies 16 01055 g007
Figure 8. Energy absorbed by various battery module parts during wedge indentation at 0.05 mm/s: (a) Case 1; (b) Case 2; and (c) Case 3.
Energies 16 01055 g008
Figure 9. The FE model simulated module damage modes with original and increased welding strength: (a) Case 1; (b) Case 2; and (c) Case 3.
Energies 16 01055 g009aEnergies 16 01055 g009b
Figure 10. FE model simulated force-displacement responses with original and increased welding strength: (a) Case 1; (b) Case 2; and (c) Case 3.
Energies 16 01055 g010
Table 1. Wedge indentation direction, wedge edge orientation, and actuator speed details.
CaseWedge Indentation OrientationWedge Edge OrientationActuator Speed (mm/s)Initial Photograph
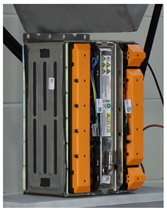
1xparallel to z0.05Energies 16 01055 i001
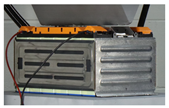
2yparallel to x0.05Energies 16 01055 i002
3zparallel to x0.05Energies 16 01055 i003
1Hxparallel to z50Energies 16 01055 i004
Table 2. Details of the FE model used for individual parts.
Part NumberPart NameMaterial ModelElement TypeElement Size (mm)Number of Elements
1C-section beamMAT_024Tetra0.021~5.0466,641
2Sidewall mounting bracketsMAT_024Hex0.513~2.6814,813
3Side platesMAT_024Hex0.102~2.8129,112
4Cell coversMAT_099Hex0.377~21.5817,988
5JellyrollsMAT_063Hex1.45~12.2158,488
6Plastic partsMAT_024Hex0.01~2.7165,781
7Bus barsMAT_024Hex0.6~1.884428
Table 3. Material properties used for stainless steel, plastic, and aluminum-based enclosure material.
Stainless SteelPlasticEnclosure Material
Young’s modulus = 180 GPa
Poisson’s ratio = 0.28
Yield strength = 250 MPa
Tangent modulus = 5 GPa
For dynamic loading:
C = 0.9/ms
P = 4.6
Young’s modulus = 7 GPa
Poisson’s ratio = 0.35
Yield strength = 40 MPa
Tangent modulus = 0.15 GPa
Young’s modulus = 52 GPa
Poisson’s ratio = 0.33
A = 0.12 GPa
B = 0.156 GPa
C = 0
n = 0.32
Disclaimer/Publisher’s Note: The statements, opinions and data contained in all publications are solely those of the individual author(s) and contributor(s) and not of MDPI and/or the editor(s). MDPI and/or the editor(s) disclaim responsibility for any injury to people or property resulting from any ideas, methods, instructions or products referred to in the content.