Abstract
Unlike the more prevalent alternating current transmission systems, the high voltage direct current (HVDC) electric power transmission system transmits electric power using direct current. In order to investigate the precise remedy for fault detection of HVDC, this research proposes a method for the HVDC fault diagnostic methodologies with their limits and feature selection-based probabilistic generative model. The main contribution of this study is using the wavelet transform based on ant colony optimization and ANN to detect the different types of faults in HVDC transmission lines. In the proposed method, ANN uses optimum features obtained from the voltage, current, and their derivative signals. These features cannot be accurate to use in ANN because they cannot give reliable accuracy results. For this reason, first, the wavelet transform applies to the fault and non-fault signals to remove the noise. Then the ACO reduces unimportant features from the feature vector. Finally, the optimum features are used in the training of ANN as faulty and non-faulty signals. The multi-layer perceptron used in the suggested method consists of many layers, enabling the creation of a probability reconstruction over the inputs by the model. A supervised learning method is used to train each layer based on the selected features obtained from the ant colony optimization-discrete wavelet transform metaheuristic method. The artificial neural network technique is used to fine-tune the model to reduce the difference between true and anticipated classes’ error. The input signal and sampling frequencies are changed to examine the suggested strategy’s effectiveness. The obtained results demonstrate that the suggested fault detection and classification model can accurately diagnose HVDC faults. A comparison of the Support vector machine, Decision Tree, K-nearest neighbor algorithm (K-NN), and Ensemble classifier Machine techniques is made to verify the suggested method’s unquestionably higher performance.
1. Introduction
Due to its lower cost across long distances and capacity to transmit more power, high voltage direct current (HVDC) transmission systems have been widely used for power transmission projects with overhead transmission lines, bulk power, and asynchronous connections. The length of the lines, the surroundings of the transmission lines, and unfavorable weather conditions have all contributed to an increased error rate in HVDC transmission lines [1]. For HVDC transmission lines, current differential protection and direct current (DC) voltage reduction are commonly utilized as backup protection in addition to primary protection systems based on voltage derivatives and traveling waves. Protections based on traveling waves and voltage derivatives are vulnerable to fault resistance because they rely on the pace of the voltage change to identify problems. They frequently misdiagnose high impedance failures [2,3].
When determining a specific fault class, the neural network approaches are growing in popularity among fault prognosis techniques [4,5]. These algorithms require fault features derived from the line data (current and voltage). Even though the fault information was generated from transmission line current or voltage waveforms, a fault class cannot be determined only based on the raw signal data. Then, it was investigated how to use signal processing methods such the wavelet transforms [6], S-transform [7], or Hilbert-Huang transform [8] to separate the important properties that control the behavior of the line faults from the transmission line waveforms. As a result, increasing the neural network-based defect detection and classification model’s accuracy has become one of the key study areas.
In [9], a decision tree (DT) based fault detection and classification technique for the microgrid was introduced. The discrete Fourier transform was used to extract the information. To identify the HVDC faults, DT and wavelet transformations were coupled [10]. In grid-tied DG systems, the wavelet transform (WT) and the S-transform can also be used to detect disturbances [11]. To identify the different types of faults, a learning model that combines the naive classifier, support vector machine (SVM), and Extreme Learning Machine (ELM) based on the traits returned by the Hilbert–Huang transform has been utilized [12]. ELM and discrete wavelet transform (DWT) were combined in [13] to detect, classify, and identify a microgrid’s sections. For the microgrid’s flaw identification and classification, Reference [14] presented a semi-supervised model; first demonstrated in [15], a Taguchi-based artificial neural network (ANN) using DWT. The shallow design constrains these neural networks- and machine learning-based techniques. They employ the ability of the complicated non-linear properties of the HVDC to learn. These methods cannot combine the advantages of numerous aspects with perfection since there are no hidden layers.
Raad Salih et al. [1] used the gray wolf optimization method based on ANN to detect the fault in the HVDC system. They used the gray wolf optimization algorithm to select the best features extracted from the voltage and current signals.
The metaheuristic methods are used in [16,17], and deep learning methods are implemented in [18,19]. The improved power quality and fault detection are presented in [20]. The economic dispatch in the HVDC system is presented in [21]. The protection in sensitive load is investigated in [22,23].
In all approaches mentioned in the literature, feature selection has not been used. Moreover, the wavelet transform cannot give accurate results because some features cannot be reliable for fault detection. It is a significant disadvantage of the previously used methods in the literature. In this study, by combining the WT-ACO, the problem is solved.
This research offers an ANN with numerous layers of hidden units to address the issues and provide a method for learning the intricate non-linear feature of the HVDC in order to increase classification accuracy. ANN was initially used to identify aircraft engine problems. After that, research into diagnosing faults in gearboxes, rolling bearings, and reciprocating compressor valves expanded quickly [24,25,26,27]. ANN is a stack of ACO-DWT that deepens the network and makes it possible for the model to extract features in an adaptive manner. ANN can work with non-linear data [28,29,30]; therefore, it can more precisely classify faults in the microgrid domain.
The proposed network performs fault diagnostics on the HVDC system with phase-to-phase and phase-to-ground fault breaker systems using voltage and current waveform data as input. The features are extracted from the raw signal samples using a discrete wavelet transform tool. This research also suggests an extension of ant colony optimization to select the best features created by DWT with the dropout approach to improve the accuracy performance of fault detection. The dropout approach considerably improves the fault detection accuracy performance against a traditional method. The following are the article’s primary conclusions:
- Based on ANN and the DWT [31,32], we develop a model for fault detection and classification of HVDC that effectively extracts the pertinent short circuit fault attribute from the faulted line signals;
- Using a supervised pre-trained method, the trained model was created with multi-layers of the network that prevents overfitting of the training data;
- To evaluate the efficacy of the suggested approach, we examine both islanded and grid-connected/tied operating modes as well as the two HVDC (radial and loop) typologies;
- The dropout method is incorporated with the suggested network to ensure that the generated ANN model performs well in noisy environments.
The protection block begins with the fault detection unit as its first component. Therefore, a quick and dependable solution is required to detect flaws in HVDC protection systems. In this study, an ANN-based on Ant Colony Optimization and wavelet transform is employed to react quickly to detect faults. ANN algorithm requires some time to learn, but after it has completed the learning step, the trained network can move on to the fault detection stage. ANNs may detect faults much faster during the testing phase than traditional logic techniques. The importance of developing fault detection techniques is that they increase accuracy, sensitivity, and reliability, and that is what the transmission authority needs to decrease time and cost for finding and repairing the faults in the HVDC system.
The order of the paper is as follows. The material and method are presented in Section 2. The design of the suggested approach for categorizing HVDC faults and the necessary materials, is also described in Section 2. The performance analysis of the suggested system is shown in Section 3. Section 4 will finalize this paper with a conclusion and future work.
2. Material and Method
Shunt faults and series faults are the two basic categories under which HVDC power line faults fall [33]. A series fault, also known as a simple break in one or more conductors, occurs when there is an imbalance in the series impedance on the line. Power transmission from one location to another is not directly related to this kind of failure. In contrast, the three-phase power network regularly experiences shunt faults during power transmission, which are subsequently categorized as phase-to-phase (PP), phase-to-ground (PG), and two PG faults (2PG).
A single line-to-ground fault can occur on any phase line of a three-phase power line if it meets the neutral line or hits the ground. The problem brought on by strong winds or trees falling on power lines is also known as a short circuit fault [34]. Figure 1A–C depicts three HVDC system stages and shows three forms of single line-to-ground faults [34].
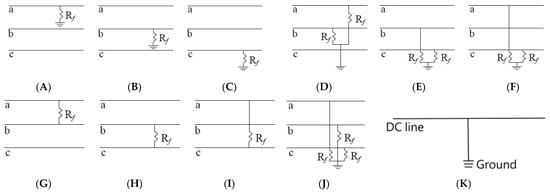
Figure 1.
HVDC system fault classes (A) a-g, (B) b-g, (C) c-g, (D) ab-g, (E) bc-g, (F) ac-g, (G) a-b, (H) b-c, (I) a-c, (J) a-b-c-g, (K) DC fault [34].
A two-PG fault occurs when two lines of a power line fall to the ground. This fault has more asymmetry and a higher fault current amplitude than the line-to-line fault. If this issue is not fixed right away, it could develop into a three-line to-the-ground fault, which is much more dangerous than other fault types. The ab-g, b-g, and a-g faults are depicted in Figure 1D–F, where Rf is the fault resistance [34].
A short circuit between any two lines in a three-phase system causes this kind of failure. One of the significant aspects of this asymmetrical fault is the difficulty in predicting the upper and lower boundaries of the fault impedance due to its magnitude varying over a large range. Three distinct PP fault types are displayed in Figure 1G–I. in contrast, three phases to ground fault appear in Figure 1G. Figure 1K illustrates the DC line to the ground fault. This paper studies the DC faults that may happen in the HVDC system’s DC line and AC faults that occur in the AC side of one of two terminal LCC HVDC systems under study.
2.1. System Modelling
This research proposes a probabilistic, generative network-based framework for detecting and classifying HVDC system faults. The sound or healthy condition was utilized to create a type of fault that provided 11 fault types for the unhealthy or fault detection plan. This sort of fault encompassed all short circuit fault scenarios and the good state of the phase. It was assumed that the classifier’s nature would be sound or error-free under typical conditions. A bad or fault event was detected when the classifier output was changed to a particular fault class. Extraction of the fault features from the raw signals was required for the suggested method’s training. Each fault signal’s energy was unique and determined by the system parameters, such as the fault distance and resistance. The DWT was used to independently assess the variation in each phase’s raw signals. After that, each signal’s energy was estimated in order to create the necessary dataset. Figure 2 shows the HVDC system under test, and Table 1 includes the parameters of the system Voltage Source Converters (VSC) that are used in modern HVDC; nevertheless, the model used in this study makes use of thyristors. The literature contains well-known and cutting-edge protection techniques for thyristor-based two-terminal HVDC systems [35,36,37]. VSC-based systems, particularly multi-terminal DC systems, are currently facing protection issues. The GWO approach, the study’s main topic, is used to assess the features and choose the appropriate voltage and current signal format.

Figure 2.
LCC-HVDC system under study.

Table 1.
Parameters of the HVDC system under study.
2.2. Effect of Fault Distance on Signal Energy
A defective occurrence could happen anywhere along the HVDC systems. The proposed ANN’s training method, which varied the network, could inspect the signal across the entire HVDC system thanks to the fault distance. In order to create the sample data, the fault event’s position was changed from the current and voltage waveforms, and the distance measurements ranged from 1 to 19 km with a 0.5 increment. The change in the original signal produced different signal energy lengths, which ultimately represented different features.
2.3. Wavelet Transform for the Generation of Fault Feature
In this work, the qualities of a particular section of a signal during a quick change in the signal were examined using the DWT. The WT works by breaking down a signal into a sequence of temporal components. A time series waveform receives significant guidance from the time series faulty sections, which shield a specific frequency range. Here is an example of how the WT approach represents, during a fault event, the fault attribute of a particular piece of the faulty signal. a group of low-pass (LPF) and high-pass (HPF) filters are used in DWT to process signals (LPF). The signal is broken up into detail (Det) and approximation (App) coefficients as a result of the LPF’s analysis of the examination of the high-frequency domain signal by the HPF and the low-frequency domain signal. The fault signal’s large- and small-scale frequency components are represented utilizing the App coefficient. Therefore, the fault signal is represented by its small- and large-scale frequency components by the Det coefficient. The subsequent App replicates this decomposition procedure, dividing a fault signal into several lesser-resolution pieces.
2.4. Model for Proposed Hierarchical Generative Faults
This section introduces the ANN framework for HVDC fault detection and classification. An arrangement of constrained machine learning makes up the proposed ACO-DWT. Using the ACO-DWT, the features are extracted and selected accurately.
2.5. Wavelet Analysis
A wavelet transform function is the display of lower-frequency signals larger and high-frequency signals narrower when wavelet detection is present. Despite similarities, there are a few significant differences between the Fourier transform and the wavelet transform. The signal is divided into sines and cosines via the Fourier transform. On the other hand, the wavelet transform can be used with elements in both Fourier and real spaces. The temporal widths of the wavelet transform can be changed to match the frequency. This attribute of frequency width auto-tune is most helpful when assessing electromagnetic transients that have superimposed on the frequency power components are high-frequency components [38]. Typically, the wavelet transform looks like this:
where a and b are the function constants, which are also known as the scaling and translation parameters, and (*) is the complex conjugate of the wavelet function . Continuous wavelet transforms (CWT), and discrete wavelet transform are the two subcategories of the wavelet transform (DWT). The wavelet transform is derived into the correlated wavelet transform (CWT), which uses redundant wavelets and arbitrary scales. By breaking down the signal into orthogonal sets using a discrete set of wavelet scales, the discrete wavelet transform (DWT) is produced. The discrete wavelet transform is obtained using the following expression (DWT).
The parameters “a” and “b” are swapped out for and , where k and m are integers compared to the term 2.17. The DWT functions as a bank of low-pass and high-pass filters that provide low-pass and high-pass subbands for the signal. The low-pass subband is subjected to the same procedure to create narrower low-pass and high-pass sub-bands. Wavelet transforms, either continuous or discrete, can be used to assess the estimated distance to the fault. In order to define a mother wavelet from a voltage transient waveform, a continuous wavelet transform is utilized in the research of fault location in power networks [39]. However, the analysis of this study can give good results with just the discrete wavelet transform (DWT). Figure 3 shows the wavelet family featuring the daubechies3 (db3) wavelet mother, which is utilized to decompose voltage waveforms registered by DFRs into its five coefficients (WTCs). Due to their abundance of high-frequency content, the WTCs at level 1 (D1) are subsequently analyzed to identify the times of arrival (ToAs). These signals are finally squared to create WTC2, as was conducted in [38], to reduce noise in WTCs.
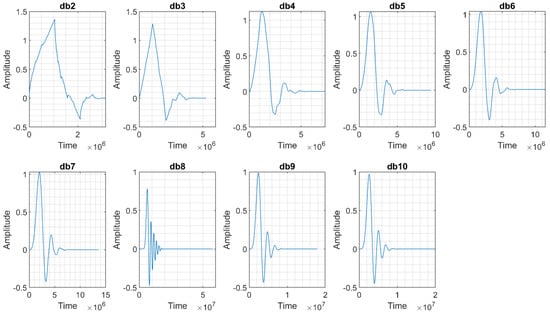
Figure 3.
Wavelet Daubechies’ family.
The signals with and without faults were constructed to investigate the HVDC fault detection in this work. Multiple signals with various AC and DC fault types were devised for this purpose. These signals are used to extract the 12 properties that depend on the voltage, current, and their individual components. Some of these features are inappropriate for ANN training [18,19], and employing them will lead to mistakes and lower detection accuracy. The best and most precise characteristics ought to be chosen for this purpose. Thus, the feature selection uses the ACO approach, which was first introduced in [40]. Figure 4 depicts a summary of the suggested technique.
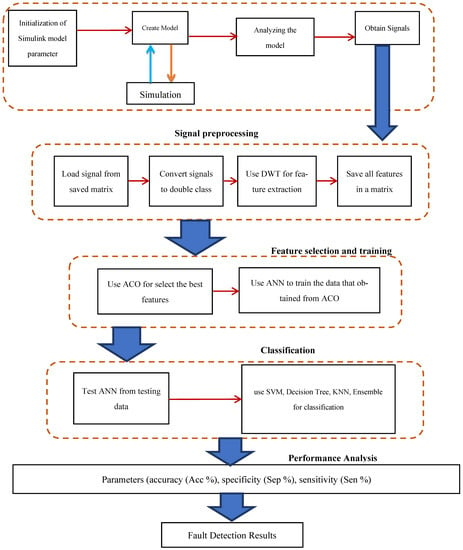
Figure 4.
Summary of the suggested technique for finding HVDC faults.
As shown in Figure 4, Simulink-MATLAB manually generates the 11 faulted signals, including the AC and DC faulted signals. Next, the output signals are obtained for each fault. The neural network may occasionally make errors in fault identification because these signals contain many characteristics, the majority of which are unsuitable for training. Therefore, the best and most practical characteristics must be chosen to train the network. The best features are selected using the ACO approach, and the neural network is trained using these features. On the right side of the flowchart is the ACO method scenario.
The main objective of this study is to use the optimum features of the fault and non-fault signals by using the Wavelet transform based on the ACO algorithm. The wavelet transform removes the noisy signal from the current and voltage signals obtained from the system. Furthermore, ACO uses to find the optimum features that affect the training of ANN to recognize the fault and non-fault signals.
First, a visual representation of every feature in the S dataset is presented. All nodes are connected to one another and are referred to as nodes. The number of ants and the number of repetitions should then be determined [41]. The value is known as the pheromone trail, and all of its values are initially set to a fixed value of one at the beginning of the algorithm. also known as the value of heuristic information, is equal to the reciprocal distance between the qualities [42], which will be determined in this article using the two approaches, FC and FF.
The algorithm is usable after establishing the initial values. The ant is initially placed on a node at random in each iteration. The rule of transfer is applied to derive the following ninety, as indicated in Equations (3) and (4):
The α and β values are chosen in order to increase the efficacy of τ and η. The ant has not yet encountered the attributes in , and the only trait they have is zero. The parameter , whose value is a random number between 0 and 1, is crucial in selecting whether to use the greedy or probabilistic approach.
The amount of pheromone collected from the scan should be updated in accordance with Equation (5) when the n ant has finished the node scan:
To lessen the effect, the value of the average number of nodes chosen for the Filter technique is equal to , which is the reverse of the error achieved using the Wrapper technique [41,42].
2.6. Criteria for Distance or Similarity of Features
Two types of relationships exist between two random variables: linear and non-linear. The correlation coefficient formula is the most well-known formula for calculating linear variables. To compute non-linear variables, they employ information theory and the entropy approach. The correlation coefficient technique has the drawback of being ineffective with batch and non-numerical data, but the entropy method performs well [43].
A discrete or continuous random variable’s uncertainty is measured using entropy or irregularity criteria. The discrete random variable has an entropy of H(X) that is determined using Equation (6).
where is the probability value of happening on the entire set.
In accordance with Equation (7), the two discrete random variables’ entropies should be calculated X and Y.
The conditional entropy of X to condition Y is determined using Equation (8).
The aforementioned formulas’ goal is to determine the information factor (IF). The IF criterion, which is in agreement with Equation (9), is utilized to analyze how dependent the two variables are:
The two variables are independent if the value of IF is zero, and the larger this value, the more dependent X and Y are [44]. The correlation between the information coefficient and entropy is depicted in Figure 5.
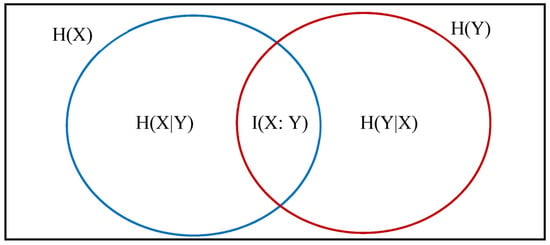
Figure 5.
Relationship between information coefficient and entropy.
The symmetrical uncertainty (SU), or normalized form of IG, used in this work is compatible with Equation (10). This formula’s benefit is the normalcy of the two variables’ dependence between 0 and 1. The two variables are dependent if the value of SU is close to one and independent if the value of SU is close to zero.
Two criteria and are employed in this paper to calculate the η [43].
The reliance of each attribute on the class is the definition of the criterion. The more vital and desirable that characteristic will be, the closer this number is to one.
The term refers to the interdependence of two qualities. If its value is very near to one, it indicates that the two traits are quite comparable, and we might consider eliminating one of the features.
When choosing attributes, we try to keep class-related attributes and remove redundant or unnecessary attributes. The objective is to select features that have higher and lower values [45].
In the first step of this research study, the voltage and current signals are generated. Then these signals are analyzed to determine the characteristics of the voltage and current signals. The ACO-DWT approach is utilized to choose the best and most effective characteristics. In order to identify the most useful features with which to train ANN, the proposed method based on the ACO algorithm is used.
3. Results and Discussion
This section uses various parameter adjustments to show how well the suggested fault detection and classification technique performs. Different magnitudes were disclosed by the fault current and voltage signals in grid-connected and islanded modes. As a result, creating a uniform fault classification scheme was challenging. As a result, the effectiveness of the suggested strategy was examined individually under different operating modes and system topologies. Three factors were taken into consideration when determining the accuracy:
- (a)
- How well the system performed, whether only using the current waveform, voltage waveform, or both waveforms together, depending on the type of input signal;
- (b)
- The sampling resolution, or how well the system performed when using different data acquisition rates;
- (c)
- The fault signal with noise present, or how well the system performed when noise was present in the sampled signal. The suggested and existing FDC techniques’ accuracy were compared to show that the suggested classifier has superior short circuit fault classification capabilities.
In machine learning, a list of data samples is used to test the model’s performance and should be different from the training data in order to determine how effective a learning model is. The current and voltage waveforms for each dataset were divided into 1716 samples, which were then combined and shuffled before being randomly selected to assess the effectiveness of the suggested strategy. When the 11 distinct fault classifiers were entered into the 11 × 11 matrix’s x- and y-axis, the confusion matrix (CM) was used to simulate the performance of ANN for Lines 1–3 under various system configurations and HVDC operating modes. The vertical levels represent the projected fault class, while the horizontal levels indicate the actual class. The true positive (TP), true negative (TN), false positive (FP), and false negative (FN) counts are also reported in the confusion matrix and are defined as:
TP: The classifier correctly predicted a label and is a member of the original class;
TN: The classifier successfully predicts a label even when it does not fall under the initial category;
FP: The classifier predicts a label to be positive even when it does not belong to the original category;
FN: The label that the classifier predicts would be negative but belongs to the original class.
First and foremost, according to the CM, most of each system configuration’s fault classes were assigned correctly. The classification accuracy of the average confusion matrix (Acc) was used as the first accuracy measurement criterion Equation (13).
Here, displays the total number of data used to create the model. denotes the number of correctly categorized data. The remainder of the HVDC system might function similarly to the proposed work.
According to the findings, the proposed classifier’s grid-connected radial mode operation had the best accuracy, which was 99.70%. The classifier performed better than 99.5% for the other system settings, which was as expected. The Confusion matrix for different classifiers, SVM, Decision Tree, K-NN, and Ensemble method, is shown in Figure 6.
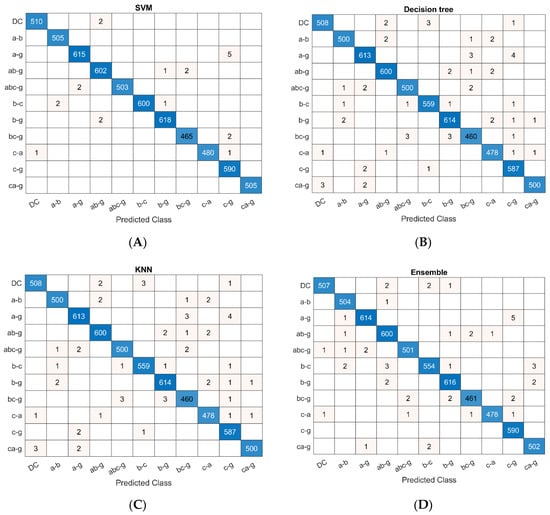
Figure 6.
Confusion matrix for different classifiers (A) SVM, (B) Decision Tree, (C) K-NN, and (D) Ensemble.
The average accuracy for various system setups is shown in Figure 7.
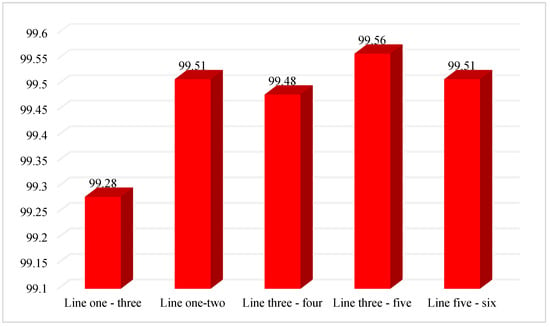
Figure 7.
Average accuracy for various system setups.
The average accuracy, however, was unable to provide a complete analysis of the model’s performance. The sensitivity, specificity, and accuracy were then used to assess the classification performance in order to determine how the classifier handled different fault types. The mentioned criteria are regarded as ideal when it equals one and worst when it equals zero. The sensitivity, also referred to as the positive predictive value, is defined as follows:
A good classifier should have a precision value of one. From Equation (14), the precision value declines as the FP rises, which is unexpected for a strong classifier. Specificity, another statistic that is also referred to as the true positive rate or the classifier’s sensitivity, is defined as follows
The best classifier’s sensitivity value should be 1, just like the precision. For this metric, the recall value fell as the FN grew, which was also contrary to expectation. As a result, accuracy, which considers both true positive and true negative, was used as another performance evaluation indicator. Given that Table 2 shows the voltage and current signals, the recommended classifier’s greater accuracy demonstrated that it had fewer false positives and negatives. Additionally, each fault class’s categorization accuracy (user accuracy) made it clear that the classifier had a high degree of accuracy in its capacity to categorize the problems.

Table 2.
Accuracy, sensitivity, and specificity of the proposed classifier.
Figure 8 is a graphical depiction of these findings.
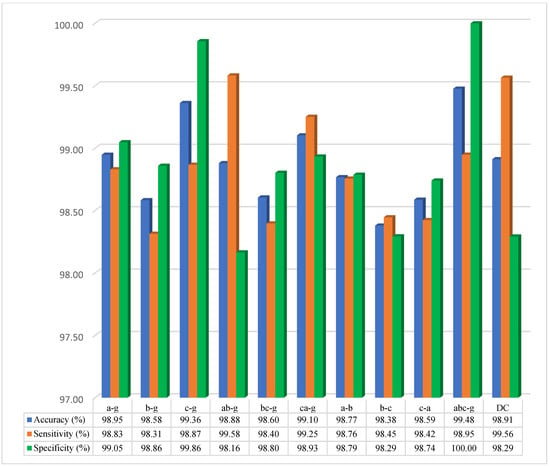
Figure 8.
Graphical chart illustration.
Due to the lack of both signals at the same time, the system must perform the categorization tasks using voltage or current waveforms. Different input signal types and sampling rates were employed to examine the fault classification performance of the proposed classifier. The input signal types used in this inquiry were the voltage waveform, the current waveform, and the combined current and voltage waveform. The SF used were 2, 5, 10, 15, and 20 kHz. Five times through the classification process, the findings for an SF and a certain signal type were determined. To obtain the final findings presented in Figure 9, the mean value of the accuracies was calculated.
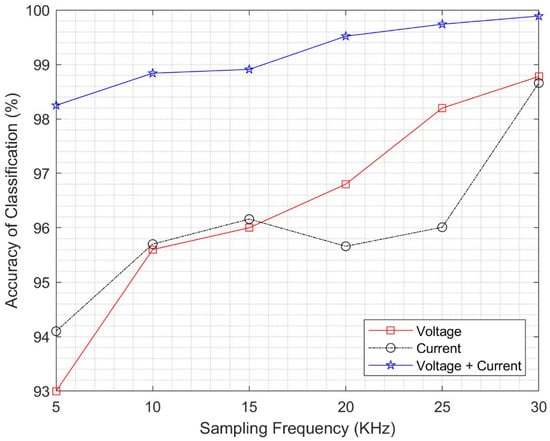
Figure 9.
Accuracy of the classification for the proposed classifier.
The improvement in classification accuracy was anticipated since a short circuit fault class with a greater SF carries more specific fault information. The three-phase current waveform performed better for classification at lower sample rates than the three-phase voltage waveform. This scenario was anticipated in part because, for a given fault class, compared to the current waveform, the voltage waveform contained less information about low-frequency faults.
On the other hand, the voltage waveform had a few spare incorrect transients that could be used to examine the short circuit fault’s specifics more thoroughly. The aforementioned analysis suggests that relying just on current or voltage waveforms would not produce the requisite precision. Given that both the three-phase current and voltage intentions utilized specific short circuit fault information, if both waveforms were taken into account simultaneously, the designated frequency level may be obtained with a higher fault categorization performance. The study’s results showed that using only the current or voltage waveforms to classify data yielded poor results; however, their fusion produced a classification accuracy of more than 99% at the high-frequency range level taken into account, validating the efficacy of the proposed FDC model. The remaining HVDC system under evaluation can show similar categorization results. Table 3 compares the accuracy, sensitivity, and specificity of the entire fault classification system for the HVDC fault classification with the suggested technique and alternative methods.

Table 3.
The proposed method’s accuracy, sensitivity, and specificity.
The best aspects of voltage, current, and derivatives are utilized in the suggested strategy. It is contrasted with the multi-layer perceptron (MLP), radial basis function (RBF), learning vector quantization (LVQ), and self-organizing map (SOM) neural networks. Results from the studies showed that the advised approach, ANN, RBF, LVQ, and SOM had accuracy values of 98.86, 98.65, 98.78, 98.30, 99.49, 99.60, 99.48, and 99.45, respectively. The proposed method had the highest accuracy because when the feature selection component of the ACO-DWT algorithm, which is based on the Decision tree classifier, was utilized, the accuracy rose to 99.60%.
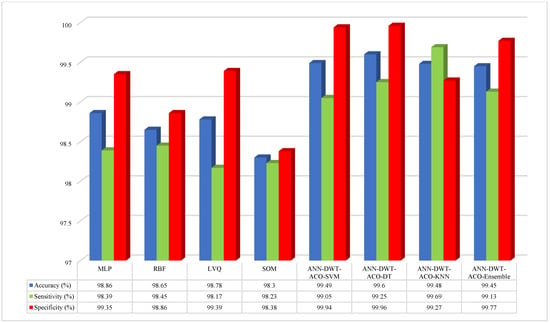
Figure 10.
Graphical illustration of the accuracy, sensitivity, and specificity.
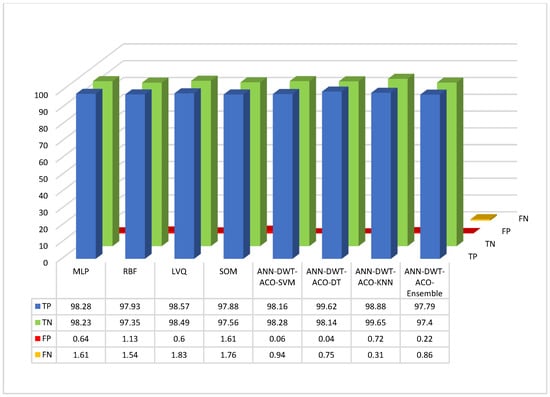
Figure 11.
Graphical illustration of the TP, TN, FP, and FN.
4. Conclusions
In order to identify the optimum characteristics of the voltage and current signal to utilize in ANN to train the system, this paper suggested the ACO for feature selection. For the grid-connected and island modes of the HVDC, the ACO approach is robust in identifying the best aspects of the signals to detect and classify the faults. The suggested approach ensured that the model automatically recognized and analyzed abnormal signals pertaining to various HVDC failures. This was accomplished by measuring the voltage and current waveforms separately and utilizing feature extraction to compare them to variations in the line characteristics. The proposed method’s usefulness as a generalized model that worked at different sampling frequencies was confirmed by using both the current and voltage parts for fault diagnosis and classification. The suggested technique’s efficiency was assessed using various experiments, such as those examining the influence of signal type. The results demonstrated that the suggested fault detection and classification model correctly recognized and categorized short circuit faults for all fault categories with an accuracy close to 99.60%. The best scenario was obtained from the ANN-DWT-ACO-DT method, with 99.60, 99.25, 99.96, 99.62, 98.14, 0.04, and 0.75 for accuracy, sensitivity, specificity, TP, TN, FP, and FN, respectively. Using both the voltage and current waveforms within the tested frequency range showed the model’s impressive performance. The authors advise employing the Fourier transform for feature extraction of the current and voltage signals and various metaheuristic techniques to identify the accuracy rates for defect detection situations.
Author Contributions
Conceptualization, R.S.J. Methodology, R.S.J. Software R.S.J. Validation, H.A. Investigation R.S.J. Writing—original draft preparation, R.S.J. Writing—review and editing, H.A. Visualization, R.S.J. Supervision, H.A. All authors have read and agreed to the published version of the manuscript.
Funding
The authors declare that there was no funding for this work.
Data Availability Statement
No new data were created or analyzed in this study. Data sharing is not applicable to this article.
Conflicts of Interest
The authors declare no conflict of interest.
References
- Jawad, R.S.; Abid, H. Fault Detection in HVDC System with Gray Wolf Optimization Algorithm Based on Artificial Neural Network. Energies 2022, 15, 7775. [Google Scholar] [CrossRef]
- Liu, J.; Tai, N.; Fan, C.; Huang, W. Protection scheme for high-voltage direct-current transmission lines based on transient AC current. IET Gener. Transm. Distrib. 2015, 9, 2633–2643. [Google Scholar] [CrossRef]
- Zhang, Y.; Li, Y.; Song, J.; Li, B.; Chen, X.; Zeng, L. Novel protection scheme for high-voltage direct-current transmission lines based on one-terminal transient AC voltage. J. Eng. 2019, 2019, 4480–4485. [Google Scholar] [CrossRef]
- Yadav, A.; Dash, Y. An overview of transmission line protection by artificial neural network: Fault detection, fault classification, fault location, and fault direction discrimination. Adv. Artif. Neural Syst. 2014, 2014, 230382. [Google Scholar] [CrossRef]
- Singh, J.; Goyal, K.K.; Kumar, R.; Gupta, V. Development of artificial intelligence-based neural network prediction model for responses of additive manufactured polylactic acid parts. Polym. Compos. 2022, 43, 5623–5639. [Google Scholar] [CrossRef]
- Hong, Y.-Y.; Wei, Y.-H.; Chang, Y.-R.; Lee, Y.-D.; Liu, P.-W. Fault detection and location by static switches in microgrids using wavelet transform and adaptive network-based fuzzy inference system. Energies 2014, 7, 2658–2675. [Google Scholar] [CrossRef]
- Gush, T.; Bukhari, S.B.A.; Mehmood, K.K.; Admasie, S.; Kim, J.-S.; Kim, C.-H. Intelligent fault classification and location identification method for microgrids using discrete orthonormal stockwell transform-based optimized multi-kernel extreme learning machine. Energies 2019, 12, 4504. [Google Scholar] [CrossRef]
- Gururani, A.; Mohanty, S.R.; Mohanta, J.C. Microgrid protection using Hilbert–Huang transform based-differential scheme. IET Gener. Transm. Distrib. 2016, 10, 3707–3716. [Google Scholar] [CrossRef]
- Kar, S.; Samantaray, S.R.; Zadeh, M.D. Data-mining model based intelligent differential microgrid protection scheme. IEEE Syst. J. 2015, 11, 1161–1169. [Google Scholar] [CrossRef]
- Mishra, D.P.; Samantaray, S.R.; Joos, G. A combined wavelet and data-mining based intelligent protection scheme for microgrid. IEEE Trans. Smart Grid 2015, 7, 2295–2304. [Google Scholar] [CrossRef]
- Ray, P.K.; Mohanty, S.; Kishor, N. Disturbance detection in grid-connected distributed generation system using wavelet and S-transform. Electr. Power Syst. Res. 2011, 81, 805–819. [Google Scholar] [CrossRef]
- Mishra, M.; Rout, P.K. Detection and classification of micro-grid faults based on HHT and machine learning techniques. IET Gener. Transm. Distrib. 2018, 12, 388–397. [Google Scholar] [CrossRef]
- Manohar, M.; Koley, E.; Ghosh, S. Microgrid protection under wind speed intermittency using extreme learning machine. Comput. Electr. Eng. 2018, 72, 369–382. [Google Scholar] [CrossRef]
- Abdelgayed, T.S.; Morsi, W.G.; Sidhu, T.S. Fault detection and classification based on co-training of semisupervised machine learning. IEEE Trans. Ind. Electron. 2017, 65, 1595–1605. [Google Scholar] [CrossRef]
- Hong, Y.-Y.; Cabatac, M.T.A.M. Fault detection, classification, and location by static switch in microgrids using wavelet transform and taguchi-based artificial neural network. IEEE Syst. J. 2019, 14, 2725–2735. [Google Scholar] [CrossRef]
- Al Hayali, S.; Rahebi, J.; Ucan, O.; Bayat, O. Increasing energy efficiency in wireless sensor networks using GA-ANFIS to choose a cluster head and assess routing and weighted trusts to demodulate attacker nodes. Found. Sci. 2020, 25, 1227–1246. [Google Scholar] [CrossRef]
- Rahebi, J.; Al-Shalah, M.M.S. Design, Modeling and Implementation of Multi-Function Protective Relay with Digital Logic Algorithm. Avrupa Bilim Teknol. Derg. 2020, 19, 549–565. [Google Scholar] [CrossRef]
- Ab-BelKhair, A.; Rahebi, J.; Nureddin, A.A.M. A Study of Deep Neural Network Controller-Based Power Quality Improvement of Hybrid PV/Wind Systems by Using Smart Inverter. Int. J. Photoenergy 2020, 2020, 8891469. [Google Scholar] [CrossRef]
- Nureddin, A.A.M.; Rahebi, J.; Ab-BelKhair, A. Power Management Controller for Microgrid Integration of Hybrid PV/Fuel Cell System Based on Artificial Deep Neural Network. Int. J. Photoenergy 2020, 2020, 8896412. [Google Scholar] [CrossRef]
- Abed, A.H.; Rahebi, J.; Farzamnia, A. Improvement for power quality by using dynamic voltage restorer in electrical distribution networks. In Proceedings of the 2017 IEEE 2nd International Conference on Automatic Control and Intelligent Systems (I2CACIS), Kota Kinabalu, Malaysia, 21 October 2017; pp. 122–127. [Google Scholar]
- Al-jumaili, M.; Rahebi, J.; Akbas, A.; Farzamnia, A. Economic dispatch optimization for thermal power plants in Iraq. In Proceedings of the 2017 IEEE 2nd International Conference on Automatic Control and Intelligent Systems (I2CACIS), Kota Kinabalu, Malaysia, 21 October 2017; pp. 140–143. [Google Scholar]
- Abed, A.H.; Rahebi, J.; Sajir, H.; Farzamnia, A. Protection of sensitive loads from voltages fluctuations in Iraqi grids by DVR. In Proceedings of the 2017 IEEE 2nd International Conference on Automatic Control and Intelligent Systems (I2CACIS), Kota Kinabalu, Malaysia, 21 October 2017; pp. 144–149. [Google Scholar]
- Sajir, H.; Rahebi, J.; Abed, A.; Farzamnia, A. Reduce power losses and improve voltage level by using distributed generation in radial distributed grid. In Proceedings of the 2017 IEEE 2nd International Conference on Automatic Control and Intelligent Systems (I2CACIS), Kota Kinabalu, Malaysia, 21 October 2017; pp. 128–133. [Google Scholar]
- Chen, Z.; Li, C.; Sánchez, R.-V. Multi-layer neural network with deep belief network for gearbox fault diagnosis. J. Vibroengineering 2015, 17, 2379–2392. [Google Scholar]
- Shao, H.; Jiang, H.; Zhang, X.; Niu, M. Rolling bearing fault diagnosis using an optimization deep belief network. Meas. Sci. Technol. 2015, 26, 115002. [Google Scholar] [CrossRef]
- Wang, X.; Li, Y.; Rui, T.; Zhu, H.; Fei, J. Bearing fault diagnosis method based on Hilbert envelope spectrum and deep belief network. J. Vibroengineering 2015, 17, 1295–1308. [Google Scholar]
- AlThobiani, F.; Ball, A. An approach to fault diagnosis of reciprocating compressor valves using Teager–Kaiser energy operator and deep belief networks. Expert Syst. Appl. 2014, 41, 4113–4122. [Google Scholar]
- Onyango, L.A.; Waititu, A.; Mageto, T.; Kilai, M. A Hybrid Classification Model of Artificial Neural Network and Non Linear Kernel Support Vector Machine. Int. J. Data Sci. Anal. 2022, 8, 47–58. [Google Scholar] [CrossRef]
- Deshpande, V.; Modi, P.; Sant, A. Analysis of Levenberg Marquardt-ANN based reference current generation for control of shunt active power filter. Mater. Today Proc. 2022, 62, 7104–7108. [Google Scholar] [CrossRef]
- Irfan, M.M.; Malaji, S.; Patsa, C.; Rangarajan, S.; Hussain, S.M.S. Control of DSTATCOM Using ANN-BP Algorithm for the Grid Connected Wind Energy System. Energies 2022, 15, 6988. [Google Scholar] [CrossRef]
- Singh, S. Condition Monitoring and Fault Diagnosis of Induction Motor using DWT and ANN. Arab. J. Sci. Eng. 2022. [Google Scholar] [CrossRef]
- Zhang, W.; Lin, Z.; Liu, X. Short-term offshore wind power forecasting-A hybrid model based on Discrete Wavelet Transform (DWT), Seasonal Autoregressive Integrated Moving Average (SARIMA), and deep-learning-based Long Short-Term Memory (LSTM). Renew. Energy 2022, 185, 611–628. [Google Scholar] [CrossRef]
- Sahoo, S. Power and Energy Management in Smart Power Systems. Artif. Intell. Smart Power Syst. 2022. [Google Scholar] [CrossRef]
- Fahim, S.R.; Sarker, S.; Muyeen, S.; Sheikh, M.; Das, S.K. Microgrid fault detection and classification: Machine learning based approach, comparison, and reviews. Energies 2020, 13, 3460. [Google Scholar] [CrossRef]
- Zhang, T.; Li, C.; Liang, J. A thyristor based series power flow control device for multi-terminal HVDC transmission. In Proceedings of the 2014 49th International Universities Power Engineering Conference (UPEC), Cluj-Napoca, Romania, 2–5 September 2014; pp. 1–5. [Google Scholar]
- Candelaria, J.; Park, J.-D. VSC-HVDC system protection: A review of current methods. In Proceedings of the 2011 IEEE/PES Power Systems Conference and Exposition, Phoenix, AZ, USA, 20–23 March 2011; pp. 1–7. [Google Scholar]
- Swetapadma, A.; Agarwal, S.; Chakrabarti, S.; Chakrabarti, S.; El-Shahat, A.; Abdelaziz, A.Y. Locating Faults in Thyristor-Based LCC-HVDC Transmission Lines Using Single End Measurements and Boosting Ensemble. Electronics 2022, 11, 186. [Google Scholar] [CrossRef]
- Magnago, F.H.; Abur, A. Fault location using wavelets. IEEE Trans. Power Deliv. 1998, 13, 1475–1480. [Google Scholar] [CrossRef]
- Borghetti, A.; Bosetti, M.; Di Silvestro, M.; Nucci, C.; Paolone, M. Continuous-wavelet transform for fault location in distribution power networks: Definition of mother wavelets inferred from fault originated transients. IEEE Trans. Power Syst. 2008, 23, 380–388. [Google Scholar] [CrossRef]
- Mirjalili, S.; Mirjalili, S.; Lewis, A. Grey wolf optimizer. Adv. Eng. Softw. 2014, 69, 46–61. [Google Scholar] [CrossRef]
- Tabakhi, S.; Moradi, P.; Akhlaghian, F. An unsupervised feature selection algorithm based on ant colony optimization. Eng. Appl. Artif. Intell. 2014, 32, 112–123. [Google Scholar] [CrossRef]
- Sivagaminathan, R.K.; Ramakrishnan, S. A hybrid approach for feature subset selection using neural networks and ant colony optimization. Expert Syst. Appl. 2007, 33, 49–60. [Google Scholar] [CrossRef]
- Yu, L.; Liu, H. Efficient feature selection via analysis of relevance and redundancy. J. Mach. Learn. Res. 2004, 5, 1205–1224. [Google Scholar]
- Bennasar, M.; Hicks, Y.; Setchi, R. Feature selection using joint mutual information maximisation. Expert Syst. Appl. 2015, 42, 8520–8532. [Google Scholar] [CrossRef]
- Hoque, N.; Bhattacharyya, D.; Kalita, J.K. MIFS-ND: A mutual information-based feature selection method. Expert Syst. Appl. 2014, 41, 6371–6385. [Google Scholar] [CrossRef]
Disclaimer/Publisher’s Note: The statements, opinions and data contained in all publications are solely those of the individual author(s) and contributor(s) and not of MDPI and/or the editor(s). MDPI and/or the editor(s) disclaim responsibility for any injury to people or property resulting from any ideas, methods, instructions or products referred to in the content. |
© 2023 by the authors. Licensee MDPI, Basel, Switzerland. This article is an open access article distributed under the terms and conditions of the Creative Commons Attribution (CC BY) license (https://creativecommons.org/licenses/by/4.0/).