Article

Online Nuclear Magnetic Resonance Analysis of the Effect of Stress Changes on the Porosity and Permeability of Shale Oil Reservoirs

1
College of Engineering Science, University of Chinese Academy of Sciences, Beijing 101400, China
2
Institute of Porous Flow and Fluid Mechanics, Langfang 065007, China
3
Shaanxi Yanchang Petroleum (China), Xi’an 710016, China
4
China Petroleum Exploration and Development Research Institute, Beijing 100083, China
*
Author to whom correspondence should be addressed.
Energies 2023, 16(3), 1139; https://doi.org/10.3390/en16031139
Submission received: 15 December 2022 / Revised: 12 January 2023 / Accepted: 16 January 2023 / Published: 19 January 2023

Abstract

:
In the process of volumetric fracturing of shale oil, physical property changes caused by stress changes will affect the recovery, so it is urgent to conduct an analysis and evaluation of physical property changes caused by stress changes. In this research, a physical simulation experiment with constant confining pressure and variable pore pressure combined with an online nuclear magnetic resonance (NMR) technique was constructed. The results show that the increased range of the macropore (IRM) and the total pore (IRT) of matrix samples is 11.70~13.24% and 10.54~14.27% with the increase of pore pressure, respectively. That of fractured samples are 7.94~8.48% and 9.21~10.51%. It indicates that increasing pore pressure is more effective for matrix reservoirs. The decreased range of the macropore (DRM) and the total pore (DRT) of matrix samples is 10.29~13.89% and 10.38~21.24% with the unloading of pore pressure, respectively. That of fractured samples are 8.49~9.66% and 10.91~11.10%. It indicates that unloading pressure has less influence on fractured reservoirs. The increased range of permeability of matrix rock samples is 99~120% with the increase of pore pressure. Greatly supplementing formation energy is an effective means to improve the permeability of matrix reservoirs. Compared with matrix reservoirs, unloading pore pressure is more damaging to fractured reservoirs.

1. Introduction

Shale oil has gradually become the main body of increasing oil storage. The effective development of shale oil is of great significance to the development of Chinese oil [1,2,3,4,5,6]. Chang 7 reservoir in Ordos Basin has a small pore throat, wide distribution of nano-scale pores and narrow flow channels. The occurrence characteristics and utilization law of crude oil are different from those of conventional reservoirs, and the availability of crude oil is poor. The practice also shows that there are problems of fast energy decline and low productivity in the actual development [7,8,9,10]. In order to solve the problem of low production and low efficiency of reservoirs, volume fracturing is usually used to obtain industrial production. In the process of fracturing, the stress changes will cause the change of permeability, porosity and other physical properties, which will affect recovery. Therefore, it is urgent to conduct scientific and quantitative analysis and evaluation of pore throat and permeability changes caused by stress changes in shale oil reservoirs. Domestic and foreign scholars have made a series of studies on this. Luo Ruilan [11] et al. and Xu Xinli [12] et al. showed that the poorer the reservoir’s physical property, the more complex the pore structure and the stronger the stress sensitivity. Yu Zhongliang [13] et al. and Li Ruishan [14] et al. showed that a shale oil reservoir is more stress-sensitive than conventional low-permeability reservoirs due to poor physical properties, complex pore structure and micro-fractures development. Gao Zhanwu [15] et al. made it clear that the fractured shale oil reservoir has stronger stress sensitivity than the original matrix reservoir through the improved stress sensitivity experiment. Lei Hao [16] et al. have shown that micro-nano pores of shale oil have a strong stress-sensitive effect, which will compress the main flow channels such as micro-fractures and micron pores in the development process and reduce the flow capacity, making the subsequent energy supplement and enhanced oil recovery (EOR) development effect worse. Fang Liangping [17] studied the effects of varying confining pressure and varying pore pressure on the stress sensitivity of tight oil samples. The results showed that the stress sensitivity of tight oil samples under varying confining pressure is stronger than that under varying pore pressure. Chhatre [18] et al. found that the permeability of shale decreases with the increase in the net confining pressure through a steady-state test, and the two show an exponential relationship. Ren [19] et al. showed that both porosity and permeability decreased with the increase of effective stress, and permeability became more sensitive with stress. Jia [20] et al. used a steady-state pulse and transient pulse to measure permeability and porosity and conducted stress-sensitive experiments. It was concluded that permeability was affected by porosity and pore structure. Therefore, the former physical simulation experiments mostly used changing confining pressure to simulate the stress change of shale oil, while the change of actual stress is caused by pore fluid pressure. Therefore, changing confining pressure cannot accurately and effectively simulate the actual stress of shale oil. Based on this, the physical simulation experiment of changing pore fluid pressure with constant confining pressure was carried out in this research. Different from the offline NMR technique used in conventional physical simulation experiments, the online NMR technique was used in this research to avoid the error caused by stress release in the experimental process. At present, the research on online NMR mainly focuses on tight oil and shale gas [21,22,23], while the research on shale oil has not been in-depth. This work was organized as follows. First was the sampling and processing of samples, and then an online NMR physical simulation system with constant confining pressure and variable pore pressure of shale oil was established. Finally, the dynamic monitoring of microscopic production law was realized, and the mechanism of single-phase flow under large fluid injection of a shale oil reservoir was also revealed. It provides a theoretical basis for the effective development of a target block.

2. Experimental Samples and Equipment

2.1. Experimental Samples

① Shale oil reservoirs of Chang 7, a member of the Yanchang Formation in the Ordos Basin, can be divided into three types: the interlayer type, the laminar type and the pure shale type, and the flow mechanism of different types of shale oil is different. In this research, the interlayer shale of the Yanchang Formation in the Ordos Basin was selected, of which its geological characteristics were mainly shallow lacustrine delta front deposits, enrichment of a thin interlayer “sweet spot” and micro-migration within the source [24,25,26,27,28]. The thickness of a single sandbody is generally less than 5 m, with stable distribution and good transverse continuity. High-quality source rocks have a good configuration relationship with sandy deposits, and oil and gas are charged with high intensity. The sampling depth is between 2300~2450 m, and the rock type is grayish-brown oil-spotted fine sandstone. The core parameters are shown in Table 1. Among them, No.1′ and No.3′ rock samples are parallel samples of No.1 and No.3 rock samples, respectively. The No.2′ rock sample was not obtained due to fragmentation in the process of artificial crack making.
② The simulated oil was kerosene. The simulated oil used in saturated rock samples and single-phase displacement of rock samples was kerosene. The use of crude oil in the experiment will lead to extraction, precipitation, plugging and other effects, which will affect the permeability of rock samples. Kerosene has a density of 0.8 g/cm3 at room temperature and a surface tension of 25.98 mN/m. By using kerosene for single-phase displacement of rock samples, the physical parameters of rock samples with pore fluid pressure were analyzed, and the single-phase flow mechanism of the shale oil reservoir was revealed under large liquid injection.

2.2. Experimental Equipment

It includes an ISCO displacement pump, online NMR, a core holder, an intermediate container, an outlet pressure hand pump, a confining pressure control system, etc. The specific connections are shown in Figure 1. The main function of the ISCO displacement pump is to control the inlet pressure and observe the displacement time and flow volume. When the displacement flow volume is stable, online NMR is used to realize dynamic monitoring of a rock sample’s status. Compared with offline NMR technology, the error caused by stress release can be avoided. Compared with the conventional manual confining pressure control system, the electric confining pressure system used in this research is more accurate and intuitive. The function of the back pressure valve is to effectively maintain the stability of the outlet pressure and protect the rock samples. Therefore, the equipment used in this research is more convenient, intuitive and safe. The results are also more precise. This research has the following limitations in terms of conditions and applicability.
(1) The confining pressure system used in this research equipment can reach a maximum of 29 MPa. Since the confining pressure is 2 MPa larger than the pore fluid pressure, the pore fluid pressure can reach a maximum of 27 MPa, and the experimental data of pore fluid pressure after 27 MPa cannot be obtained.
(2) In order to avoid the error caused by stress release, online NMR technology was used in this research to analyze the variation law of the pore throat. Therefore, the porosity under different pore fluid pressures was not measured (because the laboratory used to measure porosity equipment was offline), resulting in the lack of intuitive analysis of the rock sample porosity under different pore fluid pressures.

3. Experimental Procedure and Method

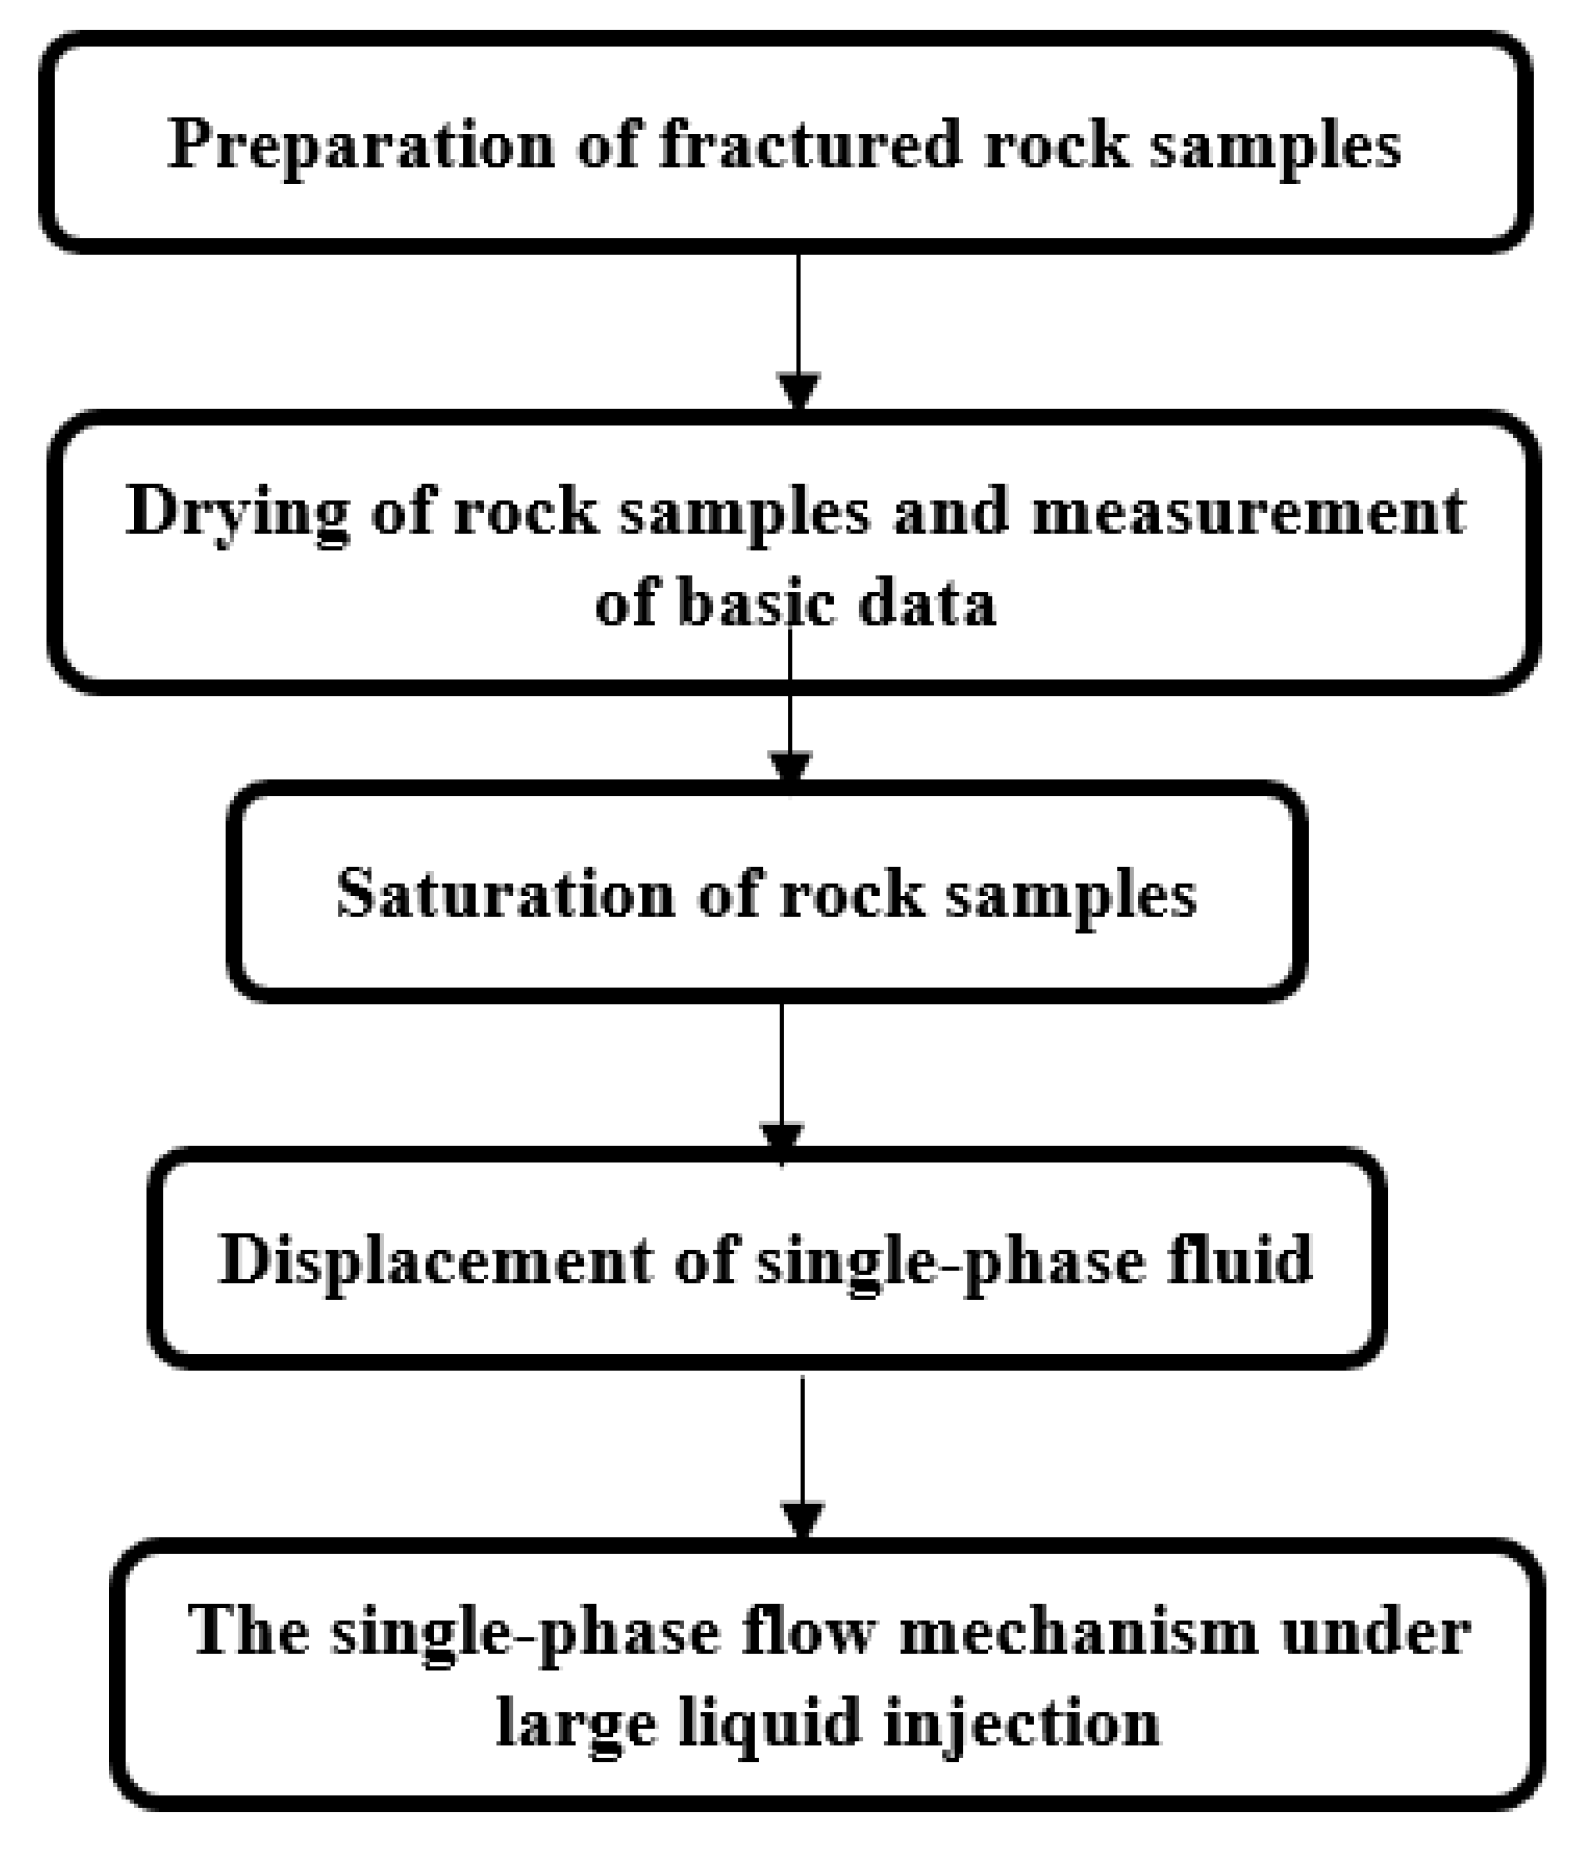
3.1. Experimental Procedure

① Preparation of fractured rock samples. In order to compare and analyze the changing law of physical parameters of the matrix and fractured rock samples under different pore fluid pressures, it is necessary to conduct an artificial fracture on parallel rock samples to obtain fractured rock samples. The common method used for an artificial fracture is the Brazilian splitting method [29,30]. The national standard “Test Procedure for physical and mechanical Properties of rocks Part 21: Tensile Strength Test of rocks” (DZ/T 0276.21-2015) was referred to. No.1′ and No.3′ rock samples were put into the fracturing machine, and the bedding direction was parallel to the direction of the cutting edge. An ISCO pump was used to press at a certain speed until the core cracked, and the core was split along the center as much as possible to simulate the opening process of artificial fractures under the confining pressure of the original formation.
② Drying. In order to avoid the interference of moisture or oil components in the rock sample, it is necessary to dry the rock sample. Five rock samples were placed in a drying oven and dried at 100 °C for 24 h. The cores were weighed and the T2 NMR spectra of the dry samples were measured.
③ The measurement of porosity and permeability. According to the national standard “Shale Porosity by Helium Gas Method and Permeability by Pulse attenuation Method” (GB/T 34533-2017), the rock sample porosity and permeability were measured. The permeability was tested by nitrogen, and the porosity was tested by helium.
④ The saturation. The samples were vacuumized for 24 h and pressurized to saturate with kerosene. The NMR T2 spectrum of the samples after being saturated with kerosene was measured.
⑤ Displacement. The kerosene-saturated rock samples were displaced at the inlet pressure of 16 MPa, 19 MPa, 22 MPa, 25 MPa and 27 MPa, and the outlet pressure of 12 MPa, 15 MPa, 18 MPa, 21 MPa and 23 MPa, while the confining pressure was maintained at 29 MPa. After the flow volume stabilized, the permeability and NMR T2 spectrum of the rock samples were recorded. Then, the inlet pressure and outlet pressure were unloaded along the original path, and the permeability and NMR T2 spectrum of the rock samples were recorded after the flow volume stabilized.
⑥ Result analysis. After the experiment, the change of physical parameters of matrix and fractured rock samples under a different pore pressure of a single-phase fluid was analyzed, and the single-phase flow mechanism under a large liquid injection of a shale oil reservoir was revealed. The operation procedure is shown in Figure 2.

3.2. Experimental Method

NMR can be used as an approximate nondestructive technique to measure the micropore structure characteristics of shale reservoirs [31,32,33]. It analyzes the pore fluid properties by observing the hydrogen nucleus signal in the pore of rock, obtains the parameters related to the reservoir’s physical properties, calculates the dynamic fluid parameters and evaluates the whole reservoir [34,35]. Therefore, NMR is a good technique to evaluate the variation of a reservoir’s physical properties with pore fluid pressure. Different from the offline NMR technique used in conventional physical simulation experiments, the online NMR technique was used in this research to avoid the error caused by stress release in the experimental process. Dynamic monitoring was carried out on the microscopic application law under different pore fluid pressures of matrix and fractured rock samples, and the variation law of physical parameters of rock samples with pore pressure was analyzed.

4. Results and Discussion

4.1. The Pore Throat State of Matrix Rock Samples Varies with Pore Pressure

Based on the research of domestic scholars [36,37], a relaxation time of 0.1~10 ms is named a small pore throat, 10~100 ms is named a medium pore throat, and a relaxation time greater than 100 ms is named a macropore throat. Figure 3, Figure 4 and Figure 5 show the NMR T2 spectrum of three matrix rock samples under different pore pressures, the change rate of macropore (CRM) under different pore pressures, and the change rate of the total pore (CRT) under different pore pressures. CRM and CRT can be calculated according to the following formula:
CRM = (Nm,p − Nm,s)/Nm,s × 100%
CRT = (Nt,p − Nt,s)/Nt,s × 100
where, Nm,p represents the NMR amplitude of the macropore throat of rock samples after pressure. Nm,s represents the NMR amplitude of the macropore throat of rock samples saturated in oil. Nt,p represents the NMR amplitude of the total pore throat of rock samples after pressure. Nt,s represents the NMR amplitude of the total pore throat of rock samples saturated in oil.
As can be seen in Figure 3, the amplitude of the NMR T2 spectrum of the macropore throat gradually increases with the continuous increase of pore pressure during inlet pressure, while the amplitude of the NMR T2 spectrum of the macropore throat gradually decreases during depressure. As shown in Figure 4, with the increase of pore pressure, the CRM of sample No.1 gradually increases from 9.49% to 22.73%, that of sample No.2 gradually increases from 1.90% to 14.48%, and that of sample No.3 gradually increases from 1.47% to 13.17%. The IRM of the three rock samples is 11.70~13.24%. Figure 5 shows that the CRT of sample No.1 gradually increases from 10.22% to 24.49%, that of sample No.2 gradually increases from 3.09% to 15.09%, and that of sample No.3 gradually increases from 2.21% to 12.75%. The IRT of the three rock samples is 10.54~14.27%. With the unloading of pore pressure, the CRM of sample No.1 gradually decreases from 22.73% to 8.84%, that of sample No.2 gradually decreases from 14.48% to 3.82% and that of sample No.3 gradually decreases from 13.17% to 2.88%. The DRM of the three rock samples is 10.29~13.89%. The CRT of rock sample No.1 gradually decreases from 24.49% to 3.25%, that of No.2 gradually decreases from 15.09% to 4.71%, and that of No.3 gradually decreases from 12.75% to 1.05%. The DRT of the three rock samples is 10.38~21.24%. When pore pressure is small, fluid flows dominate in oleophilic pores such as small pore throats and medium pore throats. With the increase of pore pressure, the flow volume increases, and the fluid flows into oleophobic pores such as macropore throats. Therefore, the CRT and the CRM gradually increase. With the unloading of pore pressure, the flow volume decreases. Part of the fluid flows out of the oleophobic pores, and the CRT and the CRM decrease. In conclusion, with the increase of pore pressure, the CRT and the CRM gradually increase. With the unloading of pore pressure, both the CRT and CRM decrease. For the matrix reservoir with high permeability, the unloading pressure has less interference on the pore change rate.

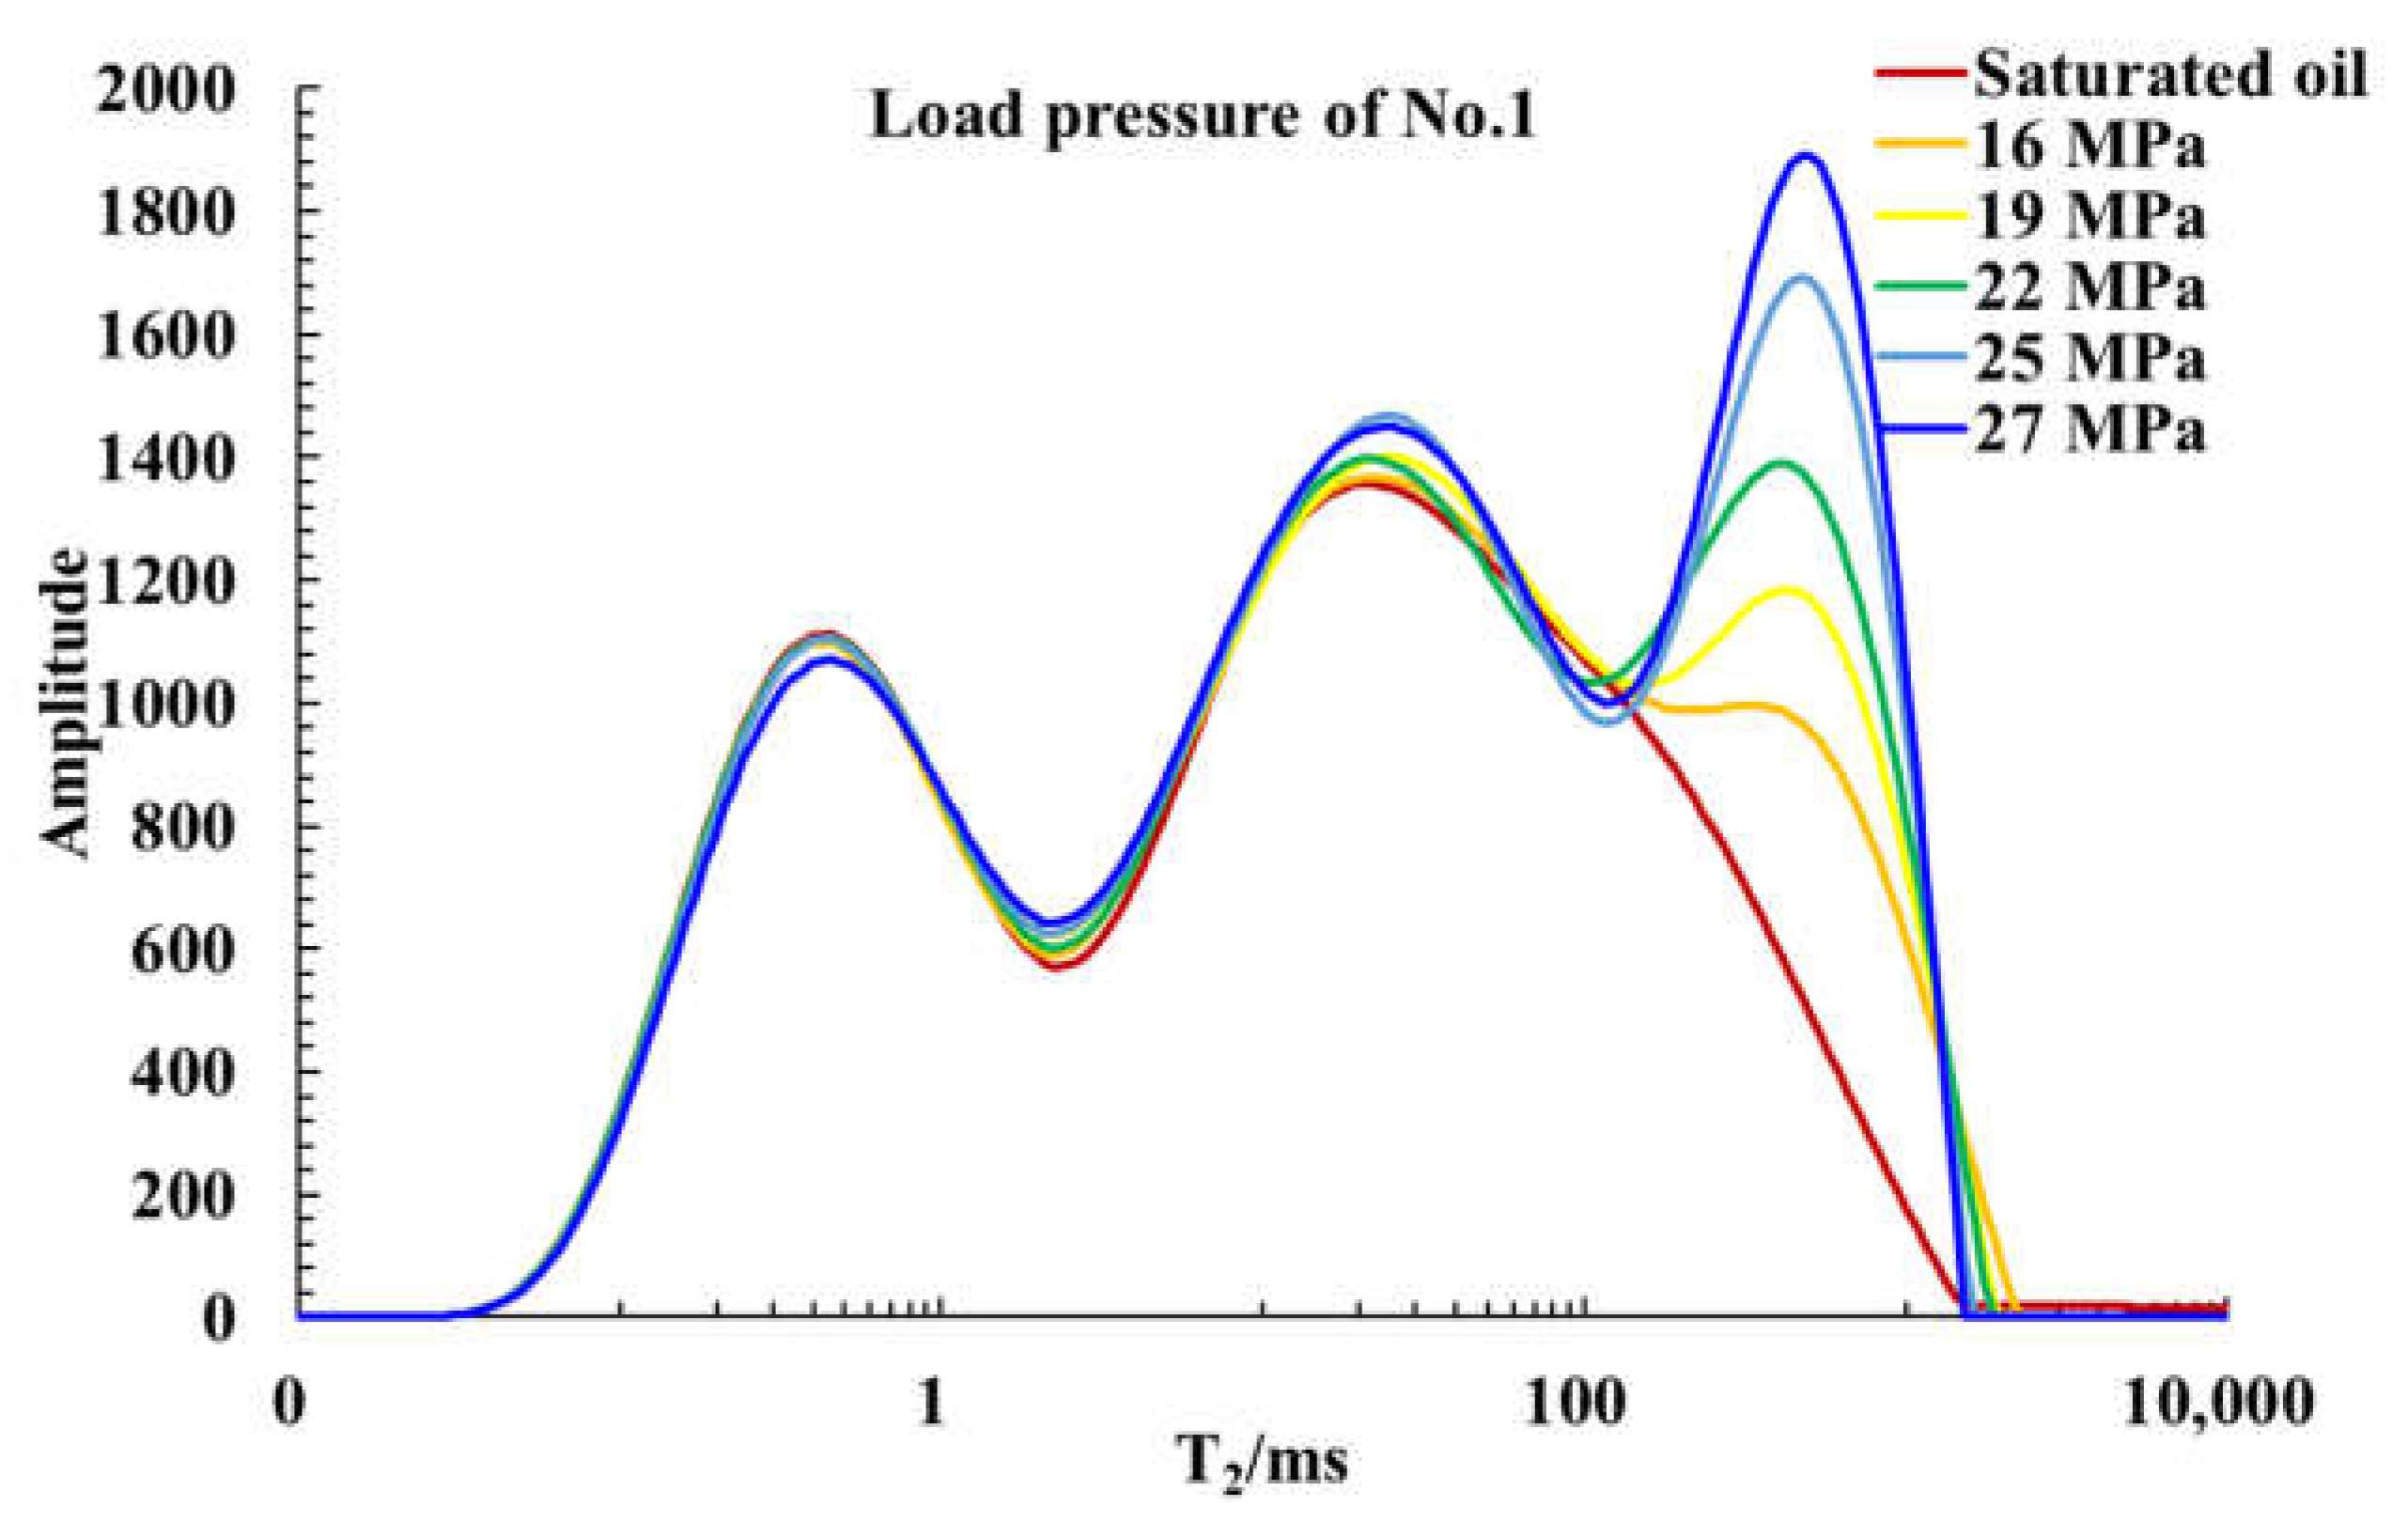
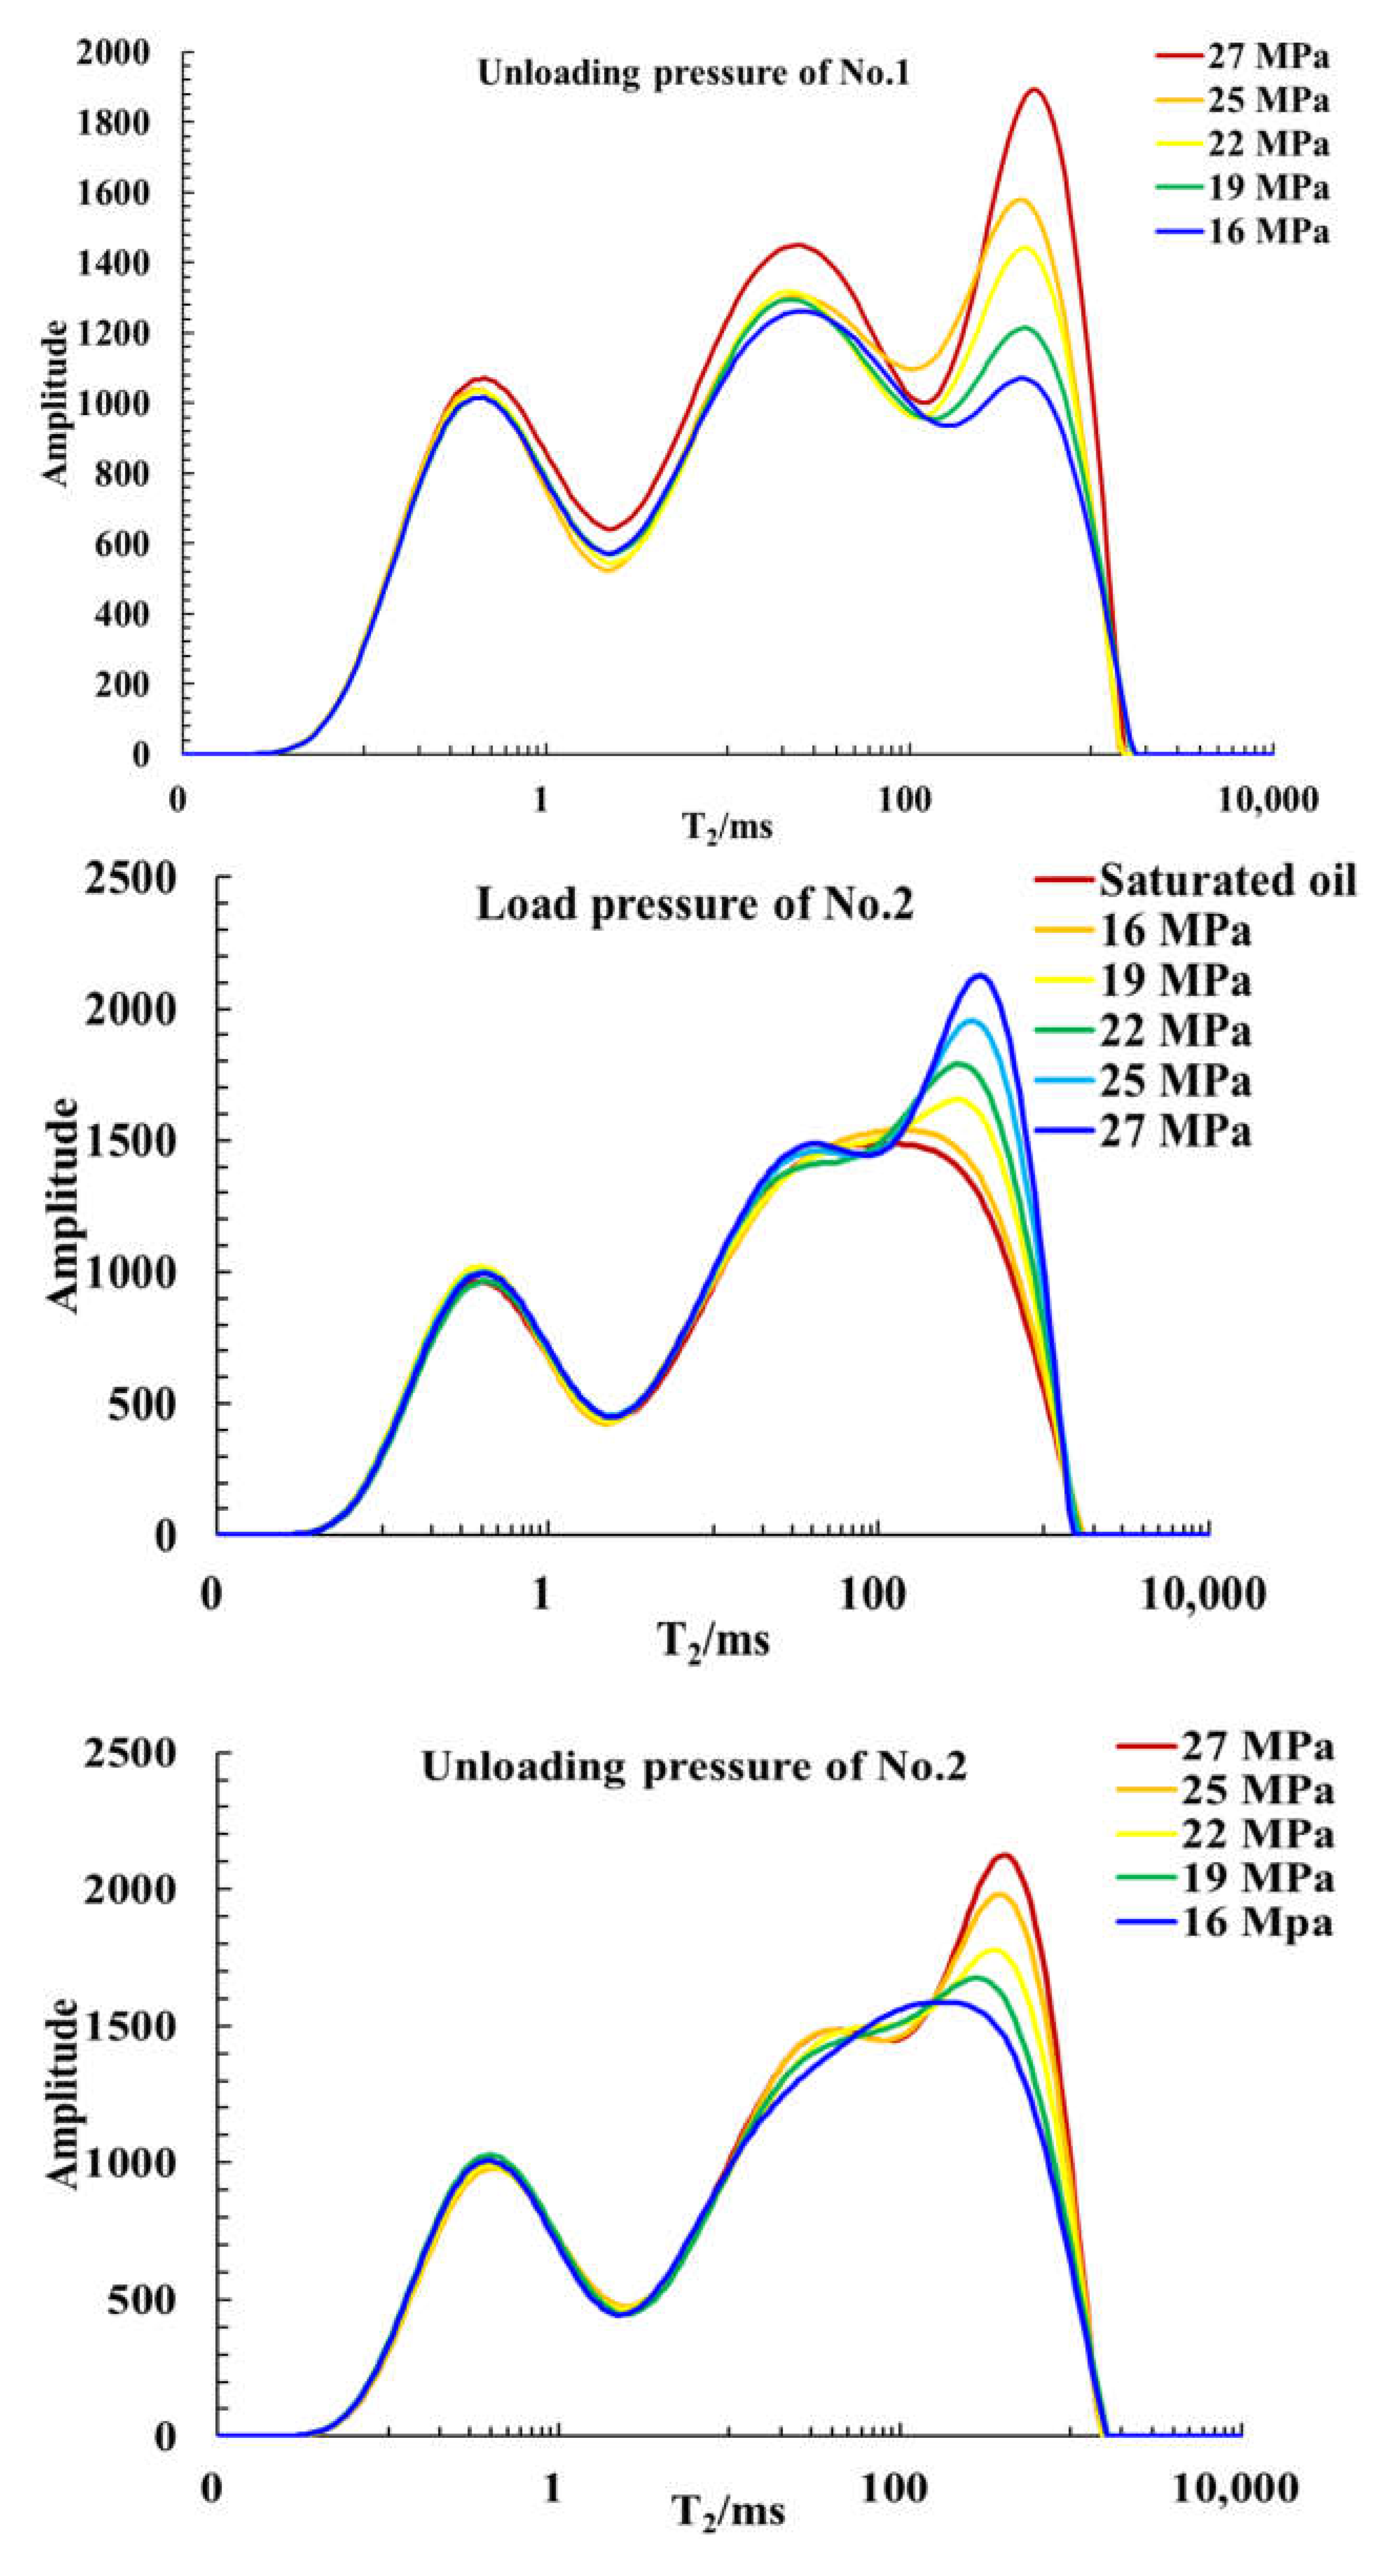
4.2. The Pore Throat State of Fractured Rock Samples Varies with Pore Pressure

Figure 6, Figure 7 and Figure 8 show the NMR T2 spectrum of two fractured rock samples under different pore pressures, the CRM under different pore pressures and the CRT under different pore pressures. As can be seen from Figure 6, the pore NMR amplitude of the macropore throat kept increasing with the continuous increase of pore pressure. When the pore pressure was unloaded, the pore NMR amplitude of the macropore throat kept decreasing. As shown in Figure 7, the CRM of rock sample No.1′ gradually increases from 1.34% to 9.82% and that of No.3′ gradually increases from 2.21% to 10.15%. The IRM of the two rock samples is 7.94~8.48%. Figure 8 shows that the CRT of rock sample No.1′ gradually increases from 2.24% to 12.75% and that of No.3′ gradually increases from 2.38% to 11.59%. The IRT of the two rock samples is 9.21~10.51%. With the unloading of pore pressure, the CRM of sample No.1′ gradually decreases from 9.82% to 1.33%, that of No.3′ gradually decreases from 10.15% to 0.49%. The DRM of the two rock samples is 8.49~9.66%. The CRT of sample No.1′ gradually decreases from 12.75% to 1.84%, that of No.3′ gradually decreases from 11.59% to 0.49%. The DRT of the two rock samples is 10.91~11.10%. In conclusion, the CRM and the CRT increase continuously with the increase of the pore pressure. With the unloading of the pore pressure, the CRM and the CRT gradually decrease.
By comparing the experimental results of matrix and fractured rock samples, the IRM and the IRT with the load pressure of matrix rock samples are greater than that of fractured rock samples, indicating that increasing pore pressure has a better effect on the matrix reservoir. The DRM and the DRT with the unloading pressure of the matrix rock sample are greater than that of the fractured rock sample, indicating that unloading pressure has less influence on the fractured reservoir.

4.3. The Permeability of Matrix and Fractured Samples Varies with Pore Pressure

The effect of pore pressure change on reservoir permeability was analyzed and evaluated by simulating the experiment of large fluid injection in a shale oil reservoir, which provided a basis for revealing the oil increase mechanism of volume fracturing. Darcy’s formula was used to measure permeability under different pore pressure states, and the variation rule of permeability with pore pressure was obtained. The calculation formula is as follows [38,39,40,41]:
K = Q μ L A Δ P
where, Q is the flow rate through the rock sample, cm3/s. A is the sectional area of the rock sample, cm2. L is the length of the rock sample, cm. μ is kerosene viscosity, mPa·s, and the kerosene viscosity at room temperature is 2 mPa·s. ΔP is the pressure difference, atm.
Figure 9 and Figure 10 show the variation curves of permeability with the pore pressures of matrix and fractured rock samples, respectively. As can be seen from Figure 9, with the increase in pore pressure during the inlet pressure, the flow volume increases, and the fluid flow in oleophobic pores such as macropore throats is enhanced. In addition, the fluid flow resistance decreases, mainly due to the flow resistance of the hydrophilic pore wall, and the permeability of rock samples also increases. The permeability of rock sample No.1 increases from 0.0078 mD to 0.0157 mD, that of No.2 increases from 0.0129 mD to 0.0256 mD, and that of No.3 increases from 0.0045 mD to 0.0099 mD. The permeability of the three rock samples increases by 99~120%. In addition, the lower the permeability of rock samples, the larger the inflection point of pore pressure with a sudden increase in permeability. Therefore, for the matrix reservoir with low permeability, it is an effective means to improve reservoir permeability by adding formation energy to a large extent. When the pore pressure is unloaded, the flow volume decreases, and the fluid flow in the oleophobic pores such as the macropore throat is weakened. The fluid flow dominates in the oleophilic pores such as small pore throats and medium pore throats. Such a pore wall has a strong adsorption force, a large pore-specific surface area, large roughness, small pore size, and a greater turbulence effect in the single pore, which affects the flow of shale oil in the porous medium. The flow resistance increases and permeability decreases. The permeability of rock sample No.1 decreases from 0.0156 mD to 0.0080 mD, that of No.2 decreases from 0.0256 mD to 0.0150 mD, and that of No.3 decreases from 0.0099 mD to 0.0046 mD. The higher the permeability of the rock sample, the more gentle the downward trend of pore pressure during unloading pressure, and the smaller the rate and magnitude of the decrease in permeability. The greater the permeability of the reservoir, the less the unloading pressure will interfere with the reservoir. In addition, the permeability after pore pressure unloading was slightly higher than that of before the experiment, indicating that the rock samples did not produce irreversible deformation during the process of pore pressure loading and unloading and cause damage to the reservoir.
Figure 10 shows that when the pore pressure reaches 22 MPa, the permeability of the two rock samples increases sharply. The permeability of rock sample No.1′ increases from 0.7986 mD to 1.6361 mD, that of No.3′ increases from 0.0606 mD to 0.1834 mD. It shows that the fracture opened in the process of pore pressure increase. After pore pressure unloading, the permeability of rock sample No.1′ decreases from 1.6361 mD to 0.0706 mD, and that of No.3′ decreases from 0.0819 mD to 0.0273 mD. The permeability is much lower than before, indicating that the fracture closed after pore pressure unloading. This is because when the pore pressure increases and is less than 22 MPa, it is difficult for the fluid to pass through the internal flow channel due to the closure of cracks. Figure 6 also shows that when the pore pressure is less than 22 MPa, the increased range of the macropore throat of rock sample No.1′ and the medium pore throat of No.3′ is not obvious, so the permeability of the rock samples decreases with the increase in the pore pressure. When the pore pressure is greater than 22 MPa, Figure 6 shows that with the increase in pore pressure, the increased range of the macropore throat of rock sample No.1′ and the medium pore throat of No.3′ is apparent. The flow channel opened and the permeability of rock samples increased with the increase of pore pressure. In conclusion, increasing pore pressure can better improve the fractured reservoir with low permeability, and unloading pore pressure can do more damage to the fractured reservoir with high permeability.
Compared with matrix reservoirs, unloading pore pressure is more damaging to fractured reservoirs.

5. Conclusions

In this research, the online NMR physical simulation experiment was conducted to simulate the changes of reservoir pore pressure caused by a large liquid injection. By comparing the displacement results of matrix and fractured rock samples with variable pore pressure, the permeability and porosity of interlayer shale oil reservoirs were analyzed and evaluated with the changes in pore pressure. Compared with previous studies, this research has the following innovations. The online NMR equipment adopted in this research avoids the error caused by stress release. The method of changing pore fluid pressure adopted in this research can more accurately simulate the stress change of reservoir under large liquid injection compared with the previous method of changing confining pressure. The following conclusions were reached:
  • The IRM and the IRT of matrix rock samples are greater than that of fractured rock samples, indicating that the increase in pore pressure is better for matrix reservoirs. For the matrix reservoir with higher permeability, the less the unloading pressure interferes with the pore. The DRM and DRT of matrix rock samples are greater than that of fractured rock samples. It shows that unloading pressure has little effect on fractured reservoirs.
  • The permeability of matrix samples increases with the increase in pore pressure, and the smaller the permeability is, the larger the inflection point of pore pressure with a sudden increase in permeability. Therefore, for the matrix reservoir with low permeability, a large amount of formation energy supplement is an effective means to improve the reservoir permeability. The larger the reservoir permeability, the gentler the downward trend of pore pressure during unloading, and the smaller the range and rate of permeability decline and the interference of unloading pressure on the reservoir. The permeability after pore pressure unloading is slightly higher than that of before the experiment, indicating that no irreversible deformation occurs in the process of pore pressure loading and unloading, and no damage is caused to the reservoir.
  • When the pore pressure reached a certain value, the permeability of the fractured rock sample increased rapidly, and the fracture opened in the process of the pore pressure increasing. After the unloading of pore pressure, the fracture closed. The improvement effect of increasing pore pressure is better for the fractured reservoir with low permeability, while the unloading of pore pressure is more damaging for the reservoir with high permeability. Compared with matrix reservoirs, unloading pore pressure is more damaging to fractured reservoirs.

Author Contributions

L.Y. analyzed and wrote the entire article. Z.Y. and H.L. decided on the theme of the article and provided guidance. Q.L., Y.H., G.Z., Z.Z. and L.C. provided financial assistance. H.H. provided help with experimental methods. M.D. provided with concepts and resources. All authors have read and agreed to the published version of the manuscript.

Funding

This research was funded by the following projects. Research on Shale Oil Development Mechanism and Technology (2022kt1001). Research on Flow Law of Typical Low-Grade Reservoirs and New Methods of Enhanced Oil Recovery (2021DJ1102). Tight Oil Reproducibility Evaluation and Enhanced Recovery Mechanism Research (2021DJ2202). Fluid Occurrence Mechanism, Flow Mechanism and Enhanced Oil Recovery Technology in Shale Oil Reservoir (2021DJ1804). Single Well EUR Laboratory Experimental Study on Multi-media Combination of Shale Oil (JI2021-117).

Data Availability Statement

Not applicable.

Conflicts of Interest

The authors declare no conflict of interest.

References

  1. Yan, W.; Sun, F.; Sun, J.; Golsanami, N. Distribution Model of Fluid Components and Quantitative Calculation of Movable Oil in Inter-Salt Shale Using 2D NMR. Energies 2021, 14, 2447. [Google Scholar] [CrossRef]
  2. Hu, S.; Tao, S.; Yan, W.; Yang, Z.; Men, G.; Tang, Z.; Xue, J.; Chen, X.; Jia, X.; Jiang, T.; et al. Advances on enrichment law and key technologies of exploration and development of continental tight oil in China. J. Nat. Gas Geosci. 2019, 4, 1083–1093. [Google Scholar]
  3. Jin, Z.; Zhu, R.; Liang, X.; Shen, Y. Several issues worthy of attention in current lacustrine shale oil exploration and development. Petrol. Explor. Dev. 2021, 48, 1276–1287. [Google Scholar] [CrossRef]
  4. Dang, H.; Xiao, Q.; Gao, R.; Qi, Z. Characteristics of CO2 displacement for Chang 7 tight reservoir in Yanchang oilfield. J. Shenzhen Univ. 2019, 36, 298–303. [Google Scholar] [CrossRef]
  5. Jang, I.S. Probabilistic Prediction of Multi-Wells Production Based on Production Characteristics Analysis Using Key Factors in Shale Formations. Energies 2021, 14, 5226. [Google Scholar]
  6. Zheng, T.; Yang, Z.; Wang, Z.; Dong, C.; He, Y. Carbon dioxide energy storage and stimulation in staged fractured horizontal Wells in tight reservoirs. Sci. Technol. Eng. 2019, 19, 99–104. [Google Scholar]
  7. Wang, H.; Zhao, W.; He, H.; Feng, J. Characteristics of Tight Oil Reservoirs in Ordos Basin—A Case Study of Chang-7 Member of Longdong Area,Ordos Basin. Unconven. Oil Gas 2019, 6, 42–51. [Google Scholar]
  8. Hu, S.; Zhu, R.; Wu, S.; Bai, B.; Yang, Z.; Cui, J. Exploration and development of continental tight oil in China. Petrol. Explor. Dev. 2018, 45, 737–748. [Google Scholar] [CrossRef]
  9. Zhang, J.; Bi, H.; Xu, H.; Zhao, J.L.; Yu, T.X.; Zhao, D.; Geng, Y.G. New progress and reference significance of overseas tight oil exploration and development. Acta Petrol. Sin. 2015, 36, 127–137. [Google Scholar]
  10. Lan, Y.; Yang, Z.; Wang, P.; Yan, Y.; Zhang, L.; Ran, J. A review of microscopic seepage mechanism for shale gas extracted by supercritical CO2 flooding. Fuel 2019, 238, 412–424. [Google Scholar] [CrossRef]
  11. Thakur, G. Enhanced Recovery Technologies for Unconventional Oil Reservoirs. J. Petrol. Technol. 2019, 71, 66–69. [Google Scholar] [CrossRef]
  12. Luo, R.L.; Cheng, L.S.; Peng, J.C. New method of determining relationship between permeability and effective overburden pressure for low-permeability reservoirs. J. China Univ. Petrol. 2007, 31, 87–90. [Google Scholar]
  13. Xu, X. Stress Sensitivity of Low-permeability Reservoir Containing Micro-fracture and Its Influence on Productivity. Spec. Oil Gas Reserv. 2015, 22, 127–130. [Google Scholar]
  14. Yu, Z.; Xiong, W.; Gao, S. Stress sensitivity of tight reservoir and its influence on oilfield development. Acta Petrol. Sin. 2007, 28, 95–98. [Google Scholar]
  15. Li, R.; Li, H.; Yang, Z.; Guo, H.; Gao, T.; Dai, Y.; Meng, H. Experimental study on stress sensitivity of shale reservoir. Chin. Sci. Pap. 2019, 14, 969–974. [Google Scholar]
  16. Gao, Z.; Qu, X.; Huang, T.; Xue, T.; Cao, P. Stress Sensitivity Analysis of Shale Oil Reservoir in Ordos Basin and Optimization of Horizontal Well Flowback System. Nat. Gas Geosci. 2021, 32, 1867–1873. [Google Scholar]
  17. Lei, H.; Zheng, Y.; He, J.; Hu, Z. A New Physical Simulation Method for Fluid Flow Characteristics in Shale Reservoirs. Acta Petrol. Sin. 2021, 42, 1346–1356. [Google Scholar]
  18. Fang, P.L. Study on Fluid solid Coupling Mechanism and Numerical Simulation Method for Tight Oil Development. Ph.D. Thesis, China University of Geosciences, Wuhan, China, 2017. [Google Scholar]
  19. Chhatre, S.S.; Sinha, S.; Braun, E.M. Effect of Stress, Creep, and Fluid Type on Steady State Permeability Measurements in Tight Liquid Unconventional Reservoirs. In Proceedings of the Unconventional Resources Technology Conference, Denver, CO, USA, 25–27 August 2014. [Google Scholar]
  20. Ren, X.; Li, A.; Fu, S. Experimental study on the oil-water relative permeability relationship for tight sandstone considering the nonlinear seepage characteristics. J. Petrol. Sci. Eng. 2018, 161, 409–416. [Google Scholar] [CrossRef]
  21. Jia, C.J.; Xu, W.Y.; Wang, H.L. Stress dependent permeability and porosity of low-permeability rock. J. Cent. South Univ. 2017, 24, 2396–2405. [Google Scholar] [CrossRef]
  22. Duan, X.; Hu, Z.; Gu, Z.; Chang, J.; Shen, R.; Sun, W. The online nuclear magnetic resonance detection technology is used to study the production law of shale gas in different occurrence states. Nat. Gas Ind. 2021, 41, 76–83. [Google Scholar]
  23. Fang, T.; Zhang, L.; Zhang, L.; Liu, N. Study on transport characteristics of tight sandstone gas based on nuclear magnetic resonance technology. Gansu J. Sci. 2017, 4, 22–27. [Google Scholar]
  24. Liu, G. Characteristics of CO2 huff and puff micropore utilization in fractured tight sandstone reservoir. J. Xi’an Shiyou Univ. 2021, 36, 64–70. [Google Scholar]
  25. Fu, J.; Li, S.; Niu, X.; Deng, X.; Zhou, X. Geological Characteristics and Exploration Practice of Triassic Chang 7 Shale Oil in Ordos Basin. Petrol. Explor. Dev. 2020, 47, 870–883. [Google Scholar] [CrossRef]
  26. Gao, B.; Wu, X.; Zhang, Y.; Chen, X.; Bian, R.; Li, Q. Hydrocarbon generation and evolution characteristics of Zhangjiatan oil shale in southern Ordos Basin. Petrol. Exp. Geol. 2022, 44, 24–32. [Google Scholar]
  27. Huang, Z.; Hao, Y.; Li, S.; Wo, Y.; Sun, D.; Li, M.; Chen, J. Evaluation of oil and gas bearing property and shale oil mobility of shale rock series in Chang 7 Member of Ordos Basin. Geol. China 2020, 47, 210–219. [Google Scholar]
  28. Gu, Z.; Liu, E.; Wang, X.; Li, R.; Xu, J.; Zhou, B. Development characteristics and exploration potential of shale in the 7th member of Yanchang Formation in the southeast of Ordos Basin. Oil Gas Geol. Rec. Factor 2021, 28, 95–105. [Google Scholar]
  29. Zheng, Z.; Qi, Z.; Zhang, L.; Yin, J.; Gao, C.; Jiang, C. The shale rock types and reservoir space characteristics of shanxi formation in the dolomite area of ordos basin. J. Northeast Petrol. Univ. 2020, 44, 85–98. [Google Scholar]
  30. Wan, Y.; Lin, Y.; Ding, Y.; Wang, J.; Li, H.; Xu, G.; Lei, Z.; Chen, H. Study on Brazilian splitting acoustic emission characteristics of layered rock mass. J. Chengdu Univ. Technol. 2021, 48, 714–722. [Google Scholar]
  31. Wu, S.; Sun, W.; Cheng, Z. Acoustic emission characteristics of brazilian fracturing test of low porosity sandstone under different loading conditions. J. Eng. Sci. 2020, 42, 988–998. [Google Scholar]
  32. Yu, Y.; Sun, Y.; Gao, R.; Da, L.; Hou, J.; Yang, M. Determination of surface relaxation rate of compact core based on T2 cut-off value. Petrol. Exp. Geol. 2022, 44, 342–349. [Google Scholar]
  33. Han, C.; Chen, X.; Chen, J.; Yin, X.; Zhang, R.; Geng, Z.; Peng, Y. Progress in Logging Evaluation Technology of Shale Oil in Lucaogou Formation of Santanghu Basin. Xinjiang Petrol. Geol. 2020, 41, 740–747. [Google Scholar]
  34. Zhou, S.; Liu, H.; Yan, G.; Xue, H.; Guo, W. NMR Study on Movable Fluid and T2 Cut off Value of Marine Shale Reservoirs in South China. Oil Gas Geol. 2016, 37, 612–616. [Google Scholar]
  35. Wu, M.; Qin, Y.; Wang, X.; Li, G.; Zhu, C.; Zhu, S. Fluid Mobility of Tight Sandstone Reservoirs in China and Its Influencing Factors. J. Jilin Univ. 2021, 51, 35–51. [Google Scholar]
  36. Kumar, H.H.; Elsworth, D.; Mathews, J.P.; Marone, C. Permeability evolution in sorbing media: Analogies between organic rich shale and coal. Geofluids 2016, 16, 43–55. [Google Scholar] [CrossRef]
  37. Argüelles, F.J.; Wang, M.; Abeykoon, G.A.; Okuno, R. Enhancement of Water Imbibition in Shales by use of Ketone Solvent. In Proceedings of the SPE International Conference and Exhibition on Formation Damage Control, Lafayette, LA, USA, 19–21 February 2020. [Google Scholar]
  38. Wang, L.; Zhang, R.; Zhang, N.; Lin, J.; Qin, Y.; Chen, G.; Zhang, G. A high-precision processing method for two-dimensional nuclear magnetic resonance logging data based on component compensation. J. Spectrosc. 2022, 39, 174–183. [Google Scholar]
  39. Zhou, D.; Shi, Y.; Li, M.; Zhang, Z.; Liu, S. Study on Spontaneous Imbibition Feature of Tight Sandstone Based on NMR Experiment. J. Xi’an Shiyou Univ. 2018, 33, 51–57. [Google Scholar]
  40. Han, C.; Li, G.; Bie, K.; Yu, D.; Chen, W.; Wu, F. Application of 2D NMR T1-T2 spectrum in fluid identification of complex carbonate reservoir in Fengxi. Well Logging Technol. 2021, 45, 56–61. [Google Scholar]
  41. Zhang, C. Study on T2cutoff Value of NMR Logging Rock Experiment and Application of Reservoir Evaluation. Master’s Theses, Yangtze University, Jingzhou, China, 2016. [Google Scholar]
Figure 1. Experimental connection equipment.
Energies 16 01139 g001
Figure 2. The operation procedure.
Energies 16 01139 g002
Figure 3. NMR T2 spectrum of matrix rock samples under different pore pressures.
Energies 16 01139 g003aEnergies 16 01139 g003bEnergies 16 01139 g003c
Figure 4. The change rate of macropore throats with different pore pressures of matrix samples.
Energies 16 01139 g004
Figure 5. The change rate of total pore under different pore pressures of matrix samples.
Energies 16 01139 g005
Figure 6. NMR T2 spectrum of fractured rock samples under different pore pressures.
Energies 16 01139 g006aEnergies 16 01139 g006b
Figure 7. The change rate of macropore throats with different pore pressures of fractured samples.
Energies 16 01139 g007
Figure 8. The change rate of total pore under different pore pressures of fractured samples.
Energies 16 01139 g008
Figure 9. Variation curve of permeability with pore pressure of matrix rock samples.
Energies 16 01139 g009aEnergies 16 01139 g009b
Figure 10. Variation curve of permeability with pore pressure of fractured rock samples.
Energies 16 01139 g010
Table 1. Basic parameters of rock samples.
No.WellLength/cmDiameter/cmPorosity/%Permeability/mDDepth/m
1Well Huan 2-17.292.53111.950.0582429.20–2429.40
2Well Huan 2-17.342.52411.670.1202442.80–2443.00
3Well Hua 151-16.952.52610.000.0292336.20–2336.45
1′Well Huan 2-17.862.57011.950.0582429.20–2429.40
3′Well Hua 151-17.212.54010.000.0292336.20–2336.45
Disclaimer/Publisher’s Note: The statements, opinions and data contained in all publications are solely those of the individual author(s) and contributor(s) and not of MDPI and/or the editor(s). MDPI and/or the editor(s) disclaim responsibility for any injury to people or property resulting from any ideas, methods, instructions or products referred to in the content.

