
A Hybrid Grey Wolf Assisted-Sparrow Search Algorithm for Frequency Control of RE Integrated System

 ,
,  ,
,  ,
,  ,
,  , ,
, ,
Abstract
1. Introduction
- A hybrid SSAGWO algorithm is proposed to improve the SSA algorithm exploitation ability, and the algorithm is tested using various classical benchmark functions to prove its effectiveness against other algorithms.
- Auto-tuning of the PID controller parameters for ALFC of an RER-integrated HPS network is implemented using various optimization algorithms to verify the robustness of the proposed algorithm.
- The proposed system is tested using the data of an actual solar power plant, emulated for extreme operating conditions.
- A stability analysis is conducted to prove the efficacy and robustness of the proposed technique.
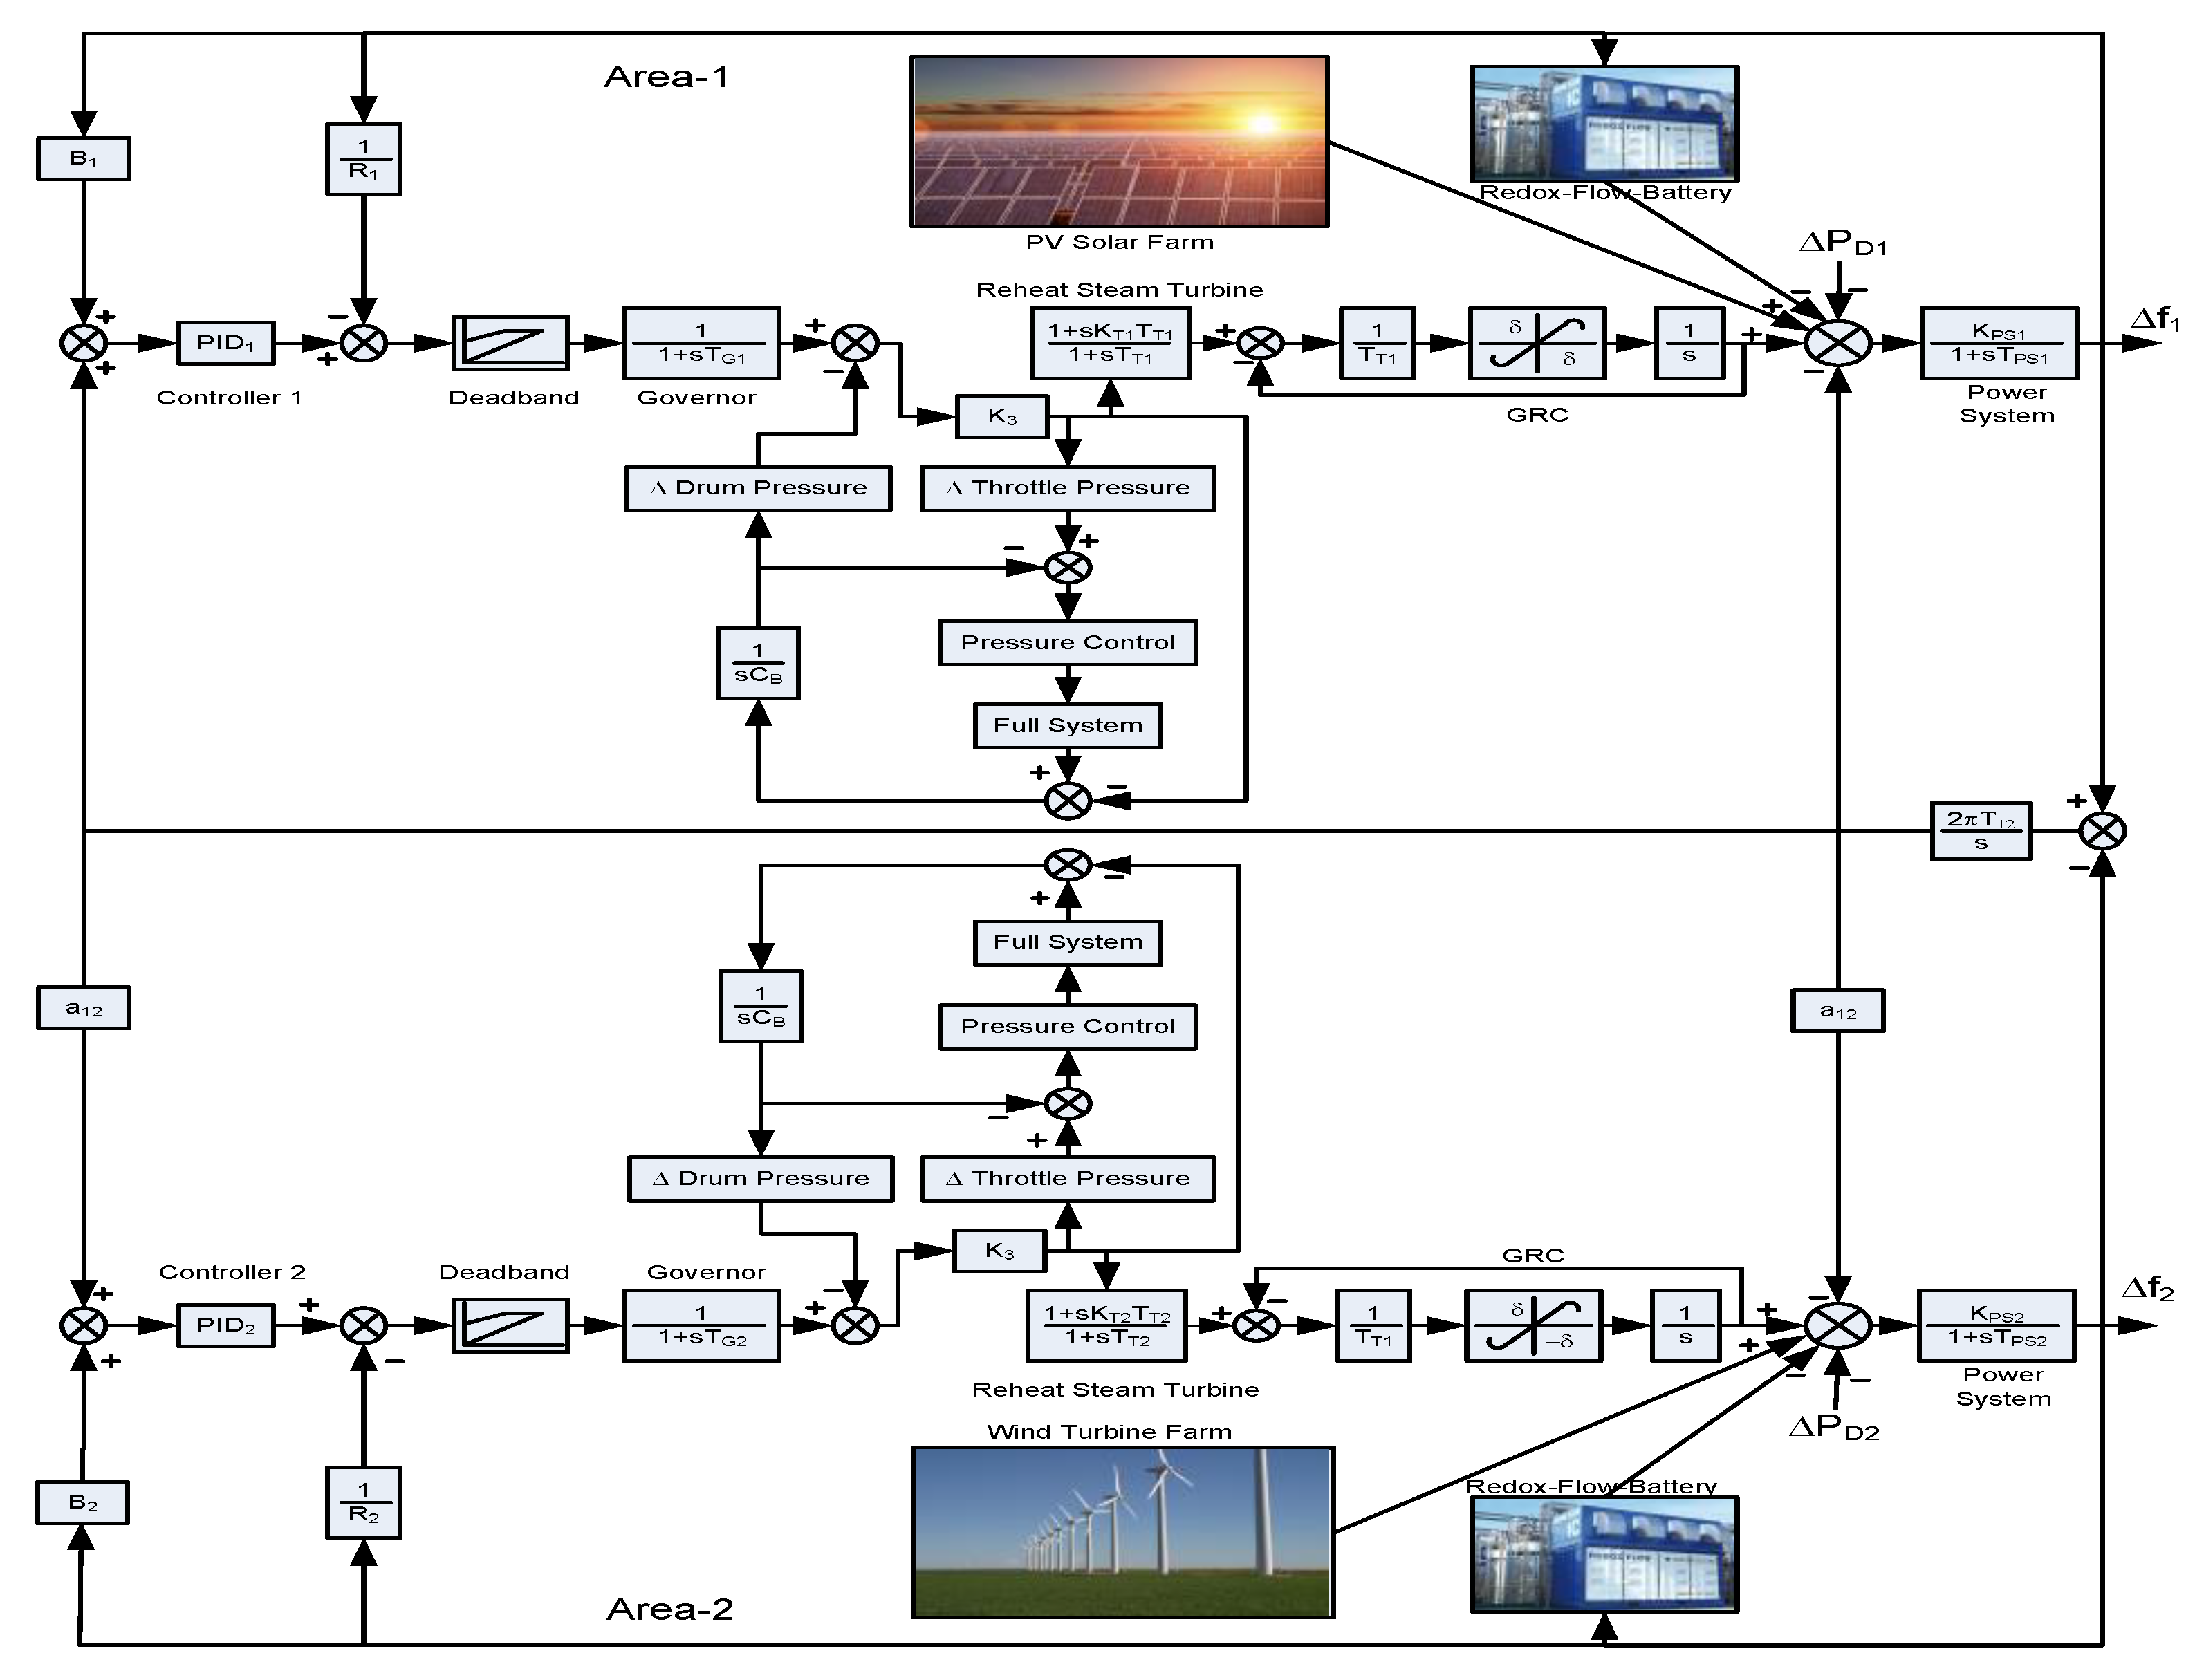
2. System Model
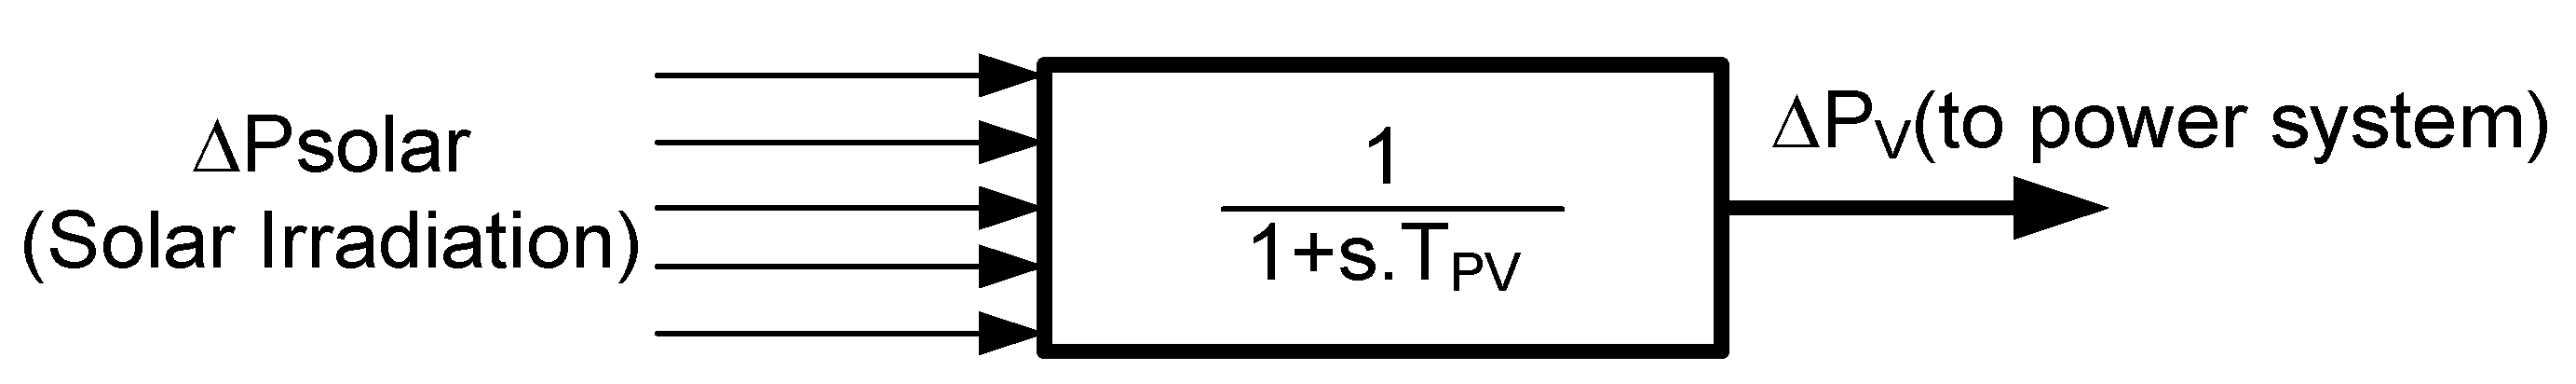
2.1. SPV Model
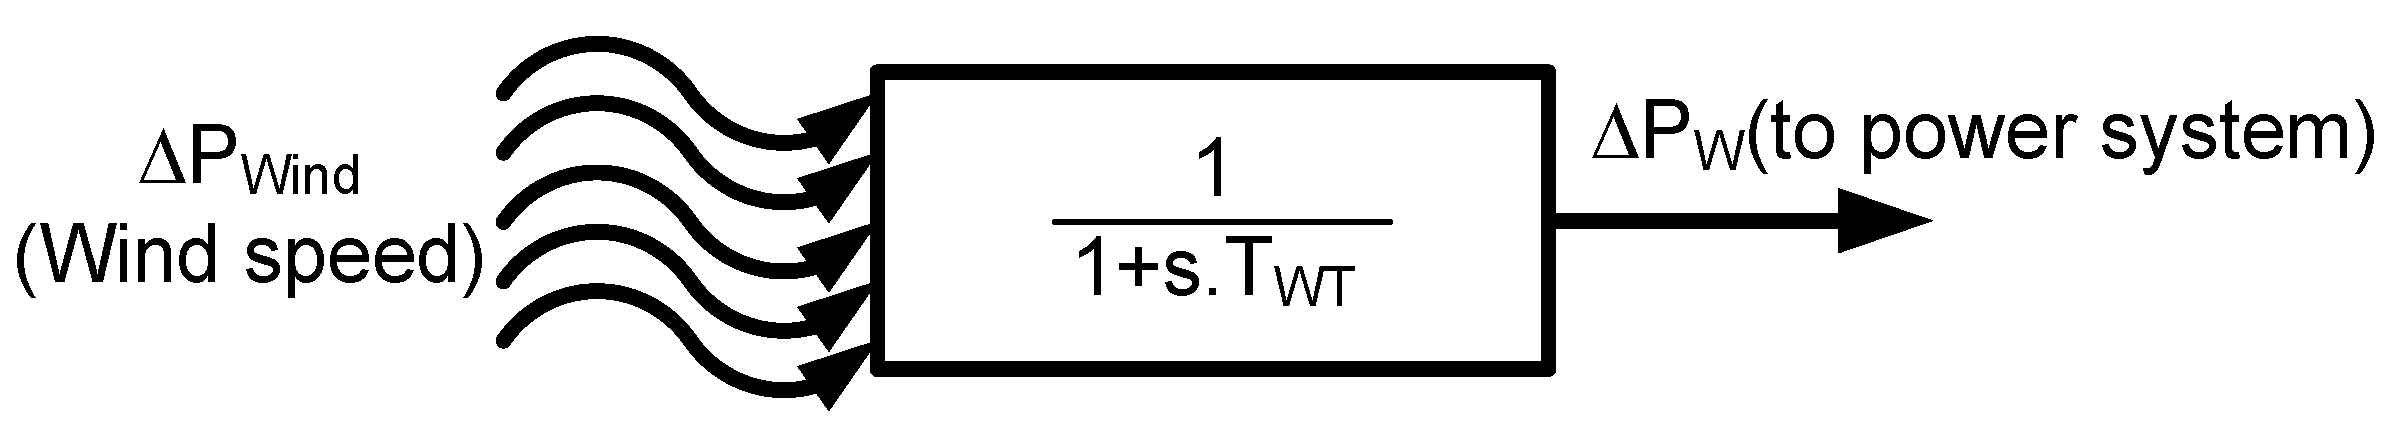
2.2. WTPG Model
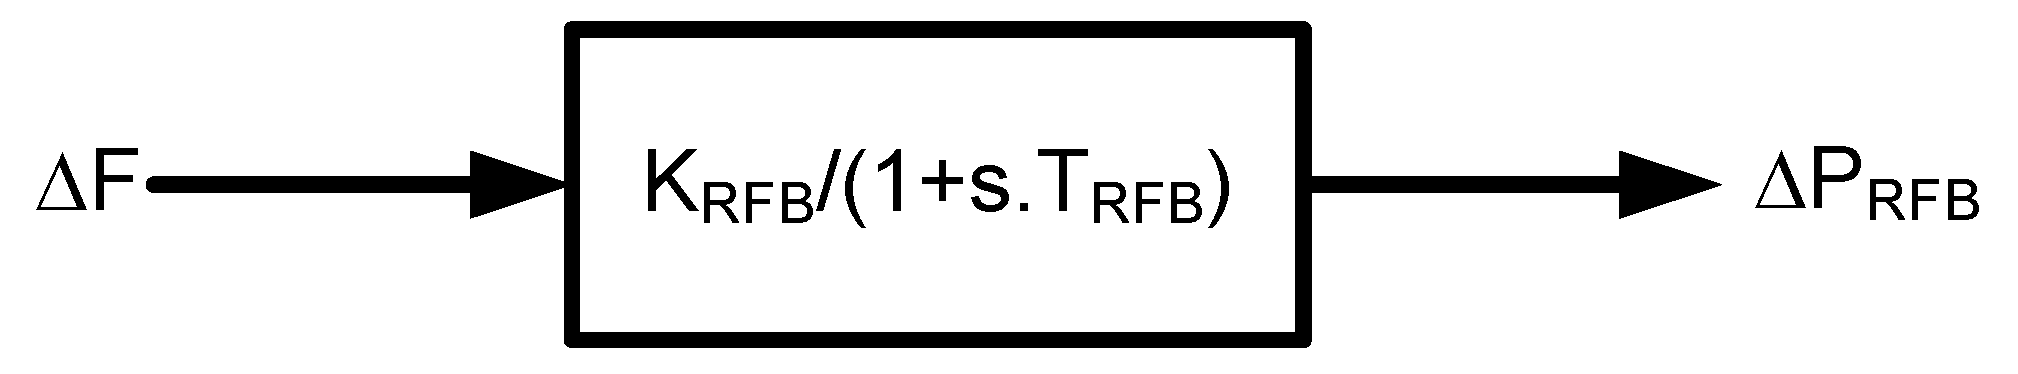
2.3. RFB Structure
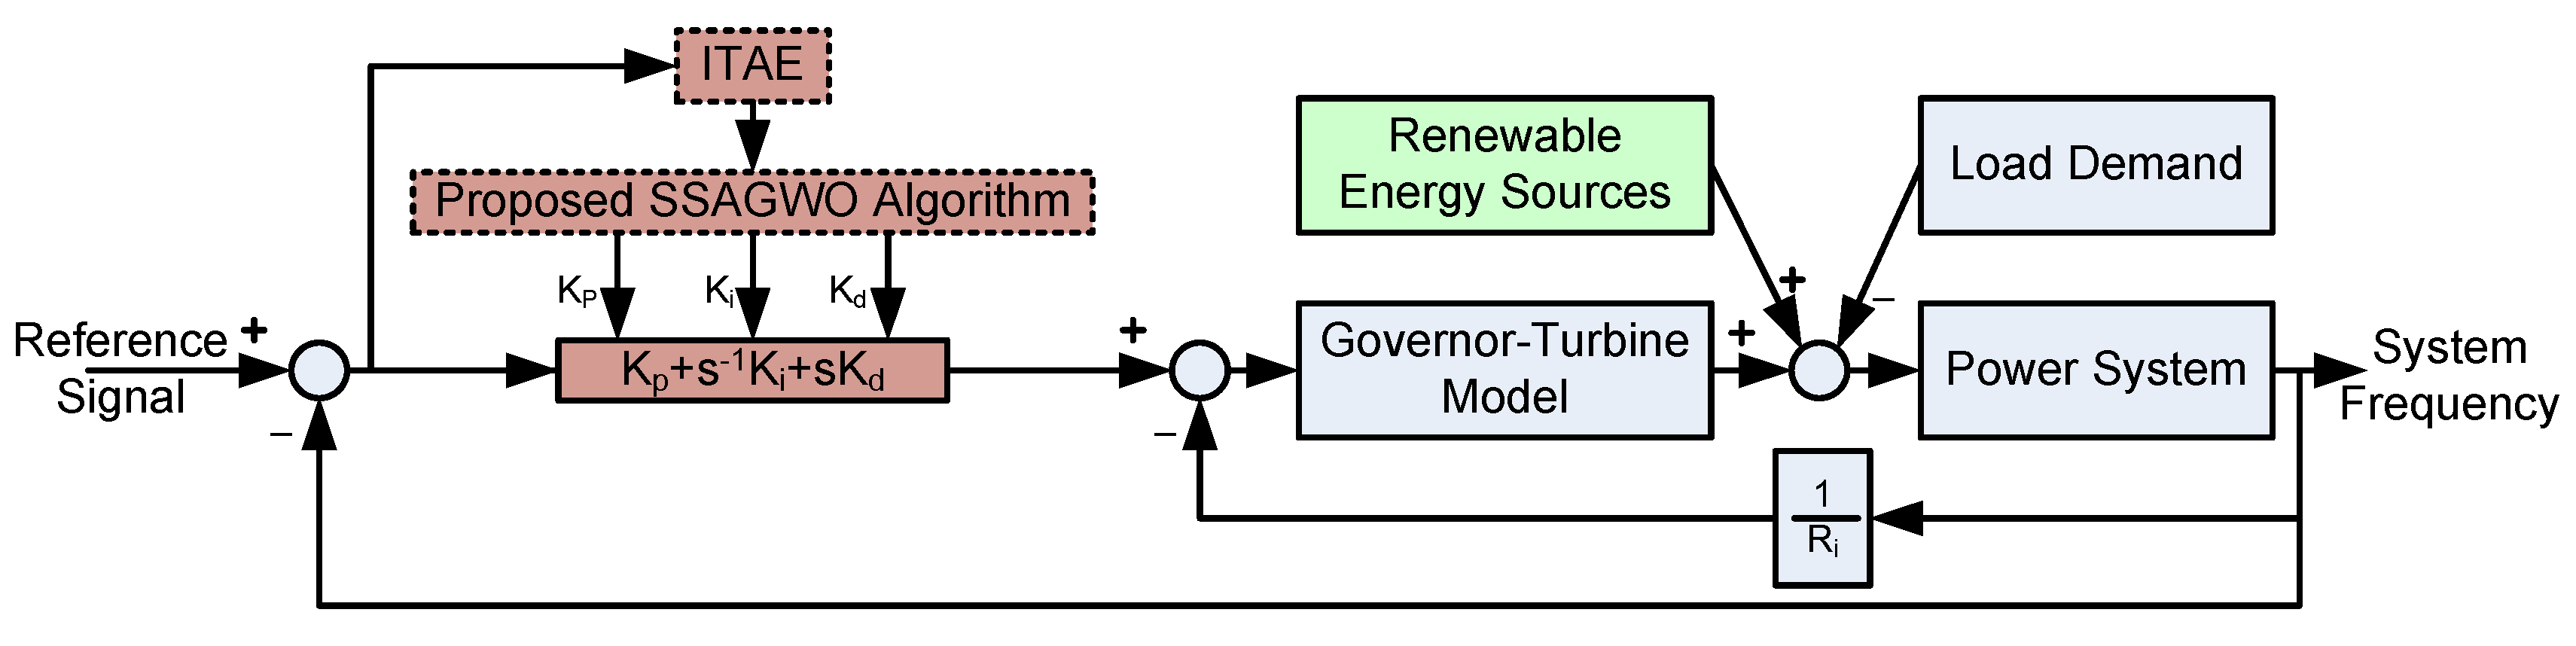
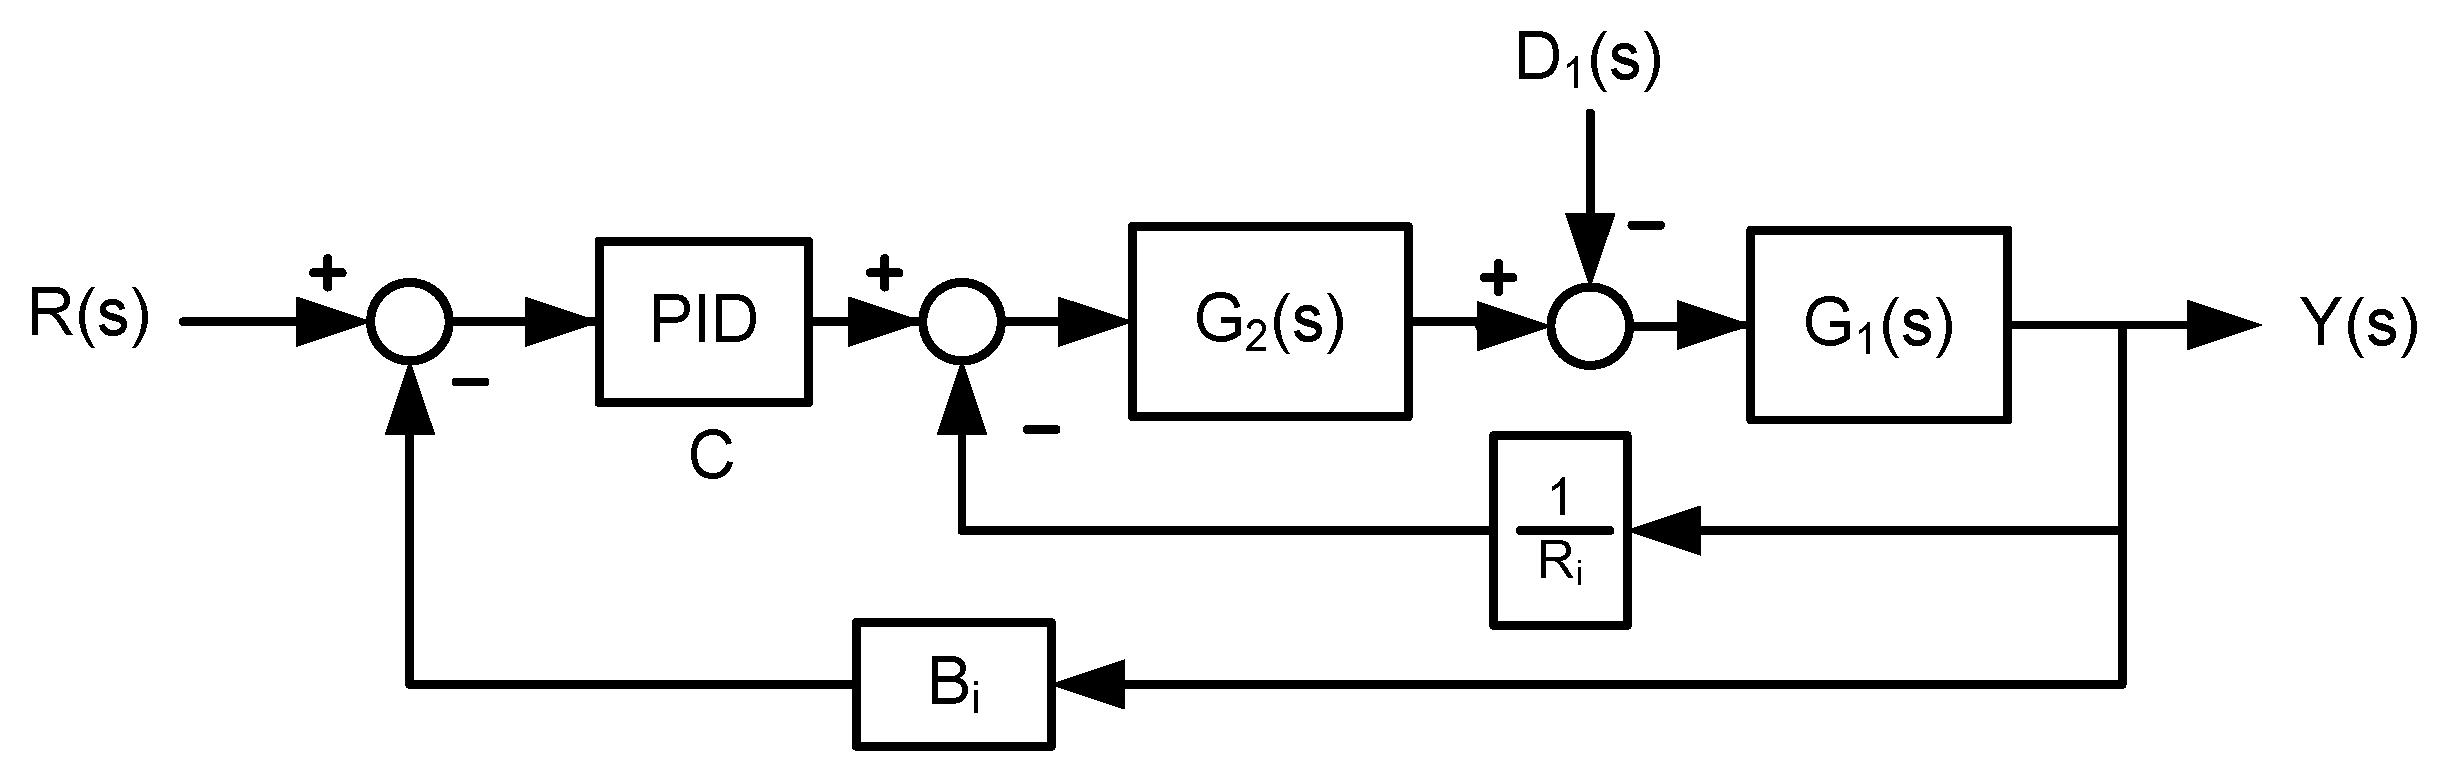
3. Control Strategy
4. Proposed Hybrid SSA-GWO
4.1. Grey Wolf Optimization
4.2. Sparrow Search Algorithm
4.3. Proposed Optimization Algorithm
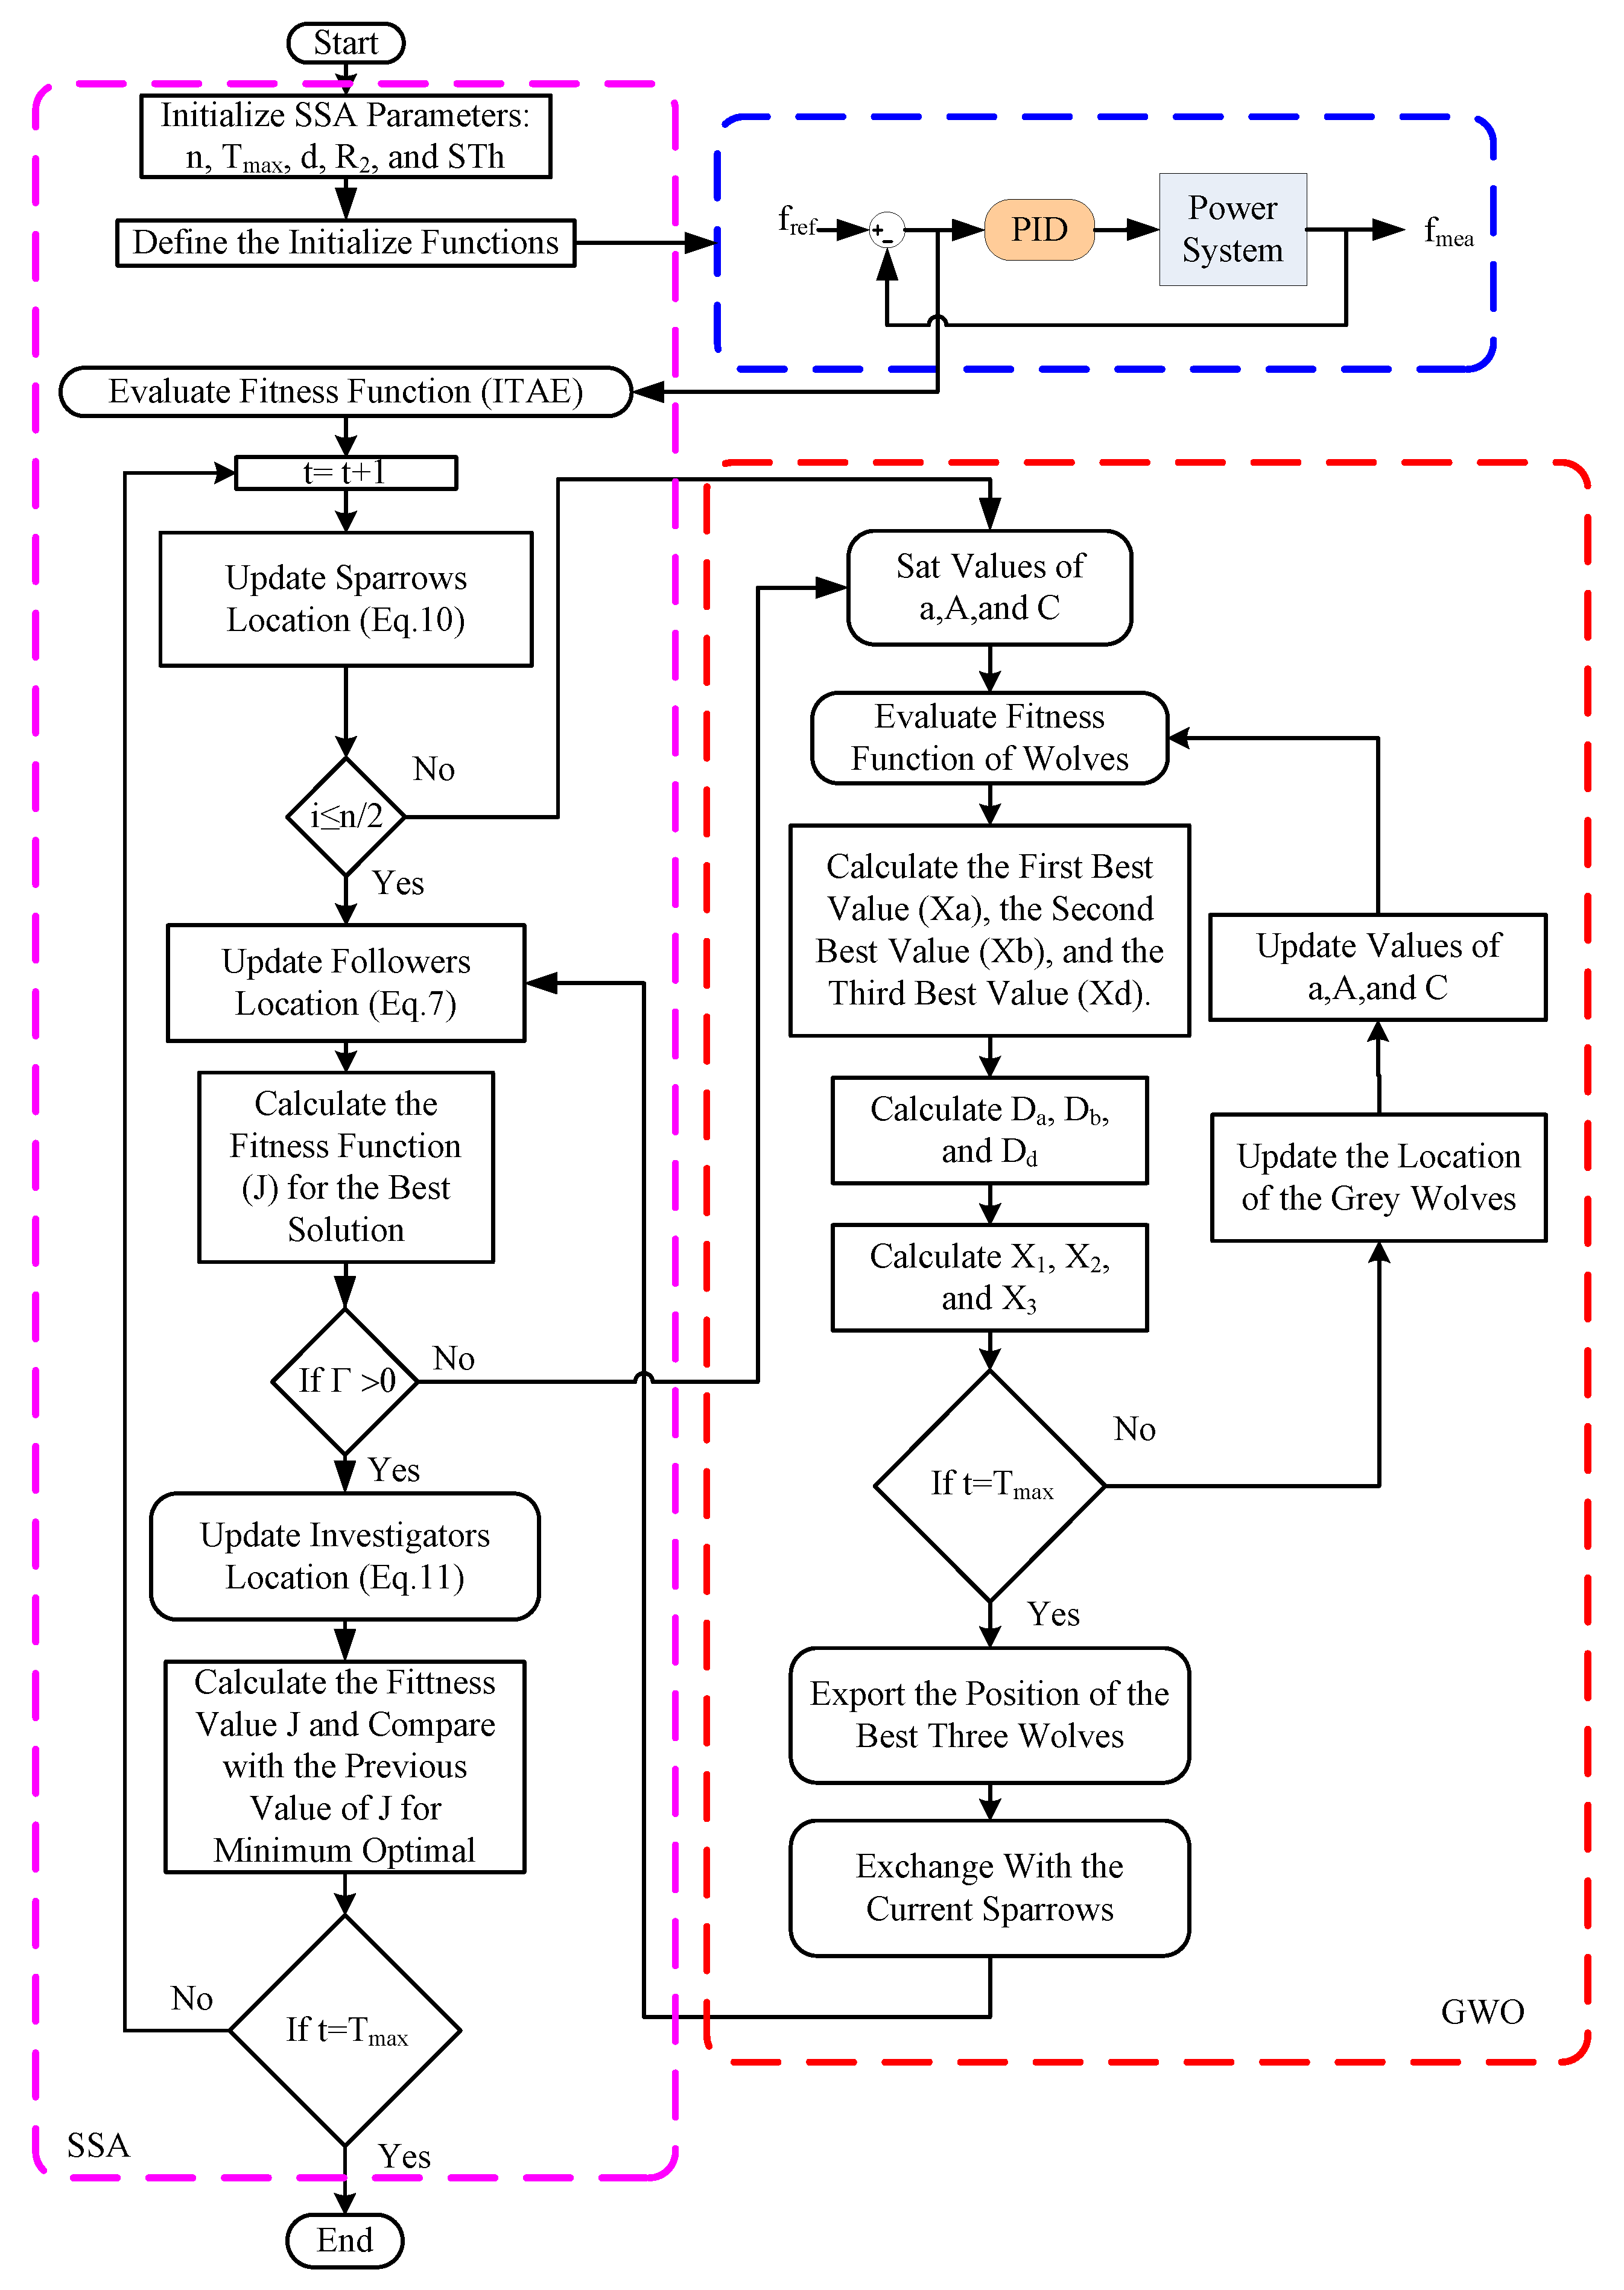
- Step 1: Initialize the sparrow search population and its parameters (n is the total number of sparrows, Tmax maximum iteration, d is the number of variables).
- Step 2: While (t < Tmax), rank the sparrows according to their fitness values by minimizing J in Equation (3). Find the current best value, which is the minimum fitness value, and the current worst value, which is the maximum fitness value.
- Step 3: Update the sparrow location for the discoverer by using Equation (10).
- Step 4: If the ith individuals at the current iteration are less or equal to half the sparrow population, then update the follower’s position using Equation (7) and go to step 9. Except for that, run the GWO algorithm.
- Step 5: Initialize the values of a, A, and C.
- Step 6: Calculate the first-best value of the alpha wolf, the second-best value of the beta wolf, and third best value of the gamma wolf.
- Step 7: Determine the distance between the wolves and prey using Equation (6). After that, calculate the value of the new position using Equations (4) and (5).
- Step 8: Export the position of the best three wolves and exchange it with the current sparrows. The flowchart of the SSAGWO is shown in Figure 7.
- Step 9: Update the follower’s position using Equation (7). Then, update the investigator’s location using Equation (11).
- Step 10: By using Equation (9), if the probability factor is a positive value, calculate the fitness value using Equation (3) and compare it with the best fitness solution to obtain the minimum optimal value. However, if the probability factor is negative, go to step 5.
5. Simulation Results and Discussion
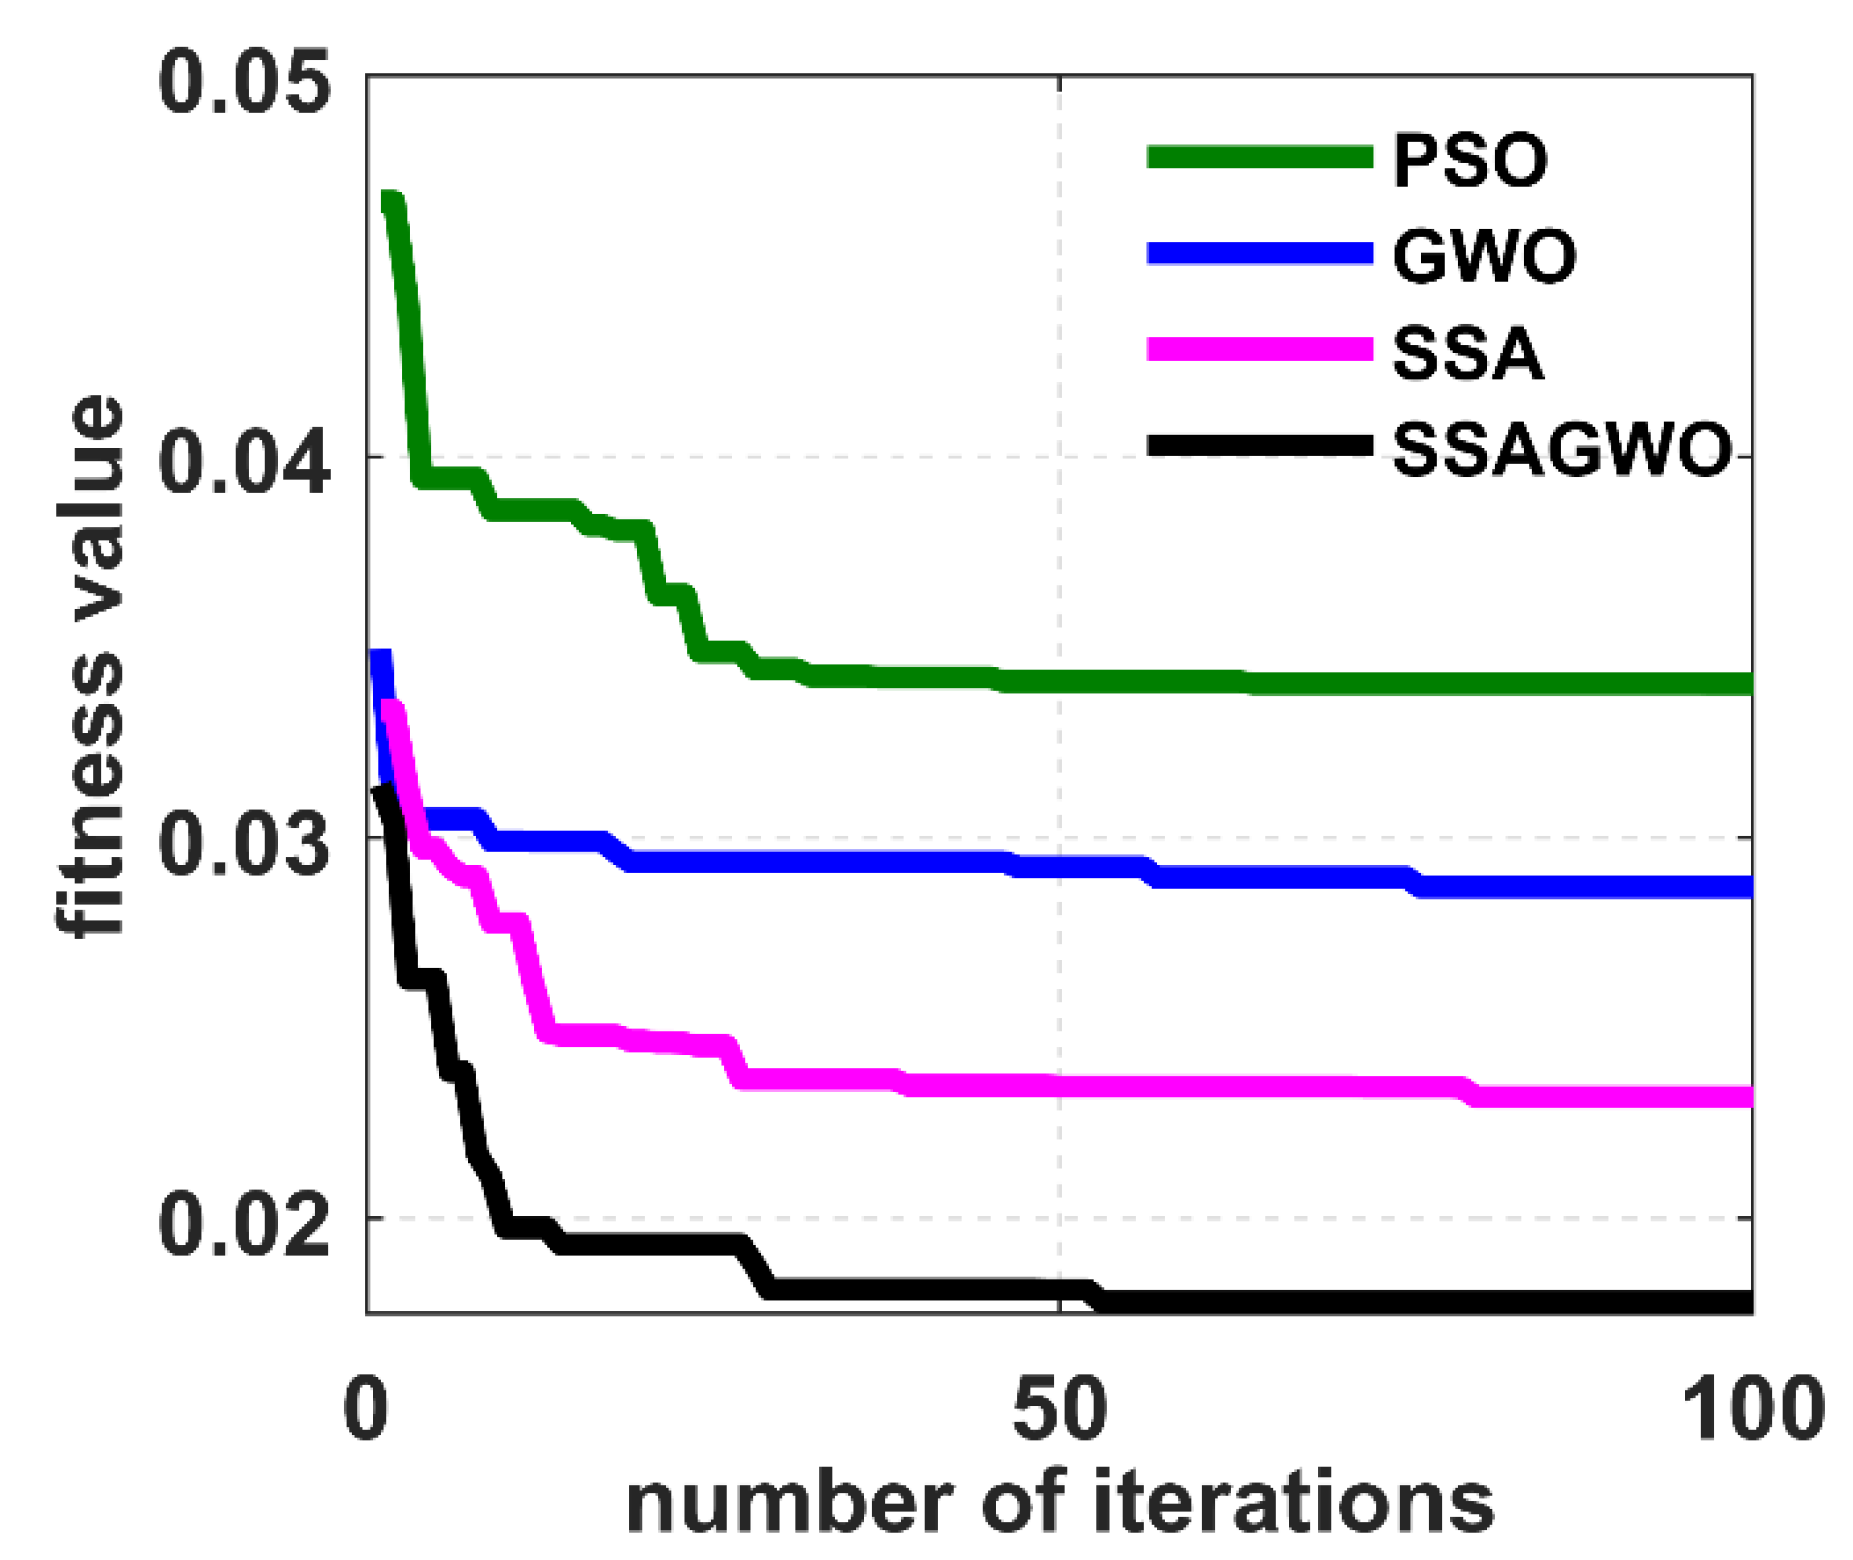
5.1. Validation of Benchmark Functions
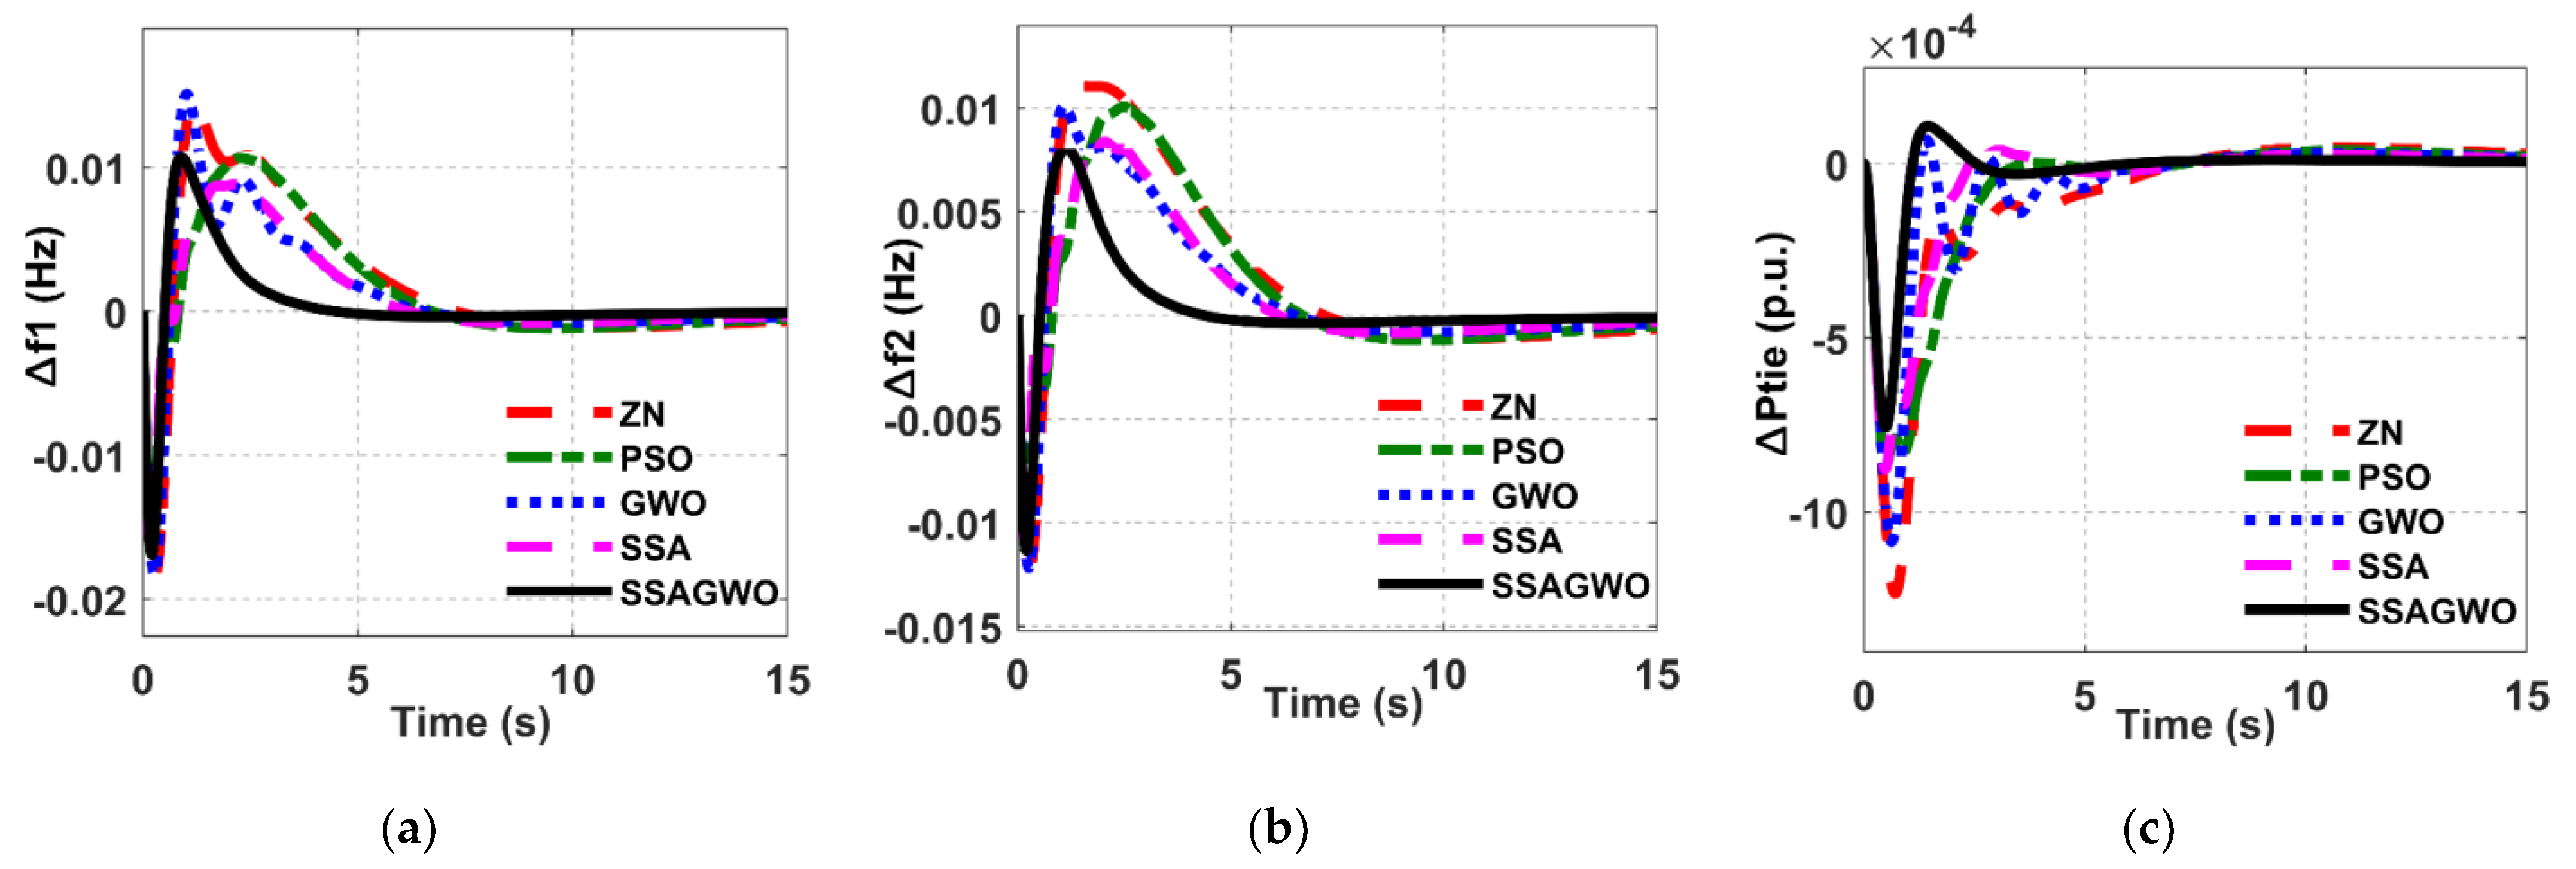
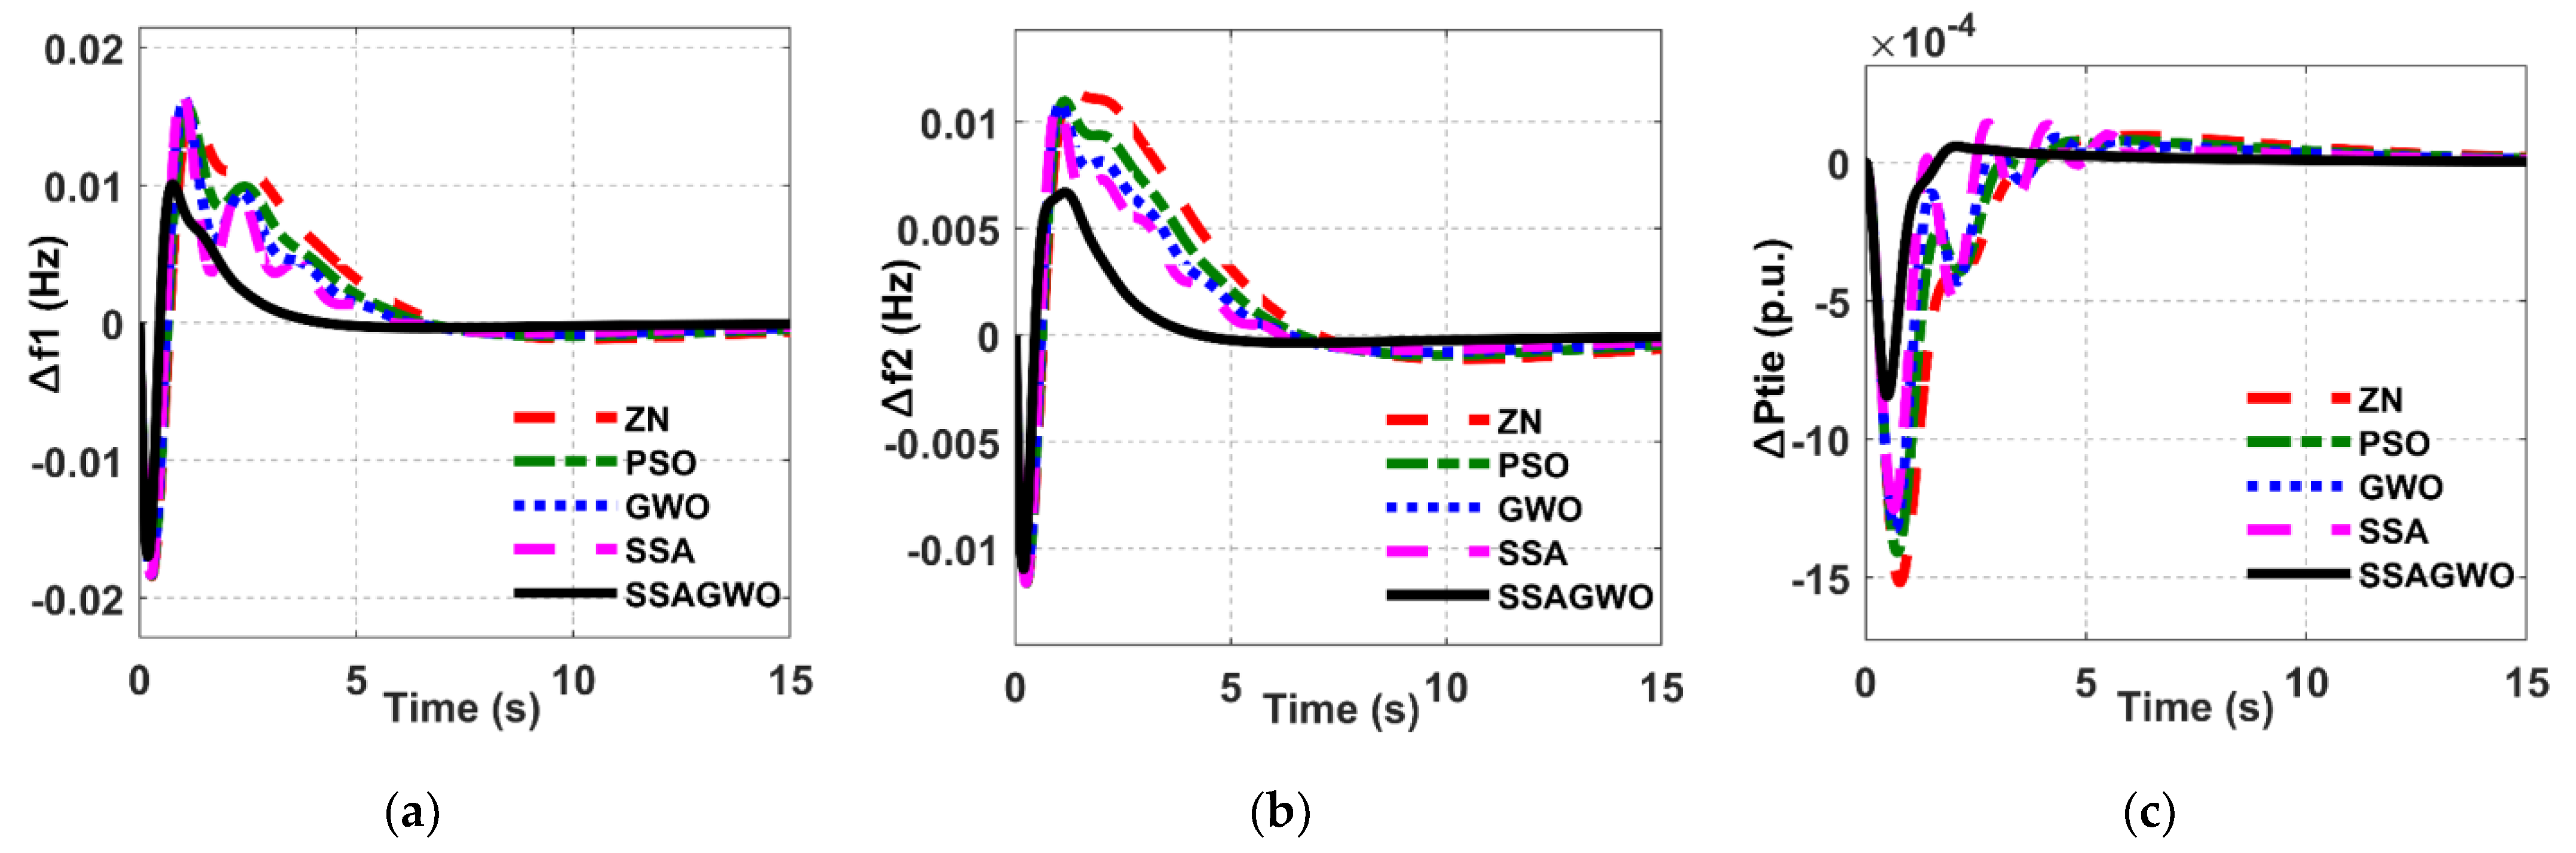
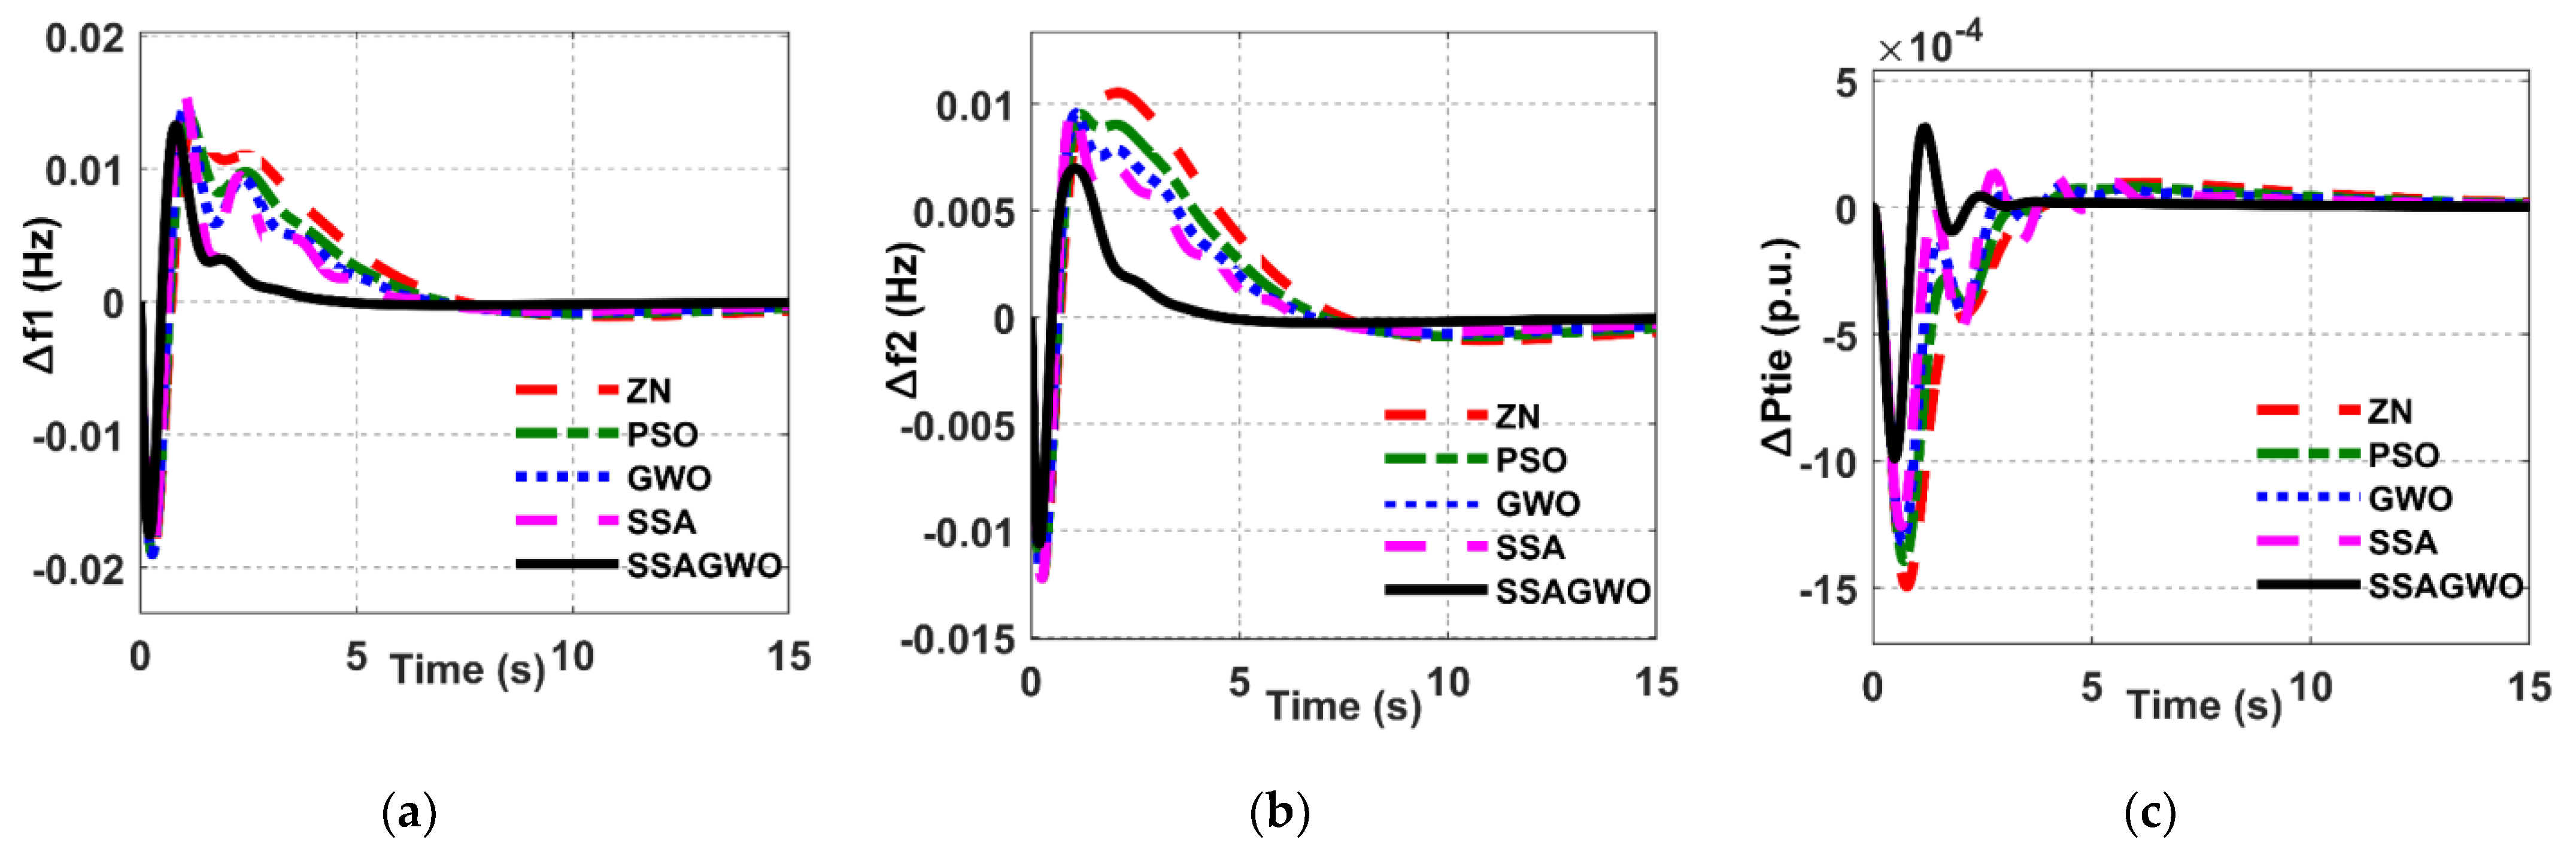
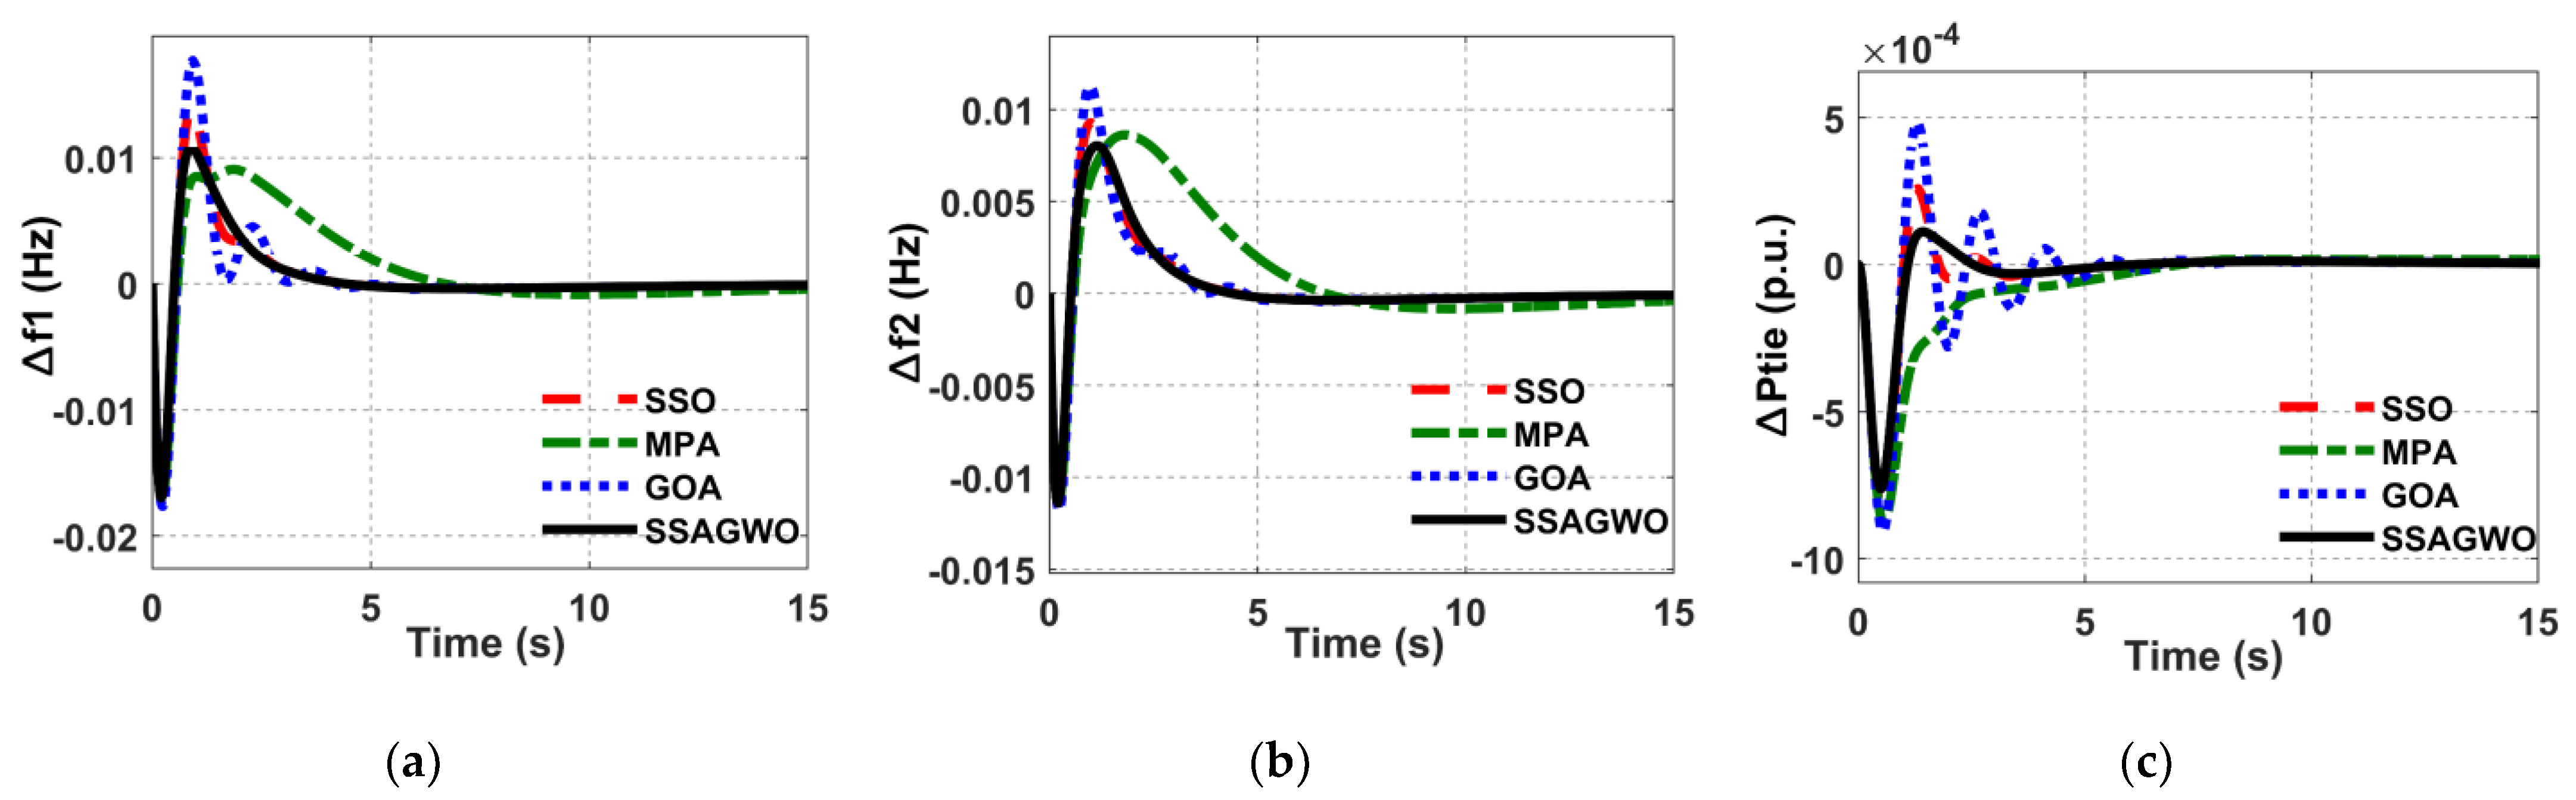
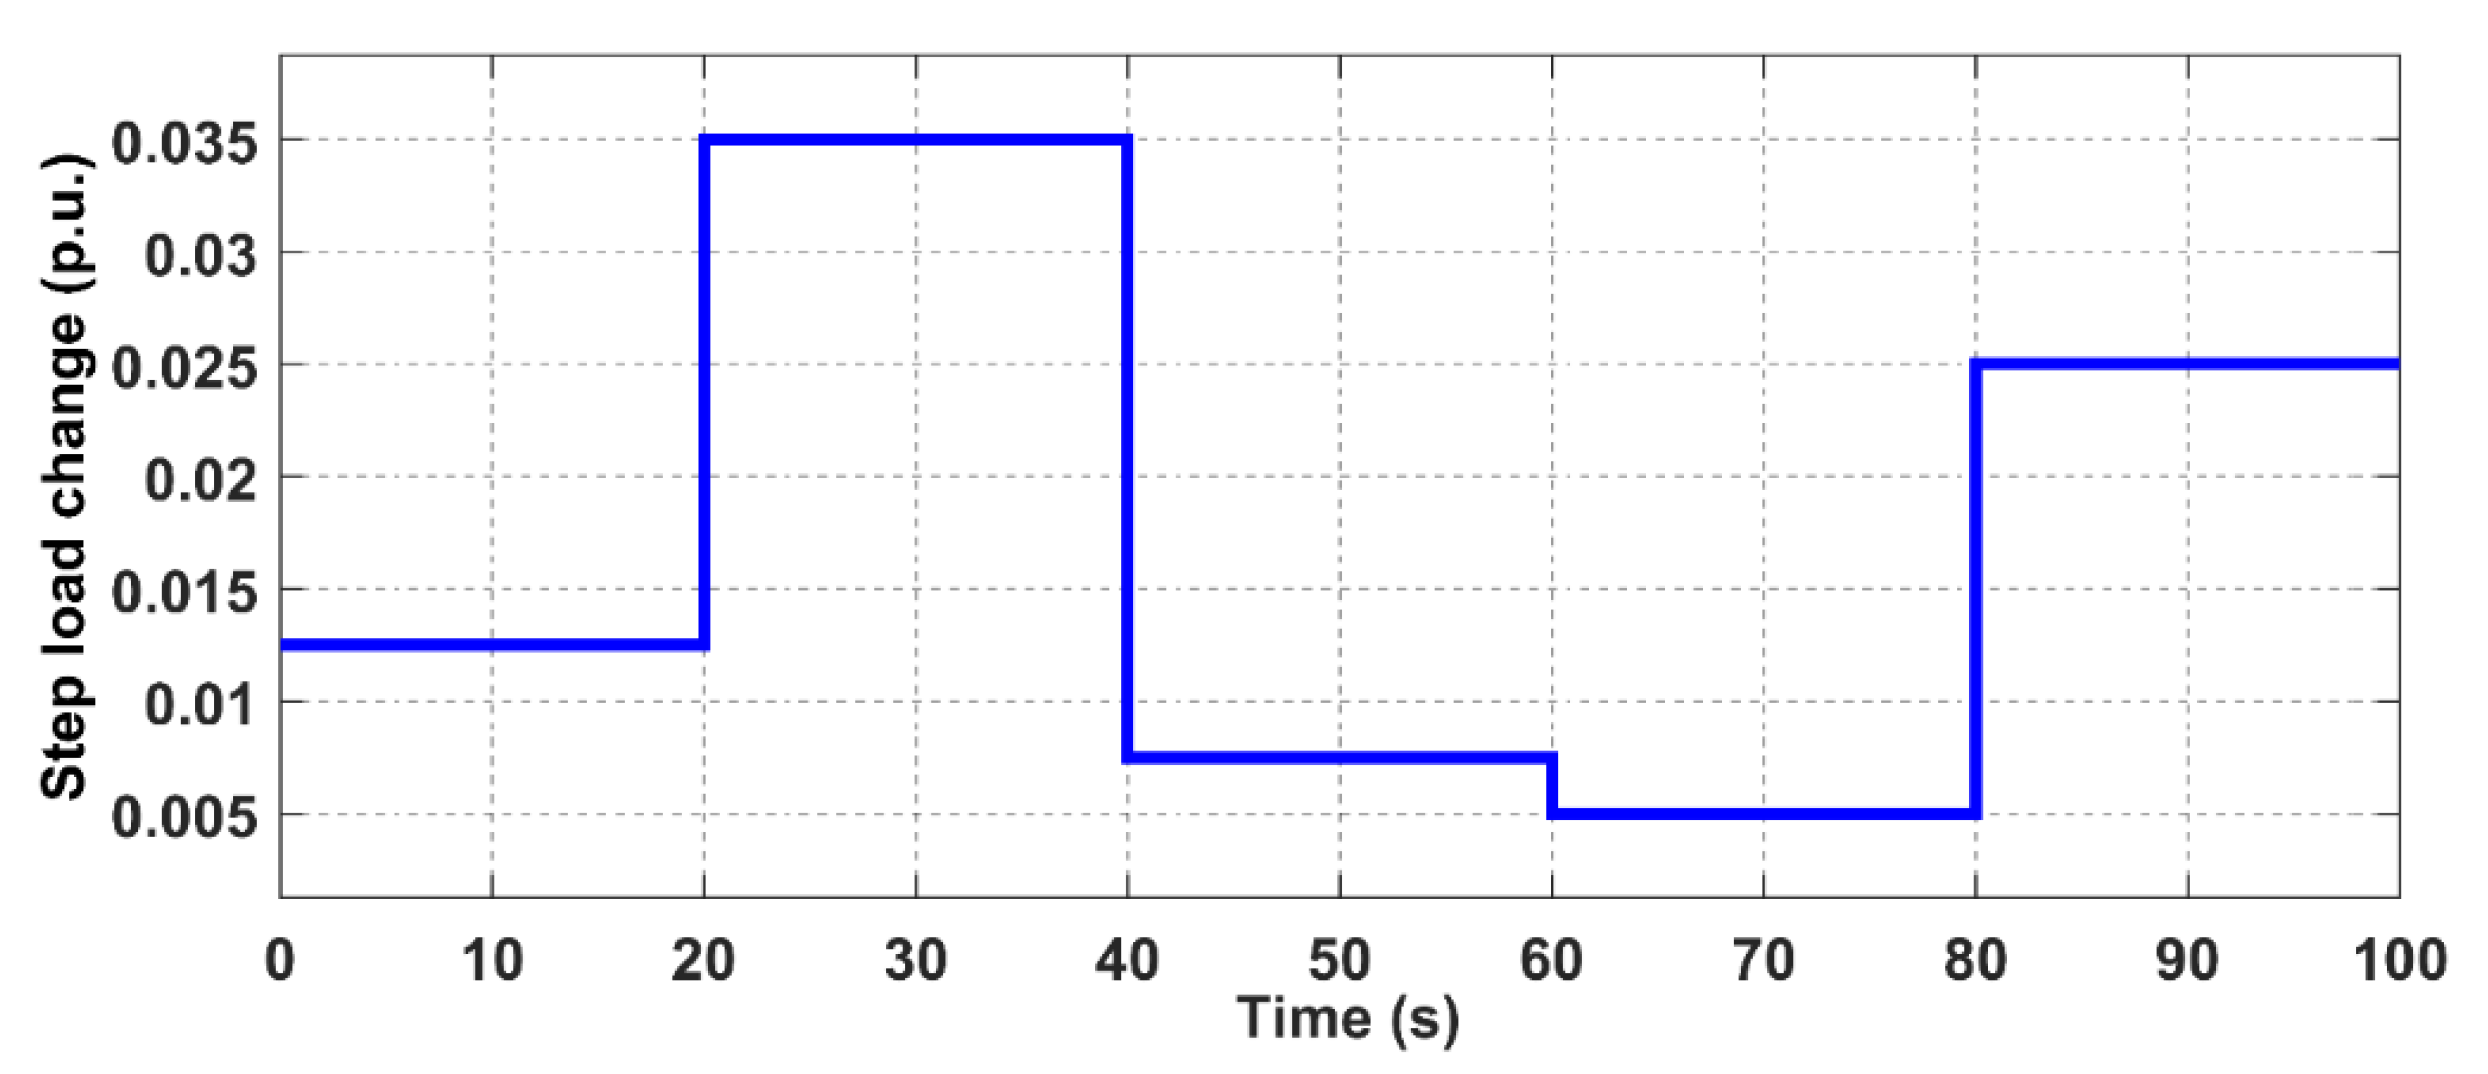
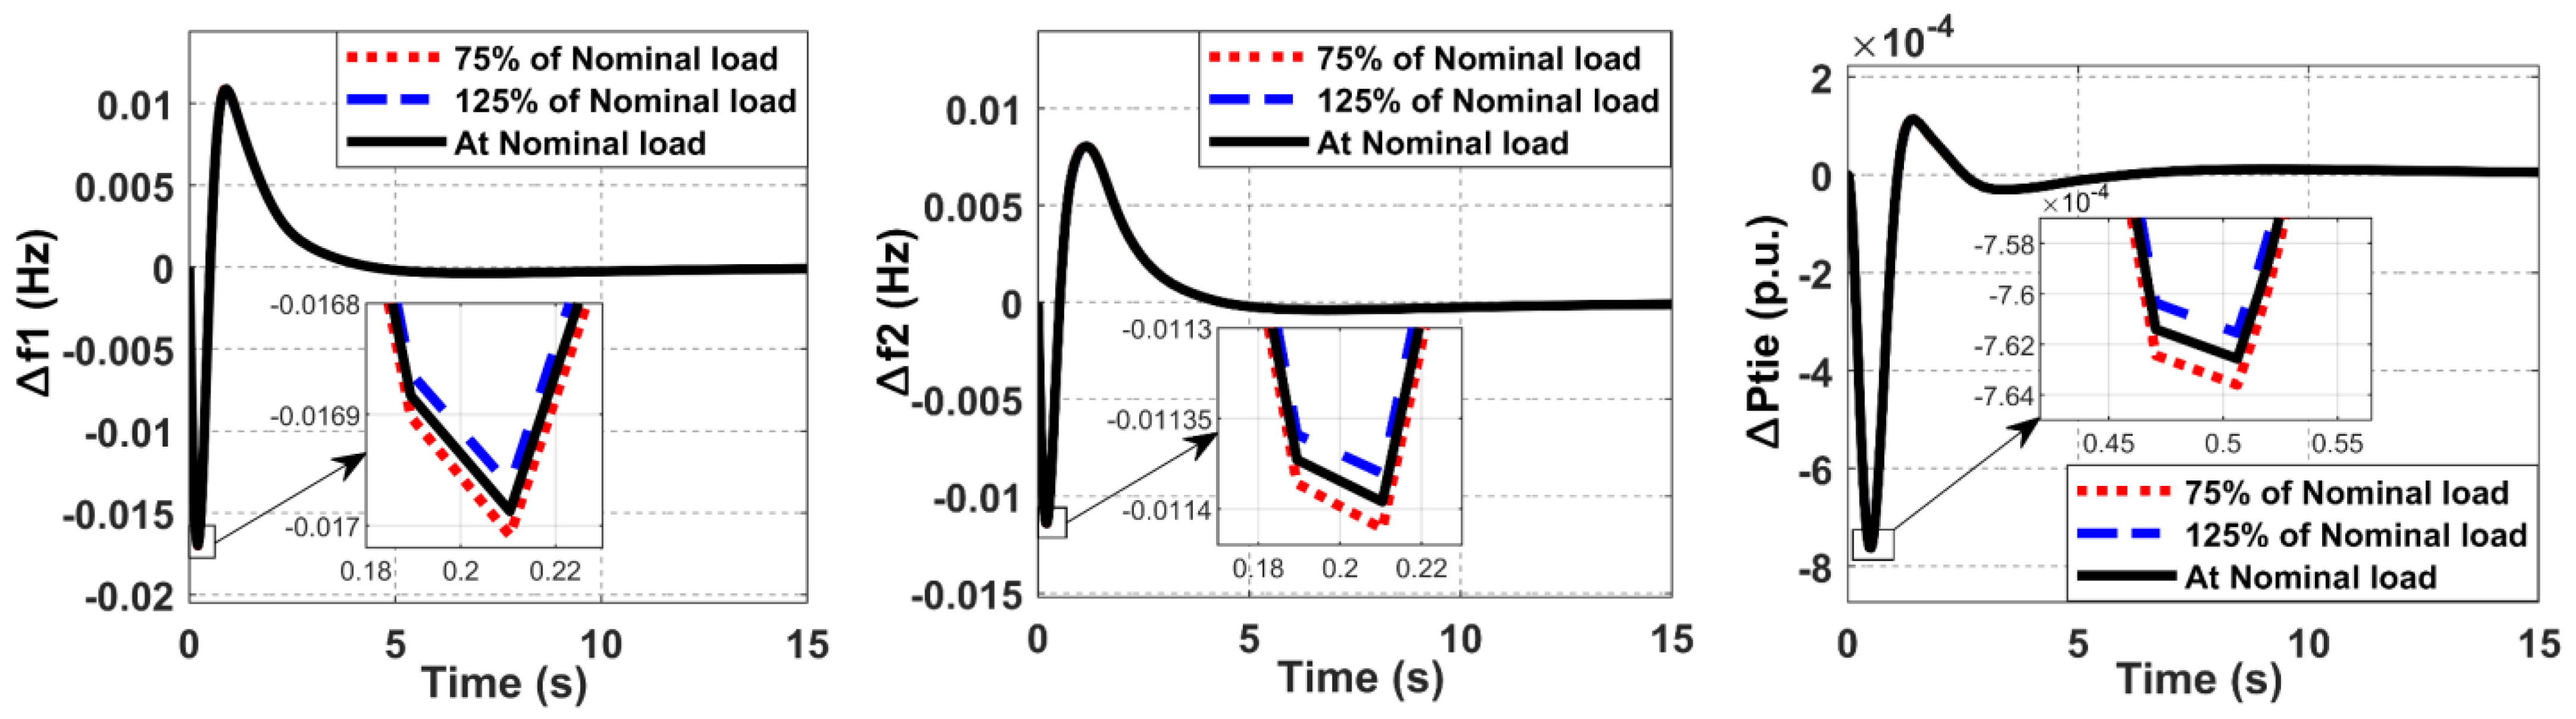
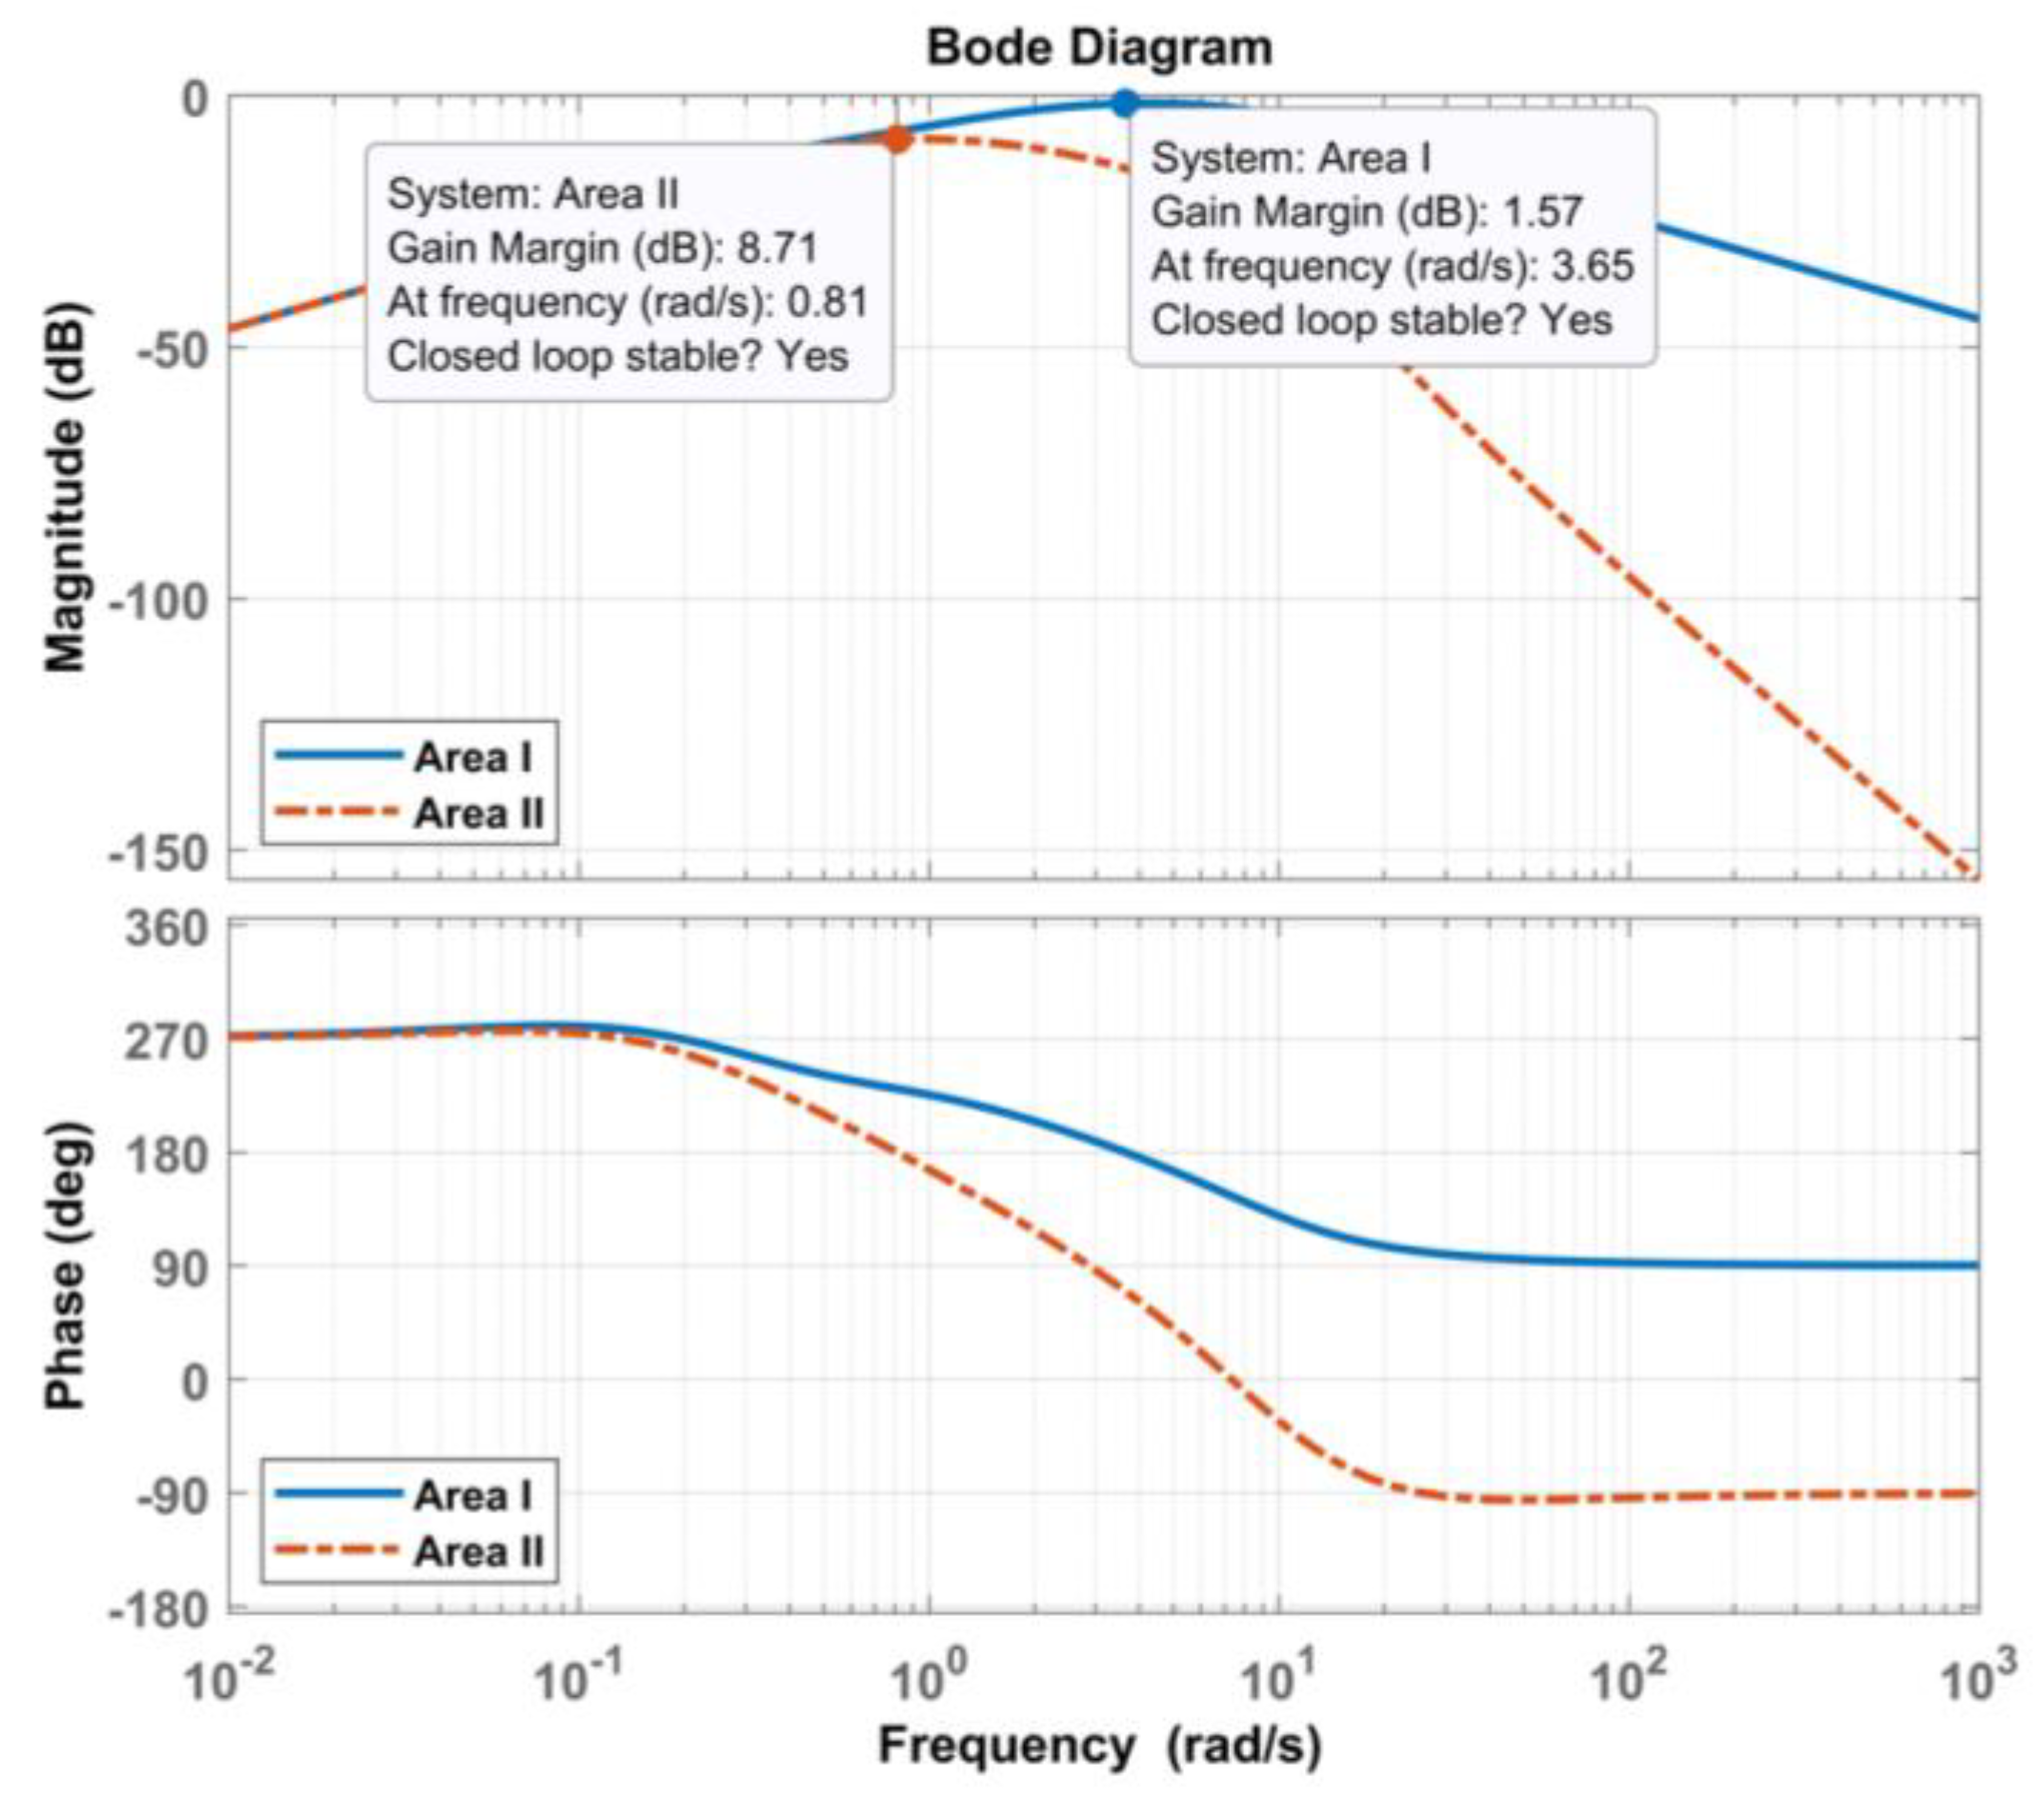
5.2. Stability Analysis
6. Conclusions
Author Contributions
Funding
Acknowledgments
Conflicts of Interest
Abbreviations
| ACE | Area Control Error |
| ACO | Ant Colony Optimization |
| ANN | Artificial Neural Network |
| ALFC | Automatic Load Frequency Control |
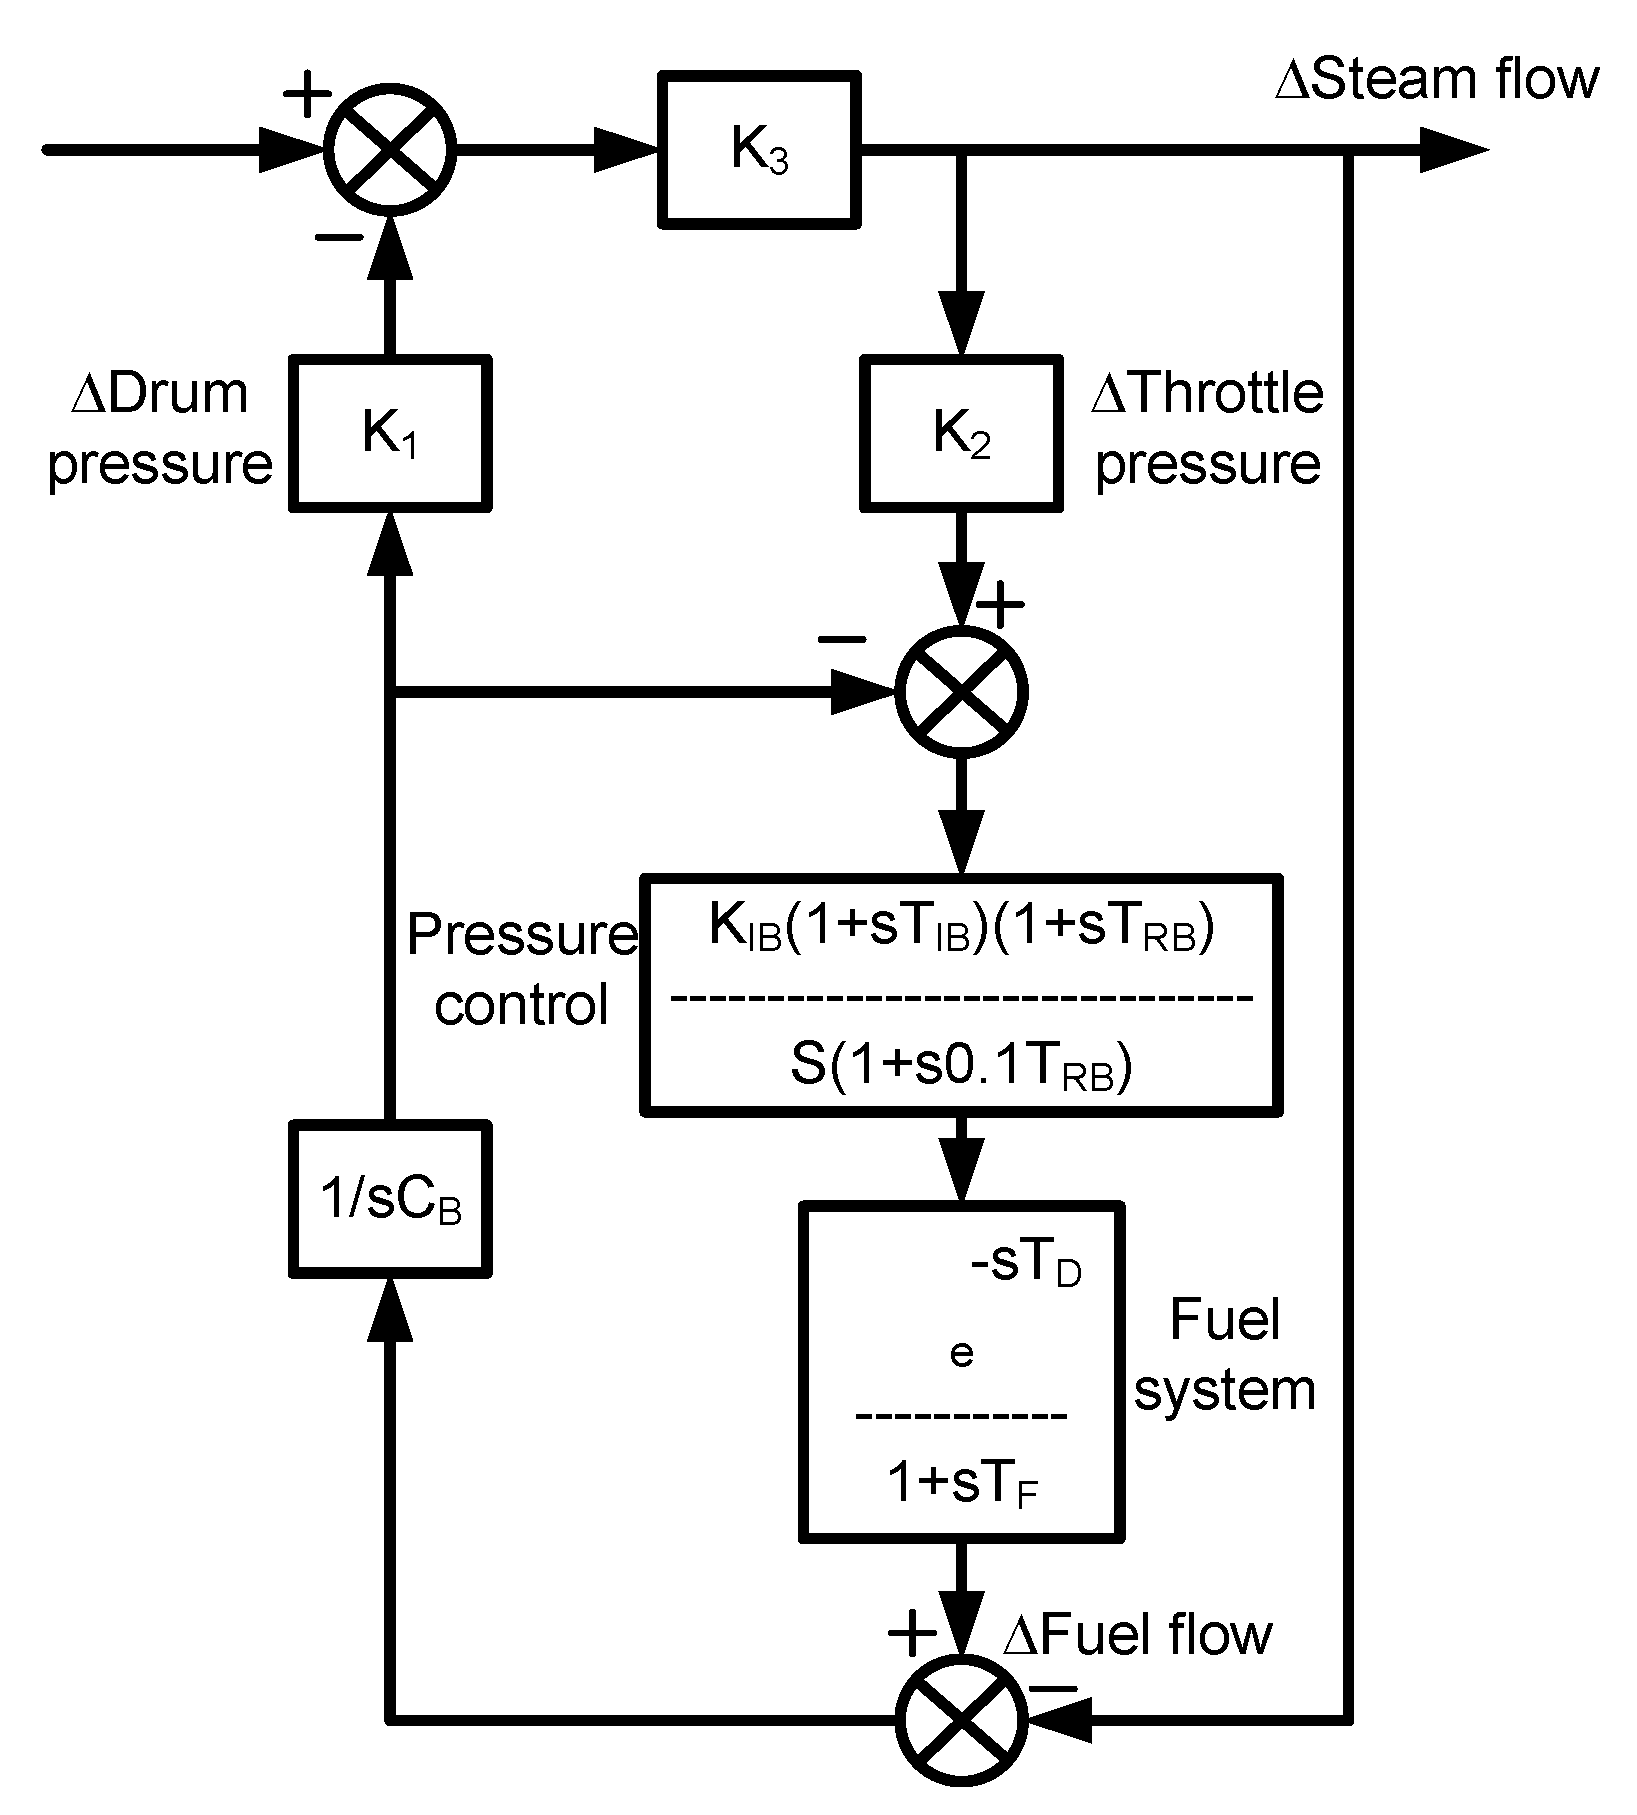
| BD | Boiler Dynamics |
| BES | Battery Energy System |
| CLTF | Closed-Loop Transfer Function |
| CTO | Class Topper Optimization |
| DE | Differential Evolutionary |
| FLC | Fuzzy Logic Controller |
| GDB | Governor Dead Band |
| GOA | Grasshopper Optimization Algorithm |
| GRC | Generator Rate Constraints |
| GWO | Grey Wolf Optimizer |
| HIO | Hybrid Intelligent Optimization |
| HPS | Hybrid Power System |
| IAE | Integral Absolute Error |
| ISE | Integral Square Error |
| ITAE | Integral Time Absolute Error |
| ITSE | Integral Time Square Error |
| MPA | Marine Predator Algorithm |
| MPC | Model Predictive Control |
| MRFO | Manta-Ray Foraging Optimizer |
| PFMPID | Predictive Functional Modified Proportional Integral Derivative |
| PID | Proportional Integral Derivative |
| PIDA | Proportional-Integral-Derivative-Acceleration |
| PSO-GSA | Particle Swarm Optimized-Gravitational Search Algorithm |
| PV | Photovoltaic Cell |
| RER | Renewable Energy Resources |
| RFB | Redox Flow Battery |
| RT | Rise Time |
| SMC | Sliding Mode Control |
| SMES | Superconducting Magnetic Energy Storage |
| SPV | Solar PV |
| SSAGWO | Sparrow Search Algorithm-Grey Wolf Optimizer |
| SSO | Salp Swarm Optimization |
| ST | Settling Time |
| STPP | Solar Thermal Power Plant |
| WOA | Whale Optimization Algorithm |
| WTPG | Wind Turbine Power Generator |
| Z–N | Ziegler-Nichols |
Appendix A

| System Parameters | Value |
|---|---|
| Base Rated Power of area 1 and area 2 PR1 = PR2 | 2000 MW |
| The gains of power system KP1 = KP2 | 120 Hz/p.u.MW |
| The time constant of the power system TP1 = TP2 | 0.08 s |
| The turbine time constant TT1 = TT2 | 0.3 s |
| The time constant of the Reheat Tr1 = Tr2 | 10 s |
| The gains of the Reheat Kr1 = Kr2 | 0.5 |
| The governor adjustment deviation coefficients R1 = R2 | 2.4 Hz/p.u.MW |
| The frequency response coefficients B1 = B2 | 0.425 p.u.MW/Hz |
| The system damping coefficient D1 = D2 | 0.00833 p.u.MW/Hz |
| The time constants of tie-line flow T12 = T21 | 0.08674 p.u.MW/rad |
| System inertia H1 = H2 | 5 s |
| Solar PV time constant TPV | 1.3 |
| Wind turbine time constant TWT | 1.5 |
| Boiler Parameters | Value |
|---|---|
| K1 | 0.85 |
| K2 | 0.095 |
| K3 | 0.92 |
| CB | 200 |
| TD | 0 |
| KIB | 0.03 |
| TIB | 26 |
| TRB | 69 |
| TF | 10 |
Appendix B
References
- Irudayaraj, A.X.R.; Wahab, N.I.A.; Premkumar, M.; Radzi, M.A.M.; Bin Sulaiman, N.; Veerasamy, V.; Farade, R.A.; Islam, M.Z. Renewable sources-based automatic load frequency control of interconnected systems using chaotic atom search optimization. Appl. Soft Comput. 2022, 119, 108574. [Google Scholar] [CrossRef]
- Shouran, M.; Anayi, F.; Packianather, M. The bees algorithm tuned sliding mode control for load frequency control in two-area power system. Energies 2021, 14, 5701. [Google Scholar] [CrossRef]
- Veerasamy, V.; Wahab, N.I.A.; Ramachandran, R.; Othman, M.L.; Hizam, H.; Kumar, J.S.; Irudayaraj, A.X.R. Design of single- and multi-loop self-adaptive PID controller using heuristic-based recurrent neural network for ALFC of hybrid power system Veerapandiyan. Expert Syst. Appl. 2022, 192, 116402. [Google Scholar] [CrossRef]
- Mokhtar, M.; Marei, M.I.; Sameh, M.A.; Attia, M.A. An Adaptive Load Frequency Control for Power Systems with Renewable Energy Sources. Energies 2022, 15, 573. [Google Scholar] [CrossRef]
- Arya, Y. AGC performance enrichment of multi-source hydrothermal gas power systems using new optimized FOFPID controller and redox flow batteries. Energy 2017, 127, 704–715. [Google Scholar] [CrossRef]
- Huddar, A.P.; Kulkarni, P.S. Load frequency control of a multi-area power system using linear quadratic regulator. J. Inst. Eng. Electr. Eng. Div. 2009, 90, 69–76. [Google Scholar]
- Wang, Z.; Liu, Y.; Yang, Z.; Yang, W. Load frequency control of multi-region interconnected power systems with wind power and electric vehicles based on sliding mode control. Energies 2021, 14, 2288. [Google Scholar] [CrossRef]
- Mohamed, A.; Diab, A.A.Z.; Rezk, H.; Jin, T. A novel adaptive model predictive controller for load frequency control of power systems integrated with DFIG wind turbines. Neural Comput. Appl. 2020, 32, 7171–7181. [Google Scholar] [CrossRef]
- Mohseni, N.A.; Bayati, N. Robust Multi-Objective H2/H∞ Load Frequency Control of Multi-Area Interconnected Power Systems Using TS Fuzzy Modeling by Considering Delay and Uncertainty. Energies 2022, 15, 5525. [Google Scholar] [CrossRef]
- Soliman, M.S.; Belkhier, Y.; Ullah, N.; Achour, A.; Alharbi, Y.M.; Al Alahmadi, A.A.; Abeida, H.; Khraisat, Y.S.H. Supervisory energy management of a hybrid battery/PV/tidal/wind sources integrated in DC-microgrid energy storage system. Energy Rep. 2021, 7, 7728–7740. [Google Scholar] [CrossRef]
- Al Alahmadi, A.A.; Belkhier, Y.; Ullah, N.; Abeida, H.; Soliman, M.S.; Khraisat, Y.S.H.; Alharbi, Y.M. Hybrid wind/PV/battery energy management-based intelligent non-integer control for smart DC-microgrid of smart university. IEEE Access 2021, 9, 98948–98961. [Google Scholar] [CrossRef]
- Ramachandran, R.; Madasamy, B.; Veerasamy, V.; Saravanan, L. Load frequency control of a dynamic interconnected power system using generalised Hopfield neural network based self-adaptive PID controller. IET Gener. Transm. Distrib. 2018, 12, 5713–5722. [Google Scholar] [CrossRef]
- Safari, A.; Babaei, F.; Farrokhifar, M. A load frequency control using a PSO-based ANN for micro-grids in the presence of electric vehicles. Int. J. Ambient. Energy 2021, 42, 688–700. [Google Scholar] [CrossRef]
- Yesil, E. Interval type-2 fuzzy PID load frequency controller using Big Bang-Big Crunch optimization. Appl. Soft Comput. J. 2014, 15, 100–112. [Google Scholar] [CrossRef]
- Veerasamy, V.; Wahab, N.I.A.; Ramachandran, R.; Vinayagam, A.; Othman, M.L.; Hizam, H.; Satheeshkumar, J. Automatic load frequency control of a multi-area dynamic interconnected power system using a hybrid PSO-GSA-Tuned PID controller. Sustainability 2019, 11, 6908. [Google Scholar] [CrossRef]
- Guha, D.; Roy, P.K.; Banerjee, S. Load frequency control of interconnected power system using grey Wolf optimization. Swarm Evol. Comput. 2016, 27, 97–115. [Google Scholar] [CrossRef]
- SNosratabadi, M.; Bornapour, M.; Gharaei, M.A. Grasshopper optimization algorithm for optimal load frequency control considering Predictive Functional Modified PID controller in restructured multi-resource multi-area power system with Redox Flow Battery units. Control Eng. Pract. 2018, 89, 204–227. [Google Scholar] [CrossRef]
- Rai, A.; Das, D.K. Optimal PID Controller Design by Enhanced Class Topper Optimization Algorithm for Load Frequency Control of Interconnected Power Systems. Smart Sci. 2020, 8, 125–151. [Google Scholar] [CrossRef]
- Paliwal, N.; Srivastava, L.; Pandit, M. Application of grey wolf optimization algorithm for load frequency control in multi-source single area power system. Evol. Intell. 2022, 15, 563–584. [Google Scholar] [CrossRef]
- Sobhy, M.A.; Abdelaziz, A.Y.; Hasanien, H.M.; Ezzat, M. Marine predators algorithm for load frequency control of modern interconnected power systems including renewable energy sources and energy storage units. Ain Shams Eng. J. 2021, 12, 3843–3857. [Google Scholar] [CrossRef]
- Gupta, D.K.; Jha, A.V.; Appasani, B.; Srinivasulu, A.; Bizon, N.; Thounthong, P. Load frequency control using hybrid intelligent optimization technique for multi-source power systems. Energies 2021, 14, 1581. [Google Scholar] [CrossRef]
- Wang, X.; Wang, Y.; Liu, Y. Dynamic load frequency control for high-penetration wind power considering wind turbine fatigue load. Int. J. Electr. Power Energy Syst. 2020, 117, 105696. [Google Scholar] [CrossRef]
- Yakout, A.H.; Attia, M.A.; Kotb, H. Marine Predator Algorithm based Cascaded PIDA Load Frequency Controller for Electric Power Systems with Wave Energy Conversion Systems. Alexandria Eng. J. 2021, 60, 4213–4222. [Google Scholar] [CrossRef]
- Guha, D.; Roy, P.K.; Banerjee, S. Whale optimization algorithm applied to load frequency control of a mixed power system considering nonlinearities and PLL dynamics. Energy Syst. 2020, 11, 699–728. [Google Scholar] [CrossRef]
- Hasanien, H.M.; El-Fergany, A.A. Salp swarm algorithm-based optimal load frequency control of hybrid renewable power systems with communication delay and excitation cross-coupling effect. Electr. Power Syst. Res. 2019, 176, 105938. [Google Scholar] [CrossRef]
- Lu, P.; Ye, L.; Zhao, Y.; Dai, B.; Pei, M.; Tang, Y. Review of meta-heuristic algorithms for wind power prediction: Methodologies, applications and challenges. Appl. Energy 2021, 301, 117446. [Google Scholar] [CrossRef]
- Almotairi, K.H.; Abualigah, L. Hybrid Reptile Search Algorithm and Remora Optimization Algorithm for Optimization Tasks and Data Clustering. Symmetry 2022, 14, 458. [Google Scholar] [CrossRef]
- Sundararaju, N.; Vinayagam, A.; Veerasamy, V.; Subramaniam, G. A Chaotic Search-Based Hybrid Optimization Technique for Automatic Load Frequency Control of a Renewable Energy Integrated Power System. Sustainability 2022, 14, 5668. [Google Scholar] [CrossRef]
- Pozna, C.; Precup, R.E.; Horvath, E.; Petriu, E.M. Hybrid Particle Filter-Particle Swarm Optimization Algorithm and Application to Fuzzy Controlled Servo Systems. IEEE Trans. Fuzzy Syst. 2022, 30, 4286–4297. [Google Scholar] [CrossRef]
- Sureshkumar, V.; Balasubramaniam, S.; Ravi, V.; Arunachalam, A. A hybrid optimization algorithm-based feature selection for thyroid disease classifier with rough type-2 fuzzy support vector machine. Expert Syst. 2021, 39, 137–145. [Google Scholar] [CrossRef]
- Gharehpasha, S.; Masdari, M.; Jafarian, A. Power efficient virtual machine placement in cloud data centers with a discrete and chaotic hybrid optimization algorithm. Cluster Comput. 2021, 24, 1293–1315. [Google Scholar] [CrossRef]
- Dorigo, M.; Socha, K. Ant colony optimization. In Handbook of Approximation Algorithms and Metaheuristics; Chapman and Hall/CRC: New York, NY, USA, 2007; pp. 28–39. [Google Scholar] [CrossRef]
- Zhao, W.; Zhang, Z.; Wang, L. Manta ray foraging optimization: An effective bio-inspired optimizer for engineering applications. Eng. Appl. Artif. Intell. 2018, 87, 103300. [Google Scholar] [CrossRef]
- Castelli, M.; Manzoni, L.; Mariot, L.; Nobile, M.S.; Tangherloni, A. Salp Swarm Optimization: A critical review. Expert Syst. Appl. 2021, 189, 116029. [Google Scholar] [CrossRef]
- Xue, J.; Shen, B. A novel swarm intelligence optimization approach: Sparrow search algorithm. Syst. Sci. Control Eng. 2020, 8, 22–34. [Google Scholar] [CrossRef]
- Okwu, M.O.; Tartibu, L.K. Grey Wolf Optimizer. Stud. Comput. Intell. 2014, 927, 43–52. [Google Scholar] [CrossRef]
- Yuan, J.; Zhao, Z.; Liu, Y.; He, B.; Wang, L.; Xie, B.; Gao, Y. DMPPT Control of Photovoltaic Microgrid Based on Improved Sparrow Search Algorithm. IEEE Access 2021, 9, 16623–16629. [Google Scholar] [CrossRef]
- Irudayaraj, A.X.R.; Wahab, N.I.A.; Umamaheswari, M.G.; Radzi, M.A.M.; Bin Sulaiman, N.; Veerasamy, V.; Prasanna, S.C.; Ramachandran, R. A Matignon’s theorem based stability analysis of hybrid power system for automatic load frequency control using atom search optimized FOPID controller. IEEE Access 2020, 8, 168751–168772. [Google Scholar] [CrossRef]
- Sahu, R.K.; Gorripotu, T.S.; Panda, S. A hybrid DE-PS algorithm for load frequency control under deregulated power system with UPFC and RFB. Ain Shams Eng. J. 2015, 6, 893–911. [Google Scholar] [CrossRef]
- El-Ela, A.A.A.; El-Sehiemy, R.A.; Shaheen, A.M.; Diab, A.E.G. Enhanced coyote optimizer-based cascaded load frequency controllers in multi-area power systems with renewable. Neural Comput. Appl. 2021, 33, 8459–8477. [Google Scholar] [CrossRef]
- Oshnoei, S.; Oshnoei, A.; Mosallanejad, A.; Haghjoo, F. Novel load frequency control scheme for an interconnected two-area power system including wind turbine generation and redox flow battery. Int. J. Electr. Power Energy Syst. 2021, 130, 107033. [Google Scholar] [CrossRef]
- Dhandapani, L.; Abdulkareem, P.; Muthu, R. Two-area load frequency control with redox ow battery using intelligent algorithms in a restructured scenario. Turkish J. Electr. Eng. Comput. Sci. 2018, 26, 330–346. [Google Scholar] [CrossRef]
- Sun, X.; Hu, C.; Lei, G.; Guo, Y.; Zhu, J. State feedback control for a PM hub motor based on gray Wolf optimization algorithm. IEEE Trans. Power Electron. 2020, 35, 1136–1146. [Google Scholar] [CrossRef]
- Singh, N.; Singh, S.B. A Modified Mean Gray Wolf Optimization Approach for Benchmark and Biomedical Problems. Evol. Bioinform. 2017, 13, 1176934317729413. [Google Scholar] [CrossRef] [PubMed]
- Xie, Q.; Guo, Z.; Liu, D.; Chen, Z.; Shen, Z.; Wang, X. Optimization of heliostat field distribution based on improved Gray Wolf optimization algorithm. Renew. Energy 2021, 176, 447–458. [Google Scholar] [CrossRef]
- Liu, G.; Shu, C.; Liang, Z.; Peng, B.; Cheng, L. A modified sparrow search algorithm with application in 3D route planning for UAV. Sensors 2021, 21, 1224. [Google Scholar] [CrossRef]
- Zhu, Y.; Yousefi, N. Optimal parameter identification of PEMFC stacks using Adaptive Sparrow Search Algorithm. Int. J. Hydrogen Energy 2021, 46, 9541–9552. [Google Scholar] [CrossRef]
- Veerasamy, V.; Wahab, N.I.A.; Ramachandran, R.; Othman, M.L.; Hizam, H.; Irudayaraj, A.X.R.; Guerrero, J.M.; Kumar, J.S. A Hankel Matrix Based Reduced Order Model for Stability Analysis of Hybrid Power System Using PSO-GSA Optimized Cascade PI-PD Controller for Automatic Load Frequency Control. IEEE Access 2020, 8, 71422–71446. [Google Scholar] [CrossRef]
- Idan, R.F.; Mahdi, A.J.; Wahhab, T.M.A. Optimized proportional-integral controller for a photovoltaic-virtual synchronous generator system. Int. J. Power Electron. Drive Syst. 2022, 13, 509–519. [Google Scholar] [CrossRef]


| Ref. No. | Controller Type | Optimization | Model Description | Limitations |
|---|---|---|---|---|
| [16] | PID | GWO | Two-area thermal system | GRC, GDB, and BD nonlinearities in thermal systems and RER have not been considered in this work. The most significant limitation of this optimization technique is trapping in local optimal points |
| [17] | PFMPID | GOA | Three-area multi-source power system comprises thermal, hydro, wind, diesel, and RFB with GDB and GRC | BD has not been considered in this study. Moreover, the GOA optimization search process begins with a population or flock of grasshoppers whose locations are comparable to design vectors which leads to poor exploration |
| [18] | PID | CTO | Two-area multi-source with thermal, hydro, and gas units in each area | Non-conventional power resources have not been considered in this study. The CTO algorithm has the drawback of a greater number of parameters to be initialized |
| [19] | PID | GWO | Single area multi-source power system comprises thermal, hydro, and gas units | RER has not been considered, and the limitation of GWO is that poor exploration leads to trapping in local optimal points |
| [15] | PID | Hybrid PSO-GSA | Considering a two-area thermal system with GRC and GDB | For a highly nonlinear and big dimensional system such as ALFC, PSO exhibits poor exploration and takes longer to find global minima. The PSO-GSA approach overcomes this, although the study considered only a conventional source |
| [20] | PID | MPA | Two-area multi-source systems were taken into consideration, with WTPG, STPP, BES, and thermal plants in area 2 as well as STPP, PV, SMES, and thermal power plants combining GDB and GRC in area 1, and a reheat generator with wind and PV RERs in area 2. GRC has been considered in the two-area | MPA’s main drawback is a slow convergence rate with poor exploration ability |
| [21] | PID | HIO | Two-area reheat turbine power plant with gas and hydro units in each area | RER has not been considered in this study |
| [22] | PID | DE | Two-area multi-source with hydro, thermal, and wind power plants in each area | Nonlinearities are not considered. The limitation of DE is inapplicable to solving many complex real-world problems in continuous domains |
| [23] | PIDA | MPA | Two-area non-reheat thermal system | This study has not considered RER, GRC, BD, or GDB |
| [24] | PID | WOA | Two-area reheat thermal system | Nonlinearities are not considered. The limitation of WOA is that whales are drawn to the coefficient vector during the later phases of WOA iteration convergence, and as a result, the whole whale population quickly enters the local optimum for the high-dimensional optimization problem |
| [25] | PID | SSO | Two-area thermal system with GRC and GDB considered with the wind power plant in both the areas | The drawback of SSO is that the update rule fails when one of the dimensions has a lower bound other than zero |
| Function Name | Type | Formula | Dimension (d) | Range | |
|---|---|---|---|---|---|
| Sphere | F1 | US | 30 | [−100, 100] | |
| Schwefel 2.21 | F2 | US | 30 | [−100, 100] | |
| Schwefel 2.22 | F3 | UN | 30 | [−10, 10] | |
| Rosenbrock | F4 | UN | 30 | [−30, 30] | |
| Rastrigin | F5 | MS | 30 | [−5.12, 5.12] | |
| Ackley | F6 | MN | 30 | [−32, 32] |
| Function | Index | SSAGWO | SSA | GWO |
|---|---|---|---|---|
| F1 | Best | 2.2339 × 10⁻³¹ | 2.7901 × 10⁻²³ | 42.0302 |
| SD | 3.3466 × 10⁻¹⁷ | 1.8513 × 10⁻¹⁹ | 10.11 | |
| Mean | 1.0642 × 10⁻¹⁷ | 6.6255 × 10⁻²⁰ | 19.9949 | |
| Min | 0 | 2.4457 × 10−47 | 8.9247 | |
| F2 | Best | 5.1938 × 10⁻¹³ | 8.0550 × 10⁻¹² | 22.7455 |
| SD | 1.0443 × 10⁻¹⁰ | 2.2659 × 10⁻¹⁰ | 3.9943 | |
| Mean | 3.7025 × 10⁻¹¹ | 7.8765 × 10⁻¹¹ | 9.4191 | |
| Min | 1.6096 × 10−80 | 4.3857 × 10−55 | 5.3553 | |
| F3 | Best | 3.6567 × 10⁻¹³ | 1.6810 × 10⁻¹¹ | 1.4005 |
| SD | 4.9149 × 10−09 | 6.1537 × 10⁻¹⁰ | 0.3749 | |
| Mean | 1.7859 × 10−09 | 3.9256 × 10⁻¹⁰ | 1.3875 | |
| Min | 8.6574 × 10−58 | 1.2831 × 10⁻²⁴ | 0.7203 | |
| F4 | Best | 2.8199 × 10⁻⁴ | 2.7812 × 10⁻² | 548.2237 |
| SD | 1.873 × 10⁻¹ | 4.97 × 10⁻² | 492.196 | |
| Mean | 1.113 × 10⁻¹ | 5.28 × 10⁻² | 963.3173 | |
| Min | 2 × 10⁻⁴ | 9.3 × 10⁻³ | 435.8798 | |
| F5 | Best | 0 | 0 | 76.6652 |
| SD | 0 | 0 | 14.1344 | |
| Mean | 0 | 0 | 61.2244 | |
| Min | 0 | 0 | 36.401 | |
| F6 | Best | 8.8818 × 10⁻¹⁶ | 8.8818 × 10⁻¹⁶ | 2.4941 |
| SD | 8.5631 × 10⁻¹¹ | 7.1236 × 10⁻¹⁰ | 0.6564 | |
| Mean | 4.7806 × 10⁻¹¹ | 3.0156 × 10⁻¹⁰ | 3.0160 | |
| Min | 8.8817 × 10⁻¹⁶ | 8.8817 × 10⁻¹⁶ | 1.3413 |
| Optimization Technique | Controller Effort | ST (s) | RT (s) | Undershoot | Steady-State Error |
|---|---|---|---|---|---|
| ∆f1 | |||||
| Z–N | 10.03 × 10⁻² | 15.5747 | 1.3000 × 10⁻³ | −1.85 × 10⁻² | −2.416 × 10⁻⁴ |
| PSO | 7.31 × 10⁻² | 15.1049 | 8.9766 × 10⁻⁴ | −1.69 × 10⁻² | −1.678 × 10⁻⁴ |
| GWO | 12.32 × 10⁻² | 13.6758 | 7.3107 × 10⁻⁴ | −1.82 × 10⁻² | −1.367 × 10⁻⁴ |
| SSA | 6.60 × 10⁻² | 13.4111 | 5.9055 × 10⁻⁴ | −1.69 × 10⁻² | −1.105 × 10⁻⁴ |
| SSAGWO | 5.95 × 10⁻² | 3.8834 | 1.9259 × 10⁻⁴ | −1.68 × 10⁻² | −3.608 × 10⁻⁵ |
| ∆f2 | |||||
| Z–N | 7.14 × 10⁻² | 16.7079 | 1.8 × 10⁻³ | −1.23 × 10⁻² | −2.366 × 10⁻⁴ |
| PSO | 7.14 × 10⁻² | 16.1989 | 1.3 × 10⁻³ | −1.14 × 10⁻² | −1.643 × 10⁻⁴ |
| GWO | 6.24 × 10⁻² | 15.1067 | 1.0 × 10⁻³ | −1.22 × 10⁻² | −1.337 × 10⁻⁴ |
| SSA | 6.02 × 10⁻² | 14.7612 | 8.2627 × 10⁻⁴ | −1.14 × 10⁻² | −1.081 × 10⁻⁴ |
| SSAGWO | 5.18 × 10⁻² | 9.9788 | 2.6857 × 10⁻⁴ | −1.13 × 10⁻² | −3.521 × 10⁻⁵ |
| ∆Ptie | |||||
| Z–N | 6.6906 × 10⁻⁴ | 13.6500 | 2.957 × 10⁻¹ | −1.2 × 10⁻³ | 10.035 × 10⁻⁶ |
| PSO | 5.5430 × 10⁻⁴ | 14.0710 | 4.0090 | −0.8 × 10⁻³ | 7.325 × 10⁻⁶ |
| GWO | 3.4650 × 10⁻⁴ | 11.5746 | 5.7 × 10⁻³ | −1.1 × 10⁻³ | 6.509 × 10⁻⁶ |
| SSA | 5.3688 × 10⁻⁴ | 12.0433 | 2.87 × 10⁻² | −0.8 × 10⁻³ | 5.096 × 10⁻⁶ |
| SSAGWO | 1.1460 × 10⁻⁴ | 4.9285 | 2.0 × 10⁻³ | −0.7 × 10⁻³ | 1.912 × 10⁻⁶ |
| Performance Index | ∆f1 | ||||
|---|---|---|---|---|---|
| Z–N | PSO | GWO | SSA | SSAGWO | |
| ITAE | 22.81 × 10⁻² | 20.45 × 10⁻² | 14.77 × 10⁻² | 13.860 × 10⁻² | 4.978 × 10⁻² |
| IAE | 5.787 × 10⁻² | 4.785 × 10⁻² | 4.296 × 10⁻² | 3.625 × 10⁻² | 2.193 × 10⁻² |
| ITSE | 9.9 × 10⁻⁴ | 8.1 × 10⁻⁴ | 5 × 10⁻⁴ | 4.4 × 10⁻⁴ | 1.3 × 10⁻⁴ |
| ISE | 5 × 10⁻⁴ | 3.4 × 10⁻⁴ | 3.4 × 10⁻⁴ | 2.3 × 10⁻⁴ | 1.6 × 10⁻⁴ |
| Performance Index | ∆f2 | ||||
| Z–N | PSO | GWO | SSA | SSAGWO | |
| ITAE | 22.22 × 10⁻² | 20.070 × 10⁻² | 14.4 × 10⁻² | 13.64 × 10⁻² | 4.845 × 10⁻² |
| IAE | 5.236 × 10⁻² | 4.425 × 10⁻² | 3.816 × 10⁻² | 3.322 × 10⁻² | 1.862 × 10⁻² |
| ITSE | 8.9 × 10⁻⁴ | 7.5 × 10⁻⁴ | 4.3 × 10⁻⁴ | 4 × 10⁻⁴ | 1 × 10⁻⁴ |
| ISE | 3.8 × 10⁻⁴ | 2.7 × 10⁻⁴ | 2.3 × 10⁻⁴ | 1.7 × 10⁻⁴ | 0.997 × 10⁻⁴ |
| Optimization Technique | Controller Effort | ST (s) | RT (s) | Undershoot | Steady-State Error |
|---|---|---|---|---|---|
| ∆f1 | |||||
| Z–N | 14.71 × 10⁻² | 15.5119 | 12.000 × 10⁻⁴ | −1.84 × 10⁻² | −2.296 × 10⁻⁴ |
| PSO | 17.09 × 10⁻² | 14.4838 | 8.8905 × 10⁻⁴ | −1.84 × 10⁻² | −1.661 × 10⁻⁴ |
| GWO | 19.04 × 10⁻² | 13.5912 | 6.9661 × 10⁻⁴ | −1.83 × 10⁻² | −1.303 × 10⁻⁴ |
| SSA | 20.49 × 10⁻² | 12.7962 | 5.7231 × 10⁻⁴ | −1.83 × 10⁻² | −1.071 × 10⁻⁴ |
| SSAGWO | 8.060 × 10⁻² | 3.73260 | 1.7247 × 10⁻⁴ | −1.69 × 10⁻² | −3.231 × 10⁻⁵ |
| ∆f2 | |||||
| Z–N | 8.96 × 10⁻² | 16.7318 | 17.000 × 10⁻⁴ | −1.16 × 10⁻² | −2.264 × 10⁻⁴ |
| PSO | 9.55 × 10⁻² | 15.9302 | 13.000 × 10⁻⁴ | −1.16 × 10⁻² | −1.637 × 10⁻⁴ |
| GWO | 10.32 × 10⁻² | 15.1767 | 9.8148 × 10⁻⁴ | −1.16 × 10⁻² | −1.283 × 10⁻⁴ |
| SSA | 11.09 × 10⁻² | 14.4961 | 8.0590 × 10⁻⁴ | −1.16 × 10⁻² | −1.054 × 10⁻⁴ |
| SSAGWO | 5.19 × 10⁻² | 9.69000 | 2.4235 × 10⁻⁴ | −1.09 × 10⁻² | −3.178 × 10⁻⁵ |
| ∆Ptie | |||||
| Z–N | 6.8776 × 10⁻⁴ | 12.0385 | 6.85 × 10⁻² | −1.5 × 10⁻³ | 6.506 × 10⁻⁶ |
| PSO | 6.9817 × 10⁻⁴ | 11.2029 | 81.85 × 10⁻² | −1.3 × 10⁻³ | 5.092 × 10⁻⁶ |
| GWO | 8.2955 × 10⁻⁴ | 10.5142 | 7.3 × 10⁻³ | −1.3 × 10⁻³ | 4.183 × 10⁻⁶ |
| SSA | 17.000 × 10⁻⁴ | 9.7186 | 10.9 × 10⁻³ | −1.2 × 10⁻³ | 3.547 × 10⁻⁶ |
| SSAGWO | 6.1746 × 10⁻⁴ | 6.4993 | 3.6 × 10⁻³ | −0.8 × 10⁻³ | 1.167 × 10⁻⁶ |
| Performance Index | ∆f1 | ||||
|---|---|---|---|---|---|
| Z–N | PSO | GWO | SSA | SSAGWO | |
| ITAE | 22.71 × 10⁻² | 17.88 × 10⁻² | 14.71 × 10⁻² | 12.45 × 10⁻² | 4.658 × 10⁻² |
| IAE | 5.845 × 10⁻² | 4.97 × 10⁻² | 4.356 × 10⁻² | 3.899 × 10⁻² | 2.069 × 10⁻² |
| ITSE | 10.1 × 10⁻⁴ | 7 × 10⁻⁴ | 5.3 × 10⁻⁴ | 4.3 × 10⁻⁴ | 1.1 × 10⁻⁴ |
| ISE | 5.2 × 10⁻⁴ | 4.2 × 10⁻⁴ | 3.6 × 10⁻⁴ | 3.3 × 10⁻⁴ | 1.4 × 10⁻⁴ |
| Performance Index | ∆f2 | ||||
| Z–N | PSO | GWO | SSA | SSAGWO | |
| ITAE | 21.72 × 10⁻² | 17.07 × 10⁻² | 14.03 × 10⁻² | 11.91 × 10⁻² | 4.393 × 10⁻² |
| IAE | 5.146 × 10⁻² | 4.32 × 10⁻² | 3.747 × 10⁻² | 3.33 × 10⁻² | 1.679 × 10⁻² |
| ITSE | 8.5 × 10⁻⁴ | 5.7 × 10⁻⁴ | 4.1 × 10⁻⁴ | 3.1 × 10⁻⁴ | 0.801 × 10⁻⁴ |
| ISE | 3.7 × 10⁻⁴ | 2.8 × 10⁻⁴ | 2.2 × 10⁻⁴ | 1.9 × 10⁻⁴ | 0.792 × 10⁻⁴ |
| Optimization Technique | Controller Effort | ST (s) | RT (s) | Undershoot | Steady-State Error |
|---|---|---|---|---|---|
| ∆f1 | |||||
| Z–N | 12.84 × 10⁻² | 15.5405 | 13.000 × 10⁻⁴ | −1.91 × 10⁻² | −2.5010 × 10⁻⁴ |
| PSO | 14.98 × 10⁻² | 14.5127 | 9.6740 × 10⁻⁴ | −1.90 × 10⁻² | −1.8080 × 10⁻⁴ |
| GWO | 17.32 × 10⁻² | 13.5950 | 7.5658 × 10⁻⁴ | −1.90 × 10⁻² | −1.4150 × 10⁻⁴ |
| SSA | 12.73 × 10⁻² | 12.7563 | 6.2227 × 10⁻⁴ | −1.89 × 10⁻² | −1.1640 × 10⁻⁴ |
| SSAGWO | 10.25 × 10⁻² | 3.8229 | 1.5464 × 10⁻⁴ | −1.75 × 10⁻² | −0.2898 × 10⁻⁴ |
| ∆f2 | |||||
| Z–N | 8.55 × 10⁻² | 16.7930 | 19 × 10−4 | −1.22 × 10⁻² | −2.469 × 10⁻⁴ |
| PSO | 7.93 × 10⁻² | 15.9452 | 14 × 10−4 | −1.22 × 10⁻² | −1.783 × 10⁻⁴ |
| GWO | 8.88 × 10⁻² | 15.1851 | 11 × 10−4 | −1.22 × 10⁻² | −1.395 × 10⁻⁴ |
| SSA | 9.99 × 10⁻² | 14.5028 | 8.7753 × 10⁻⁴ | −1.22 × 10⁻² | −1.148 × 10⁻⁴ |
| SSAGWO | 6.48 × 10⁻² | 8.8496 | 2.1741 × 10⁻⁴ | −1.06 × 10⁻² | −0.285 × 10⁻⁴ |
| ∆Ptie | |||||
| Z–N | 7.2857 × 10⁻⁴ | 12.0973 | 58.7 × 10⁻³ | −15 × 10−4 | 6.501 × 10⁻⁶ |
| PSO | 6.2357 × 10⁻⁴ | 11.2433 | 34.6 × 10⁻³ | −14 × 10−4 | 5.083 × 10⁻⁶ |
| GWO | 8.4564 × 10⁻⁴ | 10.5482 | 7.9 × 10⁻³ | −13 × 10−4 | 4.173 × 10⁻⁶ |
| SSA | 5.4 × 10⁻⁴ | 9.9408 | 9.1 × 10⁻³ | −12 × 10−4 | 3.536 × 10⁻⁶ |
| SSAGWO | 1.7 × 10⁻⁴ | 3.8952 | 3.2793 × 10⁻³ | −9 × 10⁻⁴ | 1.022 × 10⁻⁶ |
| Performance Index | ∆f1 | ||||
|---|---|---|---|---|---|
| Z–N | PSO | GWO | SSA | SSAGWO | |
| ITAE | 23.42 × 10⁻² | 18.45 × 10⁻² | 15.17 × 10⁻² | 12.87 × 10⁻² | 3.995 × 10⁻² |
| IAE | 5.882 × 10⁻² | 5.01 × 10⁻² | 4.401 × 10⁻² | 3.947 × 10⁻² | 1.978 × 10⁻² |
| ITSE | 10.3 × 10⁻⁴ | 7.1 × 10⁻⁴ | 5.3 × 10⁻⁴ | 4.3 × 10⁻⁴ | 1.1 × 10⁻⁴ |
| ISE | 5.1 × 10⁻⁴ | 4.1 × 10⁻⁴ | 3.5 × 10⁻⁴ | 3.2 × 10⁻⁴ | 1.6 × 10⁻⁴ |
| Performance Index | ∆f2 | ||||
| Z–N | PSO | GWO | SSA | SSAGWO | |
| ITAE | 22.43 × 10⁻² | 17.65 × 10⁻² | 14.51 × 10⁻² | 12.29 × 10⁻² | 3.749 × 10⁻² |
| IAE | 5.18 × 10⁻² | 4.357 × 10⁻² | 3.787 × 10⁻² | 3.366 × 10⁻² | 1.524 × 10⁻² |
| ITSE | 8.7 × 10⁻⁴ | 5.9 × 10⁻⁴ | 4.2 × 10⁻⁴ | 3.2 × 10⁻⁴ | 0.671 × 10⁻⁴ |
| ISE | 3.6 × 10⁻⁴ | 2.7 × 10⁻⁴ | 2.2 × 10⁻⁴ | 1.8 × 10⁻⁴ | 0.731 × 10⁻⁴ |
Disclaimer/Publisher’s Note: The statements, opinions and data contained in all publications are solely those of the individual author(s) and contributor(s) and not of MDPI and/or the editor(s). MDPI and/or the editor(s) disclaim responsibility for any injury to people or property resulting from any ideas, methods, instructions or products referred to in the content. |
© 2023 by the authors. Licensee MDPI, Basel, Switzerland. This article is an open access article distributed under the terms and conditions of the Creative Commons Attribution (CC BY) license (https://creativecommons.org/licenses/by/4.0/).
Share and Cite
Fadheel, B.A.; Wahab, N.I.A.; Mahdi, A.J.; Premkumar, M.; Radzi, M.A.B.M.; Soh, A.B.C.; Veerasamy, V.; Irudayaraj, A.X.R. A Hybrid Grey Wolf Assisted-Sparrow Search Algorithm for Frequency Control of RE Integrated System. Energies 2023, 16, 1177. https://doi.org/10.3390/en16031177
Fadheel BA, Wahab NIA, Mahdi AJ, Premkumar M, Radzi MABM, Soh ABC, Veerasamy V, Irudayaraj AXR. A Hybrid Grey Wolf Assisted-Sparrow Search Algorithm for Frequency Control of RE Integrated System. Energies. 2023; 16(3):1177. https://doi.org/10.3390/en16031177
Chicago/Turabian StyleFadheel, Bashar Abbas, Noor Izzri Abdul Wahab, Ali Jafer Mahdi, Manoharan Premkumar, Mohd Amran Bin Mohd Radzi, Azura Binti Che Soh, Veerapandiyan Veerasamy, and Andrew Xavier Raj Irudayaraj. 2023. "A Hybrid Grey Wolf Assisted-Sparrow Search Algorithm for Frequency Control of RE Integrated System" Energies 16, no. 3: 1177. https://doi.org/10.3390/en16031177
APA StyleFadheel, B. A., Wahab, N. I. A., Mahdi, A. J., Premkumar, M., Radzi, M. A. B. M., Soh, A. B. C., Veerasamy, V., & Irudayaraj, A. X. R. (2023). A Hybrid Grey Wolf Assisted-Sparrow Search Algorithm for Frequency Control of RE Integrated System. Energies, 16(3), 1177. https://doi.org/10.3390/en16031177