Abstract
The paper presents the performance evaluation of the DELFI (Deep Learning for False voltage dip Identification) classifier for evaluating voltage dip validity, now available in the QuEEN monitoring system. In addition to the usual event characteristics, QuEEN now automatically classifies events in terms of validity based on criteria that make use of either a signal processing technique (current criterion) or an artificial intelligence algorithm (new criterion called DELFI). Some preliminary results obtained from the new criterion had suggested its full integration into the monitoring system. This paper deals with the comparison of the effectiveness of the DELFI criterion compared to the current one in evaluating the events validity, starting from a large set of events. To prove the enhancement achieved with the DELFI classifier, an in-depth analysis has been carried out by cross-comparing the results both with the neutral system configuration and with the events characteristics (duration/residual voltage). The results clearly show a better match of DELFI classifications with network and events characteristics. Moreover, the DELFI classifier has allowed us to highlight specific situations concerning power quality at regional level, resolving the uncertainties due to the current validity criterion. In details, three groups of regions can be highlighted with respect to the frequency of the occurrence of false events.
1. Introduction
The adoption of power quality (PQ) monitoring systems is increasingly required to help the operation of electrical systems involving renewable energy power plants, power electronic devices and plug-in electrical vehicle charging stations, all possible sources of disturbance of the voltage quality [1,2,3,4,5,6,7]. PQ monitoring in low-voltage (LV), medium-voltage (MV) and high-voltage (HV) networks is carried out based on the standard EN50160 [8] which in its evolution will increasingly provide for the need to consider networks operating at higher voltage together with higher-frequency disturbances. Monitoring the medium-voltage distribution network is particularly useful for assessing the PQ impacts of the complex PQ environment, created by the increased integration of distributed generation, on customers and their commonly used devices. Among the various disturbances monitored at this voltage level, voltage dips (VD) represent the first step in going beyond the regulation of service continuity [9,10,11,12,13,14,15,16] because of the adverse effects they may have on the operation of both manufacturing facilities [17,18,19,20] and communication devices [21]. In this regard, in 2006 RSE developed, for research purposes, the QuEEN (Qualità dell’Energia Elettrica) monitoring system of the Italian MV distribution grid (10% distribution network monitored) with the support of the Italian regulatory authority and with funding from the Research Fund for the Italian Electrical System [22]. In the QuEEN system, attention was therefore immediately focused on VDs and on the need to find criteria to evaluate both their validity and origin, in addition to the other characteristics (duration and residual voltage) computed according to the standard EN 50160 [8]. These new aspects, which are currently not covered by the standard [8], immediately appeared relevant in consideration of the need to divide the responsibilities for the occurrence of voltage dips between the DSO and the TSO (VD origin) and not to attribute non-existent disturbances to the DSO (VD validity). In this regard, the research first elaborated some criteria (current criteria) for evaluating both the validity (2nd Harmonic Criterion) [23] and the origin (Global Method) [24] of the events based on signal processing and correlation techniques, both criteria implemented in the QuEEN system.
While these criteria have demonstrated good efficacy over the years, they nevertheless have some limitations. Regarding the criterion for evaluating the validity of events, if over the years it has confirmed that this has an efficacy of 87%, it is also true that in some cases, named undefined, it is not able to identify the event type (true or false). As for the Global Method, it requires extensive monitoring systems. To go beyond the limits of the currently used methods, RSE has developed new solutions for solving validity and origin assessments based on the new artificial intelligence (AI) techniques increasingly applied to PQ issues [25,26,27]. We are talking about the application of DELFI (DEep Learning for False voltage dips Identification) to assess VD validity [28,29] and the application of FExWaveS (Features Extraction from Waveform Segmentation) to assess VD origin, as has already been described in more detail in [30,31]. In [32,33], the comparison of the DELFI criterion with the current one at national, macro-area and regional levels was presented.
In this last paper, wanting to evaluate the effectiveness between the VD validity criteria, for the first time, the outcomes of the two methods were cross-checked with both some network configuration data and with the VD characteristics. In fact, in order to compare the results of two criteria applied to a given dataset it would be necessary to know the exact “answer”. Since the trip data of the MV line protections are not available, the proposed solution correlates the outcomes of the criteria, both to the neutral system operational connection and to the duration and residual voltage of the events, referring to some particular regional situation. After showing the better effectiveness of the DELFI criterion, its use has allowed researchers to highlight different PQ situation at regional levels according to the neutral configuration of the network.
The structure of the paper is as follows: Section 2 summarizes the characteristics of the QuEEN monitoring system. Section 3 briefly recalls why false voltage dips are generated in isolated neutral networks while Section 4 summarizes the main features of the algorithms used by the current and new criteria to assess VD validity. In Section 5, an in-depth comparison of the effectiveness of the criteria at both global and regional levels is conducted. In Section 6, the final conclusions are drawn.
2. Voltage Dips Monitoring: The QuEEN System
The QuEEN system is a distributed measurement system developed by RSE since 2006 for monitoring the power quality throughout MV distribution networks in Italy [22]. This system is made up of nearby 400 measurements units (MUs) (~11% of the distribution grid busbars) installed at the MV busbars of a set of monitored primary substations (PSs) and directly connected to the low-voltage side of the phase-to-ground voltage transformers (VTs) already existing there. Each MU is a PQ meter, compliant with the international standard IEC 61000-4-30 [34] which monitors both single voltage events (interruptions, dips, swells, rapid variations) and voltage variations (unbalance, flicker, harmonics). In Figure 1, the architecture of the QuEEN system has been shown.
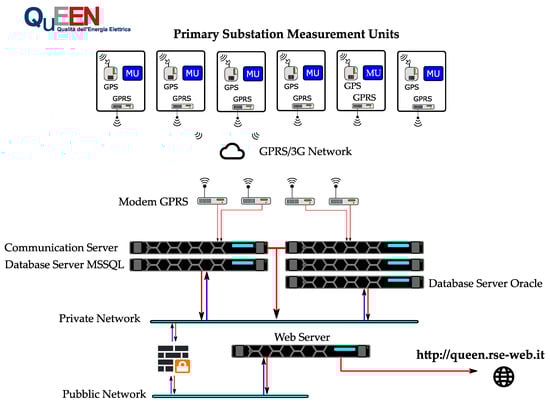
Figure 1.
QuEEN system architecture.
The data recorded by the MUs are sent through a GPRS/3G network to the QuEEN databases located in RSE. Each DSO is enabled to read all the PQ information coming from its PSs on the QuEEN website [35], visible at the bottom right in Figure 1. On the other hand, aggregated PQ statistics are publicly available to all users.
Focusing on voltage dips, the MUs identify them according to the IEC 61000-4-30 standard [34] by calculating the root mean square value (RMS) of the three line-to-line voltages for each cycle and updating them every half-cycle. The event starts when at least one line-to-line voltage RMS drops below 90% of the rated voltage and ends when all the three line-to-line voltages rise above 90% plus a hysteresis (typically 2% of the rated voltage). Both the residual voltage and the duration of the event are then automatically computed while its origin and validity are estimated by the different criteria mentioned in the introduction, namely the 2nd Harmonic Criterion and the DELFI for validity assessment, the Global Method and the FExWaveS for the evaluation of the origin, some of which are active only in the updated version of the QuEEN website (DELFI and FExWaveS). In this regard, each MU acquires and saves the event waveforms and RMS sequences for each acquired channel to provide input data to the most innovative of these criteria.
Finally, it is worth remembering that the aim that drives the genesis of the QuEEN project was to provide a basic knowledge of the current quality level of the distribution grid in Italy [36] and to enable relevant regulatory actions in the interest of consumers.
Additionally, following the experience gained with the QuEEN system in monitoring voltage dips, in 2012, the Italian Regulatory Authority for Energy, Networks, and Environment (ARERA—Autorità di Regolazione per Energia, Reti e Ambiente) asked the DSOs to implement their own voltage dips monitoring systems [37] involving all their PSs and related MV busbars. This gave rise to the DSOs National Monitoring System, whose functional specifications were written just starting from the QuEEN monitoring experience.
At the end of 2021, a step forward was made regarding the number of severe voltage dips occurring in the Italian MV distribution network. In fact, since the end of December 2021, ARERA has made the first comparative 2020 statistic for the severe events recorded by the DSOs National Monitoring System available on its website [38,39].
3. Voltage Dips Validity in Isolated and Compensated Network
Italian MV distribution systems have two main neutral configuration topologies: isolated neutral and compensated neutral. In the primary substations, the voltage measurements are carried out by means of phase-to-ground transformer measuring devices. In an isolated neutral network configuration, ground faults can generate a homopolar sinusoidal voltage whose amplitude depends on the type, position and resistance of the fault. Once the fault is extinguished, the homopolar component decays with a transient depending on the neutral to earth connection type. In isolated neutral networks, the phenomena previously described can cause saturation of the magnetic core of the VTs with a consequent reduction of the electromagnetic force induced on the secondary winding, to which the measuring devices of the QuEEN system are connected. This produces a reduction in the measured phase-to-phase voltages, leading to a “false” voltage dip (F) which must be identified and therefore eliminated from the voltage dip statistics.
In the next section, in order to characterize the phenomenon well, simulations were performed on a simplified network in both isolated and compensated neutral configurations in an ATP environment (Alternative Transient Program). The extinction of a single-phase-to-ground fault was performed. The typical characteristics of false voltage dips are analyzed.
Extinction of a Single Phase-to-Ground Fault
Simulations were performed considering a simplified scheme of a distribution network whose circuit is reported in Figure 2. The HV grid is modelled with the Thevenin equivalent circuit, with ZS impedance computed from the short circuit power PSC assumed to be equal to 4600 MVA and nominal voltage VS equal to 132 kV. The primary substation transformer is a YY 132 kV/20 kV transformer with an accessible neutral at which the Petersen coil can be connected through the switch SC. The coil is modelled with an equivalent circuit composed by the inductance LC = 281 mH, the parallel resistor RP = 460 Ω and the smoothing series resistance RS = 1.8 mΩ. Three lines are connected from the MV busbar, modelled with the π-type equivalent circuit, with an assumed equivalent capacitance CL equal to 6 μF per phase. Each line has a load of 6 MVA with a power factor of 0.9. The loads were neglected to highlight the short circuit assumptions during a single line-to-ground fault. The fault resistance is assumed to be 0.5 Ω. Each line is equipped with an ideal switch, controlled by a trip signal that opens the circuit at the current zero crossing.
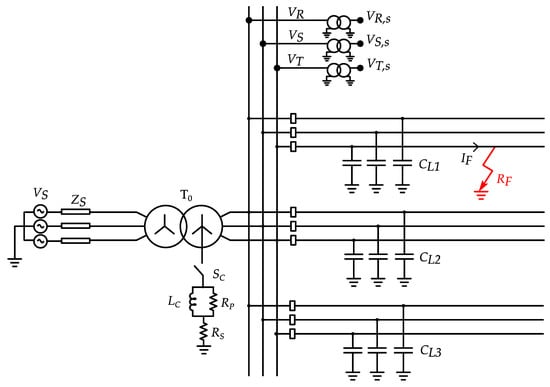
Figure 2.
Simplified schematic simulation circuit.
At the MV busbar, the voltages are measured by means of three phase-to-ground VT whose equivalent circuit is reported in Figure 3. and whose parameters are listed in Table 1:
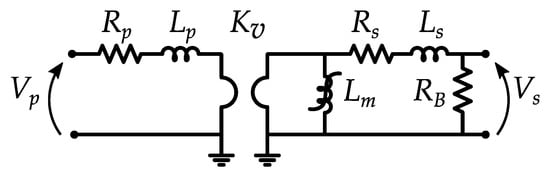
Figure 3.
Voltage transformer equivalent circuit.

Table 1.
Voltage transformer equivalent circuit parameters.
Moreover, the magnetizing current–linkage flux characteristic of the inductance Lm is reported in Figure 4. Hysteresis phenomena and iron losses were neglected.
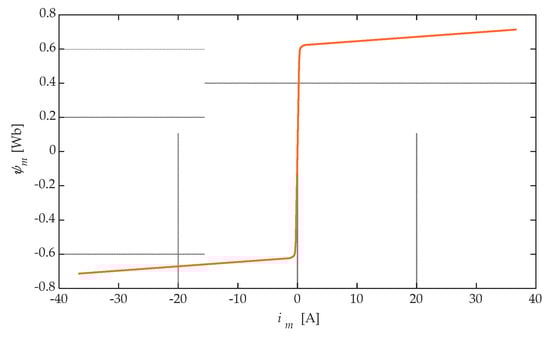
Figure 4.
Voltage transformer magnetizing current vs linkage flux characteristic of the inductance Lm.
Simulations were performed considering: (i) a single-phase-to-ground fault occurring at t = 0.180 s on the line L1 and phase T; (ii) the protection sending the trip signal to the corresponding circuit breaker after 440 ms, namely for t = 0.620 s. The sampling time and the time window were set, respectively to 2.5 μs and 1.5 s. The fault analysis was repeated considering two cases:
- Case 1: SC closed—compensated neutral (CN) system;
- Case 2: SC open—isolated neutral (IN) system.
For both the considered cases, the simulation results were reported in terms of:
- Faulted line currents (IR, F, IS, F, IT, F);
- Line-to-line voltages (VRS, s, VST, s, VTR, s) computed from the VTs secondary side phase to ground voltages (VR, s, VS, s, VT, s);
- Line-to-line voltages at MV busbar (VRS, VST, VTR);
- Homopolar voltage (V0).
From a theoretical point of view a single-phase-to-ground fault does not affect the line-to-line network voltages, since only the star centre of the system is involved during the fault stages. In fact, homopolar voltage components are established due to fault type. As is well known, in case of no-fault resistance, the affected phase voltage goes to zero while the homopolar voltage is equal to the steady state phase voltage. The value of the fault current depends on the system neutral connection, as well as the transient established when the fault has been cleared.
We begin by considering the results for Case 1, shown in Figure 5. After the transient, the fault current reaches the steady state values of nearing RMS values of 50 A. After 440 ms, the ideal switch opens the faulty line. At the first zero crossing for each phase, the current is extinguished. Considering the homopolar voltage, the decay is a damped sinusoid at the resonance frequency close to the fundamental one. During each fault and its extinction, both the ideal busbar line-to-line voltages (VRS, VST, VTR) and the relative transduced voltages (VRS, s, VST, s, VTR, s) do not show any variations.
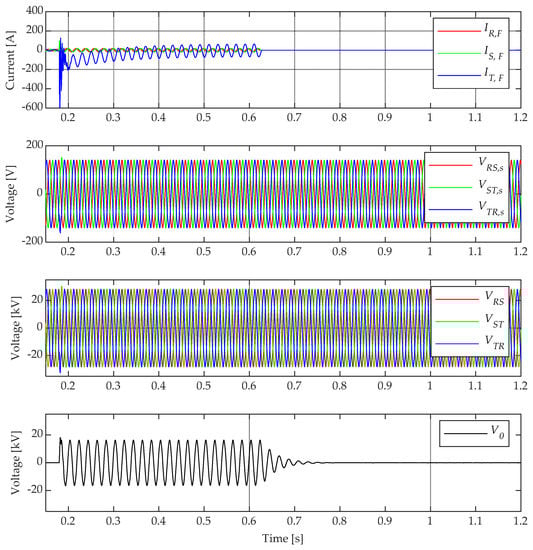
Figure 5.
Case 1 (CN system) simulation results, from top to bottom: faulted line currents, line-to-line voltages at the secondary of the VT, line-to-line voltages at the MV busbar, homopolar voltage.
Now, let us consider results for Case 2, whose current and voltage results are reported in Figure 6. Compared to Case 1, it can be highlighted that the higher RMS values of the fault current are equal to about 166 A. As in the previous case, the ideal switch opens the fault after a time delay set of 440 ms. At the opening of the switch, the homopolar voltage is not a damped sinusoidal transient but exponential, a fact which causes a low oscillation of the homopolar component that can produce a saturation of the iron core of the VTs. The saturation gives rise to a reduction in the electromagnetic force of the duration of about 90 ms on the secondary side of the VT so that a “false voltage dip” is recorded. This is evident by looking at the differences between the ideal busbar line-to-line voltages (VRS, VST, VTR) and the transduced ones (VRS, s, VST, s, VTR, s). By zooming in on the output voltages of the VTs (Figure 7), the “false” voltage dip, caused by saturation characterized by an asymmetrical waveform due to distortion phenomena, is evident.
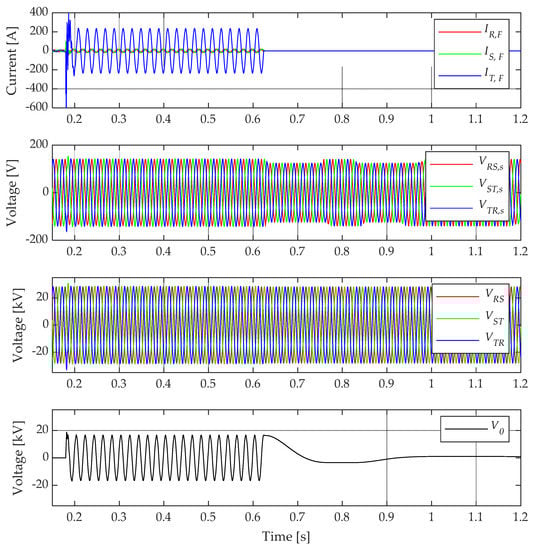
Figure 6.
Case 2 (IN system) simulation results, from top to bottom: faulted line currents, line-to-line voltages at the secondary of the VT, line-to-line voltages at the MV busbar, homopolar voltage.
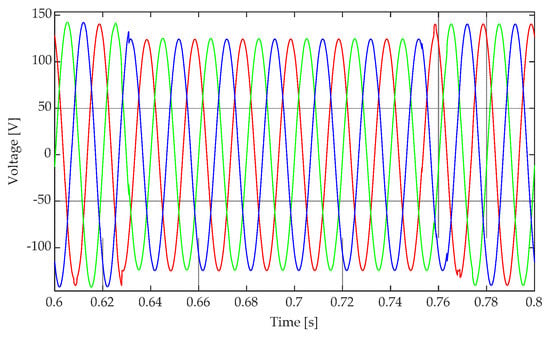
Figure 7.
Line-to-line voltage waveform: typical dip due to VT saturation.
For these reasons, from a theoretical point of view, the “false dip” can occur in IN systems and not in CN ones.
4. Voltage Dip Validity Assessment: Current and New Criteria
The previous section looked at why a false voltage dip can occur. As already explained, this kind of event must be removed from a monitoring system’s PQ statistics according to some criteria. In the next section, the current and new criteria, developed and integrated into the QuEEN system, were briefly explained. The limitations of the current criterion and the opportunities given by the new criterion were highlighted.
4.1. 2nd Harmonic Criterion
The 2nd Harmonic Criterion was the original algorithm implemented in each MU of the QuEEN system to correctly identify false events and remove them from the statistics (current criterion for VDs validity assessment). The algorithm, developed in collaboration with the Politecnico di Torino [23], is based on the measurement of the 2nd harmonic component in the VTs outputs: the estimation of this component is performed on a time window of 20 ms, which is updated every 10 ms. Once the component has been estimated, the following conditions are independently checked on all three line-to-line voltages acquired:
- the occurrence of an exceeding of the second harmonic threshold (fixed at a given percentage of the effective value);
- the occurrence of a minimum number of consecutive overruns of the second harmonic threshold.
The setting parameters of the algorithm were chosen after a laboratory measurement campaign: the second harmonic threshold was set at 10% of the effective RMS values, while the number of consecutive overruns was chosen to be equal to three (30 ms).
Unfortunately, the current criterion can lead to a non-unique evaluation of the event as the algorithm acts independently on each line-to-line voltages involved in the dips, making it possible to have a false outcome for one line-to-line voltage and True one for another. In this case, of inconsistent results, the criterion fails, and the event is classified as “Not Defined” (ND). Example of “not defined” cases are VDs characterized by short durations or those due to grounded polyphase faults extinction, which usually appear as a sequence of True + False dip. After years of measurement campaigns, the number of ND cases generally represents 12% of the voltage dips recorded. These events are not counted in the QuEEN statistics.
4.2. DELFI—Deep Learning for False Events Identification
To overcome the limitations given by the current criterion, in recent years RSE developed a new criterion based on Deep Learning algorithms: the DELFI (DEep Learning for False events Identification) classifier. The idea behind this application is to use DL models to recognize the type of events: in fact, “false” events are characterized by typical trends in the RMS voltage sequences recorded during the voltage dips. Moreover, the adoption of “pattern recognition” techniques has also made it possible the identification of the sequences of True + False events, thus potentially managing to resolve another class of ND cases. The integrated DELFI model based on the RMS sequences recognition was presented in more details in [28] along with its training and test sets. The architecture of the model is recalled in Figure 8.
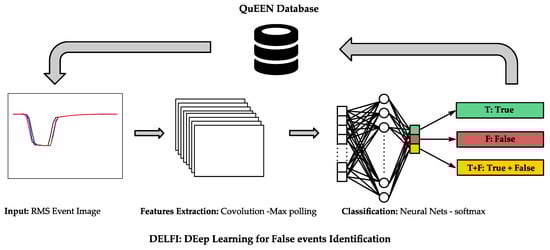
Figure 8.
DELFI architecture.
The classifier was trained selecting a set of 1300 known (The training and validation procedures were carried out considering manually labelled events for both training and test sets (supervised learning) on the basis of the experience of PQ experts and from the comparison with the results of the simulations) T, F and T + F events to whom the corresponding set of “jpg” images was associated. The model was estimated adopting a Bayesian optimization (BO) approach to assess the model hyper-parameters. The optimization process was performed by partitioning the input dataset with the following percentages 80%–10%–10% for, respectively, the training, the development and the test sets [28]. The best estimated model, with an achieved overall accuracy equal to nearby 95%, was characterized by one hidden layer, a SoftMax algorithm and by the parameters listed in the following Table 2.
Table 2.
DELFI Classifier—CNN Parameters.
In [29,32,33], its first application on a real case scenario showed interesting preliminary results as the impact of the new criterion was not negligible (÷54.3% of ND events were promoted to True events and besides some regional differences in performances were also highlighted). Thanks to these promising results, it was decided to integrate the DELFI classifier into the QuEEN system so that every event recorded by QuEEN is now classified according to both current and new criteria. As a further step forward, the results of the analysis, reported here in Section 5, also highlight the congruence of the model with respect to the electrical characteristics of the monitored distribution network.
5. Comparison of Criteria for Validity Assessment
In this work, the results of the evaluation of validity obtained by the current (2nd Harmonic Criterion) and by the new (DELFI) criteria have been compared to the neutral state of the distribution networks analyzed. In this way, in addition to what was shown in [29,32,33], this work tries to prove that the actual decisions made by the DL algorithm are more consistent with the expected electrical behaviour and hence return more appropriate outcomes than the current criterion does.
The analysis was performed considering voltage dips recorded between January 2018 and April 2021 and considering only data from regions with at least 8 operational Mus in order to have a sample that is as homogeneous as possible per region (The New QuEEN system allows researchers to query the voltage dips statistics stored in the QuEEN database according to multiple criteria, the current one applied by the instrument itself and the innovative one evaluated through a software routine. So, by selecting the time period and the MUs of interest, it is easy to get all the validity classifiers outputs). Under these assumptions, seven regions were considered, whose total number of voltage dips recorded in the period in question are reported in Table 3.
Table 3.
Number Of Events for Each Italian Region.
Below, a comparison was made between the two classifiers considering the events recorded by the MUs installed in the CPs, managed with compensated neutral (CN) and isolated neutral (IN) methods with respect to all the events. The events considered are only those of MV origin according to the Global Method [24], which in this case was applied to all events (T, F, ND) in order to be able to make a fair comparison between the validity classifiers.
For this purpose, the following groups of events were defined:
- Overall Set: 10,704 events;
- Compensated Neutral Subset: 6273 events;
- Isolated Neutral Subset: 4431 events.
Once the subsets were defined, the following analysis were performed:
- Global analysis: all data are grouped, respectively for each defined subset;
- Sensibility analysis: the subsets are analyzed considering duration and residual voltage;
- Regional analysis: subsets are considered among the seven chosen regions.
5.1. Global Analysis
First, data were aggregated with respect to all regions: for each voltage dips validity classifier, the number of events and their relative percentages were computed for the respective labels:
- T, F, ND for the 2nd Harmonic Criterion classifier;
- T, F, T + F for the DELFI classifier.
The results in percentages are reported in Table 4.
Table 4.
Criteria Comparison: 2nd Harmonic and DELFI for each subset considered and for each class of events expressed as a percentage of the totality of events.
Considering the 2nd Harmonic Criterion, substantial differences can be noted between the CN and IN Subsets: the F and ND rates are considerably higher for the IN Subset, with, respectively 11.7% and 29.8%, compared to the CN Subset that reaches only 3.4% and 10.9%. These values are significantly different from the national mean values observed in the years of QuEEN monitoring (10% for F events and 12% for ND events), regardless of the configuration of the neutral and of the VD origin. As expected, the 2nd Harmonic Criterion acts in a different way with respect to the two subsets analyzed.
This behaviour is also confirmed by the DELFI classifier: F rate is different for the two subsets as it is equal to 26.3% and 1.7% for the IN and CN Subset, respectively. Consequently, the T rates also vary considerably given the low incidence of the T + F class as it results only 0.8% and 1.4% rates for the CN and IN Subsets, respectively.
By analysing the criteria differences, the DELFI classifier increases the T rate of the CN Subset from 85.7% to 97.5%, while it is raised from 58.5% to 72.3% for the IN Subset. This means that ND events are differently classified for the two Subsets.
To better understand the obtained results, a detail comparison between the criteria outcomes is proposed: the presentation method resembles the typical confusion matrix representation but, in this case, there is no reference method that establishes the correct outcome for each label. For each event, group results are reported with the following conventions:
- DELFI results are in the rows;
- the columns refer to the outcomes of the 2nd Harmonic Criterion.
The results for each subset are reported in absolute values and as a percentage (referring to the totality of the events for each set, respectively) in Figure 9, Figure 10 and Figure 11.
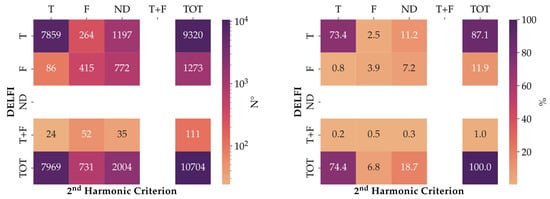
Figure 9.
Validity assessment: 2nd Harmonic and DELFI outcomes for the Overall Set.
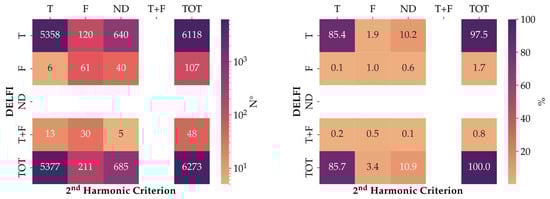
Figure 10.
Validity assessment: 2nd Harmonic and DELFI outcomes for the CN Subset.
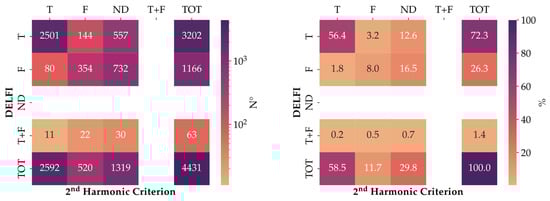
Figure 11.
Validity assessment: 2nd Harmonic and DELFI outcomes for the IN Subset.
To highlight the results achieved, some examples are reported. Let us consider Figure 9 in terms of absolute values; the cell identified as (T, T), which means True row and True column, is equal to 7859: this value represents the number of events classified as True by both criteria. As to the cell identified by the True and Not Defined labels (T, ND), 1197 represents the number of events classified as Not Defined (ND) by the 2nd Harmonic Criterion and as True (T) by DELFI. These examples can also be applied to Figure 10 and Figure 11. Regarding this type of results presentation, it is important to highlight that the T + F column and the ND row are always null for both absolute and percentage values as the 2nd Harmonic and DELFI criteria do not have the outcomes True + False (T + F) and Not Defined (ND), respectively.
Referring to results in percentage values, the following considerations can be drawn (Looking at percentage values, the row and the column TOT report the values already shown in Table 4) considering the cells identified by the combination:
- (T, ND): the recorded values for the CN and IN Subsets are, respectively 10.2% and 12.6%, namely a considerable number of events, classified as ND by the 2nd Harmonic Criterion but readmitted as T by the DELFI classifier (respectively 640 and 557 voltage dips). This means that the DELFI classifier readmits into class T a not negligible number of ND events for both subsets;
- (F, ND): the recorded value is 0.6% for the CN Subset, namely 40 events, while the same cell reaches 16.5% or 732 events for the IN Subset. This disparity is a consistent result since, theoretically, the F events are not foreseen for the CN Subset and hence the new criterion acts coherently with the expected electrical characteristics of the network;
- (T, F): the number of events classified as F by the 2nd Harmonic Criterion and readmitted as T by DELFI is not negligeable for both the CN and IN Subsets with 1.9% (120 events) and 3.2% (144 events), respectively.
To better understand the analyzed data, the comparisons between the two criteria for each set of events, are reported, respectively in Figure 12, Figure 13 and Figure 14 in terms of consistency with the results of the 2nd Harmonic Criterion. For each label, consistency can be defined as the percentage ratio of events that produced the same outcome for the current and the new criterion compared to the current classifier. The results clearly show a different behaviour between the considered subsets.
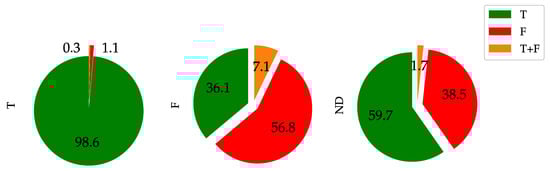
Figure 12.
Validity assessment comparison: 2nd Harmonic labels with respect to DELFI outcomes for the Overall Set.
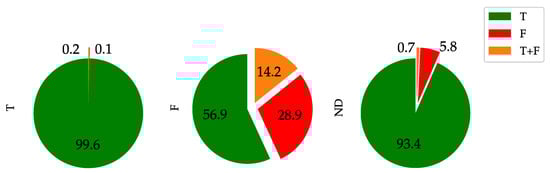
Figure 13.
Validity assessment comparison: 2nd Harmonic labels with respect to DELFI outcomes for the CN Subset.
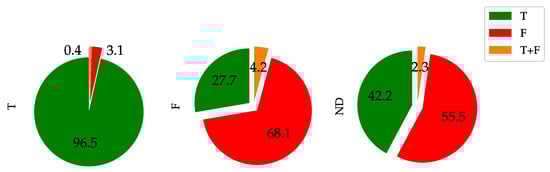
Figure 14.
Validity assessment comparison: 2nd Harmonic labels with respect to DELFI outcomes for the IN Subset.
Referring to the events classified as T by the 2nd Harmonic Criterion, a high rate of consistency is recorded for all the subsets. In fact, most of them are classified as T by both the current and the new criteria (consistency is 98.6%, 99.6% and 96.5% for the Overall, CN and IN Subsets, respectively), while a small, almost negligible, part is classified as F or T + F.
Focusing instead on the 2nd Harmonic Criterion F label, a different behaviour of the DELFI classifier among the defined subsets is clearly shown. Considering the results for the Overall Set, only 56.8% of consistency between the criteria is recorded, while 36.1% of the F events of the 2nd Harmonic Criterion are classified as T by the DELFI and therefore readmitted for the calculation of PQ indexes. Considering instead the results for the CN Subset, the consistency on F class drops to 28.9% so that 56.9% of the F events for the 2nd Harmonic Criterion are readmitted as T by the new criterion. This means that most of the F events in the compensated neutral networks are readmitted as T by the new classifier. This result, achieved by the DELFI classifier, is significant in that it follows the behaviour expected from the electrical characteristics of the network: in fact, theoretically, a compensated neutral network does not foresee the possibility of having false voltage dips caused by the transient of the homopolar component at the extinction of an earth fault. It should be remembered, however, that the information on the state of the neutral network could be partial; therefore, some events (presumably few) could have been recorded when the Peterson coil was disconnected and therefore with the network functioning with an isolated neutral network.
As regards the IN Subset, the consistence rate for F class is higher, 68.1%, but still considerably lower with respect to the T class rate. In this case, at this level of analysis, it is not possible to state that the new criterion works better than the current one as no additional information is provided on the recorded events.
Finally, the considerations made for the F event class are confirmed by the results obtained for the ND events: considering the CN Subset, the DELFI classifier has a higher prevalence towards the class T equal to 93.4% (against 59.7% for the Overall Set); on the contrary, focusing on the IN Subset, the new criterion presents a prevalence for class F with 55.5% and only the remaining 42.2% of T events. This confirms the specific behaviour of the new criterion of ND events for the CN and IN Subsets, correctly adapting the results with respect to the expected characteristics of the electrical network.
5.2. Sensibility Analysis: Duration and Residual Voltage
In the previous section, the DELFI classifier showed a better performance than the current validity criterion with respect to the expected behaviour of the electricity grid. To confirm the correctness of this, voltage dips characteristics have to be considered in terms of duration and residual voltage. In fact, false voltage dips, caused by the saturation of VTs cores, present asymmetrical and distorted waveforms, characterized by the so-called “camel humps” and “doge’s hats”, with typical durations shorter than 90 ms and residual voltages between 85% (partial saturation) and 50% (full saturation) of the nominal values [24]. The waveform and the RMS sequence of a typical “false dip”, recorded by the QuEEN system, are reported in Figure 15.
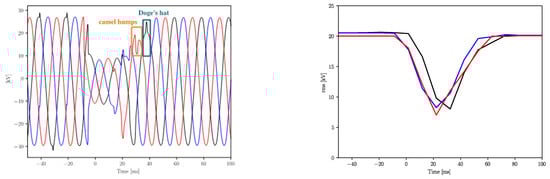
Figure 15.
A false event due to VTs saturation: voltage waveforms with the characteristic “camel humps” and “Doge’s hat” patterns (left) and RMS voltage values (right).
For this reason, a sensibility analysis was performed on both the CN and IN Subsets with respect to voltage dips duration; each subset was divided into two other subsets:
- events with duration < 90 ms;
- events with duration ≥ 90 ms.
The results of the performed sensibility analysis are reported in terms of a confusion matrix representation according to the conventions already adopted in the previous section (the rows report the results of the DELFI criterion while the columns refer to the outcomes of the 2nd Harmonic Criterion). The results for each defined subset are reported in absolute values in Figure 16 and Figure 17, respectively.
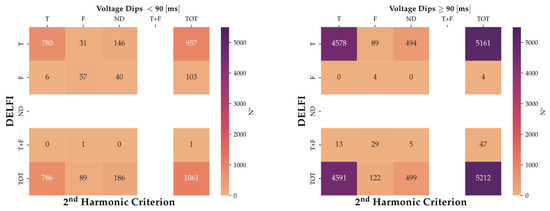
Figure 16.
Validity assessment: 2nd Harmonic and DELFI outcomes with respect to voltage durations for CN Subset.
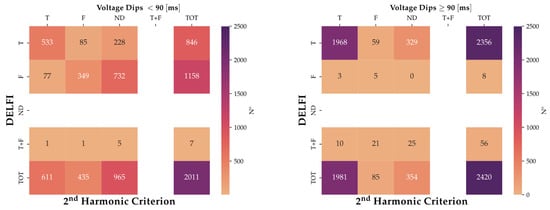
Figure 17.
Validity assessment: 2nd Harmonic and DELFI outcomes with respect to voltage durations for IN Subset.
The results obtained show a specific behaviour for each subset considered. Let us first consider the results for the CN Subset (Figure 16): the overall number of F events by the 2nd Harmonic Criterion (identified by the cell (TOT, F)) with duration ≥ 90 ms is equal to 122. Meanwhile this number, adopting the new criterion (identified by the cell (F, TOT), falls to 4, guaranteeing a classification more consistent with the expected characteristics of the network.
The better behaviour of the DELFI classifier is also confirmed by the reclassification of ND events by the 2nd Harmonic Criterion. Indeed, many of the 40 ND voltage dips with durations < 90 ms are reclassified as F by the new criterion, while the ND events with duration ≥ 90 ms, 494 over 499, are readmitted as T, and only 5 dips over 499 are dubbed T + F. Consistently, let us consider the cell (T, F) for voltage dips with duration ≥ 90 ms, equal to 89; this number quantifies that 89 events, classified as F by the 2nd Harmonic Criterion with duration ≥ 90 ms, are reclassified as T by DELFI classifier, while the oppositive behaviour is not recorded as the cell (F, T) is equal to 0. In conclusion, the new criterion provides better performance than the 2nd Harmonic Criterion for the events monitored in compensated neutral networks.
As to the events of the IN Subset (Figure 17) with duration ≥ 90 ms, the overall number of F events according to the 2nd Harmonic Criterion is equal to 85 (defined by the cell (TOT, F)). While looking at the correspondent term for the DELFI classifier, namely the cell (F, TOT), this number drastically drops to 8. Considering the outcomes of the 2nd Harmonic Criterion for ND events, the same conclusion can be drawn: all events classified as ND with duration ≥ 90 ms are mostly classified as T by DELFI, namely 329 over 354, while only 25 over 354 are classified as T + F. No F outcome is recorded for ND events by the new criterion.
To synthetize the performed analysis, the relative percentages, derived with respect to the duration of the events (events <90 ms and ≥90 ms) for each result of both criteria, are reported for the two Subsets CN and IN in Figure 18.
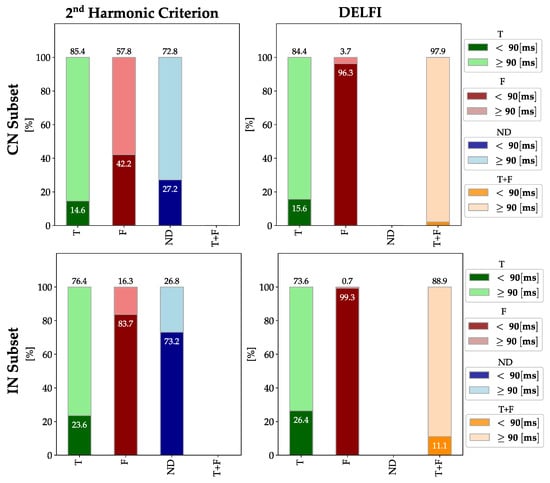
Figure 18.
Duration subdivision for each class of the respective classifiers: CN Subset and IN Subset.
The results highlight the effectiveness of the new criterion. In fact, the outcomes for the DELFI classifier are more uniform between the two subsets: in particular, considering CN Subset, the ratio of F events with a duration ≥90 ms drops from 57.8%, achieved by the 2nd Harmonic Criterion, to 3.7% according to DELFI. This behaviour is also confirmed for the IN Subset in which the ≥90 ms F rate shows a reduction from 16.3% to 0.7% when passing from the current criteria to the new one. On the other hand, the T rate shows a completely different trend, as the results are substantially similar for both subsets (≥90 ms T rates equal to 23.6% and 26.4 %, respectively for the current and new criteria for IN Subset and 14.6% and 15.6% for CN Subset).
In the following pages, we consider the comparison of the criteria with respect to the residual voltage values: Figure 19 shows the typical scatter plots in the duration–residual voltage plane for both the defined subsets and for both the criteria.
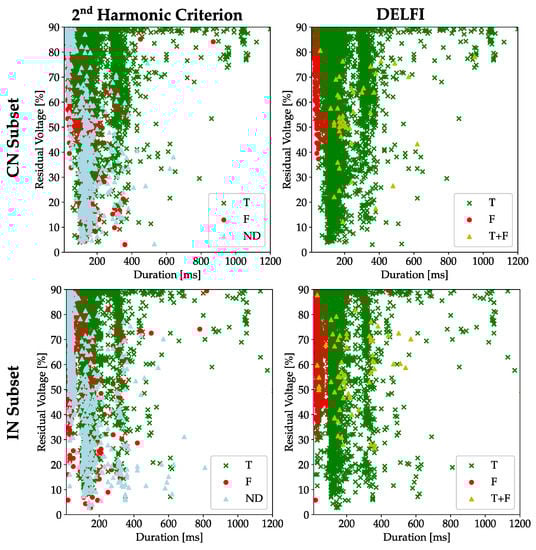
Figure 19.
Scatter plot in the duration–residual voltage plane for each class and subset (CN and IN) of the respective classifiers.
The results are coherent with the conclusions drawn by focusing only on duration. Firstly, the representation for both CN and IN Subsets clearly highlights that the F events by the 2nd Harmonic Criterion sometimes occur in an unexpected position in the plane. Secondly, by adopting the new criterion such, positions are characterized by residual voltage values compatibly with what is expected from the saturation of the voltage transformers (residual voltage included in the range 50–90%) and durations generally shorter than 100 ms.
In conclusion, the sensibility analysis confirms the consistency of the results obtained with the new criterion in terms of both duration and residual voltages for both the CN and IN Subsets.
5.3. Regional Analysis
The results, obtained for the global and sensibility analysis with respect to the neutral state of the PSs and the characteristics of the voltage dips, showed the better consistency of the new criterion compared to the current one. Based on this, in this section a regional analysis was performed on the analyzed datasets to highlight whether any PQ particular situation emerge at the regional level thanks to the adoption of the new criterion.
Firstly, the number of events for each region were reported in Figure 20 for both the CN Subset and the IN Subset. Unfortunately, the number of events for each region is not uniform between the two subsets: for example, considering Piemonte, there is prevalence for the IN Subset, with 915 voltage dips recorded against 212 attributable to the CN Subset. We should consider instead of Veneto, Sardegna and Campania the prevalence of the CN Subset where we have 939, 1130 and 990, respectively while for the IN Subset these numbers are equal to 194, 308 and 316. For Lombardia, Lazio and Sicilia the two subsets are more uniform.
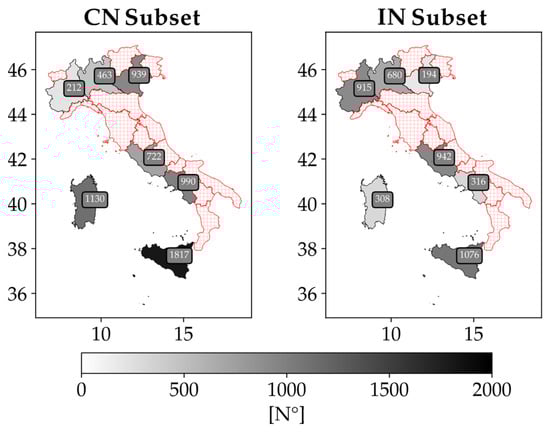
Figure 20.
Number of voltage dips recorded at regional level for the CN and IN Subsets.
Now, let us consider the outcomes of both current and new criteria on the CN Subset. The label, outcomes expressed as percentages of the total number of events for each region, are computed. Results are shown in Figure 21 and Figure 22 for the 2nd Harmonic Criterion and the DELFI classifier, respectively.
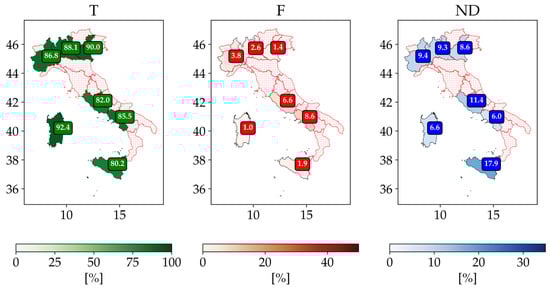
Figure 21.
Regional Comparison of the 2nd Harmonic Criterion classification label rate for the CN Subset.
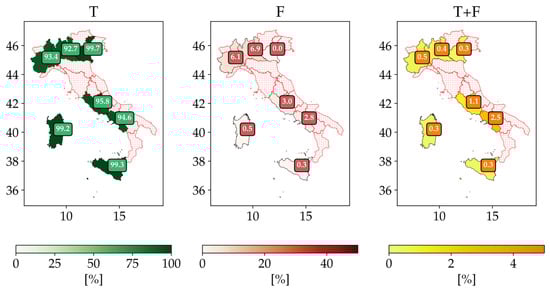
Figure 22.
Regional Comparison of the DELFI classification label rate for the CN Subset.
Results for the 2nd Harmonic Criterion show a quite uniform distribution at regional level for each label outcomes. In particular:
- the T label rate ranges from 80.2% in Sicilia up to 92.4% in Sardegna;
- considering F events, the highest ratios are recorded for Lazio and Campania with 6.6% and 8.6%, respectively;
- finally, for the ND label rate, high values are recorded for Sicilia (17.9%), Lazio (11.4%), Piemonte (9.4%) and Lombardia (9.3%).
Additionally, in the case of DELFI, the label outcomes show a quite uniform distribution among regions but with some differences:
- there is a significant increase in the T rate for all regions, going from 92.7% in Lombardia up to the 99.2% reached in Sardegna;
- consistent with what has been highlighted for class T, class F rate decreases in percentage for almost all regions except for Piemonte and Lombardia. This means that most of the ND events are reclassified as T in each region so that the increase of the T class compared to the F class is significantly larger. This is in accordance with what is expected from the network characteristics.
To better analyze the effect of the DELFI classifier with respect to the 2nd Harmonic Criterion, the percentage difference between the new and the current criteria rates was calculated for classes T and F, as shown in the equation:
The results were shown in Figure 23, where Δ was reported for each region and globally (TOT label in Figure 23).
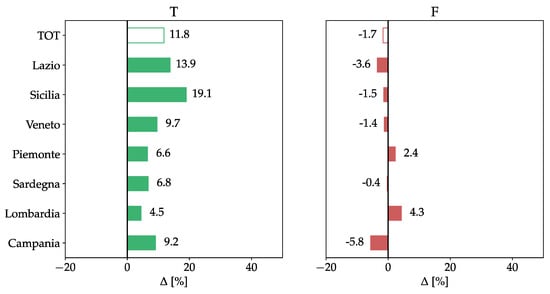
Figure 23.
Percentage difference comparison between new and current criteria: CN Subset.
With this indicator, a significant increase in T events is immediately evident, above all for Sicilia (+19.1%) and Lazio (+13.9%). Therefore, the new criterion works better than the current one. Two regions, on the other hand, also show an increase in F class, namely Lombardia and Piemonte. This result could be misread as, from a theoretical point view, no false events can occur in CN networks, as shown in Section 3. Therefore, these increases are to be attributed in part to the DELFI classifier accuracy, but also in part to the lack of information on the real state of the neutral network when the voltage dip event was recorded. In fact, if this mismatch was due only to the classifier, it should be the same for all regions.
The comparison between the current and new criteria was also made for the IN Subset; in this case, the percentage outcomes were shown, respectively in Figure 24 and Figure 25.
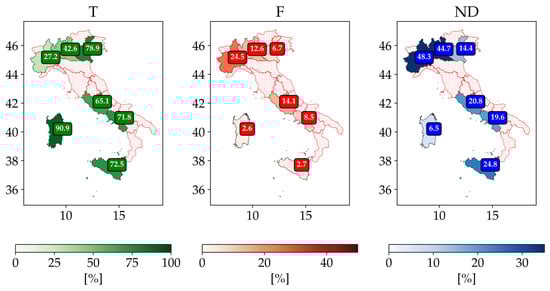
Figure 24.
Regional Comparison of the classification labels rate by the 2nd Harmonic Criterion for the IN Subset.
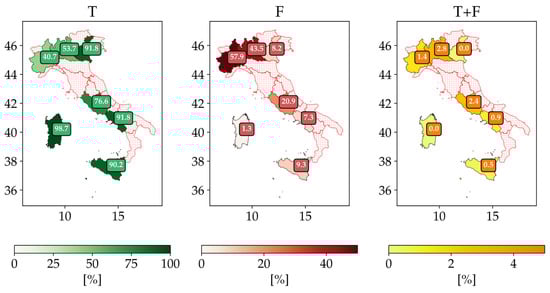
Figure 25.
Regional Comparison of the classification labels rate by DELFI for the IN Subset.
Considering the 2nd Harmonic Criterion (Figure 24), the results of the IN Subset show completely different trends from those obtained for the CN Subset: in fact, their regional distributions for each criterion label are very uneven. In particular:
- the T events ratio shows a considerable variation, ranging from 27.2% in Piemonte to 90.9% in Sardegna. Additionally, noteworthy is the 42.6% recorded in Lombardia;
- considering F events, the regional distribution is very irregular as the maximum values is reached by Piemonte with 24.5% while the minimum value 2.6% is recorded in Sardegna;
- finally, also for ND events, the regional distribution is uneven and with considerably higher values than the CN Subset: the highest values are recorded in Piemonte at 48.3% and Lombardia at 44.7% while Sicilia, Lazio and Campania have slightly lower values, with 25%, 21% and 20%, respectively. However, they are still higher than those of the CN Subset.
In general, the uncertainty given by the significant high rate of ND events, makes it difficult to make a regional comparison between regions, in contrast to the results obtained for the CN Subset. On the other hand, the behaviour showed by Piemonte compared to the other regions is very different.
In the case of the DELFI criterion (Figure 25), the percentage outcomes for the IN Subset show a marked difference from those of the current criterion. Moreover, for a better understanding of the criteria, the percentage difference, computed as in (1), was reported in Figure 26.
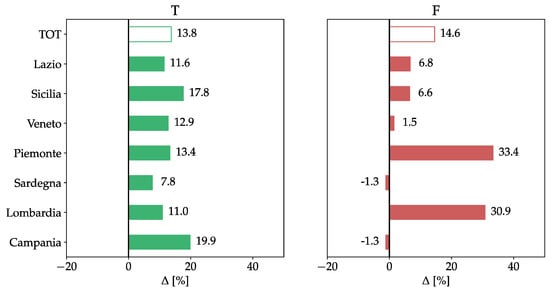
Figure 26.
Percentage difference comparison between new and current criteria: IN Subset.
The different behaviour between regions is further emphasized by the DELFI classifier. This is due to the readmission of ND events, which occur differently for different regions. In particular:
- for the T class, a global increase is achieved. Four regions have reached a T rate above 90% (Veneto, Campania, Sicilia and Sardegna), while Lombardia and Piemonte show considerably lower values with, respectively 53.7% and 40.7%;
- focusing on F events, the adoption of the new criterion in Lombardia and Piemonte outcomes is relevant: an increase of 31% and 33%, respectively, was recorded, while Lazio and Sicilia recorded an increase of about 7%. On the other hand, Sardegna and Campania showed a reduction in the F rate of −1.3%.
In details, three group of regions can be highlighted from the PQ level point of view thanks to the adoption of the new criterion:
- Piemonte and Lombardia (~50% of F events) which seem to be characterized by a high number of single phase-to-ground faults compared to polyphase ones;
- Veneto, Campania, Sardegna and Sicily (<10% of F events) which show a low number of single-phase to ground faults compared to polyphase ones;
- Lazio (20% of F events), which seems to have been affected by an intermediate number of single-phase to ground faults compared to polyphase ones.
5.4. New QuEEN Website Tables
To also allow users of the QuEEN website to be able to compare the results of different criteria for different monitoring periods or aggregations of MUs at macro-area level, comparison tables such as those presented in Figure 9, Figure 10 and Figure 11 have been made available on the New QuEEN website. An example of this online comparison was reported in Figure 27.
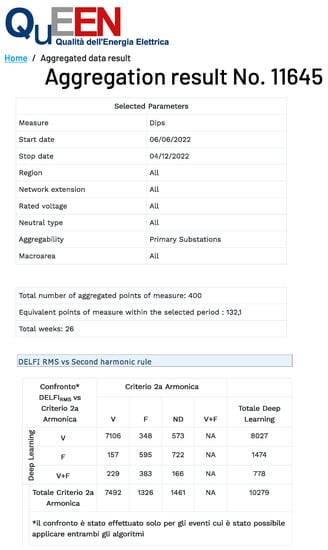
Figure 27.
QuEEN website table: validity criteria online comparison.
6. Conclusions
In this paper, the DELFI performance evaluation for voltage dips validity assessment is presented with respect to the current method (2nd Harmonic Criterion). The new validity criterion was developed to improve the accuracy of the current criterion, which settles down to 87%. This new classifier, based on DL techniques, is now fully integrated into the QuEEN monitoring system so that each recorded voltage dip is automatically classified from both the criteria and their outcomes are available online on the QuEEN website.
The comparison was performed on a large on field-dataset, made of 10704 voltage dips recorded from January 2018 to April 2021. The samples were grouped with respect to the neutral operational state, namely considering compensated neutral (CN Subset) and isolated neutral (IN Subset) configurations. It was demonstrated that DELFI criterion achieves better classification results with respect to the 2nd Harmonic Criterion: the analysis was performed by cross-checking the criteria outcomes with respect to both network neutral configuration and voltage dips characteristics (duration and residual voltages). Results proved the effectiveness of the DELFI classifier, as it led to results more consistent with the expected electrical network characteristics in the CN Subset, and solved the uncertainty on the ND events, which were not negligible in the IN Subset. Thanks to the more consistent performance of the DELFI classifier, it was possible to highlight specific situations concerning power quality at a regional level.
Author Contributions
Conceptualization, M.Z., R.C. and L.T.; formal analysis, M.Z., R.C. and L.T.; methodology, M.Z., R.C., L.T. and M.V.; supervision, R.C. and L.T.; validation, M.Z. and M.V.; writing—original draft, M.Z., R.C. and L.T.; writing—review and editing, M.Z. All authors have read and agreed to the published version of the manuscript.
Funding
This work has been financed by the Research Fund for the Italian Electrical System in compliance with the Decree of 16 April 2018.
Conflicts of Interest
The authors declare no conflict of interest.
References
- Bollen, M.H.J.; Das, R.; Djokic, S.; Ciufo, P.; Meyer, J.; Rönnberg, S.K.; Zavodam, F. Power Quality Concerns in Implementing Smart Distribution-Grid Applications. IEEE Trans. Smart Grid 2017, 8, 391–399. [Google Scholar] [CrossRef]
- Bollen, M.H.J. Understanding Power Quality Problems: Voltage Sags and Interruptions; IEEE Press: New York, NY, USA, 1999. [Google Scholar]
- CIGRE/CIRED JWG C4.112. Guidelines For Power Quality Monitoring—Measurement Locations, Processing and Presentation of Data. proceeding of the International Conference on Renewable Energies and Power Quality (ICREPQ’14), Cordoba, Spain, 8–10 April 2014. [Google Scholar]
- Kattmann, C.; Rudion, K.; Tenbohlen, S. Detailed power quality measurement of electric vehicle charging infrastructure. CIRED—Open Access Proc. J. 2017, 2017, 581–584. [Google Scholar] [CrossRef][Green Version]
- Mottola, F.; Proto, D.; Varilone, P.; Verde, P. Planning of Distributed Energy Storage Systems in μGrids Accounting for Voltage Dips. Energies 2020, 13, 401. [Google Scholar] [CrossRef]
- Meyer, J.; Blanco, A.; Rönnberg, S.; Bollen, M.; Smith, J. CIGRE C4/C6.29: Survey of utilities experiences on power quality issues related to solar power. CIRED—Open Access Proc. J. 2017, 1, 539–543. [Google Scholar] [CrossRef]
- Ray, K.; Mohanty, S.R.; Kishor, N. Classification of power quality disturbances due to environmental characteristics in distributed generation system. IEEE Trans. Sustain. Energy 2013, 4, 302–313. [Google Scholar] [CrossRef]
- EN50160: 2010; Voltage Characteristics of Electricity Supplied by Public Electricity Networks. CENELEC: Brussels, Belgium, 2010.
- IEEE Std 1564–2014; IEEE Guide for Voltage Sag Indices. IEEE: Piscataway, NJ, USA, 2014; pp. 1–59.
- Joint Working Group Cigre/Cired C4.110. Voltage Dip Immunity of Equipment and Installations; Report 412; Cigré: Paris, France, 2010. [Google Scholar]
- De Santis, M.; Di Stasio, L.; Noce, C.; Verde, P.; Varilone, P. Initial Results of an Extensive, Long-Term Study of the Forecasting of Voltage Sags. Energies 2021, 14, 1264. [Google Scholar] [CrossRef]
- D’Orazio, L.; Corsi, N.; Riva, S. Analysis of voltage dips on Italian distribution network. In Proceedings of the 2021 AEIT International Annual Conference (AEIT), Milan, Italy, 4–8 October 2021; pp. 1–6. [Google Scholar]
- Šipoš, M.; Klaić, Z.; Nyarko, E.K.; Fekete, K. Determining the Optimal Location and Number of Voltage Dip Monitoring Devices Using the Binary Bat Algorithm. Energies 2021, 14, 255. [Google Scholar] [CrossRef]
- Patra, J.; Pal, N. A Mathematical Approach of Voltage Sag Analysis Incorporating Bivariate Probability Distribution in a Meshed System. Energies 2022, 15, 7592. [Google Scholar] [CrossRef]
- Yalman, Y.; Uyanık, T.; Atlı, İ.; Tan, A.; Bayındır, K.Ç.; Karal, Ö.; Golestan, S.; Guerrero, J.M. Prediction of Voltage Sag Relative Location with Data-Driven Algorithms in Distribution Grid. Energies 2022, 15, 6641. [Google Scholar] [CrossRef]
- Guo, X.; Li, Y.; Wang, S.; Cao, Y.; Zhang, M.; Zhou, Y.; Yosuke, N. A Comprehensive Weight-Based Severity Evaluation Method of Voltage Sag in Distribution Networks. Energies 2021, 14, 6434. [Google Scholar] [CrossRef]
- Milanovic, J.V.; Gupta, C.P. Probabilistic Assessment of Financial Losses due to Interruptions and Voltage Sags—Part I: The Methodology. IEEE Trans. Power Deliv. 2006, 21, 918–924. [Google Scholar] [CrossRef]
- Milanovic, J.V.; Gupta, C.P. Probabilistic Assessment of Financial Losses due to Interruptions and Voltage Sags—Part II: Practical Implementation. IEEE Trans. Power Deliv. 2006, 21, 925–932. [Google Scholar] [CrossRef]
- Celli, G.; Pilo, F.; Pisano, G.; Soma, G.G. Including voltage dips mitigation in cost-benefit analysis of storages. In Proceedings of the 2018 18th International Conference on Harmonics and Quality of Power (ICHQP), Ljubljana, Slovenia, 13–16 May 2018; pp. 1–6. [Google Scholar] [CrossRef]
- Motoki, É.M.; Filho, J.M.d.C.; da Silveira, P.M.; Pereira, N.B.; de Souza, P.V.G. Cost of Industrial Process Shutdowns Due to Voltage Sag and Short Interruption. Energies 2021, 14, 2874. [Google Scholar] [CrossRef]
- Chiumeo, R.; Cucchietti, F.; Griffa, G.; Tenti, L. The power quality of the distribution networks and its impact on the telecommunication next generation access network. REPQJ 2014, 12, 396–400. [Google Scholar] [CrossRef]
- Chiumeo, R.; de Nigris, M.; Garbero, L.; Porrino, A.; Tenti, L. The Italian power quality monitoring system of the MV network results of the measurements of voltage dips after 3 years campaign. In Proceedings of the 20th International Conference and Exhibition on Electricity Distribution (CIRED 2009), Prague, Czech Republic, 8–11 June 2009. paper 0737. [Google Scholar] [CrossRef]
- Chiumeo, R.; de Nigris, M.; Gandolfi, C.; Garbero, L.; Tenti, L.; Carpaneto, E. Implementation of a New Method for an Improved Voltage Dips Evaluation by the Italian Power Quality Monitoring System in Presence of VT Saturation Effects. REPQJ 2010, 1, 519–523. [Google Scholar] [CrossRef]
- Chiumeo, R.; Garbero, L.; Malegori, F.; Tenti, L. Feasible methods to evaluate voltage dips origin. REPQJ 2015, 1, 357–361. [Google Scholar] [CrossRef]
- Turović, R.; Dragan, D.; Gojić, G.; Petrović, V.B.; Gajić, D.B.; Stanisavljević, A.M.; Katić, V.A. An End-to-End Deep Learning Method for Voltage Sag Classification. Energies 2022, 15, 2898. [Google Scholar] [CrossRef]
- Mei, F.; Ren, Y.; Wu, Q.; Zhang, C.; Pan, Y.; Sha, H.; Zheng, J. Online Recognition Method for Voltage Sags Based on a Deep Belief Network. Energies 2019, 12, 43. [Google Scholar] [CrossRef]
- Balouji, E.; Gu, I.Y.H.; Bollen, M.H.J.; Bagheri, A.; Nazari, M. A LSTM-based deep learning method with application to voltage dip classification. In Proceedings of the 2018 18th International Conference on Harmonics and Quality of Power (ICHQP), Ljubljana, Slovenia, 13–16 May 2018; pp. 1–5. [Google Scholar] [CrossRef]
- Tenti, L.; Chiumeo, R.; Zanoni, M.; Shadmehr, H. Deep Learning to Assess Voltage Dips Validity. In Proceedings of the 2020 AEIT International Annual Conference (AEIT), Catania, Italy, 23–25 September 2020; pp. 1–4. [Google Scholar] [CrossRef]
- Zanoni, M.; Chiumeo, R.; Tenti, L.; Volta, M. Automated Tool Based on Deep Learning to Assess Voltage Dips Validity: Integration in the QuEEN MV network Monitoring System. REPQJ 2021, 14, 409–413. [Google Scholar] [CrossRef]
- Shadmehr, H.; Chiumeo, R.; Tenti, L. Self-tuning kalman filter and machine learning algorithms for voltage dips upstream or downstream origin detection. REPQJ 2016, 19, 235–240. [Google Scholar] [CrossRef]
- Zanoni, M.; Chiumeo, R.; Tenti, L.; Volta, M. FExWaveS application for voltage dips origin assessment: Optimization of the tool in views of its integration into the QuEEN monitoring system. In Proceedings of the 2021 AEIT International Annual Conference (AEIT), Milan, Italy; 2021; pp. 1–6. [Google Scholar]
- Zanoni, M.; Chiumeo, R.; Tenti, L.; Volta, M. Advanced Machine Learning Functionalities in the Medium Voltage Distributed Monitoring System QuEEN: A Macro-Regional Voltage Dips Severity Analysis. Energies 2021, 14, 7949. [Google Scholar] [CrossRef]
- Zanoni, M.; Chiumeo, R.; Tenti, L.; Volta, M. Highlighting of local Power Quality states with the new QuEEN system, enhanced with Deep Learning and Machine Learning algorithms. In Proceedings of the 2022 AEIT International Annual Conference (AEIT), Rome, Italy, 3–5 October 2022. [Google Scholar] [CrossRef]
- IEC 61000-4-30; Electromagnetic Compatibility (EMC)—Part 4-30: Testing and Measurement Techniques—Power Quality Measurement Methods. International Electrotechnical Commission (IEC): Geneva, Switzerland, 2015.
- QuEEN—RSE (Qualità dell’Energia Elettrica) Home Page. Available online: http://queen.rse-web.it/ (accessed on 14 December 2022).
- CEER. 5th CEER Benchmarking Report on the Quality of Electricity Supply 2011; Annex to Chapter 3 on Voltage Quality data; CEER: Brussels, Belgium, 2012; pp. 136–139. [Google Scholar]
- AEEGSI. Resolution 29 December 2011, 198/2011. Available online: https://www.arera.it/it/docs/11/198-11arg.htm (accessed on 14 December 2022).
- ARERA. Resolution 23 December 2019, 566/2019/R/EEL. Available online: https://www.arera.it/it/docs/19/566-19.htm (accessed on 14 December 2022).
- Voltage Quality Indicators in Distribution Networks. 2021. Available online: https://www.arera.it/it/elettricita/qualitatensione.htm (accessed on 14 December 2022).


Disclaimer/Publisher’s Note: The statements, opinions and data contained in all publications are solely those of the individual author(s) and contributor(s) and not of MDPI and/or the editor(s). MDPI and/or the editor(s) disclaim responsibility for any injury to people or property resulting from any ideas, methods, instructions or products referred to in the content. |
© 2023 by the authors. Licensee MDPI, Basel, Switzerland. This article is an open access article distributed under the terms and conditions of the Creative Commons Attribution (CC BY) license (https://creativecommons.org/licenses/by/4.0/).