Article

Comparison of Measured and Derived Thermal Conductivities in the Unsaturated Soil Zone of a Large-Scale Geothermal Collector System (LSC)

GeoZentrum Nordbayern, Department Geographie und Geowissenschaften, Friedrich-Alexander-Universität Erlangen-Nürnberg, Schlossgarten 5, 91054 Erlangen, Germany
*
Author to whom correspondence should be addressed.
Energies 2023, 16(3), 1195; https://doi.org/10.3390/en16031195
Submission received: 23 December 2022 / Revised: 17 January 2023 / Accepted: 18 January 2023 / Published: 21 January 2023
(This article belongs to the Special Issue Shallow Geothermal Energy in Densely Inhabited Areas)

Abstract

:
The design, energetic performance, and thermal impact of large-scale geothermal collector systems (LSCs) are dependent on the thermal conductivity of unsaturated soils (λ). The aim of this study was to investigate the benefits of two different λ measurement methods using single-needle sensor measuring devices on a laboratory scale. Since large-scale determinations are required in the context of LSCs, the potential for deriving λ from electrical resistivity tomography measurements (ERTs) was also examined. Using two approaches—the continuous evaporation method and the punctual method—thermal conductivities of soil samples from Bad Nauheim (Germany) were measured. The results were compared with averaged λ derived from three ERT sections. With the evaporation method, significant bulk density changes were observed during the experimental procedure, which were caused by the clay content and the use of repacked samples. The punctual method ensures a sufficiently constant bulk density during the measurements, but only provides a small number of measurement points. The thermal conductivities derived from ERTs show largely minor deviations from the laboratory measurements on average. If further research confirms the results of this study, ERTs could provide a non-invasive and unelaborate thermal exploration of the subsurface in the context of large-scale infrastructure projects such as LSCs.

1. Introduction

1.1. Large-Scale Geothermal Collector System (LSC) in Bad Nauheim (Germany)

For reaching the aims of climate policies, reducing emissions not only from power production but also from heat supply is necessary [1]. Thereby, shallow geothermal energy is an important component of achieving these goals. In addition to standard systems, such as borehole heat exchangers or small-scale horizontal systems for individual residential or industrial buildings, the focus is also shifting to a combination of fifth-generation district heating and cooling networks with, for example, large-scale geothermal collector systems (LSCs) [2]. LSCs are defined by an area ≥ 1000 m2, maximum source power ≥ 25 kW or source heat extraction ≥ 50 MWh/y. Hereby, entire building sites can be provided with heating and cooling energy. By combining LSCs and low-temperature district heating networks, this type of heat supply can be used not only in rural regions but also in densely inhabited areas. The district heating and cooling networks operate with low system temperatures in the range of very shallow subsurface temperatures, resulting in very low heat losses [2,3,4]. Furthermore, the network itself can gain up to 50% of the heat demand [2].
Such a combination is being studied in detail scientifically as part of the KNW-Opt research project (Grant No. 03EN3020C). On this test site, which is located at Bad Nauheim in Hesse in the centre of Germany, a two-layer LSC with a total area of 22,000 m2 was placed beneath an agricultural area. The collectors are installed at a depth of 1.5 and 3.0 m below ground level (m b. g. l.). A new residential settlement is supplied via a low-temperature district heating and cooling network.

1.2. Determination of Thermal Conductivity of Soils

Exploring the subsurface, especially its thermal properties, is necessary for several reasons in the context of LSCs. Thermal soil parameters are crucial for the design, performance and as input parameters for the modelling of horizontal systems [5,6,7,8,9]. Furthermore, the effects of heat and cold extraction on the subsurface for water law and ecological considerations can also be estimated more realistically. Such considerations particularly concern the saturated zone, as thermal changes can result in hydrochemical and biological alterations of groundwater [10,11,12,13]. Therefore, a monitoring concept can be used to ensure the sustainable application of larger shallow geothermal systems [14,15]. Furthermore, the unsaturated zone and its thermal properties are essential, as the groundwater temperature down to a depth of 10 to 15 m is mainly influenced by vertical heat transport [16]. In addition, the collectors are often located in the unsaturated zone due to the very shallow installation depth.
The main transport mechanism for heat in the unsaturated subsurface is conduction [17]. For this reason, the geothermal potential in the context of LSCs can be described by the thermal conductivity of soil (λ) [18]. This parameter depends on further soil properties such as water content, bulk density, soil texture and organic matter [17,18,19,20]. Based on these correlations, several models were created to calculate λ [21,22,23,24]. Furthermore, thermal conductivity can be measured directly, e.g., using a single-needle sensor [25,26,27]. However, this can only be conducted on a laboratory scale or in situ selectively on a small scale. For borehole heat exchangers in particular, thermal response tests (TRTs) are often used as an in situ measurement method [28,29].
Large-scale investigations are associated with increased effort. Since large-scale considerations are particularly required in the context of LSCs, an alternative determination of thermal conductivity on a larger scale would be more expedient. One potential approach could be non-invasive electrical resistivity tomography (ERT) and the derivation of soil parameters over longer distances and thus larger areas.
The methodology of geoelectrical measurements has developed significantly in recent decades and can be used to investigate the geophysical parameters on many different issues [30,31,32,33]. Because the physical parameters of soil which determine thermal conductivity are also decisive for the electrical resistivity and respective electrical conductivity (σ) in soils [34,35,36], a geothermal assessment performed by using geoelectrical measurements can be possible. Similar to thermal conductivity, σ is determined mainly by the parameters water content, density and organic content [37,38,39,40,41], although water content is more decisive as a single parameter [42]. Due to this correspondence, there are various attempts to derive thermal conductivity from electrical conductivity [35,36,42,43,44,45,46]. However, a direct dependency across all soil types is not present, which is why direct derivations often cannot be applied in a generalised manner [42,47]. For this reason, Schwarz and Bertermann [42] presented an indirect but generally applicable determination of thermal conductivity by ERTs for unsaturated soils.

1.3. Aims of This Study

This study aims to compare measured and derived thermal conductivities in the unsaturated soil zone of the LSC in Bad Nauheim. It is common practice to measure the thermal conductivity in situ or on a laboratory scale, e.g., using a single-needle sensor measuring device. Therefore, two different measurement methods on a laboratory scale are compared using samples from Bad Nauheim to work out their benefits and disadvantages.
A large-scale determination of thermal parameters in the subsurface—as it is required in the context of LSCs—can only be guaranteed by a very high number of measurements. For this reason, this study also examines the potential of deriving crucial physical and thermal soil parameters by ERTs according to Schwarz and Bertermann [42] and compares the derived values with actual measurement results. ERTs could be an alternative method for performing large-scale thermal explorations of the unsaturated zone for corresponding projects. Moreover, this approach would be non-invasive and could also be applied after installing the LSC and refilling the collector area.

2. Materials and Methods

2.1. Test Site and Geological Conditions

Bad Nauheim is a city located at the eastern edge of the Taunus Mountain range. For subsurface exploration and sampling from 2019 to 2021 trial pits (TP) were conducted and boreholes (B), as well as ramming cores (RCD), were drilled. The location of the sampling points is shown in Figure 1a.
TP2 was conducted directly in the collector field and after backfilling with excavated material. Six 10.5 m deep boreholes for groundwater monitoring wells were installed around the LSC [14]. In addition, three more trial pits (TP4, TP5, TP6) were performed in the range of the low-temperature district heating network 170 to 300 m northwest of the LSC. Figure 1b shows the stratigraphic units encountered and their thickness at the various sample points.
At the test site, quaternary loamy valley deposits and bench gravels are present in the shallow subsurface [48]. These are overlain by topsoil and locally by agriculturally influenced soil and anthropogenic loamy fillings, which are predominantly redeposited or anthropogenically influenced valley deposits or similar soil types. Several grain size analyses were performed for the exclusively fine-grained soils (Figure 1b). Towards the gravel aquifer layer boundary, the gravel content already increases in the quaternary loam. The underlying bench gravel is the local shallow aquifer. The groundwater flow direction is to the northeast and east towards the river Usa. (Figure 1a). The bench gravel is followed by a very heterogeneous layer of tertiary basalt. The basalt largely decomposed to clayey silt with clay sections or clay known as ‘Rotlehm’ [49]. Deeper, the basalt layer gets more permeable because of its rising hard rock characteristics.

2.2. Field and Laboratory Investigations

2.2.1. Geotechnical and Soil Scientific Investigations

For the thermal evaluation of the subsurface, various field and laboratory investigations of crucial soil parameters were performed. A list is shown in Table 1. For this purpose, the trial pits and boreholes shown in Figure 1, and samples taken from them, were used. Water content determinations were performed in boreholes B2 to B6 and in TP2 to TP6, density determinations in TP1 to TP6. In addition, bulk density and water content measurements were conducted on the topsoil and the very near-surface valley deposits at eight locations in the range of the LSC or the immediate vicinity.
The trial pits were opened to a maximum of 3.4 m b. g. l., so undisturbed sampling was not possible at a deeper level. For the large-scale determination of the bulk density (ρb) for the depths 0.5 to 3.5 m b. g. l. in 0.5 m intervals, the average value was calculated using measured values in the range ±0.5 m from the corresponding depth. Due to the similar soil types and stratigraphic units, the results of the more distant TP4, TP5 and TP6 were also considered for a large-scale approach, which includes the low-temperature district heating network. For the depths 4.0 m to 5.0 m b. g. l., the average value calculated for 3.5 m b. g. l. was also simplified assumed. However, this only applies to the areas of the test site where unsaturated quaternary loam is still present at this depth and not the coarse bench gravel.
In accordance with the procedure for ρb, the average value of the gravimetric water content (ω) was calculated for the depth steps between 0.5 and 5.0 m b. g. l.
The average depth-dependent values of ρb and ω were used to calculate the volumetric water content ( θ ) considering the density of water (ρw) as follows:
θ = ( ω · ρ b ) / ρ w

2.2.2. Thermal Conductivity Measurements on a Laboratory Scale

To determine the thermal conductivity of soils in the unsaturated zone on a laboratory scale, two methods were used. The procedures and the measuring devices for these two methods are described in Table 2 and schematic in Figure 2. The evaporation method is based on the procedure described by Markert et al. [27].
The dimensions of the used single-needle TR-1 and TR-3 sensors comply with the specifications according to IEEE Std 442-1981 [54] and ASTM D5334 [55]. The volumes of measuring cylinders were 397 cm3 and 944 cm3. After oven drying (65 °C), the measurements were performed after the samples had cooled down to room temperature. For each measurement, the weight and water content of the sample was recorded.
Each measurement at a certain water content of the punctual method is an average of three measured values, which deviate from each other by a maximum of 0.1 W/(m∙K). In the case of sample TP4 0.6 m b. g. l, only two values were used for the measurement at ωsat.
In addition, changes of ρb for selected measurements with the evaporation method were documented, since swelling and shrinkage of the samples were observed.
A list of the samples and sample configurations on which thermal conductivity measurements were performed is shown in Table 3.
For the determination of the depth-dependent, large-scale thermal conductivity, λ was calculated for specific depth intervals using regressions with a second-degree polynomial function of corresponding measurement results and the average, depth-dependent values of ω. The two measurement methods were considered separately.
For the evaporation method, only one measurement point per 24 h is used for the thermal conductivity calculation and illustration in the following. This results in the single measurement at ω = 0.0 g/g being weighted more for the regression. Due to the similar soil types and stratigraphic units, the results of the more distant TP4 and TP6 were also considered for a large-scale approach, which includes the near low-temperature district heating network.

2.3. Electrical Resistivity Tomography (ERT) and Parameter Derivation

Along three 2D sections, ERTs were performed on the test site on 7 April 2021, i.e., after refilling the collector field. The sections partly crossed groundwater monitoring wells to compare the results with the layer structure of drilling profiles and the measured groundwater levels (Figure 1a).
The measurements were taken at a frequency of 4.16 Hz with the earth resistivity meter 4point light by LGM—Lippmann Geophysical Equipment and the software GeoTest (version 2.4.3) by Geophysics—Dr. Rauen. Methodology and measurement configuration for each section is shown in Table 4. A total of 80 electrodes were used for Section A and 60 electrodes for Sections B and C.
For data processing, the measured pseudo-resistivities were inverted using the software Res2DInv (version 4.03.36) by Aarhus GeoSoftware. Since the terrain is slightly sloping, an elevation profile was implemented. The calculation was performed using the robust inversion settings and the full Gauss–Newton method. To generate smoother resistivity transitions, the calculated cells were halved by using the halved-unit electrode spacing option. The values of the 10th iteration of inversion processes were considered for the evaluation. Section A showed an error of 3.8%, Section B 1.4% and Section C 2.1%.
The derivation of λ is performed as described by Schwarz and Bertermann [42]. This approach is based only on the electrical conductivity σT, which is corrected by temperature factor f T   according to Sheets and Hendrickx [56] to electrical conductivity at a temperature of 25 °C ( σ 25 ):
σ 25   = f T · σ T
f T   = 0.4470 + 1.4034 · e T / 26.815
For the temperature correction, the average value of all temperature monitoring stations located at B1–B6 of the measurement on 22 April 2021 was formed, in this case T = 10.1 °C [14]. The electrical conductivity σT is the reciprocal value of the measured electrical resistivity (ER).
For the derivation of λ, several steps are required in this approach. First, θ is calculated according to Bertermann and Schwarz [57] considering correction factors for the soil type groups Clay (Xclay) and Silt (Xsilt) according to Schwarz and Bertermann [42]:
θ = e 0.3415 · ln ( σ 25 ) + 4.228 X clay or silt
Xclay = 34.122 · σ 25 + 5.1063
Xsilt = 204.75 · σ 25 + 5.2482
The soil texture groups are also defined by σ25 in three different ranges (Sand: <0.01 S/m; Silt: 0.01–0.05 S/m; Clay: >0.05 S/m). These separation ranges are used to determine the selection of the respective correction factor for θ as well as for the calculation of ρb. Bulk density is derived as follows:
ρ b _ clay = 0.9565 · σ 25 + 1.1683
ρ b _ silt = 4.6015 · σ 25 + 1.3362
ρ b _ sand = 1.4
By deriving θ and ρb, the thermal conductivity can be calculated. As proposed by Schwarz and Bertermann [42], the calculation in this study is performed according to Kersten [22]:
λ = 0.1442 · ( 0.7 · log ( θ ρ b ) + 0.4 ) · 10 0.6243 · ρ b
The inverted electrical resistivities and the thermal conductivities derived from them were interpolated with the Surfer® mapping software by Golden Software and illustrated graphically.
For the comparison of the derived parameters with measured values, the average values of ρb, θ and λ per measured layer for each section were calculated.

3. Results

3.1. Bulk Density and Water Content

The measured average values for ω and ρb and the calculated volumetric water contents using Equation (1) are listed in Table 5.
The water content and bulk density showed location-dependent fluctuations, especially in the area very close to the surface. Water contents of 0.06 to 0.32 g/g were measured over the entire depth. The average water content initially increased with depth and decreased again from 2.0 m b. g. l. onwards.
Bulk densities between 1.2 and 1.7 g/cm3 were measured. The average values were initially approximately constant and increased from 2.0 m b. g. l. downwards and are simplified and assumed to be constant from 3.5 m b. g l.

3.2. Atterberg Limits and Plasticity Properties

Table 6 shows the determined Atterberg limits and the plasticity index for soil samples examined. As can be seen, the shrinkage limit (ωS) for four out of five samples was between 0.17 g/g and 0.19 g/g and the liquid limit (ωL) between 0.28 g/g and 0.29 g/g. Only the sample from TP1 at 1.4–1.9 m b. g. l. showed a significantly higher liquid limit of 0.40 g/g and a lower shrinkage limit of 0.14 g/g. Thus, according to the ISSCS (Indian Standard Soil Classification System) plasticity chart, this sample is classified as intermediate plastic clay (CI). The remaining samples are classified as low plastic clays (CL), with plasticity indexes between 0.08 and 0.10.

3.3. Thermal Conductivity Measurements Using Evaporation Method

Thermal conductivities measured with the evaporation method are shown in Figure 3.
The measurements initially showed increasing values of λ with decreasing ω. The thermal conductivity reached a maximum and decreased again as the water content continued to decrease. The differences between the maximum thermal conductivity and the thermal conductivity at saturated conditions were between 0.1 and 0.3 W/(m∙K). Maximum values for λ between 1.2 and 1.7 W/(m∙K) were measured.
Furthermore, changes in the volume of the samples were observed during saturation, and drying due to evaporation. At selected samples those changes were recorded. The results are summarised in Table 7.
Accordingly, significantly lower bulk densities after saturation and significantly higher bulk densities after drying in comparison to the initially installed bulk density (ρb_ini) were observed. During the test procedures, alterations of ρb by amounts of 0.3 g/cm3 to 0.5 g/cm3 occurred.

3.4. Thermal Conductivity Measurements Using Punctual Method

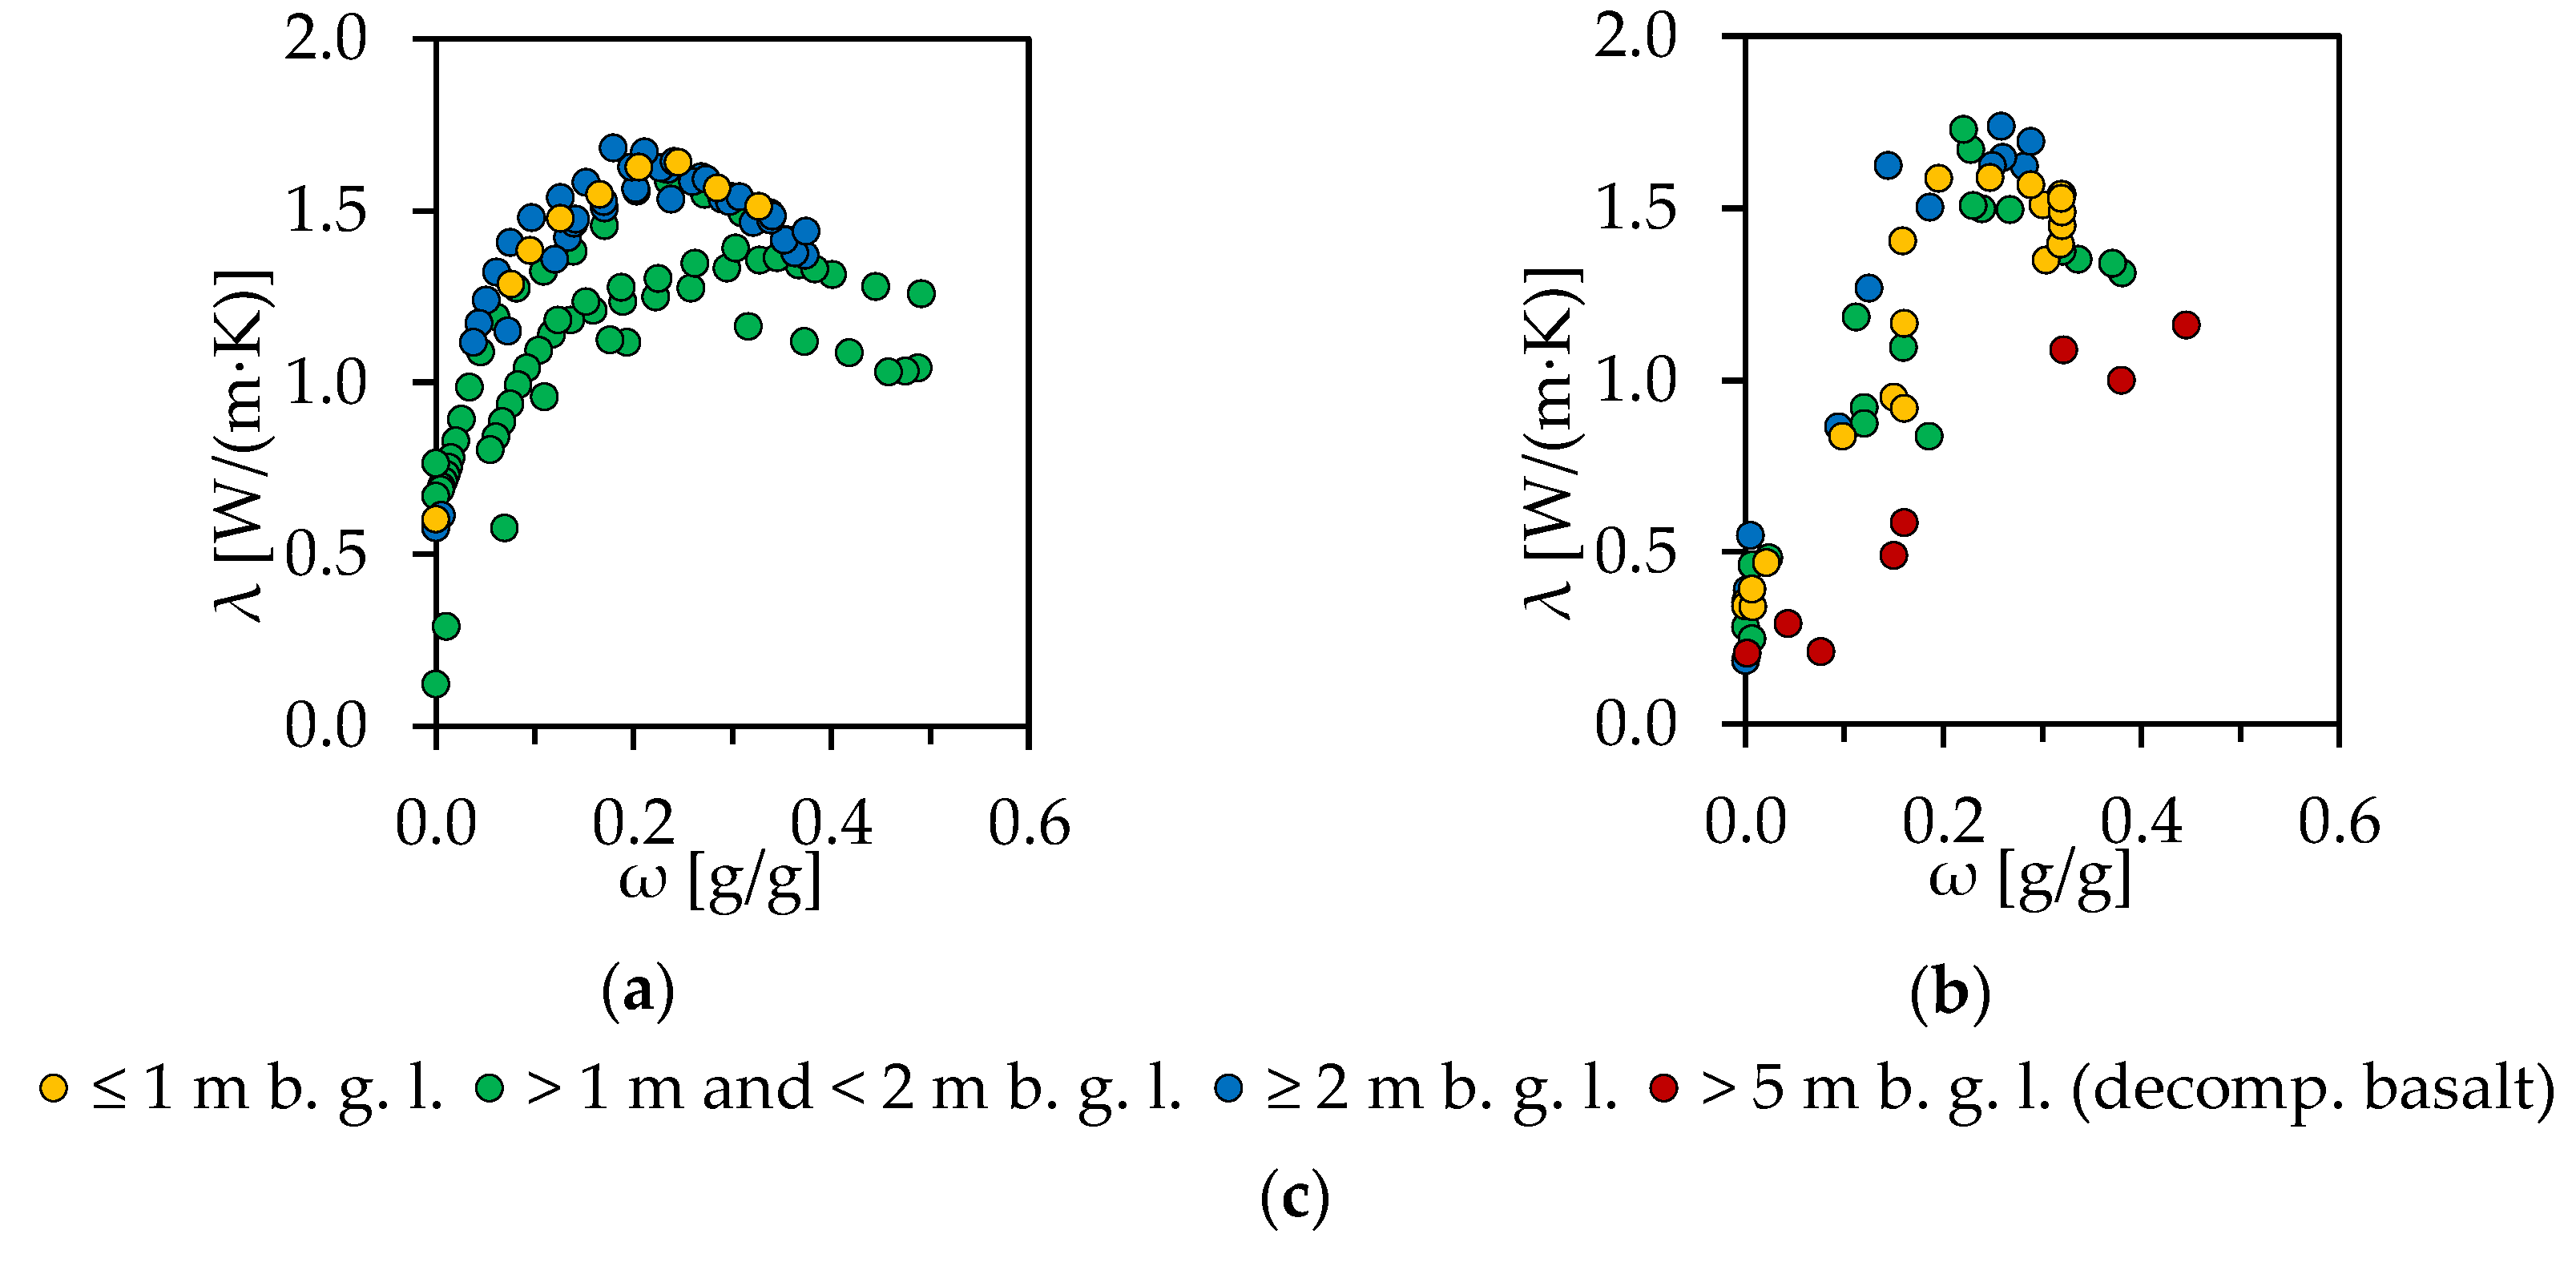
The results of the punctual method are shown in Figure 4. The water contents to be measured were based on the results of the evaporation method. However, it turned out that significantly lower maximum values of ω were achieved due to saturation. As a result, the measurements at ω2 and ωsat were partially conducted at similar water content values.
Here, predominantly increasing thermal conductivities occurred with increasing ω. Maximum values for λ between 1.3 W/(m∙K) and 1.7 W/(m∙K) were achieved for quaternary valley deposits or overlaying layers.

3.5. Depth-Dependent Thermal Conductivities

The measured values for λ, sorted by the depth interval from which the respective soil samples were taken and by measurement method, are shown in Figure 5.
The depth-dependent thermal conductivities were calculated with the gravimetric water contents listed in Table 5. For this purpose, a regression of the measurement results with a second-degree polynomial function for each depth interval was used. The results are shown in Table 8. The quality of the regression is determined by the coefficient of determination (R2) and Root Mean Square Error (RMSE).
By using a regression based on ω, the results are considered independently of bulk density. Furthermore, due to the density changes during the evaporation method, a determination of the volumetric water content is not possible.
With the punctual method, between three and five samples were measured per depth interval. For the evaporation method, one measurement for the depth ≤ 1 m b. g. l. was performed. Four measurements were conducted for each of the remaining depth levels.

3.6. ERTs and Parameter Derivation

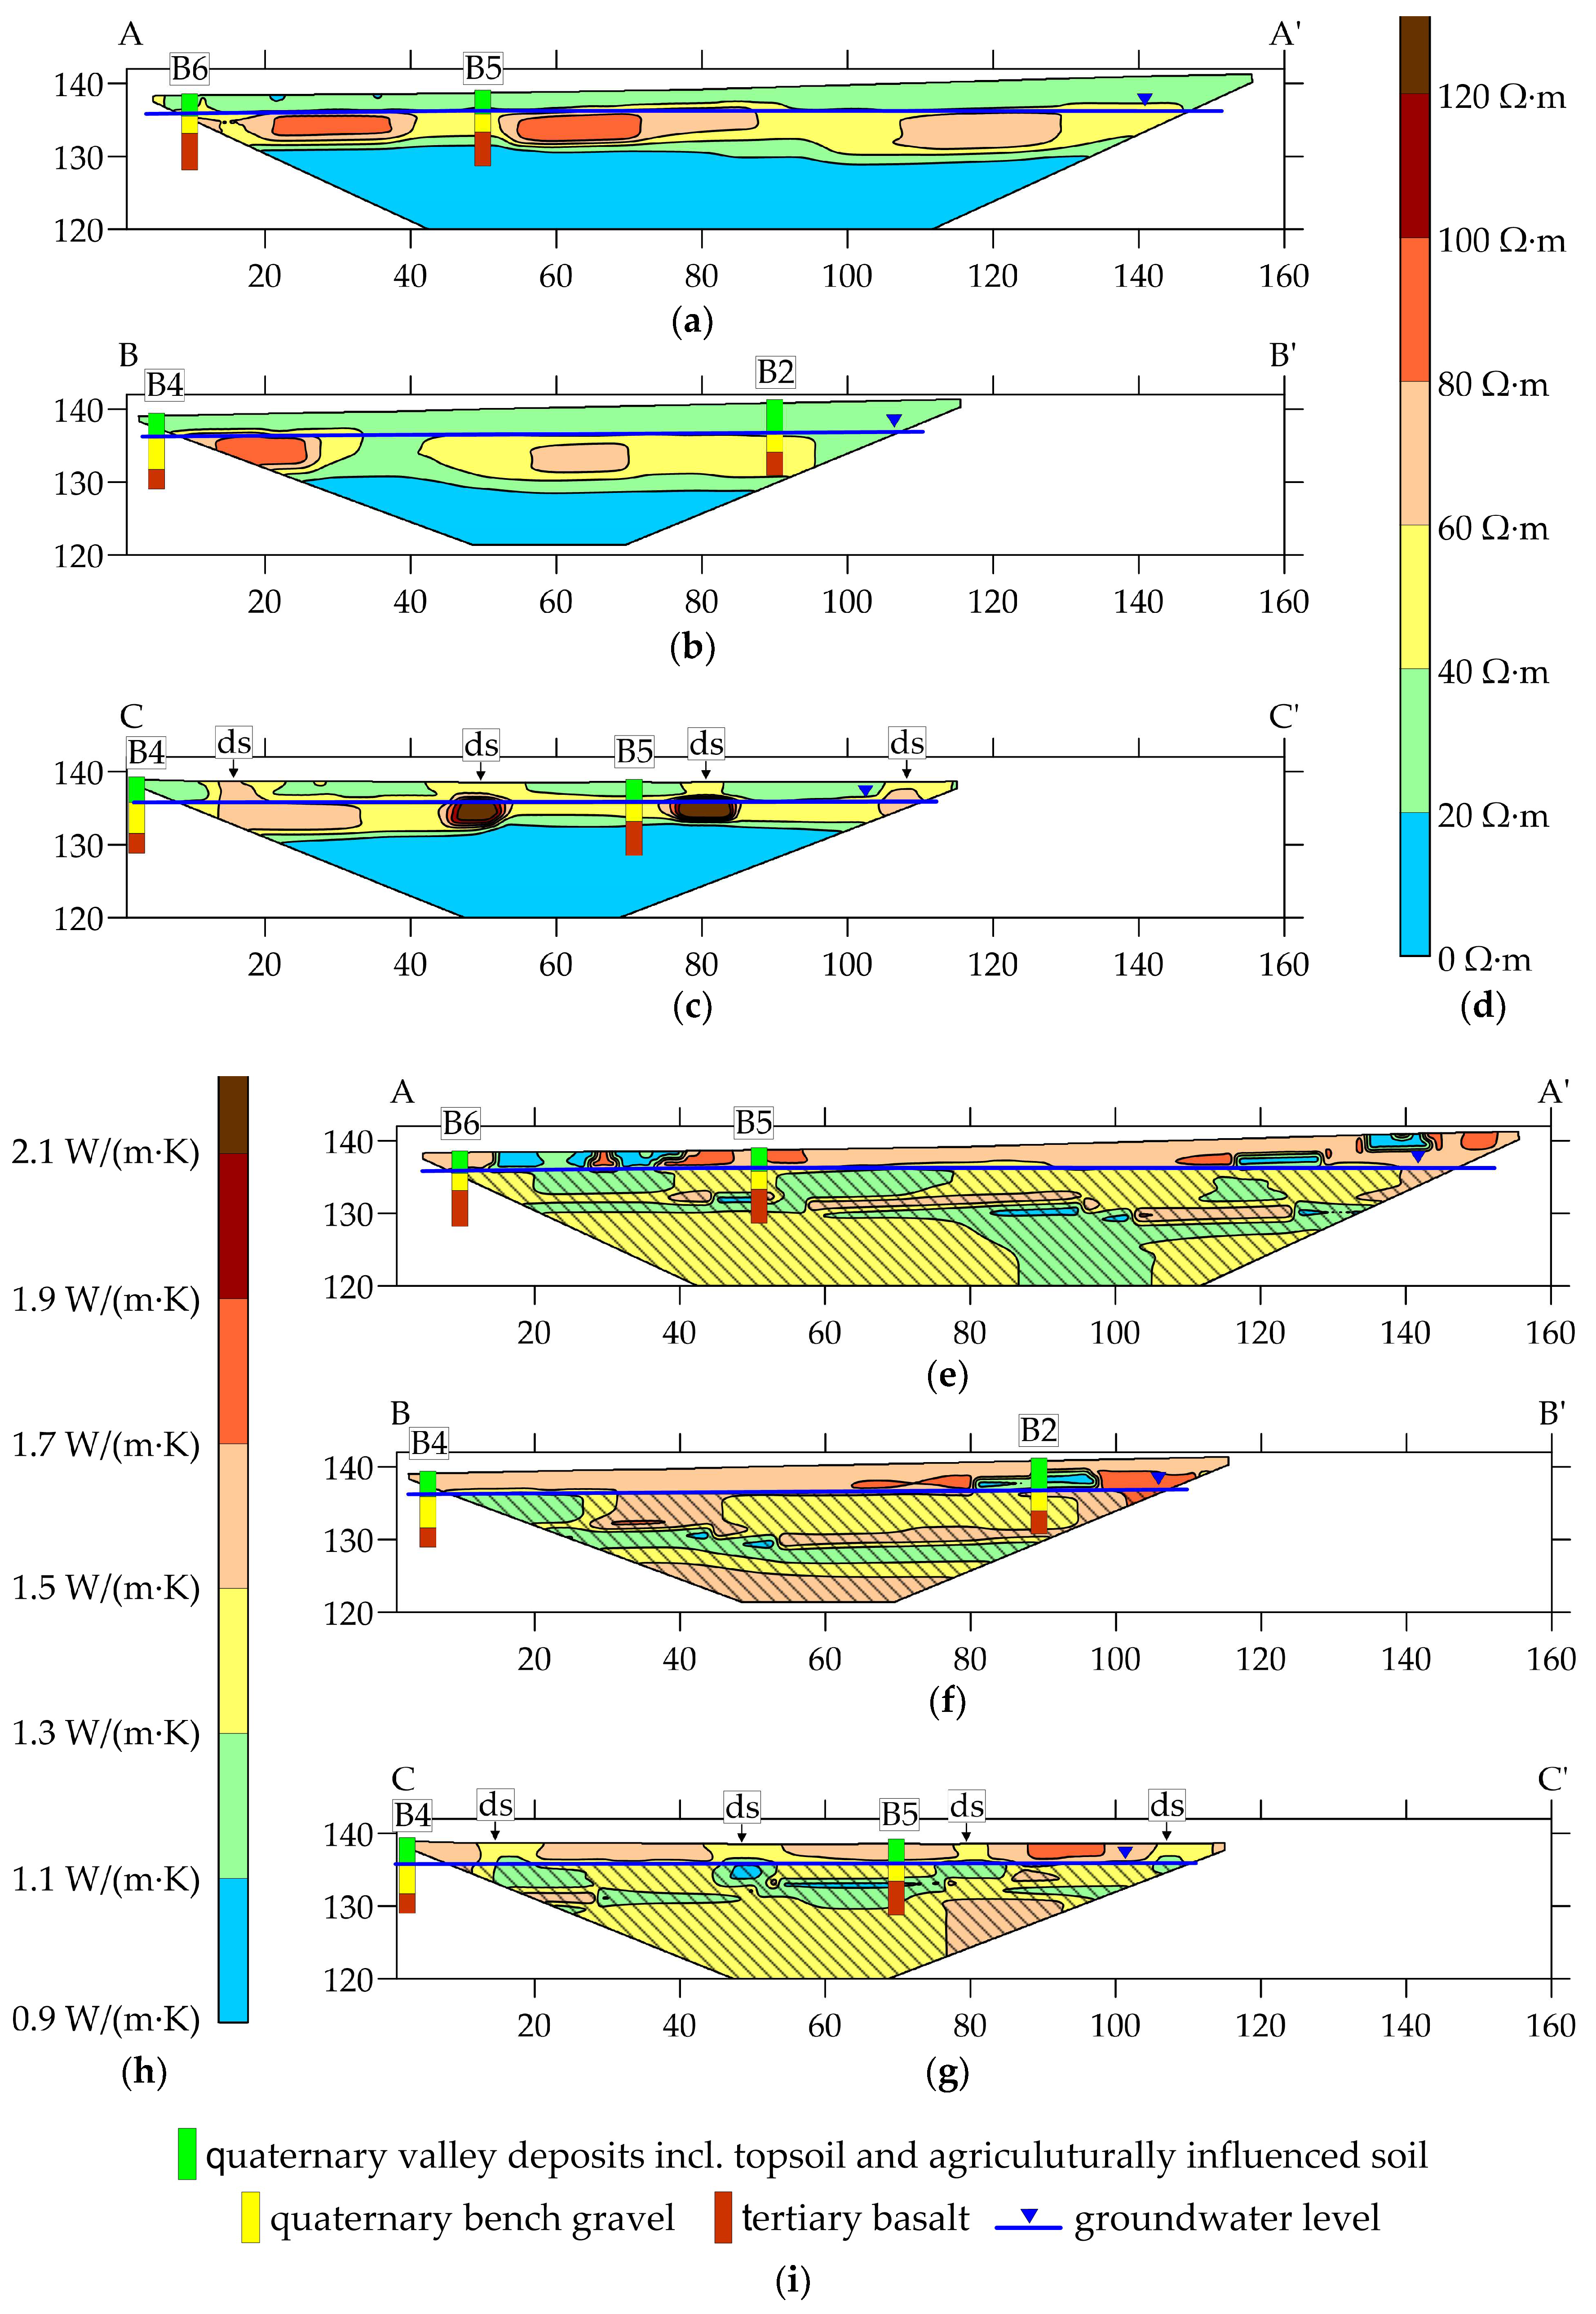
The measured and interpolated electrical resistivities for each section are shown in Figure 6. In the quaternary valley deposits, as well as in the overlaying layers, electrical resistivities between 20 and 40 Ω∙m were mostly observed. Section C showed locally higher resistivities, which, however, are due to distribution shafts. The boundary to the adjacent bench gravel, which also approximately represents the groundwater level, was characterised by increasing resistivities. In the aquifer, values for ER between 40 and 100 Ω∙m were measured, whereby even higher values can be explained by distribution shafts in Section C. The decomposed basalt closer to the surface showed similarly high values, in deeper layers ER decreased to values between 0 and 20 Ω∙m.
For the derivation of soil parameters from ER and respectively σ25, only the unsaturated subsurface was considered in the following. On 7 April 2021, the average groundwater level was 136.3 (±0.3) m above sea level. After temperature correction (Equation (2)), the electrical conductivities predominantly showed values in the separation range of the silt and clay soil type groups.
As can be seen in Table 9, the derived average bulk densities in the unsaturated zone differed only slightly between the individual sections and with depth, averaging 1.49 g/cm3. It is similar to θ, with an average value of 0.25 cm3/cm3. The thermal conductivity ranged between 1.5 and 1.6 W/(m∙K) over large ranges of the sections with locally limited deviations (Figure 6e–g). Especially in the first 50 m of Section A, significantly lower values between 0.9 and 1.1 W/(m∙K) were observed. In Section C, lower values due to the distribution shafts were calculated.

4. Discussion

4.1. Comparison of Laboratory-Scale Methods for Determination of Thermal Conductivity Using Single-Needle Sensors

In the process of the evaporation method, it was observed that maximum values of λ were reached at a medium water content and not at full saturation as expected (Figure 3). Alterations of ρb due to swelling and shrinkage of the sample in the measuring cylinder were also evident. Since, in addition to water content, bulk density also has a significant influence on λ [17,18,19,20], it is assumed that these density changes caused the observed correlation of thermal conductivity and ω.
The shrinkage and swelling processes due to water content changes in clayey soils are further known [58,59,60]. In simplified terms, soil shrinks with decreasing water content until the shrinkage limit [61] and then reaches the highest bulk density. However, the thermal conductivity maximum was reached when the optimum ratio of ρb and ω was present (ω ≥ ωS). The deviating correlation of λ and water content that occurred due to shrinkage is also described by Ardiansyah et al. [62].
The soil samples examined here showed a high (Pearson’s coefficient r = 0.90) and significant (p-value = 4%) linear correlation between the extent of shrinkage and clay content (Figure 7a). However, the clay content is only a rough approach to estimating the susceptibility of soils for shrinkage, since shrinkage is a complex process and contains different phases [63]. In addition to the amount of clay, the type of clay minerals is also decisive [58]. As repacked samples were used, the disturbance of the structural stability due to the installation and compaction of the dried soil samples can also lead to a changed and potentially increased shrinkage behaviour [64]. Therefore, due to the predominantly low plasticity indexes, it is assumed that the repacking process also caused a significant proportion of the observed volume changes. Furthermore, the higher values of ρb_dry than those of ρb_ini also indicate that decreasing water contents additionally led to a rearrangement of the grain structure.
The amount of swelling during capillary saturation also showed a high (r = 0.88) and significant (p-value = 5%) linear correlation with the initially set bulk density (Figure 7b). Increased swelling behaviour with increasing originally-set density was observed.
Installing the soil in the measuring cylinder at a higher water content would reduce the effects of swelling of clayey soils. Similarly, by using undisturbed samples, increased shrinkage during drying, caused by the disturbance of structural stability, can be ruled out.
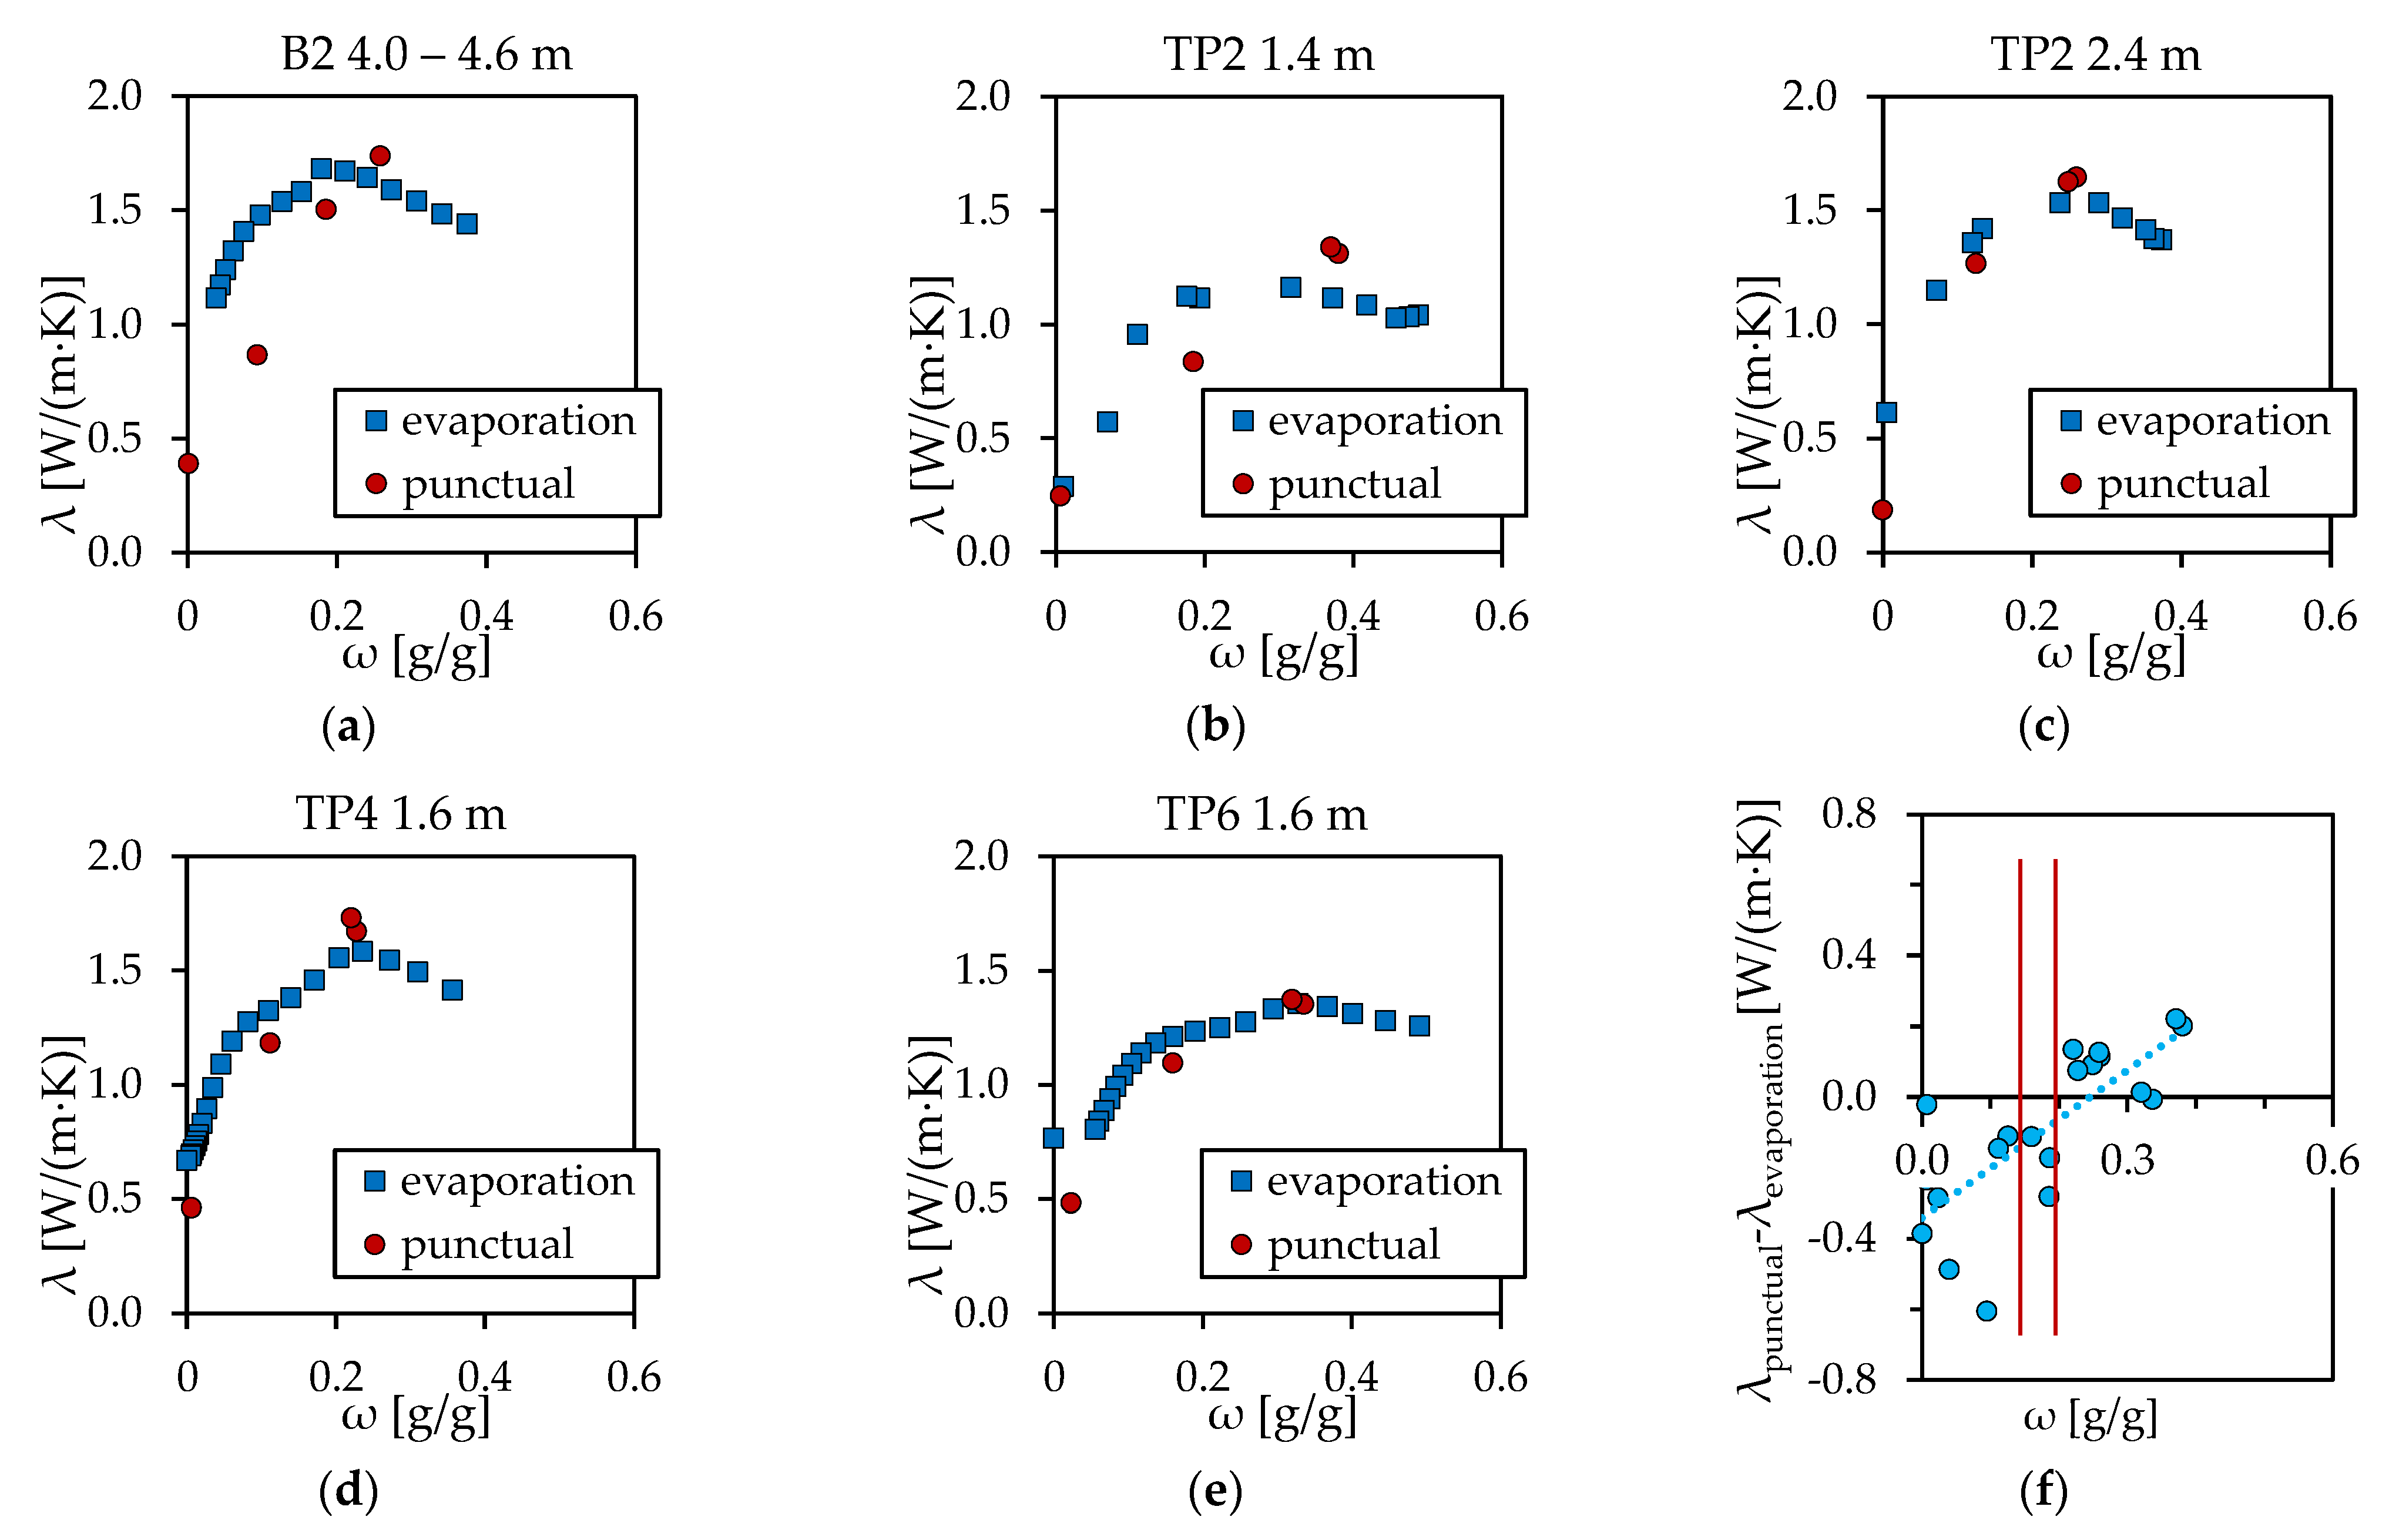
Both methods were performed on five identical samples, so the results can be compared (Figure 8a–e). The values for ρb_ini only differ by a maximum of 0.03 g/cm3.
The measured values for λ differed by up to 0.6 W/(m∙K) at equal water contents. These differences correlated clearly (r = 0.75) and significantly (p-value = 0%) with ω (Figure 8f). At low water contents (ω ≤ ωS), higher values for λ were measured with the evaporation method, whereas at higher water contents (ω > ωS), higher values were determined with the punctual method. This can also be explained by the shrinking and swelling, and the resulting higher and lower densities which occur during the evaporation method. However, this is not always related to the extent of the density change and there were deviations from it.
The comparatively higher densities after capillary saturation also resulted in lower values for ωsat. It is also assumed that in some cases complete saturation by capillary saturation was not achieved with the punctual method.
Due to low water content differences during capillary saturation and oven drying, swelling and shrinkage processes can be significantly reduced with the punctual method. In this study, ω2 was often almost equal to ωsat, and ω1 was in the range of ωS or below. Therefore, an approximately constant density is assumed for the measurements. The punctual method, therefore, has the benefit of a largely controlled and constant bulk density. However, compared to the evaporation method, a large amount of measuring points can only be achieved with increased effort in the laboratory by re-installing the sample each time.
Considering the calculated depth-dependent thermal conductivities (Table 8), the values of the evaporation method were particularly higher at 0.5 and 1.0 m b. g. l., by 0.1 W/(m∙K) on average. As can be seen in Table 5, the used values of ω were between 0.12 and 0.22 and in the range of ωS (Table 6). Accordingly, with the evaporation method, higher bulk densities between 1.3 g/cm3 and 1.8 g/cm3 can be assumed, with a positive effect on thermal conductivity [17,18,19,20]. With the punctual method values for ρb between 1.1 g/cm3 and 1.6 g/cm3 were used (Table 3). Thus, the actual bulk densities of the evaporation method were closer to the measured average bulk densities (Table 5), especially in the near-surface area, and, therefore, presumably provide more realistic values in a large-scale consideration including the near low-temperature district heating network.
At 1.5 m b. g. l., lower thermal conductivities were measured with the evaporation method compared to other depths, despite similar water contents. In addition, the lower value for R2 showed a greater variation in measured values. It is assumed that the CI-soil partially present at this depth has different thermal properties and is less conductive than CL-soil occurring elsewhere (Table 6).
With this large-scale approach, it must be considered that water content and bulk density can be variable over a large area or seasonally due to different land use, climatic influences, or oscillating groundwater level. Accordingly, thermal conductivity is also a variable parameter.
As Figure 4 and Figure 5 show, the decomposed basalt has lower thermal conductivities despite similar soil types and bulk densities. This can probably be attributed to the deviating mineralogical composition of this layer.

4.2. Derivation of Physical and Thermal Soil Parameters from ERTs

The measured electrical resistivities reflected the stratigraphic layer structure (Figure 6a–c). The loamy valley deposits and the loamy agriculturally- or anthropogenically-influenced soils showed already known resistivities for silt and loess loam [65]. Likewise, expectable values for water-saturated gravel were measured for the bench gravel layer. Here, the values fluctuated due to the different contents of fine-grained soil. Basalt as a hard rock normally has significantly higher electrical resistivities. However, low values of 30 Ω∙m can also be measured in saturated basalt [66]. Especially in the deeper range, even lower values were observed here. These can be explained by the local decomposing to clayey ‘Rotlehm’, as in B4. In addition, the groundwater occurring in the partially decomposed and permeable basalt has high electrical conductivities, as was already measured in B3 [14] or is already known elsewhere in Bad Nauheim [67].
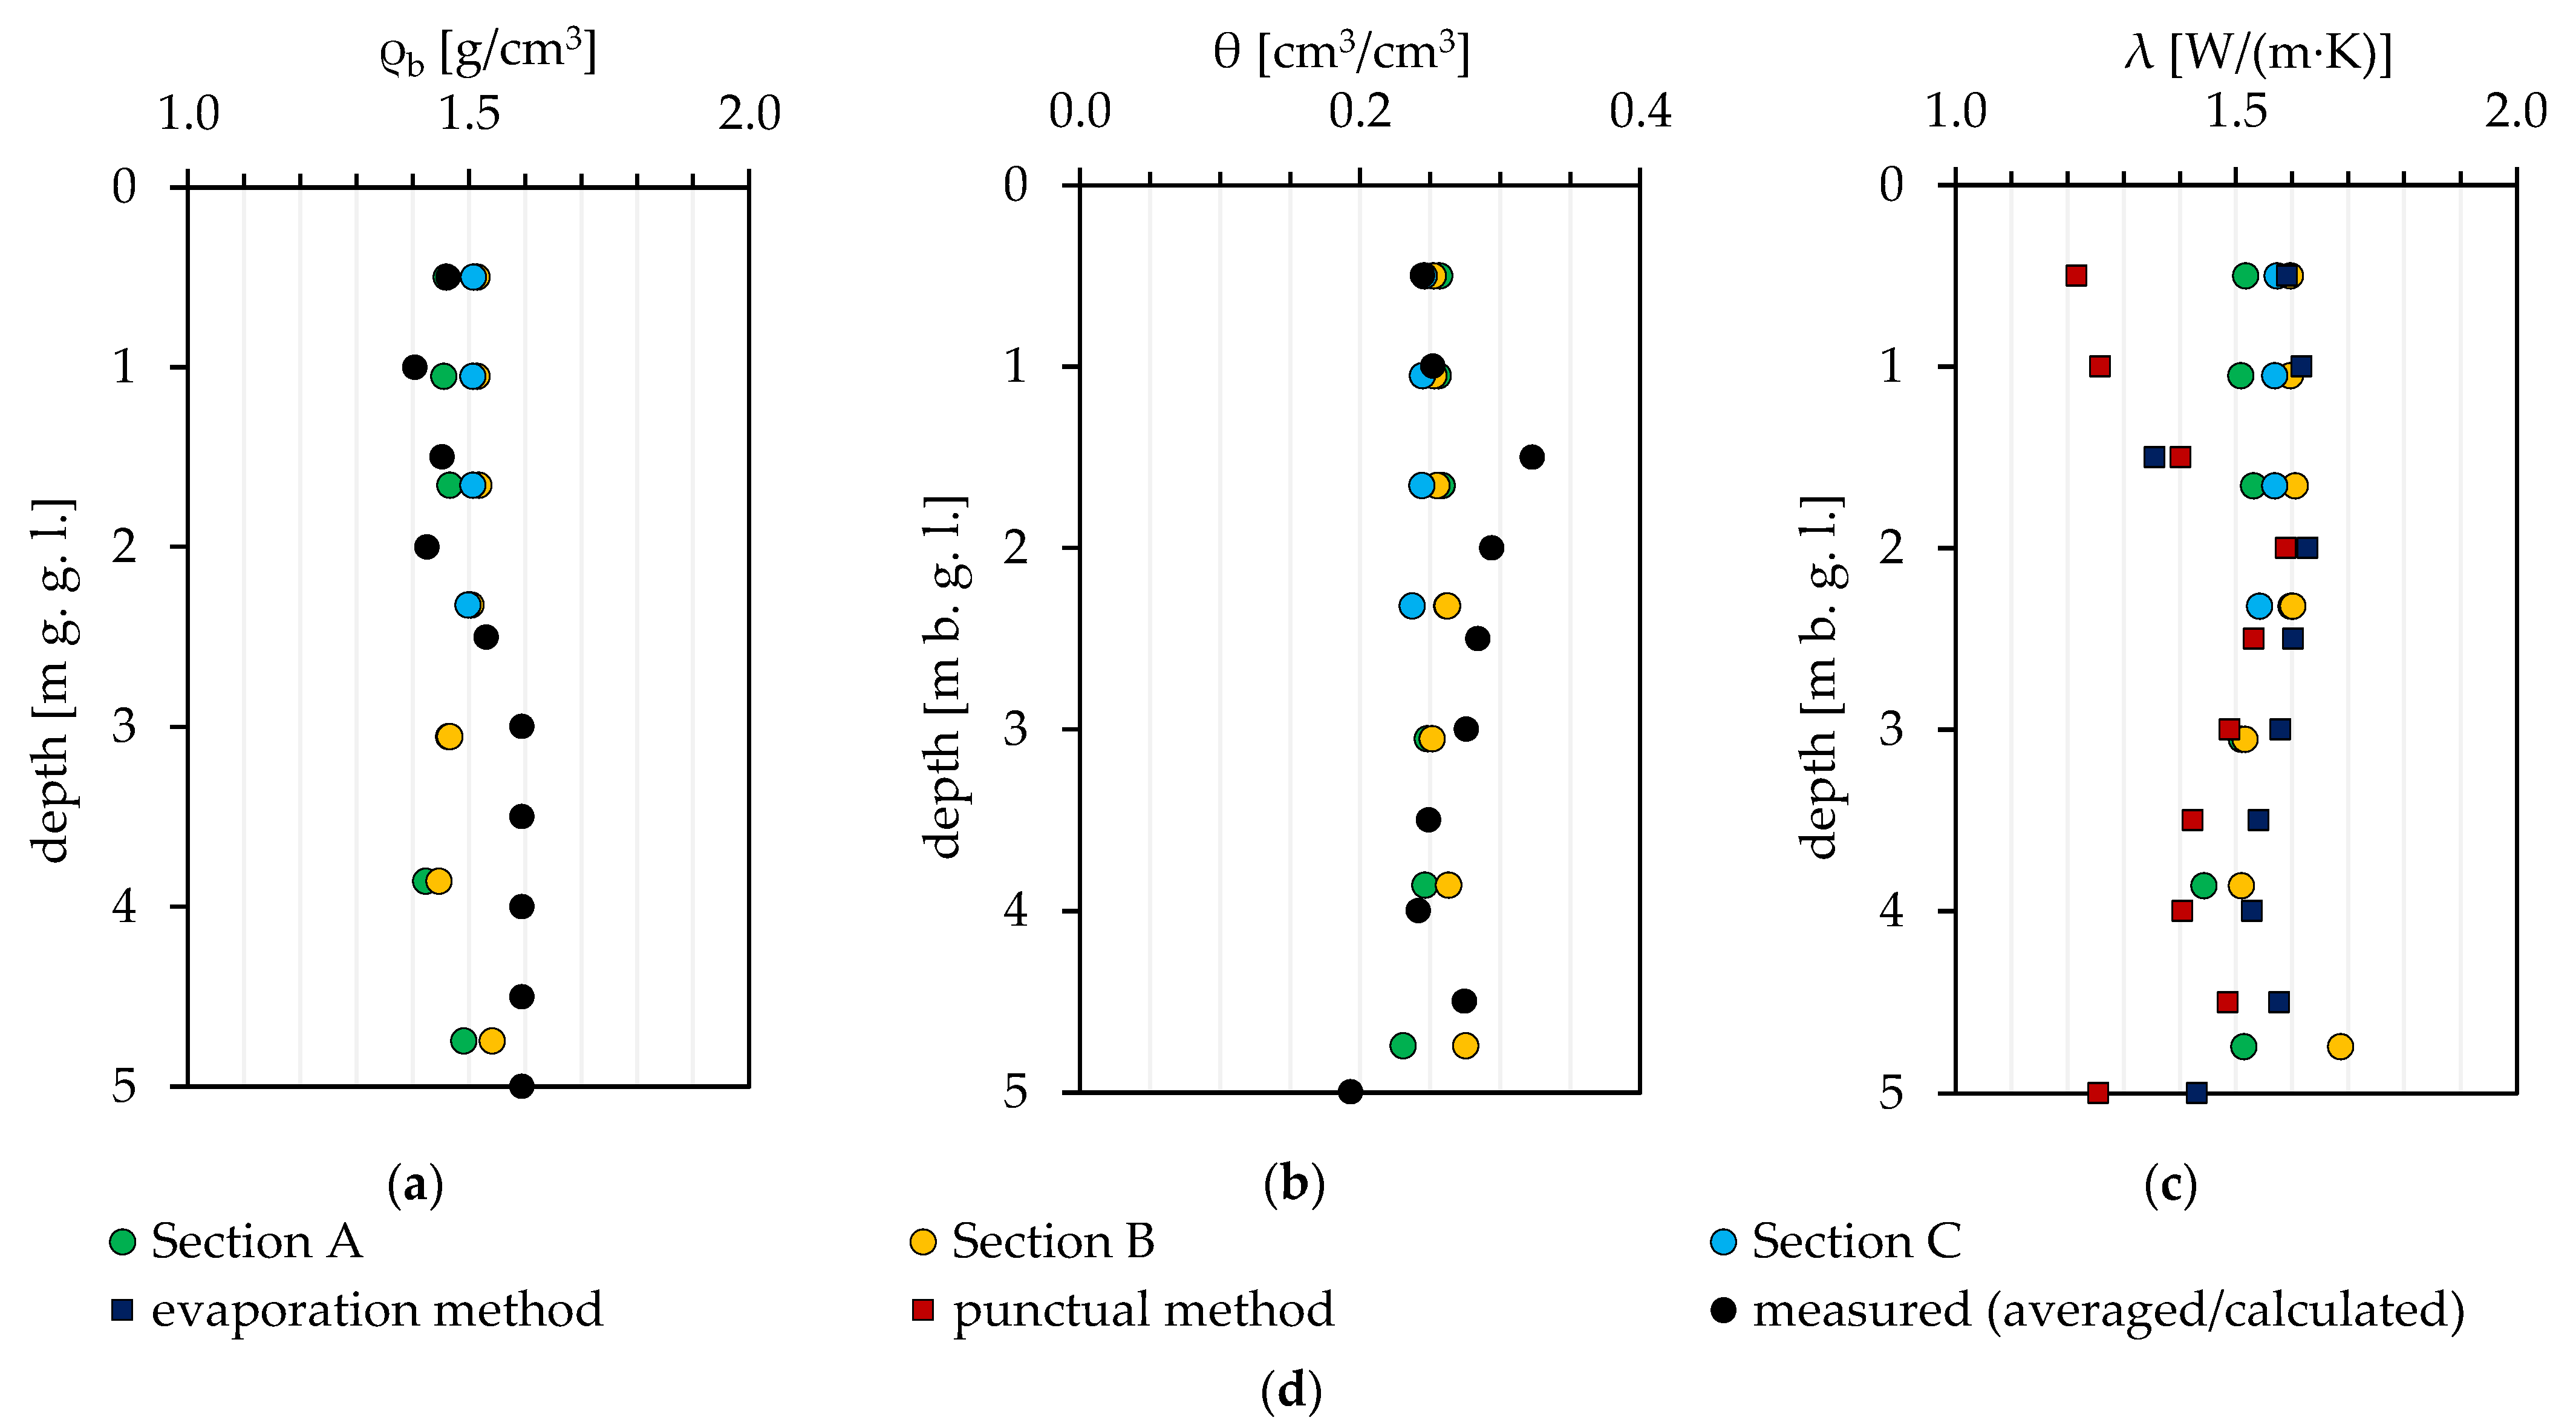
Figure 9 and Table 10 compare the Equations (2)–(10) derived soil parameters of the individual ERT sections (Table 9) with the measured averaged and calculated values of ρb, θ and λ listed in Table 5 and Table 8.
The average derived values of ρb and θ showed only minor deviations when compared with the average measured values. While the relationship between electrical conductivity and water content is significant, according to Schwarz and Bertermann [42], there is actually only a rough relationship between density and electrical conductivity. Therefore, especially the accuracy of the density derivation needs to be investigated in further studies.
Furthermore, as mentioned before, bulk density and water content can be locally and temporally variable. This is particularly evident from 0.5 to 1.5 m b. g. l. considering the calculated standard deviations (Table 5). For this reason, a comparison of only average values in largely uniform soil types is particularly appropriate. In addition, the local disturbances of electrical conductivities by the distribution shafts or other structures are in this case not very significant due to the use of average values.
The thermal conductivities derived from the ERTs were largely 1.5 and 1.6 W/(m∙K) on average (Table 9). However, higher standard deviations (0.2–0.3 W/(m∙K)) due to local sections with lower or higher values are given, especially for Section A and Section B. In total, there were no differences between the derived and measured values using the evaporation method on average. Only at a depth of 1.5 m b. g. l., derived values for λ were higher by 0.2 W/(m∙K) in each section. This is probably due to the CI-soil present at this depth, which is not sufficiently resolved with the ERTs.
With the punctual method, the measured values were, on average, 0.1 W/(m∙K) lower. The highest deviations (up to −0.4 W/(m∙K)) were observed at 0.5 m b. g. l. and 1.0 m b. g. l., presumably due to the lower bulk densities used in the laboratory measurements. Over the entire depth of the unsaturated zone and considering both measurement methods, the average difference was −0.1 W/(m∙K).
The use of average values along the ERT sections and of depth-dependent values for λ, determined from several laboratory scale measurements and water content measurements, provides a rough and large-scale comparison. This is considered particularly useful with regard to LSCs or other larger infrastructure projects. A small-scale comparison is not performed by this approach. Small and locally limited layers or areas with deviating thermal behaviour, such as the less-conductive CI-soil in this case, are not detected by this procedure. In addition, ERT sections can have locally small-scale, presumably unrealistic values due to interfering factors, either unknown or due to, for example, distribution shafts. These could decisively affect the derivation of soil parameters in detailed investigations.

5. Conclusions

The comparison of the two laboratory measurement methods using single-needle sensors—the evaporation method based on Markert et al. [27] and the punctual method—shows the benefits and disadvantages of both approaches.
With the evaporation method, changes in the density of the sample body affected the measurements. These swelling and shrinking processes were caused by the clay content and by the use of repacked soil samples. Such effects can be reduced by using undisturbed soil samples and by installing the soil sample in an already moist state. Soils with a low clay content are also expected to have fewer density alterations. The benefit of this method is that the continuous measurement generates a data set that can cover the complete water content range. In addition, the laboratory effort for each measurement is comparatively low.
With the punctual method, a sufficiently constant density can be ensured for the measurements—even with clayey and repacked soil samples. However, this is conditionally dependent on the selected water contents at which the thermal conductivity is measured. Due to the two times of installation in the measuring cylinders, the laboratory effort per measurement increases. In addition, it is only possible to generate a larger number of measurement points with greater effort or by combining both methods.
The thermal conductivities derived from the ERTs showed largely minor deviations from the laboratory measurements using a large-scale approach based on averaged values. According to the results of this study, ERTs could be used for non-invasive thermal exploration of the very shallow, unsaturated subsurface in the context of large-scale infrastructure projects such as LSCs. Due to the calculation of λ according to Kersten [22] as proposed by Schwarz and Bertermann [42], no prior knowledge about the subsurface to be investigated is required. However, the soil parameters derived in this study are site-specific and particularly the correlation of bulk density and electrical conductivity is only rough. Therefore, further investigations by comparative measurements are necessary to verify the accuracy and utility of this methodology considering different soil types, soil compositions, and subsurface conditions.

Author Contributions

Conceptualization, M.R.; methodology, M.R. and H.S.; software, M.R. and H.S.; validation, M.R.; formal analysis, M.R.; investigation, M.R., H.S. and J.W.; resources, D.B.; data curation, M.R.; writing—original draft preparation, M.R.; writing—review and editing, M.R., H.S., J.W. and D.B.; visualization, M.R.; supervision, D.B.; project administration, D.B. and M.R.; and funding acquisition, D.B. All authors have read and agreed to the published version of the manuscript.

Funding

This research was funded in the cause of the research project ‘KNW-Opt’ by Federal Ministry for Economic Affairs and Climate Action (BMWK), Grant No. 03EN3020C.

Data Availability Statement

The data presented in this study are available on request from the corresponding author. The data are not publicly available due to privacy restrictions.

Acknowledgments

A big thank you goes to our research partners Stockinger and his group from the Technische Hochschule Nürnberg as well as to Stadtwerke Bad Nauheim GmbH, who provided administrative support during our measurements. In addition, thanks to the members of the shallow geothermal working group at Friedrich-Alexander Universität Erlangen-Nürnberg, especially Hannes Hagenauer and Oliver Suft, for help with the measurements and valuable discussions.

Conflicts of Interest

The authors declare no conflict of interest.

Nomenclature

Acronyms
CIIntermediate plastic clay
CLLow plastic clay
ERTElectrical resistivity tomography
LSCLarge-scale geothermal collector system
Variables
θvolumetric water content [cm3/cm3]
λthermal conductivity [W/(m∙K)]
ρbbulk density [g/cm3]
ρwdensity of water [g/cm3]
σ25electrical conductivity at a temperature of 25 °C [S/m]
σTelectrical conductivity [S/m] at a temperature T
ωgravimetric water content [g/g]
ωLliquid limit [g/g]
ωPplastic limit [g/g]
ωSshrinkage limit [g/g]
ERelectrical resistivity [Ω∙m]
fTtemperature correction factor [-]
IPplasticity index [-]
Tsubsurface temperature [°C]
XClayCorrection factor for soil type group Clay [-]
XSiltCorrection factor for soil type group Silt [-]

References

  1. Vienken, T.; Händel, F.; Epting, J.; Dietrich, P.; Liedl, R.; Huggenberger, P. Energiewende braucht Wärmewende—Chancen und Limitierungen der intensiven thermischen Nutzung des oberflächennahen Untergrundes in urbanen Gebieten vor dem Hintergrund der aktuellen Energiedebatte in Deutschland. Grundwasser 2015, 21, 5. [Google Scholar] [CrossRef]
  2. Zeh, R.; Ohlsen, B.; Philipp, D.; Bertermann, D.; Kotz, T.; Jocic, N.; Stockinger, V. Large-Scale Geothermal Collector Systems for 5th Generation District Heating and Cooling Networks. Sustainability 2021, 13, 6035. [Google Scholar] [CrossRef]
  3. Boesten, S.; Ivens, W.; Dekker, S.C.; Eijdems, H. 5th generation district heating and cooling systems as a solution for renewable urban thermal energy supply. Adv. Geosci. 2019, 49, 129–136. [Google Scholar] [CrossRef] [Green Version]
  4. Buffa, S.; Cozzini, M.; D’Antoni, M.; Baratieri, M.; Fedrizzi, R. 5th generation district heating and cooling systems: A review of existing cases in Europe. Renew. Sustain. Energy Rev. 2019, 104, 504–522. [Google Scholar] [CrossRef]
  5. Di Sipio, E.; Bertermann, D. Factors Influencing the Thermal Efficiency of Horizontal Ground Heat Exchangers. Energies 2017, 10, 1897. [Google Scholar] [CrossRef] [Green Version]
  6. Di Sipio, E.; Bertermann, D. Thermal properties variations in unconsolidated material for very shallow geothermal application (ITER project). Int. Agrophys. 2018, 32, 149–164. [Google Scholar] [CrossRef]
  7. Sangi, R.; Müller, D. Dynamic modelling and simulation of a slinky-coil horizontal ground heat exchanger using Modelica. J. Build. Eng. 2018, 16, 159–168. [Google Scholar] [CrossRef]
  8. Selamat, S.; Miyara, A.; Kariya, K. Analysis of Short Time Period of Operation of Horizontal Ground Heat Exchangers. Resources 2015, 4, 507–523. [Google Scholar] [CrossRef] [Green Version]
  9. Wu, Y.; Gan, G.; Verhoef, A.; Vidale, P.L.; Gonzalez, R.G. Experimental measurement and numerical simulation of horizontal-coupled slinky ground source heat exchangers. Appl. Therm. Eng. 2010, 30, 2574–2583. [Google Scholar] [CrossRef] [Green Version]
  10. Arning, E.; Kölling, M.; Schulz, H.D.; Panteleit, B.; Reichling, J. Einfluss oberflächennaher Wärmegewinnung auf geochemische Prozesse im Grundwasserleiter. Grundwasser 2006, 11, 27–39. [Google Scholar] [CrossRef]
  11. Bonte, M.; van Breukelen, B.M.; Stuyfzand, P.J. Temperature-induced impacts on groundwater quality and arsenic mobility in anoxic aquifer sediments used for both drinking water and shallow geothermal energy production. Water Res. 2013, 47, 5088–5100. [Google Scholar] [CrossRef] [PubMed]
  12. Brielmann, H.; Griebler, C.; Schmidt, S.I.; Michel, R.; Lueders, T. Effects of thermal energy discharge on shallow groundwater ecosystems. FEMS Microbiol. Ecol. 2009, 68, 273–286. [Google Scholar] [CrossRef] [PubMed] [Green Version]
  13. Brielmann, H.; Lueders, T.; Schreglmann, K.; Ferraro, F.; Avramov, M.; Hammerl, V.; Blum, P.; Bayer, P.; Griebler, C. Oberflächennahe Geothermie und ihre potenziellen Auswirkungen auf Grundwasserökosysteme. Grundwasser 2011, 16, 77. [Google Scholar] [CrossRef]
  14. Bertermann, D.; Rammler, M. Suitability of Screened Monitoring Wells for Temperature Measurements Regarding Large-Scale Geothermal Collector Systems. Geosciences 2022, 12, 162. [Google Scholar] [CrossRef]
  15. Hähnlein, S.; Bayer, P.; Ferguson, G.; Blum, P. Sustainability and policy for the thermal use of shallow geothermal energy. Energy Policy 2013, 59, 914–925. [Google Scholar] [CrossRef]
  16. Taylor, C.A.; Stefan, H.G. Shallow groundwater temperature response to climate change and urbanization. J. Hydrol. 2009, 375, 601–612. [Google Scholar] [CrossRef]
  17. Farouki, O.T. Thermal Properties of Soils; Cold Regions Research and Engineering Lab: Hanover, NH, USA, 1981. [Google Scholar]
  18. Bertermann, D.; Klug, H.; Morper-Busch, L.; Bialas, C. Modelling vSGPs (very shallow geothermal potentials) in selected CSAs (case study areas). Energy 2014, 71, 226–244. [Google Scholar] [CrossRef]
  19. Abu-Hamdeh, N.H. Thermal Properties of Soils as affected by Density and Water Content. Biosyst. Eng. 2003, 86, 97–102. [Google Scholar] [CrossRef]
  20. Abu-Hamdeh, N.H.; Reeder, R.C. Soil Thermal Conductivity Effects of Density, Moisture, Salt Concentration, and Organic Matter. Soil Sci. Soc. Am. J. 2000, 64, 1285–1290. [Google Scholar] [CrossRef]
  21. Côté, J.; Konrad, J.-M. A generalized thermal conductivity model for soils and construction materials. Can. Geotech. J. 2011, 42, 443–458. [Google Scholar] [CrossRef]
  22. Kersten, M. Thermal Properties of Soils; University of Minnesota: Mineapolis, MN, USA, 1949. [Google Scholar]
  23. Lu, Y.; Lu, S.; Horton, R.; Ren, T. An Empirical Model for Estimating Soil Thermal Conductivity from Texture, Water Content, and Bulk Density. Soil Sci. Soc. Am. J. 2014, 78, 1859–1868. [Google Scholar] [CrossRef]
  24. Markert, A.; Bohne, K.; Facklam, M.; Wessolek, G. Pedotransfer Functions of Soil Thermal Conductivity for the Textural Classes Sand, Silt, and Loam. Soil Sci. Soc. Am. J. 2017, 81, 1315–1327. [Google Scholar] [CrossRef]
  25. Barry-Macaulay, D.; Bouazza, A.; Singh, R.M.; Wang, B.; Ranjith, P.G. Thermal conductivity of soils and rocks from the Melbourne (Australia) region. Eng. Geol. 2013, 164, 131–138. [Google Scholar] [CrossRef] [Green Version]
  26. Low, J.E.; Loveridge, F.A.; Powrie, W.; Nicholson, D. A comparison of laboratory and in situ methods to determine soil thermal conductivity for energy foundations and other ground heat exchanger applications. Acta Geotech. 2015, 10, 209–218. [Google Scholar] [CrossRef]
  27. Markert, A.; Peters, A.; Wessolek, G. Analysis of the Evaporation Method to Obtain Soil Thermal Conductivity Data in the Full Moisture Range. Soil Sci. Soc. Am. J. 2016, 80, 275–283. [Google Scholar] [CrossRef]
  28. Suft, O.; Bertermann, D. One-Year Monitoring of a Ground Heat Exchanger Using the In Situ Thermal Response Test: An Experimental Approach on Climatic Effects. Energies 2022, 15, 9490. [Google Scholar] [CrossRef]
  29. Zarrella, A.; Emmi, G.; Graci, S.; De Carli, M.; Cultrera, M.; Santa, G.D.; Galgaro, A.; Bertermann, D.; Müller, J.; Pockelé, L.; et al. Thermal Response Testing Results of Different Types of Borehole Heat Exchangers: An Analysis and Comparison of Interpretation Methods. Energies 2017, 10, 801. [Google Scholar] [CrossRef] [Green Version]
  30. Dimech, A.; Cheng, L.; Chouteau, M.; Chambers, J.; Uhlemann, S.; Wilkinson, P.; Meldrum, P.; Mary, B.; Fabien-Ouellet, G.; Isabelle, A. A Review on Applications of Time-Lapse Electrical Resistivity Tomography Over the Last 30 Years: Perspectives for Mining Waste Monitoring. Surv. Geophys. 2022, 43, 1699–1759. [Google Scholar] [CrossRef]
  31. Loke, M.H.; Chambers, J.E.; Rucker, D.F.; Kuras, O.; Wilkinson, P.B. Recent developments in the direct-current geoelectrical imaging method. J. Appl. Geophys. 2013, 95, 135–156. [Google Scholar] [CrossRef]
  32. Loke, M.H.; Rucker, D.F.; Chambers, J.E.; Wilkinson, P.B.; Kuras, O. Electrical Resistivity Surveys and Data Interpretation. In Encyclopedia of Solid Earth Geophysics; Gupta, H.K., Ed.; Springer International Publishing: Cham, Switzerland, 2020; pp. 1–6. [Google Scholar]
  33. Samouëlian, A.; Cousin, I.; Tabbagh, A.; Bruand, A.; Richard, G. Electrical resistivity survey in soil science: A review. Soil Tillage Res. 2005, 83, 173–193. [Google Scholar] [CrossRef]
  34. Bertermann, D.; Schwarz, H. Laboratory device to analyse the impact of soil properties on electrical and thermal conductivity. Int. Agrophys. 2017, 31, 157–166. [Google Scholar] [CrossRef] [Green Version]
  35. Logsdon, S.; Green, T.; Bonta, J.; Seyfried, M.; Evett, S. Comparison of Electrical and Thermal Conductivities for Soils from Five States. Soil Sci. 2010, 175, 573–578. [Google Scholar] [CrossRef] [Green Version]
  36. Tokoro, T.; Ishikawa, T.; Shirai, S.; Nakamura, T. Estimation methods for thermal conductivity of sandy soil with electrical characteristics. Soils Found. 2016, 56, 927–936. [Google Scholar] [CrossRef]
  37. Bai, W.; Kong, L.-W.; Guo, A. Effects of physical properties on electrical conductivity of compacted lateritic soil. J. Rock Mech. Geotech. Eng. 2013, 5, 406–411. [Google Scholar] [CrossRef] [Green Version]
  38. Corwin, D.L.; Lesch, S.M. Apparent soil electrical conductivity measurements in agriculture. Comput. Electron. Agric. 2005, 46, 11–43. [Google Scholar] [CrossRef]
  39. Ewing, R.P.; Hunt, A.G. Dependence of the Electrical Conductivity on Saturation in Real Porous Media. Vadose Zone J. 2006, 5, 731–741. [Google Scholar] [CrossRef]
  40. Friedman, S.P. Soil properties influencing apparent electrical conductivity: A review. Comput. Electron. Agric. 2005, 46, 45–70. [Google Scholar] [CrossRef]
  41. McCutcheon, M.C.; Farahani, H.J.; Stednick, J.D.; Buchleiter, G.W.; Green, T.R. Effect of Soil Water on Apparent Soil Electrical Conductivity and Texture Relationships in a Dryland Field. Biosyst. Eng. 2006, 94, 19–32. [Google Scholar] [CrossRef]
  42. Schwarz, H.; Bertermann, D. Mediate relation between electrical and thermal conductivity of soil. Geomech. Geophys. Geo-Energy Geo-Resour. 2020, 6, 50. [Google Scholar] [CrossRef]
  43. Narain Singh, D.; Kuriyan, S.J.; Chakravarthy Manthena, K. A generalised relationship between soil electrical and thermal resistivities. Exp. Therm. Fluid Sci. 2001, 25, 175–181. [Google Scholar] [CrossRef]
  44. Sreedeep, S.; Reshma, A.C.; Singh, D.N. Generalized relationship for determining soil electrical resistivity from its thermal resistivity. Exp. Therm. Fluid Sci. 2005, 29, 217–226. [Google Scholar] [CrossRef]
  45. Sun, Q.; Lü, C. Semiempirical correlation between thermal conductivity and electrical resistivity for silt and silty clay soils. Geophysics 2019, 84, MR99–MR105. [Google Scholar] [CrossRef]
  46. Wang, J.; Zhang, X.; Du, L. A laboratory study of the correlation between the thermal conductivity and electrical resistivity of soil. J. Appl. Geophys. 2017, 145, 12–16. [Google Scholar] [CrossRef]
  47. Dong, Y.; McCartney, J.S.; Lu, N. Critical Review of Thermal Conductivity Models for Unsaturated Soils. Geotech. Geol. Eng. 2015, 33, 207–221. [Google Scholar] [CrossRef]
  48. Kümmerle, E. Geologische Karte von Hessen 1:25000 5618 Friedberg; Hessisches Landesamt für Bodenforschung: Wiesbaden, Germany, 1976. [Google Scholar]
  49. Kümmerle, E. Erläuterungen zur Geologischen Karte von Hessen 1: 25000 Blatt Nr. 5618 Friedberg; Hessisches Landesamt für Bodenforschung: Wiesbaden, Germany, 1976; p. 247. [Google Scholar]
  50. DIN EN ISO 11272; Soil Quality—Determination of Dry Bulk Density (ISO 11272:2017). German version EN ISO 11272:2017; Beuth Verlag GmbH: Berlin, Germany, 2017.
  51. DIN EN ISO 17892-1; Geotechnical Investigation and Testing—Laboratory Testing of Soil—Part 1: Determination of Water Content (ISO 17892-1:2014). German Version EN ISO 17892-1:2014; Beuth Verlag GmbH: Berlin, Germany, 2015.
  52. DIN EN ISO 17892-12; Geotechnical Investigation and Testing—Laboratory Testing of Soil—Part 12: Determination of Liquid and Plastic Limits (ISO 17892-12:2018). German version EN ISO 17892-12:2018; Beuth Verlag GmbH: Berlin, Germany, 2020.
  53. Krabbe, W. Über die Schrumpfung bindiger Böden. Mitteilungen der Hannoverschen Versuchsanstalt für Grundbau und Wasserbau 1958, 13, 256–342. [Google Scholar]
  54. IEEE Std 442-1981; IEEE Guide for Soil Thermal Resistivity Measurements. IEEE Power Engineering Society: New York, NY, USA, 1981.
  55. ASTM D5334; Standard Test Method for Determination of Thermal Conductivity of Soil and Soft Rock by Thermal Needle Probe Procedure. ASTM International: West Conshohocken, PA, USA, 2014.
  56. Sheets, K.R.; Hendrickx, J.M.H. Noninvasive Soil Water Content Measurement Using Electromagnetic Induction. Water Resour. Res. 1995, 31, 2401–2409. [Google Scholar] [CrossRef]
  57. Bertermann, D.; Schwarz, H. Bulk density and water content-dependent electrical resistivity analyses of different soil classes on a laboratory scale. Environ. Earth Sci. 2018, 77, 570. [Google Scholar] [CrossRef]
  58. Boivin, P.; Garnier, P.; Tessier, D. Relationship between Clay Content, Clay Type, and Shrinkage Properties of Soil Samples. Soil Sci. Soc. Am. J. 2004, 68, 1145–1153. [Google Scholar] [CrossRef] [Green Version]
  59. Haines, W.B. The volume-changes associated with variations of water content in soil. J. Agric. Sci. 1923, 13, 296–310. [Google Scholar] [CrossRef]
  60. Smith, C.W.; Hadas, A.; Dan, J.; Koyumdjisky, H. Shrinkage and Atterberg limits in relation to other properties of principal soil types in Israel. Geoderma 1985, 35, 47–65. [Google Scholar] [CrossRef]
  61. Sharanya, A.G.; Mudavath, H.; Thyagaraj, T. Review of methods for predicting soil volume change induced by shrinkage. Innov. Infrastruct. Solut. 2021, 6, 116. [Google Scholar] [CrossRef]
  62. Ardiansyah; Shiozawa, S.; Nishida, K. Thermal properties and shrinkage-swelling characteristic of clay soil in a tropical paddy field. J. Jpn. Soc. Soil Phys. 2008, 110, 67–77. [Google Scholar]
  63. Brake, B.; Ploeg, M.; de Rooij, G. Water storage change estimation from in situ shrinkage measurements of clay soils. Hydrol. Earth Syst. Sci. 2013, 17, 1933–1949. [Google Scholar] [CrossRef] [Green Version]
  64. Schäffer, B.; Schulin, R.; Boivin, P. Shrinkage Properties of Repacked Soil at Different States of Uniaxial Compression. Soil Sci. Soc. Am. J. 2013, 77, 1930–1943. [Google Scholar] [CrossRef]
  65. Knödel, K.; Krummel, H.; Lange, G. Handbuch zur Erkundung des Untergrundes von Deponien und Altlasten Band 3: Geophysik; Springer: Berlin, Germany, 2005; p. 1102. [Google Scholar]
  66. Zohdy, A.A.R.; Jackson, D.B. Application of deep electrical soundings for groundwater exploration in Hawaii. Geophysics 1969, 34, 584–600. [Google Scholar] [CrossRef]
  67. Schäffer, R.; Sass, I. Ausbreitung und Vermischung geogener, kohlendioxidführender Thermalsole in oberflächennahem Grundwasser, Bad Nauheim. Grundwasser 2016, 21, 305–319. [Google Scholar] [CrossRef]
Figure 1. (a) Test site and location of sampling points, electrical resistivity tomography (ERT) sections and groundwater contour lines from the groundwater level measurements on 7 April 2021 specified in meters above sea level (m a. s. l.); (b) Boreholes (B1–B6), ramming core drillholes (RCD1-RCD4) and trial pits (TP1–TP6), thickness of their stratigraphic units in meters below ground level (m b. g. l.) and USDA (U.S. Department of Agriculture) soil classification for predominantly fine-grained soils based on grain size analyses. The groundwater level measured on 7 April 2021 and for TP3 on 25 November 2020 is also shown. TP2, TP4, TP5 and TP6 were conducted in backfilled areas, so that the stratigraphic layer structure may be disturbed, and the stratification shown above can only be understood as rough.
Energies 16 01195 g001
Figure 2. Schematic illustration of the procedure for thermal conductivity (λ) measurements explained in Table 2 with (a) evaporation method based on Markert et al. [27] and (b) punctual method with measurement of λ at four selected gravimetric water contents (ω): medium water contents (ω1 and ω2), water content after oven drying (ωdry) and water content after capillary saturation (ωsat). The selection of the water contents ω1 and ω2 was based on the results of the evaporation method.
Energies 16 01195 g002
Figure 3. Results of thermal conductivity (λ) measurements as a function of the gravimetric water content (ω) using the evaporation method for samples of (a) TP1, (b) TP2 and (c) B2, TP4 and TP6. A maximum of one measuring point per 24 h is displayed.
Energies 16 01195 g003
Figure 4. Results of thermal conductivity (λ) measurements as a function of the gravimetric water content (ω) using the punctual method for samples of (a) B2, B4 and B5, (b) TP2, (c) TP4 and (d) TP6.
Energies 16 01195 g004
Figure 5. Measured values for λ as a function of gravimetric water content in specific depth intervals for (a) the evaporation method and (b) the punctual method. In addition, the measured thermal conductivity of decomposed basalt samples (>5 m b. g. l.) is shown in (b). For the evaporation method, a maximum of one measuring point per 24 h is displayed. Chart legend is shown in (c).
Energies 16 01195 g005
Figure 6. (ad) Distribution of electrical resistivities in the subsurface along the ERT sections with colour scale; (eh) derived thermal conductivities for each ERT section with colour scale. The derivation method is only applicable to the unsaturated zone (area that is not hatched). Shown also are simplified profiles of boreholes crossed by ERT sections and groundwater level from 7 April 2021, legend is shown in (i). In addition, the location of distribution shafts (ds) is shown in Section C. Altitudes are given in meters above sea level, length in meters.
Energies 16 01195 g006
Figure 7. (a) Correlation of the difference of ρb_sat and the bulk density after oven drying (ρb_dry) with clay content; (b) correlation of the difference between the initial bulk density (ρb_ini) and the density after saturation (ρb_sat) with ρb_ini. The differences were calculated with the actual measured bulk densities and not with the rough indication of Table 7.
Energies 16 01195 g007
Figure 8. (ae) Comparison of the results of the evaporation method and the punctual method. For the evaporation method, a maximum of one measuring point per 24 h is displayed; (f) correlation between the differences of measured values for λ with the punctual method (λpunctual) and the evaporation method (λevaporation) at matching values of ω. The two red lines represent the area, where ωS is located according to Table 6. If no measurement data was available at equal water contents, λ was linearly interpolated.
Energies 16 01195 g008
Figure 9. Comparison of average ERT-derived (a) bulk densities, (b) volumetric water contents and (c) thermal conductivities with measured and calculated values for the unsaturated zone. Chart legend is shown in (d).
Energies 16 01195 g009
Table 1. Conducted field and laboratory investigations of soils and soil samples in the unsaturated zone in the range of the large-scale geothermal collector system (LSC) and the near low-temperature district heating and cooling network.
ParameterNumber of TestsMethod
dry bulk density (ρb)36undisturbed sampling with stabbing cylinders and oven drying based on DIN EN ISO 11272 [50]
gravimetric water content (ω)57sampling and oven drying based on DIN EN ISO 17892-1 [51]
Atterberg limits and plasticity index5plastic limit (ωP), liquid limit (ωL) and plasticity index (IP) according to DIN EN ISO 17892-12 [52] and shrinkage limit (ωS) according to Krabbe [53]
Table 2. Measurement devices and approaches for thermal conductivity (λ) measurements with single-needle sensors on fine-grained, repacked soil samples. Thermal properties analyzer KD2Pro by Decagon Devices, Inc. and Tempos by METER Group, Inc.
MethodThermal Properties AnalyzerSingle-NeedleAccuracyMeasuring IntervalPreparation/Experimental Procedure
EvaporationKD2 Pro
Tempos
TR-1 (10 cm);
TR-3 (10 cm)
±10% from 0.2–4.0 W/(m∙K);
±10% from 0.1–4.0 W/(m∙K)
15 min-days
  • Installation of oven dried and mortared soil sample in measuring cylinder
  • Capillary saturation
  • Continuous or temporary measurement of λ with decreasing water content due to evaporation [27]
  • Additional measurement after oven drying
PunctualTemposTR-3 (10 cm)±10% from 0.1–4.0 W/(m∙K)-
  • Installation of mortared soil samples in measuring cylinder at two selected medium water contents (ω1 and ω2)
  • Measurement of λ at ω1 and ω2
  • Additional measurements after oven drying (ωdry) and capillary saturation (ωsat)
Table 3. Soil samples, with sampling depth in meters below ground level (m b. g. l.) and USDA (U.S. Department of Agriculture) soil classification, on which thermal conductivity measurements were performed. In addition, the bulk density (ρb_ini) with which the soil sample was initially installed in the measuring cylinder is shown. By installing the sample twice with the punctual method, ρb_ini can also differ slightly within the test.
Sampling PointDepth
[m b. g. l.]
Stratigraphic UnitUSDAEvaporation MethodPunctual Methodρb_ini
[g/cm3]
B24.0–4.6Quaternary valley depositsSilty clay loam1.48; 1.45; 1.46
B48.0–9.0Tertiary basalt (Rotlehm)Clay1.27; 1.38
B56.2–6.9Tertiary basalt (decomposed)Silt loam1.43; 1.46
TP10.2TopsoilSilt loam1.57
1.4–1.9Quaternary valley depositsSilty clay loam1.39
2.4Quaternary valley depositsSilt loam1.47
2.9–3.4Quaternary valley depositsSilt loam1.50
TP20.2TopsoilSilty clay loam1.22; 1.24
0.7Agriculturally influenced soil-1.15
1.4Quaternary valley depositsSilt loam1.16; 1.15
1.9Quaternary valley deposits-1.36
2.4Quaternary valley deposits-1.50; 1.47; 1.49
2.9Quaternary valley depositsSilt loam1.55; 1.56
TP40.6Anthropogenic fillingSilty clay1.41; 1.49
1.2Quaternary valley depositsSilty clay loam1.47; 1.55
1.6Quaternary valley depositsSilt loam1.51; 1.50
TP60.6Anthropogenic fillingLoam1.28; 1.29
0.6Anthropogenic fillingLoam1.28; 1.29
1.6Quaternary valley depositsSilty clay loam1.30; 1.28
Table 4. Methodology and measurement configuration of electrical resistivity tomography (ERT) for Sections A, B and C.
SectionMethodMaximal Measurement per PointThreshold Measurement Error [%]Electrode Spacing [m]Length [m]Measured LayersMeasured Depth [m b. g. l.]
AWenner array [31]400.121582028
B250.221181720
C250.221181720
Table 5. Average bulk densities (ρb) and gravimetric water contents (ω), which were determined in the unsaturated zone, and with Equation (1) calculated average volumetric water contents (θ). The standard deviation and the number of measured values used in each case are also shown in the brackets. For the depths 4.0 m to 5.0 m b. g. l., the average ρb calculated for 3.5 m b. g. l. is also assumed in a simplified way.
Depth [m b. g. l.]ω [g/g]ρb [g/cm3]θ [cm3/cm3]
0.50.17 (0.06/24)1.46 (0.16/19)0.24
1.00.18 (0.06/23)1.40 (0.15/12)0.25
1.50.22 (0.04/16)1.45 (0.16/11)0.32
2.00.21 (0.05/17)1.43 (0.09/8)0.29
2.50.19 (0.04/8)1.53 (0.10/5)0.28
3.00.17 (0.05/11)1.59 (0.07/3)0.28
3.50.16 (0.05/6)1.59 (0.00/1)0.25
4.00.15 (0.04/7)1.59 (-/-)0.24
4.50.17 (0.04/3)1.59 (-/-)0.27
5.00.12 (0.05/3)1.59 (-/-)0.19
Table 6. Results of the determination of the liquid limit (ωL), plasticity limit (ωP), plasticity index (IP) and shrinkage limit (ωS), as well as the soil class determined from the ISSCS plasticity chart (PC): CI = intermediate plastic clay, CL = low plastic clay.
Sample PointDepth [m b. g. l.]ωL [g/g]ωP [g/g]IPωS [g/g]PC
B22.7–4.60.290.190.100.17CL
TP11.4–1.90.400.190.210.14CI
TP12.9–3.40.290.210.080.19CL
TP22.90.290.200.080.18CL
TP41.60.280.210.080.19CL
Table 7. Observed bulk density changes during saturation and drying using the evaporation method: ρb_ini = initially installed bulk density, ρb_sat = bulk density after saturation, ρb_dry = bulk density after oven drying. Due to the not completely straight surface of the soil body after swelling and shrinking, the indication of ρb_sat and ρb_dry is kept rough.
Sample PointDepth [m b. g. l.]ρb_ini [g/cm3]ρb_sat [g/cm3]ρb_dry [g/cm3]Clay Content
TP21.41.16~1.2~1.526%
TP22.41.50~1.3~1.624% 1
TP41.61.51~1.4~1.723%
TP61.61.30~1.2~1.635%
B24.0–4.61.48~1.3~1.835%
1 Clay content linearly interpolated between the determined values at 1.4 m and 2.9 m b. g. l.
Table 8. Thermal conductivity per depth step using regression with a second-degree polynomial function as a function of the gravimetric water content for the evaporation method (λevaporation) and the punctual method (λpunctual). The quality of the respective regression is shown in the form of the coefficient of determination (R2) and Root Mean Square Error (RMSE).
Depth [m b. g. l.]λevaporation [W/(m∙K)]R2evaporation/RMSEλpunctual [W/(m∙K)]R2punctual/RMSE
0.51.60.98/0.041.20.93/0.13
1.01.61.3
1.51.40.73/0.161.40.87/0.17
2.01.60.90/0.091.60.95/0.12
2.51.61.5
3.01.61.5
3.51.51.4
4.01.51.4
4.51.61.5
5.01.41.3
Table 9. Average derived values for ρb, θ and λ for each section and for each measured layer of the ERTs. The standard deviation is also shown in the brackets.
Depth [m b. g. l.]ρb [g/cm3]θ [cm3/cm3]λ [W/(m∙K)]
ABCABCABC
0.51.46 (0.13) 1.51 (0.01)1.51 (0.03)0.26 (0.02) 0.25 (0.01)0.25 (0.03)1.5 (0.2) 1.6 (0.0)1.6 (0.1)
1.11.45 (0.13)1.51 (0.01)1.51 (0.03)0.26 (0.02)0.25 (0.01)0.24 (0.03)1.5 (0.3)1.6 (0.0)1.6 (0.1)
1.71.47 (0.13)1.52 (0.01)1.51 (0.03)0.26 (0.02)0.25 (0.01)0.24 (0.03)1.5 (0.2)1.6 (0.0)1.6 (0.1)
2.31.50 (0.09)1.50 (0.09)1.50 (0.03)0.26 (0.02)0.26 (0.02)0.24 (0.03)1.6 (0.2)1.6 (0.2)1.5 (0.1)
3.11.46 (0.12)1.47 (0.12)-0.25 (0.04)0.25 (0.03)-1.5 (0.3)1.5 (0.2)-
3.91.42 (0.15)1.45 (0.15)-0.25 (0.03)0.26 (0.02)-1.4 (0.3)1.5 (0.3)-
4.71.49 (0.00)1.54 (0.01)-0.23 (0.00)0.28 (0.01)-1.5 (0.0)1.7 (0.0)-
Table 10. Deviations between measured or calculated soil parameters and from ERTs derived and averaged values for each section. For this, the derived values from the ERT were linearly interpolated for each depth step in intervals of 0.5 m from 0.5 m b. g. l. down to a depth of a maximum 4.5 m b. g. l. Negative values mean higher values derived from ERT.
ParameterMinimum DeviationMaximal DeviationAverage Deviation
ABCABCABC
ρb [g/cm3]−0.1−0.1−0.10.20.10.00.10.0−0.1
θ [cm3/cm3]−0.01−0.020.000.070.070.080.020.010.03
λpunctual [W/(m∙K)]−0.3−0.4−0.40.00.00.0−0.1−0.2−0.2
λevaporation [W/(m∙K)]−0.2−0.2−0.20.10.10.10.00.00.0
Disclaimer/Publisher’s Note: The statements, opinions and data contained in all publications are solely those of the individual author(s) and contributor(s) and not of MDPI and/or the editor(s). MDPI and/or the editor(s) disclaim responsibility for any injury to people or property resulting from any ideas, methods, instructions or products referred to in the content.