Article

Financial Analysis of Household Photovoltaic Self-Consumption in the Context of the Vehicle-to-Home (V2H) in Portugal

1
IFSC, Instituto Federal de Santa Catarina, Florianópolis 88020-300, Brazil
2
SustainRD, EST Setubal, Instituto Politécnico de Setúbal, 2914-508 Setúbal, Portugal
3
INESC-ID, 1000-029 Lisbon, Portugal
4
ISEL—Instituto Politécnico de Lisboa, Estrada de Benfica, 1549-020 Lisbon, Portugal
5
CTS-UNINOVA, 2829-516 Costa da Caparica, Portugal
*
Author to whom correspondence should be addressed.
Energies 2023, 16(3), 1218; https://doi.org/10.3390/en16031218
Submission received: 20 December 2022 / Revised: 18 January 2023 / Accepted: 19 January 2023 / Published: 22 January 2023
(This article belongs to the Section C: Energy Economics and Policy)

Abstract

:
This paper focuses on the purpose to see if it is possible to increase the earnings associated to the installation of PV systems in people’s homes. In accordance with this, a different way of thinking was adopted, namely the investment in batteries to maximize the energy earnings. The main problem of this classical approach is that the investment in those batteries is important. In this way, a different perspective was taken into account, namely the use of the electrical vehicles. This kind of vehicles is starting to become a real reality. In fact, the selling of these vehicles start to become a solution for the ordinary people, and it is expected in a very near future to be a reality for most of them. Thus, this study presents the use of a storage system based on the vehicle-to-home (V2H) technology for the people’s homes. The V2H availability varies among prosumers profile regarding the daily routines, weather conditions, and business aspects, besides other aspects. These profiles were combined with different power panels with and without injection into the grid. The costs of each configuration considering a residential consumer located in Portugal, as well as, their peak solar hours in a year were estimated. From this study, it will be possible to verify that the obtained economical results show that the usage of V2H as storage system based on batteries for modern homes is very attractive.

1. Introduction

Many countries have concerns regarding greenhouse gas emissions, air quality, and fossil fuels consumption and dependence. Energy production from coal is known as one of the most polluters. An alternative is to produce energy from renewable sources such as photovoltaic (PV) systems, especially for countries that have high levels of solar radiation throughout the year. According to some studies, the decentralized energy production reduces the distance between consumers and producers, which reduces the investments in energy transportation and its losses, thus contributing to a more efficient electric grid. Due to the latest advances in PV technologies at more affordable prices, the micro-generation (uG) produced by PV systems of the usual consumer brought the well-known concept of prosumer. From the point of view of the evolving energy systems, there are different types of prosumers’ roles according to the next references. The paper presented in [1] examines the literature on prosumer community based on smart grid structures by reviewing relevant literature published from 2009 to 2018 with focus on two dimensions, namely prosumer community groups and prosumer relationships. In [2], the optimal tariff in the presence of heterogeneous prosumers is determined. The paper presented in [3] intends to give an additional contribution to the subject by investigating the economic profitability of different residential PV systems configurations regarding different Portuguese prosumer’s profiles. The study presented in [4] attempts to determine the importance of factors in the development of energy production by prosumers from PV installations in Polish regions.
The different types of prosumers involve for example whether the prosumer injects electricity in the grid, whether they use batteries, and whether they consume their own energy produced i.e., self-consumption (SC). As opposed to SC, the prosumer could inject all the PV energy production into the grid (being remunerated by a feed-in tariff) and import the consumption demand from the grid. To inject energy into the grid, it is required a bidirectional meter and usually a payment fee. Other equipment that are required to be a prosumer are, besides the PV modules, an inverter and as optional some batteries. Thus, for the ordinary residential consumer concerned with the electricity bill and environmental problems, the main issue is to analyze their scenario and decide whether it is worth the investment to be a prosumer or not.
The main variables regarding such assessment are [5]:
  • Government incentives, regulation, fees, and feed-in tariffs;
  • Estimated solar radiation and PV energy production;
  • Energy consumption profile, peak and off-peak hours;
  • Equipment required, capacity, their prices and lifetime;
  • Type of prosumer: with or without injection in the grid, with or without storage (for example batteries).
Many countries have new regulations and policies to promote the increasing of prosumers which, in most cases, offer some financial support to encourage micro-generation. Some examples can be found in the next bibliographic references. The paper presented in [6] aims to review the different public policies used to promote the integration of photovoltaic technology into smart grids, taking the case of Portugal as reference. The study presented in [7] intends to demonstrate the profitability of photovoltaic prosumers installation in Spanish households compared with other European countries. A profitability assessment of residential PV prosumers in Spain was presented in [8]. Another similar study in residential households across various geographic regions in San Diego was proposed in [9]. Several countries created laws to cover electricity production aiming both SC and injection into the grid. In Portugal, those laws specify two forms of decentralized energy production: Production Unity for Self-consumption (UPAC) and Small Production Unity (UPP). This decentralized micro-generation is beneficial for the electric grid and environment; however, the investment cost for the typical residential consumer is the main concern. In this way, several economic assessments have been realized over the last years, some of them being associated with a specific country. Actually, this economic assessment is dependent on the regulation of each country. These studies are also reliant on what is considered, namely, the use of storage systems, whether the produced energy can be sold and on financial incentives. So, studies associated to specific countries have been made, such as Portugal [3,6], Spain [7,8], USA [9], Australia [10,11], Italy [12], Germany [13], Republic of Korea [14], Taiwan [15], Peru [16] and Chile [17] and Namibia [18]. From the several studies, it was concluded that SC is now a very interesting solution, being considered already profitable. These studies also showed that to enhance SC of the PV prosumers, there is the need to also consider battery energy storage systems (BESS) in the evaluation. In fact, the increase in the PV energy self-consumption in residences that are connected into the grid due to the BESS cost can be high. Two examples in which this increase was very accentuated are shown in [19,20], wherein the increase was from 56% to 89% and 50% to 80% of the annual PV generated energy. However, in this context of storage, the perspective is different since it was verified that self-consumption is currently far from being profitable.
An additional element that has now started being considered in economic assessments, which is expected to have an important role in the next years, is the proliferation of electrical vehicles (EV). EVs are now becoming part of the electrical grid (especially in the smart-grids context), since it can be more than just a load, that is, it can also be seen as a mobile storage system. In recent years, the sales and market share of EVs has increased [21]. Some factors include emission regulations, economic policies, oil prices, and resources depletion. These aspects have been pushing the automobile industries to seek alternatives to the internal combustion engine (ICE) vehicles. The clean energy ministerial (CEM), which is composed of many EV industry-leading countries, expects to reach a 30% sales share for EVs by 2030 [22]. Among all EV components, the batteries capacity is one of the main concerns. This aspect impacts charging habits, travel autonomy, speed, and price. Moreover, batteries are likely to impact the grid for the next coming years since many citizens will have EVs as the leading consumer appliance. To illustrate, the average usable battery capacity of EVs is 60.1 kWh [23], in contrast to the average daily electricity consumption of 30 kWh for a United States residential customer in 2018 [22].
In the context of EVs, a technological challenge emerged over the past years, which is the vehicle-to-grid (V2G) technology concept wherein the energy might flow in both directions (charging and discharging mode) when the vehicle is connected to the grid. Several studies have shown the applicability of this concept, namely in energy flow management in buildings and electric grids, absorbing the excess of the renewable energy sources and supporting the capacity of the infrastructures, among others. A study about the integration of electric vehicles and management in the Internet of energy can be found in [24]. The paper presented in [25] investigates the management of the EV battery through an optimization approach capable to minimize the electricity supply costs for an Italian residential end-user with PV, considering battery constraints such as driving habits. The study presented in [26] proposes and analyzes a novel energy management system for buildings connected in a micro-grid, by considering electric vehicles as active components of such energy scheme. Centralized and distributed optimization models for V2G applications to provide frequency regulation in power systems and electricity market can be found in [27].
Another aspect regarding the EVs′ batteries is related with their useful lifetime. Due to the particularity of most static applications, batteries can be reused in those applications at lower costs [28]. This reuse is due to the fact that in EVs the batteries are usually replaced when their capacity is reduced up to a value of 70% or 80% [29,30]. So, studies which analyzed the application of EVs batteries associated with the electric grid have been presented in [31,32]. Their use was also verified in the context of the PV energy self-consumption in residences. The maximum utilization of renewable energy sources using gridable vehicles (GVs) for sustainable cyber-physical energy systems is presented in [33]. In this paper, three models are described and results of the smart grid model show the highest potential for sustainability. An economic evaluation of a PV combined energy storage charging station based on cost estimation of second-use batteries is presented in [34]. The work presented in [35] proposes a methodology to maximize the self-sufficiency or cost-effectiveness of grid-connected prosumers by optimizing the sizes of photovoltaic (PV) systems and electrochemical batteries.
However, the EVs associated with PV energy self-consumption in residences can also be used in the vehicle-to-home concept (V2H). This possibility has not been deeply studied, especially under the economic point of view. This can eventually play a very important role, by which the study of the V2H associated with the PV energy self-consumption in residences may be relevant. The V2H is a recent concept for the operation of electric vehicles. In this concept, the vehicle is connected to the house or building and it is able to send or receive energy from the house when necessary, according to a predefined strategy. This EV operation mode may change the energy demand resulting in a reduced amount of energy cost to the consumer. The V2H may also operate as backup power resource if properly incorporated in the home energy management system. The use of this concept requires the use of bidirectional power converters in the EVs charging structure and proper communication systems to change the operation mode when necessary [36].
Meanwhile, as energy consumption grows and energy efficiency concerns increases, another concept about smart-grids (SG) has emerged. This seeks to integrate monitoring systems and smart meters in order to manage energy demand and mitigate the impact over the distribution network [37]. Over the past years, the distributed generation (DG) approach (for example PV residential systems) has promoted the creation of new SG solutions since it is usually more efficient than traditional power plants using fossil fuel considering the distribution from the source to the final consumer [38]. Moreover, DG is more environment-friendly because it usually comes from dispersed renewable energy sources. However, the intermittent nature of these renewable sources requires the grid to be compensated by some means [38], where most solutions are expensive and consequently do not fit most small-scale residential producers. Thus, EVs’ batteries may provide a convenient solution to compensate for the grid due to the renewable source generation for the small-scale producers. The gridable EVs (GEVs) (or the concept of connecting a group of EVs to the grid) exchange energy with the grid in both directions: they can draw energy from the power grid with the plug-in-function and also deliver energy back to the grid via the bidirectional charger [35]. Thus, the V2H concept arises where the GEVs exchange energy with residential grids. The V2Hs act also as a controllable load.
This work assesses the economic profitability of using V2Hs’ storage as an alternative to individual packs of batteries. This analysis regards in which way the V2H, as storage systems in the context of the PV energy self-consumption, can impact the profitability of the renewable energy system in domestic homes. Therefore, this study will consider several factors such as availability of the vehicle and battery state of charge. Regarding the cash flow analysis, it takes into consideration regulation, fees, feed-in tariffs, solar radiation, PV production, electricity consumption profile, equipment required, and type of prosumer. The investment time is 25 years and the prosumer income over the years is the electricity bill reduction due to the PV energy production and grid injection remuneration. The work is sectioned as follows: vehicle-to-home (V2H) in the context of the household photovoltaic self-consumption explains in detail the concept of V2H and its state-of-the-art. The adopted methodology of this work is described in Materials and Methods, including: residential photovoltaic setup which explains the equipment and costs in a residential PV system setup regarding the Portuguese legislation; Portugal energy consumption and production data samples illustrates the 2019 annual data sample provided by the Portuguese Energy Regulatory Authority and Services [39] of energy consumption and PV micro-generation, which will be the data used for this assessment; grid injection and feed-in tariff explains the variables involving grid injection, its remuneration and fees; V2H usage profiles and batteries shows that EV driver patterns from other researches are taken into consideration in order to build different V2H usage profiles, thus it is possible to estimate when the V2H battery will be available at home; the economic assessment of this work is based on traditional financial variables that provide absolute and relative points of comparison such as net present value (NPV), internal rate of return (IRR), profitability index (PI), discounted payback period (DPP), and levelized cost of energy (LCOE), where economic assessment section describes all of them in detail. Results of the economic assessment for each usage profile and for different PV setups are shown in Results. These setups present variations with and without grid injection and PV power. Finally, Conclusions discuss the presented results.

2. Vehicle-to-Home (V2H) in the Context of the Household Photovoltaic Self-Consumption

As mentioned in the previous section, one of the factors that has created most restrictions to the increase of household PV self-production is the cost of the storage systems. Nowadays, a viable solution to this problem is to use the batteries of the EVs as storage systems. In the last few years, EV manufactures have evolved to produce more efficient and affordable electric cars jointly with the support of public policies and government incentives. At the same time, SGs are growing, and the main goals are helping energy demand management and reduce the impact on the energy distribution. The 
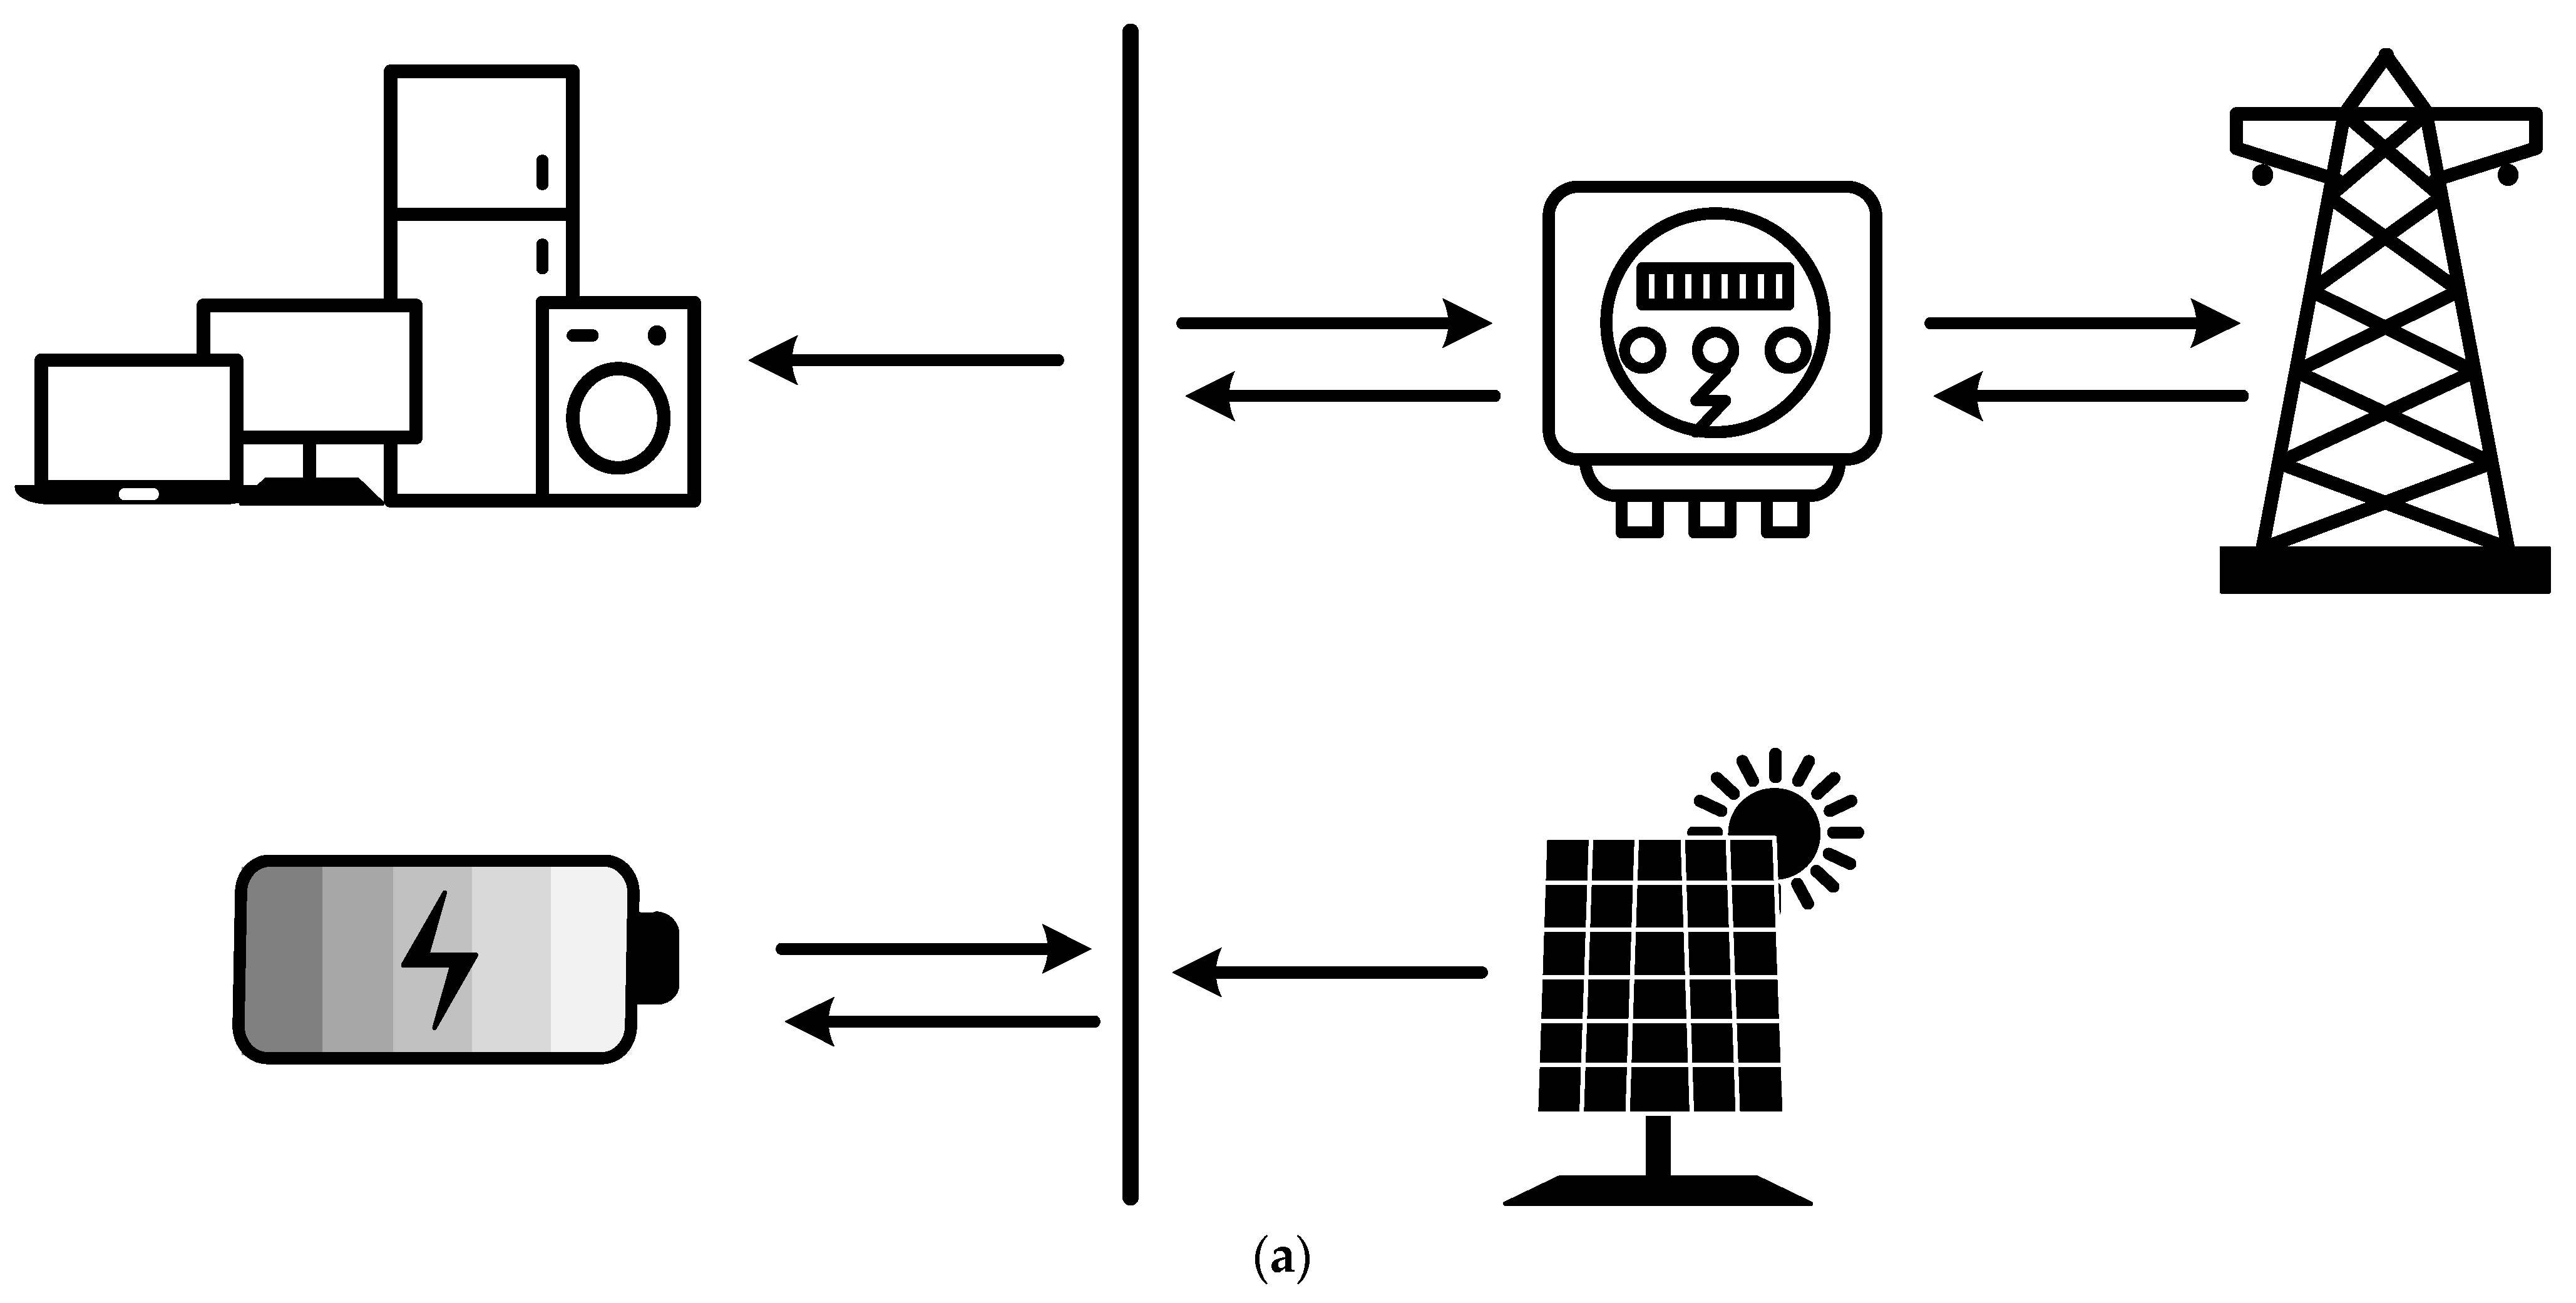
DG contributes to these goals because it is usually produced from renewable sources and also because it reduces the distribution losses between the source and the final consumer. Renewable energy sources, however, do not have a continuous availability because they depend on weather conditions, time of the day, etc., which can cause instability problems to the grid and consumers. Thus, such systems require an auxiliary source of energy to compensate for the periods in which the renewable sources cannot provide the demanded energy. Expensive solutions usually do not suit small-scale systems such as PV prosumers (Figure 1a). In this context, the growing EV technology can fit the auxiliary source of energy using its batteries. The V2H concept means the home can draw energy from the vehicle and also deliver energy back by a plug-in-function by a bidirectional charger. It operates as a storage system and may replace the need for buying a separate battery pack for the residential PV system.
It is expected that the V2H (Figure 1b) might be the future for spreading small-scale PV prosumers, although they are at an early stage nowadays and only the first steps were taken toward this reality. The first model of the Tesla Roadster (2008) had V2H capability although the company removed it in the following upgrades. However, in the last few years, automobile companies are considering introducing again this type of technology. In this way, EVs can play a very important role in the context of the PV energy self-consumption in residences. So, it is predictable that in some residences the investment in batteries might change considering using the EVs batteries as energy storage system. EVs’ storage may provide a convenient solution to compensate for the renewable source generation in self-consumption residences.
The use of the EVs as a storage system will reduce the investment in the batteries that are usually the most expensive equipment [3]. The use of EVs is expected to increase the PV energy self-consumption in residences when compared with the solution without storage systems. However, the decision about this solution requires a reliable profitability forecast, otherwise prosumers might be very reluctant to move forward. So, this paper presents an economic profitability study of the application of V2Hs’ storage as an alternative to individual packs of batteries. In this study, it is considered in which way the consumer uses its V2H. Depending on the EV usage profile, the V2Hs’ storage will be available or not for the PV system to store PV surplus production. In addition, the V2Hs’ battery cannot store the surplus if it is already full, therefore its state of charge (SoC) is considered in the assessment. Likewise, the depth of discharge (DoD) is limited to a minimum value to preserve the battery’s lifespan, which can vary according to the manufacturer.

3. Materials and Methods

According to the report [40], in Portugal the annual availability of global solar radiation varies between 1350 kWh/m2 and 1950 kWh/m2 and the production of renewable energy provided from PV systems became very important; hence, regulations were implemented to handle the increase in prosumers and for some governmental support to encourage micro-generation. Therefore, the government created the law 153/2014 [40] to cover energy production aiming SC and injection into the grid. The law specified two forms of decentralized energy production: Production Unity for Self-consumption (UPAC) and Small Production Unity (UPP). UPAC covers energy production from renewable or non-renewable sources and connected or not to the Electrical Utility Grid (RESP). Surplus may be injected into the grid. On the other hand, UPP covers renewable source production where the entire electricity must be injected into the RESP. Since this work is related to household PV self-consumption, the study is developed in the UPAC context.

4. Residential Photovoltaic Setup

A PV system consists of different components that work together to provide energy for a home and/or grid. The PV solar panels absorb sunlight and output direct current (DC), then a DC to alternate current (AC) inverter is required since most appliances are designed to be connected to the AC grid. The inverter may consist of a hybrid inverter charger, which besides converting DC to AC can also charge a battery plugged to it and manage inputs from the battery bank or from the solar panels. Most hybrid inverters regulate the load in a way that ensures the maximization of its energy output. Another PV system component is the bidirectional meter, which is responsible for counting consumption and grid injection. It is set between residential circuitry and the RESP. A production meter is also mandatory in many countries, such as Portugal according to law 153/2014 [39].
Most PV mounting set in the market are composed by a PV panel and its structure, micro-inverter, and connecting cables for AC-DC. If a battery pack is adopted, then the system must provide a hybrid inverter separately. Additionally, a bidirectional meter is necessary in case of grid injection as stated in [39].
In this analysis, the hybrid inverter is disregarded because the battery pack is not considered. Instead, as described in the previous section, the V2H battery is considered when the vehicle is at home. The V2H itself will provide an internal hybrid converter mechanism and this will be considered in our analysis. The price of the bidirectional watt meter was also disregarded. A remark must be made regarding the bidirectional watt meter. The Portuguese electrical distribution company is currently replacing the previous analogue watt meters and deploying new digital versions with bidirectional metering capabilities in all Portuguese territory. A 80% replacement rate was achieved until 2020 (European Union directive from 2009). In this way, the presented analysis ignored the bidirectional counter acquisition costs, imposed by Portuguese law DL 153/2014, whenever it is applicable.
This work assesses PV systems involving 0.5 kWp, 0.75 kWp, 1.5 kWp, and 3.45 kWp, with and without grid injection, and with the usage of V2H battery when EV is available. The component prices of each setup (0.5, 0.75, 1.5, 3.45 kWp) were taken from [41] and provided in Table 1. The equipment lifespan is considered 25 years. The prices include the installation of a complete residential photovoltaic plant.

5. Portugal Energy Consumption and Generation Data Samples

Consumption and generation distribution along the year were taken from an annual sample provided by [42]. These samples contain normalized kilowatt-hour data for every 15 min over the entire year.
The consumption (see Figure 2) and production/generation (see Figure 3) profiles considered were UPAC with a surplus selling contract. This profile can vary among three different classes (A, B, or C). Profile UPAC Class C was chosen since this category must have power equal or less than 13.8 kVA and annual consumption equal or less than 7140 kWh, which includes residential consumers.
The average annual consumption in 2019 for UPAC class C was 3506 kWh [37], which is also used to perform our analysis. To obtain the average annual production for a certain region, [21] it can use Equation (1), where E is the total energy generated in one year, C_pv is the capacity of the PV system (0.5, 0.75, 1.50, or 3.45 kWp for the proposed study), T_ps is the total number of peak solar hours in a year and e is the loss factor and allowance for PV array which is 0.18 [21]. To obtain T_ps, we retrieved different values of global horizontal irradiation (kWh/m2) across Portugal from [43], resulting in an average of 1600 kWh/m2. To convert this value to hours, we divided it by 1000 kWh/m2 (given that a peak sun-hour is an hour during which the intensity of sunlight is 1000 watts per square meter) resulting in 1600 h (which is equivalent to an average of 4 h per day at 1000 kWh/m2).
E = C p v T p s ( 1 e )
Other relevant information about the consumption and injection profiles are regarding the period of the day where they happen. This is true especially when it is considered in different hours of the day where the V2H’s battery is available at home. Figure 4 illustrates the annual total consumption and injection along the hours of the day. The respective sums result in the value of 1000.
All data shown in this section are used to perform the financial analysis of this study. It supposes that these annual profiles and average consumption and production remain the same over the 25 years.

6. Grid Injection and Feed-In Tariff

The UPAC remuneration due to the energy provided for the RESP is specified by the law [40]. This law also states that the PV system must be equal to or less than the contracted power of the prosumer. Equation (2) describes the remuneration R_m for month m, where E_m is the energy in kilowatt-hour injected in the grid each month and OMIE_m is the average Iberian electricity market closing price for Portugal (daily market) in the month m. In this study, the assessment considers the average monthly price for 2019 in Portugal, which is 0.05745 €/kWh. This value is assumed over 25 years of investment. The average price is provided by the Iberian Energy Market Operator in its 2019 price report [44].
R m = E m O M I E m 0.9
Regarding the fees for a UPAC to operate, Table 2 shows the values according to [39]. This table does not consider power greater than 5 kW since it is not regarded in this work. Additionally, a periodic inspection is required. For PV systems less than 1 MW, this inspection must occur every 10 years. The inspection price is 20% of the registration fee.
The normal low voltage (BTN) consumer in Portugal can choose among three different metering cycles (one, two or three periods during the day). In this analysis we chose two periods (peak and off-peak). The peak period corresponds to 8 am until 22 pm and the off-peak from 22 pm to 8 am. These periods are constant for the whole year and for any day of the week. The off-peak period has a lower energy price compared to the peak period. Table 3 and Figure 5 show the peak and off-peak values of some electricity retailers in the continental region of Portugal. These values were taken from [45] and are constantly updated. This study assumes a contracted power of 10.35 kVA.

7. V2H Usage Profiles and Batteries

To evaluate how much and when a prosumer can use their EV’s storage, it is required to understand when the vehicle is available at home. Moreover, the EV’s storage must be available in the periods when there is solar radiation. When the storage is not available, the possibility for the prosumer is to self-consume the energy produced at the moment and, if the production exceeds the consumption, inject it in the grid being remunerated by the feed-in tariff. However, since the cost of retailer energy is more expensive than the price received for the injection in the grid, it is preferable to store the surplus to use later for self-consumption in order to reduce the electricity bill, increasing in this way the profitability of the PV system. Thus, understanding V2H driver journey patterns enables defining periods when the vehicle—and therefore EV’s storage—will be available at home. In this context, the battery SoC says how much energy is available to draw and its complement—DoD—says how much is available for storage. The SoC parameter is useful in this analysis work to consider the energy required for the V2H trips. That is, to reserve an amount of kilowatt-hour in the battery which is not drawn or storage by the PV system. This amount is only used for journeys. This work considers a DoD of 50%.
Previous research studies regarding EV usage patterns [46,47,48] consider variables such as first journey start time, final journey finish time, state of charge (SoC) among others. They enable the extraction of patterns from drivers and estimate periods in which EVs will be available at home. The research [42] conducted in Ireland in 2016 with 72 EVs presents the first journey start time with a peak hour around 8:00 and another peak hour around 6:30 pm for final journey finish time, on weekdays. On the weekends, the peak hours for first and final journeys are, respectively, around 10:30 am and 7:00 pm. Considering only start time journeys (not necessarily first or final) the research shows three main peak hours on the weekdays at 8:30 am, 1:30 pm and 5:00 pm, and on the weekend a peak hour at 2:00 pm with a bell-curve shape. The greatest proportion of recorded trips per vehicle per day ranges from 2 to 5. Regarding the EVs battery SoC, 58.7% of charge events happened when the SoC was above 50%, 25.5% when it was above 80%, and only 6.29% when it was below 20%. After the charging events, the SoC was 100% in almost all cases. Another related study involving 141 EVs in the United Kingdom (UK) occurred in 2011–2012 [45]. Regarding the private EVs (41 in total), the analysis of SoC per time of day shows that the average SoC for any time of the day is always above 60%. The average number of journeys per day is 1.76. The EVs usage peak hours are between 7:30 am and 9:00 am and from 5:00 pm–8:00 pm which is conforming to usual daily commuting due to working schedule. Another research published in 2018 took place in Beijing with 41 private EVs [48]. As expected, the first trip′s start time occurs around 7:00 am–8:00 am and the final trip finishes around 6:00 pm–8:00 pm. The average number of trips per day is 3.96 and the biggest proportion is two trips per day. The work also states that the charge consumption is far below the nominal capacity of the battery. According to the study, the reasons are:
  • The battery is not 100% charged when the charging process finishes (In 33% of charge events the SoC is below 90% after charging) and;
  • Second, most drivers charge the battery when the SoC is not even close to the battery depletion.
One of the main concerns of EV owners is the batteries degradation and respective lifetime. Thus, when using the EVs’ batteries for storage in V2H applications the main concern of most owners is the accelerated degradation of the batteries due to the increased charging and discharging cycles. In fact, in V2H applications the batteries will reduce their lifetime and the question is how long the batteries can last before a sudden death. Several recent studies have been dedicated to EVs batteries lifetime. Some of the following examples can be found in the literature. The review presented in [30] contributes to what is already known by connecting measurement data, driving data, and V2G operations to the battery cycle aging model. A pattern-driven stochastic degradation model for the prediction of remaining useful life of rechargeable batteries is proposed by [49]. An analytical model of capacity fading for lithium–sulfur cells can be found in [50]. Another study about aging monitoring for lithium-ion batteries is proposed in [51]. A study about correlating the optimal size, cycle life estimation, and technology in the selection of batteries is proposed in [52]. A study about electric vehicles battery wear cost optimization is proposed by [53]. Another study about cycle aging cost model for battery energy storage systems considering an accurate battery life degradation is proposed by [54].
A recent study indicates that in battery cell aging tests, a mean of 50% SoC is determined as optimal for enhancing battery cell life [30]. This study also indicates that the lowest battery cell cycle depth provides the longest lifetime, and the highest cycle depth provides the shortest life expectancy. Moreover, usually for V2G operations the lowest cycle depth value is around 5%, which provides the highest number of equivalent full cycles. It is also considered that most battery cells become unreliable after cells reach 80% of the original capacity. Considering the study presented in [30] and considering that most EV manufacturers assure battery cells guarantee up to 8 years, which is the average time for most owners to replace the EV by a new one, it is easy to calculate that a total of 5840 (365×2×8) cycles are expected for daily two cycles for 8 years. According to this study, it is possible to perform more than 6000 equivalent full cycles before the cells reach 80% of the original capacity considering that the daily average SoC is around 40% to 60%. Higher cycle depth will degrade the equivalent full cycles and lower cycle depth will improve the equivalent full cycles. In these conditions, it is reasonable to accept that EV battery cells will be available for at least 8 years.
Considering this information, this study seeks to consider different EV usage profiles in order to evaluate V2Hs as battery storage during the period they are available at home. The battery capacity for this analysis was taken from an electric vehicle database [23], which is constantly updated. Thus, the value considered is the average of usable battery capacity of full EV: 60.1 kWh (August 2020). In the calculations performed in this work, an batteries efficiency of 85% was considered. Even considering the efficiency of the batteries, it still make sense to store the surplus in the batteries, since, according to the data available, the price paid for injecting energy into the grid is 0.05745 €/kWh (see first paragraph of Section 6), while that the cost of energy production is 0.1213 €/kWh (Table 3). This difference is large enough to compensate for the loss of batteries efficiency.
In this work, some vehicle usage profiles were analyzed considering the different range of hours along the week, as can be seen in Table 4. These profiles try to simulate real usage situations based on previously mentioned research. In the Results section, the profiles are also compared to two other references: when the V2H is either always or never available at home.

8. Economic Assessment

The consumed and produced energies are sampled every 15 min over the year, as described in the subsection, Portugal Energy Consumption and Production Data Samples. It is required to account the surplus or shortfall energy in every sample and handle this amount: either store surplus to V2H’s battery or drain shortfall from the V2H’s battery, either inject surplus into the grid or waste it, and either supply shortfall from the grid or from the V2H’s battery. The approach which takes these decisions into account is illustrated in an activity diagram in Figure 6. Given that the EV is at home, the V2H battery may or may not be sufficient to provide the energy consumed by the house, this depends on the remaining energy that the battery had when the EV arrived at home and how much of that energy has already been consumed since the car arrived. In the work, it was considered a battery capacity of 60.1 kWh, and 50% of this value as the remaining amount of energy that can be drawn from the battery when the EV is at home. Taking into consideration these aspects, the determination of the amount of energy that is considered in this study is done in accordance with the flowchart presented in Figure 6. Through that flowchart, it is possible to see the criterion that was considered to determine the amount of storage energy. For example, if the vehicle is all the day in house, not all the hours will be considered, since meantime the battery will be fully charged, and it does not have capacity to store more energy. The same regarding the discharging process.
In the study, we have considered that the V2H battery can never be below 50% of its capacity. Thus, in the worst possible case scenario, the user would have 50% of the car′s battery charged when leaving in the morning. Thus, there are situations where the EV is fully charged and other situations not, but at least 50% of full charge is guaranteed.
To evaluate the proposed household photovoltaic system, this study considered an investment period of 25 years, a discount rate of 4%, maintenance and operation costs of 1% over total value invested [55] and depreciation factor of 0.75% per year [56]. The depreciation factor range is typically between 0.5% and 1.0% as indicated in [57]. The salvage value of assets after the investment period is proportional to its remaining lifetime. The economic parameters are NPV, IRR, PI, DPP, and LCOE as explained next.
In this study, the NPV is the sum of all income and costs of the project converted to present value by the discount rate during the period of the investment, as seen in Equation (3). The first sum represents all incomes where REV_i is the revenue at year i calculated in Equation (4) by gross revenue (G_i) minus maintenance and operation costs (MO) as a percent of total investment (I_ti) until year i. The second sum is all investments (INV) for every year i and in the last sum SAL is the salvage value at the end of the investment period (year n). A NPV less than 0 is rejected.
N P V = i = 1 n R E V i ( 1 + a ) i i = 0 n 1 I N V i ( 1 + a ) i + S A L ( 1 + a ) n
R E V = G i M O I t i
The IRR parameter compares the profitability of the investment with the discount rate. Therefore, in Equation (3) we substitute IRR for a and find IRR for NPV = 0 (See Equation (5). If IRR > a then the investment is viable.
N P V ( a = I R R ) = 0
The PI parameter is the ratio between the incomes and outcomes of the cash flow, considering their current value (Equation (6)). If PI > 1 then the investment is worth it. The PI provides a relative quantity to compare whilst NPV is an absolute value.
P I = i = 1 n R E V i ( 1 + a ) i + S A L ( 1 + a ) n i = 0 n 1 I N V i ( 1 + a ) i
The DPP parameter provides the time required to recover the investment values over the years. All cash flows are converted to present value. DPP is used in Equation (7). If DPP is less than the period of the investment, n, then this is indicative that the investment is feasible.
i = 1 D P P R E V i ( 1 + a ) i + S A L ( 1 + a ) n = i = 0 n 1 I N V i ( 1 + a ) i
The LCOE parameter (see Equation (8)) informs the production cost of electricity in Euro per kilowatt-hour. It provides the cost of operating the PV project. This is a useful relative quantity to compare the price in Euro per kilowatt-hour with energy retailers. The costs and energy production are converted to present value. In Equation (8), E_i represents energy production for year i in kilowatt-hour. We should discount the salvage value from INV_i which is implicitly included in it.
L C O E = i = 1 n I N V i + M O I t i ( 1 + a ) i + S A L ( 1 + a ) n i = 1 n E t ( 1 + a ) i

9. Results

Each PV setup, namely: 0.5 kWp, 0.75 kWp, 1.5 kWp, and 3.45 kWp was assessed separately in the respective Table 5, Table 6, Table 7 and Table 8. Each one is analyzed with and without injection and with different EV usage profiles. It is visible that most scenarios are financially viable regardless of the injection and the availability of the vehicle. The exception case is the hypothesis where V2H is never available and there is no surplus injection into the grid, for any PV power. In this case, the NPV and PI parameters are less than zero and DPP is greater than 25 years (period of investment). This hypothesis is for comparison purposes only, as well as the always available one. The latter shows the best possible scenario although it is not feasible because no consumer will pursue a V2H to leave it at home all the time.
As expected, in general, the PV setup with grid injection overtake the same PV setup that do not have injection. This is because the cost required for enabling injection is low: a higher fee compared to with injection (see Table 2) and also because bidirectional meter cost is disregarded because this study considers that the bidirectional meter is already provided. Thus, the prosumer needs to inject into the grid a sufficiently small quantity to overcome the injection investment. Nevertheless, there are few exceptions: for 0.5 kWp and 0.75 kWp PV setup, with V2H always available and mon–fri 6:00 pm until 11:00 pm without injection are more profitable than with injection. Considering V2H is always available, the battery is always available and therefore injection occurs only when the battery is full. As the battery capacity is higher in the context of a residential PV system setup, the battery will be full only when PV generation is at a high rate (i.e., greater power capacity). That is why for 1.5 and 3.45 kWp PV setup the injection occurs, and its amount is sufficient to become more profitable than without injection. For 0.5 kWp and 0.75 kWp PV setup profile from mon–fri 6:00 pm until 11:00 pm the system must inject energy into the grid; however it is not enough to overcome the injection investment.
Amongst feasible profiles (discarding always and never available), the one which has the highest NPV and lowest DPP is the profile from mon–fri 1:00 pm until 6:00 pm with injection and 3.45 kWp PV setup. The highest IRR and PI is achieved by sat–sun 6:00 am until 0:00 am with injection and 0.75 kWp PV setup. These two are the most financially viable profiles.
Other economic perspectives can be shown by how much is saved every month for each scenario. In other words, this represents the impact over the electricity bill for the prosumer each month. This is shown in Figure 7 and Figure 8.
Nevertheless, higher savings (per month) does not mean a more profitable setup because investment costs vary, and these costs are not accounted for in average monthly savings. Without injection (Figure 8), when the V2H is not available, no savings occur because all PV generation is wasted, since neither injection nor battery are available. Moreover, from average monthly savings figures, it is clear that differences between V2H’s battery availability becomes more impactful for higher PV setups. For example, profiles from mon–fri from 1:00 pm–6:00 pm, 6:00 pm–11:00 pm, and 8:00 am–1:00 pm all consist of a six-hour period and considering 0.5 kWp and 0.75 kWp PV setup, their savings are roughly the same, but for 1.5 kWp and 3.45 kWp the saving differences are more visible.
Actually, the results in both monthly savings and in economic parameters show that profiles consisting of six-hour periods during the weekday perform similarly to each other, regardless of whether the period is during morning, afternoon, or evening. On the other hand, the ten-hour period during weekdays does underperform the others significantly for all PV setups.

Results Considering Individual Packs of Batteries

This section presents the economical results of considering individual packs of batteries instead of EV batteries. In this analysis similar assumptions for batteries efficiency, investment period, discount rate, maintenance and operation costs, and depreciation factor per year were considered for the residential photovoltaic installation. Table 9 presents the investment costs in three different battery packs according to [41].
Similarly to the results presented in Table 5, Table 6, Table 7 and Table 8, now Table 10, Table 11, Table 12 and Table 13 demonstrate the economical results considering 0.5 kWp, 0.75 kWp, 1.5 kWp, and 3.45 kWp as PV setup with and without grid injection. According to the performed calculations, in case of using individual battery packs, none of them are economically viable.

10. Conclusions

In this paper, an economical study for residential PV system investments with a different approach regarding battery costs was presented. Instead of considering the classical use of battery banks, the using batteries from electric vehicles (EV) in the context of the vehicle-to-home (V2H) was considered. The results presented in this work were very attractive toward the usage of V2H as battery supplies for modern homes. The main reason is due to the high expenses regarding batteries in residential setup. Without this particular cost, the overall financial result becomes viable in most scenarios. The obtained economical results showing the usage of V2H as battery supplies for modern homes is very attractive. In fact, with this change in thinking important earnings can be obtained, making residential PV system investments much more attractive.
One aspect that influences the earnings is the way of life of the residential driver. In fact, the availability of the electrical vehicle in the houses is fundamental, the function being whether or not the driver (electric vehicle) is at home. In this way, scenarios with different patterns were considered. One of them was when the V2H was either always or never available at home. This was used for comparison purposes only. The other V2H usage patterns considered were to represent real scenarios: a residential consumer who uses its vehicle on the weekdays for a six-hour period, ten-hour period, and on the weekends. From the obtained results, it was possible to conclude that the six-hour weekday and the weekend profiles (sat–sun 6:00 am–0:00 am and mon–fri 1:00 pm–6:00 pm) outperform the ten-hour weekday profile. In fact, these two profiles allowed to obtain the best IRR parameter with values of 27.32% and 27.04% for the 0.75 kWp PV setup and considering grid injection. Without the consideration of grid injection, these values slightly decrease, namely to 26% and 25.36%. The worst scenario is the one that considers ten-hour weekday (mon–fri 8:00 am–6:00 pm) with a value of 6.20% for the 1.5 kWp PV setup. Under the point of view of the energy earnings, that is, not considering investment, the best solution is the one associated to the six-hour weekday (mon–fri 1:00 pm–6:00 pm) with a value for the 3.45 kWp PV setup. Besides that, this study showed that this context can increase the profitability of the PV systems allowing to increase their adoption.

Author Contributions

Conceptualization, R.G.N., V.F.P. and J.L.S.; methodology, R.G.N., V.F.P. and J.L.S.; software, R.G.N.; validation, V.F.P., A.C. and D.F.; formal analysis, V.F.P. and A.C.; investigation, R.G.N., V.F.P. and J.L.S.; resources, V.F.P. and A.C.; writing—original draft preparation, R.G.N. and J.L.S.; writing—review and editing, R.G.N., V.F.P., J.L.S., A.C. and D.F.; visualization, V.F.P., A.C. and D.F.; supervision, V.F.P.; project administration, V.F.P., A.C. and D.F.; funding acquisition, V.F.P. and A.C. All authors have read and agreed to the published version of the manuscript.

Funding

This research was funded by national funds through FCT-Fundação para a Ciência e a Tecnologia, under projects UIDB/50021/2020 and UIDB/00066/2020.

Institutional Review Board Statement

Not applicable.

Informed Consent Statement

Not applicable.

Data Availability Statement

Not applicable.

Conflicts of Interest

The authors declare no conflict of interest.

References

  1. Espe, E.; Potdar, V.; Chang, E. Prosumer communities and relationships in smart grids: A literature review, evolution and future directions. Energies 2018, 11, 2528. [Google Scholar] [CrossRef] [Green Version]
  2. Gautier, A.; Jacqmin, J.; Poudou, J.-C. Optimal grid tariffs with heterogeneous prosumers. Util. Policy 2021, 68, 101140. [Google Scholar] [CrossRef]
  3. Camilo, F.M.; Castro, R.; Almeida, M.E.; Pires, V.F. Economic assessment of residential pv systems with self-consumption and storage in portugal. Sol. Energy 2017, 150, 353–362. [Google Scholar] [CrossRef]
  4. Wicki, L.; Pietrzykowski, R.; Kusz, D. Factors Determining the Development of Prosumer Photovoltaic Installations in Poland. Energies 2022, 15, 5897. [Google Scholar] [CrossRef]
  5. Lupangu, C.; Bansal, R.C. A review of technical issues on the development of solar photovoltaic systems. Renew. Sustain. Energy Rev. 2017, 73, 950–965. [Google Scholar] [CrossRef]
  6. Lage, M.; Castro, R. A Practical Review of the Public Policies Used to Promote the Implementation of PV Technology in Smart Grids: The Case of Portugal. Energies 2022, 15, 3567. [Google Scholar] [CrossRef]
  7. Escobar, P.; Martínez, E.; Saenz-Díez, J.C.; Jiménez, E.; Blanco, J. Profitability of self-consumption solar PV system in Spanish households: A perspective based on European regulations. Renew. Energy 2020, 160, 746–755. [Google Scholar] [CrossRef]
  8. Roldán Fernández, J.M.; Burgos Payán, M.; Riquelme Santos, J.M. Profitability of household photovoltaic self-consumption in spain. J. Clean. Prod. 2021, 279, 123439. [Google Scholar] [CrossRef]
  9. Kim, J.D.; Trevena, W. Measuring the rebound effect: A case study of residential photovoltaic systems in San Diego. Util. Policy 2021, 69, 101163. [Google Scholar] [CrossRef]
  10. Shaw-Williams, D.; Susilawati, C.; Walker, G.; Varendorff, J. Valuing the impact of residential photovoltaics and batteries on network electricity losses: An Australian case study. Util. Policy 2019, 60, 100955. [Google Scholar] [CrossRef]
  11. Ellabban, O.; Alassi, A. Integrated economic adoption model for residential grid-connected photovoltaic systems: An australian case study. Energy Rep. 2019, 5, 310–326. [Google Scholar] [CrossRef]
  12. Cerino Abdin, G.; Noussan, M. Electricity storage compared to net metering in residential pv applications. J. Clean. Prod. 2018, 176, 175–186. [Google Scholar] [CrossRef]
  13. Bertsch, V.; Geldermann, J.; Lühn, T. What drives the profitability of household pv investments, self-consumption and self-sufficiency? Appl. Energy 2017, 204, 1–15. [Google Scholar] [CrossRef] [Green Version]
  14. Chung, M. Comparison of economic feasibility for efficient peer-to-peer electricity trading of pv-equipped residential house in korea. Energies 2020, 13, 3568. [Google Scholar] [CrossRef]
  15. Chen, C.-N.; Yang, C.-T. The Investability of PV Systems under Descending Feed-In Tariffs: Taiwan Case. Energies 2021, 14, 2728. [Google Scholar] [CrossRef]
  16. Espinoza, R.; Muñoz-Cerón, E.; Aguilera, J.; Casa, J. Feasibility evaluation of residential photovoltaic self-consumption projects in peru. Renew. Energy 2019, 136, 414–427. [Google Scholar] [CrossRef]
  17. Troncoso, N.; Rojo-González, L.; Villalobos, M.; Vásquez, Ó.C.; Chávez, H. Economic decision-making tool for distributed solar photovoltaic panels and storage: The case of chile. Energy Procedia 2019, 159, 388–393. [Google Scholar] [CrossRef]
  18. Amupolo, A.; Nambundunga, S.; Chowdhury, D.S.P.; Grün, G. Techno-Economic Feasibility of Off-Grid Renewable Energy Electrification Schemes: A Case Study of an Informal Settlement in Namibia. Energies 2022, 15, 4235. [Google Scholar] [CrossRef]
  19. Thygesen, R.; Karlsson, B. Simulation and analysis of a solar assisted heat pump system with two different storage types for high levels of pv electricity self-consumption. Sol. Energy 2014, 103, 19–27. [Google Scholar] [CrossRef]
  20. Brusco, G.; Burgio, A.; Menniti, D.; Pinnarelli, A.; Sorrentino, N. The economic viability of a feed-in tariff scheme that solely rewards self-consumption to promote the use of integrated photovoltaic battery systems. Appl. Energy 2016, 183, 1075–1085. [Google Scholar] [CrossRef]
  21. Bai, B.; Xiong, S.; Song, B.; Xiaoming, M. Economic analysis of distributed solar photovoltaics with reused electric vehicle batteries as energy storage systems in china. Renew. Sustain. Energy Rev. 2019, 109, 213–229. [Google Scholar] [CrossRef]
  22. Clean Energy Ministerial. A Campaign of the Clean Energy Ministerial. 2019. Available online: http://www.cleanenergyministerial.org/campaign-clean-energy-ministerial/ev3030-campaign (accessed on 10 November 2019).
  23. Electric Vehicle Database. Useable Battery Capacity of Full Electric Vehicles. Available online: https://ev-database.org/cheatsheet/useable-battery-capacity-electric-car (accessed on 10 November 2019).
  24. Mahmud, K.; Town, G.E.; Morsalin, S.; Hossain, M.J. Integration of electric vehicles and management in the internet of energy. Renew. Sustain. Energy Rev. 2018, 82, 4179–4203. [Google Scholar] [CrossRef]
  25. Lazzeroni, P.; Olivero, S.; Repettov, M.; Stirano, F.; Vallet, M. Optimal battery management for vehicle-to-home and vehicle-to-grid operations in a residential case study. Energy 2019, 175, 704–721. [Google Scholar] [CrossRef]
  26. Barone, G.; Buonomano, A.; Calise, F.; Forzano, C.; Palombo, A. Building to vehicle to building concept toward a novel zero energy paradigm: Modelling and case studies. Renew. Sustain. Energy Rev. 2019, 101, 625–648. [Google Scholar] [CrossRef]
  27. El-Hendawi, M.; Wang, Z.; Liu, X. Centralized and Distributed Optimization for Vehicle-to-Grid Applications in Frequency Regulation. Energies 2022, 15, 4446. [Google Scholar] [CrossRef]
  28. Hu, J.; Moraisv, H.; Sousa, T.; Lind, M. Electric vehicle fleet management in smart grids: A review of services, optimization and control aspects. Renew. Sustain. Energy Rev. 2016, 56, 1207–1226. [Google Scholar] [CrossRef] [Green Version]
  29. Assunção, A.; Moura, P.S.; Almeida, A.T. Technical and economic assessment of the secondary use of repurposed electric vehicle batteries in the residential sector to support solar energy. Appl. Energy 2016, 181, 120–131. [Google Scholar] [CrossRef]
  30. Lehtola, T.A.; Zahedi, A. Electric Vehicle Battery Cell Cycle Aging in Vehicle to Grid Operations: A Review. IEEE J. Emerg. Sel. Top. Power Electron. 2021, 9, 423–437. [Google Scholar] [CrossRef]
  31. Mirzaei Omrani, M.; Jannesari, H. Economic and environmental assessment of reusing electric vehicle lithium-ion batteries for load leveling in the residential, industrial and photovoltaic power plants sectors. Renew. Sustain. Energy Rev. 2019, 116, 109413. [Google Scholar] [CrossRef]
  32. Debnath, U.K.; Ahmad, I.; Habibi, D. Gridable vehicles and second life batteries for generation side asset management in the smart grid. Int. J. Electr. Power Energy Syst. 2016, 82, 114–123. [Google Scholar] [CrossRef]
  33. Saber, A.Y.; Venayagamoorthy, G.K. Efficient utilization of renewable energy sources by gridable vehicles in cyber-physical energy systems. IEEE Syst. J. 2010, 4, 285–294. [Google Scholar] [CrossRef] [Green Version]
  34. Han, X.; Liang, Y.; Ai, Y.; Li, J. Economic evaluation of a pv combined energy storage charging station based on cost estimation of second-use batteries. Energy 2018, 165, 326–339. [Google Scholar] [CrossRef]
  35. Ciocia, A.; Amato, A.; Di Leo, P.; Fichera, S.; Malgaroli, G.; Spertino, F.; Tzanova, S. Self-Consumption and Self-Sufficiency in Photovoltaic Systems: Effect of Grid Limitation and Storage Installation. Energies 2021, 14, 1591. [Google Scholar] [CrossRef]
  36. Hemmati, R.; Mehrjerdi, H.; Al-Emadi, N.A.; Rakhshani, E. Mutual Vehicle-to-Home and Vehicle-to-Grid Operation Considering Solar-Load Uncertainty. In Proceedings of the 2019 2nd International Conference on Smart Grid and Renewable Energy (SGRE), Doha, Qatar, 19–21 November 2019; pp. 1–4. [Google Scholar] [CrossRef]
  37. Fathima, H.; Prabaharan, N.; Palanisamy, K.; Kalam, A.; Mekhilef, S.; Justo, J.J. 10—Smart grid and power quality issues. In Hybrid-Renewable Energy Systems in Microgrids; Woodhead Publishing: Cambridge, UK, 2018; pp. 195–202. [Google Scholar]
  38. Liu, C.; Chau, K.T.; Wu, D.; Gao, S. Opportunities and challenges of vehicle-to-home, vehicle-to-vehicle, and vehicle-to-grid technologies. Proc. IEEE 2013, 101, 2409–2427. [Google Scholar] [CrossRef] [Green Version]
  39. Ministério do Ambiente, Ordenamento do Território e Energia. Decreto-lei 153/2014. October 2014. Available online: https://dre.pt/home/-/dre/58406974/details/maximized (accessed on 12 May 2019).
  40. Cavaco, A.; Silva, H.; Canhoto, P.; Neves, S.; Neto, J.; Pereira, M.C. Radiação Solar Global em Portugal e a sua Variabilidade, Mensal e Annual. Available online: https://docplayer.com.br/64131546-Radiacao-solar-global-em-portugal-e-a-sua-variabilidade-mensal-e-anual.html (accessed on 21 October 2018).
  41. Foles, A.; Fialho, L.; Collares-Pereira, M. Techno-economic evaluation of the portuguese pv and energy storage residential applications. Sustain. Energy Technol. Assess. 2020, 39, 100686. [Google Scholar] [CrossRef]
  42. Perfis de Consumo. 2020. Available online: https://www.edpdistribuicao.pt/pt-pt/perfis-de-consumo (accessed on 18 November 2019).
  43. European Commission. Photovoltaic Geographical Information System. 2020. Available online: https://re.jrc.ec.europa.eu/pvg_tools/en/#MR (accessed on 21 June 2021).
  44. OMIE. Evolución del Mercado de Electricidad. Informe Anual 2020. Available online: https://www.omie.es/sites/default/files/2020-02/informe_anual_2019_es.pdf (accessed on 6 July 2021).
  45. P. E. S. R. Authority. Simulador. 2020. Available online: https://simulador.precos.erse.pt/eletricidade/ (accessed on 5 June 2021).
  46. Weldon, P.; Morrissey, P.; Brady, J.; O’Mahony, M. An investigation into usage patterns of electric vehicles in ireland. Transp. Res. Part D Transp. Environ. 2016, 43, 207–225. [Google Scholar] [CrossRef]
  47. Gough, B.; Rowley, P.; Walsh, C. What impact will the journey patterns of electric vehicles have on their capability to provide ancillary services? In Proceedings of the 5th IET Hybrid and Electric Vehicles Conference (HEVC 2014), London, UK, 5–6 November 2014; pp. 1–5. [Google Scholar]
  48. Zhang, X.; Zou, Y.; Fan, J.; Guo, H. Usage pattern analysis of beijing private electric vehicles based on real-world data. Energy 2019, 167, 1074–1085. [Google Scholar] [CrossRef]
  49. Zhang, Z.; Jeong, Y.; Jang, J.; Lee, C.G. A Pattern-driven Stochastic Degradation Model for the Prediction of Remaining Useful Life of Rechargeable Batteries. IEEE Trans. Ind. Inform. 2022, 18, 8586–8594. [Google Scholar] [CrossRef]
  50. Sedlakova, V.; Sikula, J.; Sedlak, P.; Cech, O.; Urrutia, L. A Simple Analytical Model of Capacity Fading for Lithium–Sulfur Cells. IEEE Trans. Power Electron. 2019, 34, 5779–5786. [Google Scholar] [CrossRef]
  51. Kim, S.H.; Lee, H.M.; Shin, Y.J. Aging Monitoring Method for Lithium-Ion Batteries Using Harmonic Analysis. IEEE Trans. Instrum. Meas. 2021, 70, 3506811. [Google Scholar] [CrossRef]
  52. Masaud, T.M.; El-Saadany, E.F. Correlating Optimal Size, Cycle Life Estimation, and Technology Selection of Batteries: A Two-Stage Approach for Microgrid Applications. IEEE Trans. Sustain. Energy 2020, 11, 1257–1267. [Google Scholar] [CrossRef]
  53. Kolawole, O.; Al-Anbagi, I. Electric Vehicles Battery Wear Cost Optimization for Frequency Regulation Support. IEEE Access 2019, 7, 130388–130398. [Google Scholar] [CrossRef]
  54. Zhang, L.; Yu, Y.; Qian, X.; Zhang, S.; Wang, X.; Zhang, X.; Chen, M. Improved Cycle Aging Cost Model for Battery Energy Storage Systems Considering More Accurate Battery Life Degradation. IEEE Access 2022, 10, 297–307. [Google Scholar] [CrossRef]
  55. Peters, M.; Schmidt, T.S.; Wiederkehr, D.; Schneider, M. Shedding light on solar technologies—A techno-economic assessment and its policy implications. Energy Policy 2011, 39, 6422–6439. [Google Scholar] [CrossRef]
  56. Jordan, D.; Kurtz, S. Photovoltaic degradation rates—An analytical review. Prog. Photovolt. Res. Appl. 2013, 21, 12–29. [Google Scholar] [CrossRef] [Green Version]
  57. Jordan, D.C.; Kurtz, S.R.; VanSant, K.; Newmiller, J. Compendium of photovoltaic degradation rates. Prog. Photovolt. Res. Appl. 2016, 24, 978–989. [Google Scholar] [CrossRef]
Figure 1. V2Hs as the future for spreading small-scale PV prosumers; (a) classical structure with batteries, (b) planned structure using batteries of the EVs (V2H).
Energies 16 01218 g001aEnergies 16 01218 g001b
Figure 2. Normalized consumption for UPAC class C [39].
Energies 16 01218 g002
Figure 3. Normalized production for UPAC class C [39].
Energies 16 01218 g003
Figure 4. Annual total distributed consumption and injection over the day.
Energies 16 01218 g004
Figure 5. Peak and off-peak price values of electricity retailers in Portugal assuming a contracted power of 10.35 kVA [45].
Energies 16 01218 g005
Figure 6. Activity decision diagram for every 15 min sampled energy.
Energies 16 01218 g006
Figure 7. Average savings with injection (per month).
Energies 16 01218 g007
Figure 8. Average savings without injection (per month).
Energies 16 01218 g008
Table 1. Condition estimated equipment and installation prices [41].
PV Power (kWp)Mounting or
Holding Device (€)
Inverter (€)Cables and
Accessories (€)
Labor to Install (€)
0.505019950100
0.755032450150
1.50200597100200
3.453001393100300
Table 2. Registration fee to operate as UPAC with and without surplus injection.
PV Power (kWp)With Surplus Injection (€)Without Surplus Injection (€)
0–1.5300
1.5–510070
Table 3. Peak and off-peak values of Portugal Continent electricity retailers assuming a contracted power of 10.35 kVA [45].
CompanyPeak (€/kWh) w/o TaxOff-Peak (€/kWh) w/o Tax
Endesa0.1810.111
Iberdrola0.1950.119
Galp0.2000.093
Muon Electric0.1740.081
Gold Energy0.1740.081
YLCE0.1870.100
EDP0.1720.101
Ptlive0.1870.102
Luzboa0.1850.100
Average (with Tax)0.22620.1213
Table 4. Vehicle-to-Home usage profile: periods in which the vehicle is off home.
ProfileHoursDay
weekday morningfrom 8:00 am until 1:00 pmMonday to Friday
weekday afternoonfrom 1:00 pm until 6:00 pmMonday to Friday
weekdayfrom 8:00 am until 6:00 pmMonday to Friday
weekday eveningfrom 6:00 pm until 11:00 pmMonday to Friday
weekendfrom 6:00 am until 0:00 amSaturday, Sunday
Table 5. Economical results for 0.5 kWp PV setup.
Grid InjectionV2H Occupied PeriodsNPV [€]IRR [%]PIDPP [Years]LCOE [€/kWh]
Truealways available1802.818134.255.20244.11770.0089
Truesat–sun 6:00 am–0:00 am1318.949326.774.07455.06870.0089
Truemon–fri 1:00 pm–6:00 pm1260.415025.853.93805.17370.0089
Truemon–fri 6:00 pm–11:00 pm1179.370324.593.74915.33170.0089
Truemon–fri 8:00 am–1:00 pm1117.869023.623.60585.46250.0089
Truemon–fri 8:00 am–6:00 pm575.465914.882.34148.31460.0089
Truenot available78.30575.731.182519.07990.0089
Falsealways available1845.556536.955.62553.72670.0082
Falsesat–sun 6:00 am–0:00 am1196.957326.203.99995.13910.0082
Falsemon–fri 1:00 pm–6:00 pm1118.495324.893.80325.30020.0082
Falsemon–fri 6:00 pm–11:00 pm1222.043726.624.06285.09090.0082
Falsemon–fri 8:00 am–1:00 pm927.420321.663.32446.09260.0082
Falsemon–fri 8:00 am–6:00 pm200.35918.471.502214.06780.0082
Falsenot available−466.0565NaN−0.1681−1.00000.0082
Table 6. Economical results for 0.75 kWp PV setup.
Grid InjectionV2H Occupied PeriodsNPV [€]IRR [%]PIDPP [Years]LCOE [€/kWh]
Truealways available2578.014834.665.26824.08920.0125
Truesat–sun 6:00 am–0:00 am1908.914327.324.16055.00980.0125
Truemon–fri 1:00 pm–6:00 pm1883.910327.044.11915.03970.0125
Truemon–fri 6:00 pm–11:00 pm1717.679425.203.84385.25490.0125
Truemon–fri 8:00 am–1:00 pm1670.091324.683.76515.32230.0125
Truemon–fri 8:00 am–6:00 pm856,486615.422.41808.17680.0125
Truenot available167.44916.571.277217.10820.0125
Falsealways available2620.753336.565.56583.75240.0118
Falsesat–sun 6:00 am–0:00 am1704.557126.003.96965.16290.0118
Falsemon–fri 1:00 pm–6:00 pm1649.661625.363.87405.24040.0118
Falsemon–fri 6:00 pm–11:00 pm1760.320426.654.06685.08790.0118
Falsemon–fri 8:00 am–1:00 pm1363.049022.003.37466.03890.0118
Falsemon–fri 8:00 am–6:00 pm272.45728.241.474714.17700.0118
Falsenot available−670.4634NaN−0.1681−1.00000.0118
Table 7. Economical results for 1.5 kWp PV setup.
Grid InjectionV2H Occupied PeriodsNPV [€]IRR [%]PIDPP [Years]LCOE [€/kWh]
Truealways available4277.511431.514.79554.33400.0232
Truesat–sun 6:00 am–0:00 am3239.310425.393.87435.23450.0232
Truemon–fri 1:00 pm–6:00 pm3419.925426.464.03455.10720.0232
Truemon–fri 6:00 pm–11:00 pm2681.317522.063.37926.02710.0232
Truemon–fri 8:00 am–1:00 pm3092.013424.513.74365.34630.0232
Truemon–fri 8:00 am–6:00 pm1585.173515.322.40658.20960.0232
Truenot available437.21577.521.387915.20230.0232
Falsealways available4186.421330.174.58734.45100.0242
Falsesat–sun 6:00 am–0:00 am2688.134521.573.30356.09860.0242
Falsemon–fri 1:00 pm–6:00 pm2808.966422.273.40705.66460.0242
Falsemon–fri 6:00 pm–11:00 pm2223.398818.842.90526.59050.0242
Falsemon–fri 8:00 am–1:00 pm2335.467419.513.00136.46000.0242
Falsemon–fri 8:00 am–6:00 pm274.65326.201.235318.04560.0242
Falsenot available−1381.0709NaN−0.1834−1.00000.0242
Table 8. Economical results for 3.45 kWp PV setup.
Grid InjectionV2H Occupied PeriodsNPV [€]IRR [%]PIDPP [Years]LCOE [€/kWh]
Truealways available6612.416926.354.01525.11820.0454
Truesat–sun 6:00 am–0:00 am5370.000222.543.44875.62460.0454
Truemon–fri 1:00 pm–6:00 pm5996.781024.473.73455.35010.0454
Truemon–fri 6:00 pm–11:00 pm4303.738519.232.96256.51660.0454
Truemon–fri 8:00 am–1:00 pm5709.326323.593.60345.47060.0454
Truemon–fri 8:00 am–6:00 pm3873.187517.872.76627.16970.0454
Truenot available1463.88299.811.667512.20920.0454
Falsealways available5054.772621.773.33696.07020.0447
Falsesat–sun 6:00 am–0:00 am3294.038616.152.52297.57340.0447
Falsemon–fri 1:00 pm–6:00 pm4136.148918.872.91226.59060.0447
Falsemon–fri 6:00 pm–11:00 pm2064.414212.021.954410.22340.0447
Falsemon–fri 8:00 am–1:00 pm3693.875717.452.70787.26400.0447
Falsemon–fri 8:00 am–6:00 pm1032.79388.271.477514.16050.0447
Falsenot available−2544.3731NaN−0.1763−1.00000.0447
Table 9. Investment costs in three different battery packs according to [41].
Capacity (kWh)Investment Cost (€)
3.31625.0
6.64060.0
9.95370.0
Table 10. Economical results for 0.5 kWp PV setup (individual battery packs).
Grid InjectionBattery DescriptionNPV [€]IRR [%]PIDPP [Years]LCOE [€/kWh]
Truebattery pack of 3.3 kWh−153.5163.250.9253−10.0423
Truebattery pack of 6.6 kWh−2994.94−4.780.3328−10.0922
Truebattery pack of 9.9 kWh−4522.12−7.430.2202−10.1191
Falsebattery pack of 3.3 kWh−369.2062.110.8176−10.0415
Falsebattery pack of 6.6 kWh−3207.65−5.890.2806−10.0914
Falsebattery pack of 9.9 kWh−4731.85−8.650.1798−10.1183
Table 11. Economical results for 0.75 kWp PV setup (individual battery packs).
Grid InjectionBattery DescriptionNPV [€]IRR [%]PIDPP [Years]LCOE [€/kWh]
Truebattery pack of 3.3 kWh−357.95422.350.8394−10.0458
Truebattery pack of 6.6 kWh−3199.3818−5.160.314−10.0958
Truebattery pack of 9.9 kWh−4726.561−7.750.2088−10.1227
Falsebattery pack of 3.3 kWh−573.64341.220.7391−10.0451
Falsebattery pack of 6.6 kWh−3412.087−6.290.2637−10.095
Falsebattery pack of 9.9 kWh−4936.2894−9.010.1695−10.1219
Table 12. Economical results for 1.5 kWp PV setup (individual battery packs).
Grid InjectionBattery DescriptionNPV [€]IRR [%]PIDPP [Years]LCOE [€/kWh]
Truebattery pack of 3.3 kWh−968.93140.120.6479−10.0566
Truebattery pack of 6.6 kWh−3810.359−6.260.2654−10.1065
Truebattery pack of 9.9 kWh−5337.5382−8.700.1785−10.1334
Falsebattery pack of 3.3 kWh−1284.3436−1.330.54−10.0576
Falsebattery pack of 6.6 kWh−4122.7872−7.690.2113−10.1075
Falsebattery pack of 9.9 kWh−5646.9896−10.320.1361−10.1344
Table 13. Economical results for 3.45 kWp PV setup (individual battery packs).
Grid InjectionBattery DescriptionNPV [€]IRR [%]PIDPP [Years]LCOE [€/kWh]
Truebattery pack of 3.3 kWh−2232.1979−3.270.4153−10.0788
Truebattery pack of 6.6 kWh−5073.6255−8.390.1886−10.1287
Truebattery pack of 9.9 kWh−6600.8048−10.720.1272−10.1556
Falsebattery pack of 3.3 kWh−2447.8871−4.380.3538−10.078
Falsebattery pack of 6.6 kWh−5286.3308−9.730.1505−10.1279
Falsebattery pack of 9.9 kWh−6810.5331−12.360.0959−10.1548
Disclaimer/Publisher’s Note: The statements, opinions and data contained in all publications are solely those of the individual author(s) and contributor(s) and not of MDPI and/or the editor(s). MDPI and/or the editor(s) disclaim responsibility for any injury to people or property resulting from any ideas, methods, instructions or products referred to in the content.

