Article

The Effect of Diluents on the Flame Structure and NO Generation Characteristics of H2/CO Micromixing Flames

School of Energy Science and Engineering, Harbin Institute of Technology, Harbin 150006, China
*
Authors to whom correspondence should be addressed.
Energies 2023, 16(3), 1252; https://doi.org/10.3390/en16031252
Submission received: 24 December 2022 / Revised: 18 January 2023 / Accepted: 19 January 2023 / Published: 24 January 2023

Abstract

:
This paper uses numerical simulation to investigate the effects of diluents on the flame structure and NO generation of H2/CO micromixing flames. The results show that under the same thermal power condition, the diluents reduce the flame temperature and decrease the combustion reaction rate and flame propagation velocity. In addition, the diluents downsize the flame and force it downstream. With an increase in the diluent fraction, these trends are amplified. The NO production decreases due to the diluents, and the NO is lowest when H2O is added. When the diluents are CO2 and H2O, the NO generation is dominated by the reactants’ concentration. This results in the lowest temperature not corresponding to the lowest NO production. The diluents also reduce the sensitivity of the NO production to the temperature, and the CO2 diluent highly weakens the sensitivity.

1. Introduction

Currently, coal accounts for more than 50% of the total energy consumption in China. China’s energy structure determines that coal resources will remain in use for a long time. The Integrated Gasification Combined Cycle (IGCC) is one of the most efficient coal-based power generation technologies. It has ultralow/near-zero emissions of pollutants and CO2. The IGCC thus meets the demand for China’s current and future development needs [1]. The fuel behind IGCC is syngas produced by the gasification of solid fuels such as coal or coke. The main combustible components of syngas are CO and H2. Its combustion products are H2O and CO2, which classify it as a clean energy source. Due to the presence of H2, the flame propagation is fast, the adiabatic flame temperature is high, and NOX is easily generated [2]. In fact, syngas NOX emissions are much higher than those from natural gas [3]. Micromixing combustion technology has been proposed as an advanced combustion organization method to decrease the combustion instability and high NOX emissions of syngas [4]. As another standard technical route, dilution combustion is also very beneficial in solving the abovementioned problems. Therefore, the flame structure and NOx emission characteristics have become important research topics in terms of the dilute micromixing combustion of syngas.
Many studies have focused on the flame structure and NOX formation characteristics of diluted syngas combustion. Zhang et al. [5,6,7] concluded that adding diluents caused significant changes in a flame’s microscopic and macroscopic characteristics. Meanwhile, different diluents had similar effects on flames. Regardless of the diluent type, they decreased the flame temperature, density, and propagation velocity. Jithin et al. [8] summarized the studies of syngas dilution combustion. The results indicated that a large scatter in laminar burning velocity was observed at the rich side, especially the equivalence ratios near to the peak value of the laminar burning velocity. In addition, adding diluents reduced the flame height, total flame front length, and OH radical concentration, and increased the flame swirl area. Adding diluents also made the flame’s thermal diffusion instability and acceleration effect become more prominent, and when the diluent fraction was increased, these effects were even more pronounced. However, the diluents also show diversity. When the diluents were N2, CO2, and H2O, studies [5,9] revealed that the radiant heat loss from the flame was greater than that without diluents, and there were significant lift phenomena when the CO2 and H2O diluents were added. Furthermore, the blow-off temperature was higher under H2O dilution than under the N2 and CO2 dilutions. A sensitivity analysis of the relevant chemical reactions showed that OH + OH = O + H2O occurred as a heat-absorption reaction in the H2O-diluted flame. In contrast, O + H + M = OH occurred as an exothermic reaction in the N2- and CO2-diluted flames. The specific heat capacity of N2 was the smallest, which resulted in the highest flame temperature. In addition, compared to the N2 and H2O dilution, CO2 dilution had the lower OH radical concentration and flame temperature, the smaller flame size, and the more pronounced effects of flame thermal diffusion instability and flame acceleration [10].
The NO emissions from syngas combustion come primarily from fuel NO formation and thermal NO formation [11]. Studies on syngas combustion have shown that different diluents have varying effects on NO generation. For flames diluted with N2, CO2, and H2O, the NOx production and temperature always peaked simultaneously with the stoichiometric fraction. This suggests that NO generation is primarily influenced by the temperature. In addition, the effect of the diluent on NO generation varied. For premixed flames, NO production was minimal with the H2O because the N2 itself provided the elemental N, which promoted the N → NO reaction and generated more NO. In contrast, CO2 generated more O radicals via the thermal and NNH routes, which promoted NO formation. In diffusion flames, most NO was generated via the thermal route, with the CO2 diluent generating a lower amount of NO and the N2 and H2O diluents generating comparable levels of NO. The CO2 diluent reduced the NO generation mainly by slowing the reaction rates of N + NO = N2 + O, N +O2 = NO + O, N + OH = NO + H, and N + CO2 = NO + CO. In addition to the combustion organization method, the dilution effect of the diluents varied across different strain rates. At any strain rate, the combustion temperature was highest with the N2 diluent, while the magnitudes of the combustion temperatures with the CO2 and H2O diluents were opposite at high and low strain rates. At high strain rates, the combustion temperature of the H2O-diluted flame was higher due to the chemical effect. In contrast, at low strain rates, the radiation effect resulted in a lower combustion temperature. At high strain rates, the H2O diluent produced a lower amount of NO. Adding H2O led to increasing H radicals, which strengthened the reaction of the NNH + H = N2 + H2, weakened the primary reaction of the NNH + O = NH + NO in the NNH intermediate route, and further weakened the reaction of the NH + O = H + NO with a corresponding decrease in the concentration of the N radicals. Then, the reduction in the N radicals led to an inactive primary reaction in the thermal route and, ultimately, lower NO production. At a strain rate of 10 s−1, the CO2 diluent minimized the NO production. Although CO2 strengthened the reaction of the N +CO2 = NO + CO, the radiative heat loss from the flame was significant, reducing the NO production through the thermal route. At a strain rate of 1 s−1, the H2O diluent produced the least amount of NO because the reaction of the N + CO2 = NO + CO overtook the thermal route as the prime source of NO [9,12,13]. The study of Shi et al. [14] showed that when the volume ratio of CO/H2 changed, the influence of the diluent on the NO generation characteristics was also strongly altered. When the N2 diluent was added, the NNH route generated the majority of NO when the CO/H2 was less than 4, and the NO generated by this route increased with the increase in the CO/H2. In contrast, the NO generated by the thermal route and the N2O route decreased with an increase in the CO/H2. Furthermore, when the CO/H2 was more than 4, the proportion of NO generated by each route remained almost unchanged. When CO2 was added, the NNH route generated the most NO, and the NO proportion in the thermal route did not change. When the CO/H2 was less than 3, the NO generated by the NNH route rose, while the NO generated by the N2O route decreased with the increase in the CO/H2. When the CO/H2 was greater than 3, the route trends described above reversed. When H2O was added, the N2O route generated the most NO, and with the increase in the CO/H2, the N2O route generated less NO, and the NNH route generated more NO. When the CO/H2 was 8, the two routes were almost equal, and the NO change in the thermal route could be ignored. In addition, the study of Wang et al. [15] revealed that the influence of the diluents on the NO generation characteristics also changed under different pressures. Based on the above studies, diluents can significantly alter the flame structure and affect the NO generation during combustion. These diluent effects are not constant and depend on diverse combustion conditions. At present, there is a lack of research on the effects of diluents on the flame structure and the NO generation characteristics of syngas in micromixing combustion. Hence, this paper investigates the effect of diluents on micromixing combustion.

2. Methods

2.1. Physical Model

This study carried out numerical simulations of the micromixing combustion of syngas, using the burner schematic shown in Figure 1 to achieve micromixing combustion. Figure 1a shows the overall structure of the burner and the combustion chamber. Figure 1b shows the center-section view of the burner, and Figure 1c shows the details of the dotted box in Figure 1b. The air entered the green air chamber through the green inlets before entering the seven air pipes that passed through the red cylindrical fuel chamber. The fuel entered the red annular fuel chamber through the red inlets before entering the cylindrical fuel chamber. The air and fuel inlets’ diameters were 10 mm. At 10 mm before the outlet of each air pipe, there were four holes with uniform distributions perpendicular to the axis of the air pipe. Fuel entered the air pipe through these holes and mixed with the air to form a premixed section. The mixed gas entered the blue combustion chamber through the air pipe outlets. The hole and air tube diameters were 1 mm and 6 mm, respectively. The diameter of the combustion chamber was 500 mm, the height of the combustion chamber was 1000 mm. Compared with a traditional burner, this burner reduced the geometric scale of the fuel-and-air mixture and shortened the residence time of the mixture, thus realizing micromixing combustion.
In order to reduce the calculation, the fluid domain was simplified. Compared to the physical model, there were two changes. Firstly, part of the air chamber and fuel chamber was ignored. The distance from the air inlet to the burner outlet was 240 mm. The air inlet area was 961 mm2, and the fuel inlet area was 126 mm2. Secondly, the diameter of the combustion chamber was 300 mm, and the height was 600 mm.

2.2. Numerical Simulation Model and Mechanism

The calculations in this study used the Reynolds-averaged Navier-Stokes (RANS) method. The micromixing burner had seven nozzles and flowed through the pipeline. The mixed gas entered the combustion chamber through a jet flow, with a high exit velocity and vortices at the exit. According to the above structure and flow characteristics, the realizable k-ε model was selected, and the governing equations are shown below [16]. The continuity equation is
( ρ ¯ u ˜ ) = 0 ,
where ρ ¯ is the mean density of the mixture and u ˜ is the mean velocity vector. The momentum equation is
( ρ ¯ u ˜   u ˜ ) = p ˜ + μ u ˜ + ( u ˜ ) T 2 3 u ˜ I   μ t u ˜ + ( u ˜ ) T 2 3 ρ ¯   k ˜ I ,
where p ˜ is the time-averaged total pressure, μ is the dynamic viscosity, μ t is the eddy viscosity, k ˜ is the mean turbulent kinetic energy, and I is the unity identity tensor. The equations for the mean turbulent kinetic energy and the mean dissipation rate are
( ρ ¯ u ˜ k ˜ ) = μ + μ t σ k k ˜ + G k ρ ¯ ε ˜ ,
and
( ρ ¯ u ˜ ε ˜ ) = μ + μ t σ ε ε ˜ + C ε 1 ε ˜ k ˜ G k C ε 2 ρ ¯ ε ˜ 2 k ˜ ,
where ε ˜ is the mean dissipation rate, σ k and σ ε are the turbulent Prandtl numbers of k ˜ and ε ˜ , respectively, σ k = 1.00 , σ ε = 1.30 , G k is the turbulent kinetic energy generated by the velocity gradient, and C ε 1 = 1.44 and C ε 2 = 1.92 are the production and destruction constants that control the dissipation rate of the turbulent kinetic energy, respectively. G k is represented as
G k = μ t S ˜ 2 ,
where S ˜ is the module of the average strain rate tensor, defined as
S ˜ = 1 2   u ˜ + (   u ˜ ) T ˜ ;
based on k ˜ and ε ˜ , μ t is expressed as
μ t = ρ ¯ C μ k ˜ 2 ε ˜ ,
where C μ is a constant value.
In addition to the continuity equation and the momentum equation, the control equation is used and also includes the energy equation
( ρ ¯ u ˜ h ˜ ) = f c p + μ t P r t h ˜ + S ˜ rad ,
where h ˜ is the mean total enthalpy of the mixture, f is the thermal conductivity of the mixture, c p is the mean specific heat of the mixture, P r t is the turbulent Prandtl number, and S ˜ rad is the radiant heat source, where h ˜ is denoted as
h ˜ = k Y ˜ k h ˜ k ,
where Y ˜ k represents the mean average mass fraction and h ˜ k is the mean total enthalpy, which can be expressed as
h ˜ k = k = 1 N k h f 0 ¯ W k + T r e f T ˜ c p , k d T ˜ ,
where N k is the total number of chemical species, h f 0 ¯ is the molar enthalpy of formation, W k is the molecular mass, T ˜ is the mean temperature, T r e f is the reference temperature, and c p , k is the specific heat. The formula for c p is
c p = k = 1 N k Y ˜ k c p , k .
Among the many combustion models, the Flamelet Generated Manifolds (FGM) model can create small flame tables with detailed chemical reaction mechanisms and establish a continuous flame surface in the small flame region, ensuring accurate simulation of the H2 combustion [17]. Therefore, the FGM model was chosen for this study. The energy treatment was set as nonadiabatic. The flamelet type was premixed. The flamelet solution method was progress variable space. The number of mean progress variable points was 45, and the number of mean mixture fraction points was 40. The number of progress variable variance points was 28, and the number of mixture fraction variance points was 17. The maximum number of species was 15. NO was selected as the transported scalars. Currently, the GRI Mesh 3.0 mechanism, Davis mechanism, and Ranzi mechanism are widely used in syngas combustion modeling. The GRI Mesh 3.0 mechanism contains the most components and chemical reactions. Studies by Natarajan [18] and Yuan [2] have shown that the GRI Mesh 3.0 mechanism predicted the flame structure and NOX production better than the other two mechanisms. In addition, the applicability of the GRI Mesh 3.0 mechanism to syngas combustion was confirmed by Sahu et al. [19]. Therefore, this study chose the GRI Mesh 3.0 mechanism to model the H2/CO chemical reaction and NO generation properties.

2.3. Boundary Conditions

The inlet boundary was defined as the velocity inlet, and the outlet boundary used a pressure outlet condition. The equivalence ratio was fixed at 0.7, and the power was constant at 10.5 kW. The air (comprising 79% and 21% of N2 and O2, respectively, at 691.15 K) inlet velocity is shown in Table 1 at atmospheric pressure. A turbulence intensity of 5% and a hydraulic diameter of 0.021 m defined the air inlet turbulence. The inlet velocity of the fuel (with C/H as 1, at 288.15 K) is shown in Table 1. The pressure was atmospheric. A turbulence intensity of 5% and a hydraulic diameter of 0.012 m defined the fuel inlet turbulence. N2 and CO2 diluted the fuel side, and H2O diluted the air side. The flame without the diluent was denoted as F. With the N2 dilution fractions of 0.1, 0.2, and 0.3, the flames were called FN1, FN2, and FN3, respectively. With the CO2 dilution fractions of 0.1, 0.2, 0.3, the flames were called FC1, FC2, and FC3, respectively. With the H2O dilution fractions of 0.1, 0.2, and 0.3, the flames were called FH1, FH2, and FH3, respectively.

2.4. Solution

In this study, the SIMPLE method was used to solve the coupled pressure–velocity problem, and a split implicit solver was used to solve all the control equations. The pressure, momentum, energy, and species terms were all in second-order upwind discrete formats. The energy residual was set to <10−6, and the other residuals were set to <10−3.

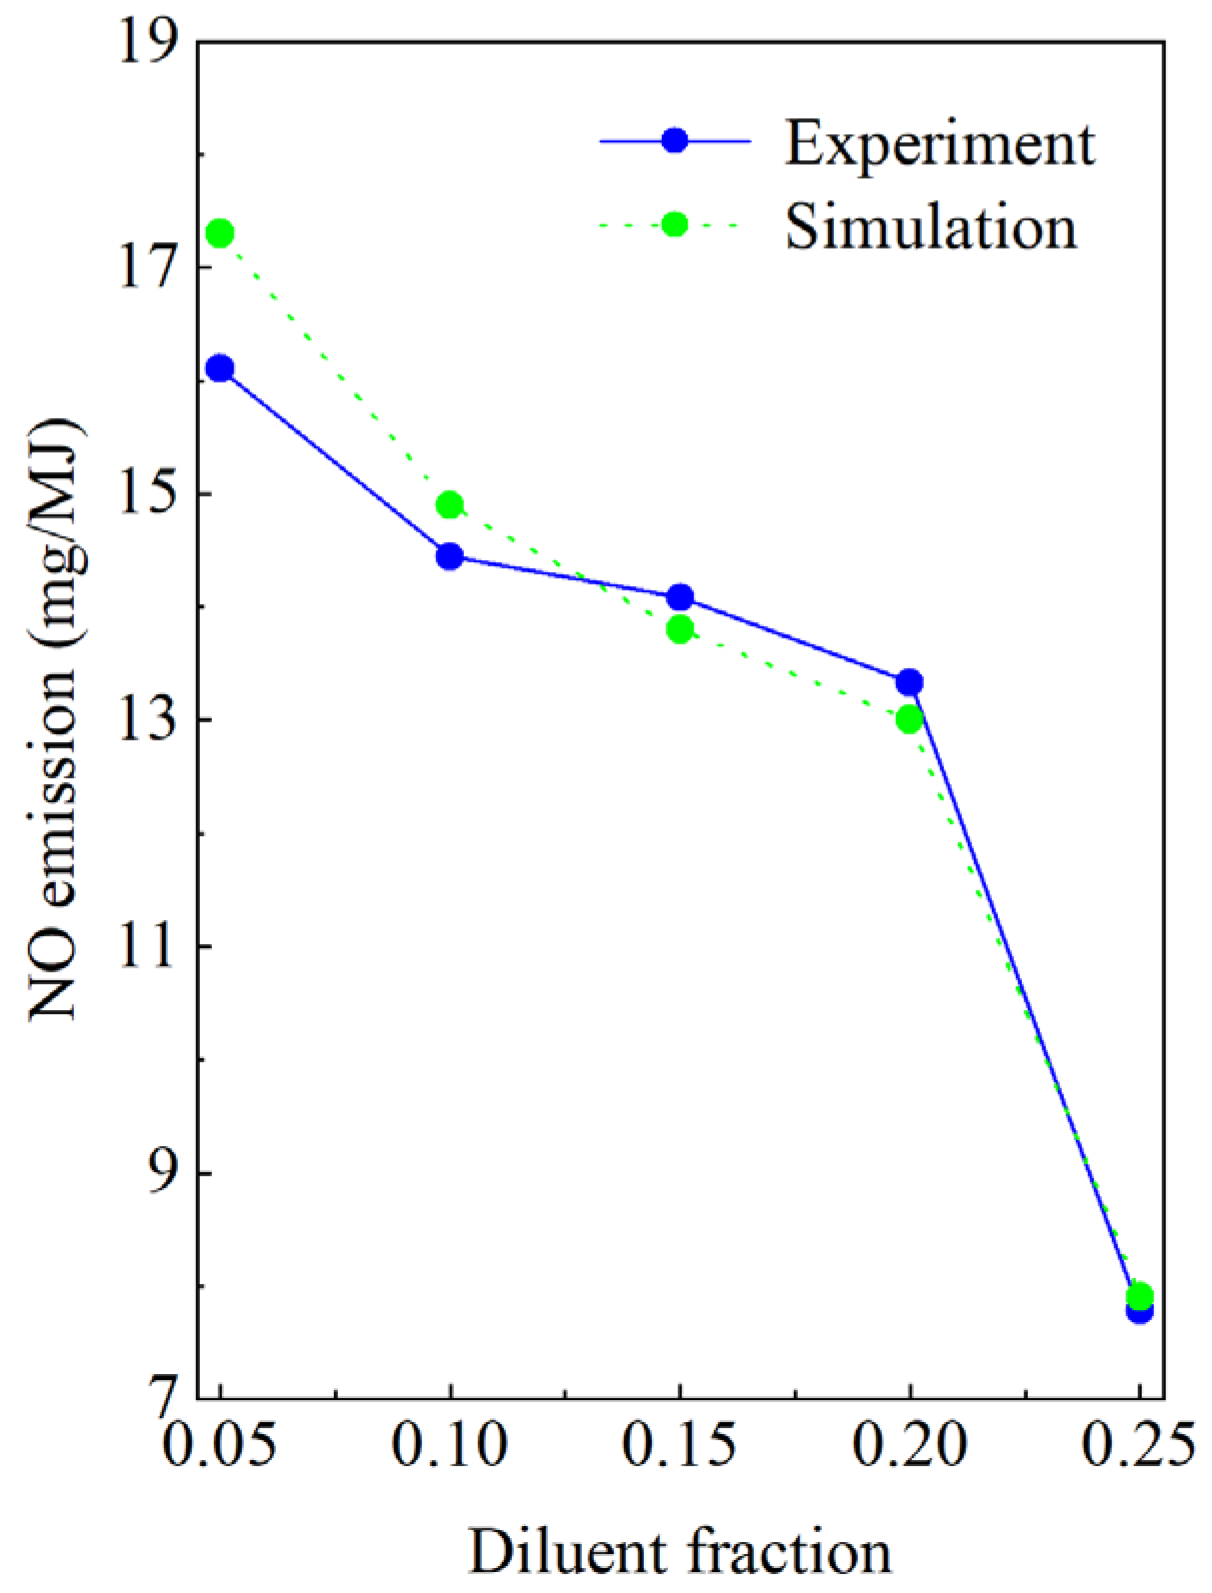
2.5. Model Verification

The grid was divided into a hybrid grid mesh to improve the simulation accuracy without compromising the computational intensity. To ensure the accuracy of the simulation, the grid was encrypted at the fuel–air mixing and burning main zone. Due to the different mesh sizes, four different densities of meshes were obtained: 1.02 million grids, 2.52 million grids, 3.92 million grids, and 7.96 million grids. According to Roache’s Grid Convergence Index (GCI) for mesh irrelevance verification [20], the GCI is less than 3% when the number of mesh units is greater than or equal to 2.52 million grids, which indicates that the error of this study’s calculation results was within an acceptable range when the number of mesh units was greater than or equal to 2.52 million grids [21]. Therefore, the 2.52 million grids shown in Figure 2 were used for the numerical simulations. Figure 2a shows the mesh contour of the fluid domain. The surface grid size used in making the poly-hexcore mesh was three. Figure 2b shows the mesh on the central section of the fluid domain. The area inside the dashed box used BOI. Figure 2c shows a detailed view of the mesh in the dashed box of the combustion chamber region. The size of the grid was two. Figure 2d shows a detailed view of the mesh in the dashed box of the air–fuel mixing region. The size of the grid was 0.3.
Prior experimental data [22] on hydrogen-rich syngas combustion were used to verify the legitimacy of the model. The experiment formed a premixed swirl flame. The swirler was equipped with six straight vanes, which were positioned at an angle of 45 degrees to the axial centerline. The outer diameter of the swirler was 40 mm, while the swirler hub diameter was 20 mm. The swirler was placed at the burner outlet, concentric with the burner wall. The boundary conditions chosen in this study were consistent with prior work. The mass flow rate of the air was fixed at 0.2 g/s, the diluent fraction of the CO2 was varied from 0.05 to 0.25 at intervals of 0.05, and the fuel contained a fixed quantity of 5% methane. The fuel composition and volume content of the CO2 diluent are shown in Table 2. The equivalence ratio was fixed at 1, and the gas was initially at ambient temperature. A comparison of the simulated data with the experimental data is given in Figure 3. Blue indicates the experimental data; green indicates the simulated data. Comparing the data corresponding to different diluent fractions revealed good agreement between the simulated and experimental data, with acceptable errors of within 8%. Therefore, the model chosen in this study can be used to simulate H2/CO combustion.

3. Results and Discussion

This section investigates the effects of the diluents on the flame structure and NO emission characteristics of the syngas micromixing combustion flames. The effects of the diluents on the flame structures were analyzed in terms of the flame temperature, OH radical concentration, liftoff height, and the flame height. The effects of the diluents on the NO production and the relationship between the temperature and the NO production were researched.

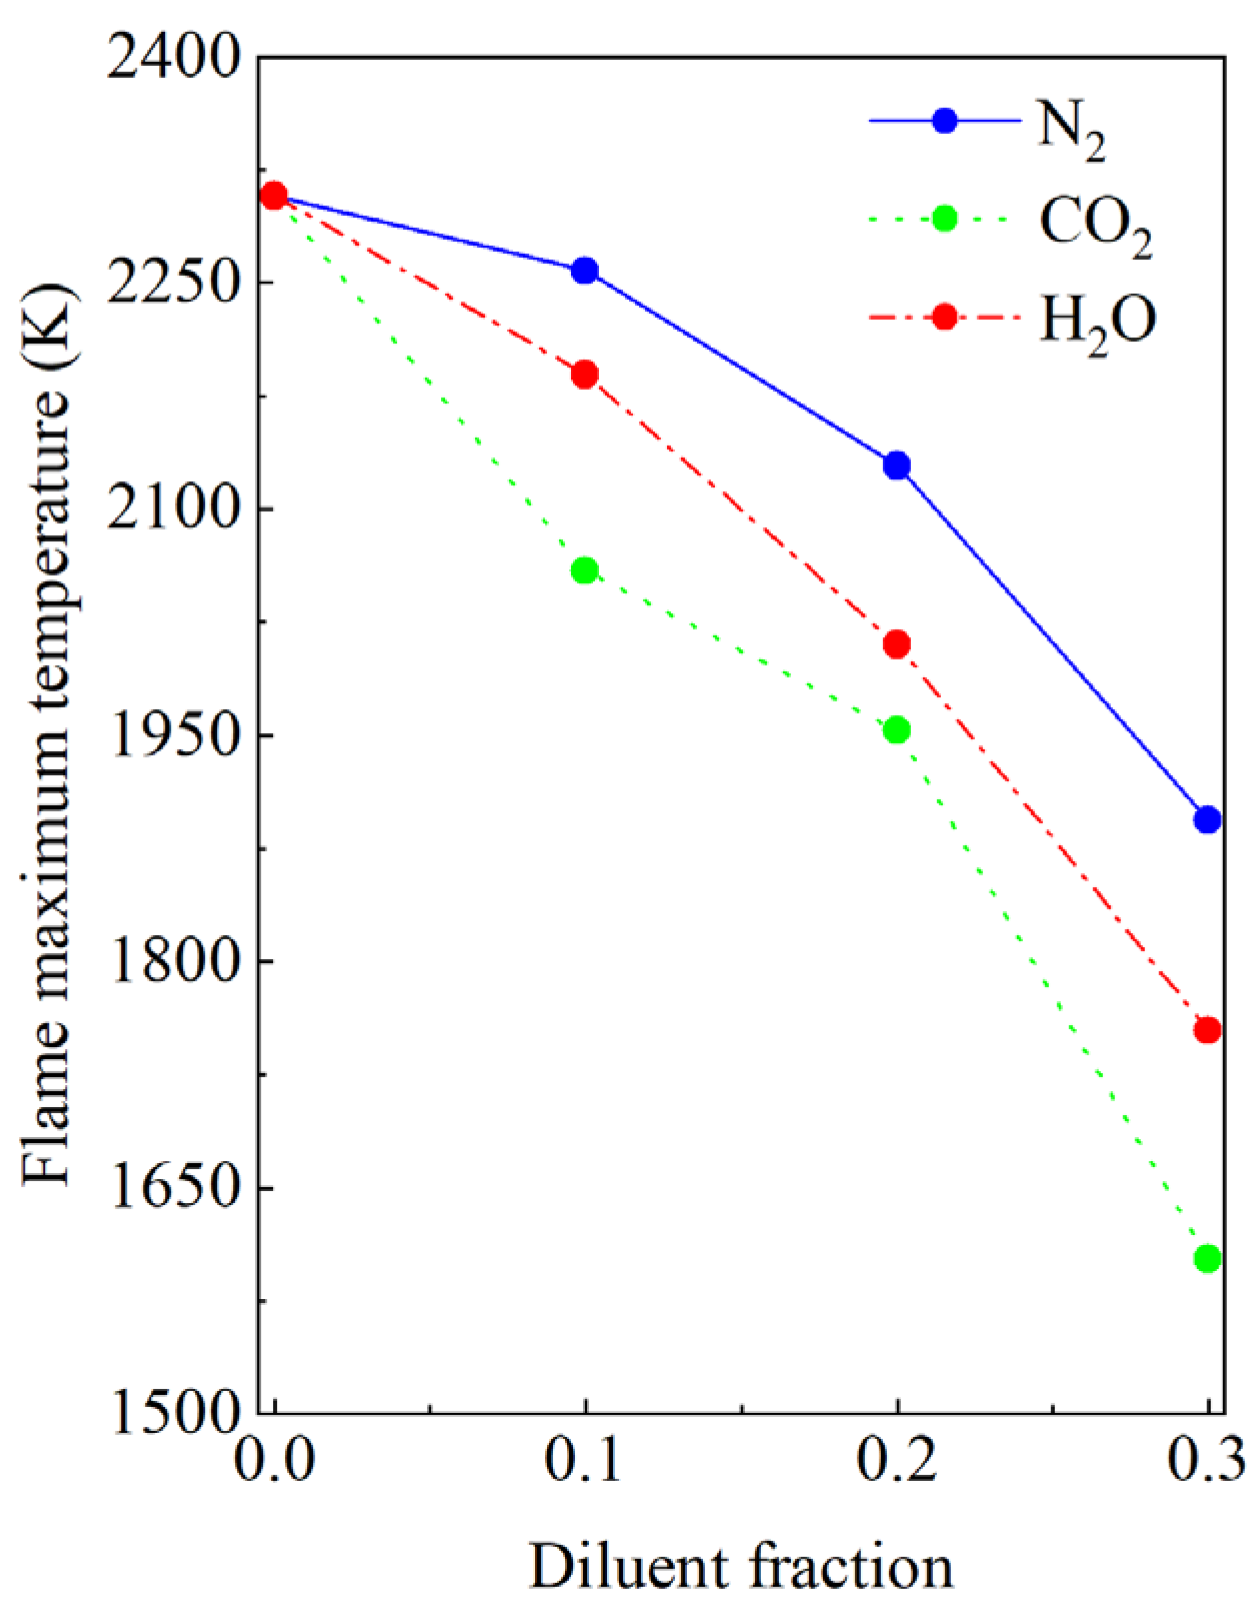
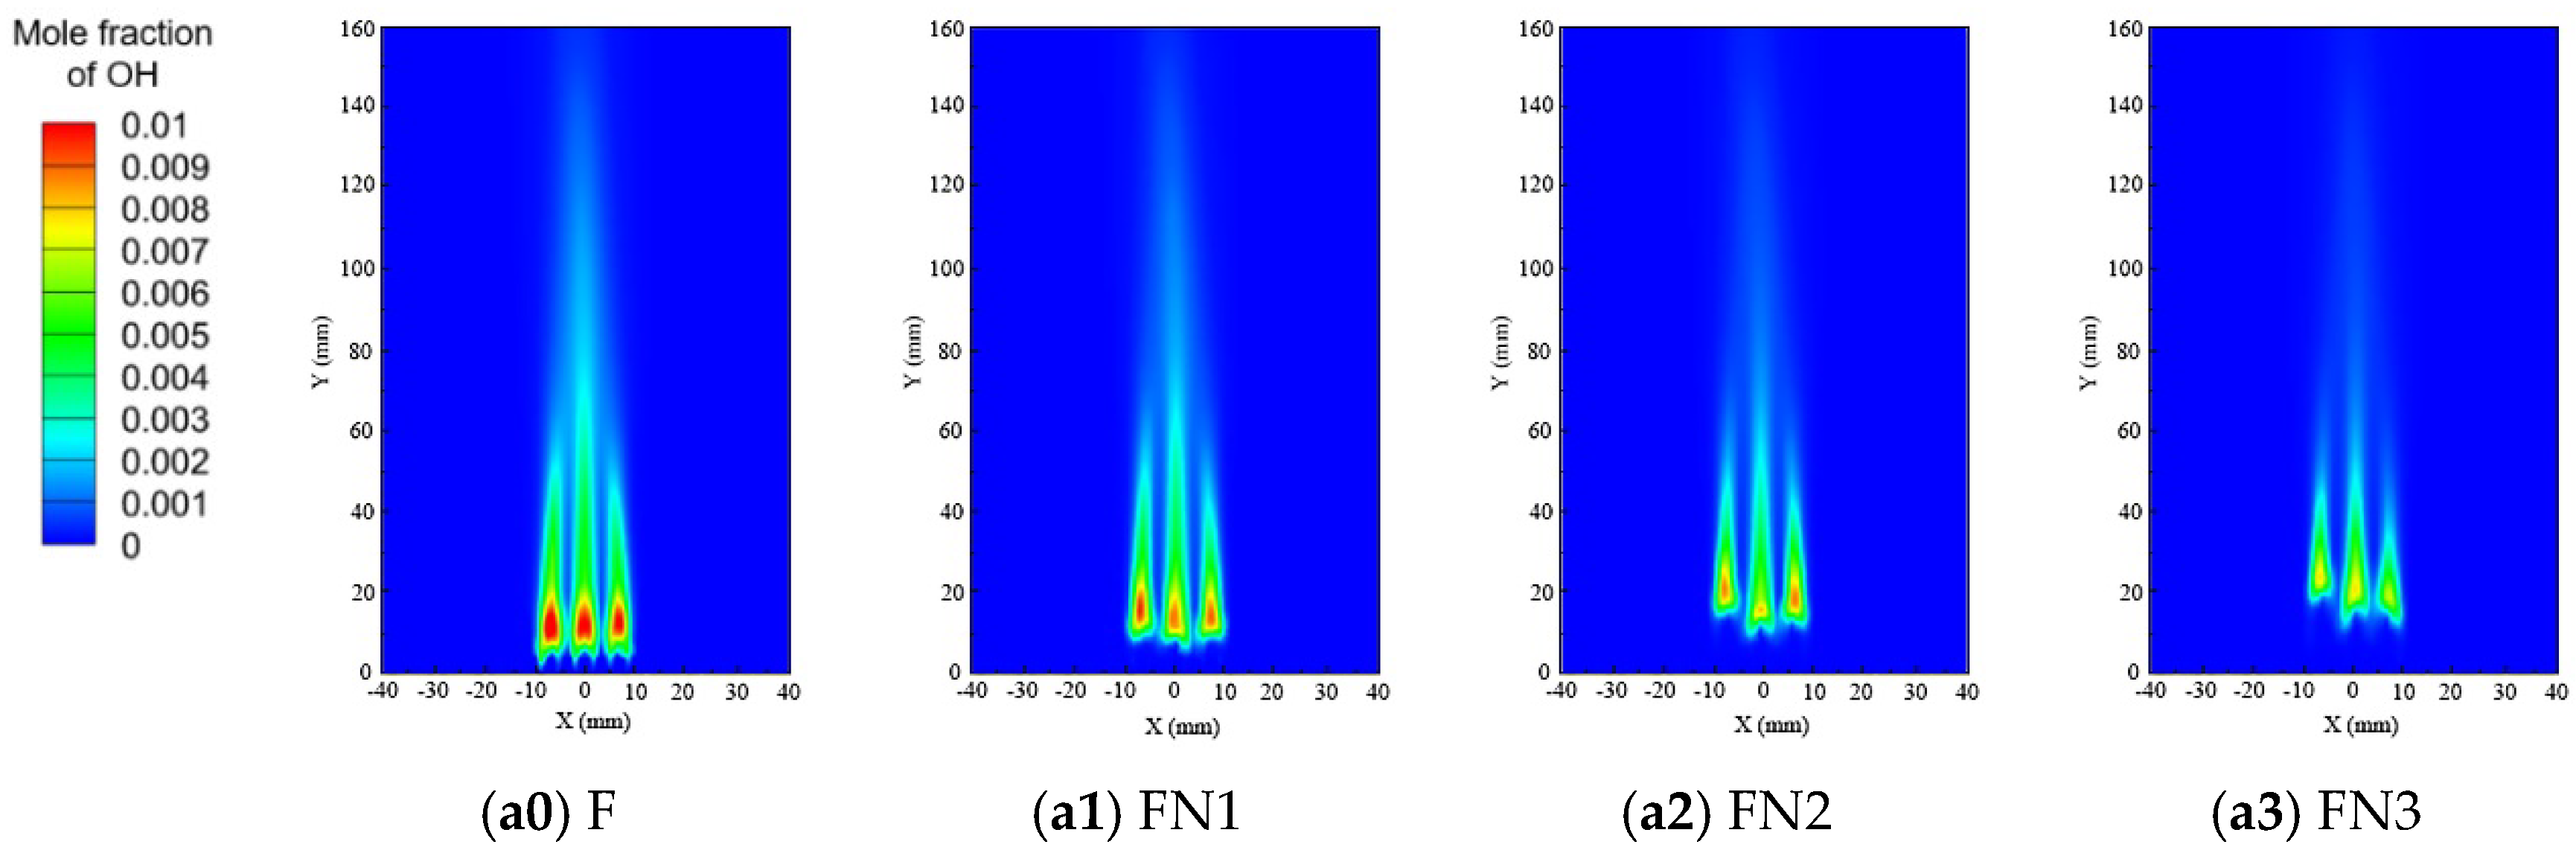
3.1. Effect of the Diluents on the Flame Structure

The flame temperature is an essential characteristic of a flame and a necessary physical quantity for studying the effect of diluents on the combustion. The maximum temperatures of the F, FN, FC, and FH flames at different diluent fractions are given in Figure 4. Blue indicates the data for the N2 diluent, green for the CO2 diluent, and red for the H2O diluent. The following figures are represented in the same way. The maximum temperature decreased with the increase in the diluent fraction. The larger the diluent fraction was, the faster the rate of temperature decrease. Compared to the F flame, the maximum temperatures of the FN3 flame, FC3 flame, and FH3 flame decreased by 415 K, 705 K, and 554 K, respectively. The dilution with the CO2 caused a very significant temperature reduction, while the N2 diluent caused little temperature drop. Adding a diluent increased the heat capacity of the gas mixture. At 2000 K, the constant molar pressure specific heat capacities of the N2, CO2, and H2O were 34 kJ/kmolK, 60 kJ/kmolK, and 52 kJ/kmolK, respectively [23]; among these diluents, the N2 had the lowest heat capacity, and the CO2 had the highest. Therefore, the flame temperature was highest with the N2 dilution. The diluents also affected the chemical reaction and reduced the heat release during combustion. Variations in the maximum flame heat release rate (HRR) with the diluent fractions are given in Figure 5. The data show that the HRR decreased with an increase in the diluent fraction. With the CO2 diluent, the low HRR indicated that a small amount of heat was released. This was because when the CO2 was added, the reaction rate of the CO2 + H = CO + OH was enhanced, consuming the H radicals and inhibiting all the reactions to varying degrees [10]. In contrast, the H2O diluent decomposed to produce more O, H, and OH radicals, thereby promoting the chemical reactions, releasing more heat. Eventually, the H2O-diluted flame temperature was higher than the CO2-diluted flame temperature.
OH radicals can be used to identify the regions with concentrated exothermic reactivity and to characterize the resulting flame structure. Figure 6 shows the OH radical concentration for the F, FN, FC, and FH flames at different diluent fractions, where a0, b0, and c0 are the OH radical concentrations for the F flames; a1, a2, and a3 are the OH radical concentrations for the FN1, FN2, and FN3 flames; b1, b2, and b3 are the OH radical concentrations for the FC1, FC2 and FC3 flames; and c1, c2, and c3 are the OH radical concentrations for the FH1, FH2 and FH3 flames, respectively.
The graphs show that as the diluent fraction rose, the OH radical concentration dropped, and the size of the OH radical distribution area declined. As the diluent fraction increased, the flame temperature dropped and slowed the dissociation reaction of the OH radicals [24]. The variation in the OH radical concentration suggested that the rates of the combustion chemical reaction and the flame propagation became slow with the increase in the diluent fraction. Comparing the OH radical concentrations in the FN, FC, and FH flames, the highest concentrations were found in the FN flames. The lowest concentrations were found in the FC flames. The FN flames’ OH radical level was relatively high due to the temperature being minimally influenced by the cooling effect of the dilution. A previous study [10] noted that adding the H2O diluent strengthened the reaction of the H2O + O = OH + OH to increase the level of the OH radicals. In addition, the temperature of the FH flame was higher than that of the FC flame, which made the OH radical dissociation rate higher in the former and further led to the OH radical level of the FH flame being higher than that of the FC flame.
The liftoff height, flame height, and flame angle were identified by the 5% volume fraction contour of the maximum OH radical concentration. Figure 7a shows the variation in the liftoff height and flame height for the F, FN, FC, and FH flames as the diluent fraction increased. The liftoff height HL refers to the most extended axial height between the unburned area at the root of the flame and the burner outlet [25]. The flame height H refers to the axial distance between the front of the flame and the burner outlet [26]. As seen from the graph, the liftoff height increased and the flame height decreased as the diluent fraction increased, which means that the area of the unburned region became extensive, and the flame length became small. For the liftoff height, the FN3 flame, FC3 flame, and FH3 flame added 11 mm, 35 mm, and 17 mm, respectively, to the F flame, which show that the CO2 diluent exhibited the most desired effect on the liftoff height. This occurred because as the diluent fraction rose, the velocity of the gas flow at the burner outlet increased, and the momentum of the gas mixture became high, which allowed the gas to move downstream more strongly. Furthermore, the addition of the diluent made the heat capacity of the gas mixture larger and the heating rate slower. The ignition position moved down, and the ignition delay time became longer. Figure 7a shows that the effect of the CO2 diluent on the flame height was the most obvious, followed by the H2O and N2 diluents. On the one hand, the diluent increased the flame velocity and momentum, which caused the flame height to increase. On the other hand, the diluent increased the heat capacity of the gas mixture, which caused the flame temperature and height to decrease. At higher diluent fractions, the decrease in the flame height showed that the diluent cooling effect dominated the net influence on height. Figure 7b shows the changes in flame angle with increasing diluent fractions.
The flame angle α refers to the angle between the tangential direction of the outer flame front and the central flame axis [27]. As seen from the data, unlike the liftoff height and flame height, the change in flame angle was nonmonotonic, enlarging and then downsizing with increasing diluent fractions. Regardless of the diluent fraction, adding diluent expanded the gas volume flow compared to the F flame, forcing the flame to spread out in the radial direction. Prior work [27] revealed that the swirl number fluctuations mainly caused a change in the flame angle. Across the diluent fraction range of this study, the flame angle varied over a small range within 15°. A combined analysis of HL, H, and α showed that the diluent caused the flame’s dimensional reduction and radial spread. This tendency to change the flame shape intensified as the diluent fraction increased. Compared with the N2 and H2O diluents, the CO2 diluent had a more pronounced effect on the flame.

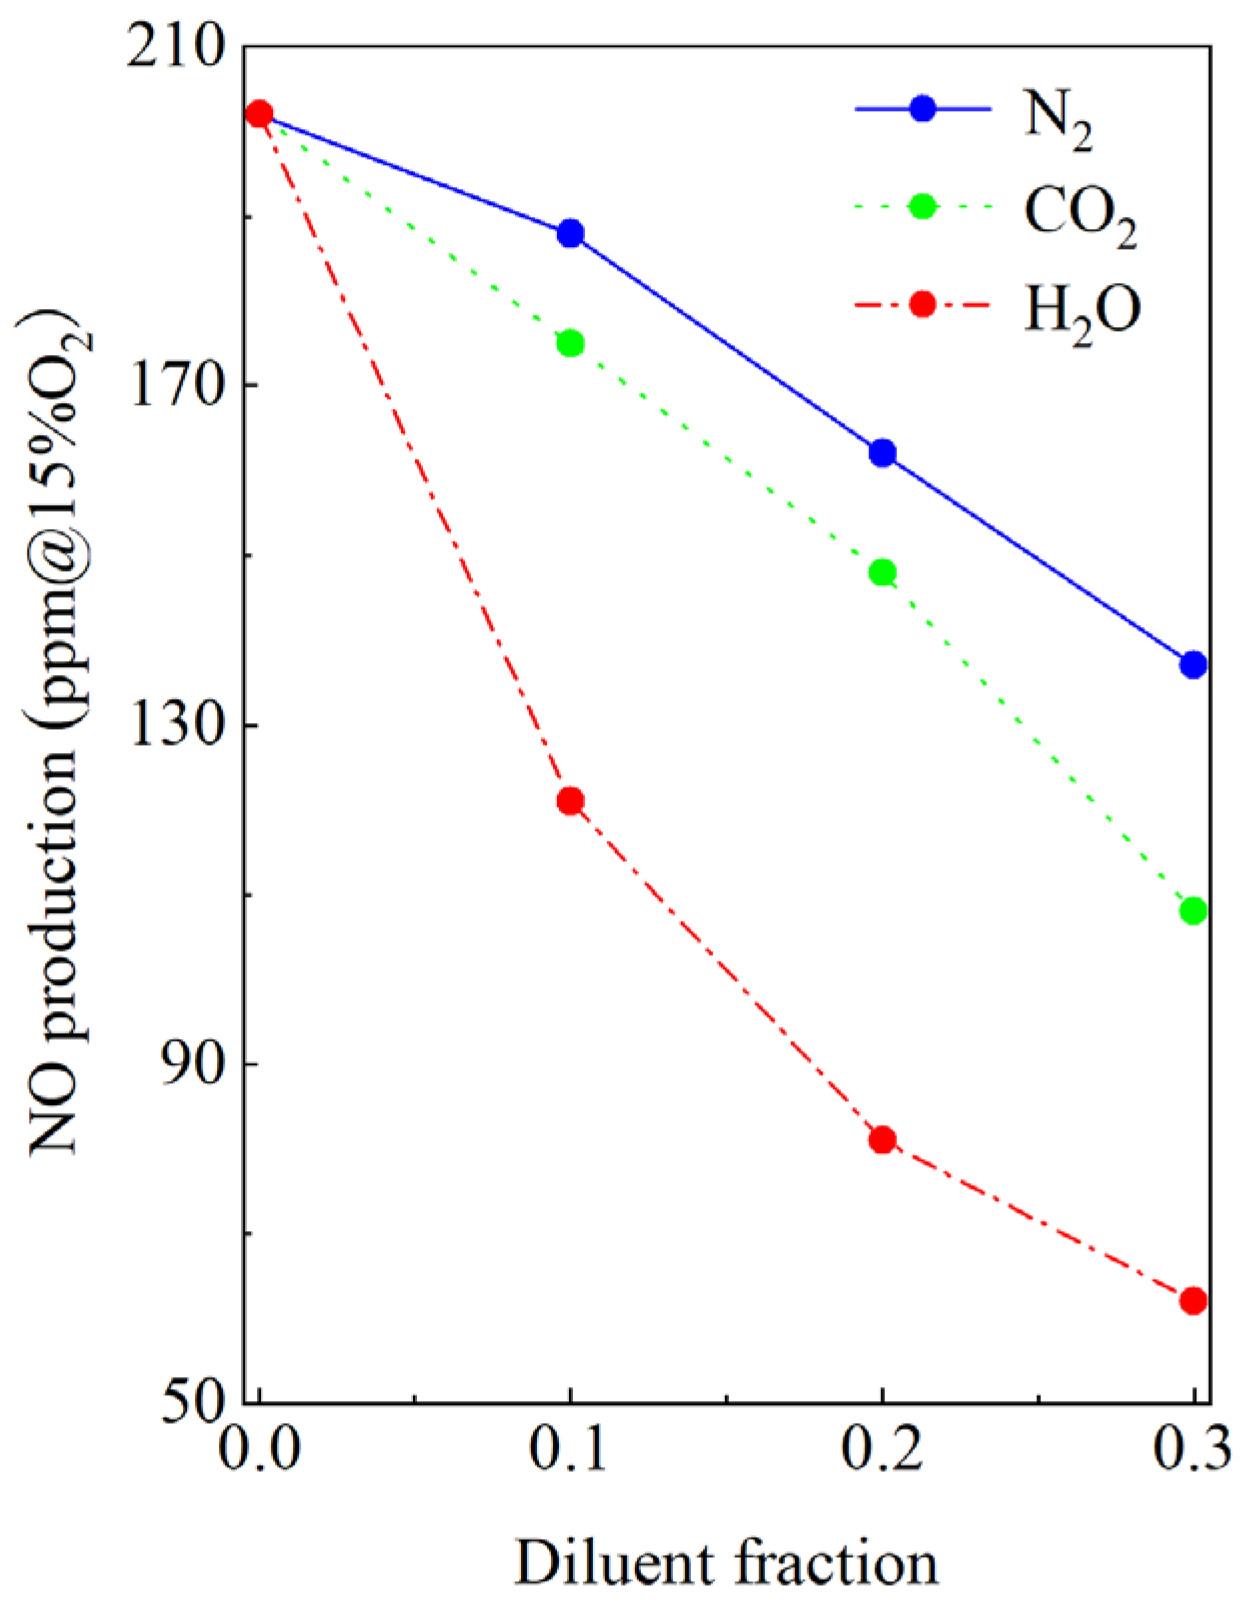
3.2. Effect of the Diluents on the NO Formation Characteristics

Figure 8 represents the NO generation of the F, FN, FC, and FH flames. The data showed that the NO generation reduced with the increase in the diluent fraction. At a diluent fraction of 0.3, the NO generation for the H2O diluent was 62 ppm, which was 69% lower than that observed without a diluent. In addition, it was 47% and 32% lower than that observed with the CO2 and N2 diluents, respectively. The NO production routes mainly include the Zeldovich thermal route, the NNH intermediate route, and the N2O intermediate route. Because Figure 4 showed that the flame temperature for the N2 diluent was higher than that of the CO2 and H2O diluent, the N2-diluted flame generated more NO by the thermal route. Considering the CO2 and H2O diluents, the temperature level and NO production showed contradictory relationships, whereby the CO2 diluent showed a lower temperature but a higher NO generation than the H2O diluent. This was attributed to the fact that when CO2 was added, more O radicals were generated than H2O, further promoting the reactions of N + NO = N2 + O, NH + O = H + NO, and NNH + O = NO + NH to generate NO. N + NO = N2 + O generated NO while generating N radicals. Further, the N radicals promoted the reactions of N + O2 = NO + O, N + OH = NO + H, and N + CO2 = NO + CO to produce more NO [10]. From this route analysis, it is clear that the NO production from the FC flames was significantly influenced by the concentration of the reactants, which inevitably caused a change in the correlation between the temperature and NO production. The joint probability density functions (JPDFs) of the temperature and NO production for the F, FN, FC, and FH flames are represented in Figure 9. The closer the color is to yellow, the higher the probability; the closer the color is to blue, the lower the probability. a0, b0, and c0 show the JPDFs of the F flame; a1, a2, and a3 show the JPDFs of the FN1, FN2, and FN3 flames, respectively; b1, b2, and b3 show the JPDFs of the FC1, FC2, and FC3 flames, respectively; and c1, c2, and c3 show the JPDFs of the FH1, FH2, and FH3 flames, respectively. As the diluent fractions of the FN flames changed from 0.1 to 0.3, the NO concentration ranges corresponding to high probabilities were 3.1 ppm, 2.2 ppm, and 1 ppm, respectively. Further, the related temperature ranges were 331 K, 259 K, and 132 K, respectively. The ratio of the NO concentration range to the temperature range diminished. This indicated that as the diluent fraction increased, the response of the NO to temperature changes slowed, the effect of the temperature on the NO production was weakened, and the correlation between the NO production and the temperature diminished. An analysis of the FC and FH flames gave the same trend as described above. At the diluent fraction of 0.3, the NO concentration ranges and the temperature range corresponding to the high probabilities for the FC3 flame were 0.89 ppm and 179 K, respectively. For the FH3 flame, they were 0.92 ppm and 149 K. The ratio of the NO concentration range to the temperature range was larger for the FN3 flame than the FH3 and FC3 flames. This trend revealed that at larger diluent fractions, the CO2 and H2O diluents made the NO production less sensitive to temperature changes, and the effect of the temperature on the NO production diminished. In comparison, the effect of the temperature on the NO production was less obvious with the CO2 diluent.

4. Conclusions

In this study, a numerical simulation method was used to model the effect of diluents on the micromixing combustion of H2/CO mixed fuel and to investigate the resulting flame structure and NO generation characteristics. The following conclusions were obtained:
The diluents distinctly reduced the combustion temperature and moderate reactions with a rising diluent fraction. The decrease in the OH radical concentrations indicated that the diluents also reduced the rate of the reactions and limited the flame propagation. Compared with the N2-diluted and H2O-diluted flames, the CO2-diluted flame was influenced most distinctly.
By changing the ignition position, extending the ignition delay time, and reducing the ignition temperature, the diluents increased the liftoff height and decreased the flame height, resulting in shorter flames. Furthermore, the addition of a diluent enlarged the flame angle, causing the flame to spread radially. Compared to the N2 and H2O diluents, the CO2 diluent had a more visible effect on the flame size compared to the N2 and H2O diluents. In the actual syngas micromixing combustion process, when adding diluent, the flame area should be ensured to have a sufficient length and large space in the radial direction. When there is a possibility of power reduction, the inlet velocity can be suitably reduced to provide sufficient combustion time.
The addition of a diluent significantly reduced the amount of NO production. Compared with the CO2 and H2O diluents, the N2-diluted flame produced more NO by the thermal route for a higher temperature. When CO2 was added, it promoted the generation of more O radicals, which facilitated a series of reactions that generated NO. In contrast, the H2O diluent inhibited NO production more effectively. An analysis of the JPDFs of the NO production and temperature revealed that the addition of diluents made the NO production less sensitive to changes in temperature. Among the three diluents, the NO production of the CO2-diluted flame had a lower sensitivity to the temperature. In the practical application of syngas micromixing combustion, the H2O diluent can reduce the NO generation without making the temperature too low. It is the best choice.

Author Contributions

Methodology: W.W. and D.C.; writing: W.W.; review and editing: W.Z., D.C. and R.S.; supervision: R.S. All authors have read and agreed to the published version of the manuscript.

Funding

This work was funded by the National Science and Technology Major Project of China, grant number 2019-Ⅲ-0018.

Data Availability Statement

The data that support the findings of this study are available from the corresponding author upon reasonable request.

Conflicts of Interest

The authors declare no conflict of interest.

References

  1. Mu, Y.F.; Li, Z.Y.; Luo, K.; Fan, J.R.; Xing, J.K.; Zhang, B.; Shi, S.P. Analyzing the combustion oscillation of a gas turbine for syngas based on the characteristic time-scale theory. Therm. Sci. Eng. Prog. 2022, 30, 101224. [Google Scholar] [CrossRef]
  2. Yuan, Y. Experimental and Numerical Study on Dilution Diffusion Combustion of H2/CO Syngas. Ph.D. Thesis, Nanjing Normal University, Nanjing, China, 2018. [Google Scholar]
  3. Xi, J.F.; Gu, Z.C.; Yuan, Y.; Zhang, X.P. Effect of Diluents on Pollutant Emission from Syngas Combustion. J. Chin. Soc. Power Eng. 2018, 38, 394–399. [Google Scholar]
  4. Wang, F.; Liu, R.; Dou, L.; Liu, D.; Jin, J. A dual timescale model for micro-mixing and its application in LES-TPDF simulations of turbulent nonpremixed flames. Chin. J. Aeronaut. 2019, 32, 875–887. [Google Scholar] [CrossRef]
  5. Zhang, G.-P.; Li, G.-X.; Li, H.-M.; Lv, J.-C. Effect of diluent gas on propagation and explosion characteristics of hydrogen-rich syngas laminar premixed flame. Energy 2022, 246, 123370. [Google Scholar] [CrossRef]
  6. Yang, L.; Weng, W.; Zhu, Y.; He, Y.; Wang, Z.; Li, Z. Investigation of Hydrogen Content and Dilution Effect on Syngas/Air Premixed Turbulent Flame Using OH Planar Laser-Induced Fluorescence. Processes 2021, 9, 1894. [Google Scholar] [CrossRef]
  7. Yang, L.; Wang, Z.H.; Zhu, Y.Q.; Li, Z.S.; Zhou, J.H.; Huang, Z.Y.; Cen, K.F. Premixed jet flame characteristics of syngas using OH planar laser induced fluorescence. Chin. Sci. Bull. 2011, 56, 2862–2868. [Google Scholar] [CrossRef] [Green Version]
  8. Jithin, E.V.; Raghuram, G.K.S.; Keshavamurthy, T.V.; Velamati, R.K.; Prathap, C.; Varghese, R.J. A review on fundamental combustion characteristics of syngas mixtures and feasibility in combustion devices. Renew. Sustain. Energy Rev. 2021, 146, 111178. [Google Scholar] [CrossRef]
  9. Zhuo, L.; Jiang, Y.; Qiu, R.; An, J.; Xu, W. Effects of Fuel-Side N2, CO2, H2O Dilution on Combustion Characteristics and NOx Formation of Syngas Turbulent Nonpremixed Jet Flames. J. Eng. Gas Turbines Power 2014, 136, 061505. [Google Scholar] [CrossRef]
  10. Ding, N.; Arora, R.; Norconk, M.; Lee, S.-Y. Numerical investigation of diluent influence on flame extinction limits and emission characteristic of lean-premixed H2–CO (syngas) flames. Int. J. Hydrogen Energy 2011, 36, 3222–3231. [Google Scholar] [CrossRef]
  11. Whitty, K.J.; Zhang, H.R.; Eddings, E.G. Emissions from syngas combustion. Combust. Sci. Technol. 2008, 180, 1117–1136. [Google Scholar] [CrossRef]
  12. He, D.; Yan, W. Influences of different diluents on NO emission characteristics of syngas opposed-flow flame. Int. J. Hydrogen Energy 2018, 43, 2570–2584. [Google Scholar] [CrossRef]
  13. Yang, K.-H.; Shih, H.-Y. NO formation of opposed-jet syngas diffusion flames: Strain rate and dilution effects. Int. J. Hydrogen Energy 2017, 42, 24517–24531. [Google Scholar] [CrossRef]
  14. Shi, G.D.; Li, P.F.; Hu, F.; Liu, Z.H. NO mechanisms of syngas MILD combustion diluted with N2, CO2, and H2O. Int. J. Hydrogen Energy 2022, 47, 16649–16664. [Google Scholar] [CrossRef]
  15. Wang, S.X.; Wang, Z.H.; Han, X.L.; Chen, C.L.; He, Y.; Zhu, Y.Q.; Cen, K.F. Experimental and numerical study of the effect of elevated pressure on laminar burning velocity of lean H2/CO/O2/diluents flames. Fuel 2020, 273, 117753. [Google Scholar] [CrossRef]
  16. da Silva, C.V.; Deon, D.L.; Centeno, F.R.; França, F.H.R.; Pereira, F.M. Assessment of combustion models for numerical simulations of a turbulent non-premixed natural gas flame inside a cylindrical chamber. Combust. Sci. Technol. 2018, 190, 1528–1556. [Google Scholar] [CrossRef]
  17. Zhang, Z.H.; Liu, X.; Zhao, T.Z.; Liu, G.; Lu, G.P.; Zheng, H.T. Study on combustion characteristics of swirl premixed combustion chamber. J. Therm. Sci. Technol. 2021, 20, 171–177. [Google Scholar]
  18. Natarajan, J.; Kochar, Y.; Lieuwen, T.; Seitzman, J. Pressure and preheat dependence of laminar flame speeds of H2/CO/CO2/O2/He mixtures. Proc. Combust. Inst. 2009, 32, 1261–1268. [Google Scholar] [CrossRef]
  19. Sahu, A.B.; Ravikrishna, R.V. A detailed numerical study of NOx kinetics in low calorific value H2/CO syngas flames. Int. J. Hydrogen Energy 2014, 39, 17358–17370. [Google Scholar] [CrossRef]
  20. Roache, P. Error Bars for CFD. In Proceedings of the 41st Aerospace Sciences Meeting and Exhibit, Reno, NV, USA, 6–9 January 2003. [Google Scholar] [CrossRef]
  21. Manna, P.; Dharavath, M.; Sinha, P.K.; Chakraborty, D. Optimization of a flight-worthy scramjet combustor through CFD. Aerosp. Sci. Technol. 2013, 27, 138–146. [Google Scholar] [CrossRef]
  22. Samiran, N.A.; Ng, J.-H.; Jaafar, M.N.M.; Valera-Medina, A.; Chong, C.T. H2-rich syngas strategy to reduce NOx and CO emissions and improve stability limits under premixed swirl combustion mode. Int. J. Hydrogen Energy 2016, 41, 19243–19255. [Google Scholar] [CrossRef] [Green Version]
  23. Lee, M.C. Effects of H2/CO/CH4 syngas composition variation on the NOx and CO emission characteristics in a partially-premixed gas turbine combustor. Sci. China Technol. Sci. 2016, 59, 1804–1813. [Google Scholar] [CrossRef]
  24. Yu, M.; Zhai, F.; Li, H.; Han, S.; Li, S.; Zheng, K.; Yu, Y. Comparative study on the effect of initial temperatures and pressures on the laminar flame speed of the heavily carbonaceous syngas containing water vapor via reaction kinetics simulation. Int. J. Hydrogen Energy 2022, 47, 32763–32775. [Google Scholar] [CrossRef]
  25. Nada, Y.; Kidoguchi, Y.; Sakai, H.; Moriyama, Y. Modeling of liftoff heights of nonpremixed turbulent flames in coflows having various temperatures and O2 concentrations. Fuel 2021, 306, 121678. [Google Scholar] [CrossRef]
  26. Muraleedharan, A.; Jithin, E.V.; Aravind, B.; Kumar, S.; Velamati, R.K. Combustion characteristics of syngas laminar microjet diffusion flames. J. Taiwan Inst. Chem. Eng. 2020, 115, 47–59. [Google Scholar] [CrossRef]
  27. Xu, P.Y. Study on NOx Generation and Control Strategy of Hydrogen Internal Combustion Engine. Ph.D. Thesis, Beijing University of Technology, Beijing, China, 2020. [Google Scholar]
Figure 1. Schematic of the burner structure. ((a) shows the overall structure of the burner and the combustion chamber, (b) shows the center-section view of the burner, and (c) shows the details of holes).
Energies 16 01252 g001
Figure 2. The fluid domain grid. ((a) shows the mesh contour of the fluid domain, b shows the mesh on the central section of the fluid domain, c shows a detailed view of the mesh in the dashed box of the combustion chamber region, (d) shows a detailed view of the mesh in the dashed box of the air–fuel mixing region).
Energies 16 01252 g002
Figure 3. Comparison of the experimental and simulated NO emission.
Energies 16 01252 g003
Figure 4. Variation in the maximum temperature with the diluent fractions.
Energies 16 01252 g004
Figure 5. Variation in the HRR with the diluent fractions.
Energies 16 01252 g005
Figure 6. Concentration of the OH radicals in different diluted flames.
Energies 16 01252 g006aEnergies 16 01252 g006b
Figure 7. Variations in the liftoff height, flame height, and the flame angle with the diluent fraction. ((a) shows the variation in the liftoff height and flame height, (b) shows the changes in flame angle. The vertical coordinate of the line segment in black dotted circle is the one indicated by the arrow).
Energies 16 01252 g007
Figure 8. Variation in the NO production with the diluent fraction.
Energies 16 01252 g008
Figure 9. JPDFs of the temperature and NO concentration.
Energies 16 01252 g009aEnergies 16 01252 g009b
Table 1. Inlet boundary conditions.
DiluentDiluent FractionAir Inlet Velocity (m/s)Fuel Inlet Velocity (m/s)
N2, CO2, H2O05.5771.973
N2, CO20.15.5772.192
N2, CO20.25.5772.466
N2, CO20.35.5772.818
H2O0.15.7601.973
H2O0.25.9871.973
H2O0.36.2801.973
Table 2. The fuel and CO2 volumetric content.
NumberCO2
vol. %
H2
vol. %
CO
vol. %
1549.540.5
21046.838.3
31544.036.0
42041.333.8
52538.531.5
Disclaimer/Publisher’s Note: The statements, opinions and data contained in all publications are solely those of the individual author(s) and contributor(s) and not of MDPI and/or the editor(s). MDPI and/or the editor(s) disclaim responsibility for any injury to people or property resulting from any ideas, methods, instructions or products referred to in the content.

