
Effects on Frequency Stability of Power System for Photovoltaic High-Penetration Ratio Grid-Connected Power Generation

Abstract
:1. Introduction
2. DIgSILENT-Based Grid Model
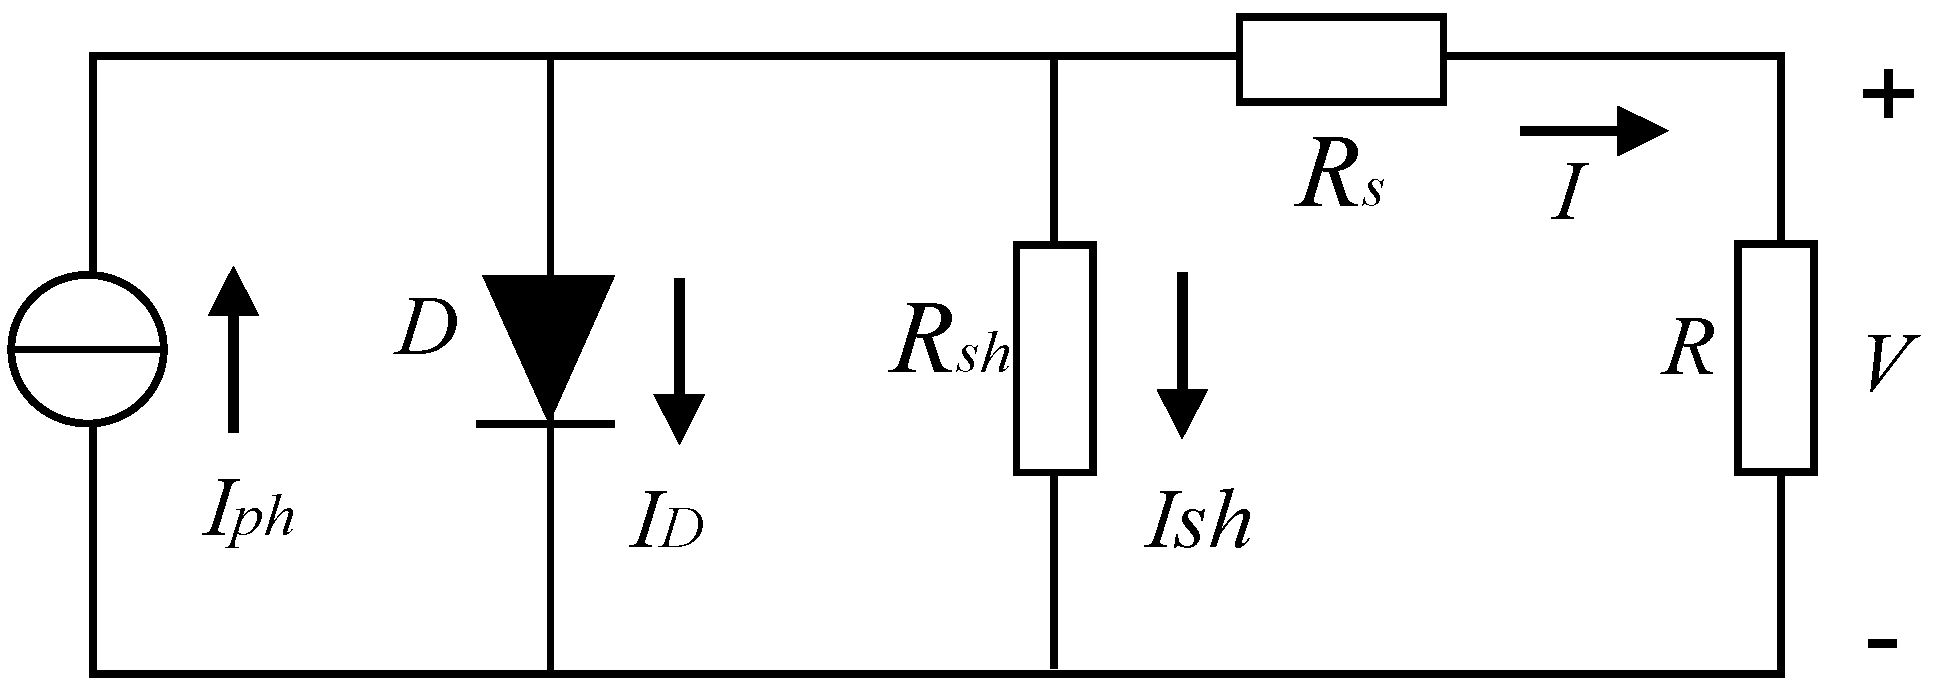
2.1. Photovoltaic Grid Connection Methods
2.2. Control Framework for Photovoltaic Power Generation
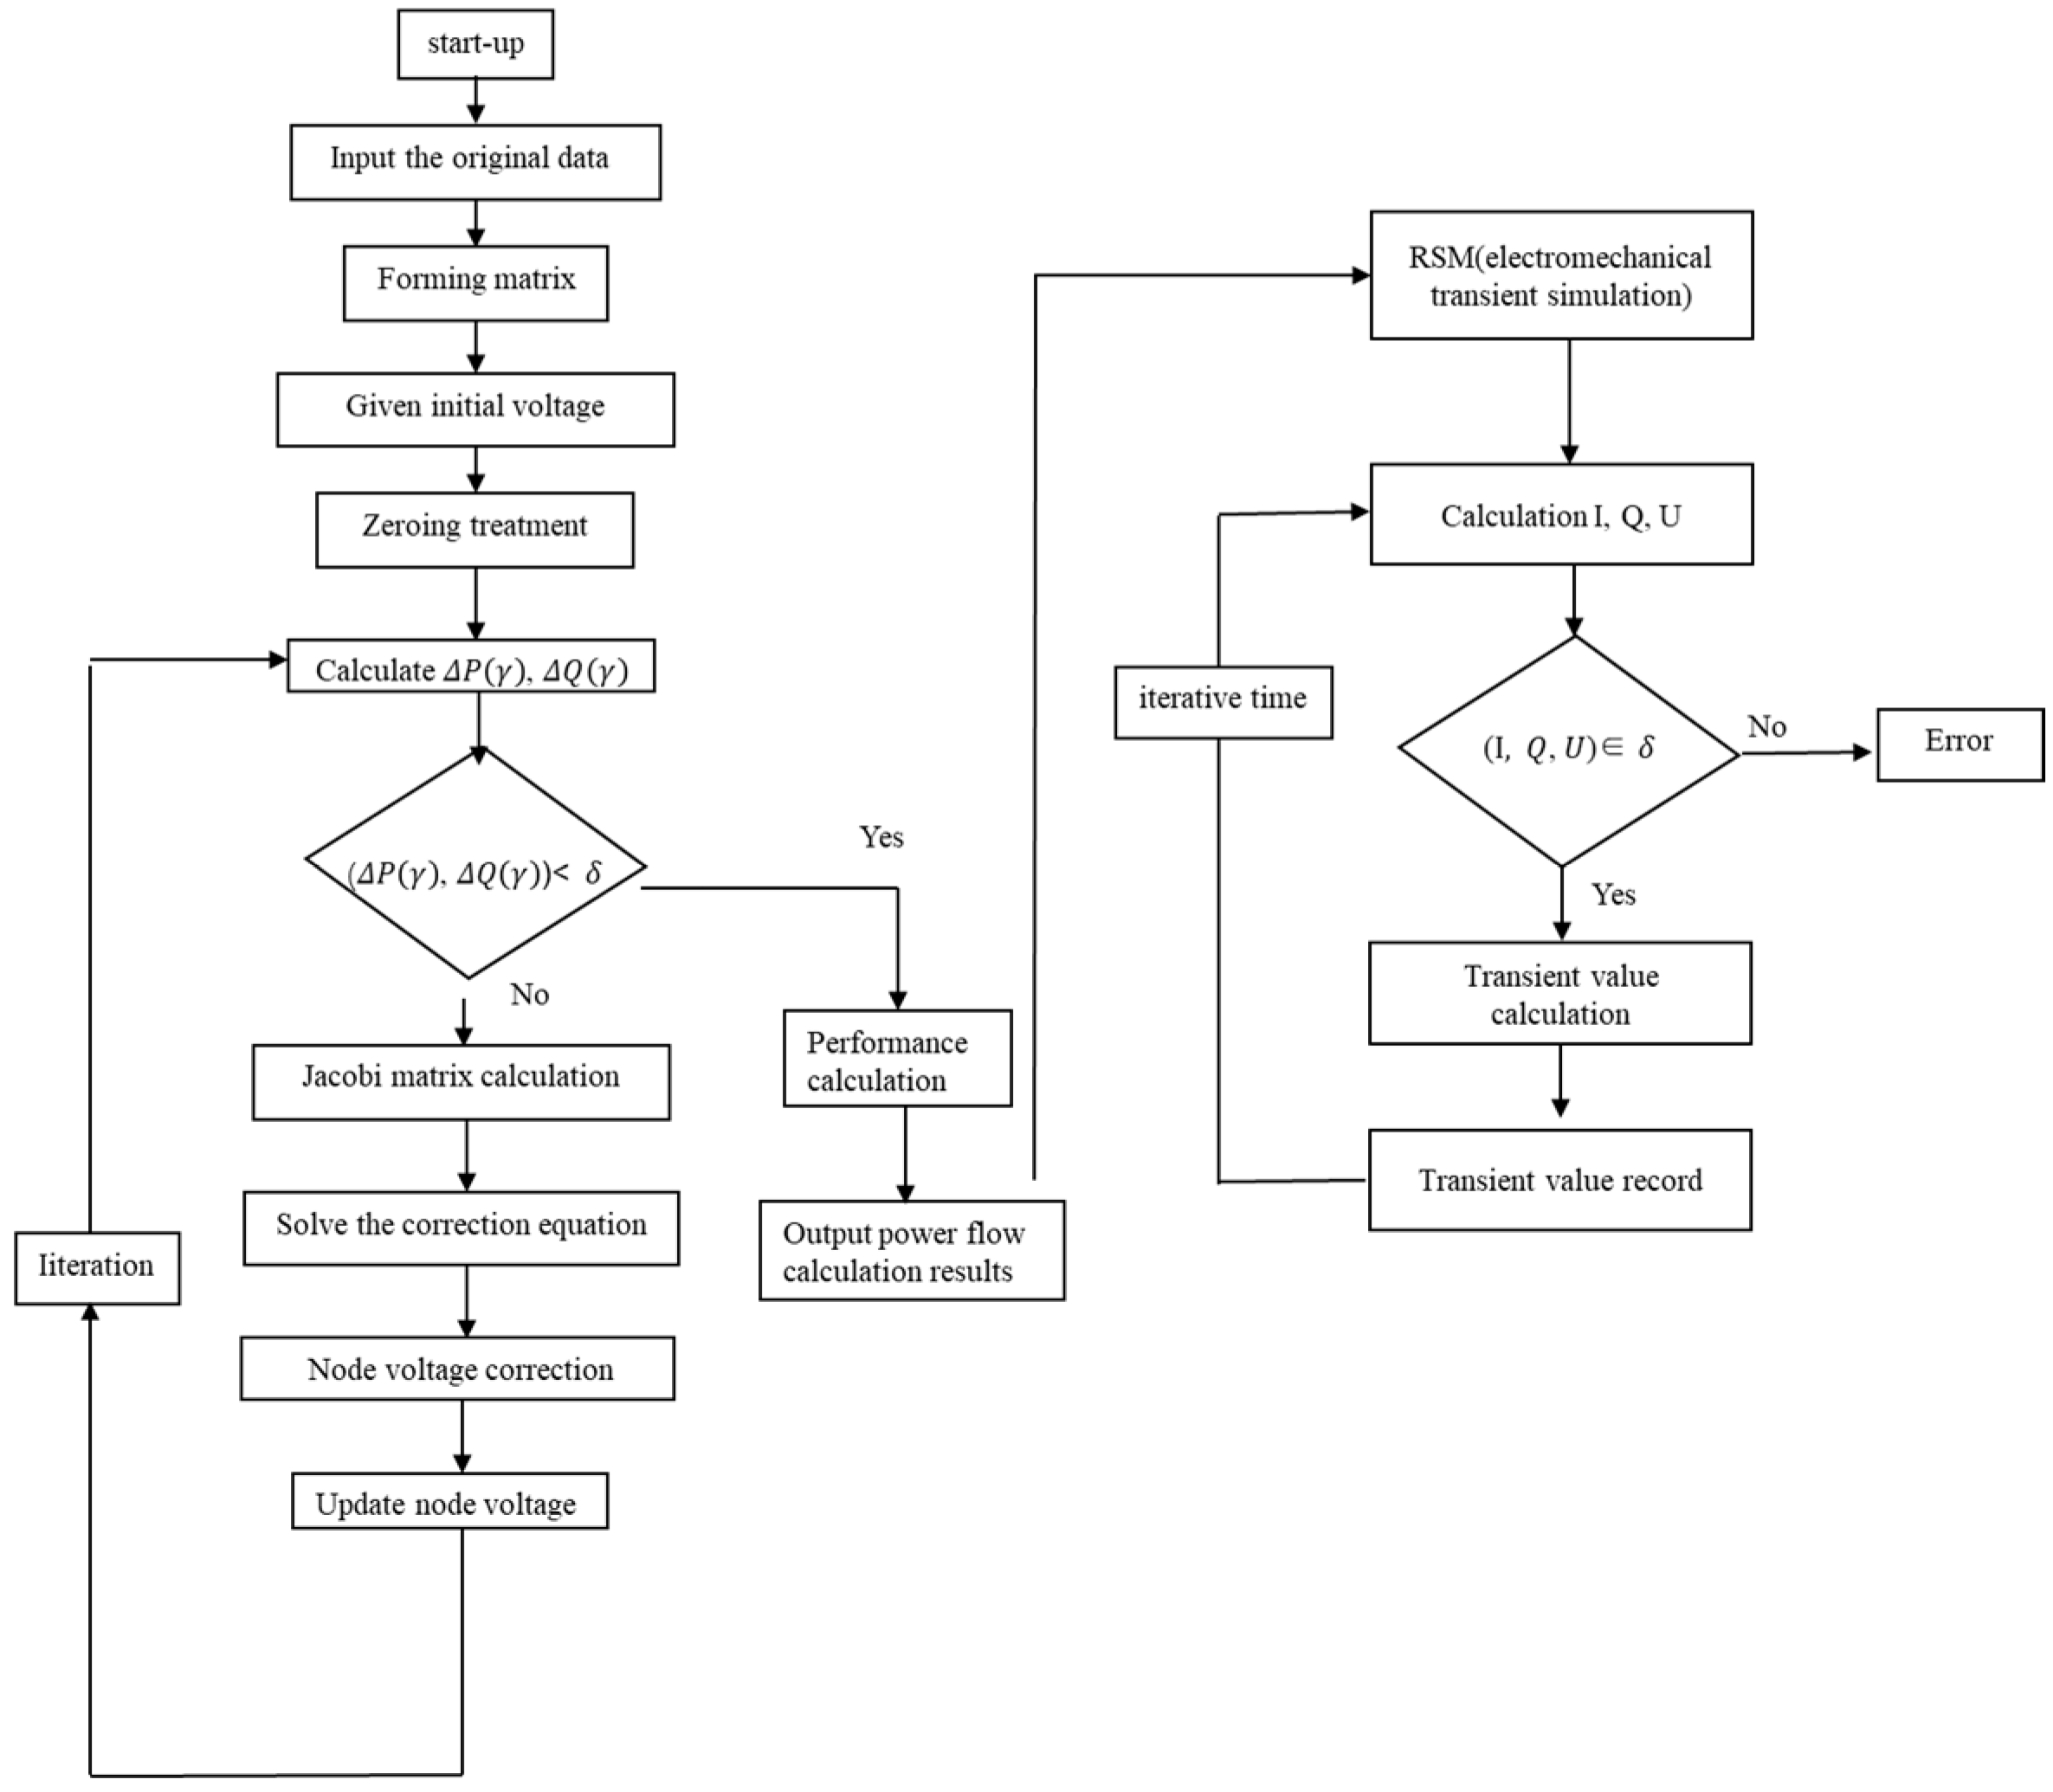
3. Frequency Response Analysis Method Based on DC Currents
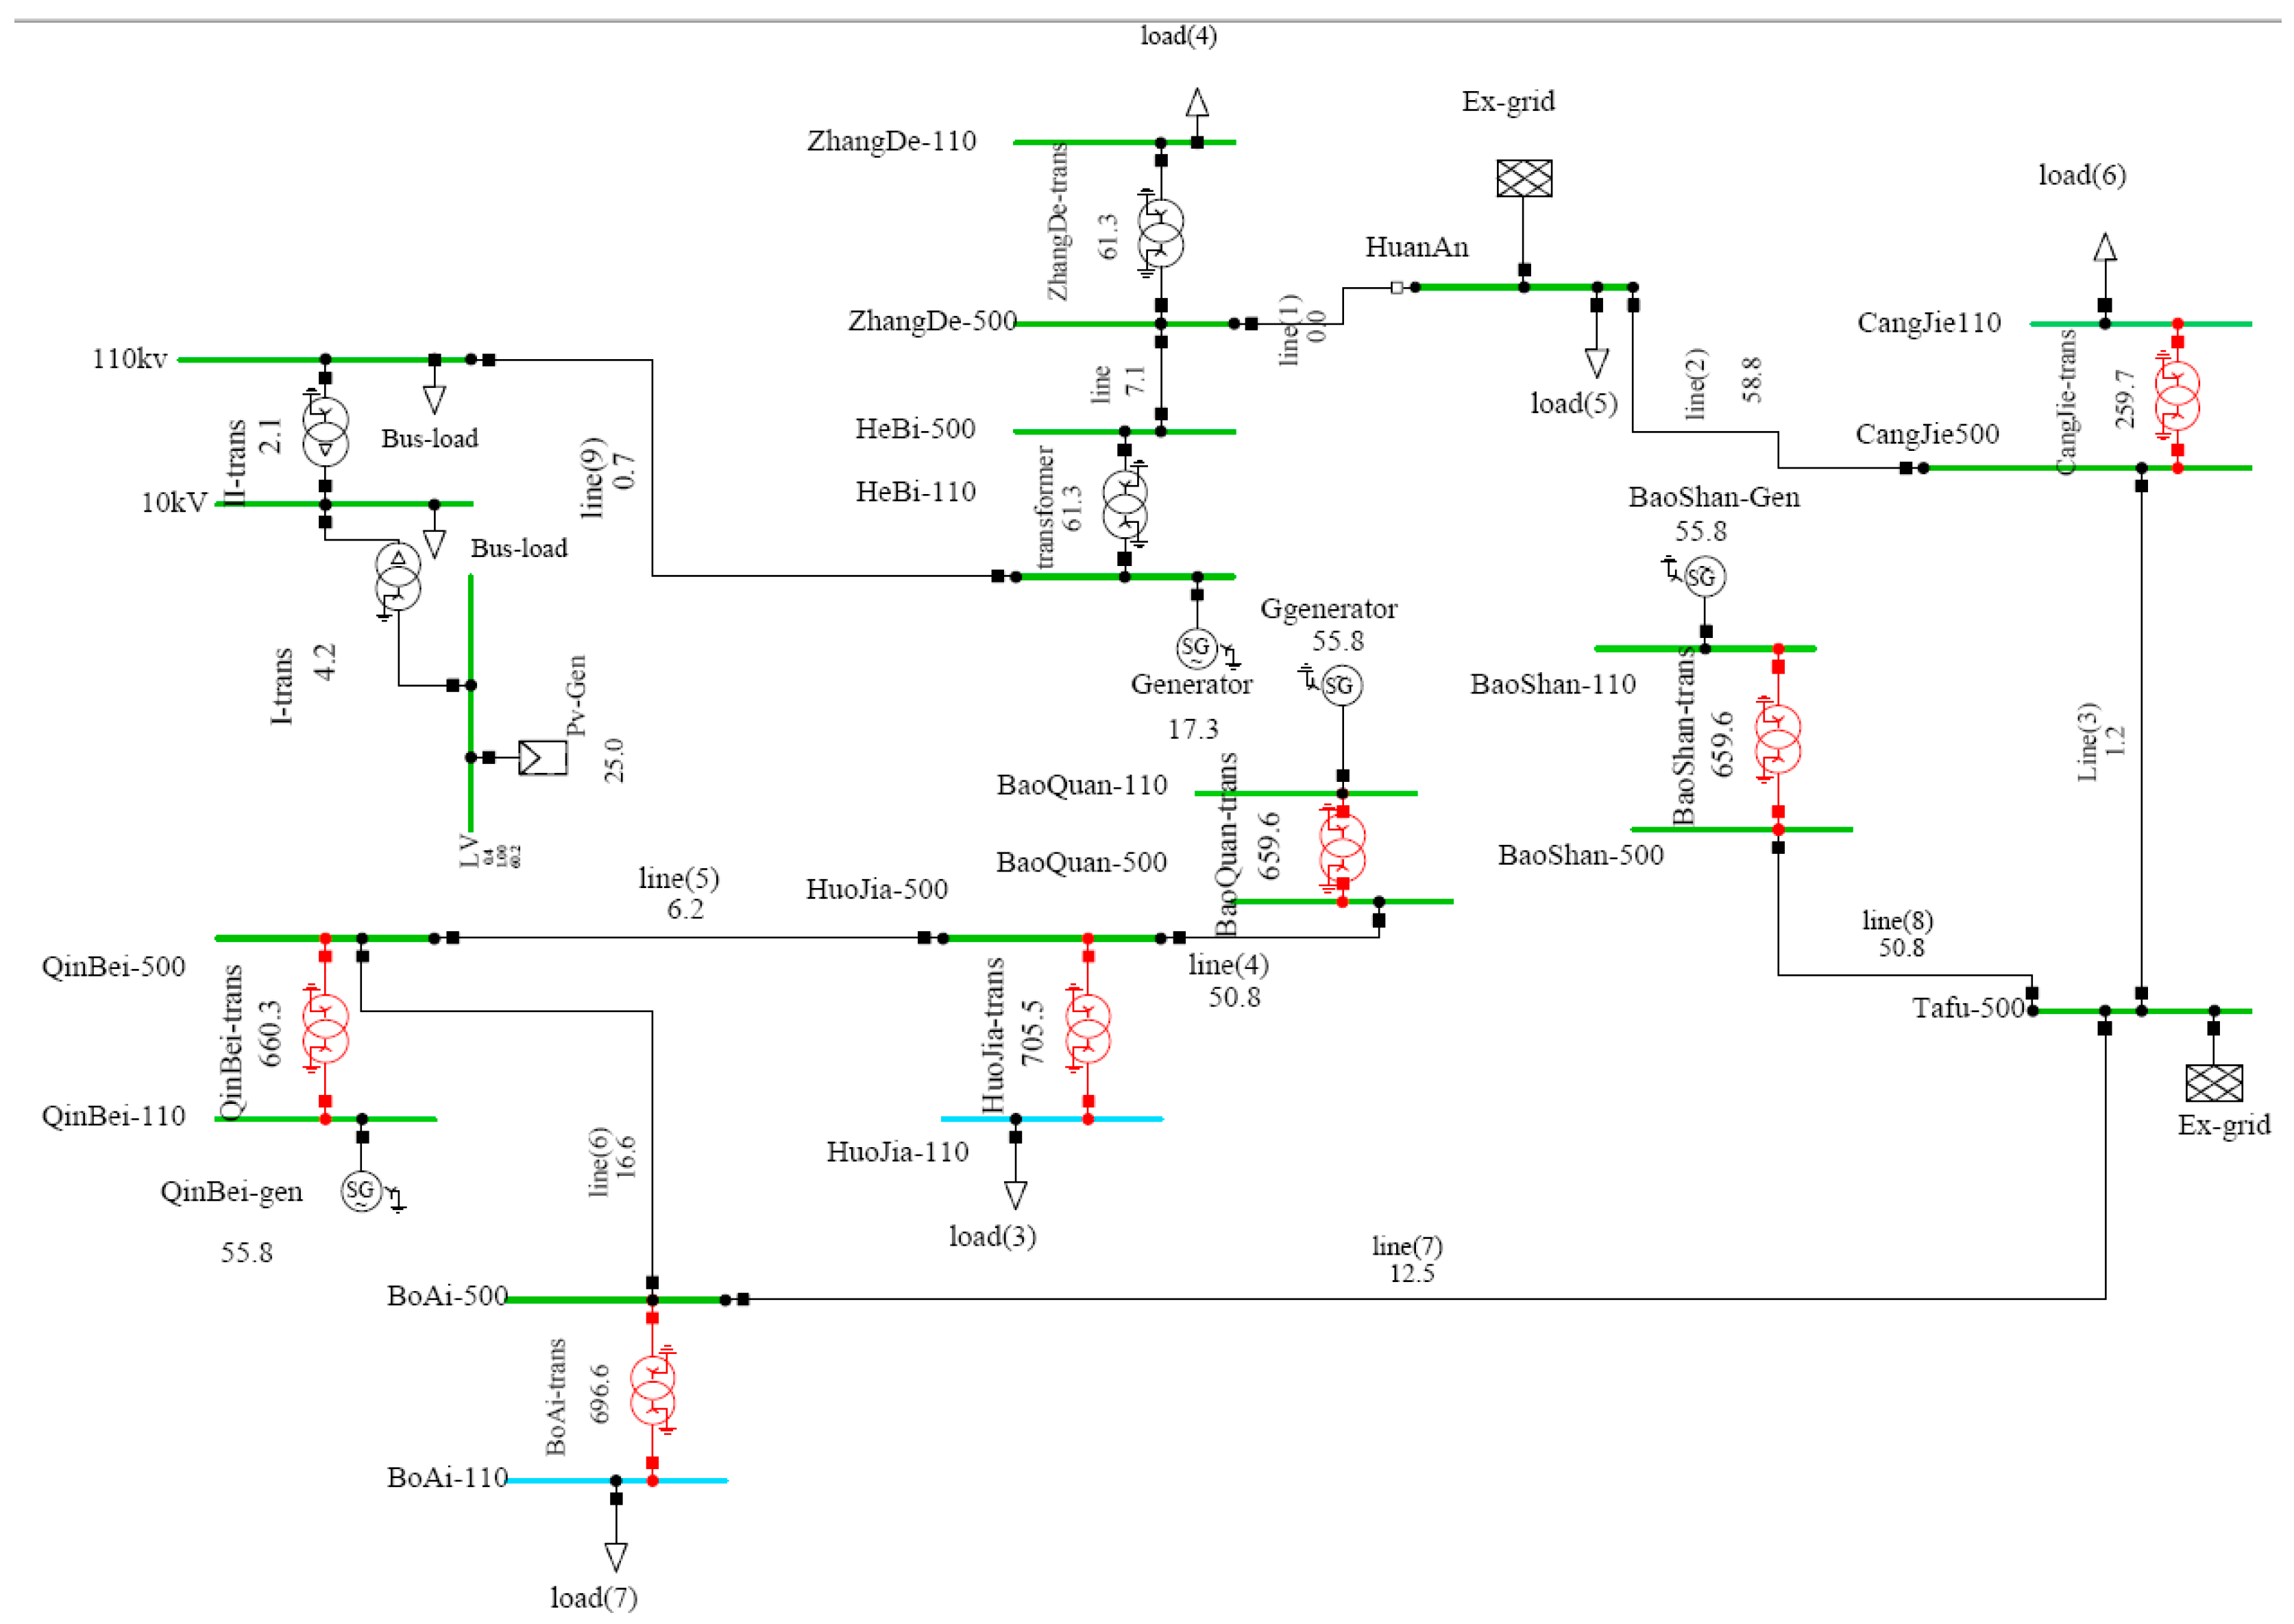
3.1. Grid Model
3.2. Analysis Methods
- (1)
- The effect of short-circuit faults at photovoltaic generating units on grid frequency stability;
- (2)
- The effect of typical load changes on grid frequency stability;
- (3)
- The impact of chemical storage on grid frequency stability.
- (1)
- A single PV array with 10 kW of power;
- (2)
- A short-circuit fault/incident on the bus where the PV is located—a 0.3 s short-circuit and 0.32 s fault removed;
- (3)
- The nodes examined include the typical node of the external grid of Tapu; the nodes at other locations do not change significantly with the factors examined in this paper and so are not considered;
- (4)
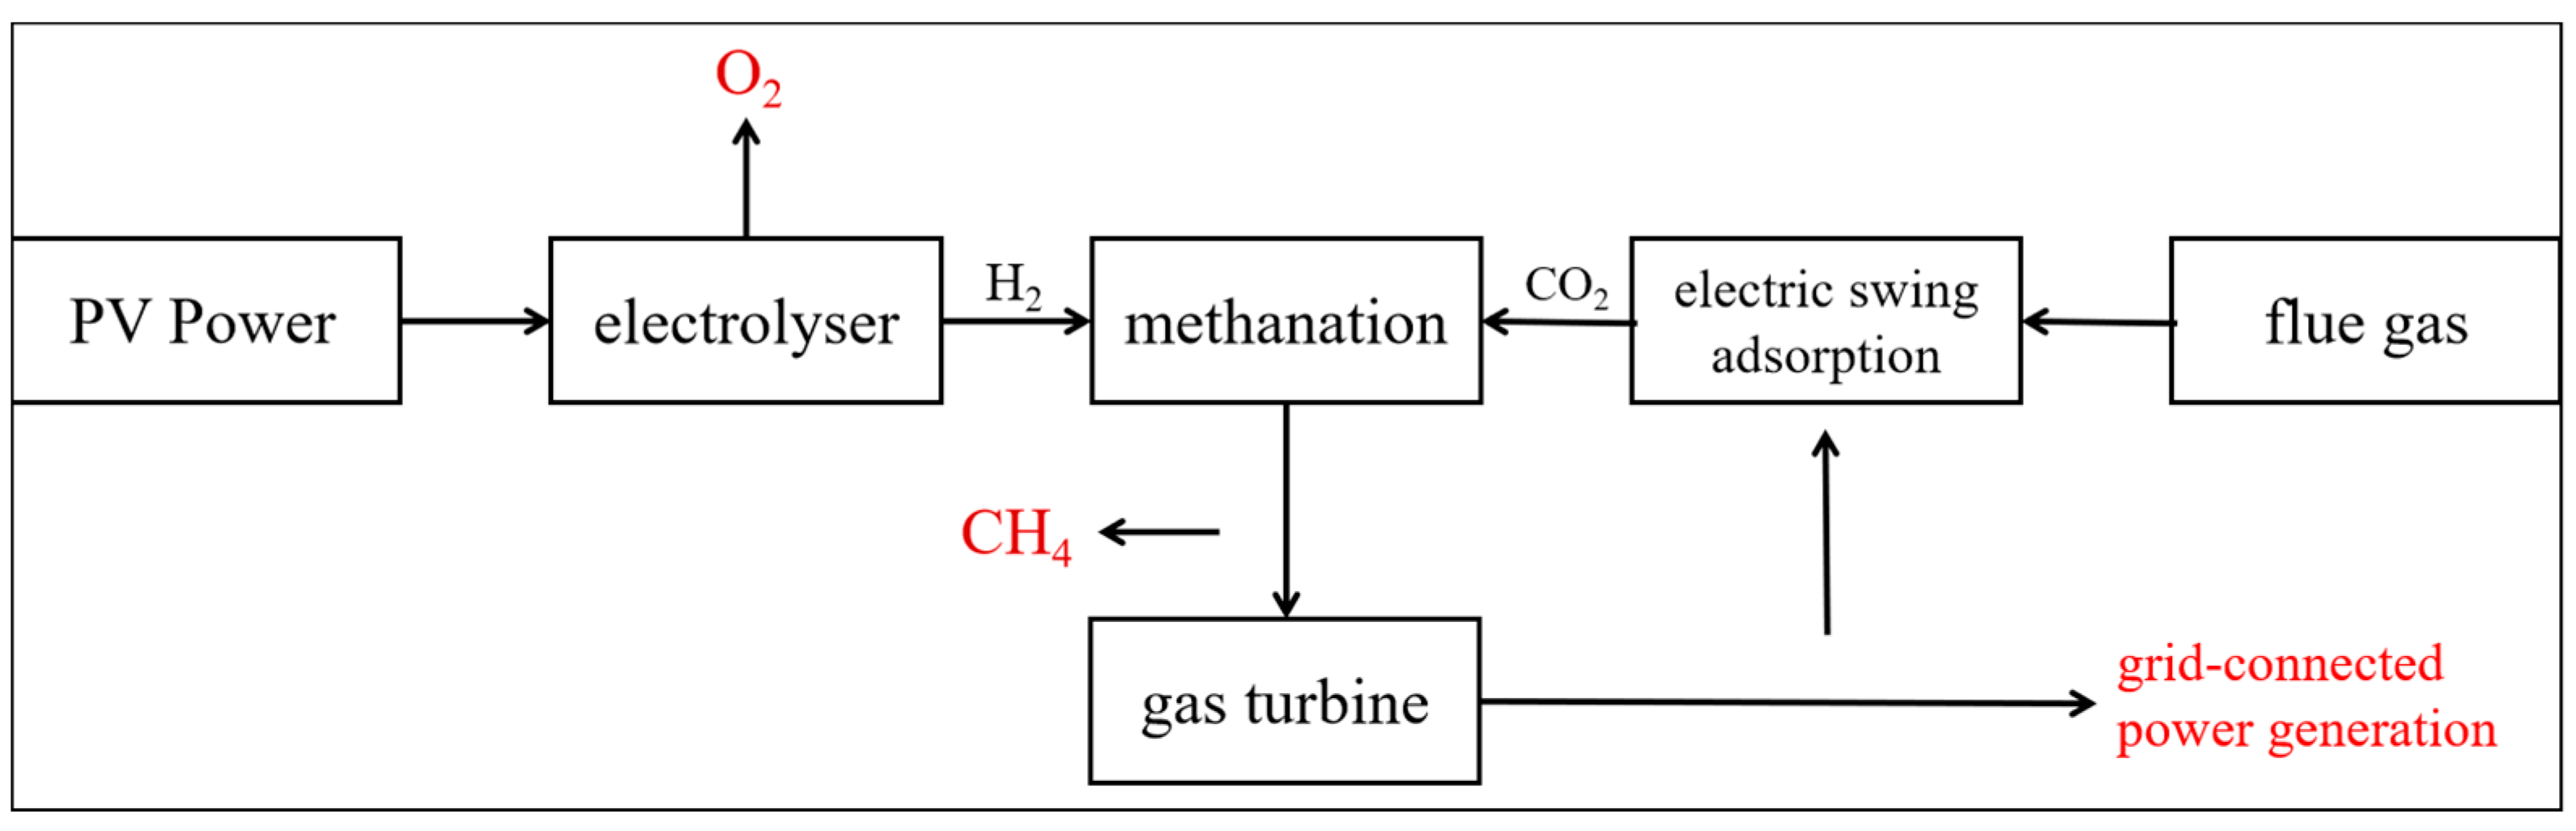
- Chemical power storage is used, as shown in Figure 4. In this technology, photoelectricity can be used to produce H2 and O2, and the O2 can be stored directly after separation and can be used as a feedstock for oxygen-rich combustion in thermal power-generating units. Flue gas from combustion in thermal power plants is subjected to the variable power adsorption of CO2 to produce efficiently storable CH4 through methanation reactions. CH4 can be fed into the city’s natural gas network on the one hand and can be burned by gas turbines to generate electricity on the other, thus achieving a stable external power output. Regarding CH4, 60% of the electricity on the photovoltaic side is connected to the grid through this chemical storage conversion method.
4. System Simulation Analysis
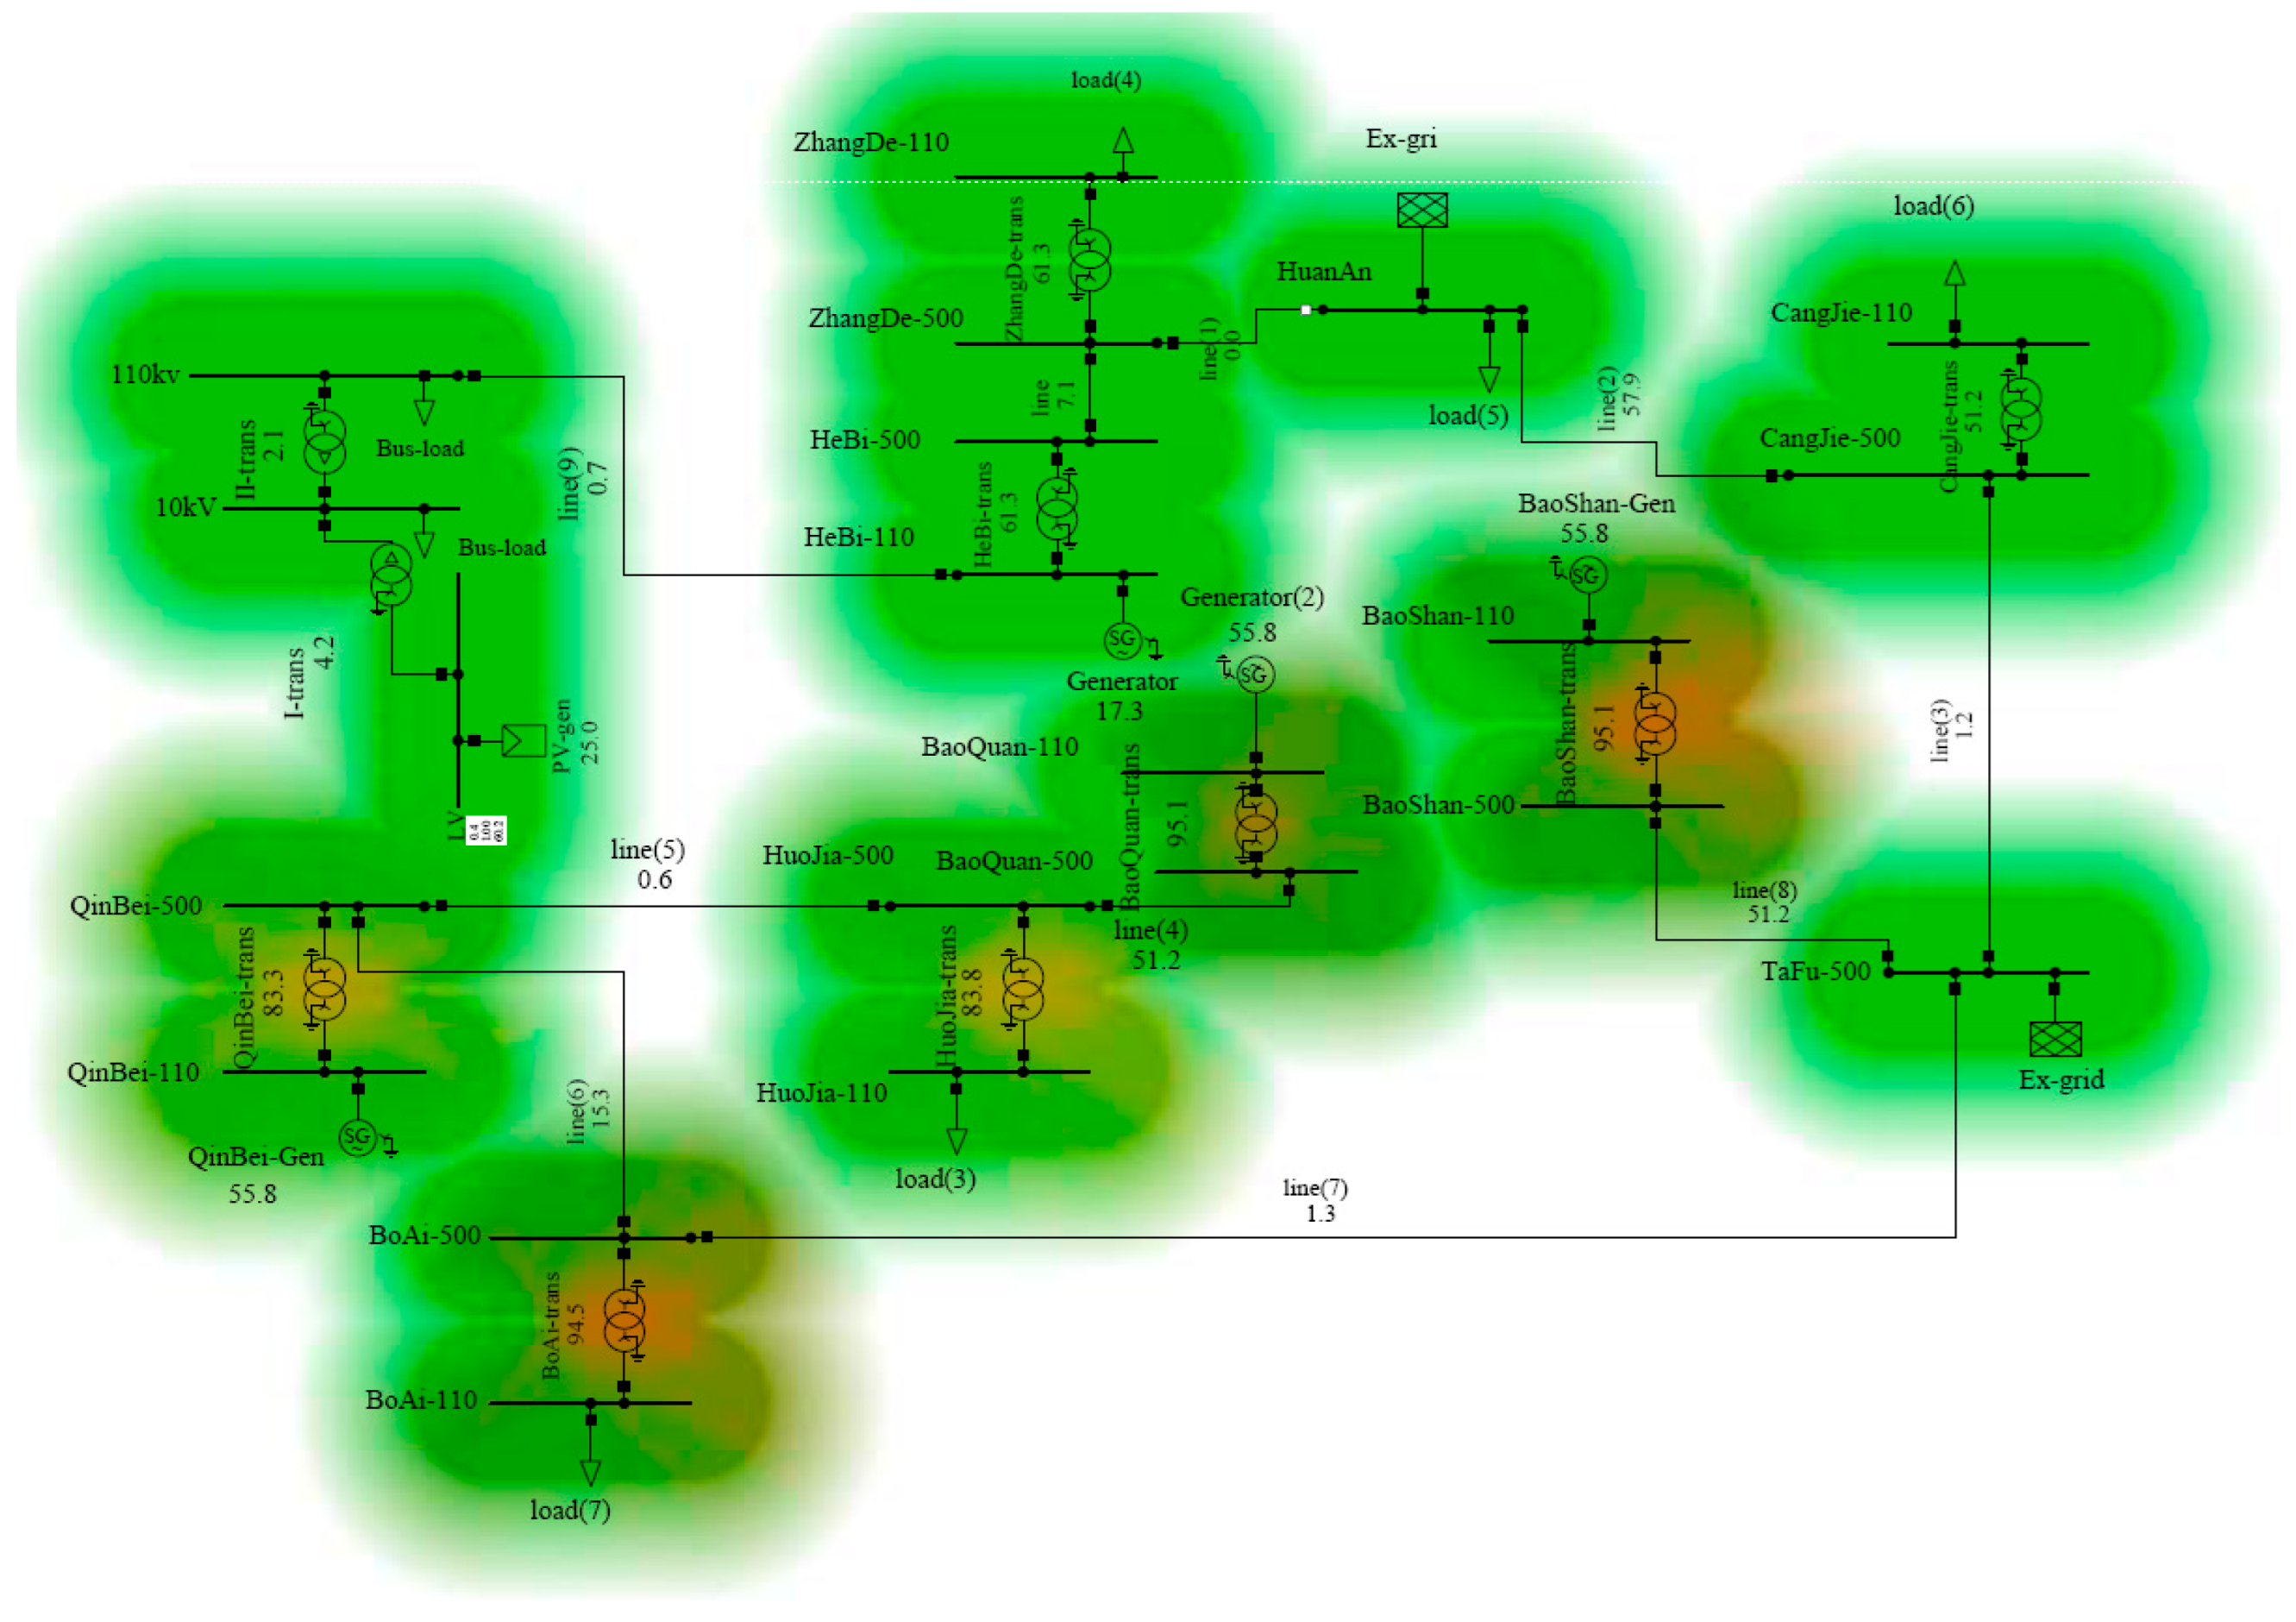
4.1. Calculation of Grid-Connected PV Currents in Northern Henan
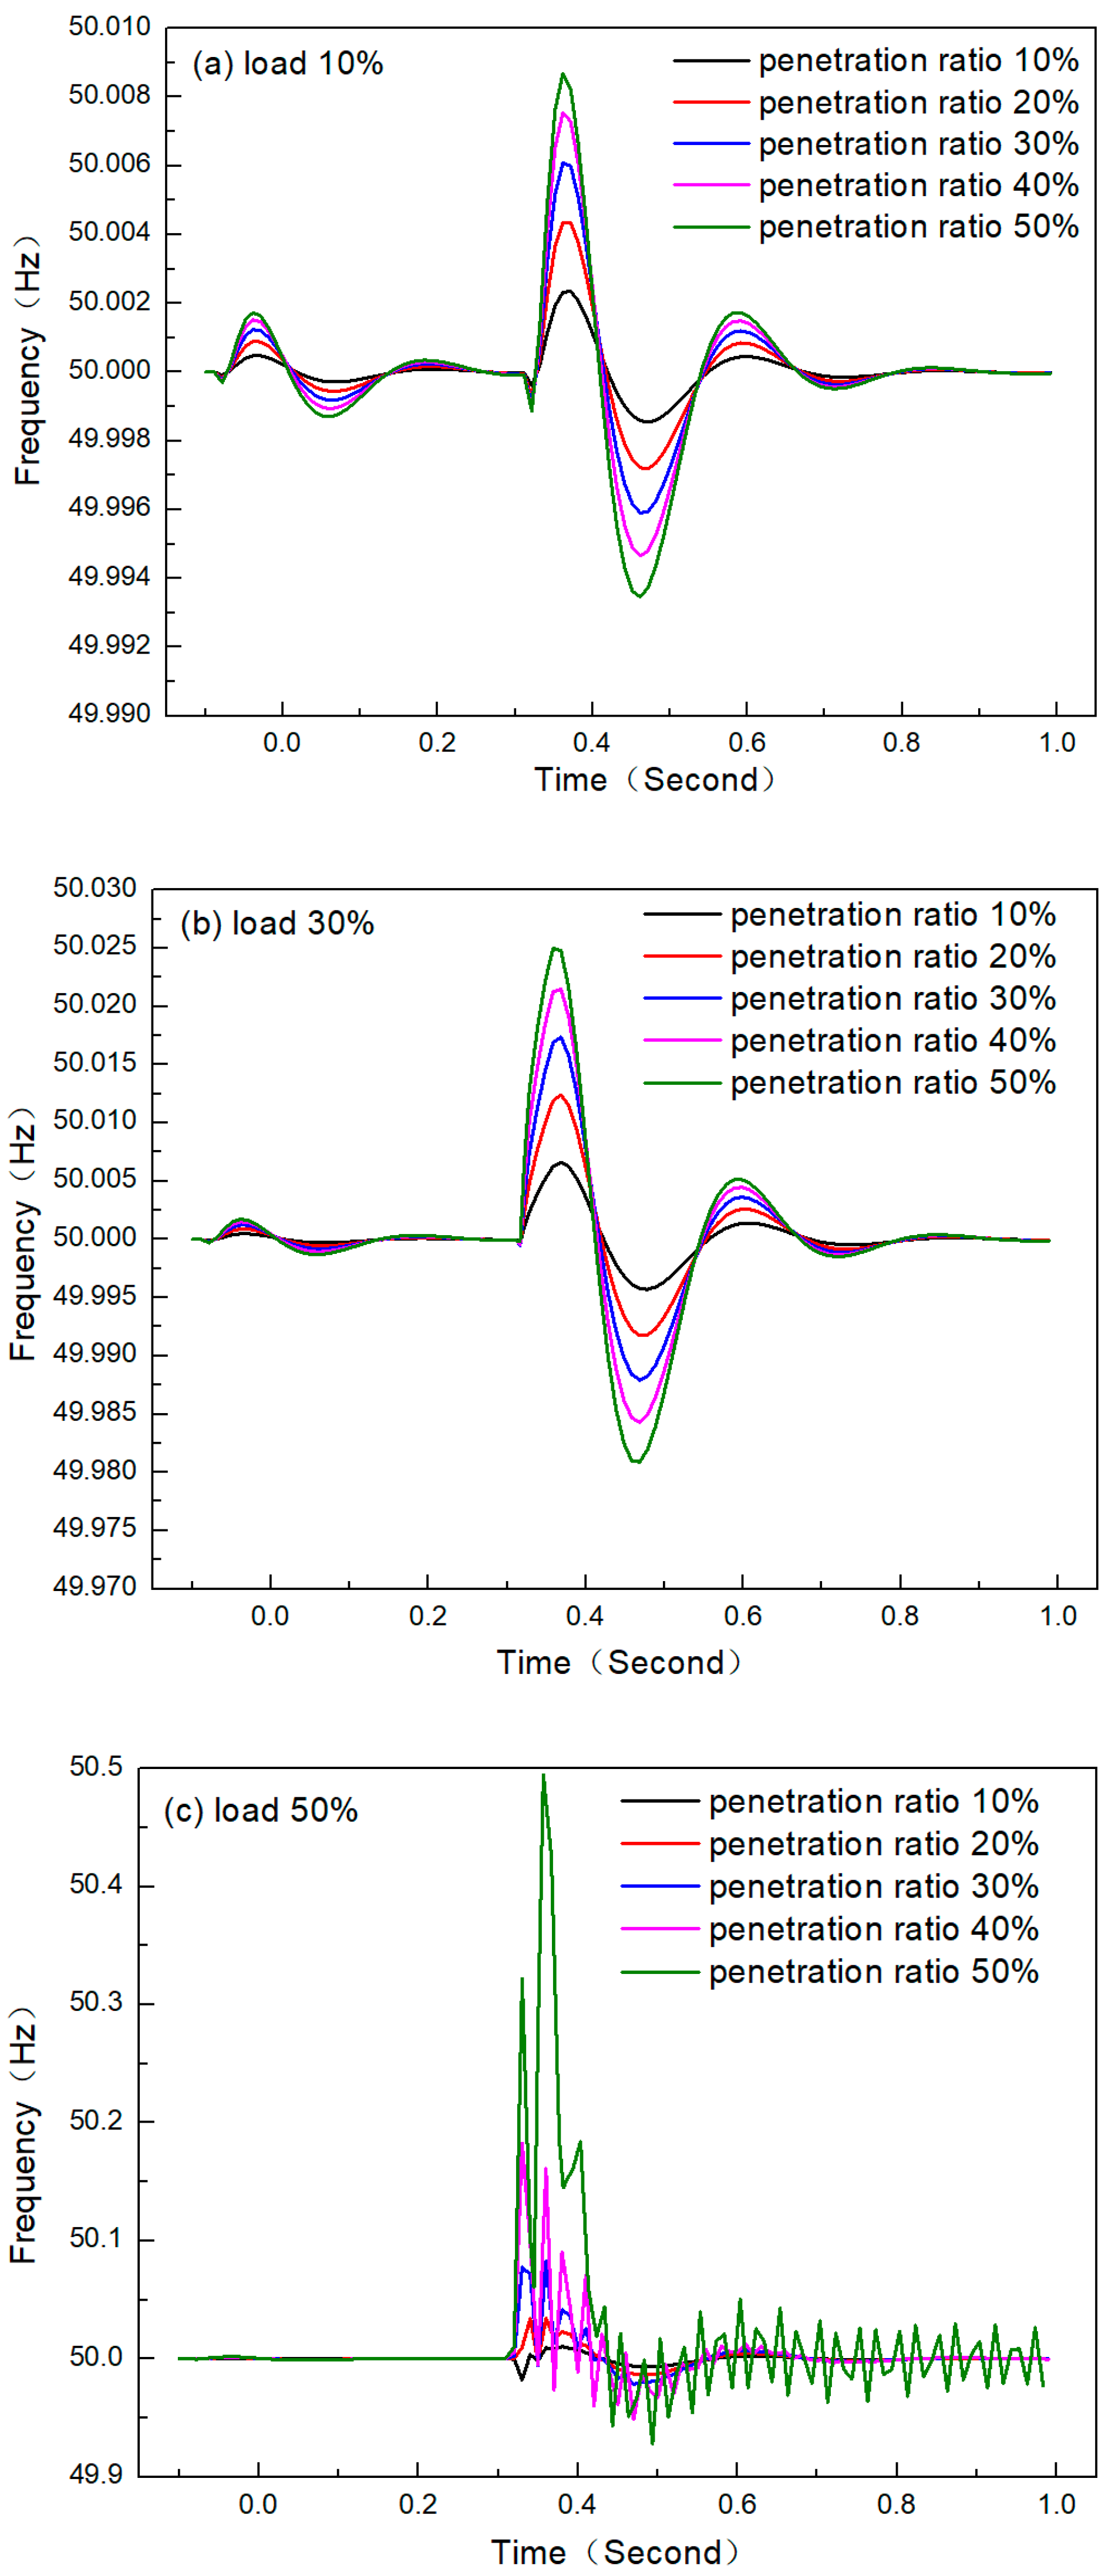
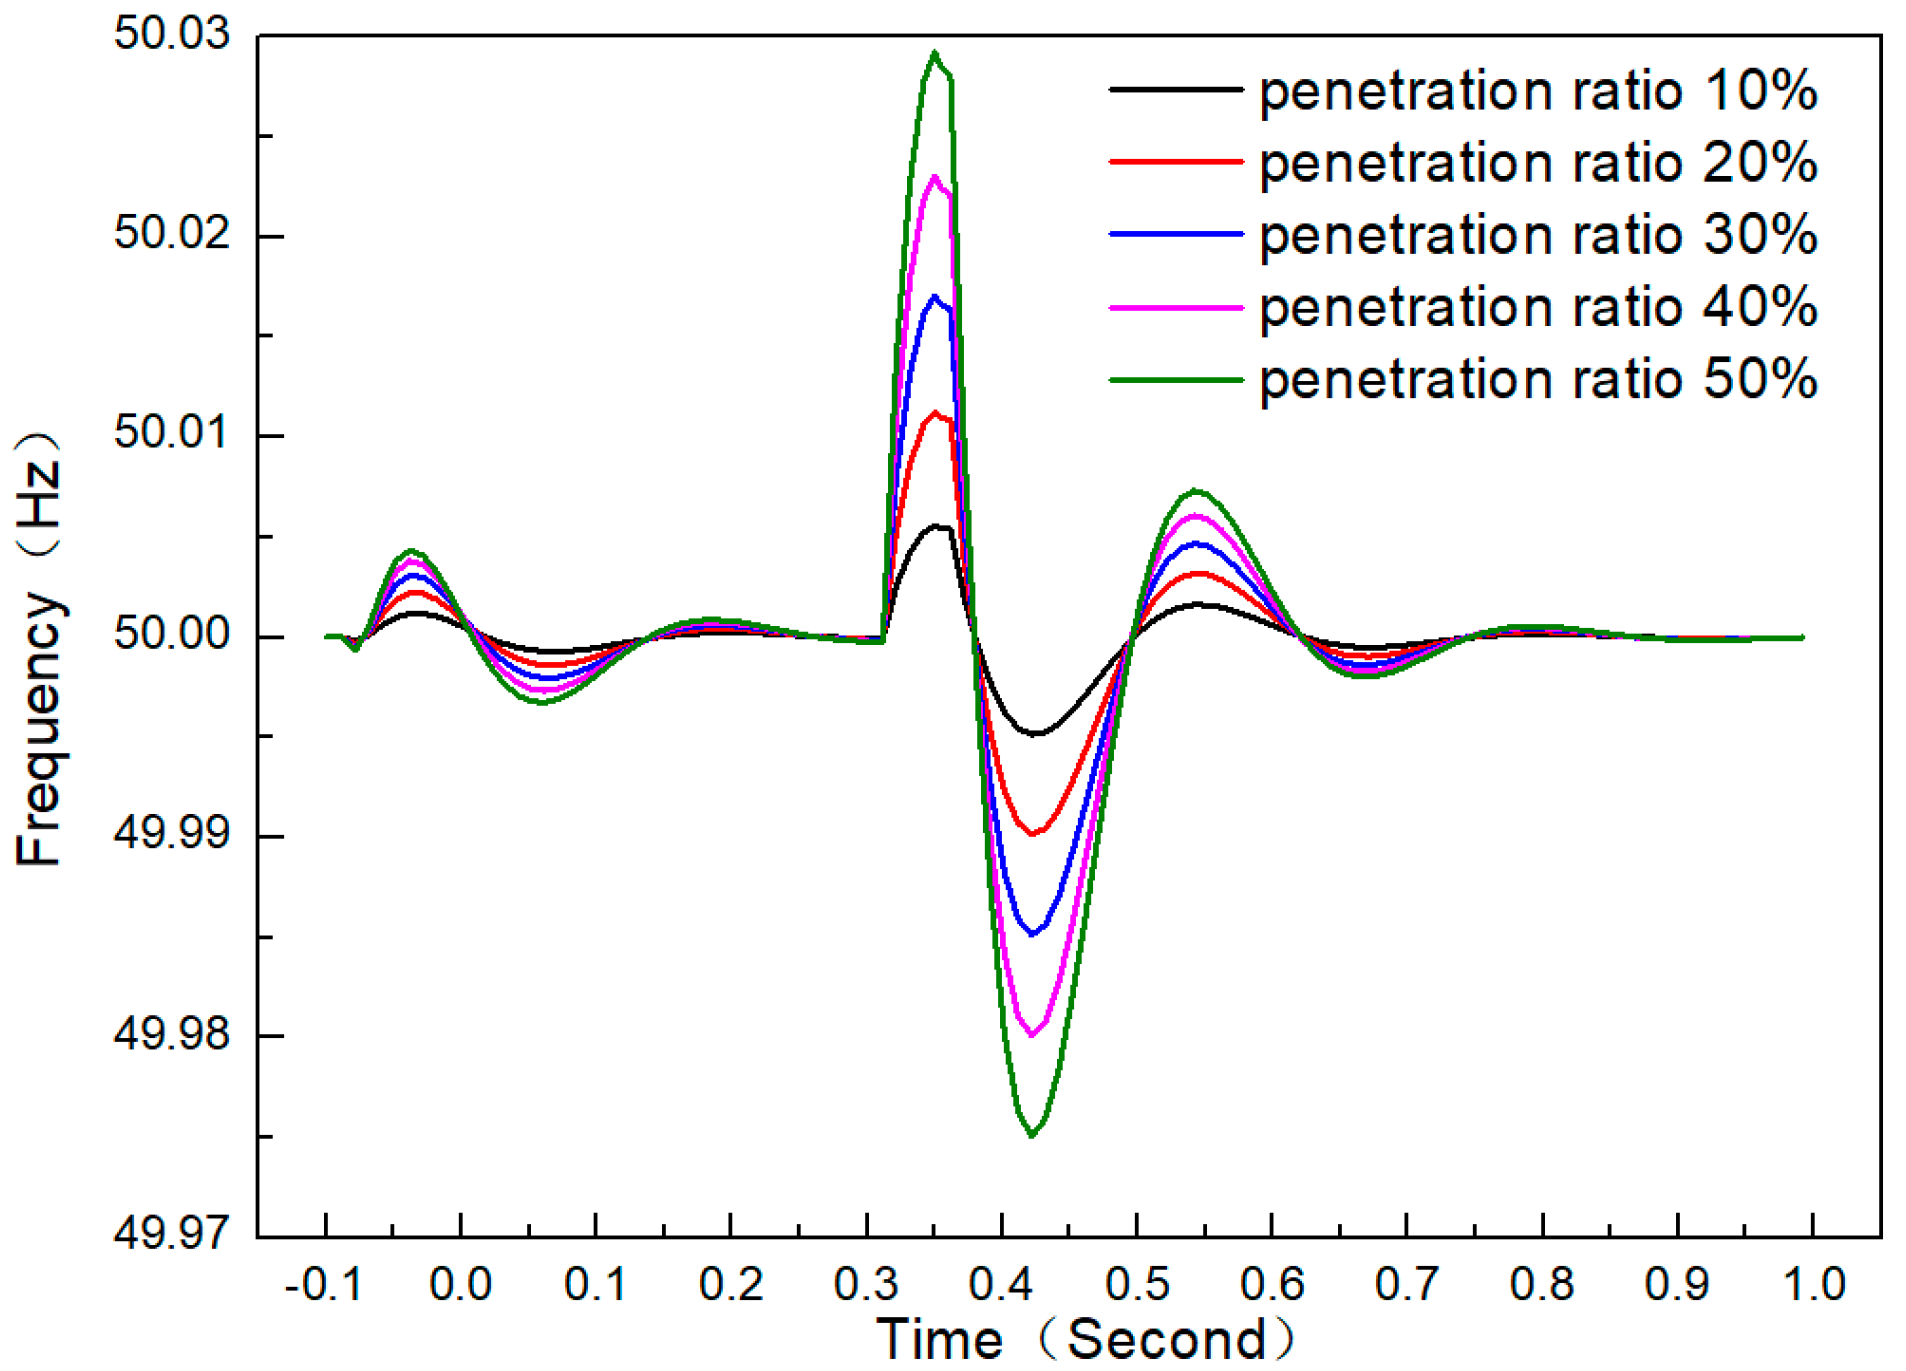
4.2. Impact of Short-Circuit Events on the Power System Frequency Stability
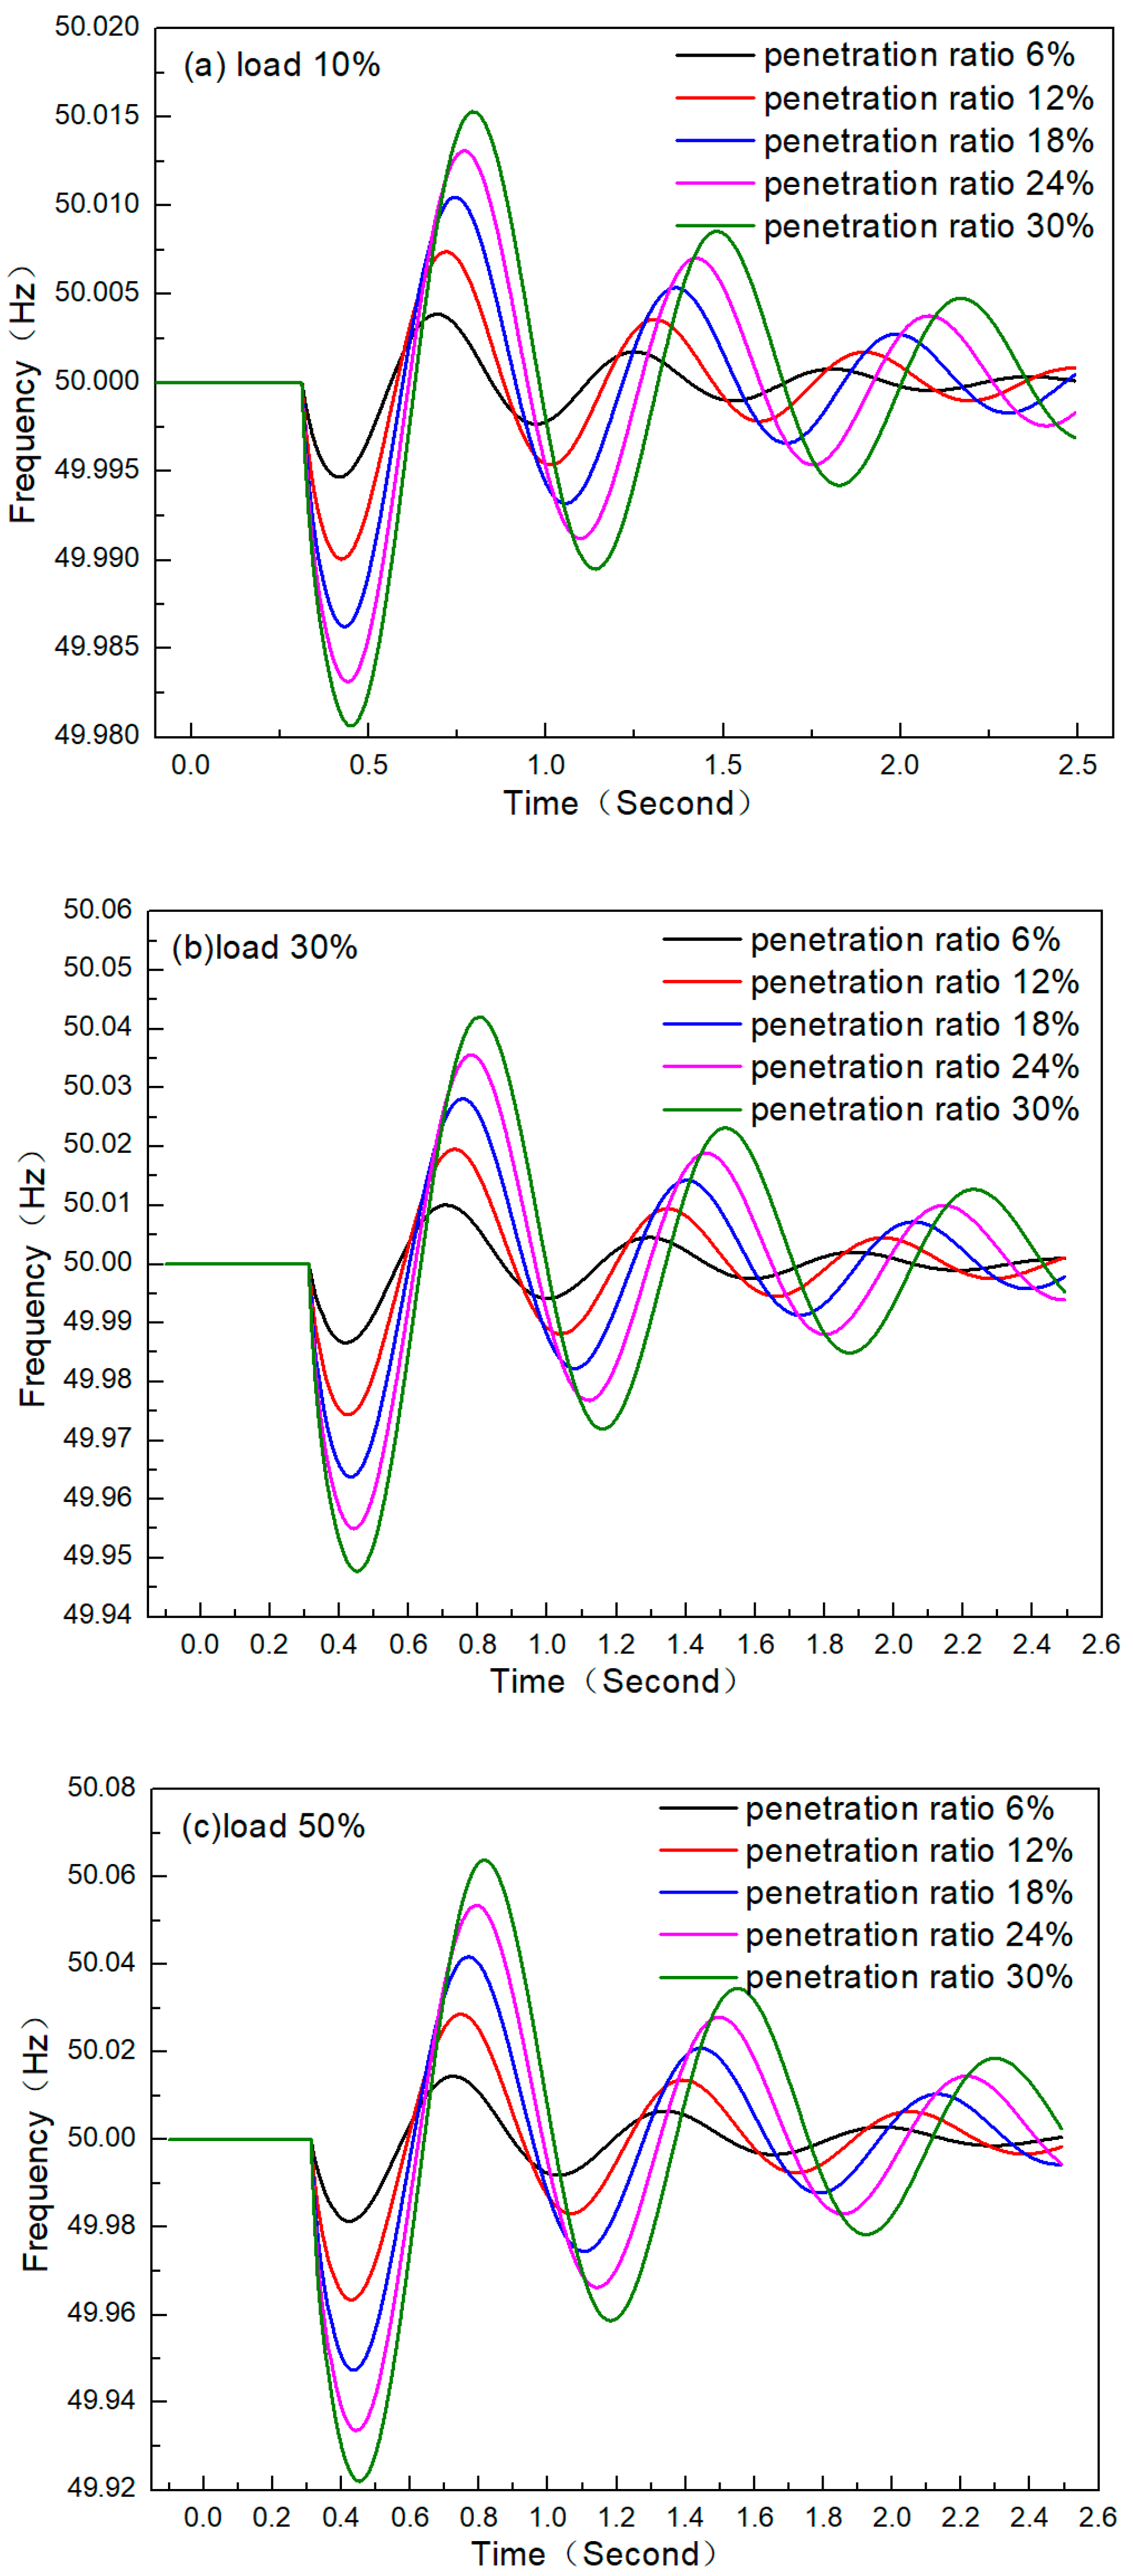
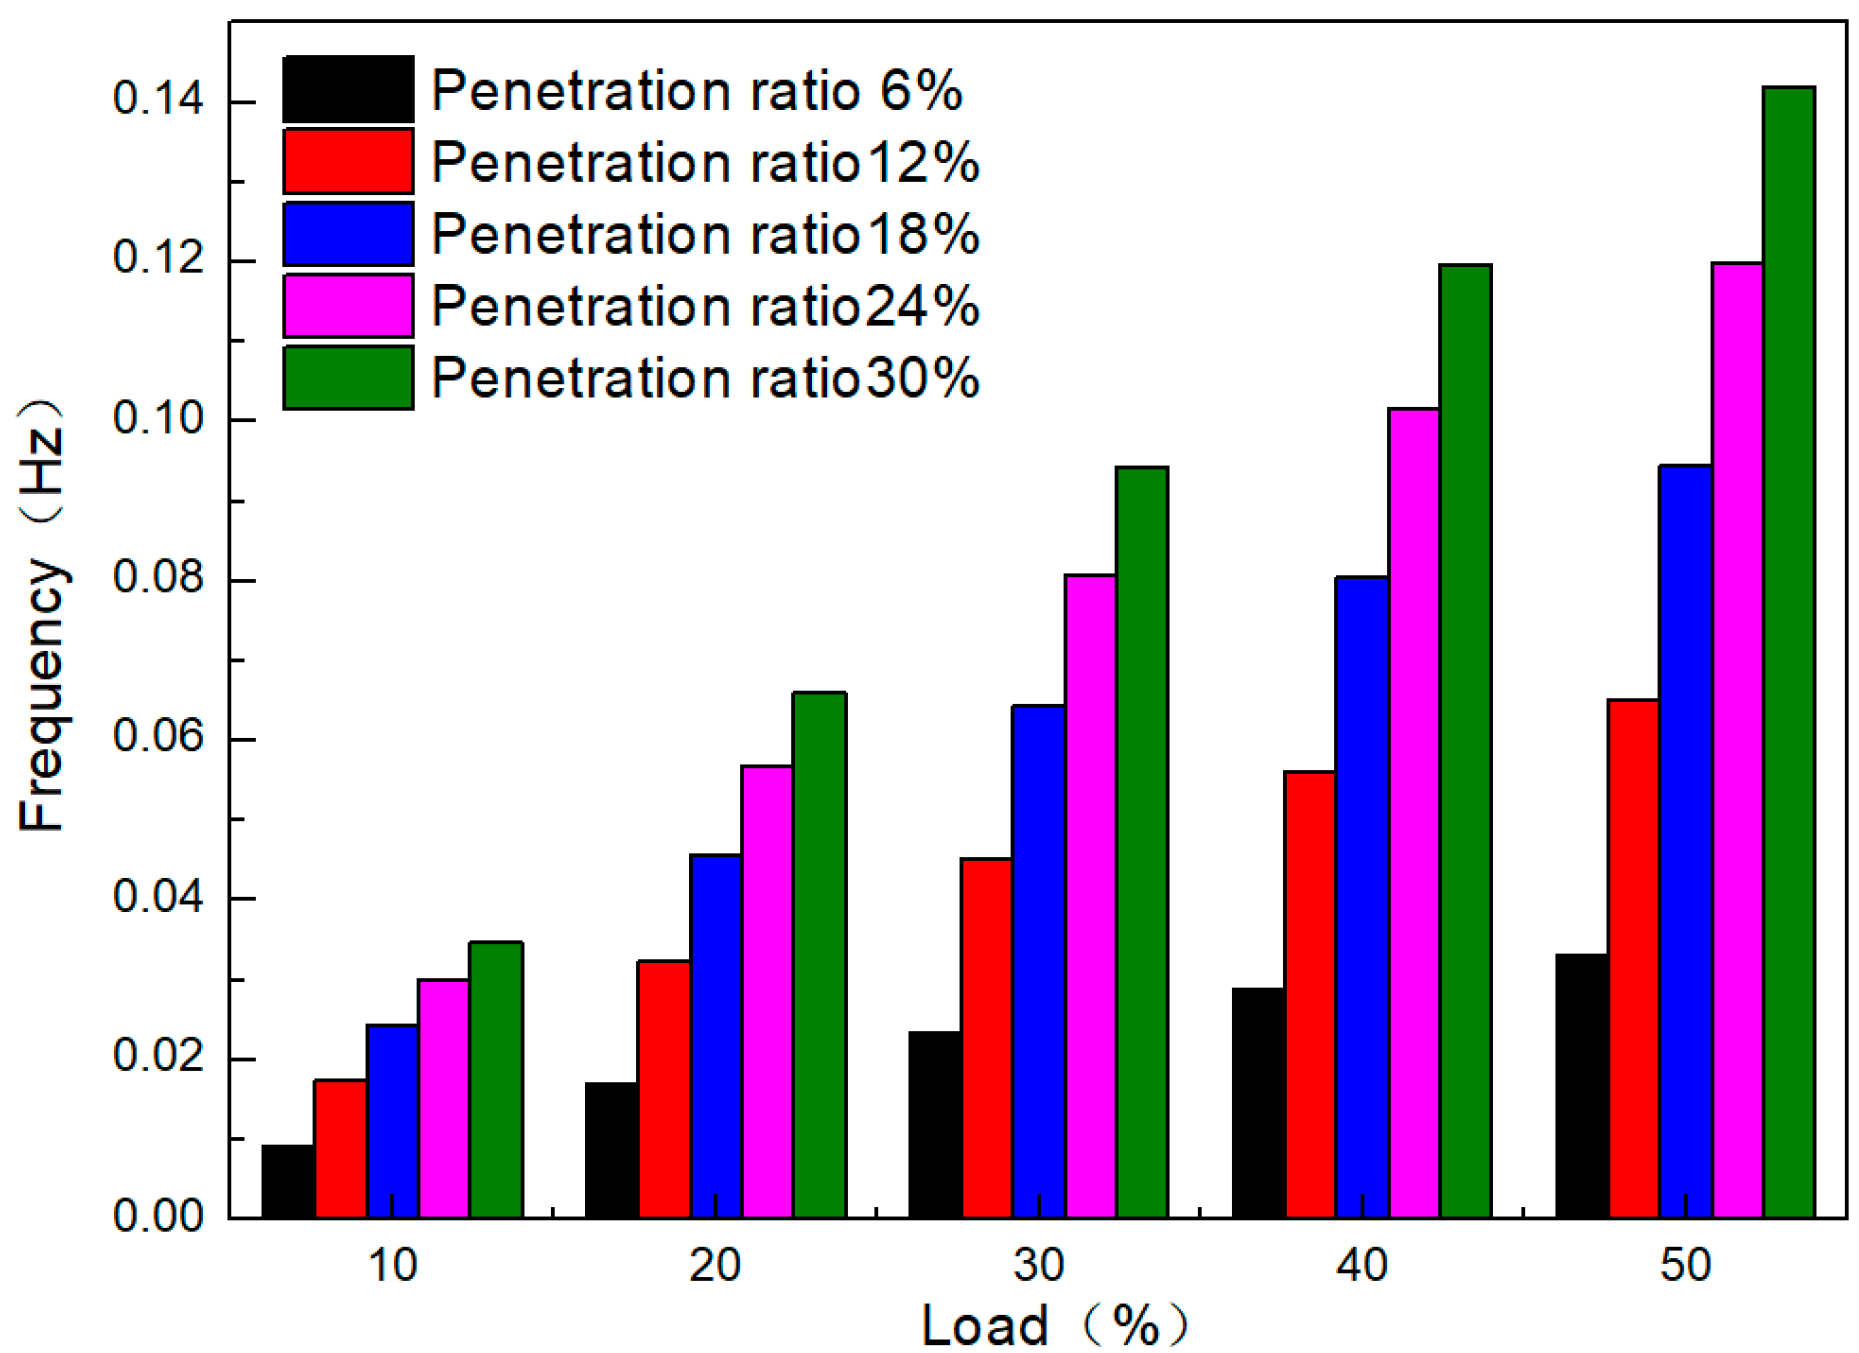
4.3. The Influence of Load Changes on Grid Frequency
5. Conclusions
- (1)
- In the case of a short-circuit fault, the frequency fluctuation amplitude in the isolated network was 0.010, 0.021, 0.032, 0.043, and 0.054 Hz, respectively, under five different penetration ratios. With the increase in the photovoltaic penetration ratio, the maximum frequency and fluctuation amplitude of the system gradually increased, and the power grid system in Northern Henan is became less and less stable.
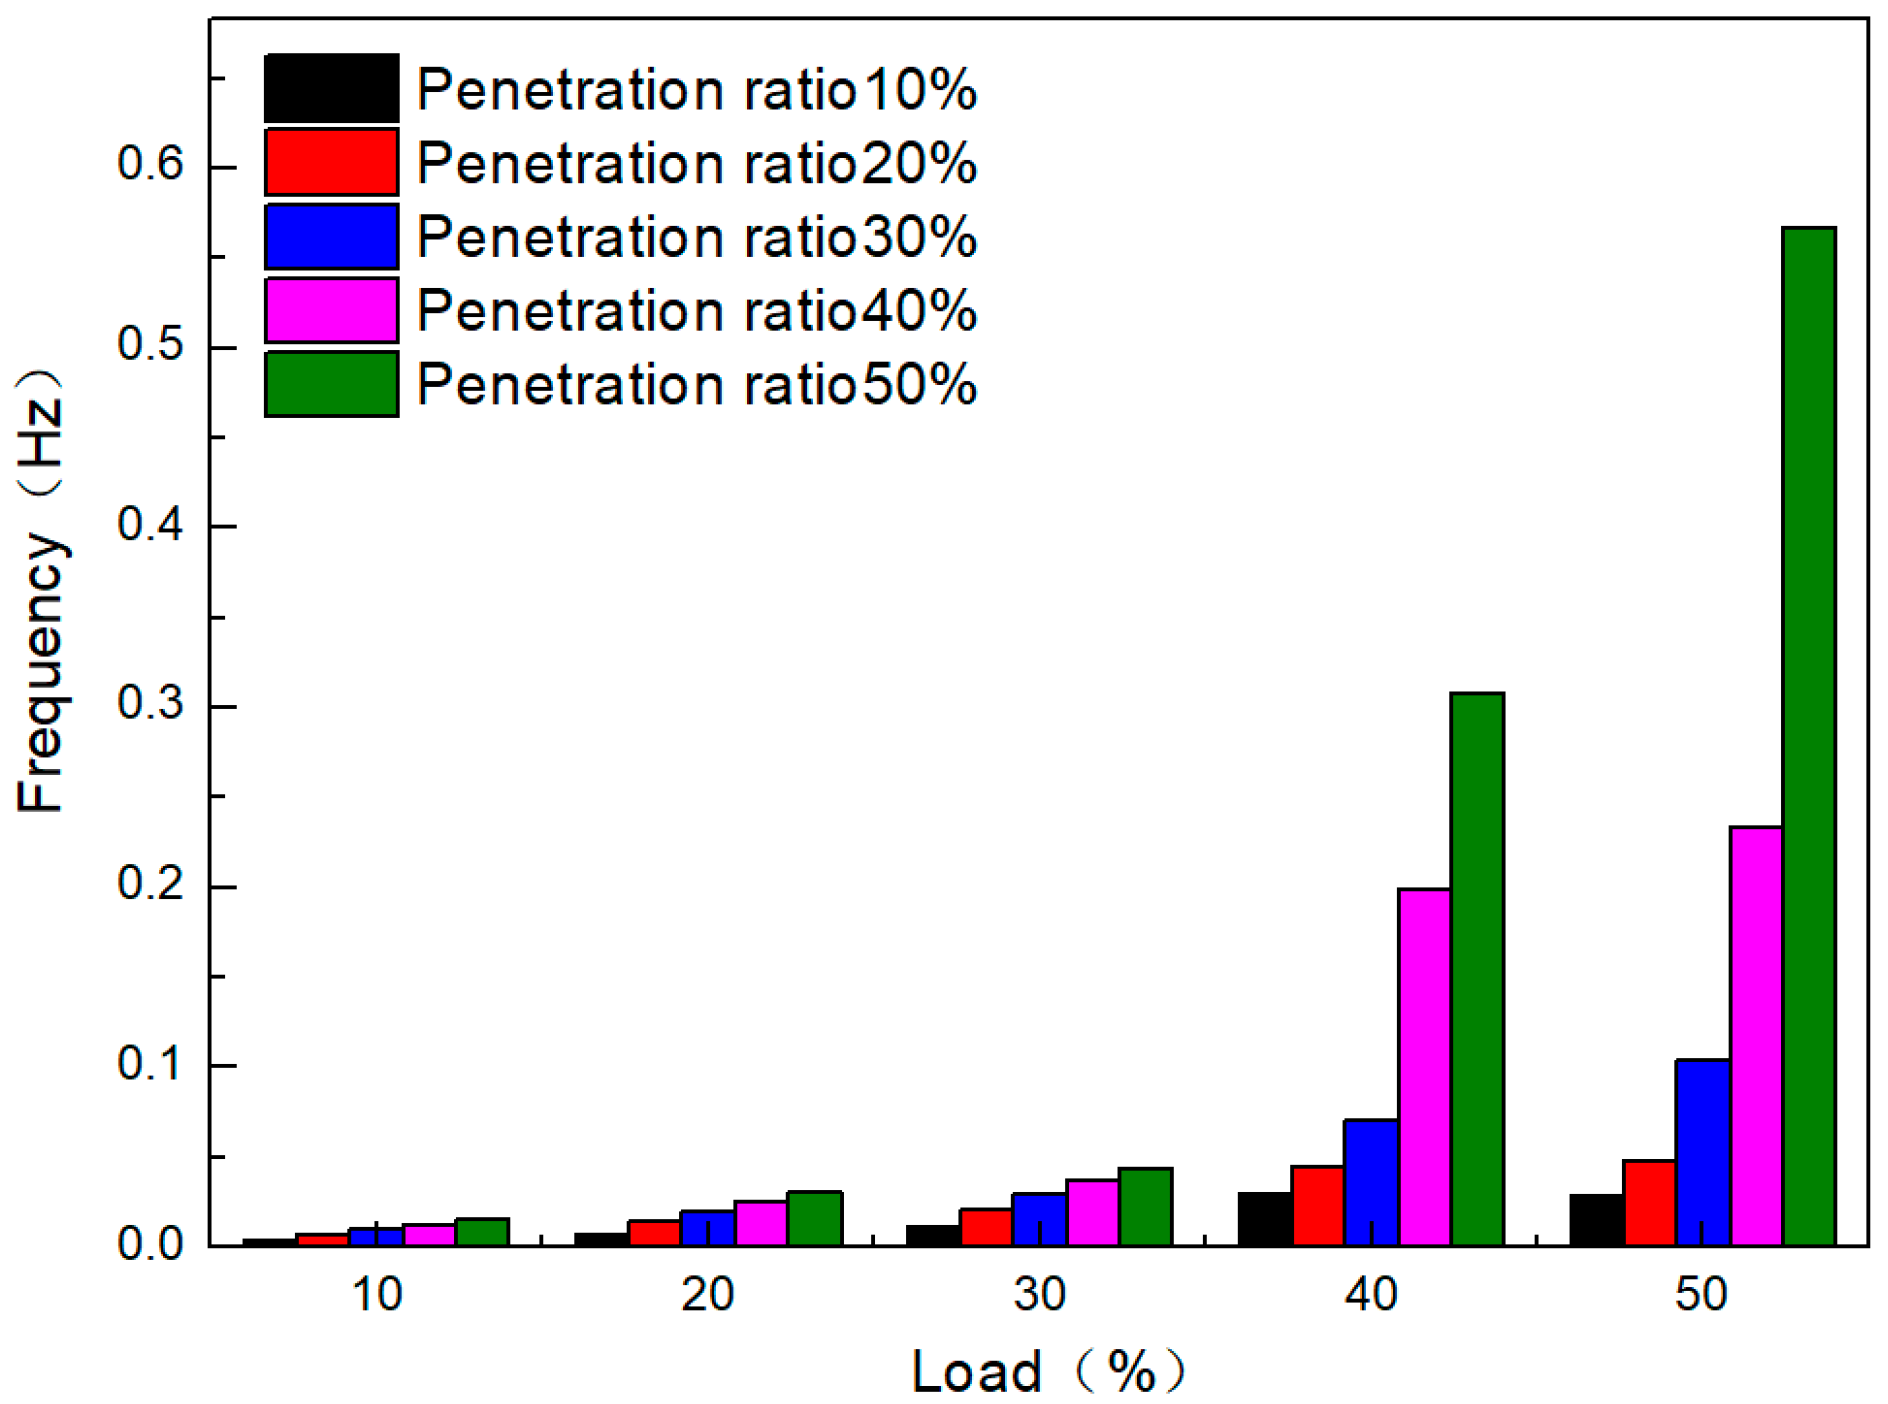
- (2)
- The load changed at 0.3 s, and the frequency gradually stabilized after 0.8 s. At the same load, as the penetration ratio increased, the peak value of the system frequency at the corresponding node gradually increased, and the valley value gradually decreased. At the same penetration ratio, as the load increased, the peak value of the frequency curve gradually increased and the valley value gradually decreased.
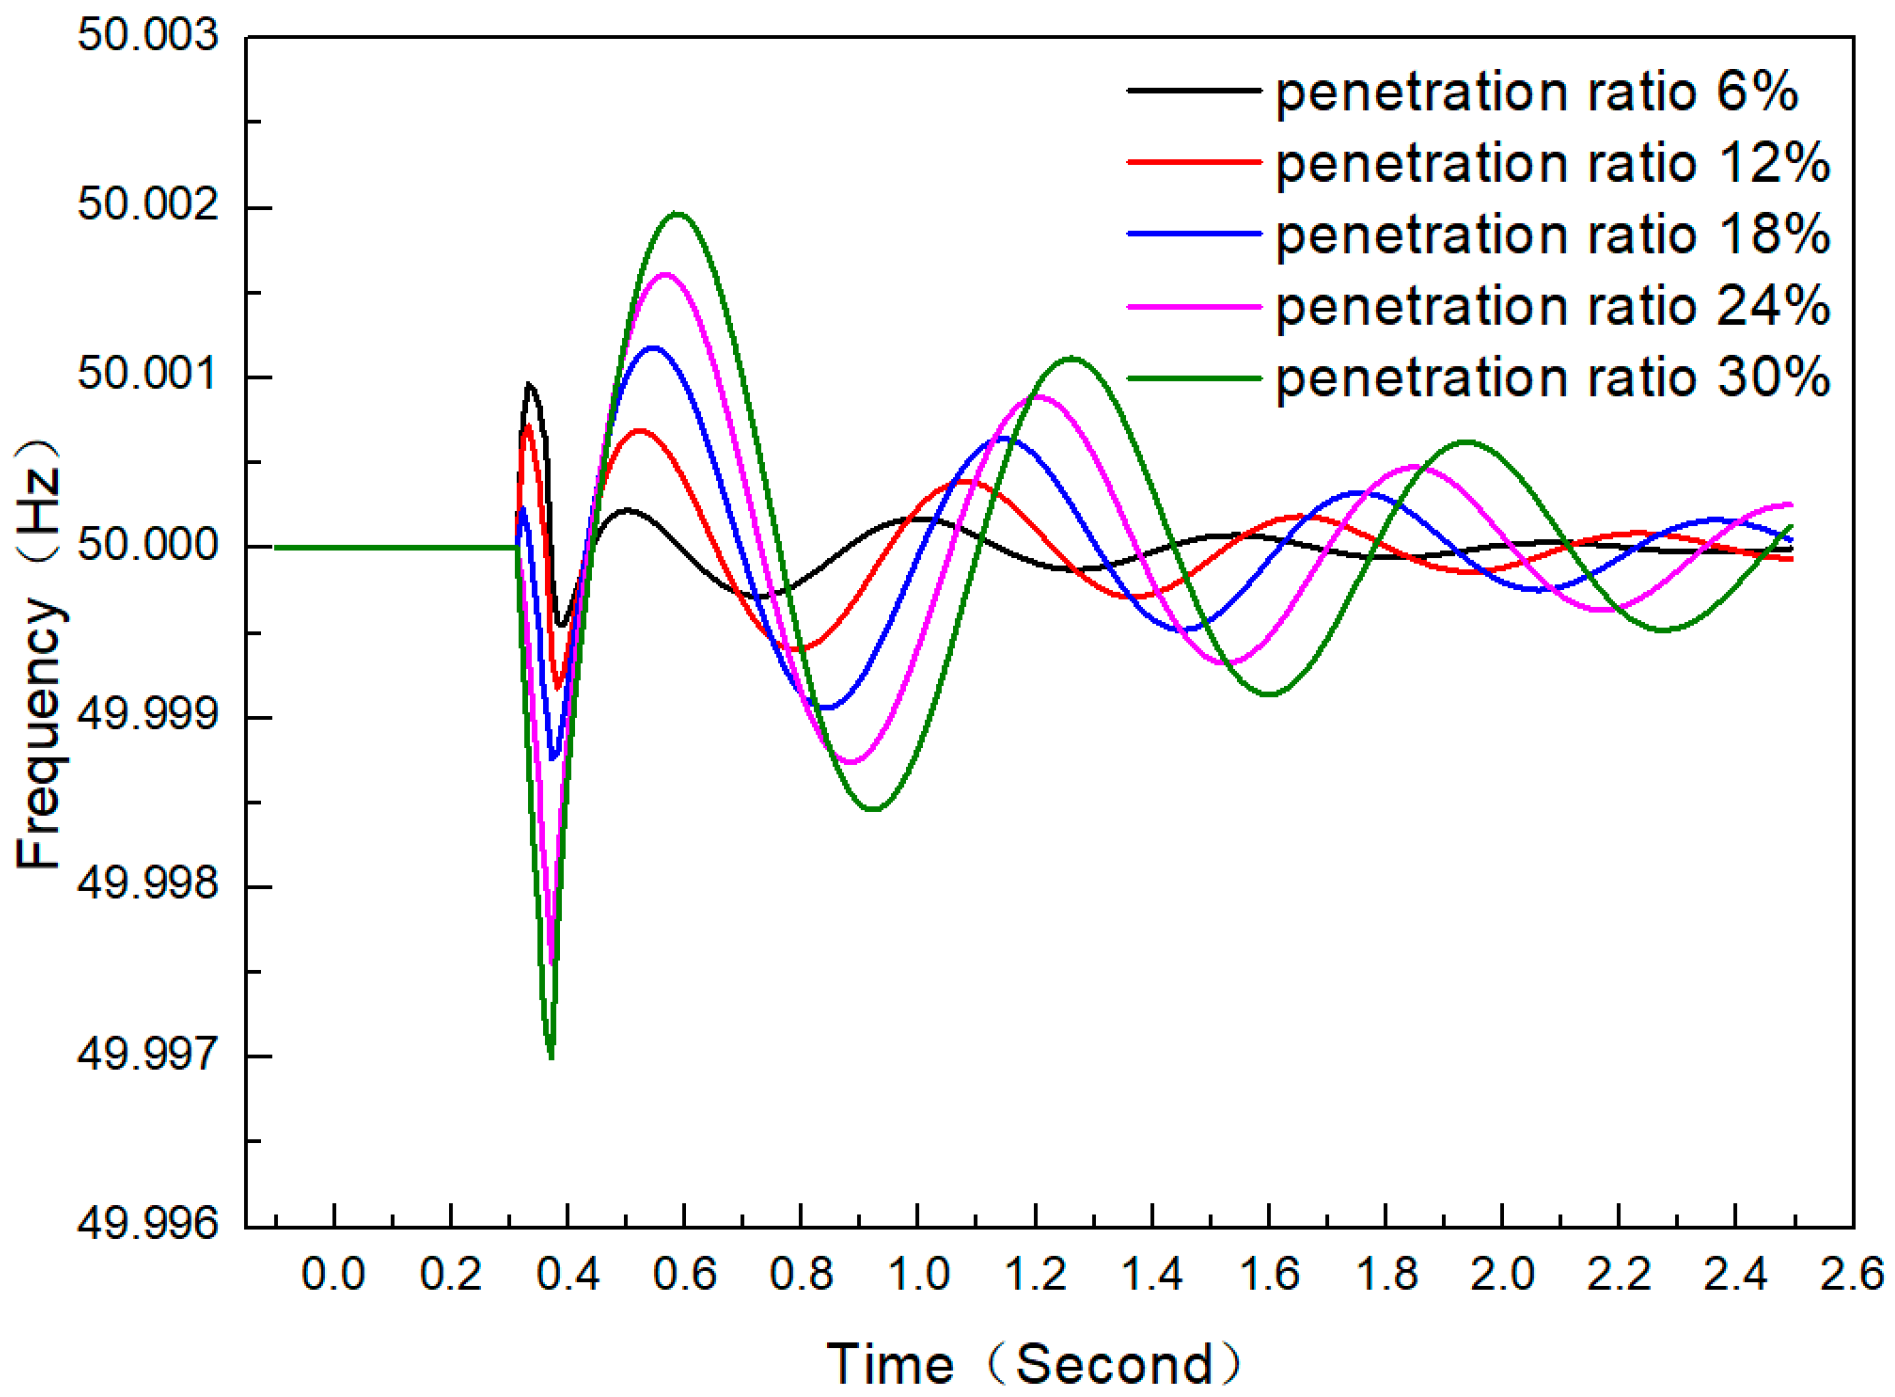
- (3)
- When the photoelectric system is connected to the grid through chemical energy storage, the stability of the system is significantly improved during short-circuit faults and load changes. After energy storage, the frequency variation amplitude of short-circuit fault operation could be maintained within ±0.005 Hz, and the frequency variation amplitude could be maintained within ±0.15 Hz when the load changes. Compared with the case before energy storage, in the event of a short-circuit accident, the frequency stability of the system after energy storage increased approximately tenfold; compared to the case before energy storage, the system frequency stability was improved by approximately four times when the load changes.
Author Contributions
Funding
Data Availability Statement
Conflicts of Interest
Abbreviations
| PV | Photovoltaic power station |
| DC | direct-current |
| PWM | Solar power control module |
| RSM | electromechanical transient simulation |
References
- Zhu, X.N.; Wang, S.R.; Wang, L. Life cycle analysis of greenhouse gas emissions of China’s power generation on spatial and temporal scale. Energy Sci. Eng. 2022, 10, 1083–1095. [Google Scholar] [CrossRef]
- National Bureau of Statistics. 2020 Statistical Bulletin of the People’s Republic of China on National Economic and Social Development; National Bureau of Statistics: Beijing, China, 2021. [Google Scholar]
- Luo, X.; Zhang, D.; Zhu, X. Combining transfer learning and constrained long short-term memory for power generation forecasting of newly-constructed photovoltaic plants. Renew. Energy 2022, 185, 1062–1077. [Google Scholar] [CrossRef]
- Shi, M.F.; Qu, J.X.; Luo, K.; Li, Q.M.; He, Y.J.; Wang, W.S. Research on high proportion of new energy grid connection and operation development. Chin. J. Eng. Sci. 2022, 24, 52–63. [Google Scholar] [CrossRef]
- Henan Regulatory Office of the National Energy Administration. Settlement of “Grid-Connected Operation and Management of New Energy Power Plants” in Henan Province in February 2022; Henan Regulatory Office of the National Energy Administration: Zhengzhou, China, 2022. [Google Scholar]
- Li, Z.H.; Wang, H.; Wu, C.H.; Zheng, C.; Wang, W. Influence of upturning of main transformer power flow caused by high proportion of new energy access on operation of Henan Power Grid. Henan Electr. Power 2020, S1, 25–29. [Google Scholar]
- Li, C.G.; Liu, Y.T.; Zhang, H.X.; Zhuang, K.Q.; Cao, L.; Huang, Z.L. Frequency response analysis method of power system based on dc power flow. Proc. CSEE 2009, 29, 36–41. [Google Scholar]
- Smith, O.; Cattell, O.; Farcot, E.; O’Dea, R.D.; Hopcraft, K.I. The effect of renewable energy incorporation on power grid stability and resilience. Sci. Adv. 2022, 8, eabj6734. [Google Scholar] [CrossRef] [PubMed]
- Jung, J.Y.; Cho, Y.S.; Min, J.H.; Song, H. An operation strategy of ESS for enhancing the frequency stability of the inverter-based jeju grid. Energies 2022, 15, 3086. [Google Scholar] [CrossRef]
- Chen, J. Influence of photovoltaic power generation on distribution network protection and countermeasures. Master’s Thesis, Shandong University of Technology, Zibo, China, 2014. [Google Scholar]
- Xu, Q. Influence analysis and evaluation of distributed power supply grid-connected on power quality. Master’s Thesis, North China Electric Power University, Beijing, China, 2012. [Google Scholar]
- Tan, T.Y.; Kirchen, S.D. Impact on the power system of a large penetration of photovoltaic generation. In Proceedings of the IEEE Power Engineering Society General Meeting, Tampa, FL, USA, 24–28 June 2007. [Google Scholar]
- Ma, Y.J.; Wei, C.C.; Zhou, X.S. Design of decoupled active disturbance rejection control for grid-connected photovoltaic inverter. Mod. Electron. Technol. 2022, 45, 175–181. [Google Scholar]
- Xue, F.; Li, X.T.; Li, H.Q.; Li, B. Research on Voltage Stability of grid-connected Photovoltaic System Based on Two-sided Voltage Feedback Control Strategy. China Power 2022, 55, 1–9. [Google Scholar]
- Kiaee, M.; Cruden, A.; Infield, D.; Chladek, P. Utilisation of alkaline electrolysers to improve power system frequency stability with a high penetration of wind power. Inst. Eng. Technol. 2014, 8, 529–536. [Google Scholar] [CrossRef]
- Tan, Z.Q.; Wang, Y.K.; Niu, Y.J.; Li, Y.H. Research progress of coal power depth peak regulation and frequency modulation technology under double carbon target. Therm. Energy Power Eng. 2022, 8, 1–8. [Google Scholar]
- Zhang, W.; Wang, R.; Niu, P.; Tian, G. Global research advances in the application of renewable energy electricity to methane. Prog. Chem. Ind. 2022, 8, 1–8. [Google Scholar]
- Baltas, P. The Arizona University Photovoltaic Designer Program. Ph.D. Thesis, Temp Arizona Arizona State University, Tempe, AZ, USA, 1996. [Google Scholar]
- Shi, R.G. Digsilent-Based Adaptation Analysis of Wind Power Access to Baoshan Grid under Asynchronous Interconnection. Master’s Thesis, Kunming University of Technology, Kunming, China, 2018. [Google Scholar]


| No | Number of Photovoltaic Arrays | Power MW | PV Penetration Ratio (without Chemical Storage)% | PV Penetration Ratio (Chemical Storage)% |
|---|---|---|---|---|
| 1 | 5 × 10⁴ | 500 | 10 | 6 |
| 2 | 1 × 10⁵ | 1000 | 20 | 12 |
| 3 | 1.5 × 10⁵ | 1500 | 30 | 18 |
| 4 | 2.0 × 10⁵ | 2000 | 40 | 24 |
| 5 | 2.5 × 10⁵ | 2500 | 50 | 30 |
Disclaimer/Publisher’s Note: The statements, opinions and data contained in all publications are solely those of the individual author(s) and contributor(s) and not of MDPI and/or the editor(s). MDPI and/or the editor(s) disclaim responsibility for any injury to people or property resulting from any ideas, methods, instructions or products referred to in the content. |
© 2023 by the authors. Licensee MDPI, Basel, Switzerland. This article is an open access article distributed under the terms and conditions of the Creative Commons Attribution (CC BY) license (https://creativecommons.org/licenses/by/4.0/).
Share and Cite
Guo, H.; Zheng, S.; Zhang, D.; Gao, P.; Miao, W.; Zuo, Z. Effects on Frequency Stability of Power System for Photovoltaic High-Penetration Ratio Grid-Connected Power Generation. Energies 2023, 16, 1308. https://doi.org/10.3390/en16031308
Guo H, Zheng S, Zhang D, Gao P, Miao W, Zuo Z. Effects on Frequency Stability of Power System for Photovoltaic High-Penetration Ratio Grid-Connected Power Generation. Energies. 2023; 16(3):1308. https://doi.org/10.3390/en16031308
Chicago/Turabian StyleGuo, Hui, Shuai Zheng, Donghai Zhang, Pengfei Gao, Wenzhe Miao, and Zongliang Zuo. 2023. "Effects on Frequency Stability of Power System for Photovoltaic High-Penetration Ratio Grid-Connected Power Generation" Energies 16, no. 3: 1308. https://doi.org/10.3390/en16031308