Article

Technical Performance Comparison between U-Shaped and Deep Borehole Heat Exchangers

Department of Chemical Engineering Materials Environment, Sapienza University of Rome, Via Eudossiana 18, I-00184 Rome, Italy
Energies 2023, 16(3), 1351; https://doi.org/10.3390/en16031351
Submission received: 1 December 2022 / Revised: 23 January 2023 / Accepted: 24 January 2023 / Published: 27 January 2023
(This article belongs to the Section H: Geo-Energy)

Abstract

:
The geothermal industry is fronted by a fundamental decade to grow and become an energy supplier in transitioning to a sustainable energy system. The introduction of Closed-Loop Geothermal energy systems (CLG) can overcome the negative social response and increase the attractiveness of geothermal developments. The present work aims to investigate and compare the performance of CLG systems. For the comparison, the case study of Campi Flegrei was chosen. The maximum depth was fixed at 2000 m, and the two configurations were set up to analyse the performance and evaluate the best operational configuration. Both CLG configurations showed decay in the output temperature of the working fluid during the production time. For a U-shaped design, it is possible to find a working condition that allows constant thermal power over time. The DBHE specific power was always more significant, up to 350 kW/m, compared to the U-shaped, which attained a maximum of 300 W/m (15%). The comparison with Beckers et al. analysis highlights the similarity of our results with their base case. The consideration of the CLG system’s length is related to the heat exchange and investment costs. For longer exchangers, there are higher investments and lower specific power.

1. Introduction

The standard production technology in high- or medium-enthalpy geothermal systems is the withdrawal of the geothermal fluid through wells. The geothermal fluids are salty water; since their properties are unsuitable for terrestrial ecosystems and also for material balance reasons, it is suggested to reinject the brines. Their extraction and reinjection involve some technical and environmental risks: corrosion and fouling of the pipes, pollution of the aquifers, soil subsidence and induced seismicity. Consequently, the investment can become unprofitable when managing brines involve high economic costs. Moreover, the possible environmental impacts and risk of induced seismicity, even at low intensity, can cause a negative social response to geothermal development. Meanwhile, high upfront risk, long lag in income generation and modest returns on investment have exacerbated a negative perception of the geothermal business model. Those aspects with others due to the unsuccessful geothermal development have contributed significantly to reducing the expansion of geothermal energy. [1]. Conversely, closed-loop geothermal energy systems (CLG) solve these problems by circulating the working fluid through a system composed of rock-insulated wells and pipes.
Since 2000, research has focused on geothermal energy production and avoiding brine extraction using CLG as the deep borehole heat exchanger. Budiono et al. [2] reported a substantial growth in papers during the period 2016–2021. This growth is the result of searches for new technologies and technical solutions to increase geothermal applications. CLG energy systems can also produce energy from unproductive or unsuccessful geothermal wells and abandoned oil and gas wells.
Their systematic review studied different CLG configurations, as reported by [2]. Two main types emerged: The first is the concept of a coaxial exchanger, which can be vertical (DBHE) or developed with a horizontal terminal part (DBHEh); and the second is the U-loop scheme, which includes a geometry composed of two pseudo-vertical sections joined by a horizontal branch (ULHE). The DBHE category largely dominates the literature by approximately two-thirds, and the other geometries are more or less equally divided by the remaining third.
ULHE is a geometry under development in the wake of the CLG systems developed by Eavor Technologies, Inc., a Canadian company, targeted to produce both power and heat [3]. The Eavor demonstration project developed in Alberta was designed to make large-scale electricity or heat sufficient to heat approximately 16,000 homes. Eavor is currently carrying out new projects in Europe [4] and the United States with improved technology. Researchers in China developed more significant literature on ULHEs and worked on experimental plants with different designs. The Budiono et al. [2] review concludes by highlighting the main parameters characterising heat extraction, identified as the temperature, heat extraction rate, pressure differential and thermal power. These key parameters are used in our work to compare the two heat exchangers.
In our review, we mainly discuss the DBHE configuration [5], highlighting the aspects to be deepened, including the choice of the heat carrier fluid, the piping materials, the design and the conversion systems. The literature presents extensive work mainly on numerical simulations with different codes and numerical schemes.
Regarding the heat carrier fluid, several studies have focused on using carbon dioxide. Several works demonstrated the difference between water and CO2. Carbon dioxide has a higher heat extraction rate than water because of a lower specific heat capacity [6]. There is also the possibility of adopting nanofluids. The idea is to increase the volumetric heat capacity of the pure fluid. Early results indicate that adding 3% aluminium oxide to water can achieve a 1% increase in heat transfer.
No specific studies on DBHE pipes are available. To improve the heat recovery of DBHE, the internal piping must find a technological solution that obtains good thermal insulation and contains the overall dimensions. On the other hand, the filling material mainly affects the heat exchange with the rocks. Therefore, well completion needs improvement, especially in conventional drilling, with updates on cement material.
Solutions that induce a convective component in the rock system are under study to overcome the limit due to the conductive heat transfer. Starting from the design solutions adopted by different authors and previously presented, the recommendation of a new design in which natural convection takes place can maximise heat transfer and reduce electrical consumption.
In our review, the most critical weakness of the DBHE is the low number of demonstration projects. Two were in Switzerland, one was in Germany, and the eldest was in Hawaii. The latter was an actual demonstration project of the technology developed in Japan. In 2019, GreenFire Energy Inc. conducted a CLG system field demonstration in Coso, California [7,8]. They used a DBHE to extract heat from an existing unproductive geothermal well. GreenFire’s modifications included inserting a Vacuum Insulated Tubing (VIT) string and installing surface equipment. The tested working fluids were water and sCO2.
The ULHE configuration has proven effective in developing geothermal energy [9,10]. Compared to the DBHE, this system has a larger contact area between the working fluid and the geothermal reservoir thanks to the extension of the two vertical and horizontal sections [11,12,13]. Sun et al. [14] investigated how to produce geothermal energy simultaneously for domestic heating and electricity generation with a configuration that included a single injection well, a long horizontal well and several vertical production wells, extracting the fluid with different temperatures. Oldenburg et al. [15] used a detailed coupled tube-tank model to study the effects of various parameters on the energy gain of CO2 flowing into a U-shaped well through a geothermal reservoir. They discovered how complicated it is to gain energy by letting CO2 flow into the tube as a function of the initial temperature, flow rate and tube diameter due to compressibility. Wu et al. [16] used a numerical model to analyse a ULHE configuration and found an influence of temperature and injection speed on output performance. A higher injection temperature did not improve the heat extraction. They also identified a critical point along the vertical ascending branch where the temperature of the fluid was equal to that of the formation. From this point, the liquid began to be cooled by the surrounding rock, suggesting the introduction of an isolation layer. Chong et al. [17] studied a ULHE application. They found that CLG is more energy efficient than an open-loop system, although the energy recovered from the geothermal resource using the closed-loop system was less than that recovered with the equivalent open-loop system. The piping insulation from the surrounding rocks in the rising section offered limited advantages over the surface temperature produced, especially at a low flow rate; the heat losses were even lower at a high flow rate.
The present work aims to compare the two CLG configurations comprehensively. The literature highlights the absence of a realistic comparison that indicates which is more energetically effective and under which operating conditions. Therefore, we decided to use the heat exchange length as a reference parameter and to introduce a concept of exchange efficiency. This choice was motivated by the reflection, considering that the comparisons often presented did not consider the heat exchange length.
We used the Geopipe software developed to study DBHEs and written in C [18,19]. In [18], we presented and discussed the developed software essentially. A version based on the same model has been designed to simulate the flow and heat exchange in the U configuration. In the following, we present the models and the results obtained considering an actual case study built by the Campi Flegrei geothermal system.

2. Materials and Methods

2.1. The DBHE and ULHE Models

The modelling of the two systems for capturing heat from the subsoil is based on a one-dimensional, quasi-stationary model, which assumes that the heat exchange with the rock system takes place in a radial direction by conduction and varies in time. The modelling is similar for the two configurations to ensure efficiency comparisons.
The heat transfer between the ground and the DBHE is evaluated using a semi-analytical approach based on the thermal resistances of the components of the DBHE [18,19] shown in Figure 1. The analytical solution of the Fourier equation of heat transport, given in the classical line heat source theory by Carslaw and Jaeger, is used to model the heat transfer into the ground source, which is assumed to be a purely conductive medium.
Considering the assumption of a purely conductive medium and the rock volume corresponding to significant temperature changes, the Fourier number is assumed to equal one. This assumption ensures sufficient accuracy of the Equation (1) as reported by Morchio et al. [20], indicating values of the Fourier number greater than 0.145 to obtain accuracy within 1% for the expansion series solution.
The thermal resistance of the rocks between the external well casing surface and the undisturbed ground (Rs) accounts for the actual radius of the thermal influence due to the undergoing heat extraction, which grows in time. The thermal resistance is evaluated with the following relationship:
R s = 1 2 π λ s ln ( 2 α s t r w )
where λs is the thermal conductivity of the rock, rw is the external radius of the well, t is the time after the startup, and αs is the rock’s thermal diffusivity.
The conductive thermal resistance of the layered geometry is evaluated through the classical heat transfer theory for cylindrical geometries. The convection coefficients hw,dw and hw,uw within the annulus and in the upward pipe, respectively, are calculated with the classical Dittus–Boelter equation, adopting the same convection coefficient on the outer and inner surface having assumed a fully developed turbulent flow [21]. Both Nusselt and Reynolds numbers are evaluated considering the corresponding hydraulic diameter Dh. The following relation expresses the energy balance of the DBHE:
Q ˙ D B H E = m ˙ w c w ( T w , u w T w , d w )
where Q ˙ D B H E represents the total heat exchanged between the working fluid and the ground. The outlet temperature of the fluid Tw,uw and the fluid temperature profile along the DBHE are evaluated through the following set of equations:
{ m ˙ w c w d T w , d w d z ( z ) = T s ( z ) T w , d w ( z ) R a T w , d w ( z ) T w , u w ( z ) R b m ˙ w c w d T w , u w d z ( z ) = T w , d w ( z ) T w , u w ( z ) R b
where Ra is the thermal resistance between the annular channel and the undisturbed ground temperature, and Rb is the thermal resistance between the annular piping and the upward pipe (Figure 1).
The set of differential equations is solved numerically to find the outlet temperature Tout = Tw,uw(0) as a function of the mass flow rate, mw, and the inlet temperature with the following boundary conditions:
T w , d w ( L = 0 ) = T i n T w , d w ( L ) = T w , u w ( L )
Descending, horizontal and ascending branches form the ULHE (Figure 2). The model considers the conductive heat exchange between the rock mass and the piping, which is regarded as a steel casing with cement to rebuild the thermal conductivity with the formations.
The following relation expresses the energy balance equation of the ULHE:
Q ˙ U l o o p = m ˙ w c w ( T w , o u t T w , i n )
where Q ˙ U l o o p is the total heat exchanged between the working fluid and the ground. The following equation allows us to obtain the temperature profile along the piping and the outlet temperature of the fluid Tw,out.
m ˙ w c w d T w , d w d z ( z ) = T s ( z ) T w ( z ) R a
The numerical solution of the differential equation allows us to find the outlet temperature Tw,out as a function of the mass flow rate, mw, and the following boundary condition gives the inlet temperature:
T w , d w ( L = 0 ) = T i n
We developed the computational code for both models in C language. The software considers a layered-rock system with different thermo-physical properties, geometry and geothermal gradient for each section. Morchio et al. [20,22] have developed an exciting transient model with a clear improvement for the early period (100 h) with a more improved model of the heat transfer in the ground. The present model evaluates efficiency over a very long working time. The accuracy related to the used model for heat transfer in the rock system is sufficiently adequate for our target. Its performance has been tested by comparing the results with the Hawaii test held in 1992 [23], giving satisfactory accuracy. Those results will be presented in future work.

2.2. The Case Study: Campi Flegrei Volcanic District

The Campi Flegrei area is a caldera with a 12 km radius and a horseshoe shape, and it is in the NW limit of the gulf of Naples, Italy (Figure 3a). The area is part of the Neapolitan volcanoes district, including Ischia Island and Somma-Vesuvius volcano.
This area was well known for thermal manifestations (hot springs, fumaroles, gas emissions) and used for thermal bathing. Between 1930 and 1980, the volcanic district was studied with exploration campaigns by different Italian energy companies (SAFEN, ENEL, AGIP) and scientific research. Twenty-six wells have been drilled in the area, reaching a maximum depth of 3046 m. The investigations found fluids with temperatures greater than 100 °C at relatively shallow depths in Campi Flegrei [24] (Figure 3b).
A hot and saline geothermal system with a high geothermal gradient (100 ÷ 170 °C/km) is present in the subsoil of Campi Flegrei. A small magma sill was supposed to be at a depth lower than 3–4 km [25,26]. The most significant magmatic source is 8–10 km deep with a thickness of almost 1 km and the same diameter as the caldera [27]. The fluids circulate very slowly at a depth greater than 3–4 km, and the heat transfer is due to conduction. In the shallower layers (0–2 km), advective transport takes place because of the high permeability due to the fracturing system. According to [28], the research investigations on the volcanic district of Campania have demonstrated the essential contribution of fluid advection to reach the thermal state of shallow crust in the area. Different authors [29,30,31,32] simulated the hydrothermal system of Campi Flegrei, demonstrating the influence of fluid injection at the bottom of the shallow layers (3–4 km), causing the bradyseism of the area.
Based on previous works in the same area [19,33], the evaluation of the technical performances of a DBHE and a ULHE configuration in the Mofete area, according to the measured data of the AGIP campaign, was conducted.

2.3. Case Study Data

The model of the geothermal system considers five different layers of volcanic rocks whose properties are taken from the literature [31,32,34,35]. The ground temperature at the surface is assumed to equal 15 °C, corresponding to the average yearly temperature.
The geometry of the two configurations uses the same size for the final drilling and casing diameters of the well, assumed to equal 12″ ¾ and 9″ 58, respectively. Cement fills the annular gap between the casing and the wellbore wall.
The double hull pipe forming the DBHE has an external steel tubing diameter of 7″ and an internal steel tubing diameter of 3″ ½. The gap between the two tubings is under vacuum. This configuration is known commercially as Vacuum Insulated Tubing (VIT). Table 1 reports the sizes of the drill bit (wb) and the piping of the casing and tubing for the two configurations (Figure 1 and Figure 2). Table 2 reports the thermal conductivity of the materials forming the VIT and the cement.
Table 3 illustrates the input parameters of the simulation with the computational code valid for both configurations of the ground heat exchanger. Water is the selected working fluid, and the flow rate ranges from 1 to 20 m3/h.
The underground model is a layered system following the main stratigraphy formed by the five layers and derived by [34,35]. The hypothesis of parallel homogenous isotropic layers is assumed. Table 4 reports the thermos-physical parameters of the rock layers used in the simulation for both the DBHE and ULHE configurations as reported in [31]. The values of specific heat and thermal conductivity based on the literature [34] are assumed to equal 1000 J/kg K and 2.1 W/m K, respectively. The geothermal gradient is 150 °C/km with a temperature of approximately 300 °C at a depth of 2000 m.

2.4. Experimental Matrix

We fix some parameters to compare the performance of the underground heat exchangers in the DBHE and the ULHE configurations. First, the exchange length is fundamental for an objective comparison in terms of efficiency. Therefore, we fix the total length of the heat exchange. As a consequence, the ULHE configuration is less deep than the DBHE. This aspect is also related to the distance occurring between the two wells. To analyse its effect, different configurations depending on the ratio between the depth and well distance, R, are considered. The experimental matrix parameters are the fluid flow rate and the ratio R. Instead, the maximum depth is 2000 m. The fixed geometry allows the same drilling cost and all related issues.
A flow rate range between 1 m3/h to 20 m3/h was defined in previous works as the most favourable condition for the DBHE configuration. Concerning the ULHE configuration, we chose a ratio R equal to 0.5, 1 and 4.5 (Figure 4). The rationale for this choice was to compare arrangements that emphasise the length of the horizontal or vertical branches. To relate the two configurations at the same maximum depth, we consider a ULHE configuration with a depth of 2000 m and a ratio R of 10. The total length of the heat exchange in this case is 4200 m, which is 210% longer compared to the 2000 m of the DBHE.
After the startup, the software at different times saves the simulation results. Those selected times are ten days, one month, three months, six months, one year, three years, five years, eight years and ten years.

3. Results

3.1. DBHE Performance Analysis

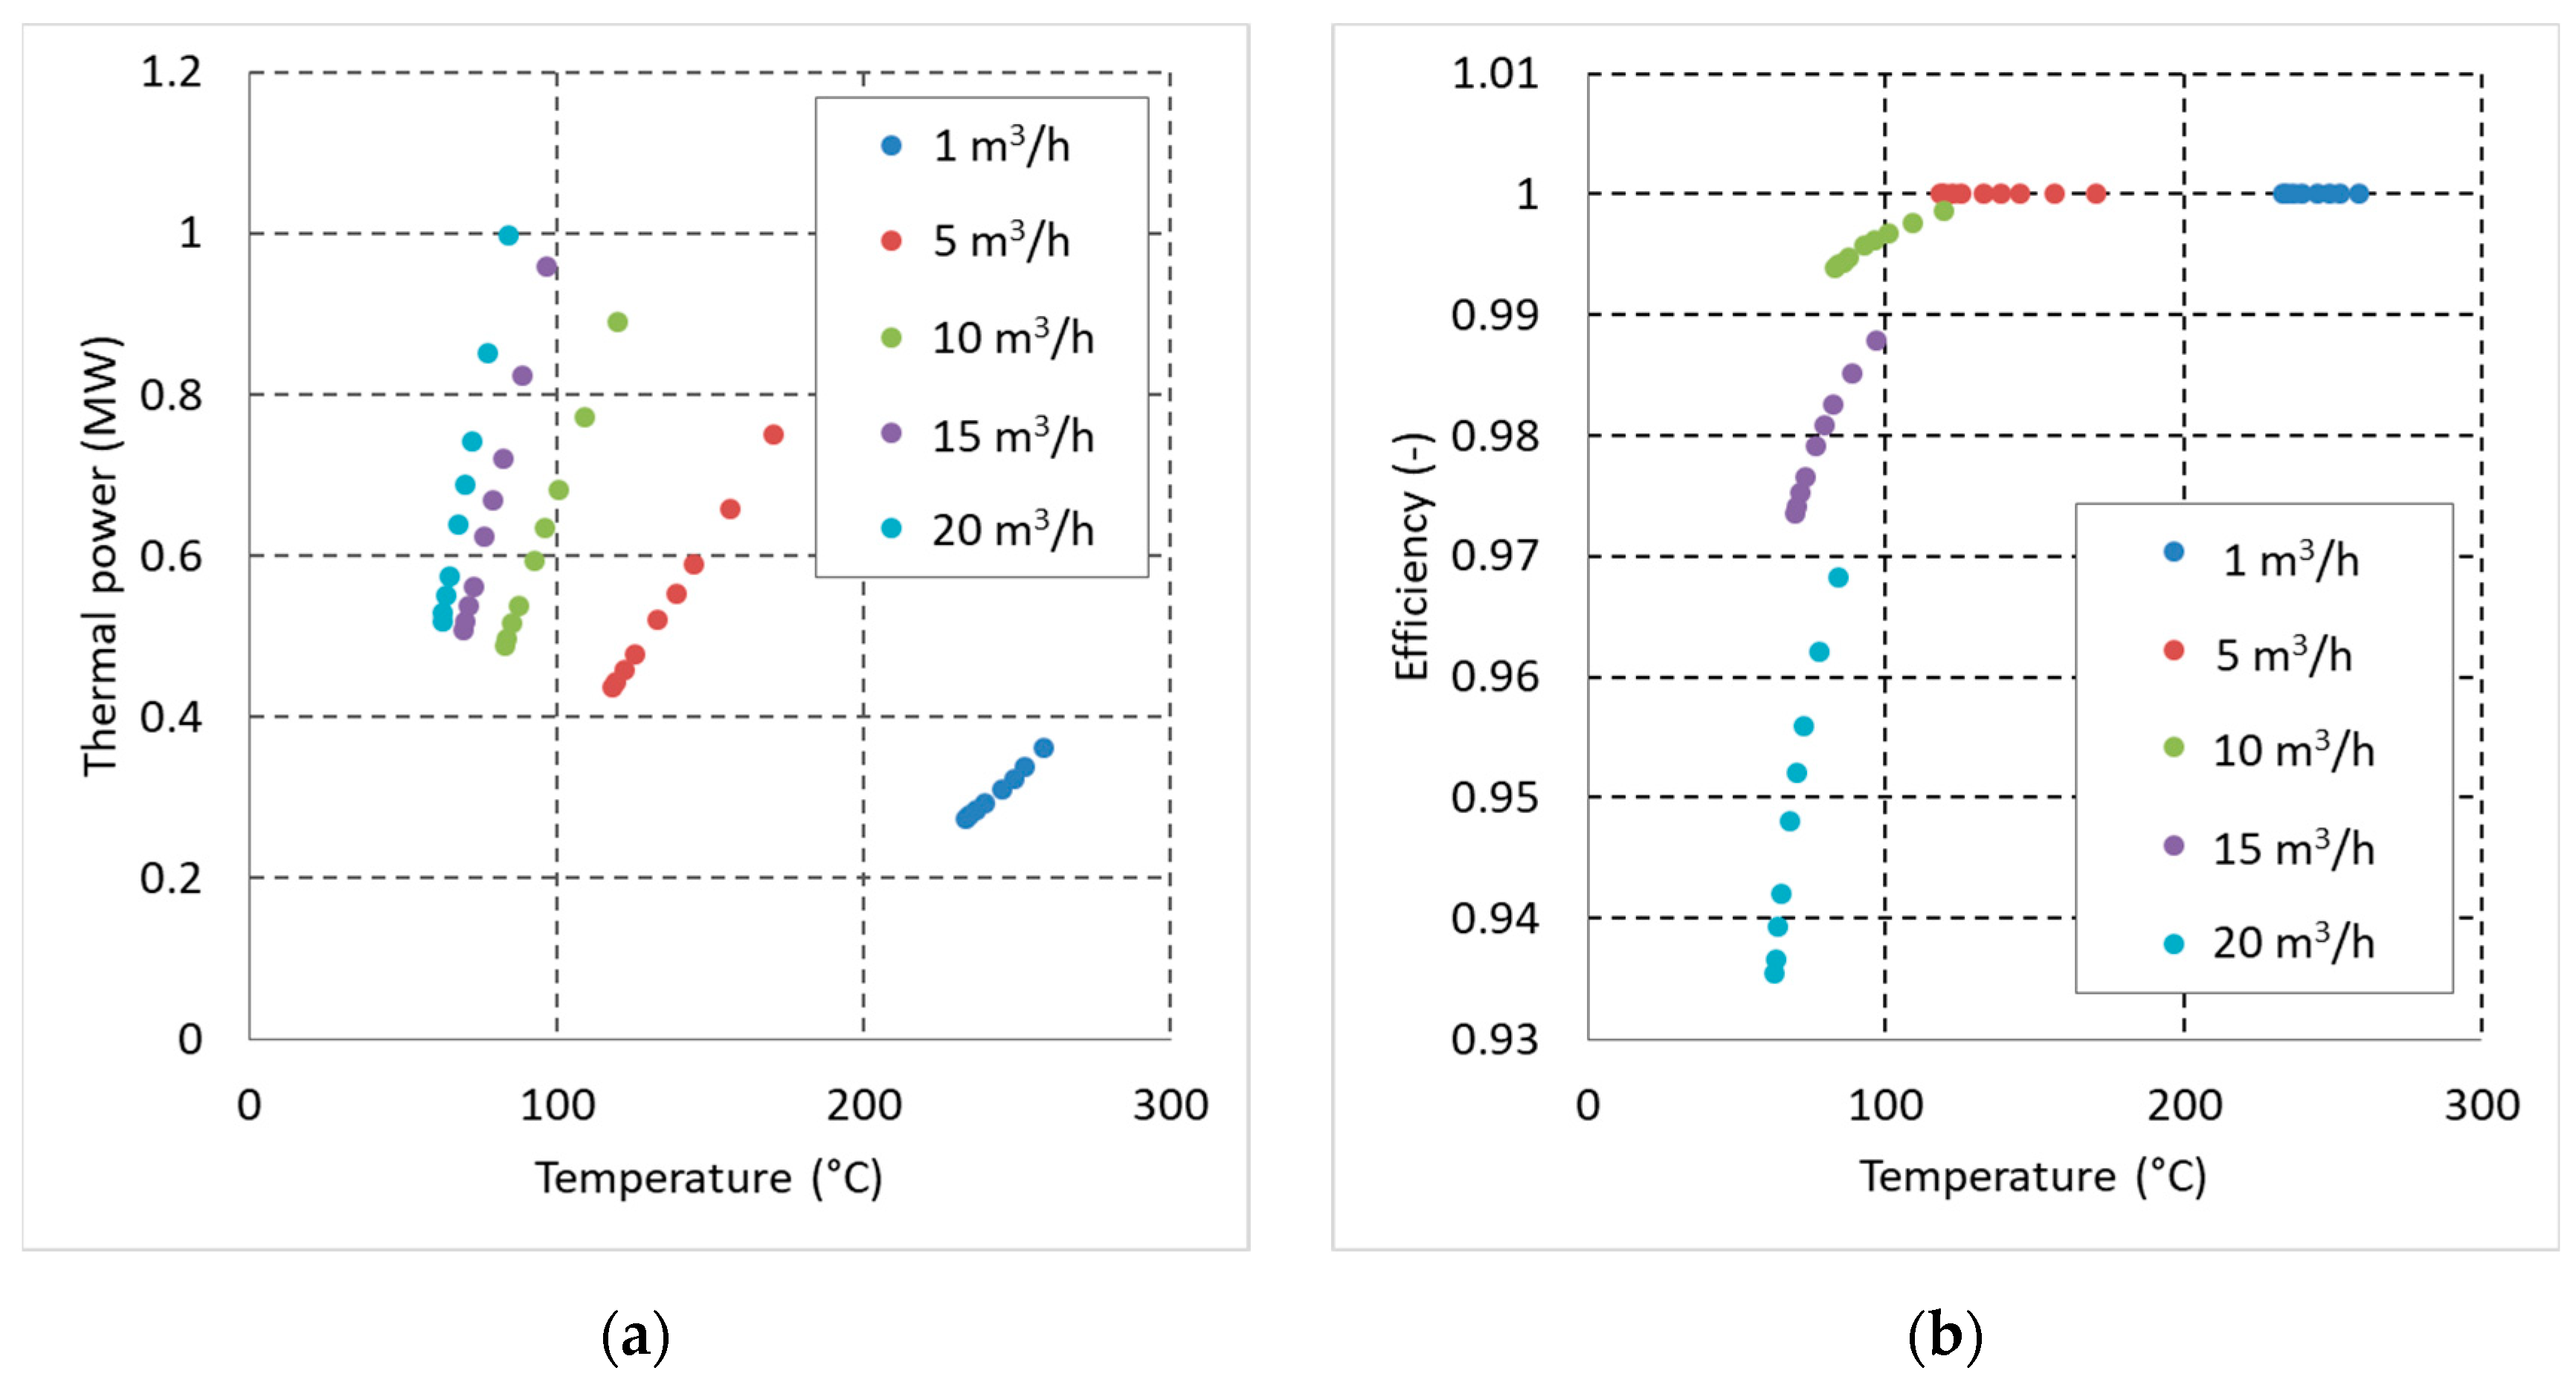
The two independent variables for the DBHE are the flow rate of the working fluid and the time. The well-known behaviour for a fixed flow rate is the performance reduction due to the cooling of the surrounding rocks and the absence of a heat recharge. As also stated in other studies [36], at a fixed time, the higher the flow rate, the lower the outlet temperature. The thermal power increases with a more significant flow rate. The limits are the low temperature at the outlet and the need for energy for pumping due to friction losses. To summarise this behaviour, Figure 5a presents the current calculation results for the DBHE. For each flow rate, the dots refer to a simulation time after the startup. The points with higher temperature and thermal power are at a short-term time. The points move downward as time increases, indicating the production of a fluid with lower temperature and thermal energy.
The other fundamental aspect is the energy efficiency of the system. Figure 5b shows the energy efficiency behaviour calculated as the ratio between the power required to lift the working fluid and the extracted thermal power. Low flow rates require no pumping power due to the thermosiphon effect. For a higher flow rate, the efficiency decreases. The dots depend on the time for the same flow rate, as discussed previously and indicated by the arrow.
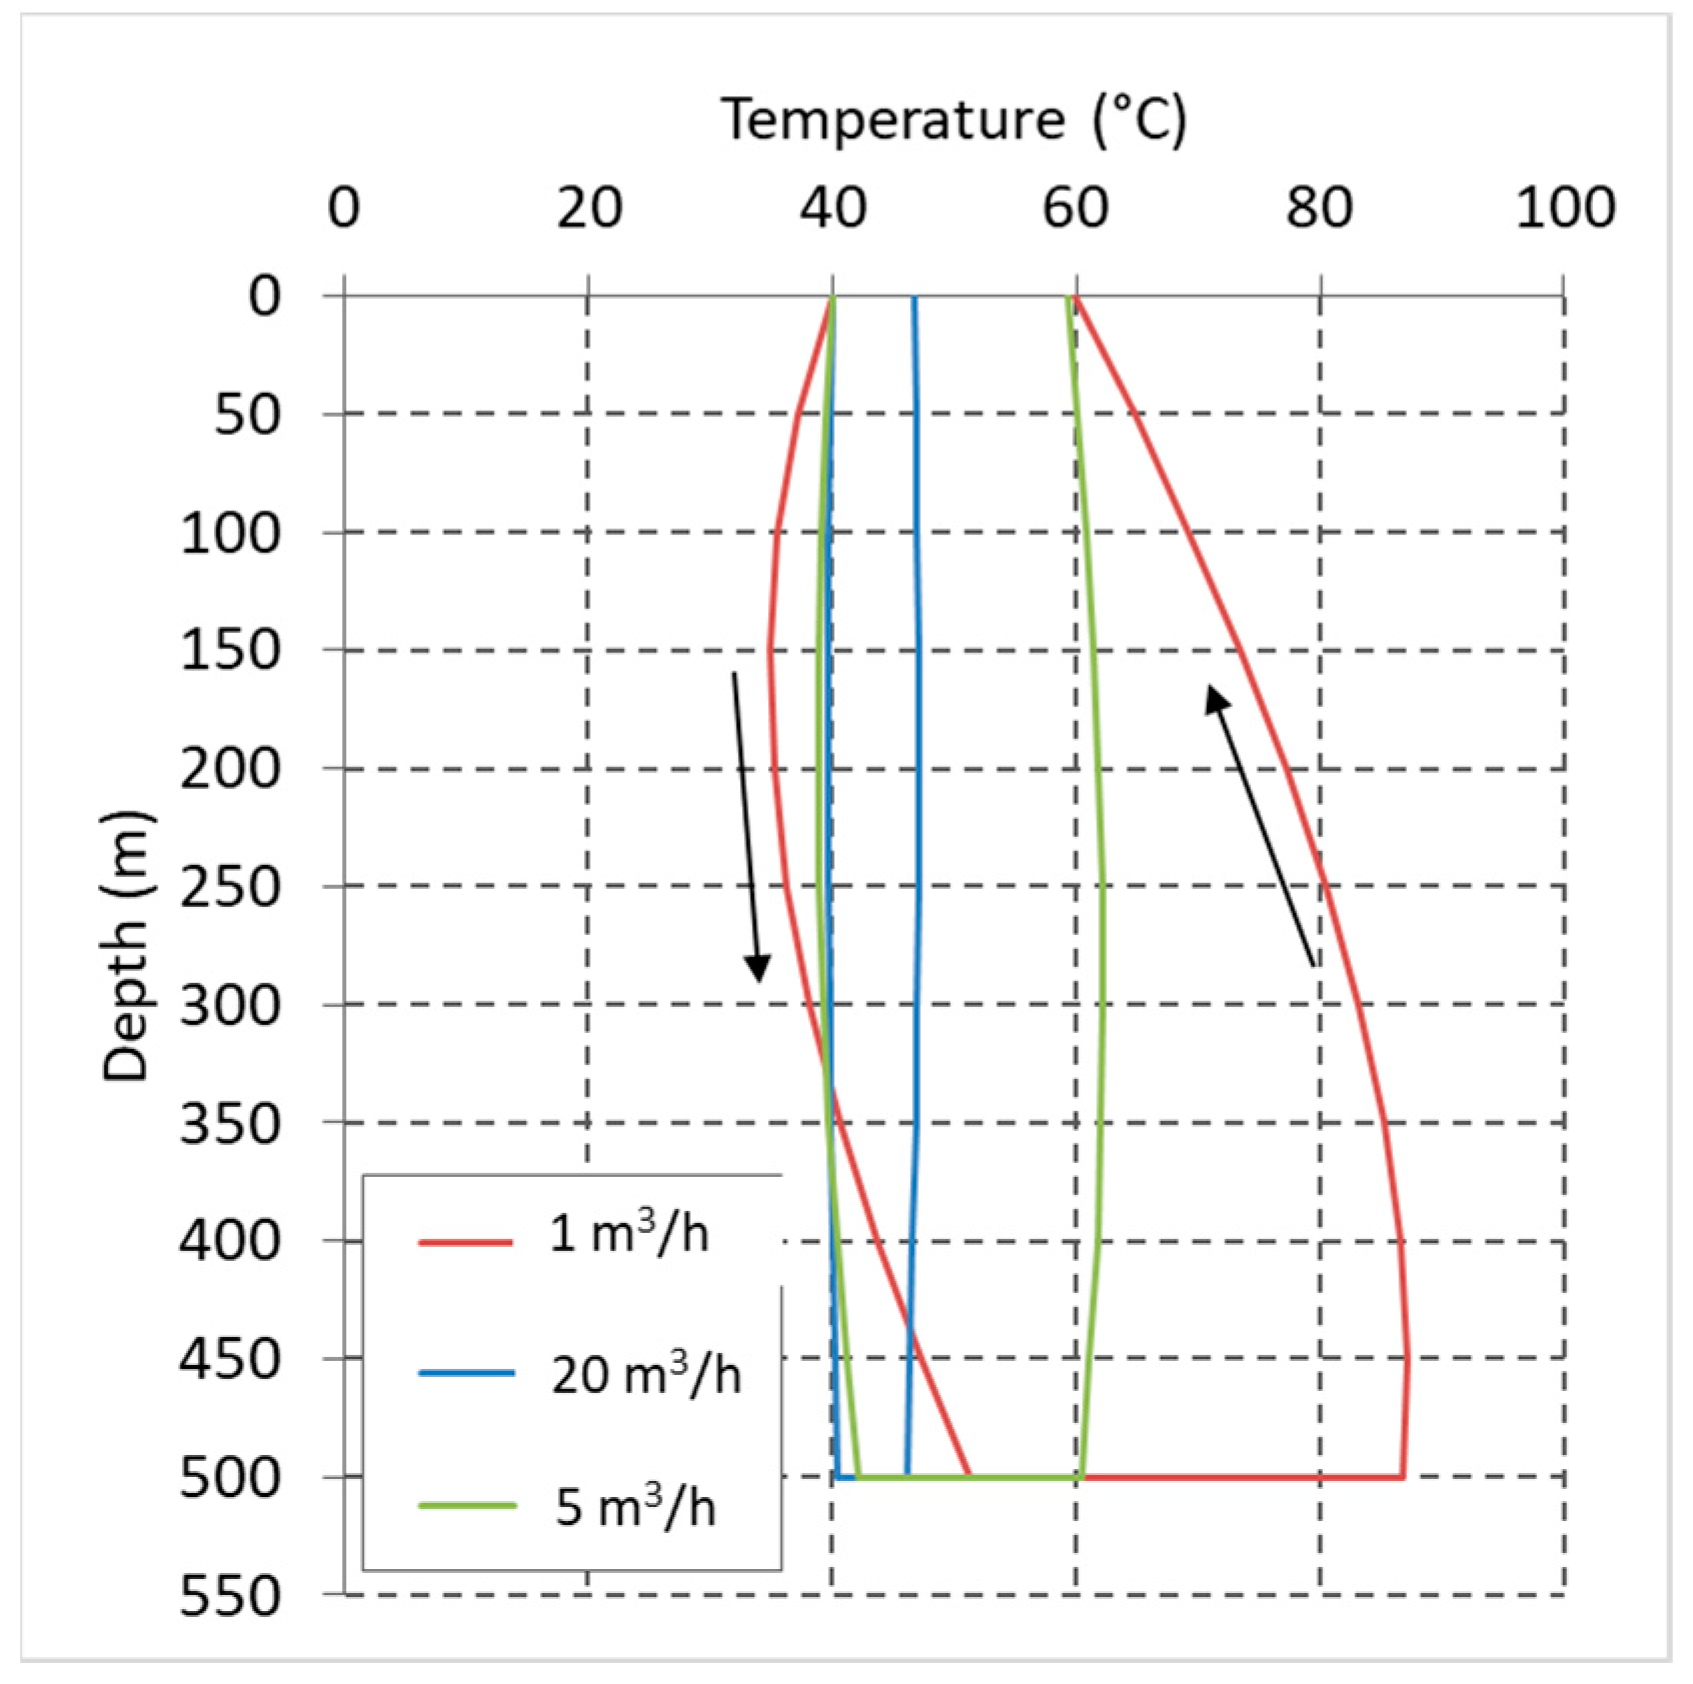
Figure 6 shows the temperature profile for three different flow rates after one year from startup to highlight the behaviour. The temperature in the return piping remains near constant for the insulation of the pipe. Increasing the flow rate reduces the temperature due to the lower residence time of the working fluid in contact with the surrounding formations.

3.2. ULHE Performance

The ULHE configuration presents a different behaviour compared to the DBHE. The first element that influences the performance of this exchanger configuration is the ratio between the depth and the distance between the two wells. The base case to highlight the capabilities is the configuration with the ratio R equal to 0.5.
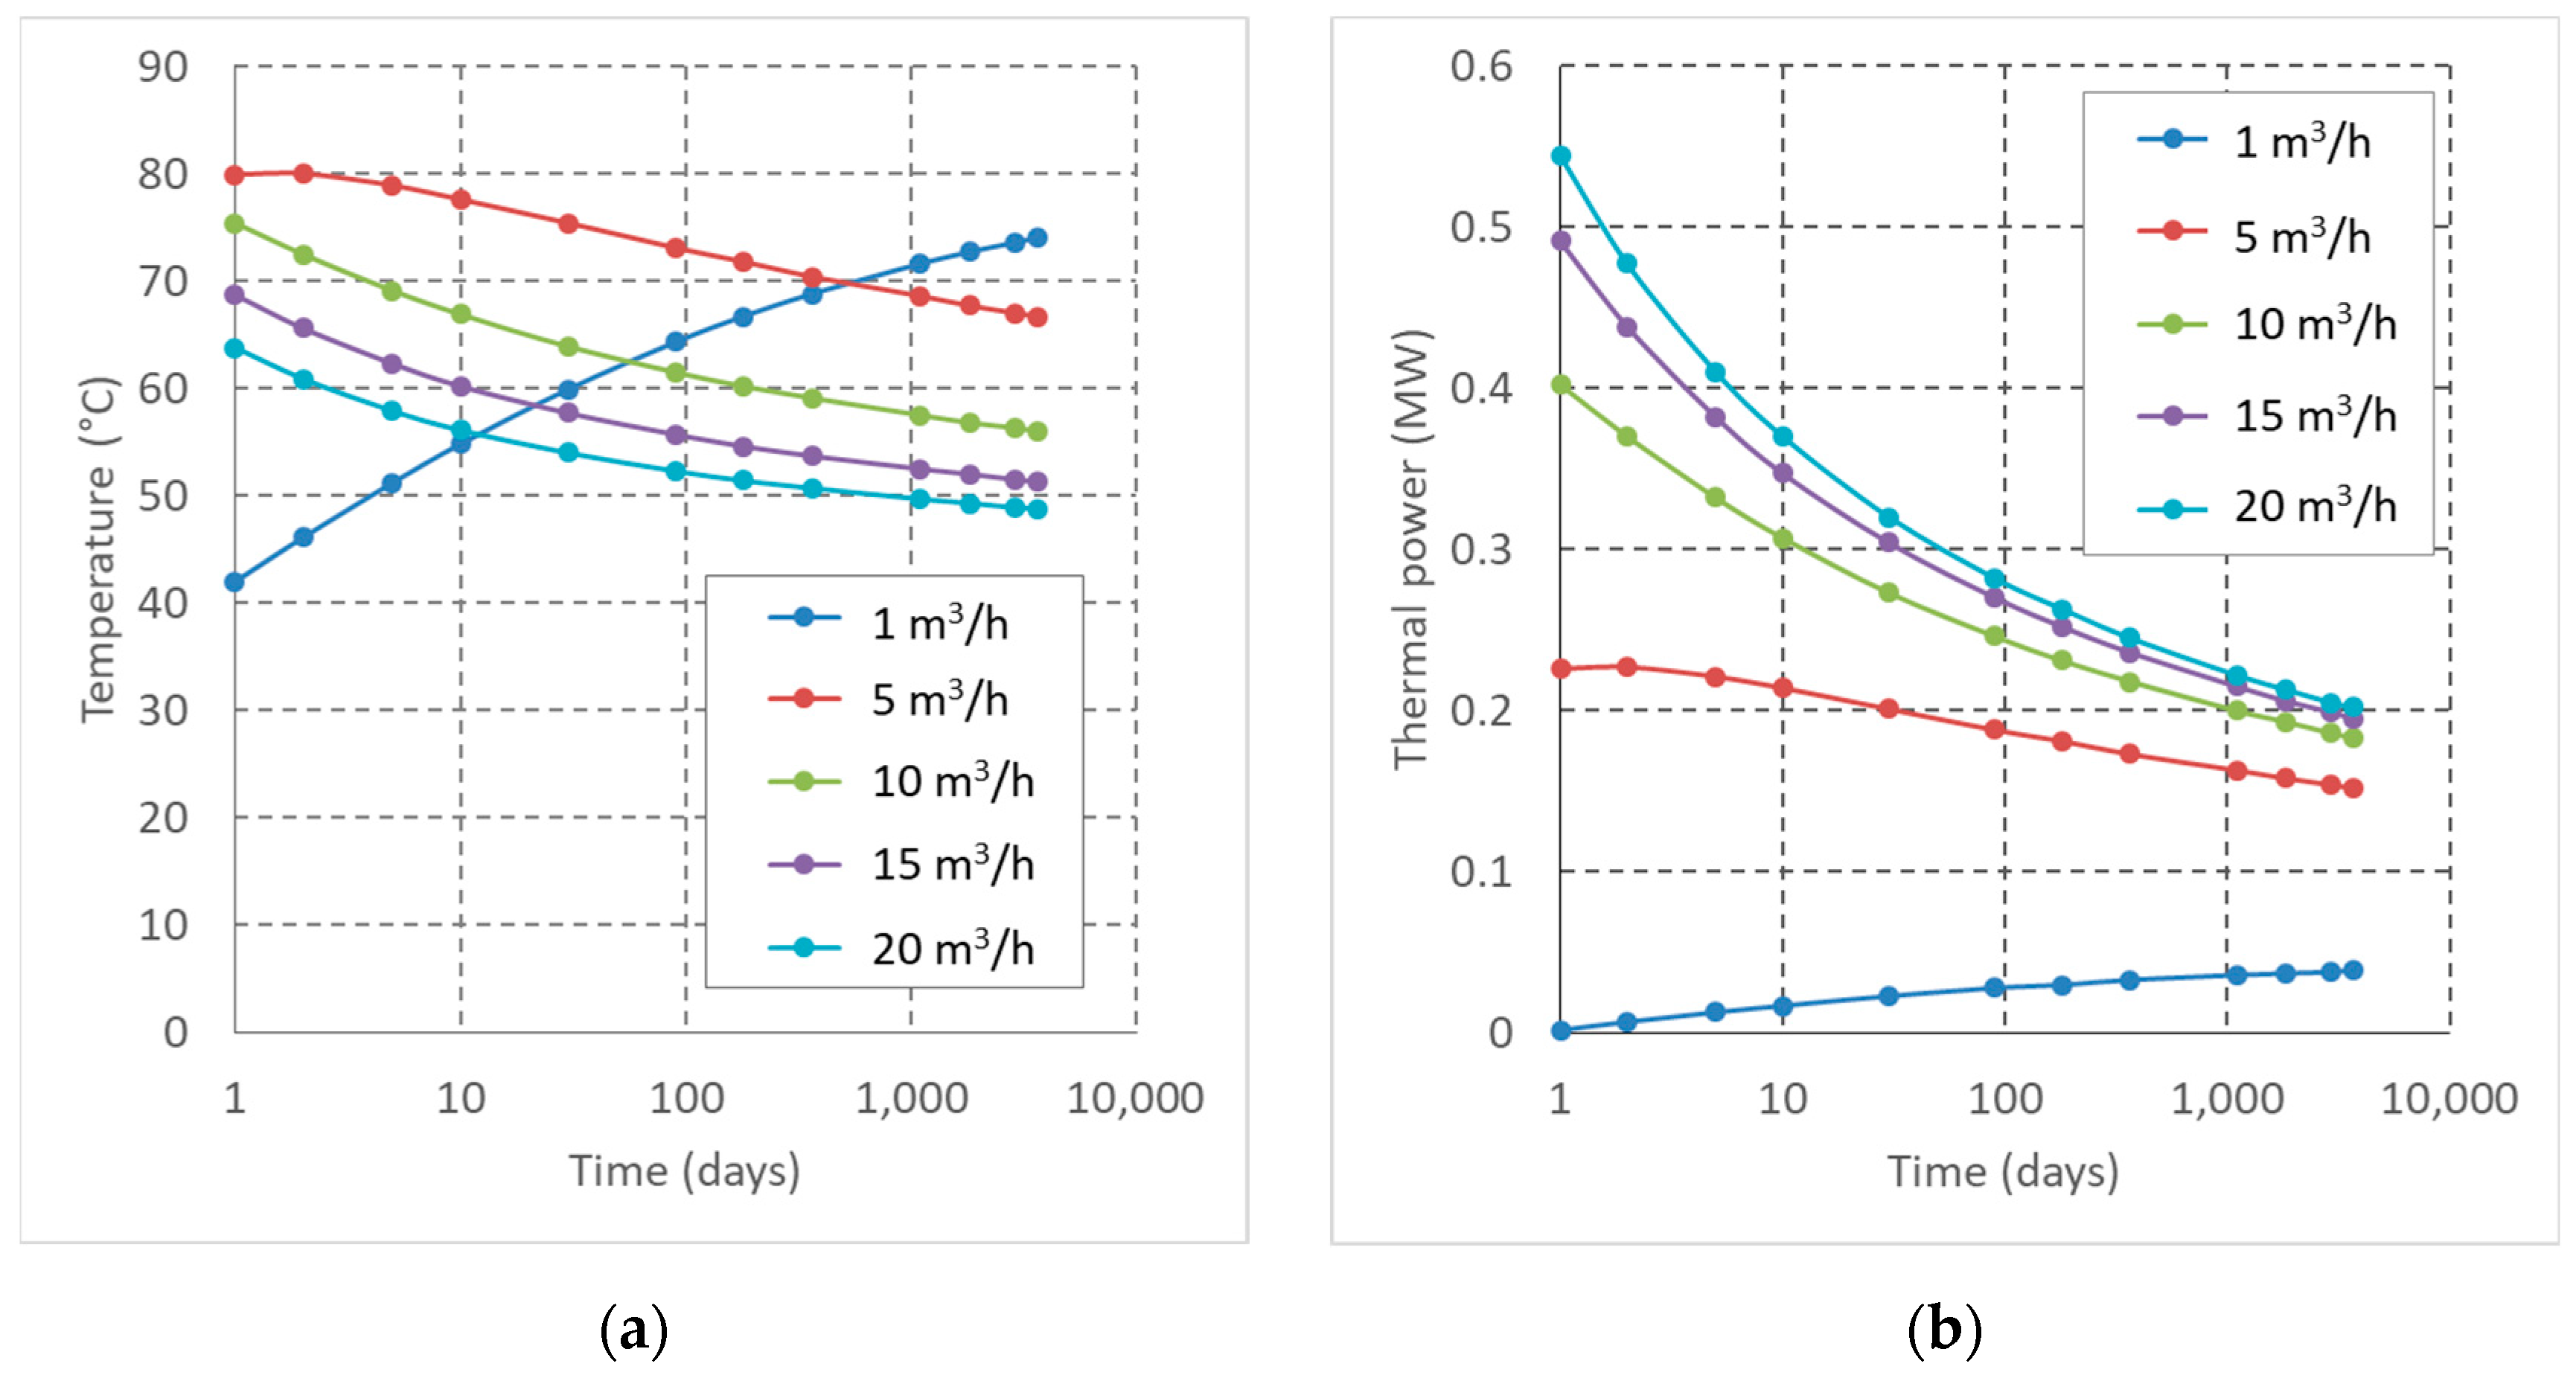
Figure 7 shows the minor temperature change over time (max 25 °C). The more significant influence is due to the flow rate. For a minimal flow rate, the outlet temperature increases over time. With a bigger flow rate, the trend shows a temperature growth that decreases over time. This effect is due to the longer residence time in the piping, the heating in the return well and the reduction in heat losses over time. Figure 8 shows the temperature profile for three different flow rates after one year to highlight the behaviour. The outlet temperature for the lower flow rate is the same as for a higher flow rate due to the cool down along the return vertical branch.
A consistent flow rate ensures a constant outlet temperature independent of the time. In terms of thermal power, this allows us to obtain steady thermal power in time. The efficiency, as previously defined, is always equal to one, indicating no pumping power is required for the studied range of flow rates. Figure 9 shows the trend in the plane temperature–thermal power for different flow rates. The points for a single flow rate are aligned over a straight line with a slope proportional to the flow rate. The arrow indicates the direction of the time increase. Pay attention to the reverse path for low and higher flow rates.
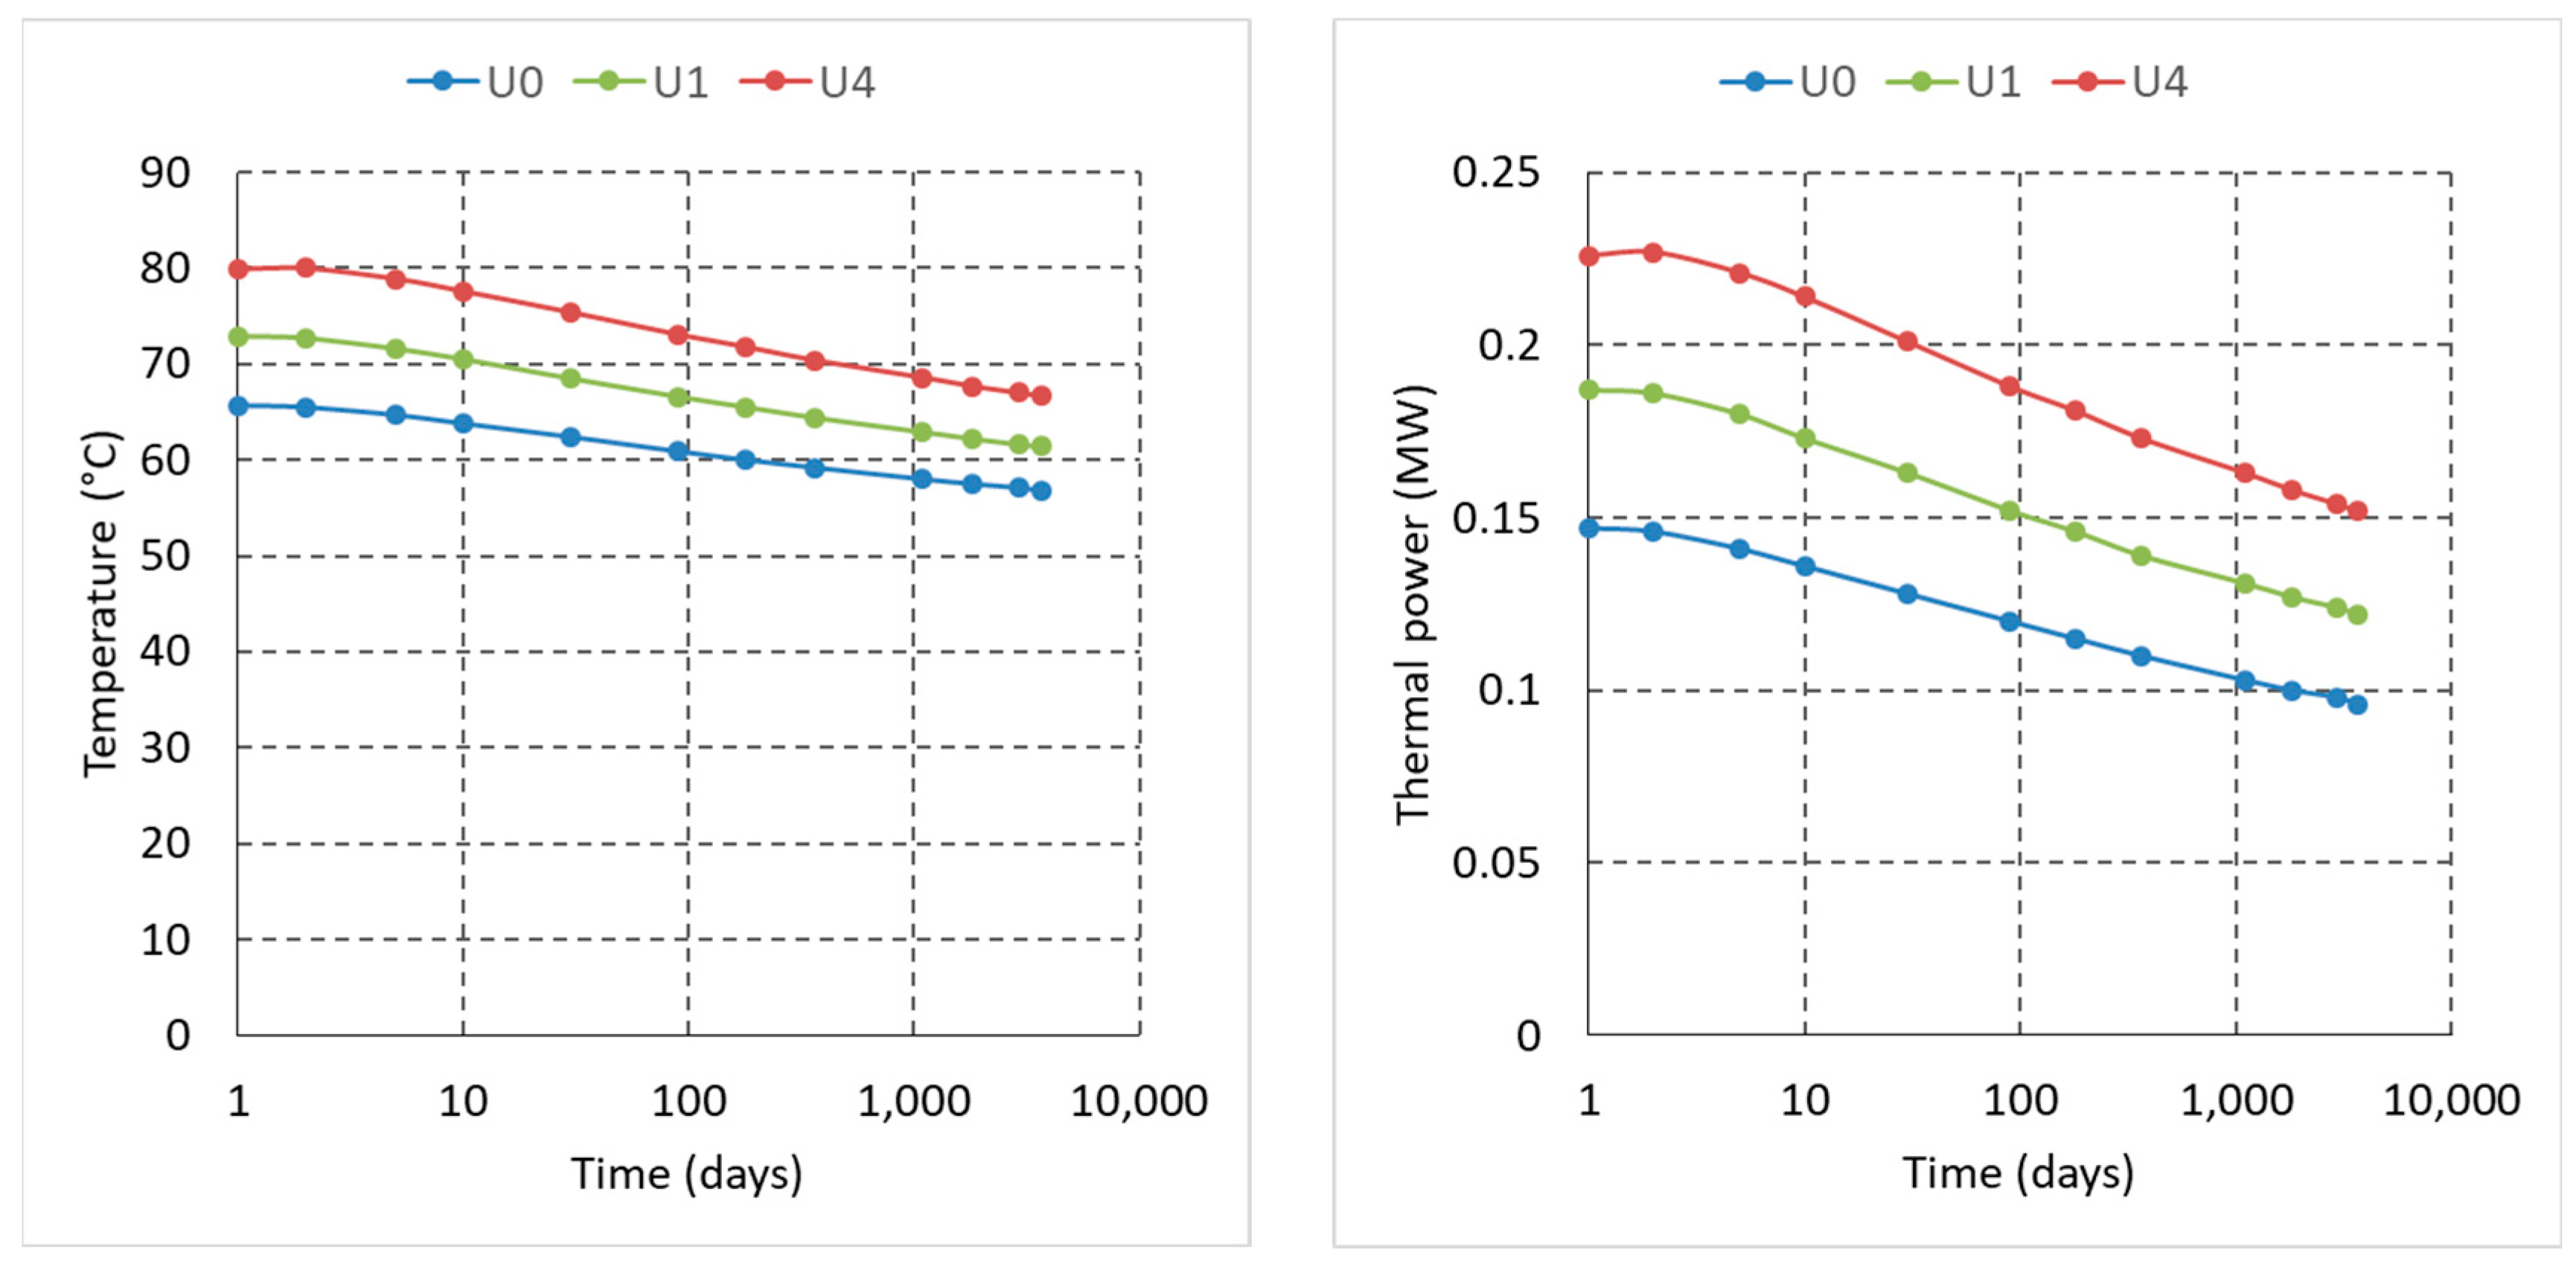
Figure 10 compares the different configurations with the same total length of exchange. For the fixed flow rate of 5 m3/h, the temperature and the thermal power increase with the increase in the ratio R.
This effect is due to the increased depth and reduced distance between the vertical branches. The curves are near to parallel between them.
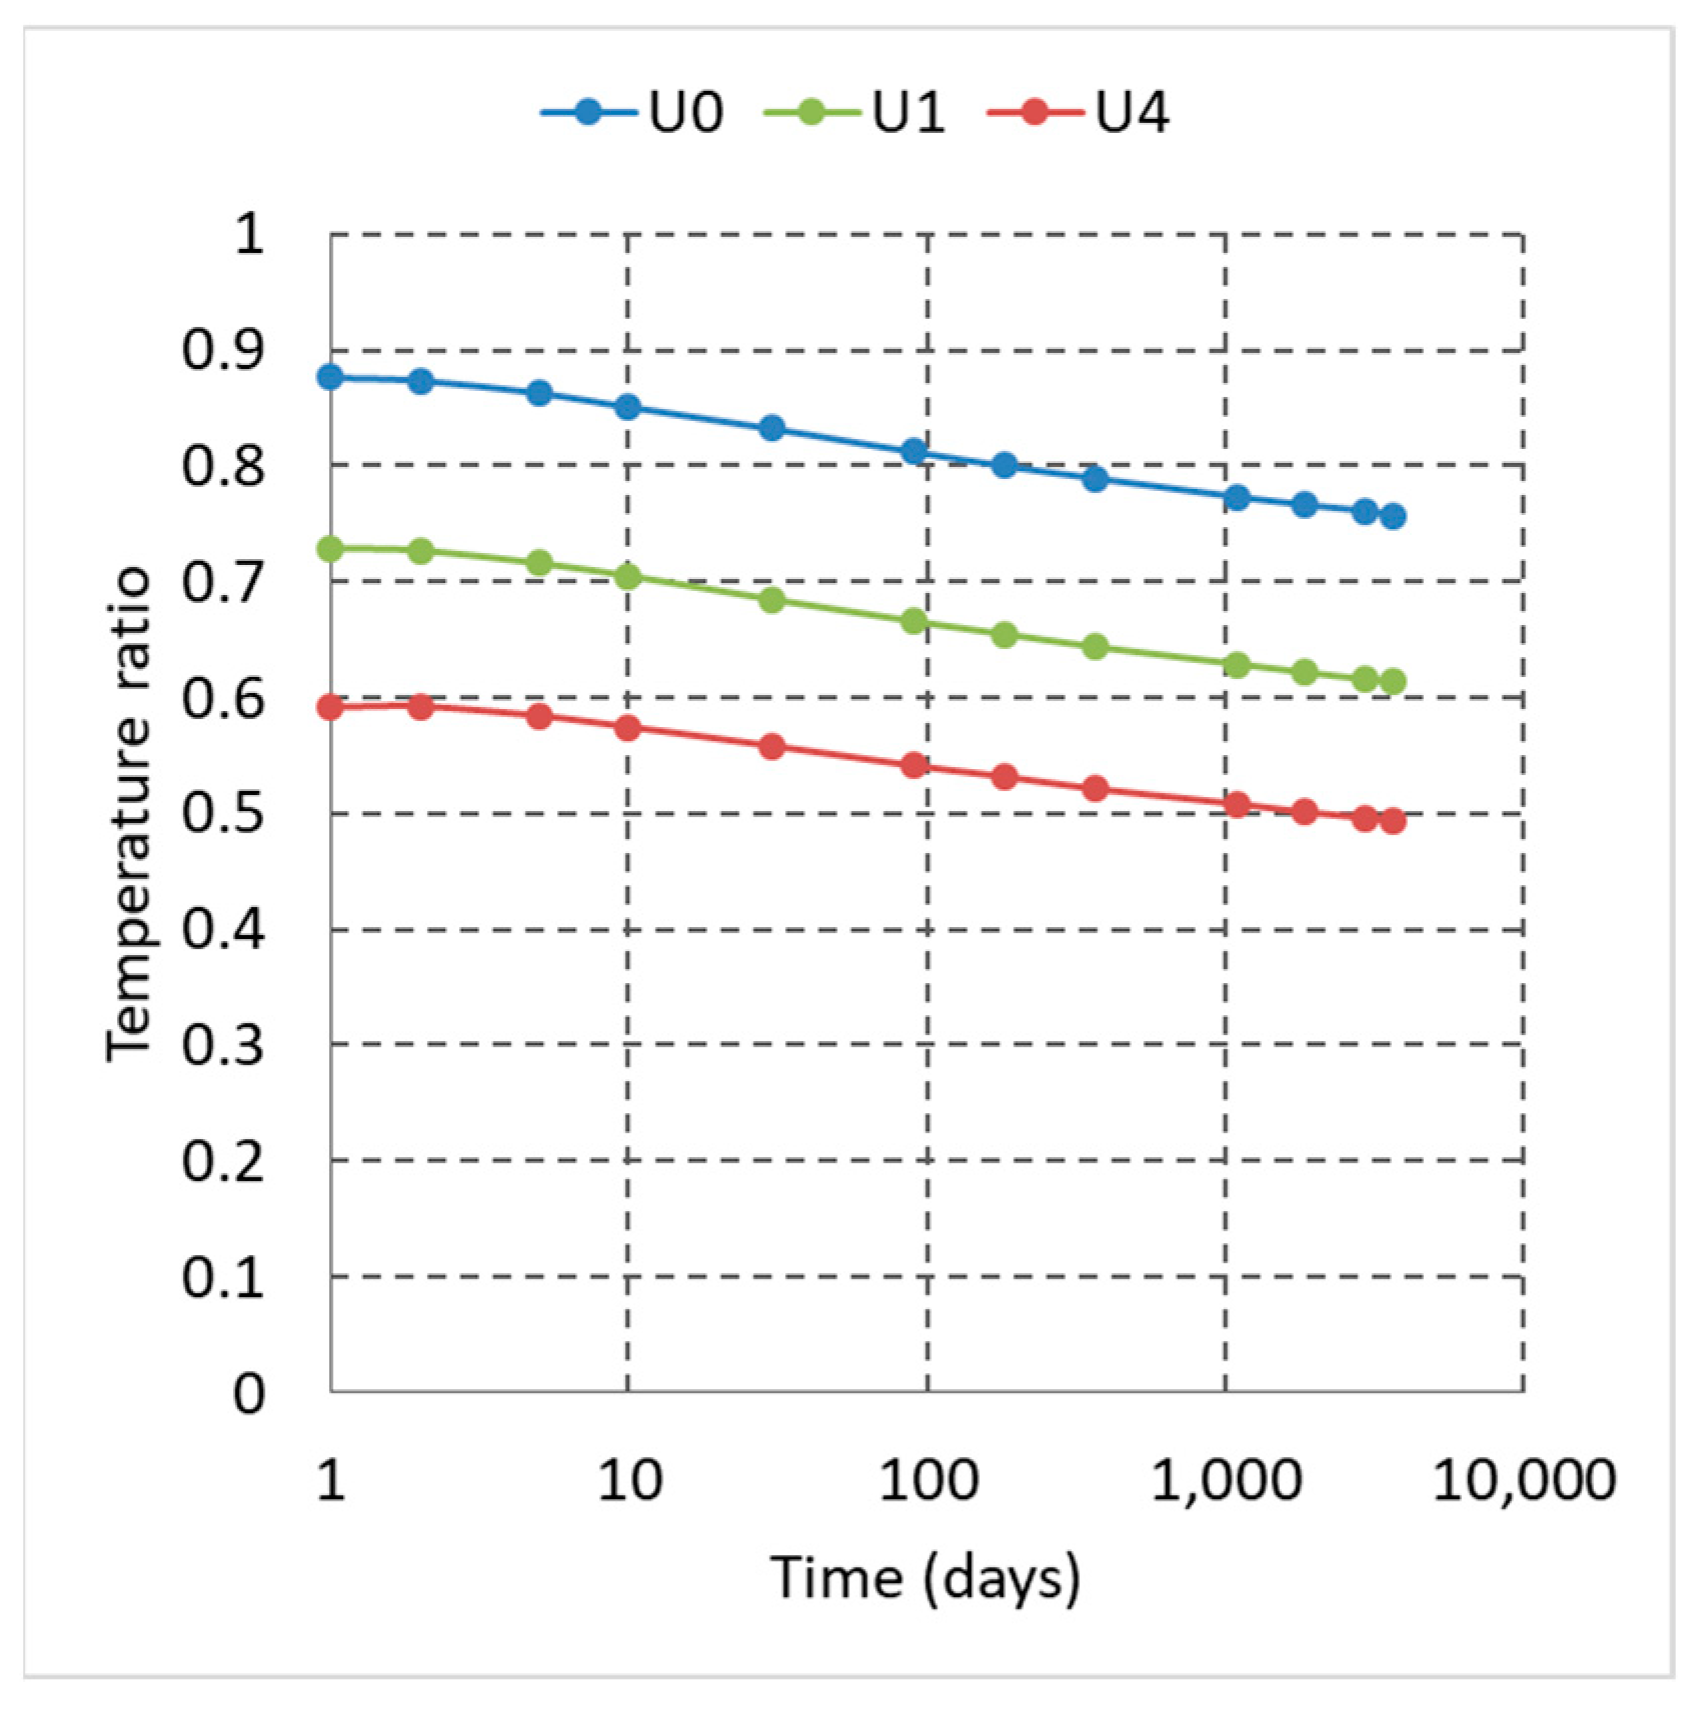
To evaluate the efficiency of the heat exchange, we adopt the ratio between the outlet and bottom-hole temperatures. Figure 11 presents the temperature ratio evolution for a constant flow rate of 5 m3/h. The higher the R ratio, the lower the temperature ratio, giving a less efficient exchange. In conclusion, the better configurations are the ones with a low R ratio where the horizontal branch dominates.

4. Discussion

The DBHE and the ULHE configurations are two possible alternative solutions to extract heat from the underground without fluid extraction and pressure disturbance. The question is: which is more efficient?
The carried-out comparison fixes critical points, such as the exchange length and the maximum depth. Considering a given depth, the contact area of the ULHE is greater than the DBHE, and when setting a fixed extension of the exchanger, the depth attained with the ULHE will be less than the DBHE. The ULHE also depends on the ratio R that determines the extension of the horizontal branch and the fixed depth attained with the exchanger, as discussed in the previous paragraph.
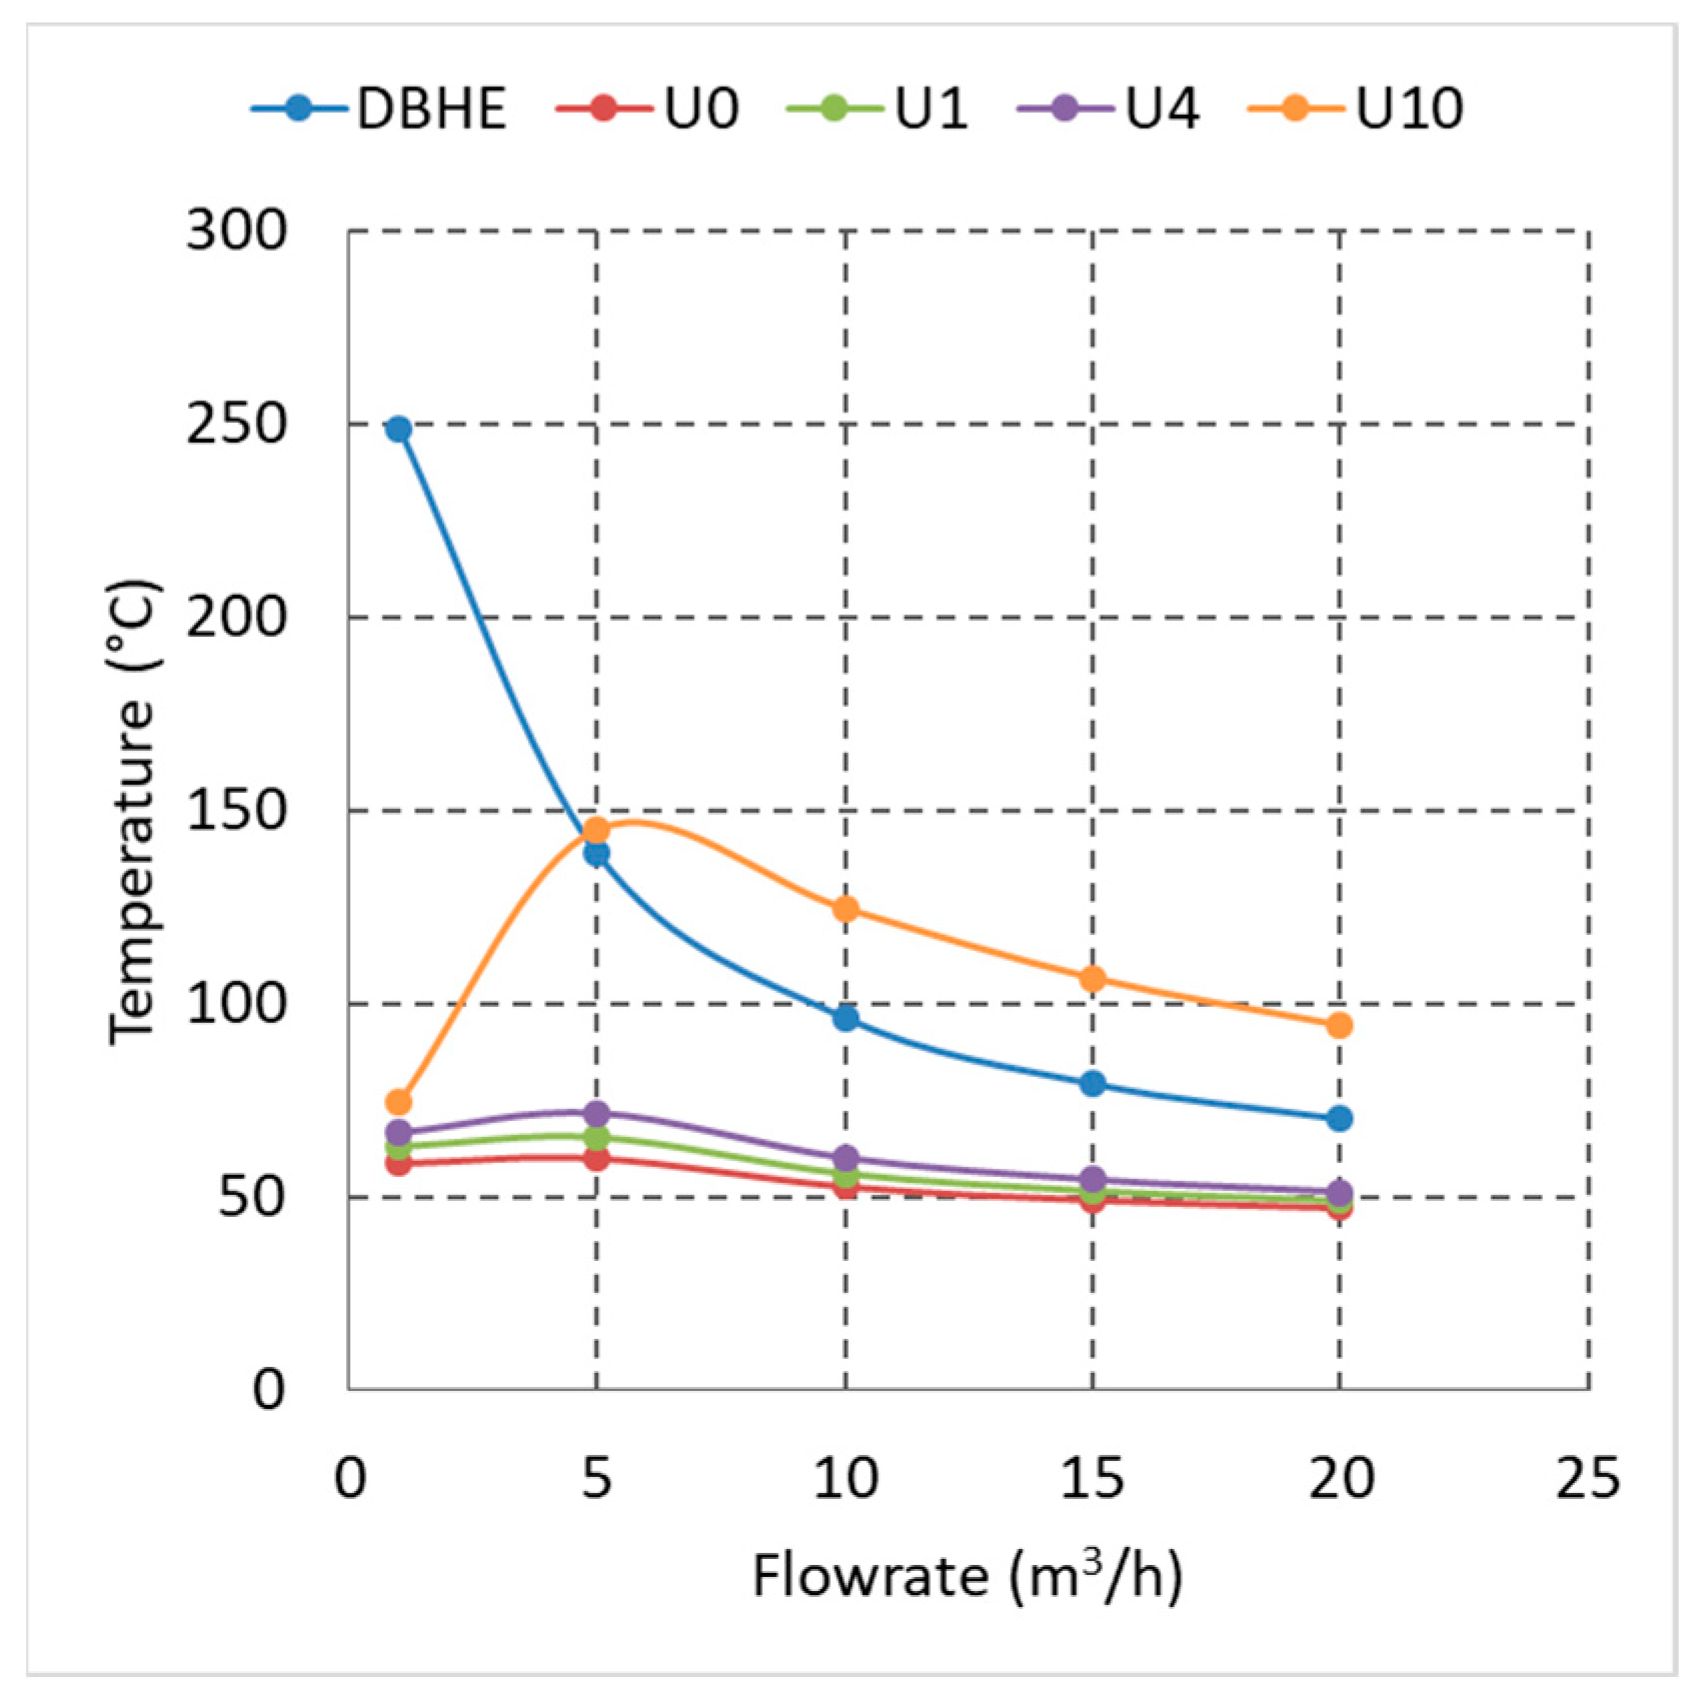
The comparison between the two analysed configurations refers to the results after six months from the startup. Figure 12 shows the evolution of the outlet temperature with increasing flow rate; the different behaviour highlights a continuous temperature decrease for the DBHE and a pseudo-constant value for the ULHE (U0, U1, U4). Considering the same exchange length, the DBHE produces a higher temperature than the ULHE. This result is due to the higher depth and, thus, higher temperature attained with the DBHE. Moreover, comparing the ULHE configuration (U10) achieving the same depth as the DBHE, the observed behaviour is different. The DBHE presents a lower exit temperature for a more significant part of the flow rates. This lower temperature is related to the larger well contact area as reported by Beckers et al. [36].
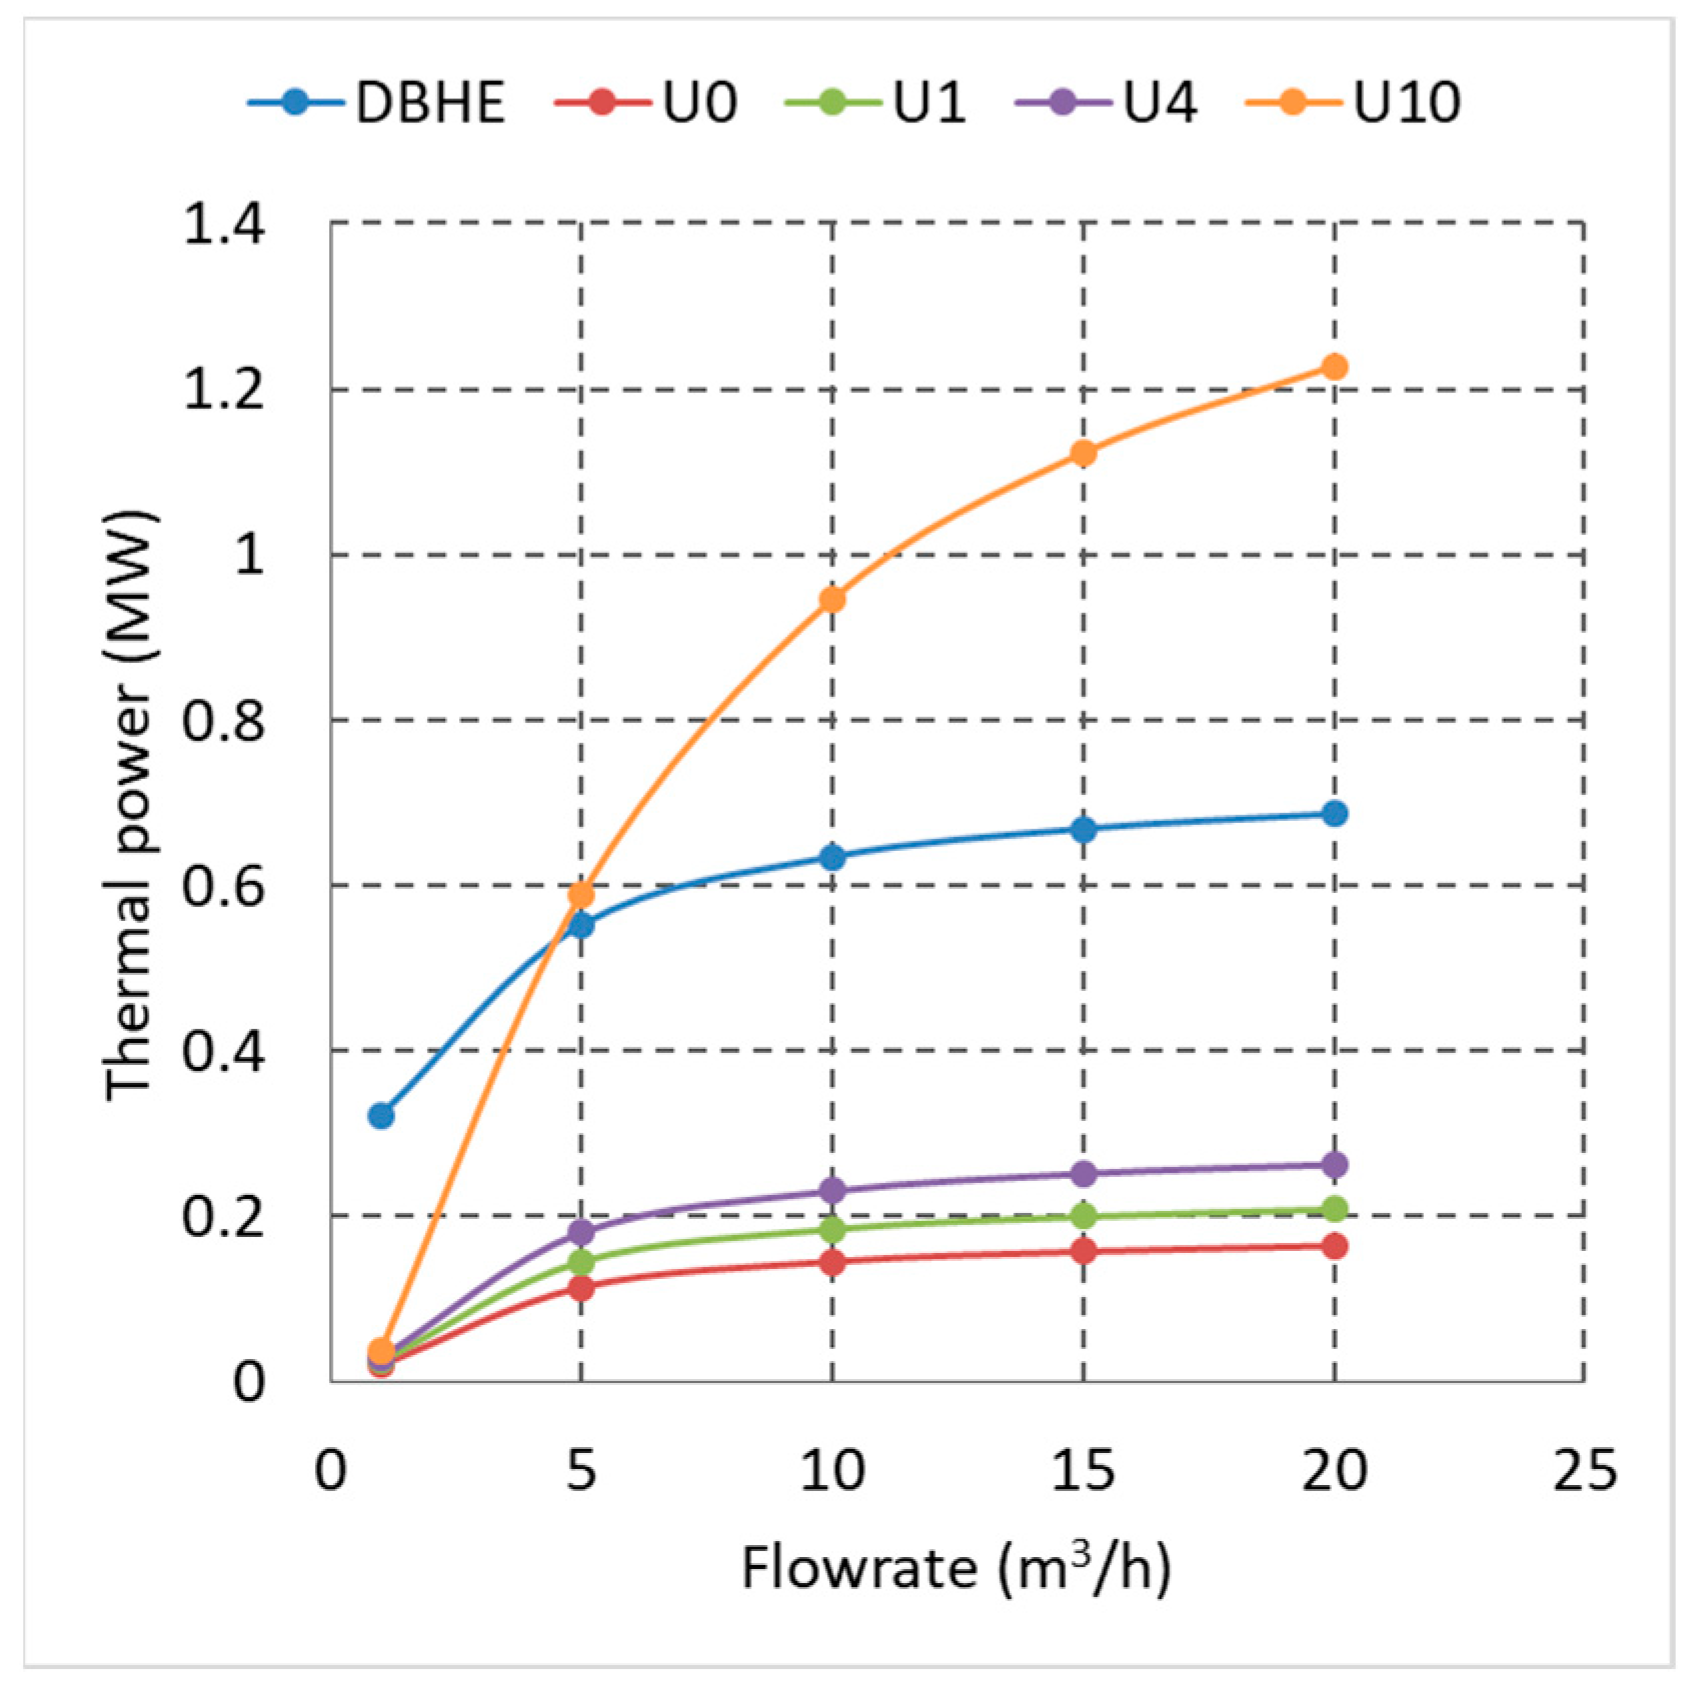
Analysing the producible thermal power, the DBHE presents a higher value, approximately 0.5 MW, compared to the configurations U0, U1 and U4 of the ULHE (Figure 13). Only the extended design U10, attaining the same depth as the DBHE, gives higher thermal power of up to 1.2 MW with a temperature of 94.5 °C. The DBHE maximum thermal power is approximately 0.7 MW with an outlet temperature of 70 °C. Matching conditions between the two configurations are near a flow rate of 5 m3/h: the outlet temperature is 140 °C, the thermal power is close to 0.6 MW for both designs, and there is no additional pumping power.
Beckers et al. [36] assumed a base with a reservoir temperature range of 150–300 °C at a depth of 2 km. Their condition fits our case study with a depth of 2 km and a reservoir temperature of 300 °C. Table 5 shows the results ten years after startup. The most crucial difference is the flow rate. In our study, we adopted a low flow rate compared to the base case in [36]. Other differences influencing the results are the more significant thermal conductivity (34.7%) and density (29.5%). In any case, the results are similar.
In the DBHE configuration, the results meet our expectations. In the ULHE configuration, the presence of a double horizontal branch of 2 km length that increases the heat extraction influences the comparison. Thus, the temperatures are very similar, but the geometrical configuration and higher flow rate affect heat production.
Considering the specific power per unit of the exchange length, the DBHE performs better than the ULHE (Figure 14). The specific power for the DBHE is between 150 and 350 W/m, and for the analysed ULHE configurations is less than 150 W/m. Only the configuration U10 attains a maximum of 300 W/m but is always below the DBHE values (approximately 15%).
The comparison with Beckers et al. [36] in terms of the specific power highlights similar results (Table 6). For the DBHE, the specific power is 1.8 times larger in [33] than in our calculation. This difference is due to the greater flow rate, which is clear from the general trend in Figure 14. The ULHE configuration has a similar result. The specific power assumes values almost identical in each case study.
This result also has drawbacks on the investment costs expressed per unit of thermal power produced. Beckers et al. [36] have highlighted that the overall costs heavily depend on drilling costs. The longer the length of drilling, the higher the costs. Another issue considered for the ULHE configuration is the need to add the costs for moving the drilling rig to the second well location.

5. Conclusions

The present work investigates the efficiency of the two main types of CLG systems. The objective is to highlight the main characteristics and differences and to compare them to identify which is more efficient. A specific application case study was used for the comparison. The more promising geothermal environment is the volcanic one. For this reason, Campi Flegrei was selected. The system is dominated mainly by conductive heat transmission with low permeability formation and fluids.
The DBHE and ULHE configurations were set up to analyse the behaviour and evaluate the best design for a maximum depth of 2000 m.
Both configurations of the CLG systems present a dependency on time, showing the decay of the exit temperature of the working fluid along with production time. For the DBHE, this decay is more important than for the ULHE configuration. For the ULHE configuration, it is possible to find an operating condition that allows having constant thermal power over time, becoming a great advantage over the DBHE. A controller is required to adapt the flow rate of a DBHE to have continuous thermal production across time.
The flow rate is the second key parameter for these CLG systems. Also, in this case, the DBHE has a higher dependency on the flow rate. This dependency is due to the system’s geometry, which has a smaller flow area than the ULHE. For a low flow rate, the ULHE cannot heat the working fluid due to the low velocity, and the fluid in the production well becomes in equilibrium with the surrounding formations. On the contrary, the DBHE, having the isolated inner tube, allows for a higher outlet temperature. At a high flow rate, the behaviour is similar, and the ULHE presents a higher temperature due to the longer extension of the exchange area. This behaviour suggests the adoption of an insulated casing in the production well to increase the performance of the ULHE.
The specific power produced is used to evaluate the efficiency of the two CLG systems. Considering this parameter, the DBHE results are always more efficient, having a value of up to 350 W/m instead of 150 kW/m for the same exchanger length. This consideration of CLG system length is also relative to investment costs. For longer exchangers, there are higher investment costs and lower specific power. This case corresponds to the configuration U10 with a specific power of 300 kW/m, always inferior to the DBHE. A possible reduction in costs can be the reuse of existing wells. In this case, the ULHE configuration requires drilling only the “horizontal” branch to keep communication between the two wells. If the DBHE configuration is adopted for both wells, no additional costs for drilling are required, and the installed power is the same as that produced with the ULHE. Figure 11 highlights that at 10 m3/h, the ULHE allows thermal power close to 1 MW, and the DBHE for a single well has 0.6 MW. Thus, with two DBHEs, 1.2 MW of thermal power is available without additional drilling costs.

Funding

This research received no external funding.

Data Availability Statement

No new data were created or analyzed in this study. Data sharing is not applicable to this article.

Conflicts of Interest

The author declares no conflict of interest.

References

  1. Scherer, J.; Higgins, B.; Muir JAmaya, A. Closed-Loop Geothermal Demonstration Project. Consultant Report; Publication Number: CEC-300-2020-007; California Energy Commission: Sacramento, CA, USA, 2020.
  2. Budiono, A.; Suyitno, S.; Rosyadi, I.; Faishal, A.; Ilyas, A.X. A Systematic Review of the Design and Heat Transfer Performance of Enhanced Closed-Loop Geothermal Systems. Energies 2022, 15, 742. [Google Scholar] [CrossRef]
  3. Eavor Technologies Inc. Available online: https://www.eavor.com/press-releases/the-worlds-first-truly-scalable-form-of-green-baseload-power-demonstrated-by-eavor-technologies-inc/ (accessed on 30 November 2022).
  4. Longfield, S.; Schwarz, B.; Hodder, M.; Stuebing, T.; Holmes, M.; Vany, J.; Mölk, D. Eavor Loop™ Commercial Project at Geretsried, Molasse Basin, Germany. In Proceedings of the European Geothermal Congress, Berlin, Germany, 17–21 October 2022. [Google Scholar]
  5. Alimonti, C.; Soldo, E.; Bocchetti, D.; Berardi, D. The wellbore heat exchangers: A technical review. Renew. Energy 2018, 123, 353–381. [Google Scholar] [CrossRef]
  6. Sun, X.; Liao, Y.; Wang, Z.; Sun, B. Geothermal exploitation by circulating supercritical CO2 in a closed horizontal wellbore. Fuel 2019, 254, 115566. [Google Scholar] [CrossRef]
  7. Amaya, A.; Scherer, J.; Muir, J.; Patel, M.; Higgins, B. GreenFire Energy Closed-Loop Geothermal Demonstration using Supercritical Carbon Dioxide as Working Fluid. In Proceedings of the 45th Workshop on Geothermal Reservoir Engineering, Stanford University, Stanford, CA, USA, 10–12 February 2020. [Google Scholar]
  8. Higgins, B.; Muir, J.; Scherer, J.; Amaya, A. GreenFire Energy Closed-Loop Geothermal Demonstration at the Coso Geothermal Field. Geotherm. Resour. Counc. Trans. 2019, 43, 436–448. [Google Scholar]
  9. Schulz, S.U. Investigations on the Improvement of the Energy Output of a Closed Loop Geothermal System (CLGS). Ph.D. Thesis, Technische Universität Berlin, Berlin, Germany, 2008. [Google Scholar]
  10. Song, X.; Shi, Y.; Gensheng, L.; Shen, Z.; Xiaodong, H.; Lyu, Z.; Zheng, R.; Wang, G. Numerical analysis of the heat production performance of a closed loop geothermal system. Renew. Energy 2018, 120, 365–378. [Google Scholar] [CrossRef]
  11. Sun, F.; Yao, Y.; Li, G.; Li, X. Performance of geothermal energy extraction in a horizontal well by using CO2 as the working fluid. Energy Convers. Manag. 2018, 171, 1529–1539. [Google Scholar] [CrossRef]
  12. Sun, F.; Yao, Y.; Li, G.; Li, X. Geothermal energy extraction in CO2-rich basin using abandoned horizontal wells. Energy 2018, 158, 760–773. [Google Scholar] [CrossRef]
  13. Haitang, Y.; Li, Q.; Sun, F. Numerical simulation of CO2 circulating in a retrofitted geothermal well. J. Pet. Sci. Eng. 2019, 172, 217–227. [Google Scholar] [CrossRef]
  14. Sun, F.; Yao, Y.; Li, G. Literature review on a U-shaped closed loop geothermal energy development system. Energy Sources Part A Recovery Util. Environ. Eff. 2020, 42, 2794–2806. [Google Scholar] [CrossRef]
  15. Oldenburg, C.M.; Pan, L.; Muir, M.P.; Eastman, A.D.; Higgins, B.S. Numerical Simulation of Critical Factors Controlling Heat Extraction from Geothermal Systems Using a Closed-Loop Heat Exchange Method. In Proceedings of the 41st Workshop on Geothermal Reservoir Engineering, Stanford University, Stanford, CA, USA, 22–24 February 2016. [Google Scholar]
  16. Wu, B.; Ma, T.; Feng, G.; Chen, Z.; Xi, Z. An Approximate Solution for Predicting the Heat Extraction and Preventing Heat loss from a Closed-Loop Geothermal Reservoir. Geofluids 2017, 17, 2041072. [Google Scholar] [CrossRef] [Green Version]
  17. Chong, Q.; Wang, J.; Gates, I.D. Evaluation of closed-loop U-Tube deep borehole heat exchanger in the Basal Cambrian Sandstone formation, Alberta, Canada. Geotherm. Energy 2022, 10, 21. [Google Scholar] [CrossRef]
  18. Alimonti, C.; Soldo, E. Study of geothermal power generation from a very deep oil well with a wellbore heat exchanger. Renew. Energy 2016, 86, 292–301. [Google Scholar] [CrossRef]
  19. Alimonti, C.; Conti, P.; Soldo, E. Producing geothermal energy with a deep borehole heat exchanger: Exergy optimisation of different applications and preliminary design criteria. Energy 2021, 220, 119679. [Google Scholar] [CrossRef]
  20. Morchio, S.; Fossa, M. Thermal modeling of deep borehole heat exchangers for geothermal applications in densely populated urban areas. Therm. Sci. Eng. Prog. 2019, 13, 100363. [Google Scholar] [CrossRef]
  21. Lavine, A.S.; DeWitt, D.P.; Bergman, T.L.; Incropera, F.P. Fundamentals of Heat and Mass Transfer, 7th ed.; Hoboken, N.J., Ed.; John Wiley & Sons, Inc.: Hoboken, NJ, USA, 2011. [Google Scholar]
  22. Morchio, S.; Fossa, M.; Beier, R.A. Study on the best heat transfer rate in thermal response test experiments with coaxial and U-pipe borehole heat exchangers. Appl. Therm. Eng. 2022, 200, 117621. [Google Scholar] [CrossRef]
  23. Morita, K.; Bollmeier, W.S.; Mizogami, H. Analysis of the Results from the Downhole Coaxial Heat Exchanger (DCHE) Experiment in Hawaii. Geotherm. Resour. Counc. Trans. 1992, 16, 17–23. [Google Scholar]
  24. Carlino, S.; Somma, R.; Troise, C.; De Natale, G. The geothermal exploration of Campanian volcanoes: Historical review and future development. Renew. Sustain. Energy Rev. 2012, 16, 1004–1030. [Google Scholar] [CrossRef]
  25. Berrino, G.; Camacho, A.G. 3D gravity inversion by growing bodies and shaping layers at Mt. Vesuvius (southern Italy). Pure Appl. Geophys. 2008, 165, 1095–1115. [Google Scholar] [CrossRef]
  26. Woo, J.Y.; Kilburn, C.R. Intrusion and deformation at Campi Flegrei, southern Italy: Sills, dikes, and regional extension. J. Geophys. Res. Solid Earth 2010, 115, 1–21. [Google Scholar] [CrossRef] [Green Version]
  27. Zollo, A.; Maercklin, N.; Vassallo, M.; Dello Iacono, D.; Virieux, J.; Gasparini, P. Seismic reflections reveal a massive melt layer feeding Campi Flegrei caldera. Geophys. Res. Lett. 2008, 35, L12306. [Google Scholar] [CrossRef] [Green Version]
  28. Carlino, S. Heat flow and geothermal gradients of the Campania region (Southern Italy) and their relationship to volcanism and tectonics. J. Volcanol. Geotherm. Res. 2018, 365, 23–37. [Google Scholar] [CrossRef]
  29. Chiodini, G.; Todesco, M.; Caliro, S.; Del Gaudio, C.; Macedonio, G.; Russo, M. Magma degassing as a trigger of bradyseismic events: The case of Phlegrean Fields (Italy). Geophys. Res. Lett. 2003, 30, 1434–1437. [Google Scholar] [CrossRef] [Green Version]
  30. Chiodini, G.; Caliro, S.; DeMartino, P.; Avino, R.; Gherardi, F. Early signals of new volcanic unrest at Campi Flegrei caldera? Insights from geochemical data and physical simulations. Geology 2012, 40, 943–946. [Google Scholar] [CrossRef]
  31. Troiano, A.; Di Giuseppe, M.G.; Petrillo, Z.; Troise, C.; De Natale, G. Ground deformation at calderas driven by fluid injection: Modelling unrest episodes at Campi Flegrei (Italy). Geophys. J. Int. 2011, 187, 833–847. [Google Scholar] [CrossRef] [Green Version]
  32. Petrillo, Z.; Chiodini, G.; Mangiacapra, A.; Caliroa, S.; Capuano, P.; Russo, G.; Cardellini, C.; Avino, R. Defining a 3D physical model for the hydrothermal circulation at Campi Flegrei caldera (Italy). J. Volcanol. Geotherm. Res. 2013, 264, 172–182. [Google Scholar] [CrossRef]
  33. Alimonti, C.; Conti, P.; Soldo, E. A comprehensive exergy evaluation of a deep borehole heat exchanger coupled with an ORC plant: The case study of Campi Flegrei. Energy 2019, 189, 116100. [Google Scholar] [CrossRef]
  34. Carlino, S.; Troiano, A.; Di Giuseppe, M.G.; Tramelli, A.; Troise, C.; Somma, R.; De Natale, G. Exploitation of geothermal energy in active volcanic areas: A numerical modelling applied to the high temperature Mofete geothermal field, at Campi Flegrei caldera (Southern Italy). Renew. Energy 2016, 87, 54–66. [Google Scholar] [CrossRef]
  35. Troise, C.; Castagnolo, D.; Peluso, F.; Gaeta, F.S.; Mastrolorenzo, G.; De Natale, G. A 2D mechanical-thermofluid-dynamical model for geothermal systems at calderas: An application to Campi Flegrei, Italy. J. Vulcanol. Geotherm. Res. 2001, 109, 1–12. [Google Scholar] [CrossRef]
  36. Beckers, K.F.; Rangel-Jurado, N.; Chandrasekar, H.; Hawkins, A.J.; Fulton, P.M.; Tester, J.W. Techno-Economic Performance of Closed-Loop Geothermal Systems for Heat Production and Electricity Generation. Geothermics 2022, 100, 21. [Google Scholar] [CrossRef]
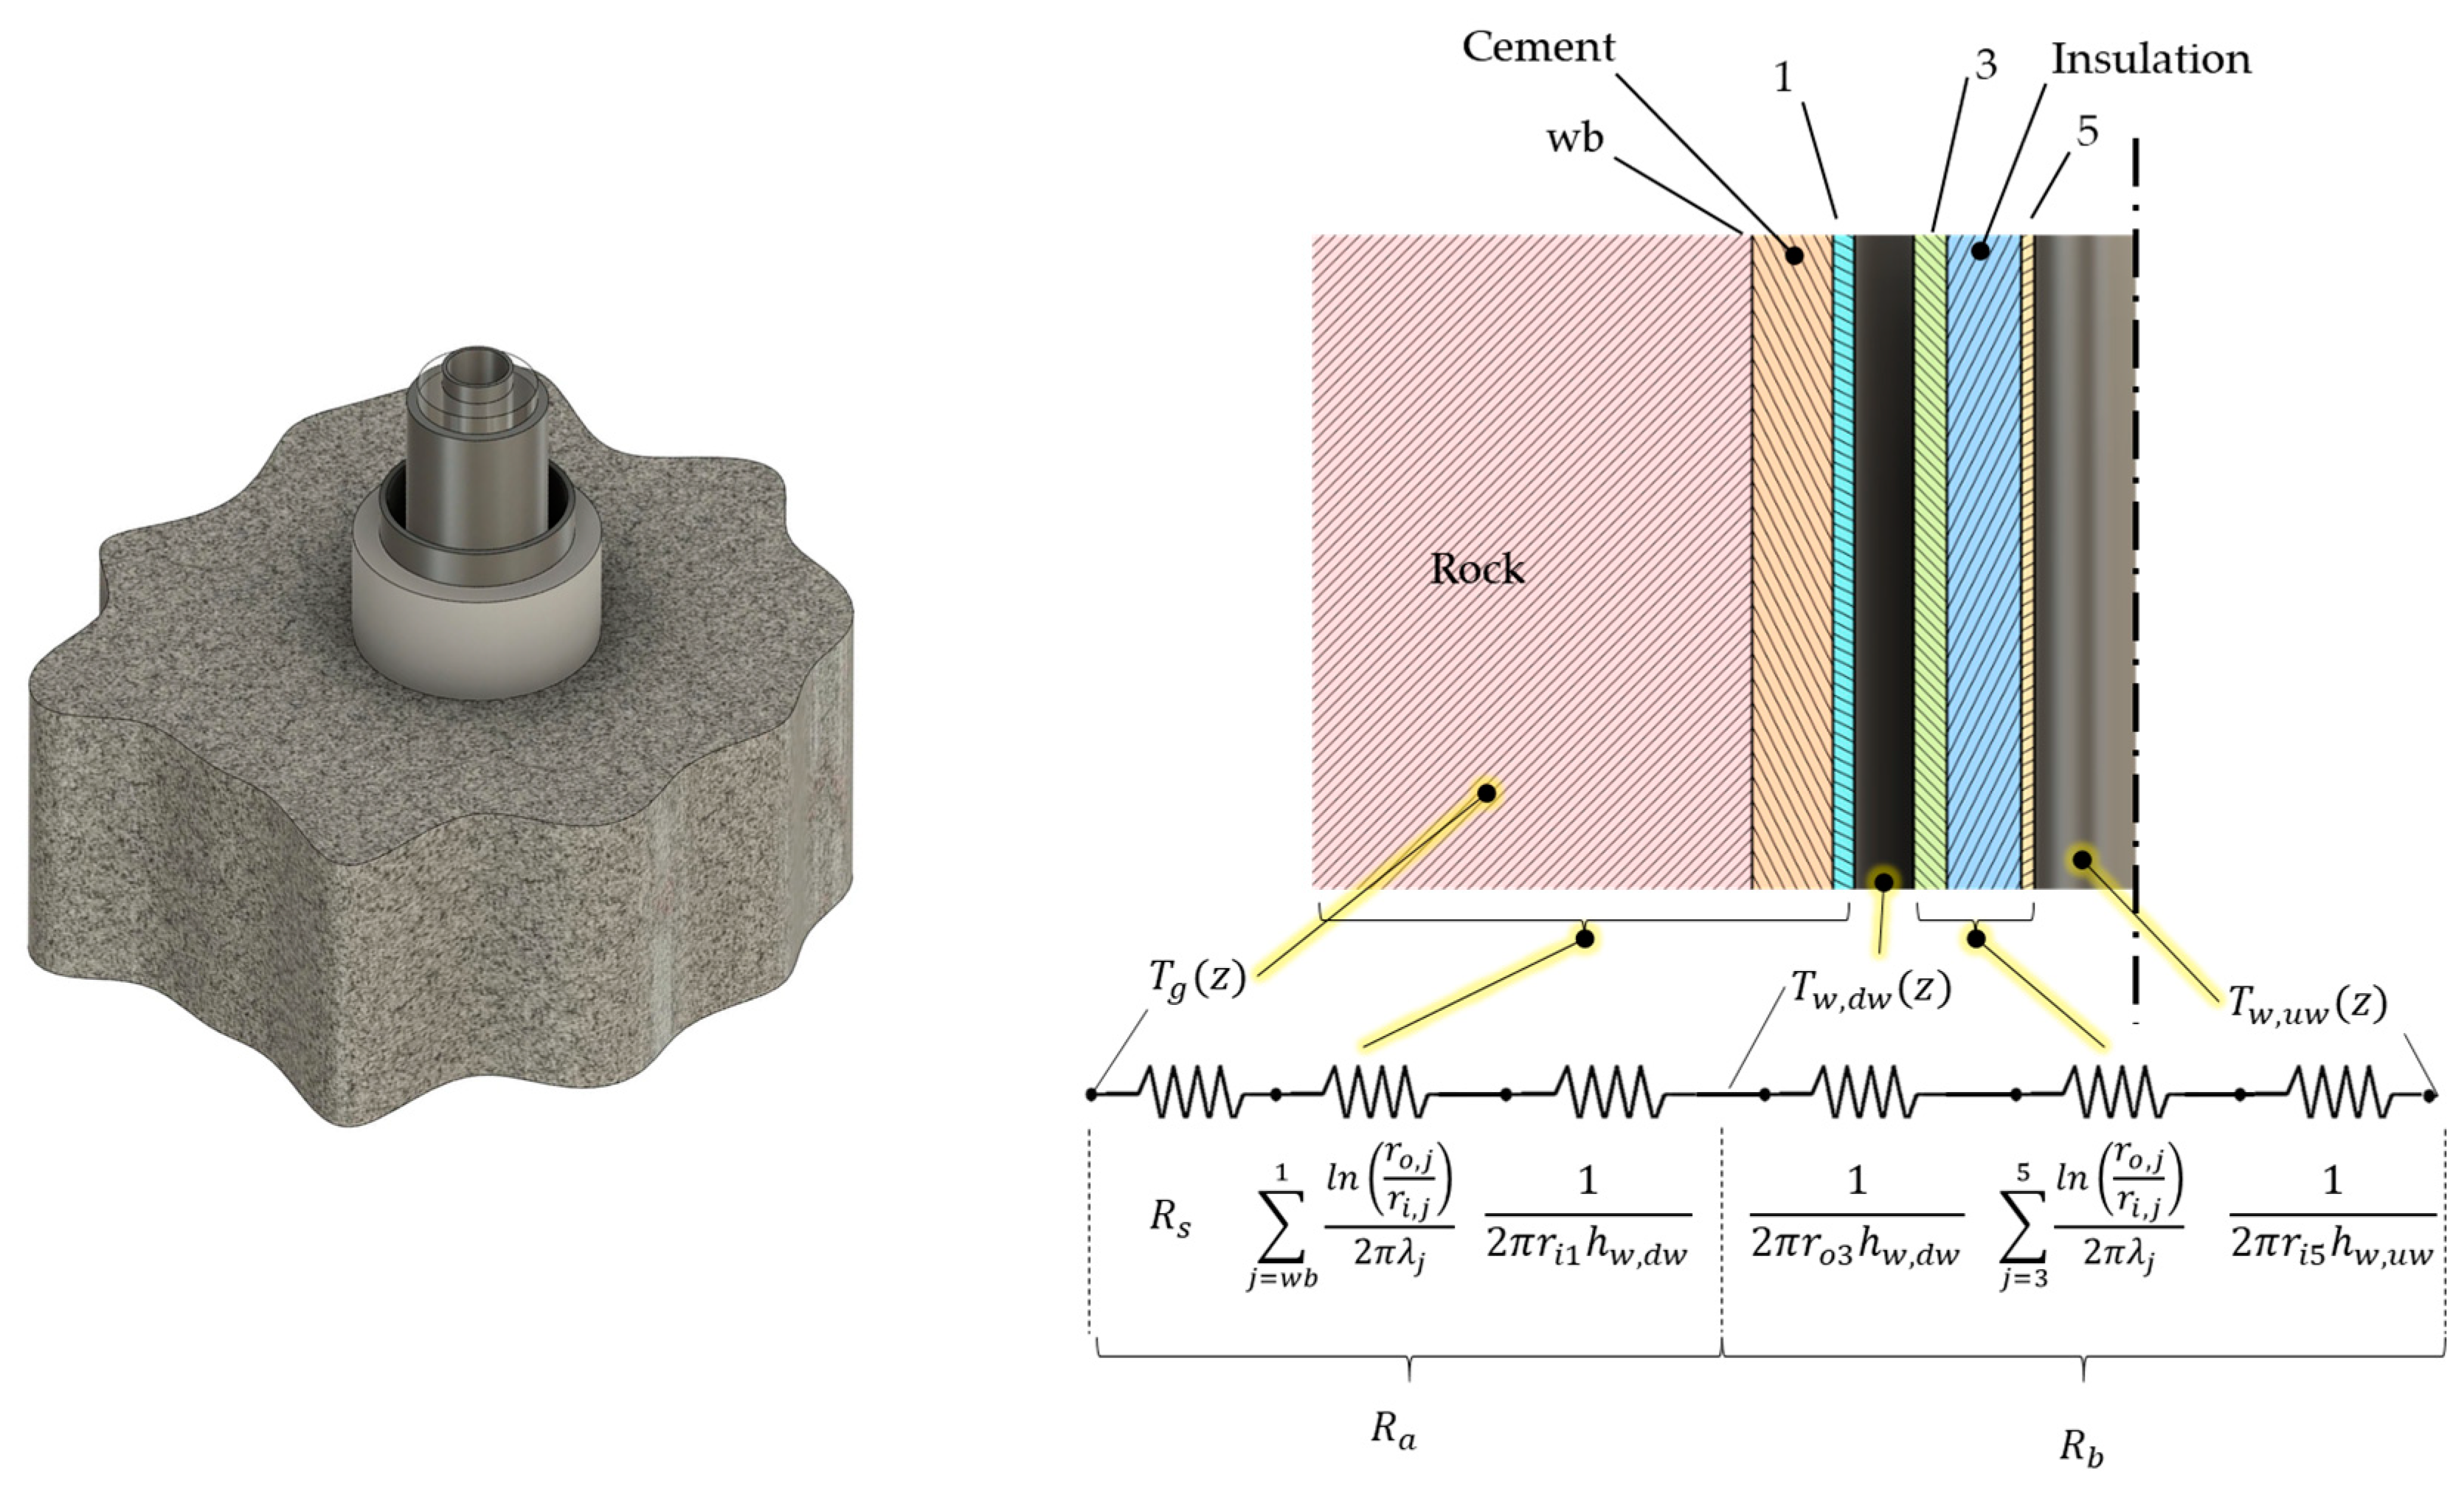
Figure 1. Thermal resistances and cross-section of the DBHE. wb—wellbore diameter, 1—external casing, 3—external tube of the VIT, 5—internal tube of the VIT.
Energies 16 01351 g001
Figure 2. Thermal resistances and cross-section of the ULHE.
Energies 16 01351 g002
Figure 3. Campi Flegrei caldera: (a) Location of deep wells; (b) Temperature profiles (Modified after [21]).
Energies 16 01351 g003
Figure 4. ULHE geometry configurations.
Energies 16 01351 g004
Figure 5. Results for the DBHE. (a) Thermal power vs. outlet temperature and (b) efficiency vs. outlet temperature.
Energies 16 01351 g005
Figure 6. Temperature profiles for different flow rates in the DBHE (after one year from startup).
Energies 16 01351 g006
Figure 7. ULHE results (Configuration U0–R = 0.5). (a) Thermal power vs. time after startup and (b) temperature vs. time after startup.
Energies 16 01351 g007
Figure 8. Temperature profiles for different flow rates in the ULHE configuration after one year from startup (Configuration U0–R = 0.5).
Energies 16 01351 g008
Figure 9. Thermal power vs. outlet temperature for the ULHE (Configuration U0–R = 0.5).
Energies 16 01351 g009
Figure 10. ULHE performances as a function of the ratio R (Q = 0.5 m3/h).
Energies 16 01351 g010
Figure 11. Outlet to bottom-hole temperature ratio vs. time after startup.
Energies 16 01351 g011
Figure 12. Outlet temperature vs. flow rate (after six months of startup).
Energies 16 01351 g012
Figure 13. Thermal power vs. flow rate (after six months of startup).
Energies 16 01351 g013
Figure 14. Specific power vs. flow rate (after six months of startup).
Energies 16 01351 g014
Table 1. Geometrical description of the CLG system configurations.
DBHEULHE
OD
(mm)
ID
(mm)
OD
(mm)
ID
(mm)
wb12″ ¾311.2-wb12″ ¾311.2-
19″ 58244.4226.619″ 58 244.4226.6
37″177.80150.36
53″ ½88.9077.92
Table 2. Thermal conductivity of the used materials.
MaterialThermal Conductivity
(W/m K)
Steel50
Grout1.3
Vacuum0.0008
Table 3. Input operating parameters of the simulation.
Input Parameter
Working fluidWater
Inlet pressure Pin2.5 MPa
Inlet temperature Tin40 °C
Flow rate1–20 m3/h
Table 4. Stratigraphy and thermo-physical properties of Campi Flegrei.
StratigraphyLayerDepth Range
(m)
Permeability
(m2)
Density
(kg/m3)
Pyroclastic deposits10–50010−151800
Tuffites2500–100010−142100
Trachytic lavas31000–140010−182400
Tuffites41400–180010−172400
Trachytic lavas51800–200010−152400
Table 5. Comparison of performance with data from Beckers et al. [36].
DBHEULHE
Flow Rate
(m3/h)
Thermal Power
(MW)
Temperature
(°C)
Thermal Power
(MW)
Temperature
(°C)
This study200.5630.9783
Beckers et al. [36]720.9304.575
Table 6. Comparison of the specific power with data from Beckers et al. [33].
DBHEULHE
Flow Rate
(m3/h)
Specific Power
(kW/m)
This study200.250.23
Beckers et al. [33]720.450.56
Disclaimer/Publisher’s Note: The statements, opinions and data contained in all publications are solely those of the individual author(s) and contributor(s) and not of MDPI and/or the editor(s). MDPI and/or the editor(s) disclaim responsibility for any injury to people or property resulting from any ideas, methods, instructions or products referred to in the content.