Article

Development and Analysis of Mathematical Plunger Lift Models of the Low-Permeability Sulige Gas Field

1
College of Petroleum Engineering, Xi’an Shiyou University, Xi’an 710065, China
2
Exploration and Development Institute, Shaanxi Yanchang Petroleum Group, Co., Ltd., Yan’an 716000, China
*
Authors to whom correspondence should be addressed.
Energies 2023, 16(3), 1359; https://doi.org/10.3390/en16031359
Submission received: 14 December 2022 / Revised: 15 January 2023 / Accepted: 25 January 2023 / Published: 28 January 2023
(This article belongs to the Special Issue Advances in Petroleum Geology and Unconventional Oil and Gas)

Abstract

:
The Sulige is a low-permeability tight gas sandstone field whose natural gas production has gradually declined with continuous development. The primary reason was that most of the wells in the field flew below their critical rates and liquids started to accumulate in the wellbore at different levels, which resulted in the production reduction due to the wellbore pressure decrease and back pressure increase on the produced gas. An artificial lift was required to remove the liquids from those wells. With the advantages such as simple installation and operation, low cost and high liquid-carrying capacity, the plunger lift has been proven effective in the Sulige Gas Field. In this paper, firstly, a series of mathematical models were developed to investigate plunger displacement and velocity in the uplink and downside phases, fluid leakage in the uplink phase, and the characteristics of tubing pressure and casing pressure in the uplink and pressure build-up phases. Then, taking well X1 and well X2 at Su 59 area of the gas field as an example, the established mathematical models were applied to estimate its tubing and casing pressure, plunger moving displacement and speed, fluid leakage during the uplink phase, and gas production during the plunger lift. Hence, the well production cycle operated by the maximum gas rate was optimized. This study provides a theoretical basis for the optimal design of plunger lift parameters and the improvement of gas production.

1. Introduction

The Sulige Gas Field is located in the Ordos Basin of China, and is a typical tight sandstone gas field whose matrix permeability is mainly distributed from 0.1 mD to 1 mD and matrix porosity is between 3% and 12% [1,2]. With the continuous development of the gas field, most gas wells have entered the stage of low production and liquid loading, and experienced a large reduction of single-well production, and poor liquid carrying capacity, which adversely affects the production of gas wells. Hence, gas well deliquification is becoming more and more prominent. A Plunger lift was used to unload the liquids (water and gas condensates) in the gas wells because of its good liquid-carrying effect and a high degree of automation [3]. Therefore, it is of great significance to improve plunger lift technology to establish mathematical models of the plunger dynamic lifting and analyze its characteristics.
In 1994, Yu [4] employed the traditional static design method proposed by Foss and Gaul to determine the run time, fluid discharge, and gas production of wells Wei 35 and Wei 63. Significant differences were noted between the values calculated using the model and those obtained experimentally [5,6]. In 2005, He et al. [7,8] analyzed the factors influencing plunger gas lift and design optimization. They accounted for three major types of factors that influence plunger gas lift: dynamic, resistance, and volume. The dynamic factors included the gas-liquid ratio, formation pressure, and gas production capacity; the plunger gas lift gas-liquid ratio should be higher than the minimum value for normal lift [9,10,11,12]. In 2018, Hashmi [13] et al. proposed a simplified plunger lift model and method for highly productive gas reservoirs, assuming that fluid accumulates in the tubing and casing annulus and eventually flows into the tubing when gas is produced in an open well [14,15]; the gas in the annulus subsequently lifts the fluid at the top of the plunger out of the wellbore [16,17]. The model accounts for both the work done by the annulus on the plunger and the frictional forces on the plunger during the movement [18,19]. In 2020, Carpenter [20] proposed a model that accounts for the gas flow during plunger movement in the tubing; the model can be used to calculate the instantaneous velocities of plunger ascent and descent [21,22]. For a more accurate prediction of the plunger dynamics, the plunger lift model was used to calculate the influence of the input parameters, and the equations for plunger ascent and descent were improved [23,24]. However, most previous studies did not consider the gas-liquid flow between the plunger and the tubing wall, resulting in the ignoring of liquid leakage in the established models.
In this paper, based on the previous work, the plunger lift process is divided into the uplink phase, continuity phase, downside phase and pressure build-up phase according to the theory of multi-phase flow in the wellbore and plunger force analysis, and the mathematical model of plunger gas lift is established to analyze the law of plunger motion and the change law of gas well parameters during the plunger lift process, which provides a reliable theoretical model for the optimal design of plunger lift parameters [25,26,27].

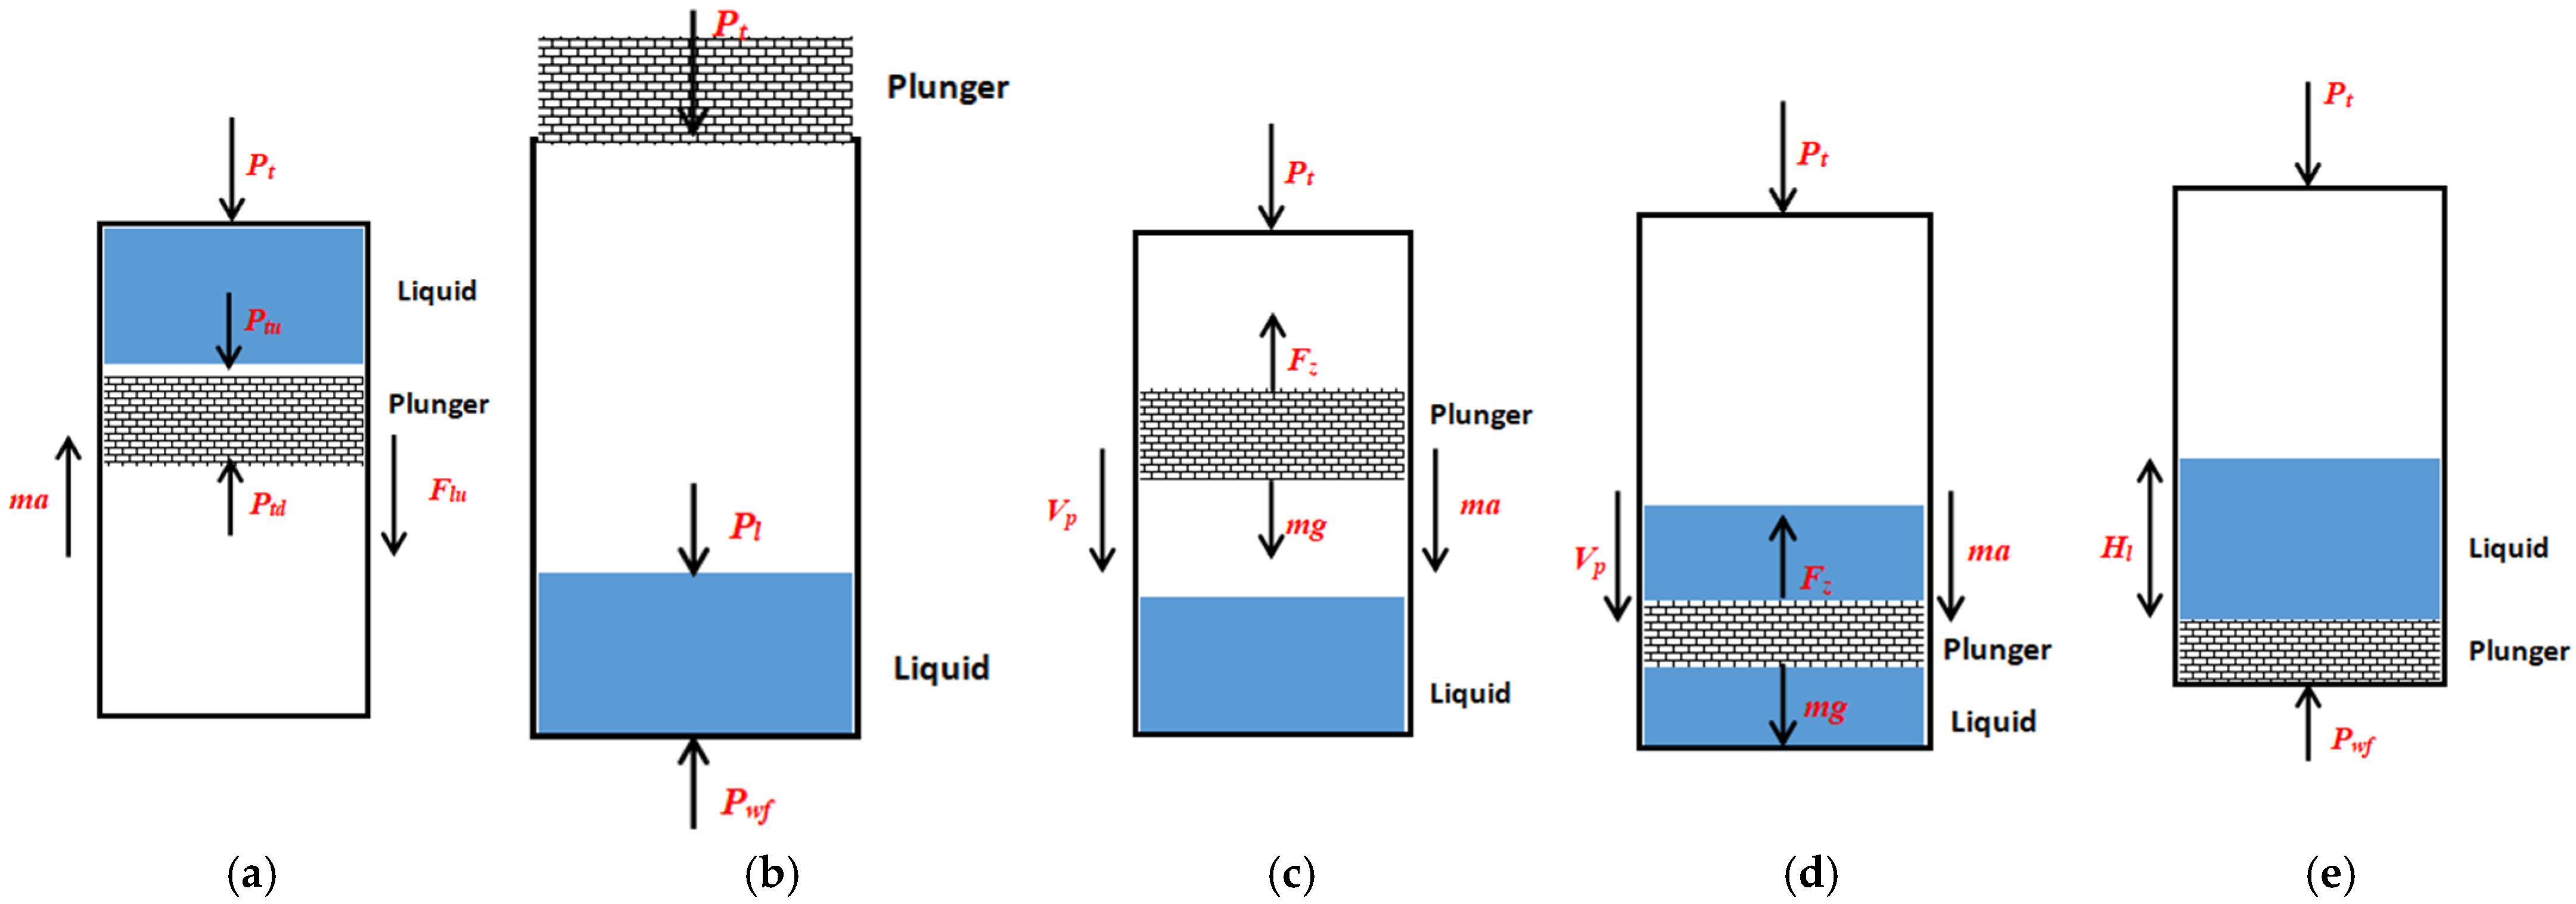
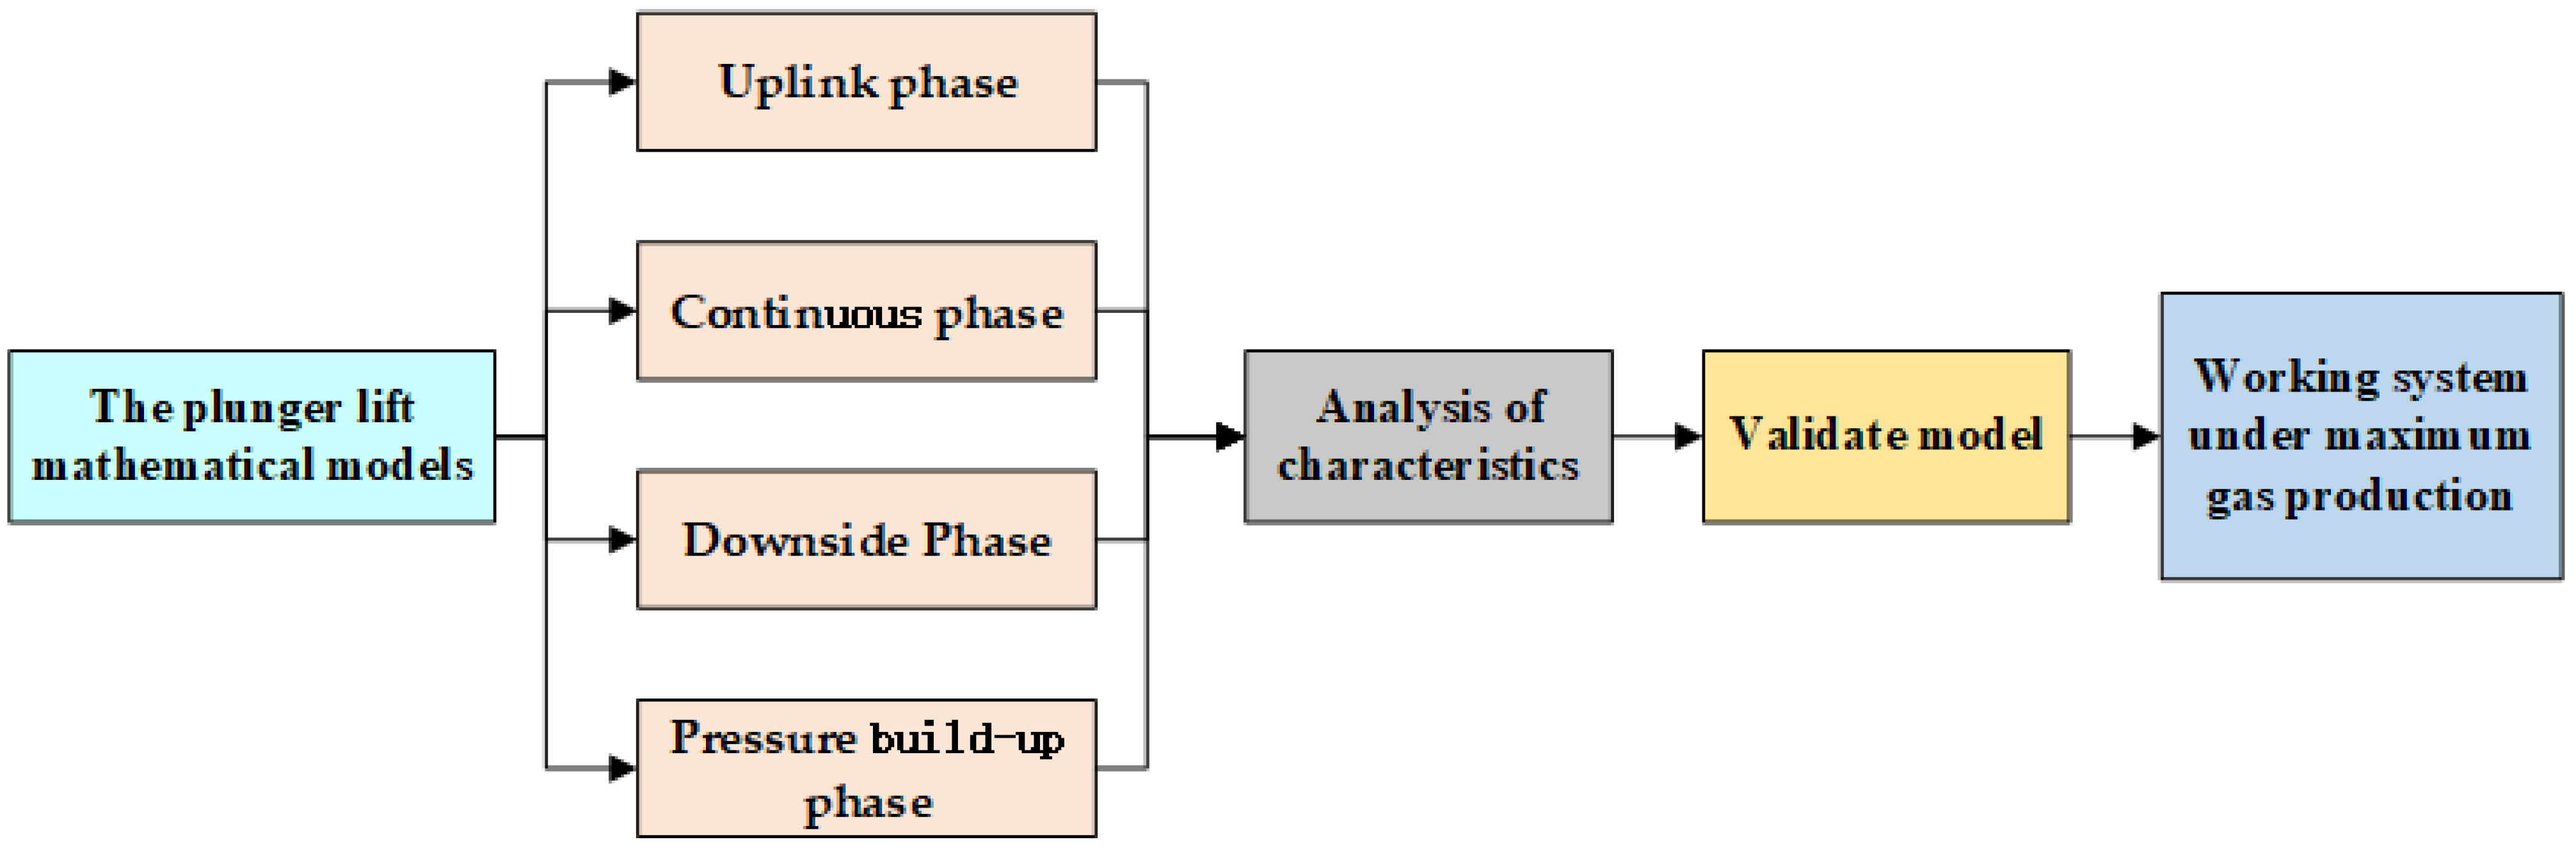
2. Development of Plunger Lift Mathematical Models

The mathematical models of plunger lift were established according to different stages of the plunger operation processes, e.g., plunger ascent stage, plunger descent stage, and formation pressure build-up stage, and the force analysis is shown in Figure 1. Dynamic simulation of the plunger lift was performed to determine the variation trends of parameters such as position, velocity, acceleration, pressure, output, and lift period of the plunger during the lifting process and the relationship between the parameters. Each stage of lifting was modelled based on the laws of conservation of mass and momentum. The workflow is shown in Figure 2.

2.1. Uplink Phase

A well bottom was considered the origin of the z-axis. A plunger moves upward along the z-axis of the vertical wellbore, exhibiting a positive movement. When gas production in the well ceases, the control valve opens and conducts the gas at the upper end of the plunger to the surface pipeline or sprays out the gas in the atmosphere. Then, the plunger uses the gas energy stored in the casing and in the formation to push the plunger into the wellbore, thereby lifting the liquid section plug and plunger to the surface. According to Newton’s second law, the plunger operation process can be expressed as follows:
( P t d P t u ) A t 10 6 m g F l u = m x = m a
where m denotes the mass of the plunger; A t denotes the area of the tubing column; g denotes the gravitational acceleration; x denotes the plunger running acceleration; F l u denotes the fluid column frictional resistance; P t u denotes the pressure on the upper surface of the plunger; P t d denotes the pressure on the lower surface of the plunger.
The upward movement of the plunger results in liquid leakage, which is influenced by factors such as plunger velocity and differential pressure, as demonstrated experimentally, and is expressed as follows:
q v = γ [ π D δ 3 12 μ ( 2 ρ g + Δ P l p ) + π D δ v p 2 ]
γ = 0.2716 v p 1.1353
q l = ( 0.2716 v p 1.1353 ) [ π D δ 3 12 μ ( 2 ρ g + Δ P l p ) + π D δ v p 2 ]
where q l denotes the liquid leakage; γ denotes the leakage factor; v p denotes the plunger velocity; l p denotes the plunger length; μ denotes the fluid viscosity; δ denotes the annular gap.

2.2. Continuous Phase

The continuous flow phase occurs after the plunger reaches the surface and enables the subsequent flow of fluids to flow; the wellhead valve opens to release the gas. During this phase, fluid is produced in the reservoir, and when gas production decreases because of the re-accumulation of the fluid at the bottom of the well, the control valve closes and the phase of continuation flow ends.
To simplify the calculations, only single-phase gas flow was considered in this study. Therefore, the outflow part of the model represents the gas flow above the plunger during the ascent of the plunger because the gas-liquid mass inside the pipe changes because of the bottom inflow and surface outflow. The overall equilibrium equation was as follows:
d d t m g t b = F g t u b F g o u t
d d t m l t b = F l t u b
where m g t b is the mass of tubing gas; m l t b is the liquid mass of the oil pipe.

2.3. Downside Phase

In the later stages of the renewed flow, the formation energy is depleted, the gas flow rate is not sufficient for fluid output, and the fluid begins to re-accumulate in the wellbore. The plunger catcher also releases the plunger, thereby causing it to descend into the wellbore. The plunger descends first through the gas column and then through the liquid portion of the wellbore. The forces (gravity and drag) acting on the plunger during its descent in the gas column determine its acceleration and velocity. Therefore, when the plunger descends at a constant velocity, the plunger’s gravity is equal to its resistance, and the acceleration is zero. The total force can be expressed as follows:
F = m p × a ( t ) = m p g F f ( t ) F f g ( t )
where m p is the plunger quality; F f ( t ) is the buoyancy of the gas to which the plunger falls in the gas column; F f g ( t ) is the gas friction force on the plunger when it falls through the gas.
After the descent of the plunger and the accumulation of liquid in the gas column, the plunger continues to descend into the liquid column. The total force can be expressed as follows:
F = m p × a ( t ) = m p g F l f ( t ) F r ( t )
where F l f ( t ) is the buoyancy force of the plunger falling in the liquid column; F r ( t ) is the frictional resistance of the plunger falling in the liquid column.

2.4. Pressure Build-Up Phase

According to the conservation of mass, the sum of the change in gas mass in the casing and that in the tubing is equal to the change in gas mass produced during the formation; similarly, the sum of the change in liquid mass in the casing and that in liquid mass in the tubing is equal to the change in liquid mass produced during the formation. These relationships are expressed as follows:
Δ m c g ( t ) + Δ m t g ( t ) = Δ m r g ( t )
Δ m c l ( t ) + Δ m t l ( t ) = Δ m r l ( t )
The fluids produced during the formation are distributed in proportion to the area occupied by the casing, and the accumulation of fluids in the casing over time can be calculated as follows:
Δ V r l = Δ V r g / G L R
Δ H 1 ( t ) = Δ V r l ( t ) 1 ( A t + A c )
Δ H c l ( t ) = Δ V r l ( t ) 1 ( A t + A c )
The mass of gas in the tubular column of the oil casing at time d t can be calculated using the following equations of the state of the gas:
m c g ( t ) = 28.97 γ g p c a v ( t ) A c H c g ( t ) × 10 6 Z a v R T a v
p c a v ( t ) = p c ( t ) + p w f ( t ) 2
m t g ( t ) = 28.97 γ g p t a v ( t ) A t H t g ( t ) × 10 6 Z a v R T a v
p t a v ( t ) = p t ( t ) + p w f ( t ) 2
where Δ m c g ( t ) is the change in the mass of the gas in the oil jacket at moment t ; Δ m t g ( t ) is the change in the mass of the gas in the tubing at moment t ; Δ m c l ( t ) is the change in the mass of the fluid in the oil jacket annulus at moment t ; Δ m t l ( t ) is the change in the mass of the liquid in the oil pipe at moment; Δ V r l is the volume of fluid produced by the formation at moment t ; Δ V r g is the mass of gas produced by the formation at moment.

3. Calculation and Analysis

The aforementioned mathematical models of the plunger lift process were analyzed and validated using the production data of well X1 in Su 59 area as shown in Figure 3; the basic data are displayed in Table 1. Without the plunger lift, the daily gas production is mostly lower than 10,000 m3/d due to the liquid accumulation at the bottom of the well, which means that the production is in a state of large unstable fluctuation range. With the plunger lift, the daily gas production is significantly higher than without the plunger lift.

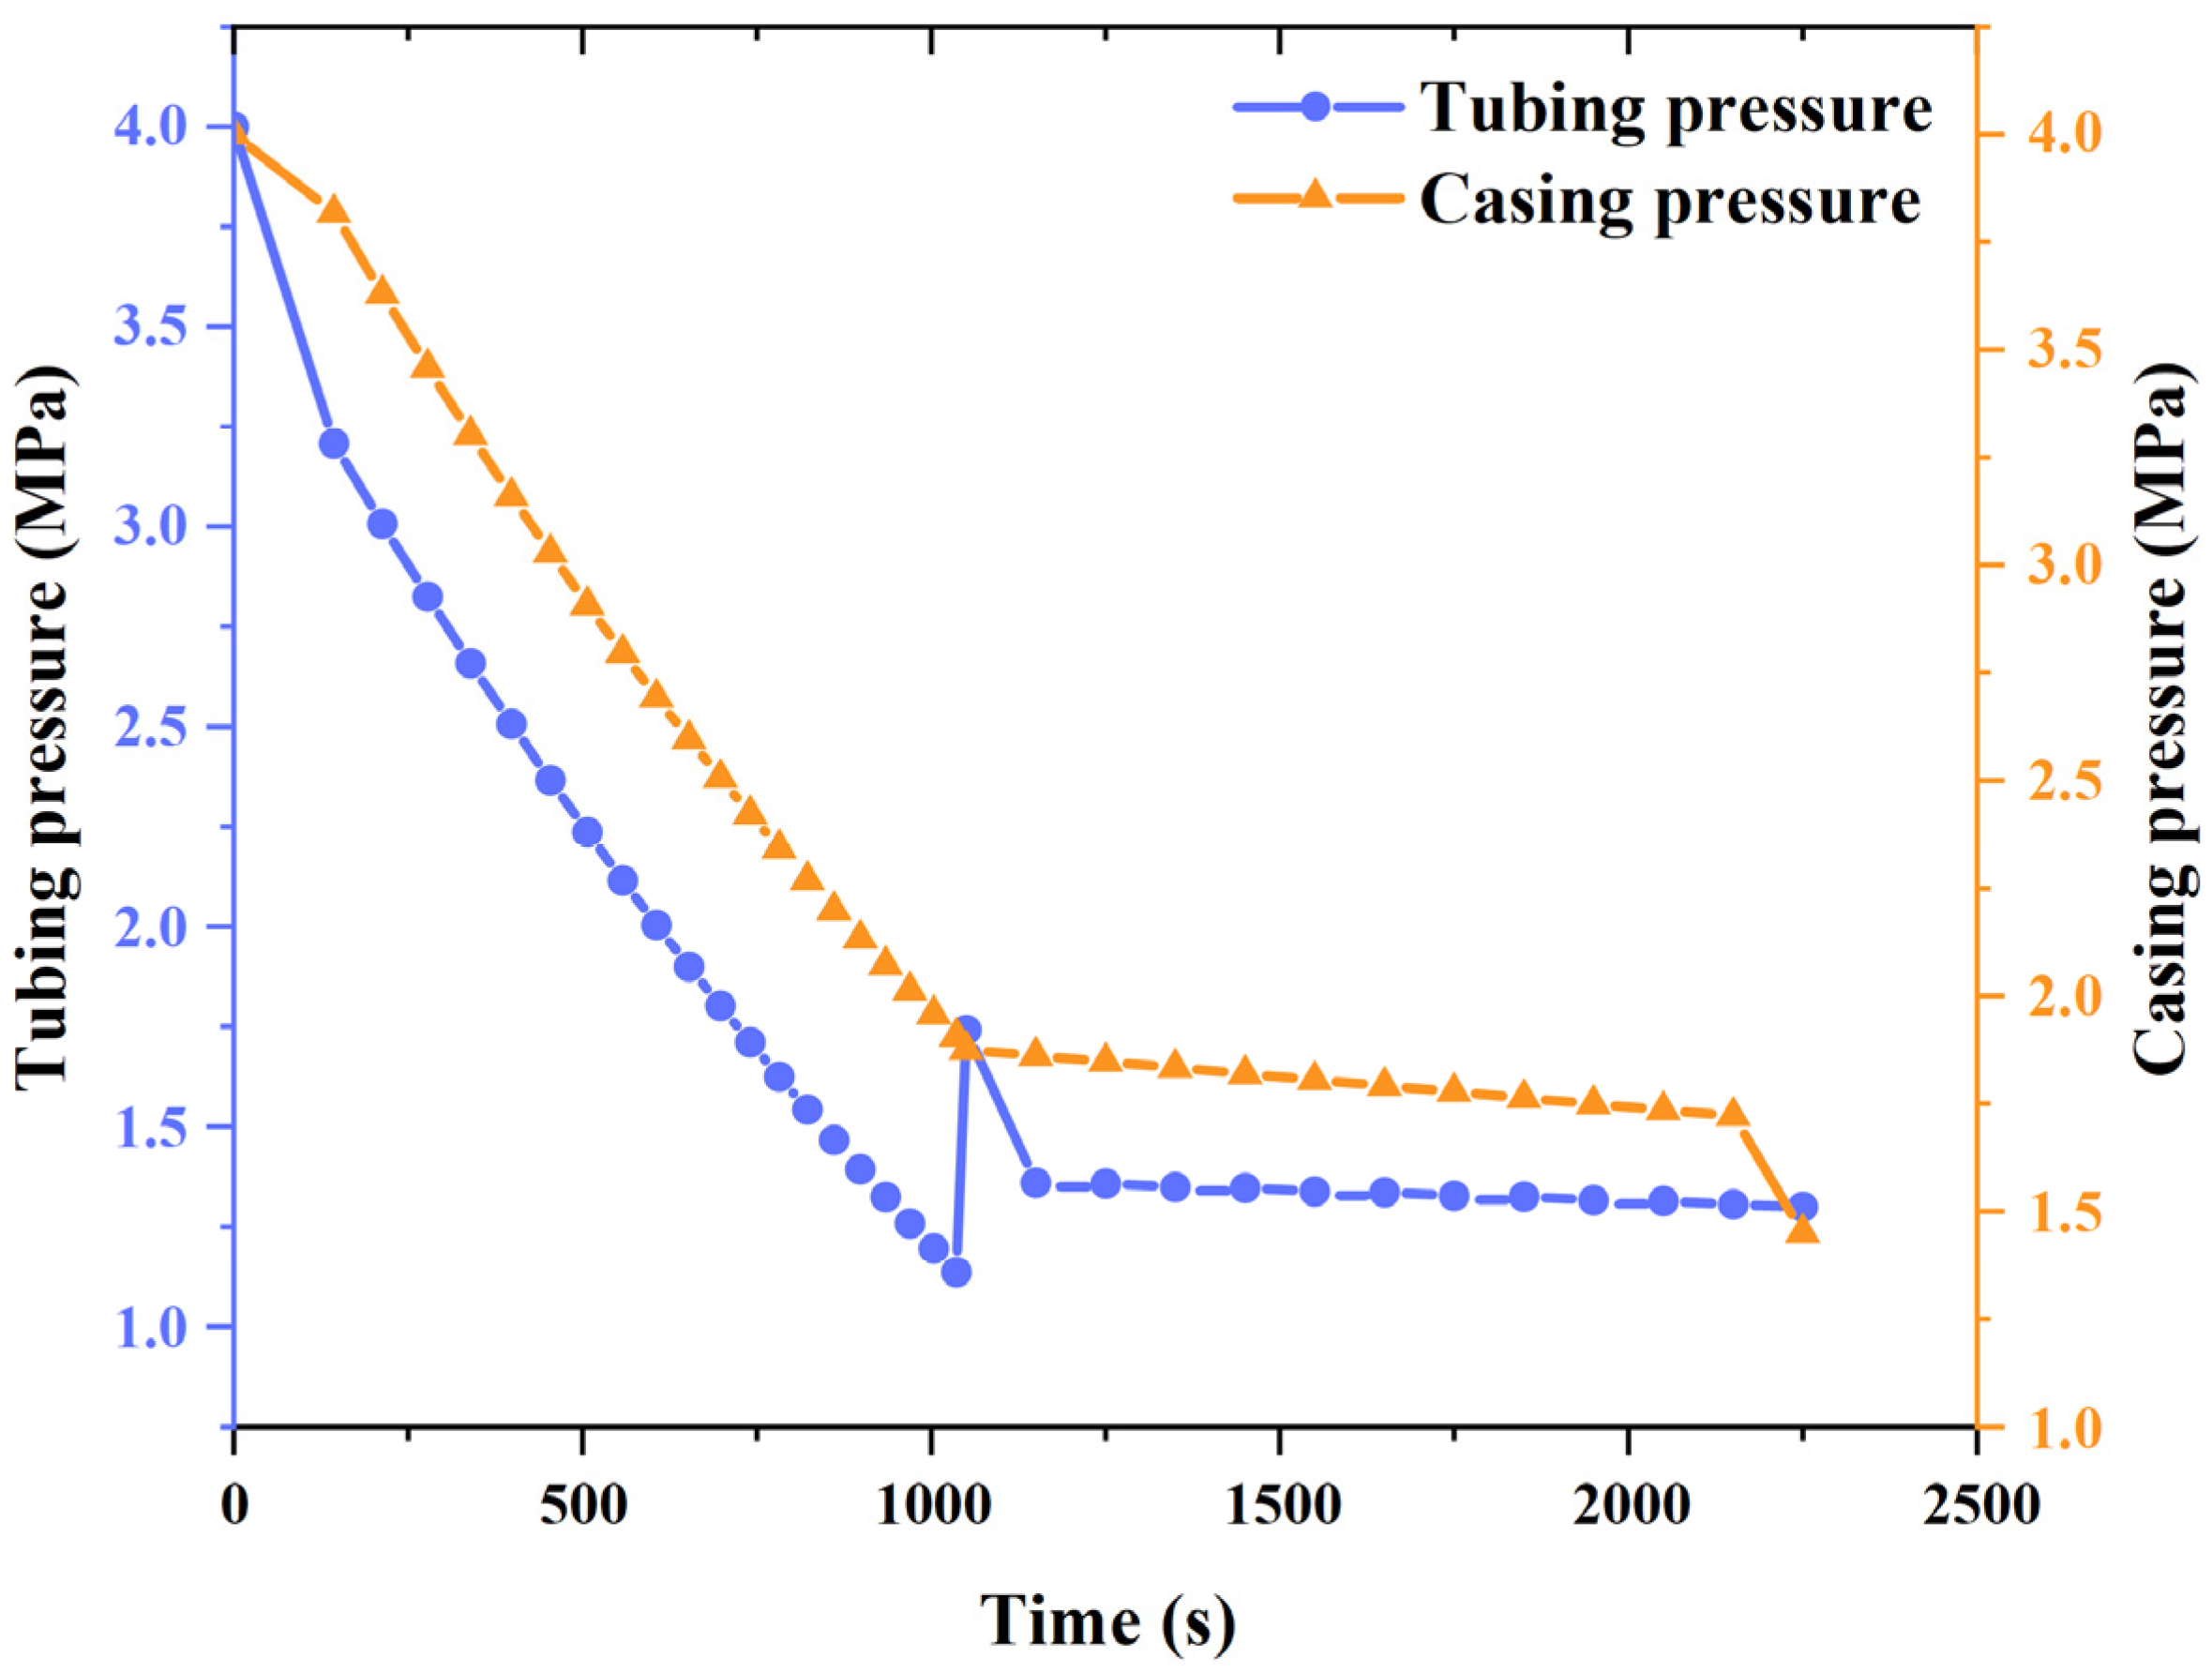
3.1. Operating Parameters of the Upstream and Renewal Phases of the Plunger

The relevant operating parameters of the plunger upstream and renewal phase—the relationship between displacement and time, the change in tubing pressure and casing pressure, the change in velocity, etc.—can be calculated according to Equations (1) and (4)–(6), as discussed in this section.
The relationship between displacement and velocity of the plunger in the upward and renewal phases and time is illustrated in Figure 4. The displacement of the plunger upward increases with time and stops varying when the plunger reaches the renewal stage; subsequently, the plunger is captured and stops moving. After the opening lift, the plunger running velocity increases rapidly from 0 to 2.5 m/s. During and after the plunger lift exhaust stage, the plunger running velocity increases gradually, but the plunger is captured by the catcher and the velocity decreases to 0 m/s at the plunger lift renewal stage.
Figure 5 illustrates the variations in the upstream tubing pressure and casing pressure of the plunger with time. According to the change of tubing and casing pressure, the situation of bottom well liquid accumulation and the time when the plunger lift enters the next working cycle can be judged. During the pressure build-up phase, with the increase of bottom well liquid, gas enters the annulus, and the high pressure of gas causes the tubing and casing pressure to rise. When this pressure reaches a certain value, it indicates that the gas well at this time is not suitable to continue in the pressure build-up phase, and will enter the continuity phase.
The tubing pressure and casing pressure decrease during the plunger upward exhaust phase, and the tubing pressure increases again when the operation reaches the wellhead discharge phase. Thereafter, the tubing pressure continues to decrease again during the renewal flow phase. The casing pressure decreases during the ascent of the plunger and renewal flow, thereby facilitating the movement of the plunger and the fluid.
As displayed in Figure 6, at the beginning of the ascent of the plunger from the bottom of the well, the plunger velocity is low, the pressure at the lower end of the plunger is large, and the shear leakage in the plunger is zero. The shear leakage increases and plunger gap leakage occurs with an increase in the plunger velocity. When the plunger velocity is equal to the leakage velocity, shear leakage increases with the increase in plunger velocity.
Figure 7 illustrates the difference between gas production with the plunger and without the plunger. With the plunger, the decreasing slope in the upward phase of the plunger lift indicated that the gas production decreases and enters the renewal phase. Consequently, the gas production rate stabilizes, and the slope remains the same. Without the plunger, the gas production is only slightly reduced due to less liquid accumulation in the early. As time goes on, the liquid accumulation increased, and the gas production obviously decreased compared with the plunger.

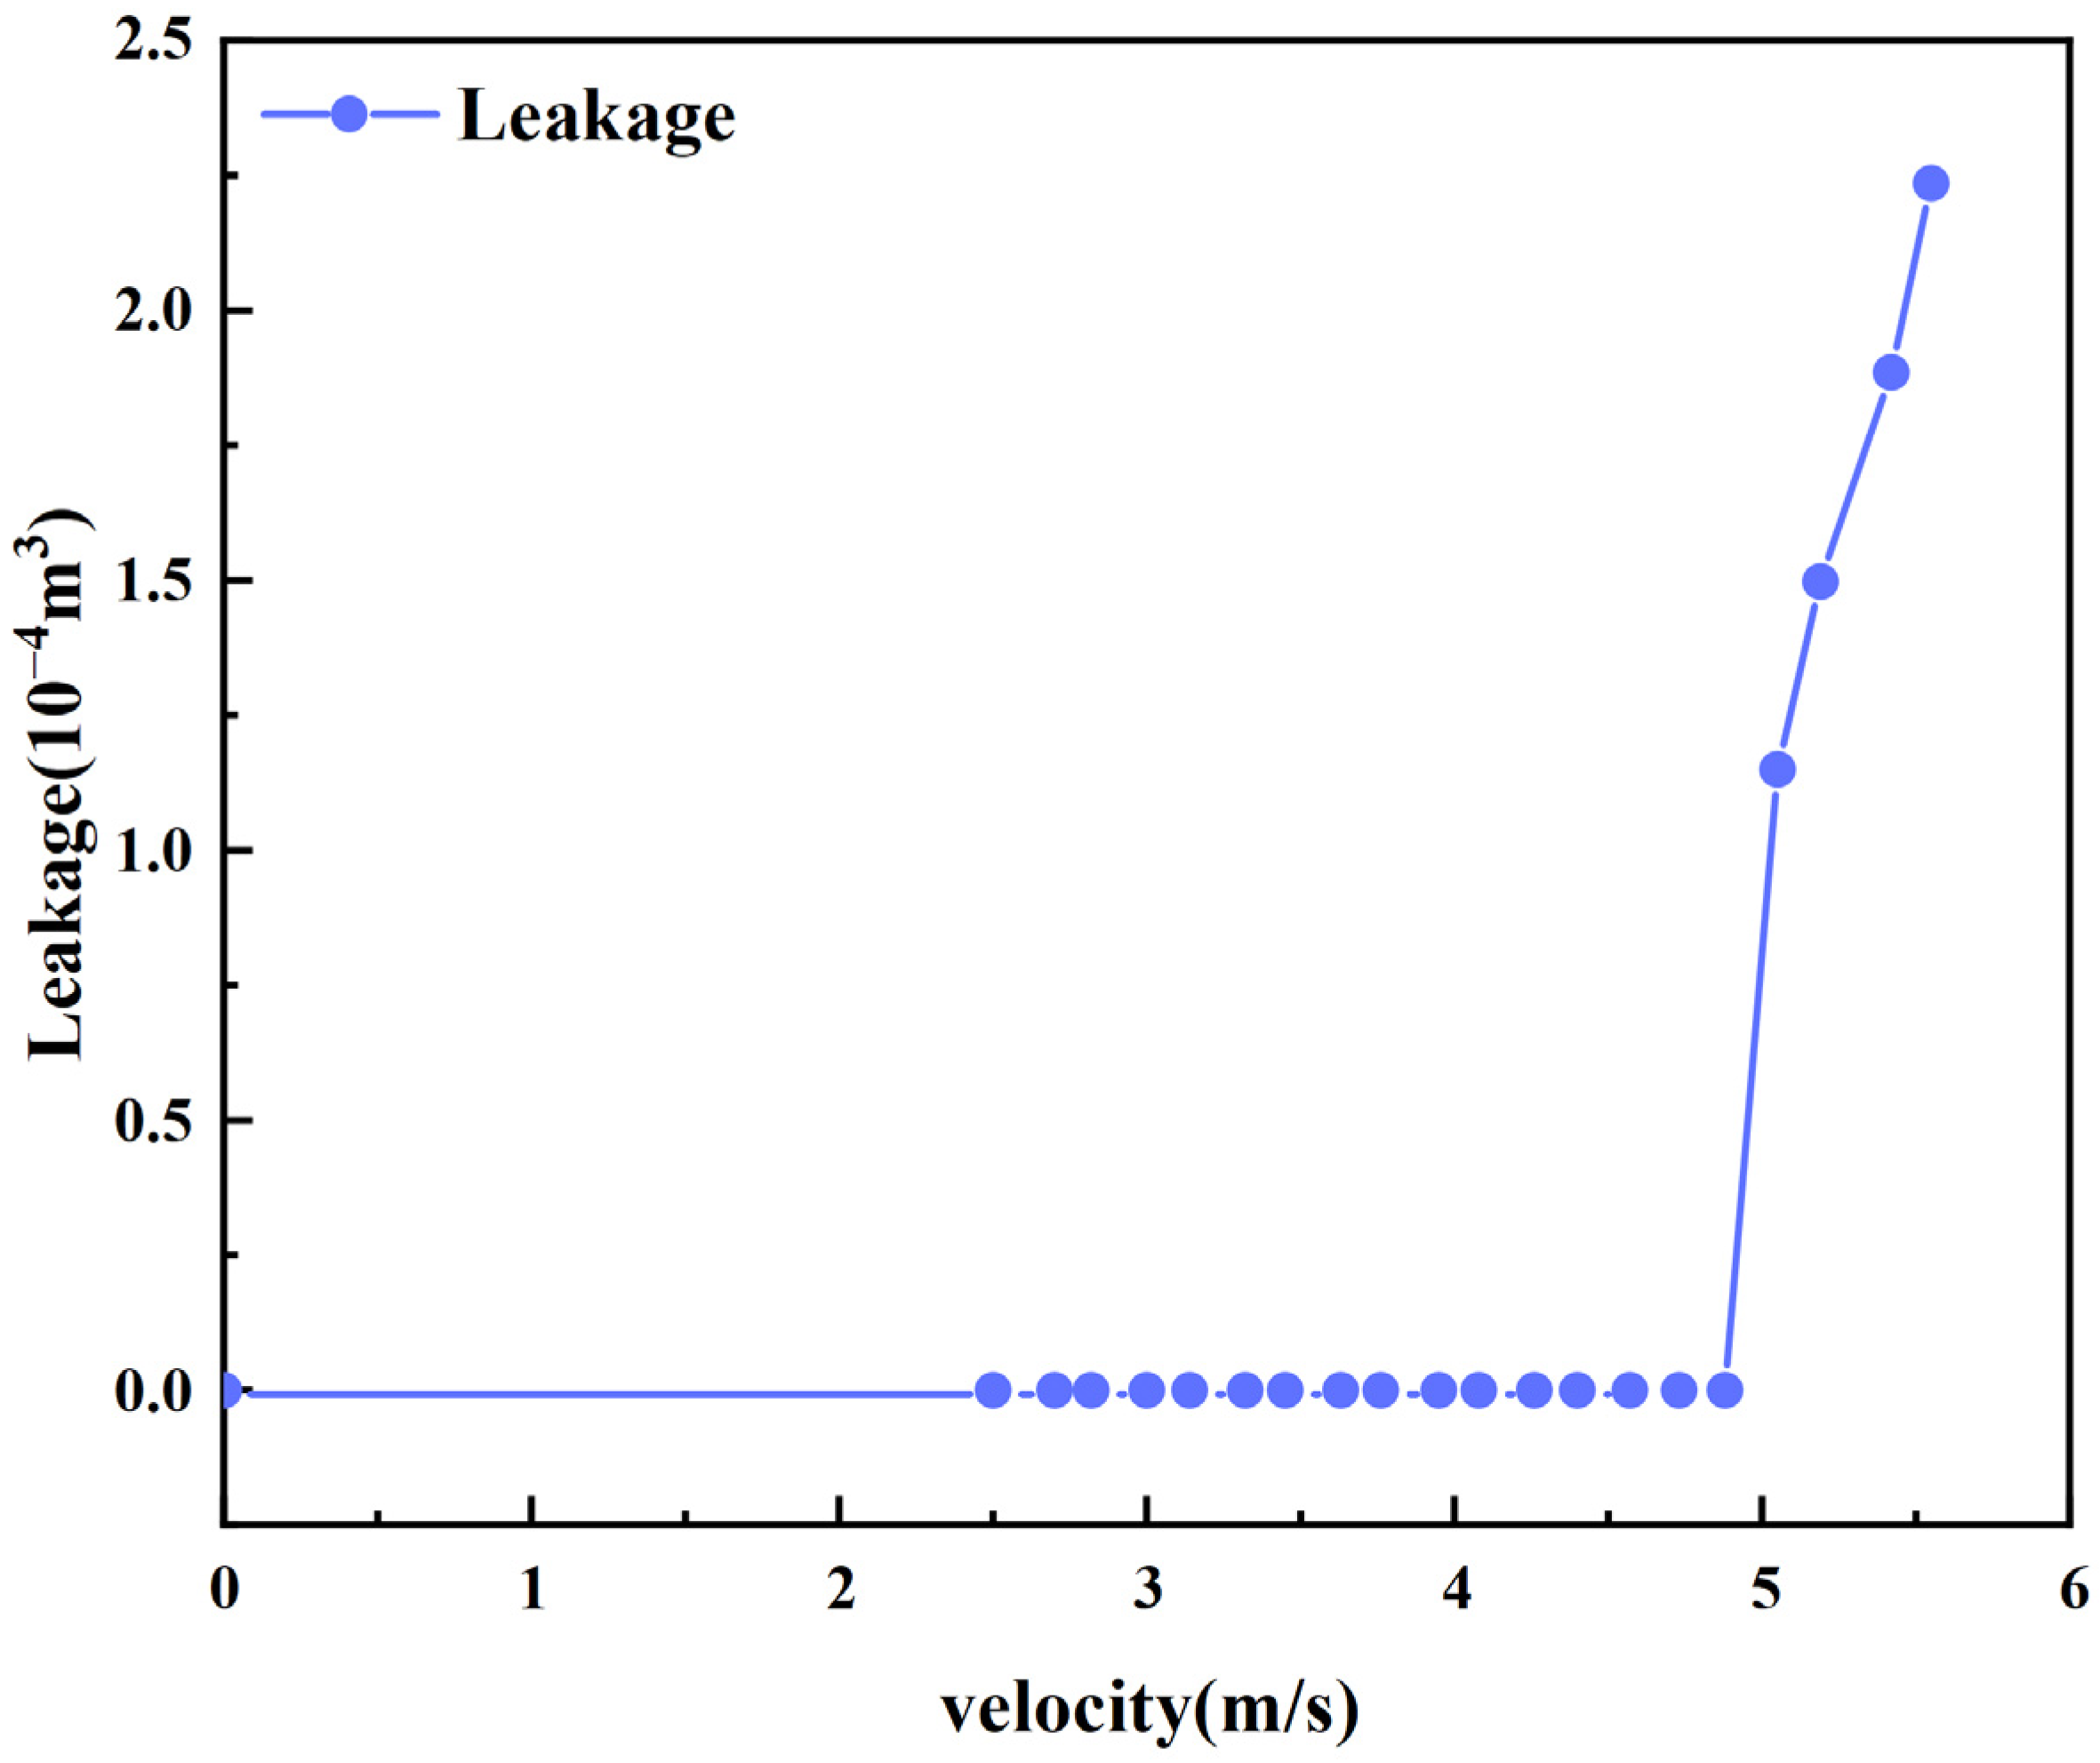
3.2. Operating Parameters of the Downward Phase of the Plunger

The relevant operating parameters of the downward phase of the plunger can be obtained through Equations (7) and (8). The relationship between displacement and time, change in acceleration, change in velocity, etc. are discussed in the following sections.
Figure 8 illustrates the curve of acceleration versus time during the downward phase of the plunger. The plunger slides and its acceleration rapidly increases from 0 m/s2 to 14.04 m/s2 and gradually decreases to 0 m/s2 because the resistance to the plunger also increases with the increase in plunger velocity, thereby resulting in a gradual decrease in column acceleration. When the force reaches equilibrium, the resistance to the plunger and the velocity of the plunger stabilize, and the acceleration decreases to 0 m/s2. When the plunger enters liquid slip, the force equilibrium is disrupted, and the acceleration decreases to −1.19 m/s2. Thereafter, the force equilibrium is established again and the acceleration increases to 0 m/s2. Finally, the velocity reaches a constant value and the plunger slides to the bottom of the well.
The relationship between plunger downtime and velocity is illustrated in Figure 9. At the end of the renewal phase, the plunger began to descend toward the bottom of the well calibrator; the velocity of the plunger gradually increased from 0 to 16.65 m/s, after which the velocity was balanced by a force and uniformly decreased. When the plunger slides into the liquid, the velocity suddenly decreases to 0.74 m/s because the running resistance in the liquid is considerably increased; the resistance to the sliding velocity decreases.
As illustrated in Figure 10, the plunger in the gas column descends within a range of 100 m with decelerated motion. Thus, the first section of the slope increases when the plunger velocity increases. When the plunger force reaches equilibrium, the velocity stabilizes, and the acceleration is 0 m/s2. Thus, the plunger maintains a uniform motion with constant velocity during the downward motion in the gas column, and the slope remains constant. When the plunger moves into the liquid column, the resistance suddenly increases and the plunger velocity decreases. Subsequently, the force reaches equilibrium again and the motion is uniform until the plunger reaches the bottom of the well.

3.3. Operating Parameters of the Pressure Build-Up Phase

The relevant operating parameters for gas well pressure build-up can be obtained from Equations (15) and (17), and the build-up tubing pressure and casing pressure of the gas well are obtained by calculating the operating results as follows.
The variations in tubing pressure and casing pressure are illustrated in Figure 11. After the well is opened for production, the gas stored in the casing pushes the plunger up and the tubing pressure and casing pressure gradually decrease. When the plunger liquid section reaches the wellhead and starts to discharge, the tubing pressure is equal to the liquid surface pressure in the liquid section and increases. Then, the tubing pressure gradually decreases again during the renewal phase. When the tubing pressure and casing pressure decrease to a constant value and the well is shut down, the tubing pressure and casing pressure increase again before the next cycle.

4. Production System and Production Parameter Design

The optimization of the plunger lift process primarily requires the optimization of the well shut-in time. The longer the shut-in time, the higher the formation energy recovery, thereby resulting in the accumulation of more gas in the oil jacket annulus, discharge of more water in a single cycle, and increase in the single renewal production time. However, because of the longer production time during the single renewal flow, the depletion of gas-well energy and production decrease compared with the critical carrying flow rate, thereby causing fluid accumulation in the wellbore and delayed well start-up. Moreover, with increased production time, more formation energy is consumed and the well shut-in build-up is prolonged, thereby severely influencing the efficiency of the plunger lift. Table 2 displays production data of well X1 and well X2 at Su 59 area for different lift fluid volumes and casing pressure, which were inputted as variables in the program.
According to the simulation analysis of the plunger production system, the amount of lift fluid increases with the increase in the casing pressure. Furthermore, the rise time of the plunger decreases, but the well shut-down increases, thereby causing the pressure to increase and the lift operation cycle to be prolonged. As displayed in Table 2, in the same operating cycle, the amount of fluid discharge in the plunger should decrease each time to enable the quick build-up of the tubing pressure and casing pressure and initiation of the next cycle of operation; therefore, for the same operating time, the number of drainage runs and the amount of gas production increase. The plunger lift of well X1 and well X2 induces a casing pressure of 4 MPa and an operating cycle of 151 min, wherein the well is opened for production for 35 min and closed for 116 min to maximize gas recovery.
Maximum gas production of well X1 is achieved at a casing pressure of 4 MPa and a lift volume of 0.09362 m3, and maximum gas production of well X2 is achieved at a casing pressure of 4 MPa and a lift volume of 0.2411 m3. Table 3 displays the design parameters of the model for the gas-production regime.

5. Conclusions

The plunger lift simulations and analyses can make out the following conclusion. At the beginning of the ascent of the plunger from the bottom of the well, the plunger velocity is low, but the pressure at the lower end of the plunger is high, and the shear leakage in the plunger is zero. The shear leakage increases and plunger gap leakage occurs with an increase in the plunger velocity. When the plunger velocity is equal to the leakage velocity, shear leakage increases with the increase in plunger velocity. Finally, we get the working system under the maximum gas production. The plunger lift of well X1 and well X2 induces a casing pressure of 4 MPa and an operating cycle of 151 min, wherein the well is opened for production for 35 min and closed for 116 min to maximize gas recovery.

Author Contributions

Conceptualization, W.C. and H.Z; methodology, W.C.; software, S.L.; validation, W.C., H.Z. and Z.H.; formal analysis, X.M.; investigation, W.C.; resources, W.C., H.Z. and K.Z.; data curation, Z.H.; writing—original draft preparation, W.C. and H.Z.; writing—review and editing, W.C. and H.Z.; visualization, Z.H.; supervision, X.M.; project administration, W.C.; funding acquisition, W.C. All authors have read and agreed to the published version of the manuscript.

Funding

This research is supported by the Postgraduate Innovation and Practice Ability Development Fund of Xi’an Shiyou University (No. YCS22213042).

Data Availability Statement

The data that support the findings of this study can be provided by the corresponding author upon reasonable request.

Acknowledgments

We thank all the reviewers who participated in the review.

Conflicts of Interest

The authors declare no conflict of interest.

References

  1. Xu, J.; Chen, Z.; Wu, K.; Li, R.; Liu, X.; Zhan, J. On the flow regime model for fast estimation of tight sandstone gas apparent permeability in high-pressure reservoirs. Energy Sources Part A Recovery Util. Environ. Eff. 2019, 41, 1–12. [Google Scholar] [CrossRef]
  2. Dongbo, H.; Guang, J.; Qianfeng, J.; Lihua, C.; Dewei, M.; Guoting, W.; Zhi, G.; Minhua, C.; Jiangchen, H. Differential development technological measures for high-water-cut tight sandstone gas reservoirs in western area of Sulige Gas Field. Nat. Gas Ind. 2022, 42, 73–82. [Google Scholar]
  3. Tugan, M.F. Deliquification techniques for conventional and unconventional gas wells: Review, field cases and lessons learned for mitigation of liquid loading. J. Nat. Gas Sci. Eng. 2020, 83, 103568. [Google Scholar] [CrossRef]
  4. Yu, R. A few points on the plunger lift of gas well deliquification. Drill. Prod. Technol. 1994, 17, 82–85. [Google Scholar]
  5. Foss, D.L.; Gaul, R.B. Plunger-life performance criteria with operating experience-ventura avenue field. In Drilling and Production Practice; American Petroleum Institute: Washington, DC, USA, 1965; pp. 124–130. [Google Scholar]
  6. Zhao, Q.; Zhang, L.; Liu, Z.; Wang, H.; Yao, J.; Zhang, X.; Yu, R.; Zhou, T.; Kang, L. A Big Data Method Based on Random BP Neural Network and Its Application for Analyzing Influencing Factors on Productivity of Shale Gas Wells. Energies 2022, 15, 2526. [Google Scholar] [CrossRef]
  7. He, S.; Wu, Z. Establishment of dynamic model for plunger gas lift. Acta Pet. Sin. 2005, 26, 88–92. [Google Scholar]
  8. He, S.; Wu, Z. Analysis the influence factors of plunger gas lift and optimizing design. Nat. Gas Ind. 2005, 25, 97–99+178. [Google Scholar]
  9. Wang, Z.; Sun, T.; Yang, Z.; Zhu, G.; Shi, H. Interactions between Two Deformable Droplets in Tandem Fixed in a Gas Flow Field of a Gas Well. Appl. Sci. 2021, 11, 11220. [Google Scholar] [CrossRef]
  10. Amani, P.; Rudolph, V.; Hurter, S.; Firouzi, M. Sustainable dewatering of unconventional gas wells using engineered multiphase flow dynamics. Fuel 2022, 324, 124675. [Google Scholar] [CrossRef]
  11. Hari, S.; Krishna, S.; Patel, M.; Bhatia, P.; Vij, R.K. Influence of wellhead pressure and water cut in the optimization of oil production from gas lifted wells. Pet. Res. 2022, 7, 253–262. [Google Scholar] [CrossRef]
  12. Sayman, O.; Jones, K.; Hale, R.; Pereyra, E.; Sarica, C. A field case study of plunger lift related tubing deformation. J. Nat. Gas Sci. Eng. 2022, 97, 104342. [Google Scholar] [CrossRef]
  13. Hashmi, G.M.; Hasan, A.R.; Kabir, C.S. Simplified modeling of plunger-lift assisted production in gas wells. J. Nat. Gas Sci. Eng. 2018, 52, 454–460. [Google Scholar] [CrossRef]
  14. Han, G.; Ma, G.; Gao, Y.; Zhang, H.; Ling, K. A new transient model to simulate and optimize liquid unloading with coiled tubing conveyed gas lift. J. Pet. Sci. Eng. 2021, 200, 108394. [Google Scholar] [CrossRef]
  15. Guerra, L.A.O.; Temer, B.O.; Loureiro, J.B.R.; Silva Freire, A.P. Experimental study of gas-lift systems with inclined gas jets. J. Pet. Sci. Eng. 2022, 216, 110749. [Google Scholar] [CrossRef]
  16. Akhiiartdinov, A.; Pereyra, E.; Sarica, C.; Severino, J. Data Analytics Application for Conventional Plunger Lift Modeling and Optimization. In Proceedings of the SPE Artificial Lift Conference and Exhibition—Americas, Virtual, 10–12 November 2020. [Google Scholar]
  17. Sayman, O.; Pereyra, E.; Sarica, C. Comprehensive Fall Velocity Study on Continuous Flow Plungers. SPE Prod. Oper. 2021, 36, 604–623. [Google Scholar] [CrossRef]
  18. Zhao, K.; Tian, W.; Li, X.; Bai, B. A physical model for liquid leakage flow rate during plunger lifting process in gas wells. J. Nat. Gas Sci. Eng. 2018, 49, 32–40. [Google Scholar] [CrossRef]
  19. Zhao, Q.; Zhu, J.; Cao, G.; Zhu, H.; Zhang, H.-Q. Transient Modeling of Plunger Lift for Gas Well Deliquification. SPE J. 2021, 26, 2928–2947. [Google Scholar] [CrossRef]
  20. Carpenter, C. Transient Plunger-Lift Model Improves Prediction of Liquid Unloading From Gas Wells. J. Pet. Technol. 2020, 72, 50–51. [Google Scholar] [CrossRef]
  21. Shi, H.; Liu, J.; Luo, W.; Ding, Y.; Li, R.; Liao, R. Study on Liquid Leakage Model of Rod Plunger Gas Lift. J. Xi’an Shiyou Univ. (Nat. Sci. Ed.) 2022, 37, 101–106+136. [Google Scholar] [CrossRef]
  22. Yin, B.; Pan, S.; Zhang, X.; Wang, Z.; Sun, B.; Liu, H.; Zhang, Q. Effect of Oil Viscosity on Flow Pattern Transition of Upward Gas-Oil Two-Phase Flow in Vertical Concentric Annulus. SPE J. 2022, 27, 3283–3296. [Google Scholar] [CrossRef]
  23. Zhao, K.; Mu, L.; Tian, W.; Bai, B. Transient Process of Gas Liquid Flow Sealing in Plunger Lift Method. J. Eng. Thermophys. 2020, 41, 1133–1138. [Google Scholar]
  24. Zhao, K.; Mu, L.; Tian, W.; Bai, B. Gas-liquid flow seal in the smooth annulus during plunger lifting process in gas wells. J. Nat. Gas Sci. Eng. 2021, 95, 104195. [Google Scholar] [CrossRef]
  25. Guo, W.; Zhang, X.; Kang, L.; Gao, J.; Liu, Y. Investigation of Flowback Behaviours in Hydraulically Fractured Shale Gas Well Based on Physical Driven Method. Energies 2022, 15, 325. [Google Scholar] [CrossRef]
  26. Huang, H.; Sun, Y.; Chang, X.; Wu, Z.; Li, M.; Qu, S. Experimental Investigation of Pore Characteristics and Permeability in Coal-Measure Sandstones in Jixi Basin, China. Energies 2022, 15, 5898. [Google Scholar] [CrossRef]
  27. Peng, C.; Feng, D.; Long, H. Assessing the Contribution of Natural Gas Exploitation to the Local Economic Growth in China. Energies 2022, 15, 5853. [Google Scholar] [CrossRef]
Figure 1. (a) Uplink phase; (b) Continuous phase; (c) Downside Phase in the gas column; (d) Downside Phase in liquid; (e) Pressure build-up phase.
Energies 16 01359 g001
Figure 2. The workflow diagram.
Energies 16 01359 g002
Figure 3. Production data of well X1 in the Su 59 area.
Energies 16 01359 g003
Figure 4. Upward and renewal phase displacement and velocity of the plunger.
Energies 16 01359 g004
Figure 5. Variation in tubing and casing pressure during the upward and renewal phases.
Energies 16 01359 g005
Figure 6. Relationship between velocity and leakage.
Energies 16 01359 g006
Figure 7. Variation in gas production.
Energies 16 01359 g007
Figure 8. Variation in the downward acceleration of the plunger.
Energies 16 01359 g008
Figure 9. Variation in the downward velocity of the plunger.
Energies 16 01359 g009
Figure 10. Downward displacement of the plunger.
Energies 16 01359 g010
Figure 11. Variations in tubing pressure and casing pressure.
Energies 16 01359 g011
Table 1. Basic data of X1 well in Su 59 area.
Depth in the Middle of the Production Layer (m)Depth of Oil Pipe Penetration (m)External Diameter of Oil Pipe (mm)Casing Inner Diameter (mm)Well Bottom Temperature (K)Tubing Pressure during Well Opening (MPa)External Transmission Pressure (MPa)
372036707312739341
Current Static Pressure (MPa)Snap-In Depth (m)Oil Pipe Inner Diameter (mm)Wellhead Temperature (K)Relative Density of Water (-)Casing Pressure during Well Opening (MPa)
163660623131.0534
Table 2. Gas production in different work system designs.
Well NameCasing Pressure (MPa)Operation Cycle (min/c)Periodicity Liquid Production Volume (m3/c)Cyclic Gas Production (m3/c)Daily Gas Production Capacity (m3/d)Daily Cycle Number of Times (c/d)
X141510.09362108810,368.649.53
X143370.187248233514.214.27
X154110.28086105036753.5
X165270.332213943763.82.7
X176500.3748817343814.82.2
X241510.2411182715,164.18.3
X243370.512814635705.73.9
X254110.625216765363.23.2
X265270.800122695672.52.5
X276500.909128336232.62.2
Table 3. Gas-well design parameters.
Well NameSingle Cycle Lifting Fluid Volume (m3/c)Maximum Casing Pressure (MPa)Average Casing Pressure (MPa)Gas Demand (m3/c)Gas-to-Liquid Ratio (m3/m3)Number of Daily Cycles (c/d)Daily Gas Production (m3/d)Daily Liquid Production Volume (m3/d)Oil Pipe down Depth (m)
X10.09443.396108840009.5310,368.640.8963670
X20.24143.192182735008.315,164.12.0013350
Disclaimer/Publisher’s Note: The statements, opinions and data contained in all publications are solely those of the individual author(s) and contributor(s) and not of MDPI and/or the editor(s). MDPI and/or the editor(s) disclaim responsibility for any injury to people or property resulting from any ideas, methods, instructions or products referred to in the content.

