Abstract
Due to the large size of offshore wind turbine blades (OWTBs) and the corrosive nature of salt water, OWTs need to be safer and more reliable that their onshore counterparts. To ensure blade reliability, an accurate and computationally efficient structural dynamic model is an essential ingredient. If damage occurs to the structure, the intrinsic properties will change, e.g., stiffness reduction. Therefore, the blade’s dynamic characteristics will differ from those of the intact ones. Hence, symptoms of the damage are reflected in the dynamic characteristics that can be extracted from the damaged blade. Thus, damage identification in OWTBs has become a significant research focus. In this study, modal model characteristics were used for developing an effective damage detection method for WTBs. The technique was used to identify the performance of the blade’s sections and discover the warning signs of damage. The method was based on a vibration-based technique. It was adopted by investigating the influence of reduced blade element rigidity and its effect on the other blade elements. A computational structural dynamics model using Rayleigh beam theory was employed to investigate the behaviour of each blade section. The National Renewable Energy Laboratory (NREL) 5MW blade benchmark was used to demonstrate the behaviour of different blade elements. Compared to previous studies in the literature, where only the simple structures were used, the present study offers a more comprehensive method to identify damage and determine the performance of complicated WTB sections. This technique can be implemented to identify the damage’s existence, and for diagnosis and decision support. The element most sensitive to damage was element number 14, which is NACA_64_618.
1. Introduction
Generally, the sensitivity of wind turbine blade sections can be defined as changes introduced into the blade’s inherent dynamic characteristics that may adversely influence its operational performance. The identification of the blade’s dynamic characteristics has received much attention recently because of its significance in blade health monitoring and structural model updating. The dynamic parameters of the blade that are extracted from the sensing data primarily depend on the locations of sensors [1]. The problem of locating sensors on a spatial lattice structure with the aim of maximising the data information was considered in [2], where the structural dynamic behaviour could be fully characterised. The study [3] presented a driving point identification method considering multiple driving points. The study assumed that preliminary numerical models’ natural frequencies and eigenvectors are available for planning.
The study [4] monitored a wind turbine blade under different operating conditions by using strain gauges, laser interferometry, and photogrammetry. A 2.5MW WTB was chosen for studying its defects by conducting an operational modal analysis due to the non-requirement of excitation data. The results showed that the operating conditions should be stable during the vibration measurements [4]. In another study, a vibration-based method was applied for arch bridges to detect, locate, and quantify damage to structural components [5]. The adopted procedure developed modified forms of modal flexibility and modal strain energy indices coupled with the Artificial Neural Network [4]. A numerical SHM method using operational modal analysis was developed in [6]. Several accelerators on the wind turbine blade and tower captured signals to analyse in FAST software. The study [6] recommended that the CMS, as a damage index, is the index with the most potential to detect damage location and its severity. The modal parameters were functions of a structure’s physical properties. If there is any damage in any section along the blade span, the blade rigidity will be reduced. The reduction in the blade’s stiffness causes a change in natural frequencies and increases the corresponding mode shapes [7]. Natural frequencies are the first signs that are widely used to predict the state condition of a structure [8]. Although changes in natural frequencies can be easily detected, they cannot provide sufficient information about the existence of damage as they are global properties of the structure. Using the difference in mode shapes may represent an adequate method to detect the sensitivity of blade elements to damage. However, using mode shapes has some drawbacks. The measured mode shapes may be affected by environmental noise or inconsistent sensor positions [9]. Derivations of mode shapes can be used to detect damage as they are more sensitive to small perturbations than mode shape displacements [9]. A simply supported beam model was used in [10] for damage detection according to the changes in CMS. The proposed approach in [11] was a damage index built on the investigation of the presence of discontinuities in CMS in a damaged beam structure identified by a lack of smoothness obtained using the Laplacian operator for the element nodes. The work reported in [12] introduced a modified Laplacian operator to curvature for identifying damaged blades.
For large offshore wind turbines, the hollow blade is made from a multi-layer composite material, and its dynamic characteristics change depending on various factors [13]. Cracks and delamination may occur within the blade structure and cause a change in the blade’s dynamic parameters. Several complications may be found during the inspection process. According to [14], there are shortcomings in the previous studies related to WTB inspection. For example, the large size of offshore wind turbine blades requires numerous sensors to increase the result accuracy, and multiple damage needs dense sensor networks [15]. Moreover, microcracks are one of the damage types that are difficult to detect. They lead to a reduction in material properties such as the stiffness and the stability of the blade and may induce a catastrophic material failure [16]. Furthermore, the locations of the sensors need more examination because it is complicated to estimate the location of a defect precisely. Research related to the sensing tools that are applied to structural health monitoring has also been a focus in recent studies [14]. Therefore, it is vital to study the behaviour of the different blade sections related to damage detection. The novelty of this paper is to demonstrate the effectiveness of using the change in the modal characteristics to identify the damage. The curvature difference (CD) was determined for each blade element, and its influence on its vicinity was investigated. Comparison of the CD between the healthy blade and its damaged counterpart was employed. The CD index can be used to identify the damage, its location, and its severity. Furthermore, the MAC index was used by employing the higher mode shapes. The results found that the element most sensitive to the damage was element number 14, which is NACA_64_618.
2. Model-Based Damage Identification
Structural vibration problems present a significant hazard and design limitation for wind turbine blades. The structural integrity of blades is of paramount concern [17,18], and a thorough and precise knowledge of their dynamic characteristics is essential. Healthy blade performance can be identified based on analysing its modal parameters. Damage index techniques can be used to detect the blade elements’ performance. These can include some, or all, of the structure’s parameters. These parameters include the natural frequencies, mode shapes, and CMS. These parameters can be employed to investigate the health condition and evaluate the reliability of wind turbine blades.
Any alterations in mass, for example, due to ice accumulation, stiffness, damping due to damage or internal defects, or unpredictable excitation force, will cause variations in their values. The vibration indices based on the modal parameters are used to identify the likely failure of a blade at an early stage before those levels reach unacceptable values [19].
3. Structural Free Vibration Analysis
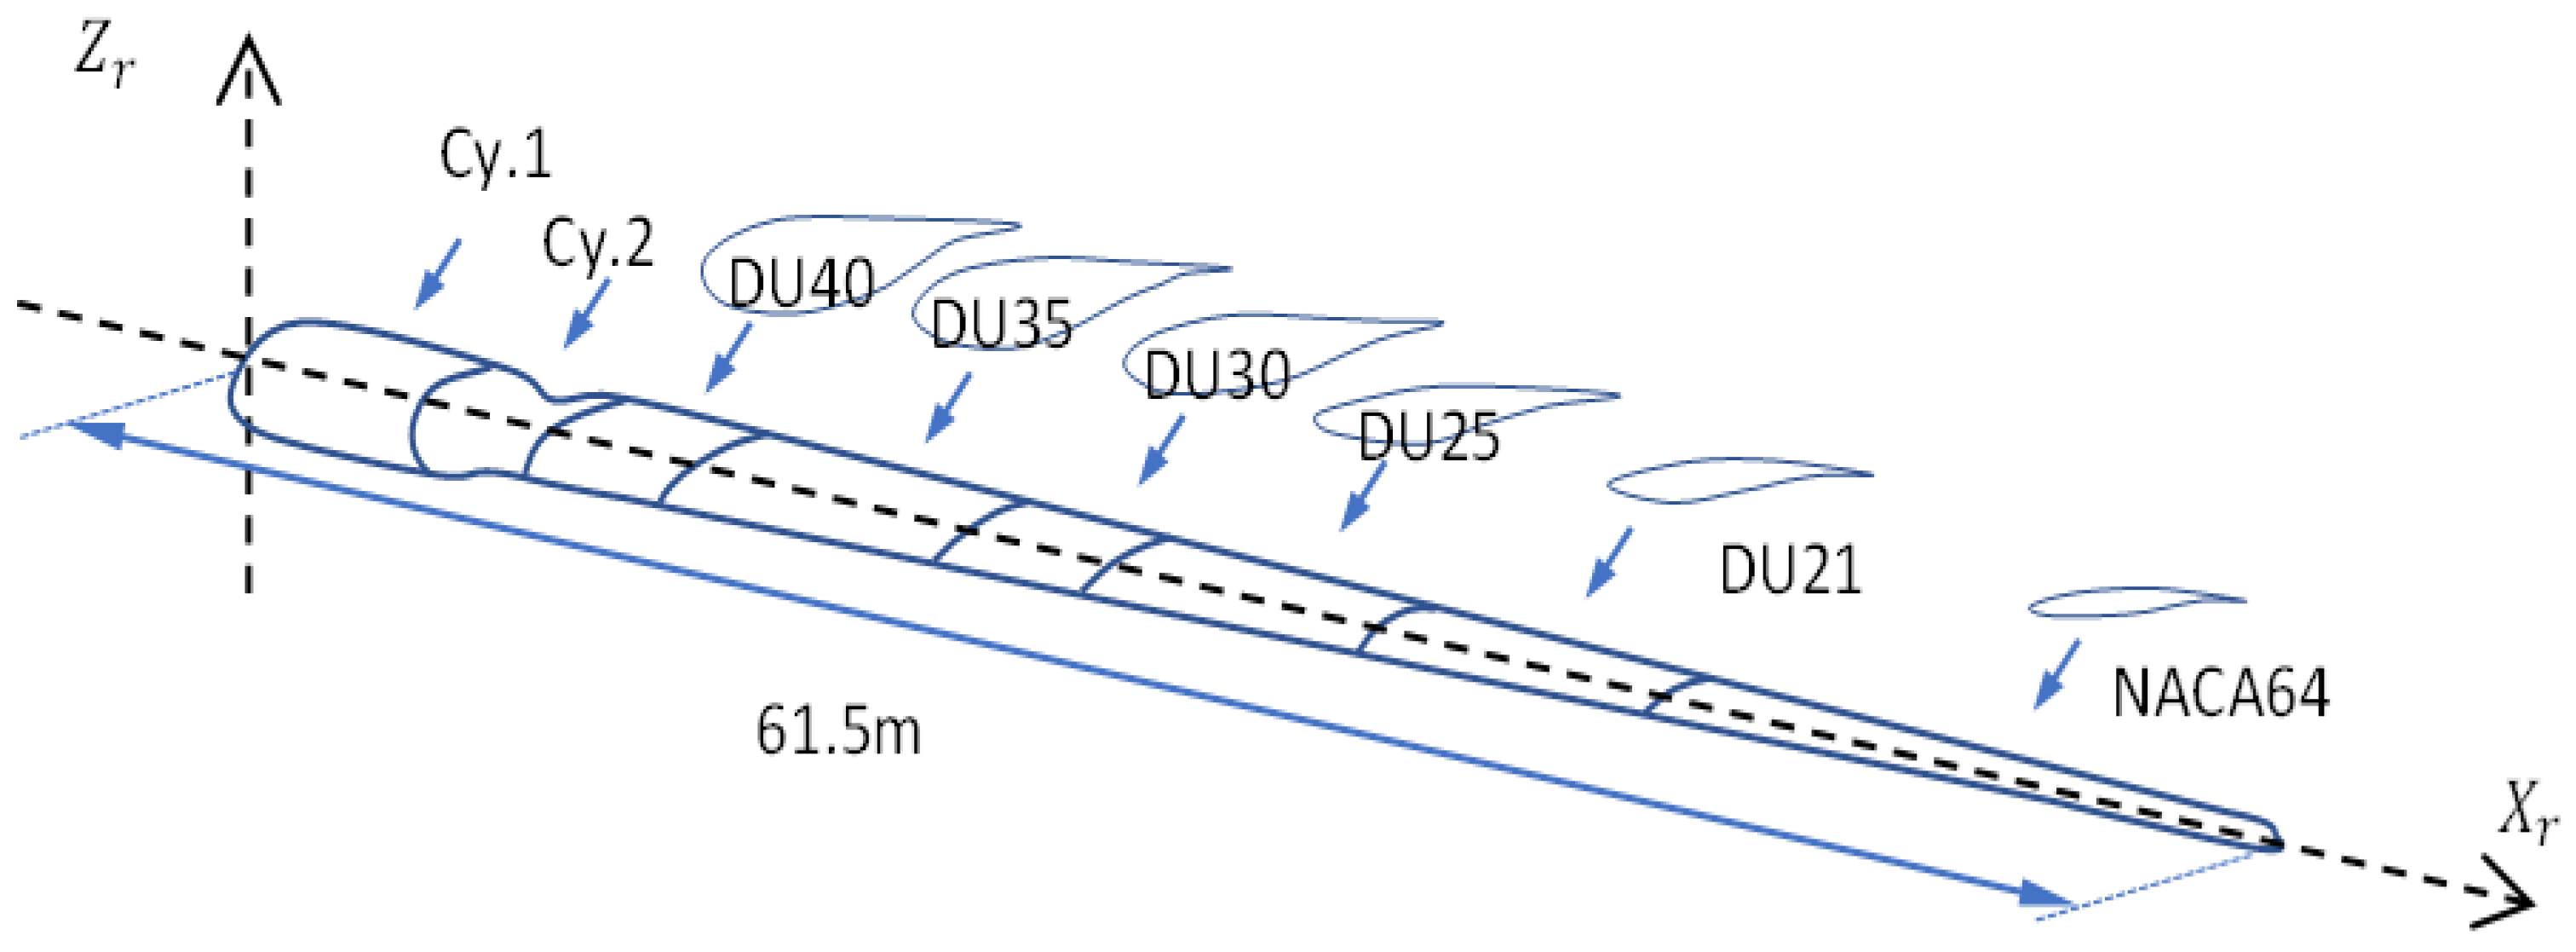
Blade deformation can be expressed by the superposition of static displacement (time independent) and dynamic behaviour due to the influence of rotational speed and the gravity force component included in the analysis [19]. In the present application, the 5MW NREL [13] wind turbine blade was used as a benchmark in order to have a high-fidelity model to emulate the HAWT blade. As shown in Figure 1, the blade was modelled by a cantilever beam with variable cross-sections. One end of the blade was fixed to a rigid hub with radius R, and the other was free. The blade was considered to rotate at an angular velocity.
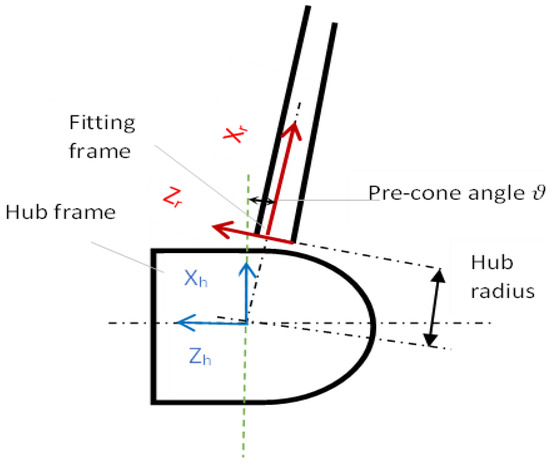
Figure 1.
Blade root coordinate frames for 5MW wind turbine blade.
Free vibration analysis includes modal analysis where the dynamic characteristics of the blade are extracted, such as natural frequencies, mode shapes, and CMS.
Modal Analysis
Modal analysis can determine the modal characteristics of blade structure [20]. These characteristics represent the natural frequencies, mode shapes, and damping properties and reflect the healthy condition of the blade. Generally, the form of the matrix equation for a wind turbine blade subjected to different external forces [21]
where is defined as a sectional column matrix of displacement, is a sectional column matrix of velocity, and = is a column matrix of acceleration, is the aerodynamic load in the out-of-plane direction, are the blade’s sectional mass, damping, and stiffness matrices, respectively, is the blade radius at element and [22]. In order to determine the dynamic characteristics, modal analysis is carried out without regard to the influence of aerodynamic load and damping. The free vibration equation derived from Equation (1) is
By working out the feature equation, the modal characteristics can be obtained as
where is the squares of the natural frequencies of the blade, and is the master degree of freedom vector of the same blade structure. Then, the relationship between the frequencies, blade rigidity, and mass can be expressed as
where is the natural frequency at mode number, is the stiffness of the blade, and is the structure mass.
Through Equation (3), the structure’s stiffness will reduce if a blade is damaged, and the natural frequencies will decrease. Therefore, the sensitivity of the dynamic characteristics toward the damage may be worked out.
The governing equation out-of-plane was obtained in [23] as:
, and is the pre-cone angle, as shown in Figure 1.
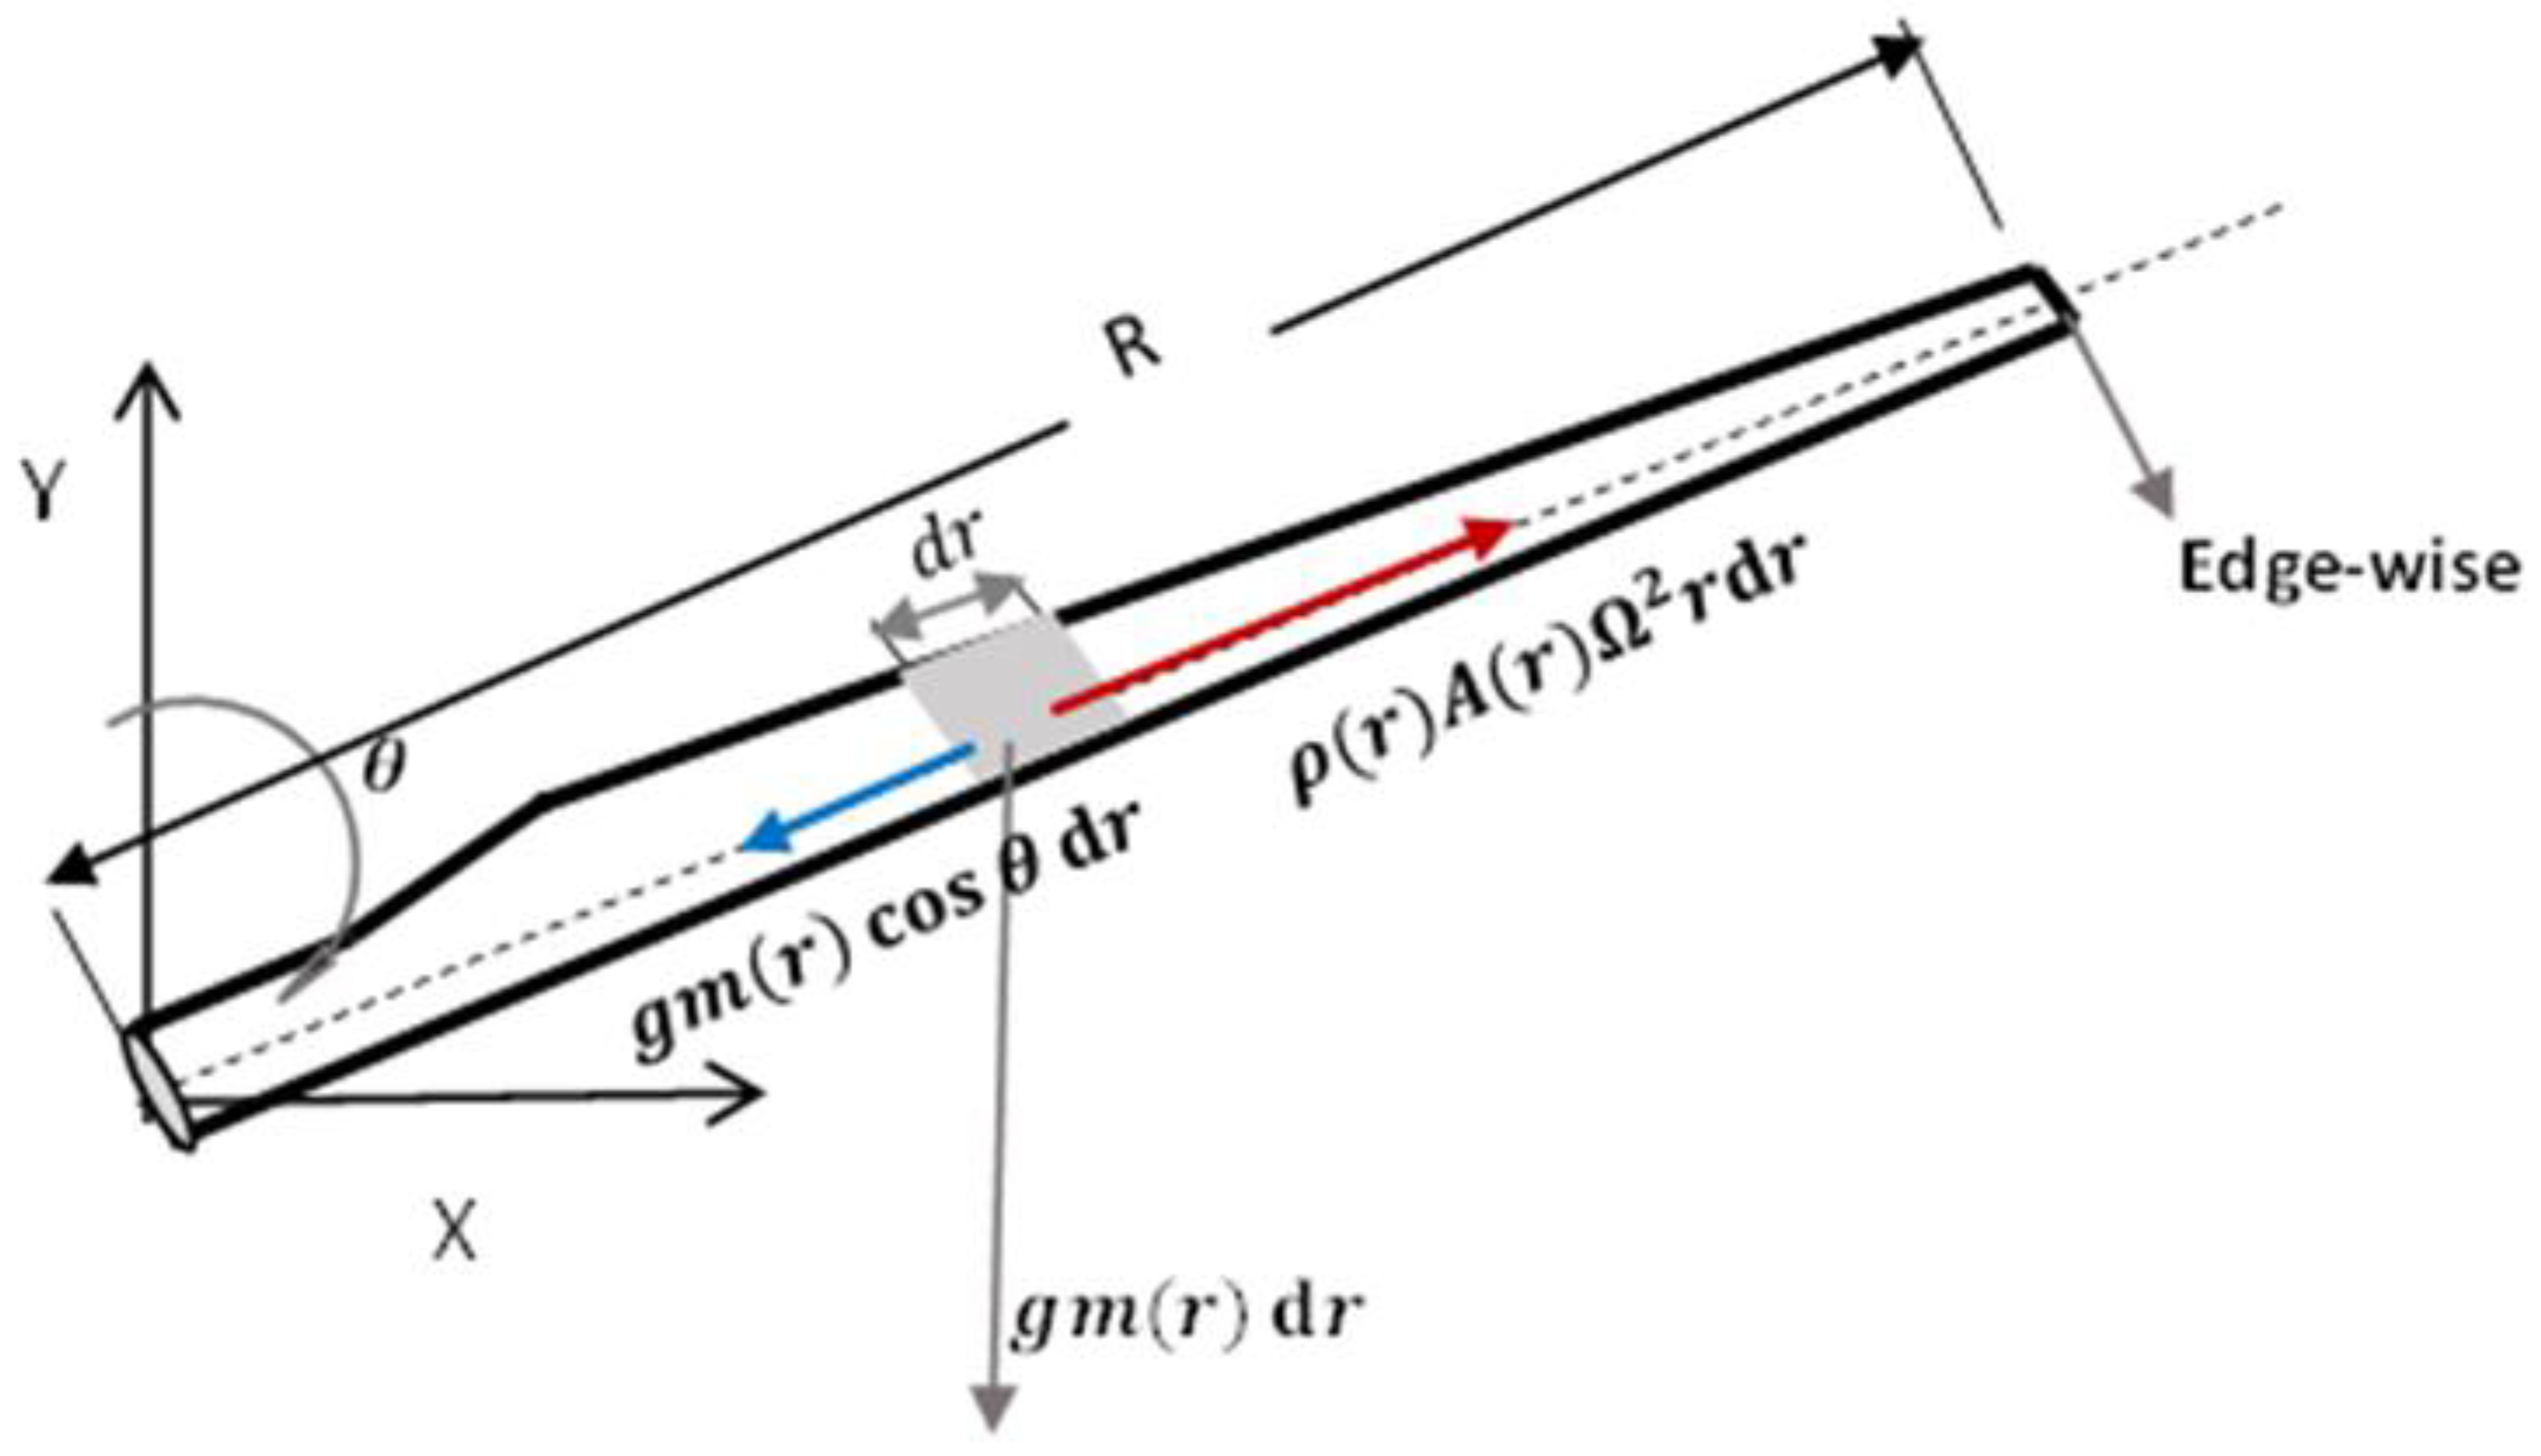
where is the axial tension due to the centrifugal force and the gravitational force component at a distance from the centre of rotation, as shown in Figure 2.
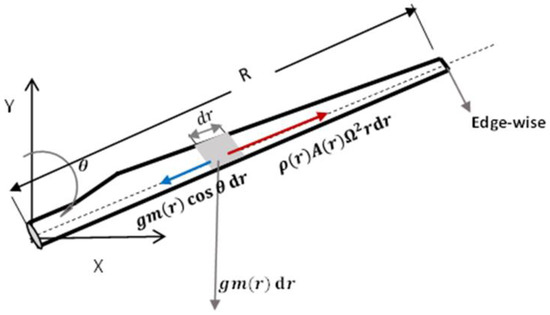
Figure 2.
The restoring force due to centrifugal force and axial component of gravity force.
The last term in Equation (15) is the result of adding the effects of pre-cone and pitch angles [23]:
The governing equation of the flap-wise deformation, Equation (5), is transformed to the general form of the matrix equations for free vibration of N degree of freedom system as indicated in Equations (2) and (3). The local intact mass and stiffness matrices for each element are [23]:
In the above equations, represents the blade density, its cross-sectional area in the out-of-plane direction at a distance relative to the blade span, blade moment of inertia, is the blade length, angular velocity of the blade, pre-cone angle, pitch angle, is the flap-wise bending displacement, and results from adding the effects of pre-cone and pitch angles and this is because of the fact that the axis of rotation is not parallel with the flap-wise direction of the blade [23].
4. Parametrisation of Damage
The blade rigidity reduction was assumed to be a local loss of stiffness along the blade length. This can be parametrised by means of a scalar that qualifies the reduction in the blade sectional stiffness. The intact value of stiffness is multiplied by at the selected location. The parameter of represents the percentage of the damage severity, where . The damage scenarios were considered at the percentages 2% to 10% at different blade sections. For instance, if a 2% damage was adopted at element five at the distance of 16.4 m from the blade root, the stiffness of this element . At each value of damage parameter , the stiffness matrix was recalculated. The value of scalar was consistent with the physics of the damage process, where the value of represents the value of intact stiffness.
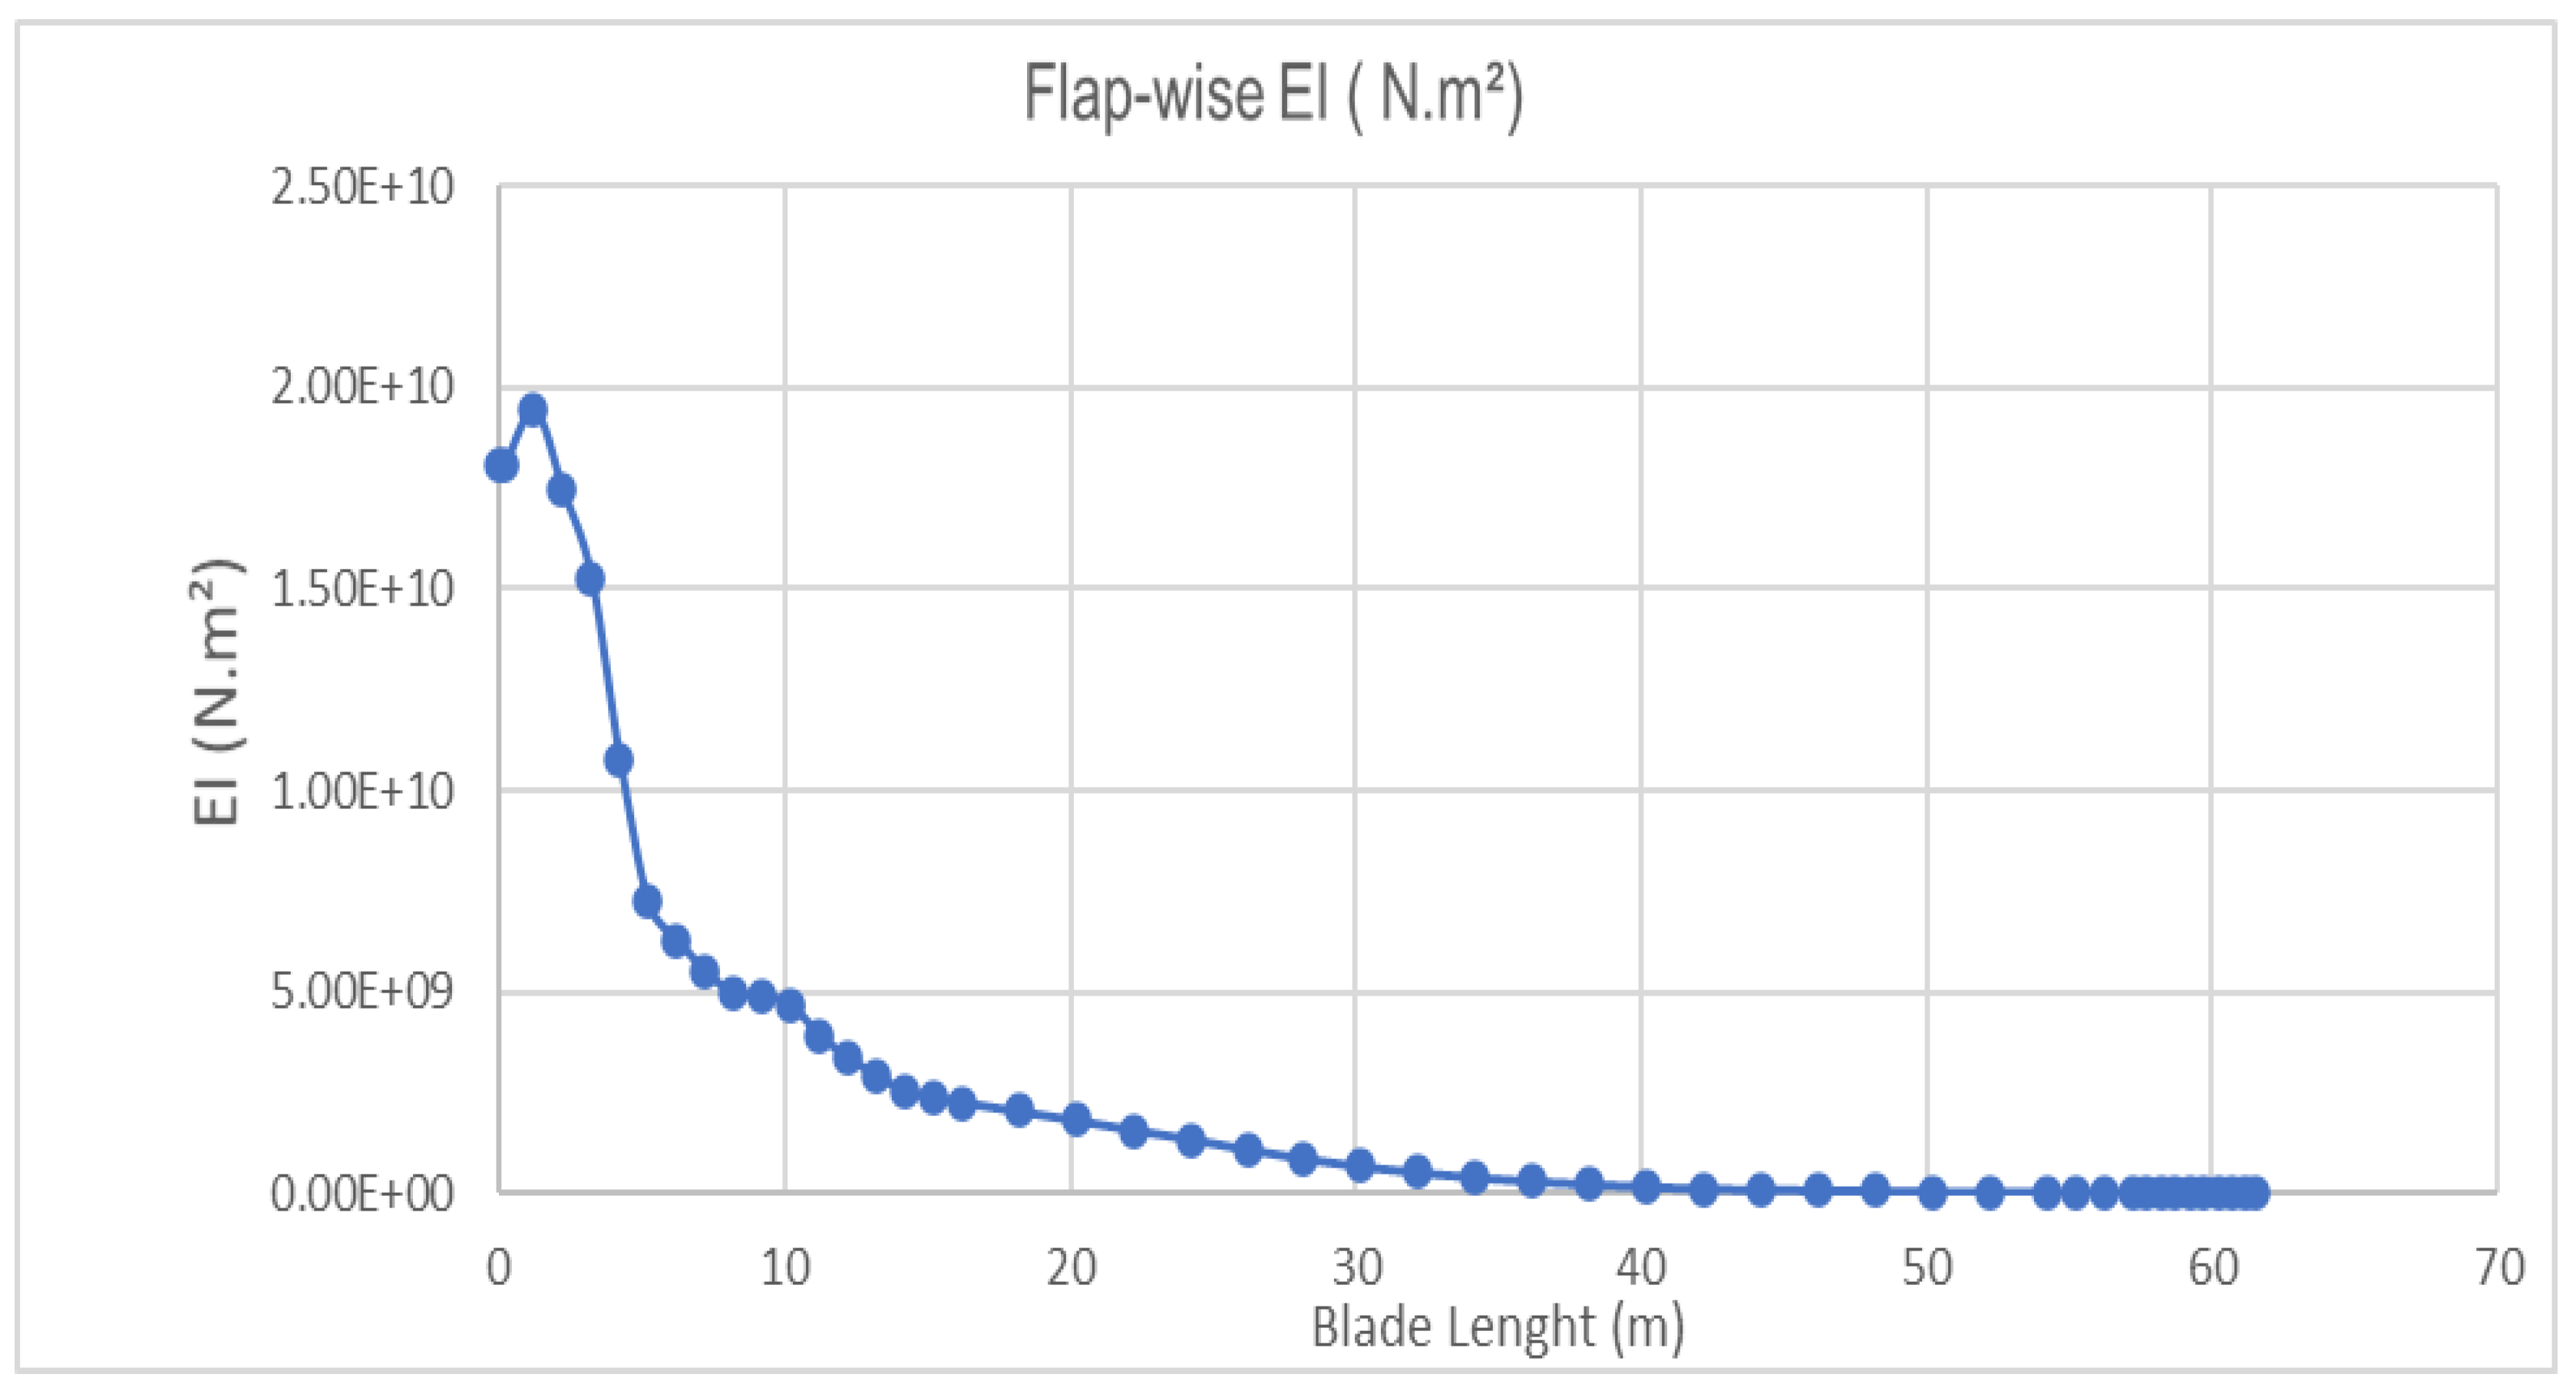
The damage was introduced into the wind turbine blade in the numerical simulation by progressively reducing the stiffness of a certain segment. The stiffness of a specific section was reduced by between 2% to 10% of the value for the intact blade. The lengths of seven different sections along the blade span, and the aerofoil types, are listed in Table 1 [13] for a rated output power of 5MW. Seven different sections of the blade were examined depending on the blade’s aerofoils. Figure 3 shows the 5MW NREL wind turbine blade with the seven chosen sections which were distributed along the blade span. The sections numbers were as shown in the figure. Figure 4 shows the flap-wise flexural rigidity (EI) distribution along the spanwise.

Table 1.
5MW NREL wind turbine blade sections and aerofoils.

Figure 3.
The blade sections and their locations from the root of blade. The length of each section was distributed as: 8.2 + 4.1 + 8.2 + 4.1 + 8.2 + 8.2 + 20.1 = 61.5 m.
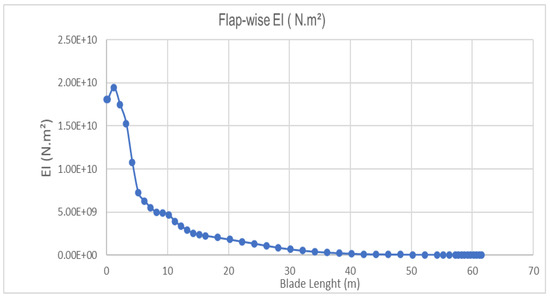
Figure 4.
The flap-wise flexural rigidity (EI) distribution along the spanwise of NREL.
5. Blade Element Performance Based on the Sensitivity Analysis of Modal Parameters
This study’s main idea was to find the blade dynamic characteristics’ sensitivity to the stiffness reduction state. Comparison was made between the natural frequencies, mode shapes, as well as CMS. The largest difference in mode shapes and the minimum or maximum curvature curve between an intact blade and its damaged counterparts often occurs in the vicinity of the damage. The displacement mode shapes can be determined using the FEM. By using the first six mode shapes acquired from the blade’s modal analysis, the displacement mode shapes and the curvature can be calculated. Each blade section along the blade span behaves as a separate entity [21]. The generalised equation for each blade section can be expressed as:
and the feature equation is
where are the local stiffness and mass matrices, the structure eigenvalue at mode , is the eigenvector of the generalised eigenvalue problem at mode , and represents the number degree of freedom.
The mode shape difference can be defined as
where and are the mode shape of the damaged and the intact blade, respectively.
The stiffness matrix, natural frequencies, and mode shapes of the damaged blade can be expressed as:
6. Mode Shape Curvature (MSC)
Changes in the CMS tend to be localised in the damaged region, so the differences between damaged and undamaged blades can be utilised to detect the occurrence and location of the damage. The curvature mode shape is related to the flexural stiffness of the blade element. When damage is introduced at any position along the blade span, it reduces the blade’s stiffness in this damaged region. This will lead to an increase in the magnitude of the curvature in that section. The change in the curvature magnitude increases with reduction in the blade’s stiffness, and the percentage of damage can be obtained from the decrease in blade stiffness.
The flexural rigidity of the blade cross-section is and if the structure is subjected to a bending moment , the curvature mode shape at distance is:
where is the difference in curvature mode shape.
Theoretically, if damage occurs in any blade section, it reduces the blade rigidity and increases the curvature value within the vicinity of the damage location. Therefore, the severity of damage can be estimated from the curvature values distribution. The stiffness reduction is associated with increased curvature values [24]. The curvature at mode can be calculated using central differences as:
where is the mode shape number, the node number, is the mode shape displacement of node at mode , and is the length of the element.
7. Predicting the Location and Severity of Damage
The existence of damage in the HAWT blade can be evaluated by comparing the intact blade parameters and its updating damaged state. In this section, the capability of the CMS in predicting damage location and severity was evaluated.
The damage indices may be represented by any change in blade physical characteristics such as the natural frequencies, mode shapes, and CMS. In this section, predicting the severity of damage was introduced based on the CMS index to monitor the damaged structure and take it out of service before failure.
The healthy curvature of the intact blade element of the first mode can be expressed as:
The damaged curvature of the damaged blade element can be expressed as:
where is the intact curvature of mode number and is the damaged curvature of the same element number. is the mode shape vector of mode and is the damaged mode shape of the same mode number. If mode number one is chosen to define the curvature mode shape index, is a dimensionless parameter which is defined as
where is a parameter depending on the value of curvature at the selected mode. However, any reduction in the blade stiffness at any element along the blade span will reduce the value of .
8. Fitness Function
Suitable sets of measurement locations can be verified using the Modal Assurance Criterion (MAC). A good candidate set of measurement locations are those in which all the off-diagonal terms in the MAC matrix are small [25]. The MAC value is bounded between 0 and 1, with any value near 0 indicating a poor degree of correlation between the sets of mode shapes being compared. Thus, each mode shape must be sufficiently different from the other modes to avoid spatial aliasing [25]. The least square method is based on linear regression analysis and provides an index that is most sensitive to the largest difference between any comparative pairs of mode shape vectors.
The MAC is calculated as the normalised scalar product of the chosen mode shape vectors and . The resulting scalars are tabulated in the MAC matrix:
The MAC index can be represented as fitness functions, where the MAC matrix is used to construct the other two objective functions [2]. The first is the average value of all the off-diagonal elements in the MAC matrix, while the second is the largest value in all the off-diagonal elements. The reason for the selection of these fitness functions is that the MAC matrix will be diagonal for an optimal sensor placement strategy, so the size of the off-diagonal elements can be taken as an indication of the fitness [2].
The MAC1 represents the fitness function as
where and are different mode shape numbers.
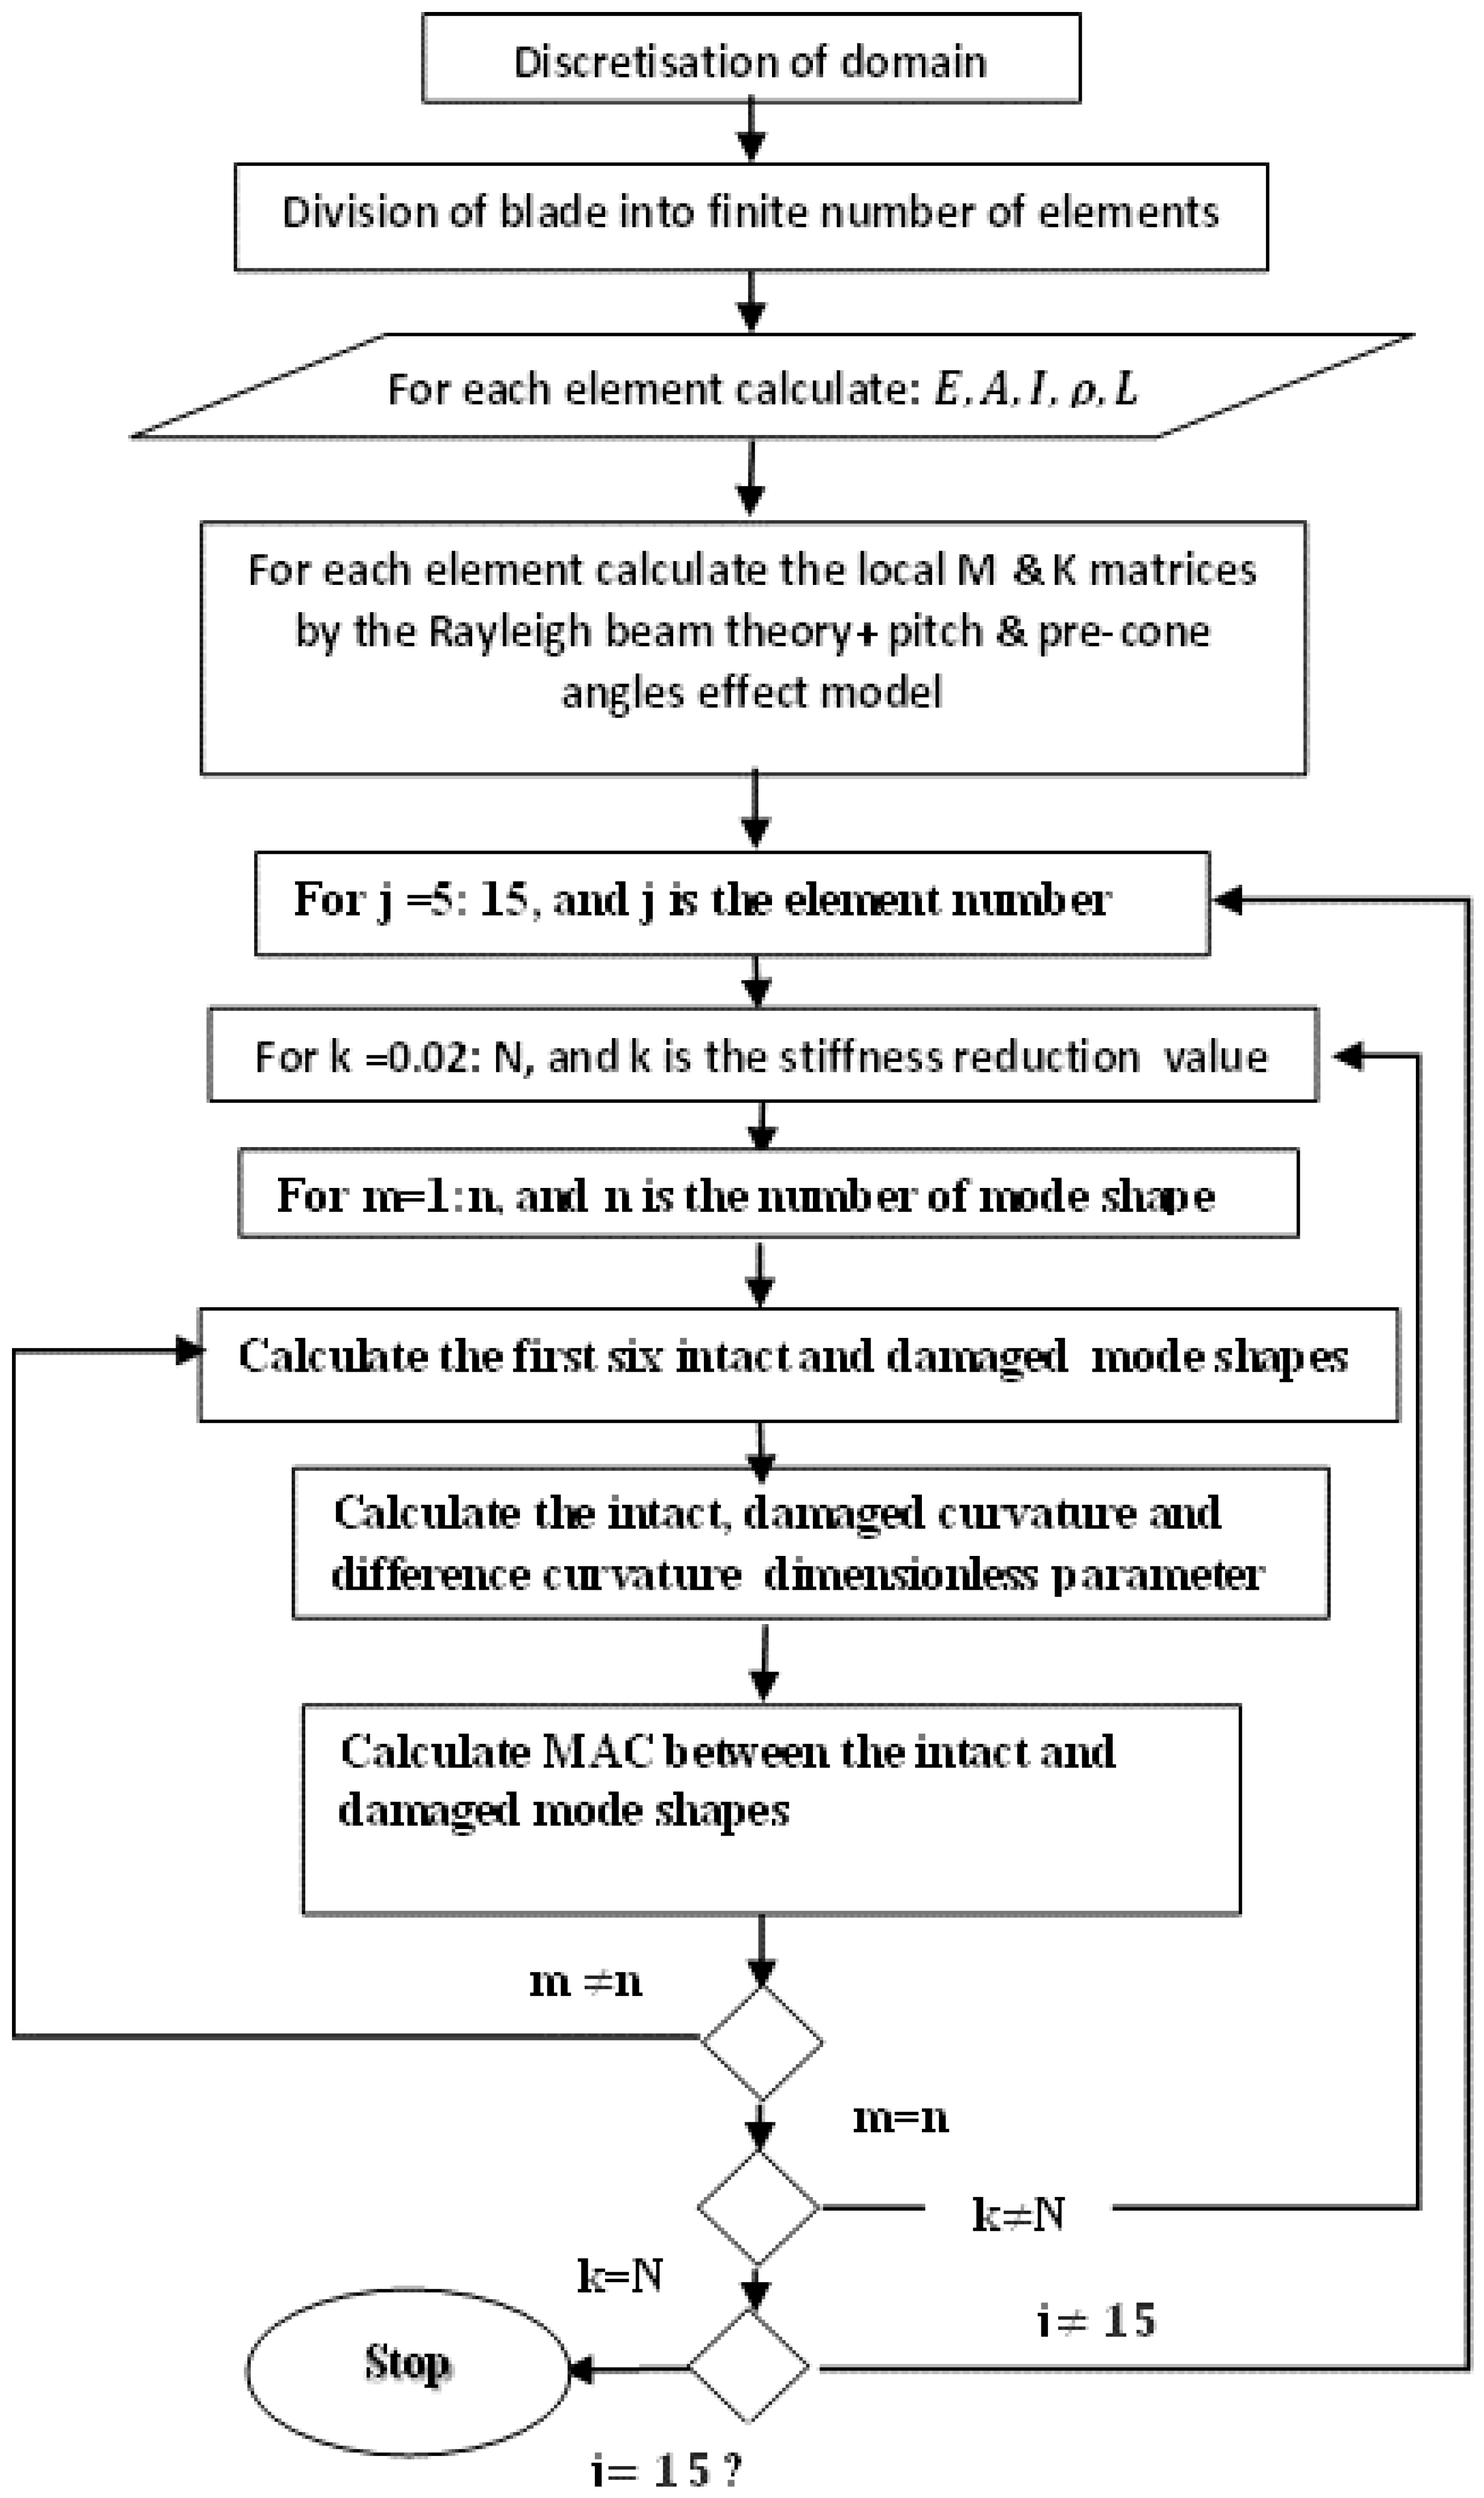
Figure 5 shows the flowchart of natural frequencies, the first six mode shapes, and the MAC and curvature extraction procedures.

Figure 5.
Flowchart of the natural frequencies and the MAC and curvature extraction procedures.
9. Results and Discussion
The algorithm procedure of this study is demonstrated in Figure 5. The National Renewable Energy Laboratory (NREL) 5MW reference wind turbine was chosen in this study. It is an upwind three-blade horizontal-axis multi-megawatt wind turbine. Based on Table 1, the blade is divided into 17 different elements. The rotor radius and the hub diameter of the blade are about 63 m and 3 m, respectively. According to the Composite Material Fatigue Database [26], the elastic material property data and mass density are listed in Table 2. Properties for triaxial material, which are denoted as SNL Triax, were determined by averaging the test-derived data for the uni-axial and double bias material [26]. The gross properties of the 5MW NREL blade, as shown in Figure 5, are represented in Table 3 [13]. By using the FE method and free vibration analysis [23] with data from [20,21], the first ten natural frequency results of a single 5MW NREL blade without aerodynamic forces are computed from Equations (5)–(8) are listed in Table 4.
Table 2.
The gross properties of the NREL 5MW wind turbine blade.
Table 3.
Material property data selected from Doe/MSU database [26].
Table 4.
Natural frequencies (Hz) for the first 10 modes in the out-of-plane direction, and results from [27,28] of NREL 5MW HAWT blade.
The damage prognosis tool is vital for blade lifetime assessment, and it can also be used to estimate when the blade must be taken out of service before its failure. The curvature mode shape and MAC indices were implemented to predict the damage severity using Equations (17)–(21). The first six modes of the intact blade and their damaged counterparts were used to find the values of the damage parameters.
In order to demonstrate the capability of capturing the vibration behaviour of the 15 chosen locations along the blade span, the curvature and MAC indices were used to identify the degree of change in the blade’s modal parameters. To do this, the damage scenarios were assumed to be at 2% to 5% for all the mentioned locations and 10% for the last blade element.
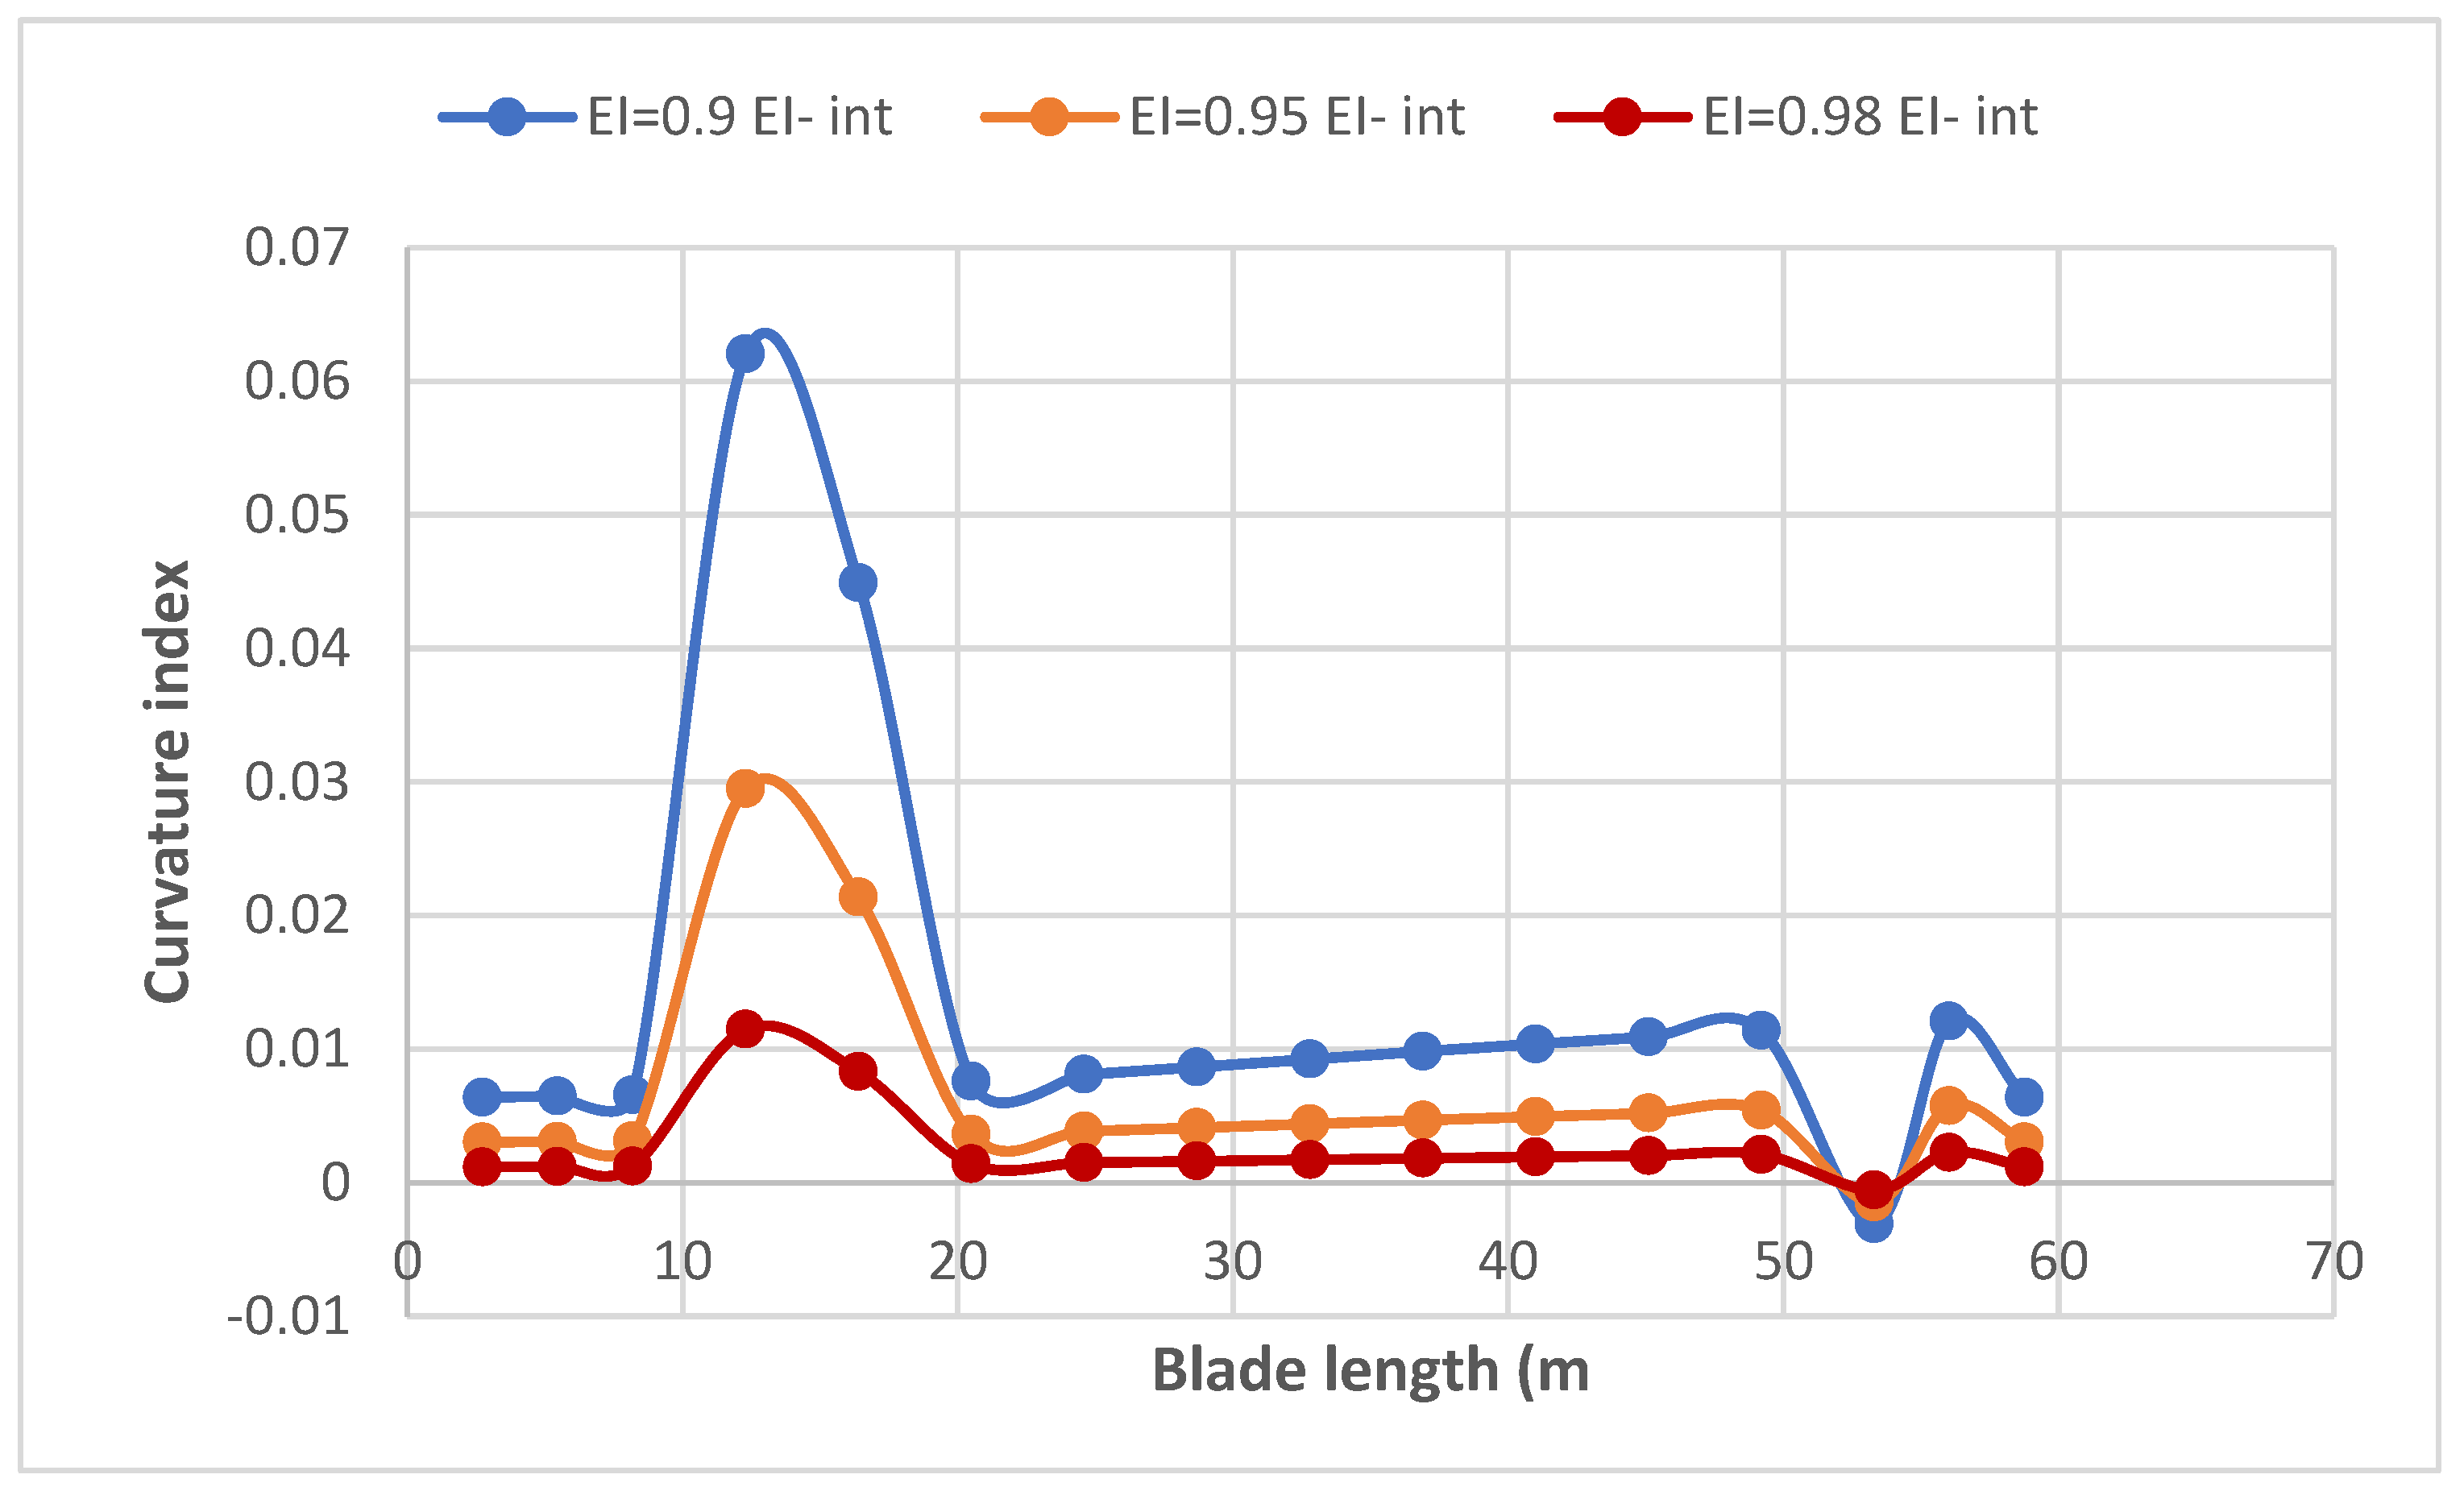
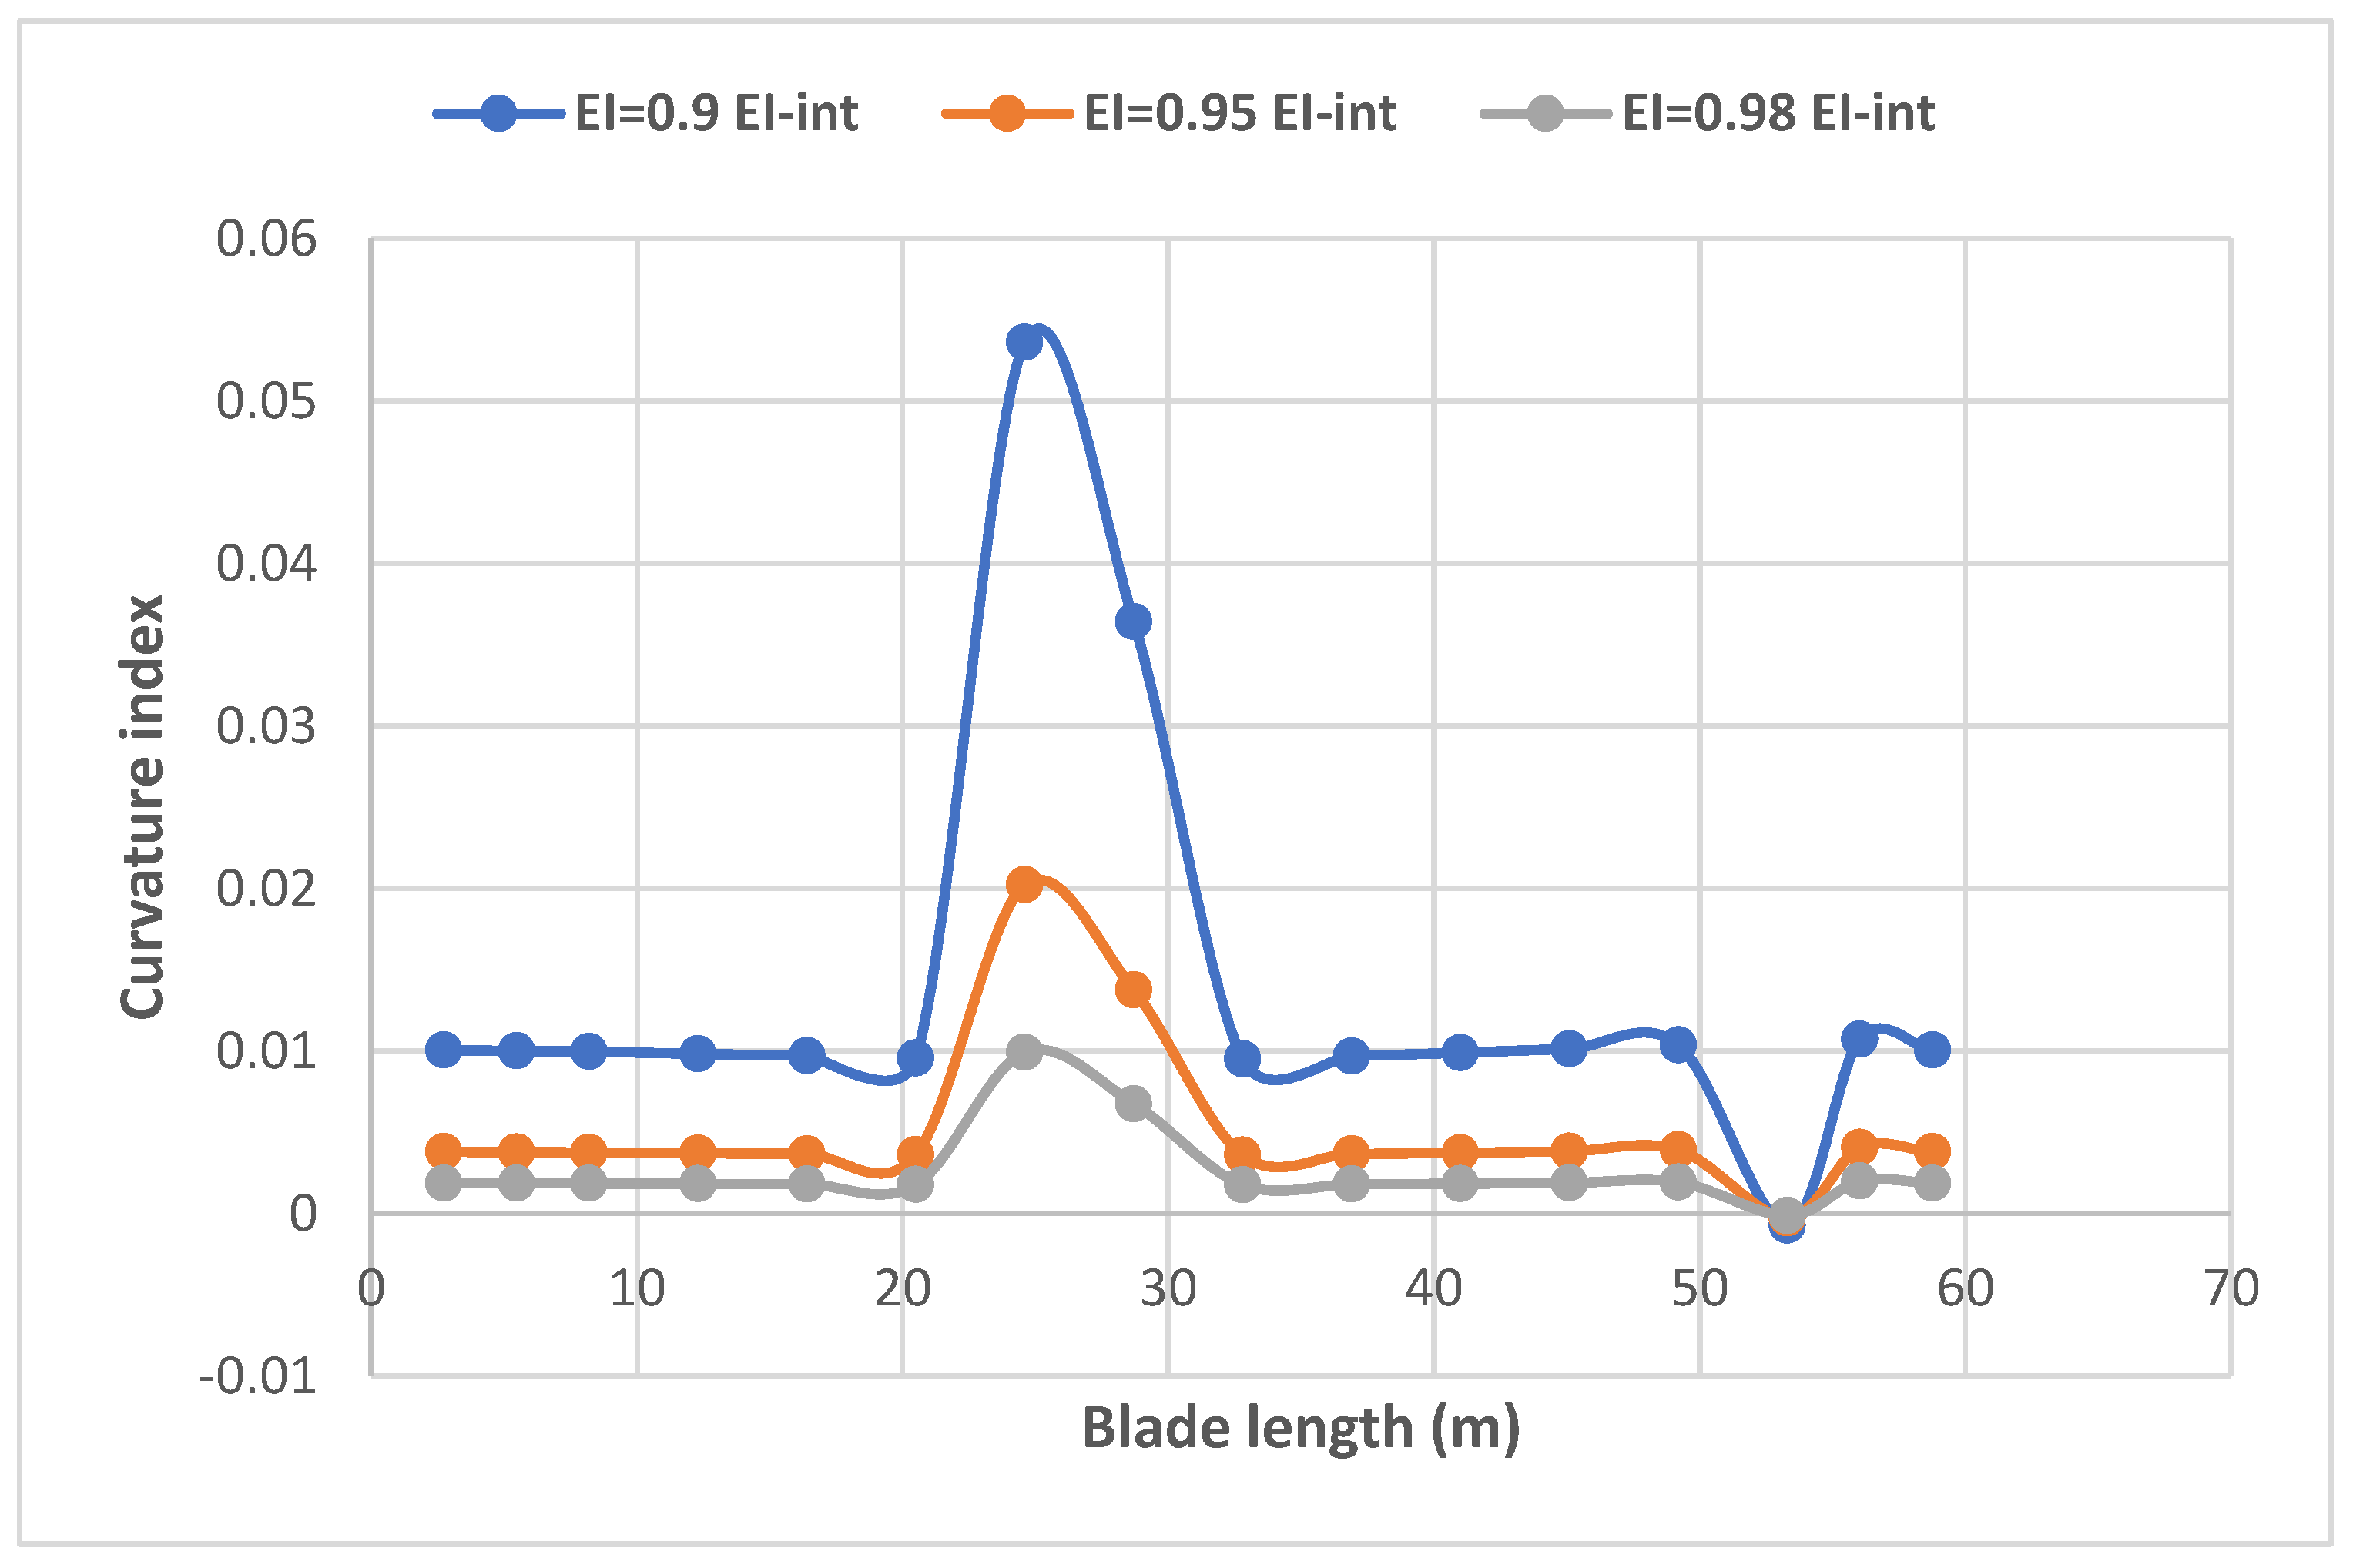
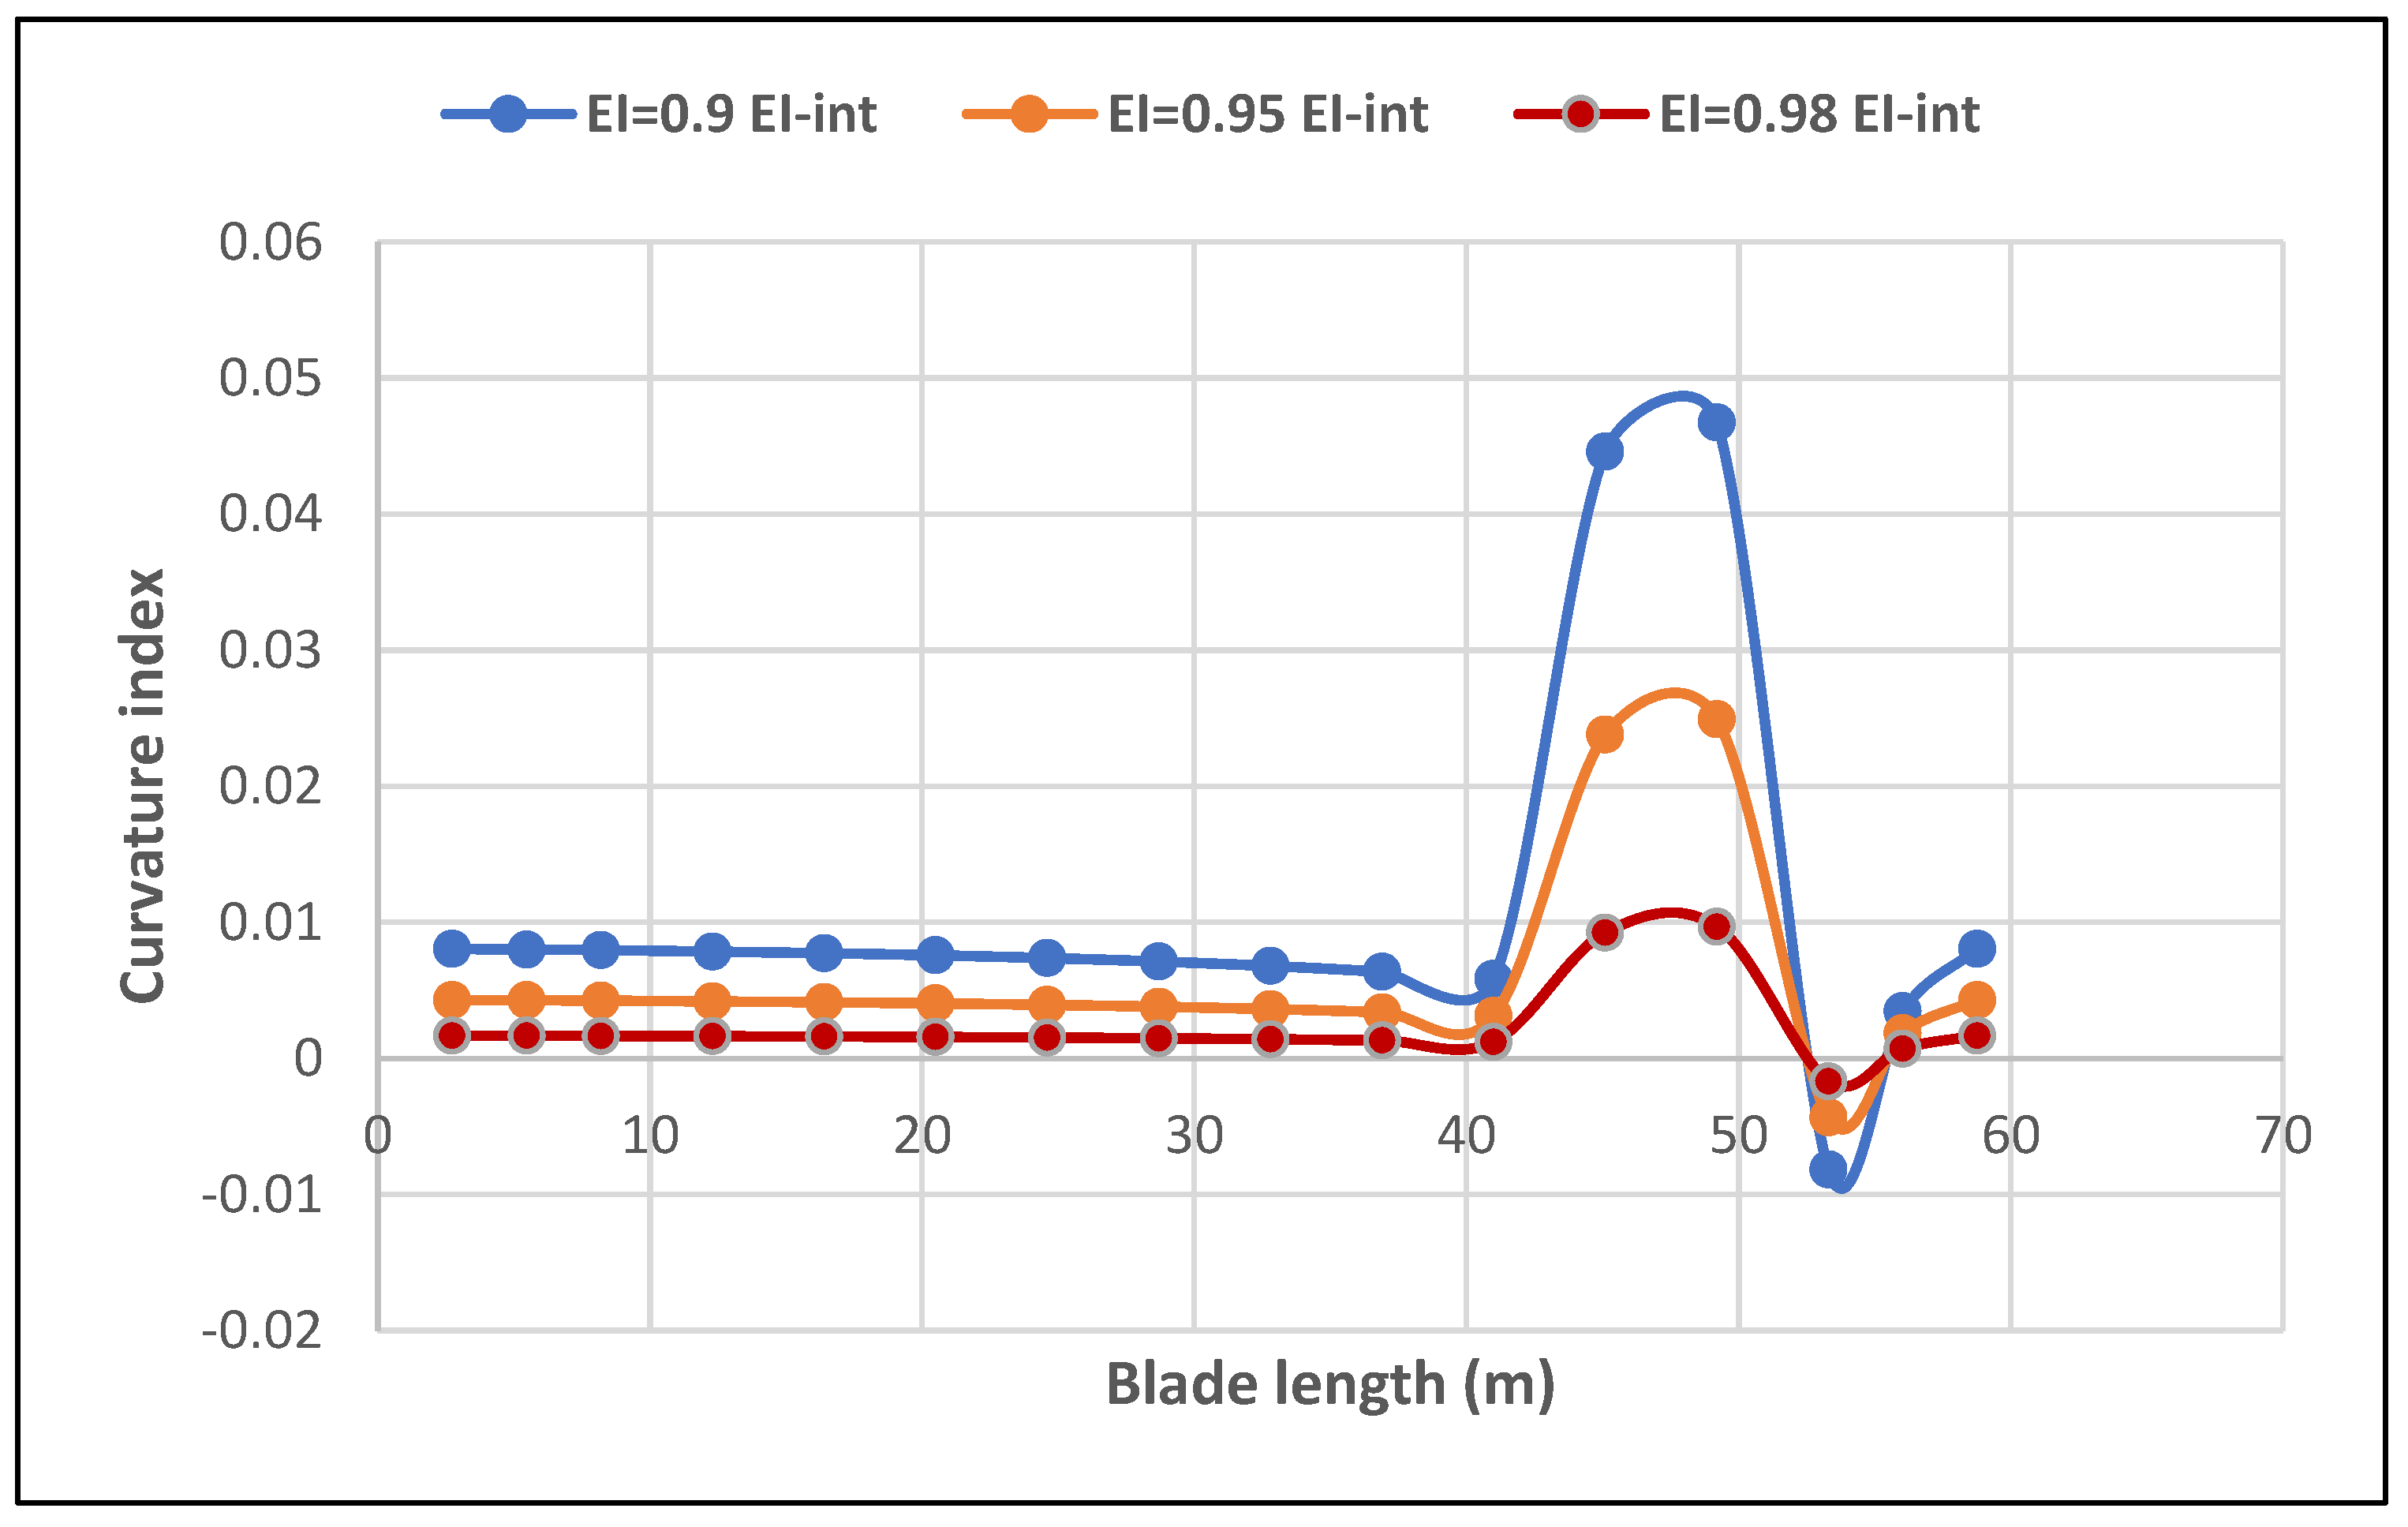
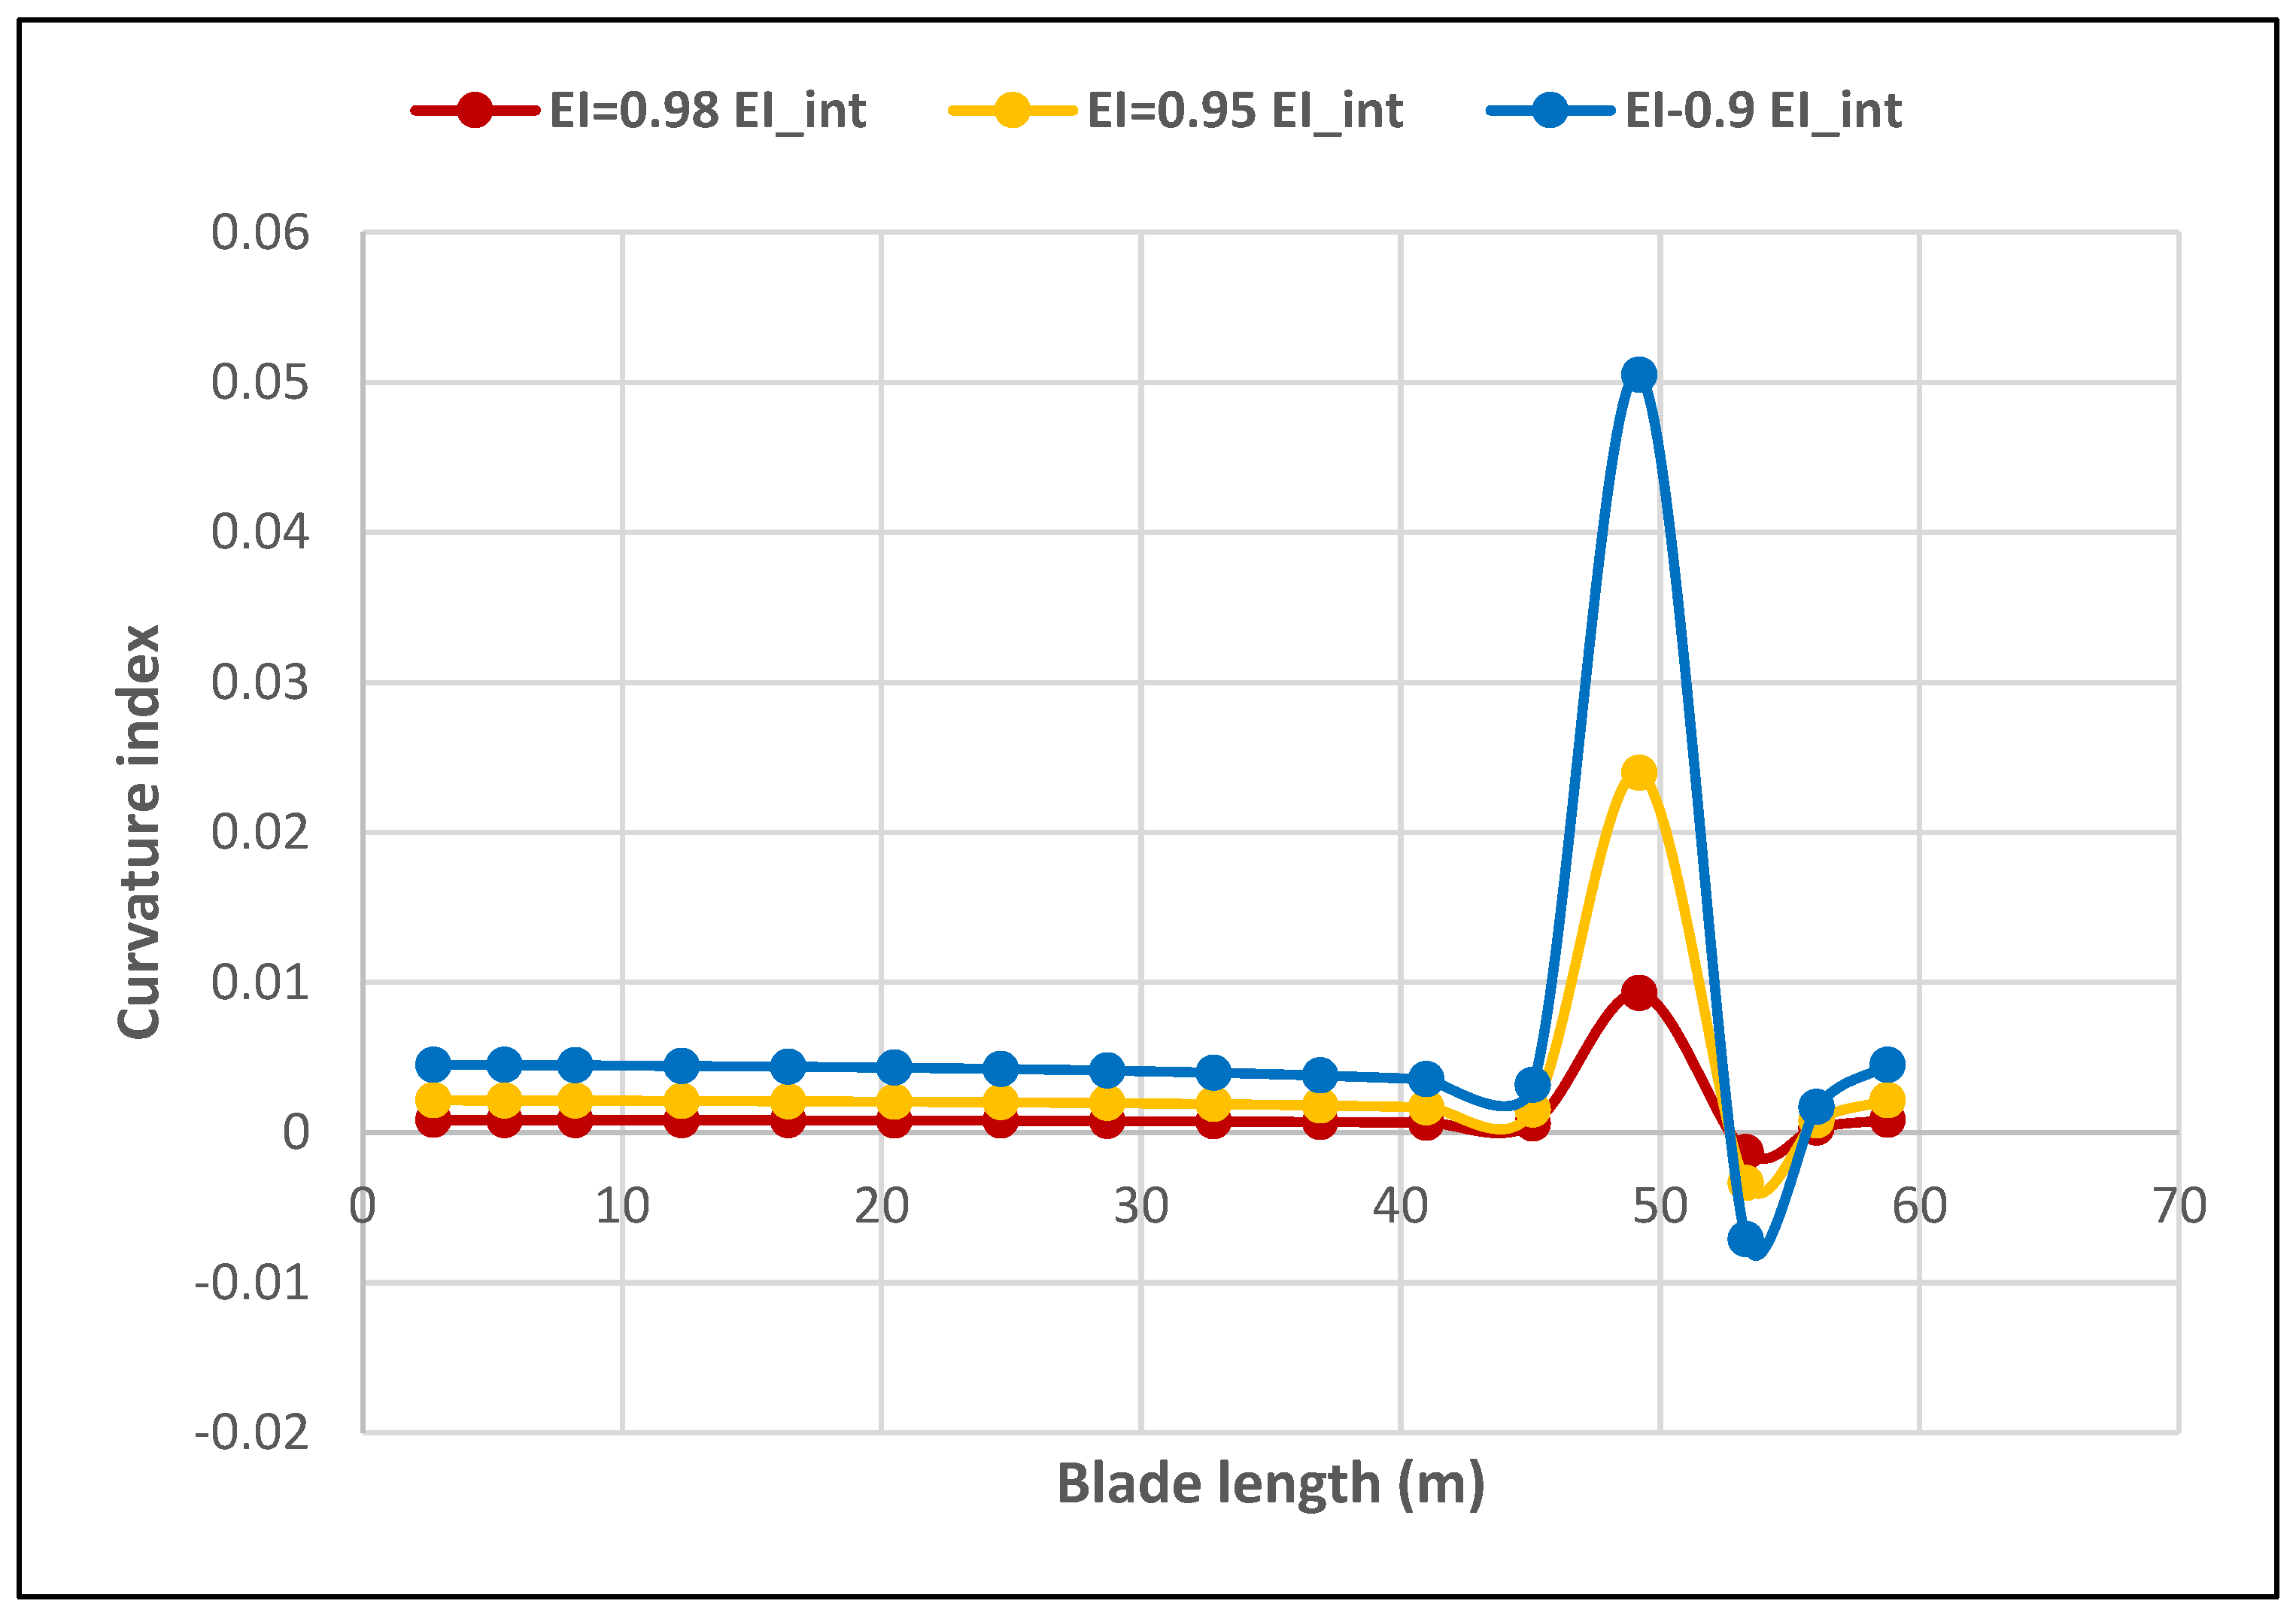
Figure 6 demonstrates the damage index distribution along the blade span using the first mode shape in the flap-wise direction. In order to evaluate the fifth element’s behaviour and its influence on the other blade sections, the stiffness reduction coefficients 0.98, 0.95, and 0.9 were chosen. The figure shows that the damage index has abruptly risen at node 5 for all the reduction in stiffness values. The curvature index value started increasing at node 4 and reached the peak at node 5, and then decreased to the minimum value at node 7. Moreover, the curve started increasing directly after node 7 to reach the second peak before node 14, and decreased again to the minimum value at node 15. It can be noticed that the two values of the vicinity before and after node 14 had the same value.
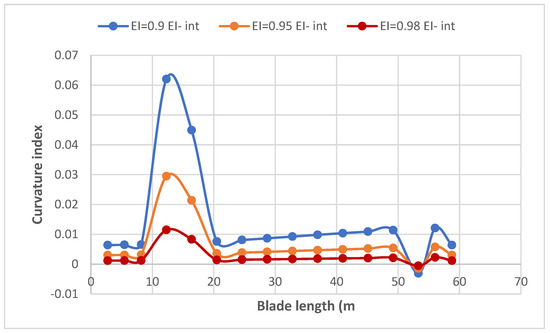
Figure 6.
The variation in the calculated damage index along the blade span for 5MW NREL blade as affected by different stiffness reductions at 16.4 m from the blade root.
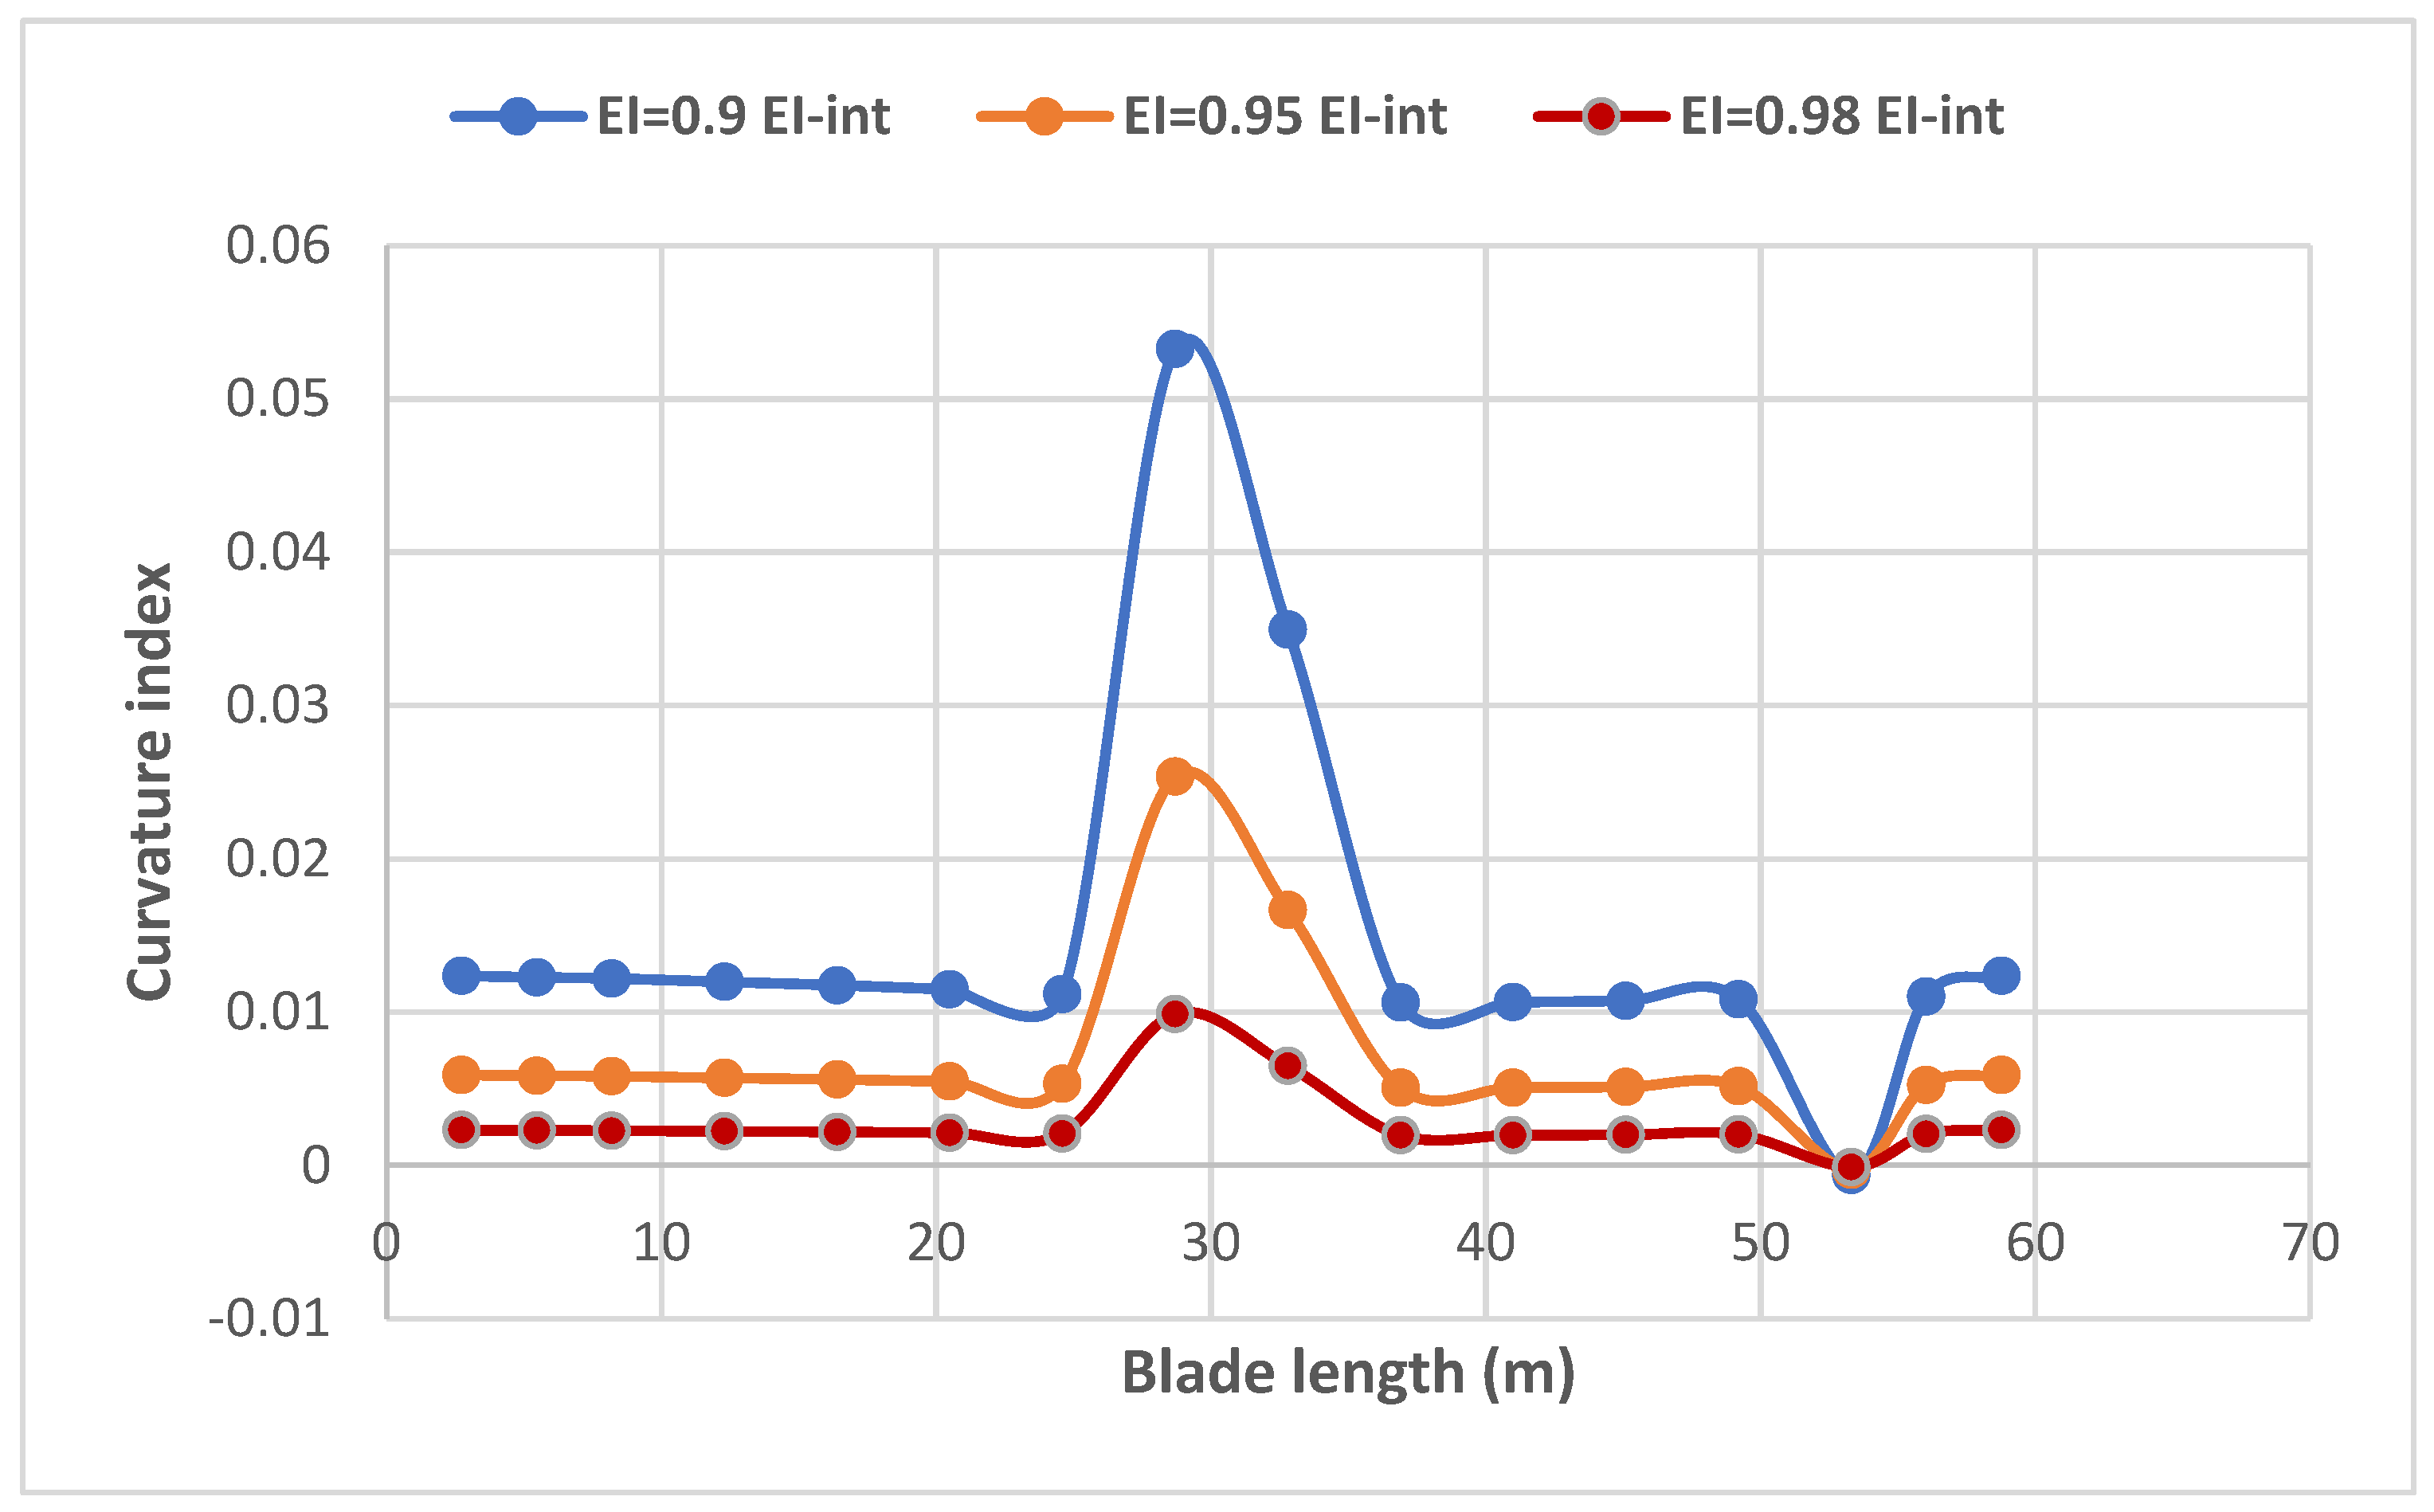
The variation in the calculated curvature deference index distribution as the effects of reduced rigidity at element seven is demonstrated in Figure 7. The index distribution followed the same trends as in Figure 6 despite all the peak values being less than those in Figure 6 The stiffness reduction coefficients at 0.98, 0.95, and 0.9 were chosen to be the same in all figures. The same behaviour of node 14 can be observed with the suddenly decreasing curve to node 15.
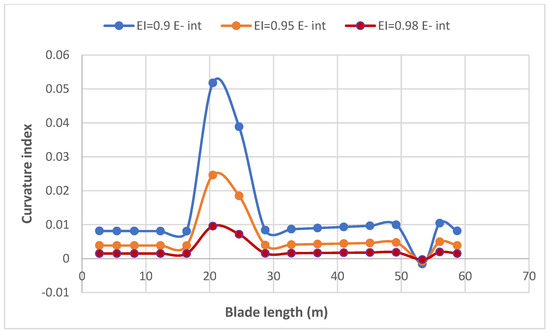
Figure 7.
The variation in the calculated damage index along the blade span for 5MW NREL blade as affected by different stiffness reductions at element 7.
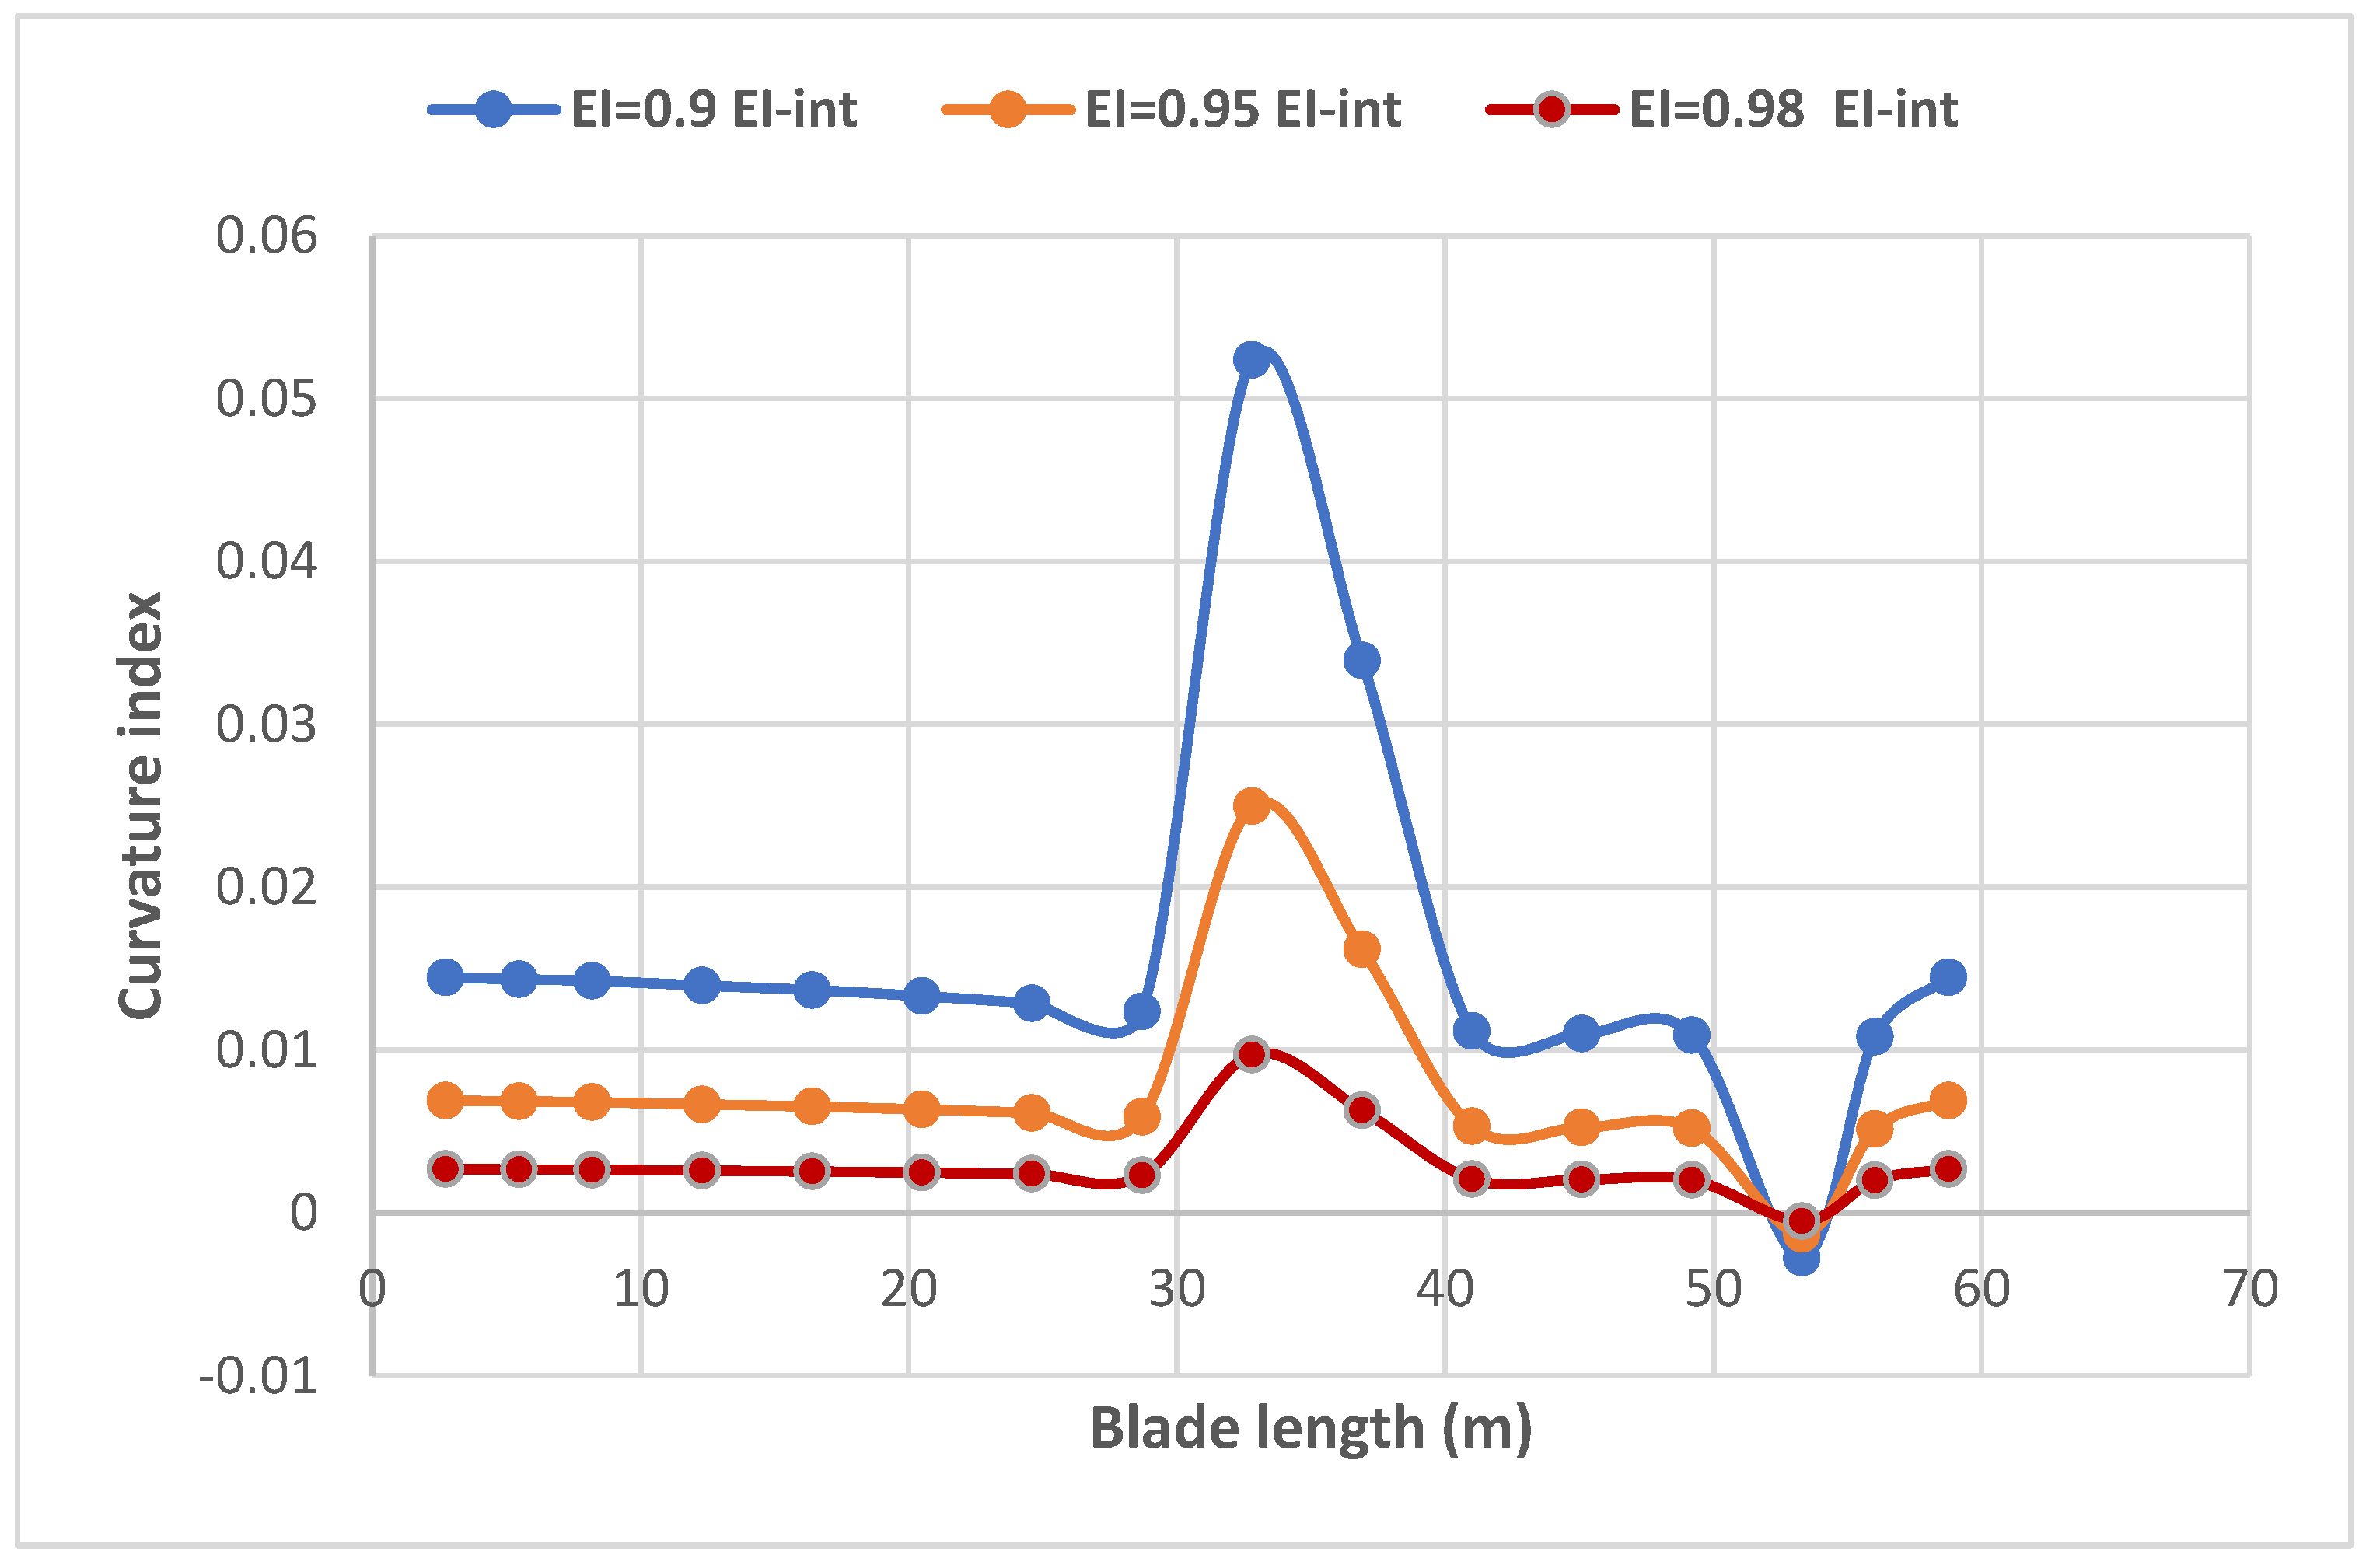
Figure 8 shows the variation in the curvature index distribution along the blade span as the effects of reduced rigidity at element 8. The response in the first part of the blade was greater than its counterparts in the previous figures. The curvature value at node 6 was changed to be less and increased again before the first peak at node 8. The index distribution followed the same trend as previous figures, and the peak values were less than those in Figure 5 and greater than those in Figure 6. The same behaviour of node 13 can be seen with the suddenly decreasing curve after the second peak at node 13.
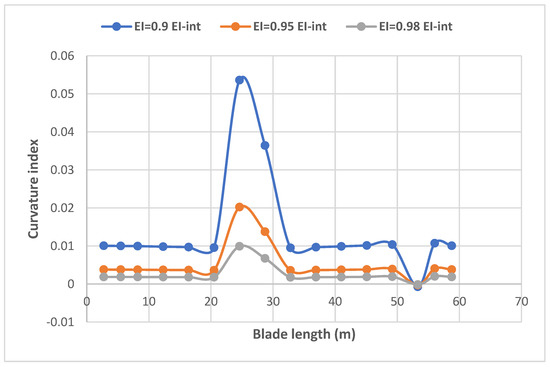
Figure 8.
The variation in the calculated damage index along the blade span for 5MW NREL blade as affected by different stiffness reductions at element 8.
Figure 9 represents the curvature index distribution along the blade span as the effects of reduced rigidity at element 9. The first part of the figure shows that values were greater than those in the previous figures. The 2% stiffness reduction effect was at the same value as in Figure 8 and Figure 9 while slightly different than Figure 7. The value of node 16 was more influenced due to the 5% and 10% stiffness reductions.
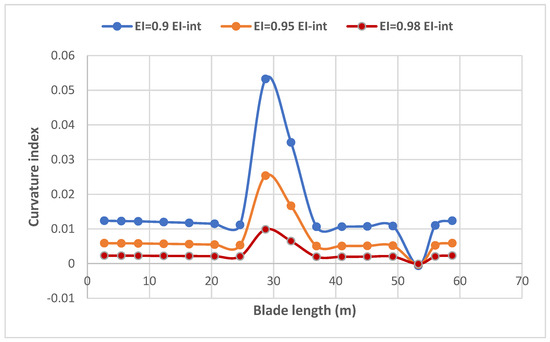
Figure 9.
The variation in the calculated damage index along the blade span for 5MW NREL blade as affected by different stiffness reductions at element 9.
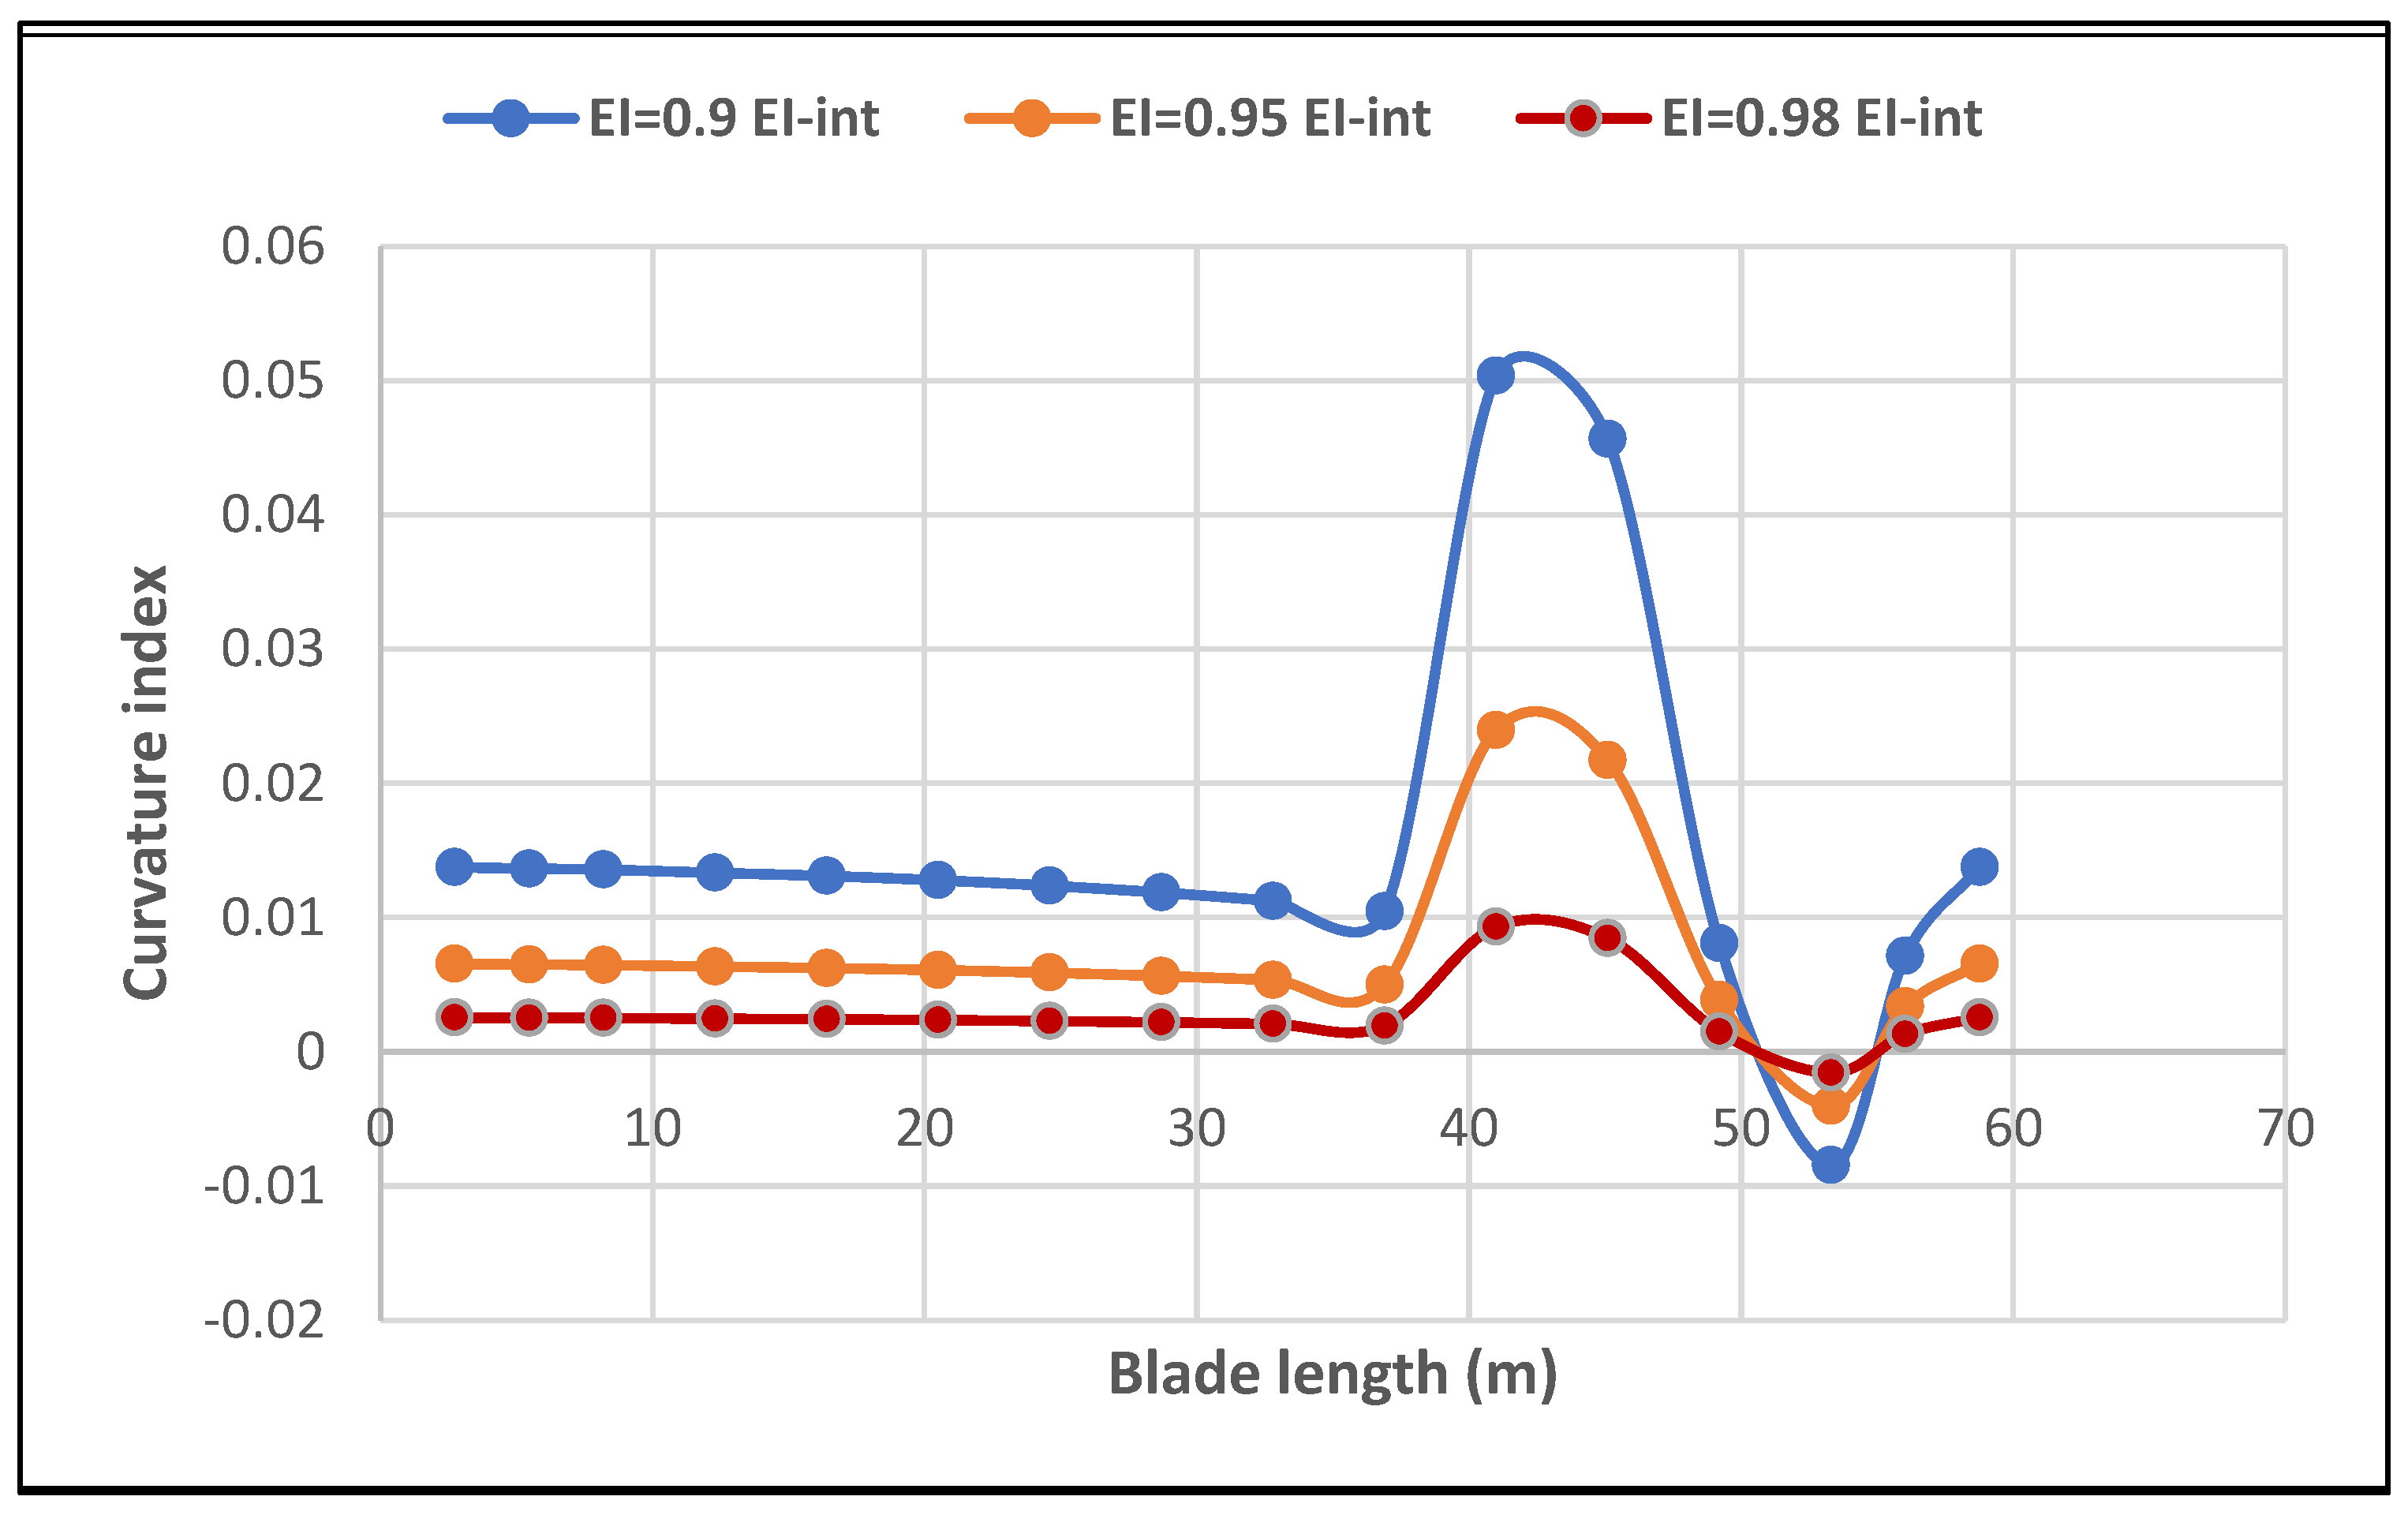
Figure 10 shows the curvature index distribution along the blade span as the effects of reduced rigidity at element 10. There was an increase in the curvature curve compared to the previous figures. The curvature value at the first peak was at the same value as in Figure 9, while the value of the trough became less at node 14 at a stiffness reduction 10% from the intact value. The index distribution followed the same trend as previous figures, and the first peak was at the same values at 0.05 and 0.1. The curve value at node 16 was greater than those at the same location in the previous curvature figures.
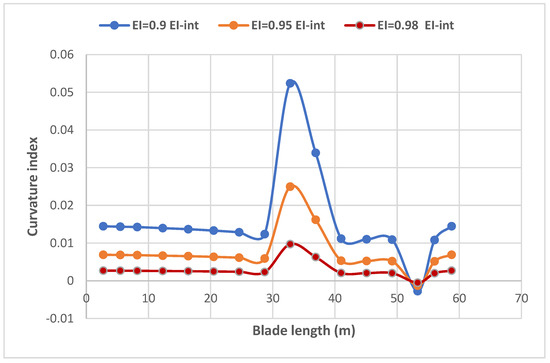
Figure 10.
The variation in calculated damage index along the blade span for 5MW NREL blade as affected by different stiffness reductions at element 10.
Figure 11 shows the variation in the curvature index curve at element 12. There were broader peaks at the damaged locations in the curvature curve compared with the previous figures. The peaks rose to the maximum after node 12 for all stiffness reduction values even though it was lower following the broad peak, and there were sharp troughs at node 14. The curvature value at the first peak was at the same value as Figure 10, while it was less affected by the different stiffness reductions located at element 10.
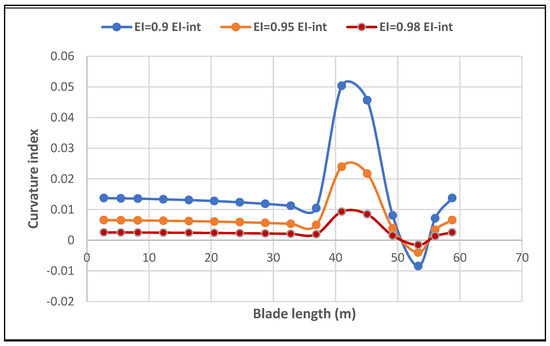
Figure 11.
The variation in calculated damage index along the blade span for 5MW NREL blade as affected by different stiffness reductions at element 12.
Figure 12 represents the curvature index distribution along the blade span as affected by reduced rigidity of the blade at element 13. The curvature values before 40 m from the blade root became less with a slight decrease in the vicinity of the damaged element. In contrast to Figure 11, the curvature value of node 13 was greater than the value of node 12. The sharp trough after node 13 was slim, and the lowest value came after node 14.
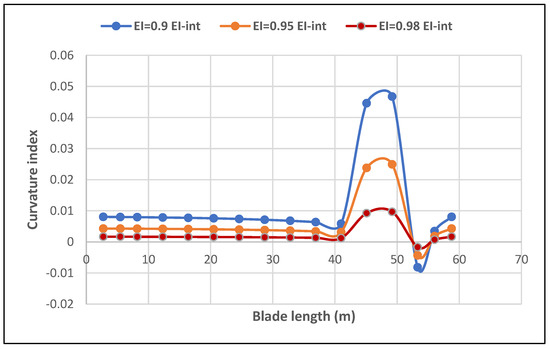
Figure 12.
The variation in the calculated damage index along the blade span for 5MW NREL blade as affected by different stiffness reductions at element 13.
Figure 13 shows the curvature index distribution along the blade span as affected by the stiffness reduction values at 53.3 m from the blade root. As in all the previous curvature figures, the values of stiffness reduction coefficients started at 0.98, 0.95, and 0.9. The figure illustrates that all the curvature values had the same approximate values at the first 13 nodes.
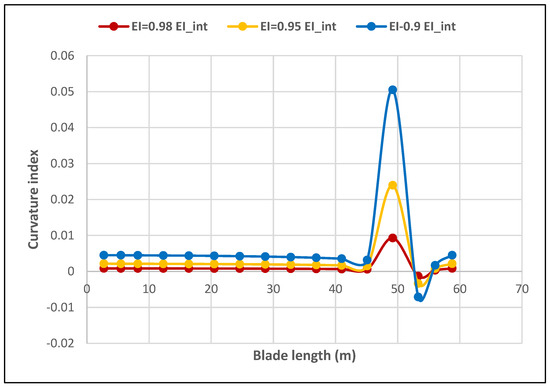
Figure 13.
The variation in the calculated damage index along the blade span for 5MW NREL blade as affected by different stiffness reductions at element 14.
It also illustrates that the curves started rising at node 14 to reach maximum positive values. These values were less than in the other curvature figures though they were still at the same peak value. The curvature curve had an abrupt negative value after node 15, returning to the same values in the last two nodes.
The curvature curve had a different scenario when element 15 was chosen to have less stiffness. As shown in Figure 14, all the blade sections before 50 m from the blade root were at the same lowest value. Furthermore, in contrast to the previous figures, the trough came before the peak. From the figure, it can be seen that the minimum curve value was before node 14. Moreover, the curve values increased to reach the maximum at node 15 and had the largest values when compared with the previous figures.
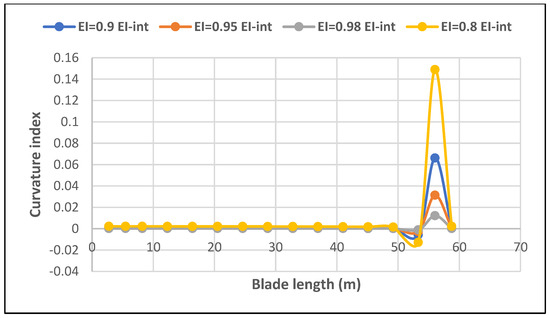
Figure 14.
The variation in the calculated curvature index along the blade span for 5MW NREL blade as affected by different stiffness reductions at element 15.
All the figures above (Figure 6, Figure 7, Figure 8, Figure 9, Figure 10, Figure 11, Figure 12, Figure 13 and Figure 14) indicate the sensitivity of element 14. This can be interpreted as the tendency of the blade to compensate for an uneven stiffness distribution along the blade. This tendency changed according to the damage location. Moreover, the reaction at element 14 was generated to be opposed to the reaction of all chosen damaged elements and increased with the increasing percentage of damage. This helps to estimate the location of the defect precisely and makes it easier to distinguish the blade reaction from damage behaviour.
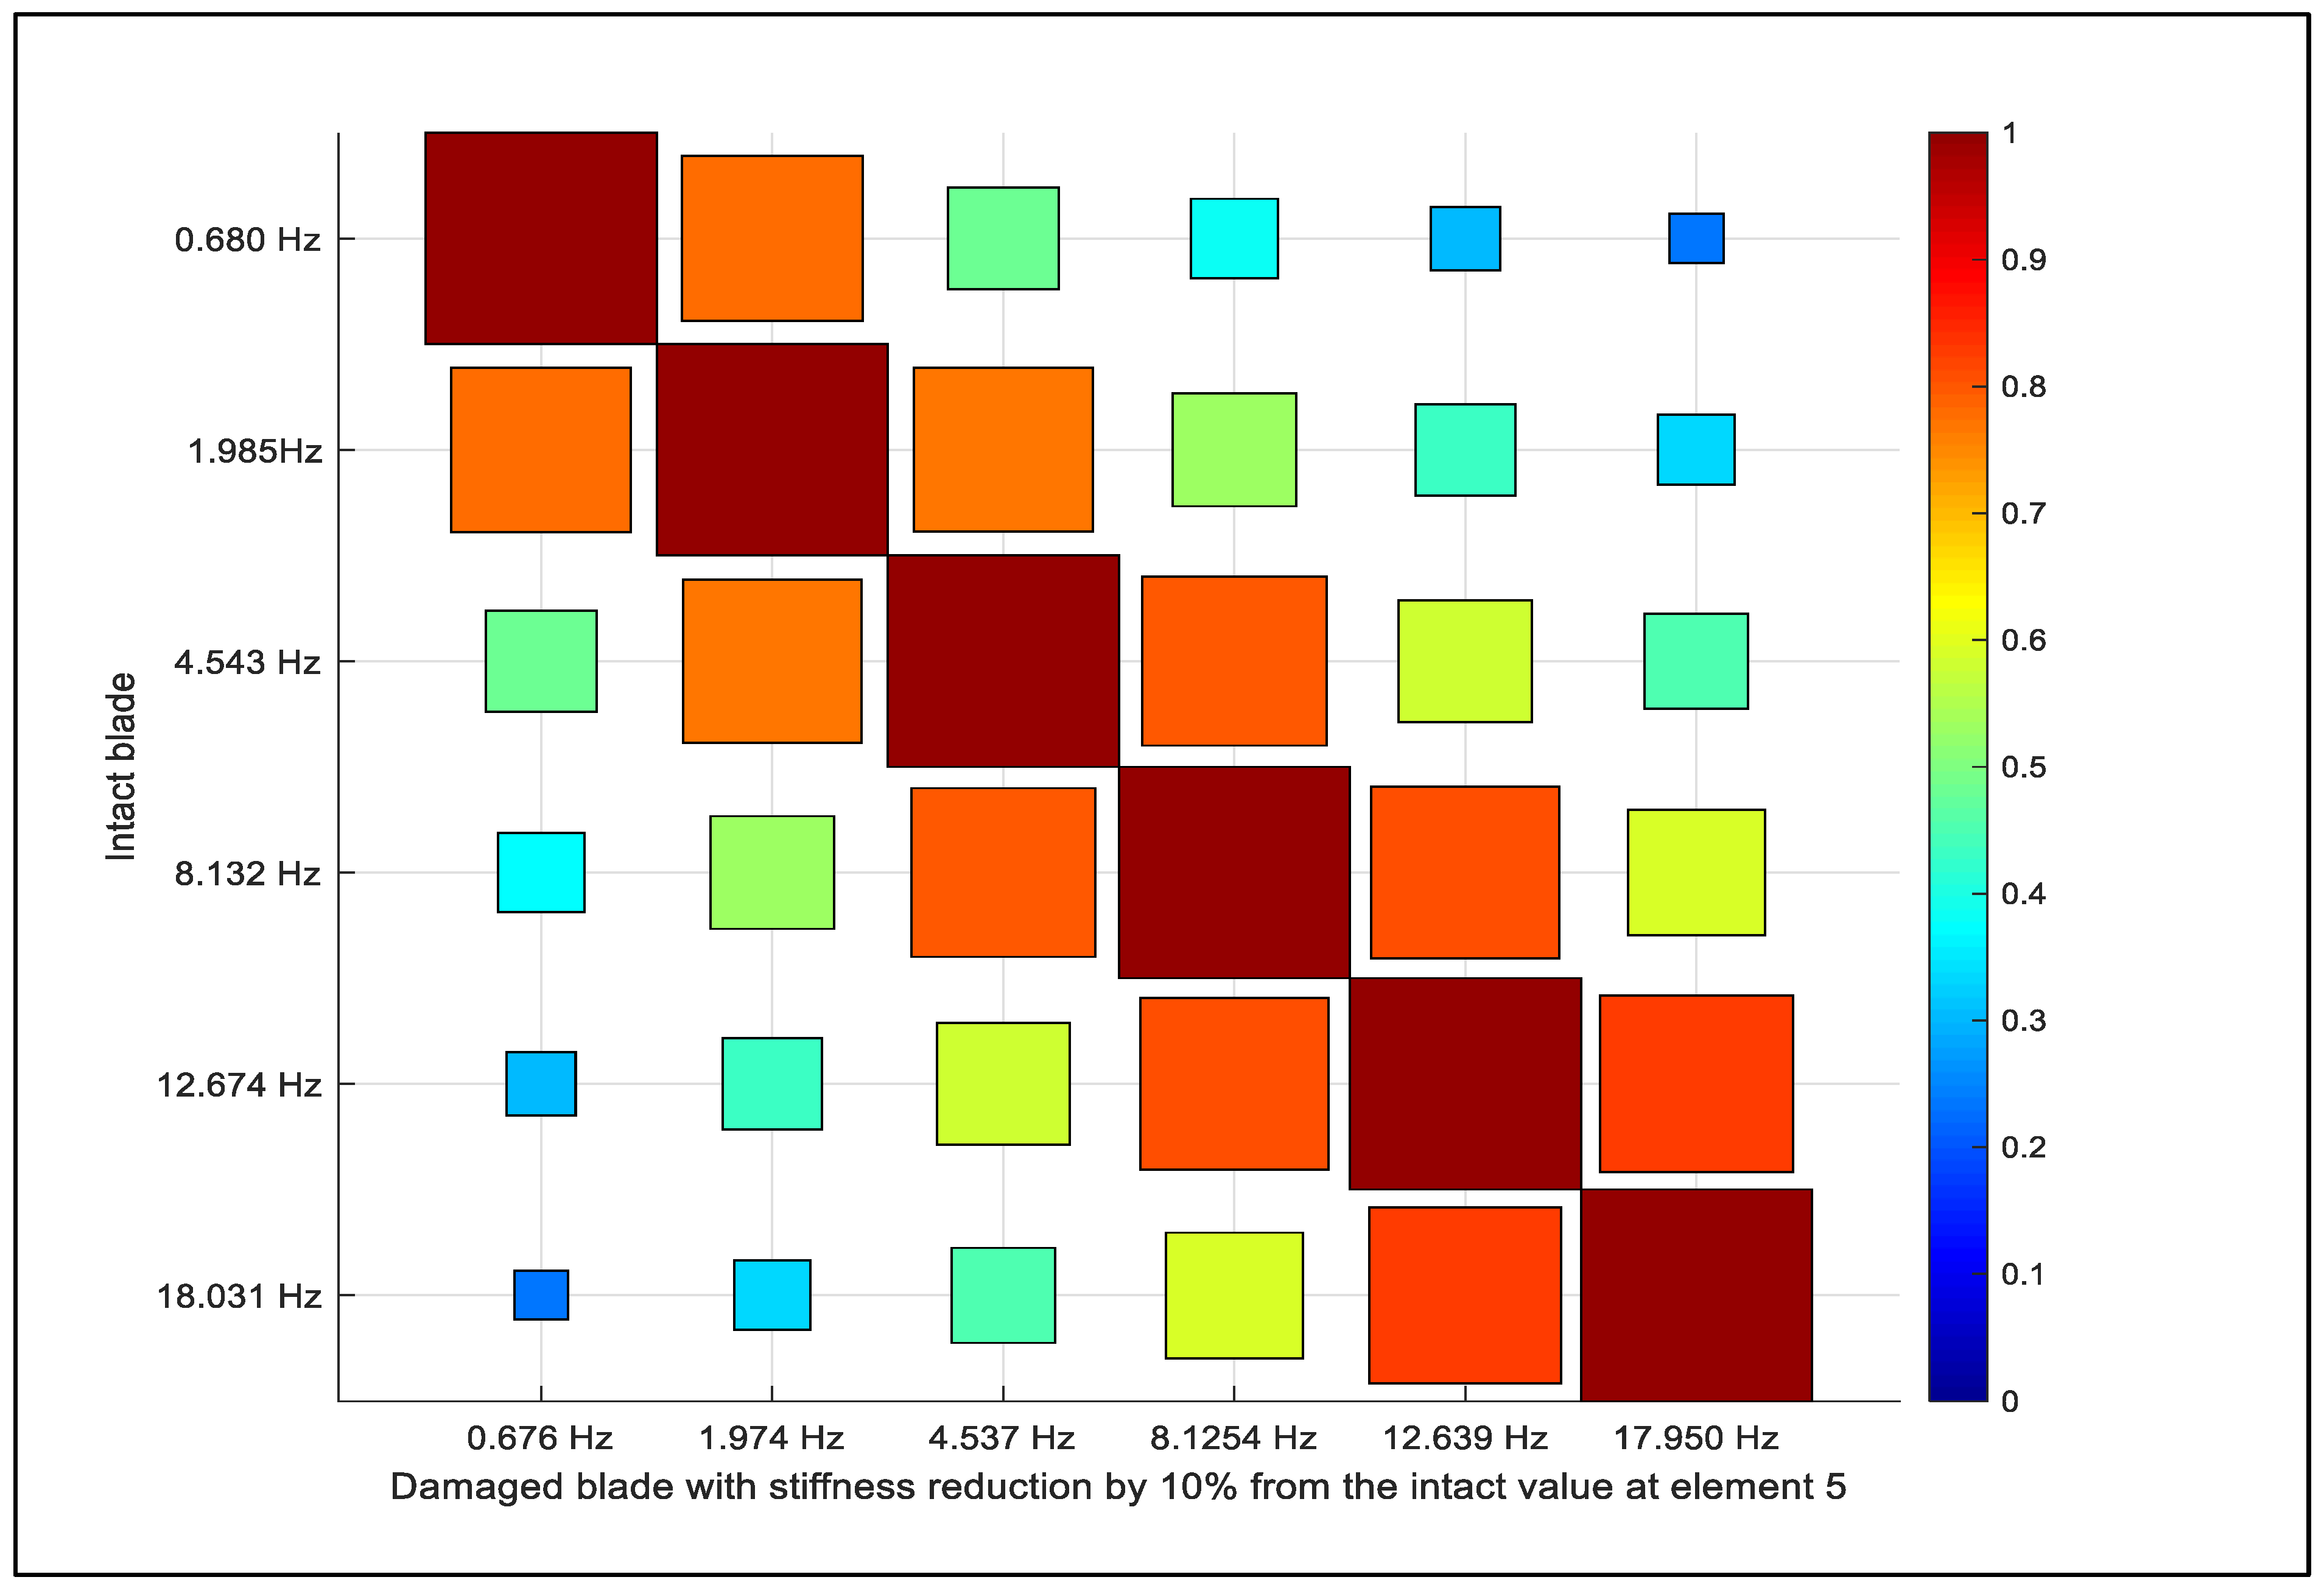
The MAC index of translational and angular mode shapes was implemented to demonstrate further the sensitivity of blade elements to the existence of damage. A stiffness reduction value of 10% was chosen for elements 5 and 15. The lowest six mode shapes of the intact blade were compared with their damaged counterparts. Figure 15 shows the variation in the calculated translation MAC index for a blade affected by a stiffness reduction of 10% located at element 5, while Figure 16 demonstrates the variation in the calculated angular MAC index for a blade affected by a stiffness reduction of 10% located at the same element. In the same manner, the first six translation and angular mode shapes were used to extract the MAC index.
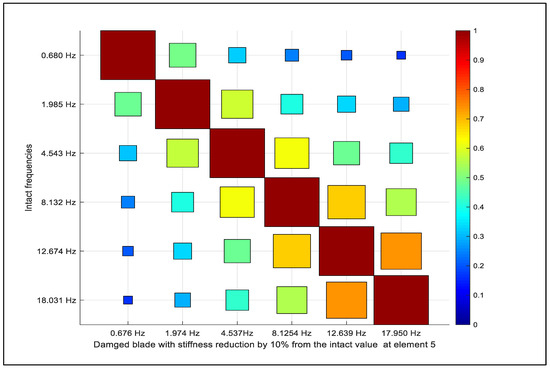
Figure 15.
The variation in calculated translation MAC index for 5MW NREL blade affected by stiffness reduction of 10% at element 5.

Figure 16.
The variation in calculated angular MAC index for 5MW NREL blade affected by stiffness reduction of 10% at element 5.
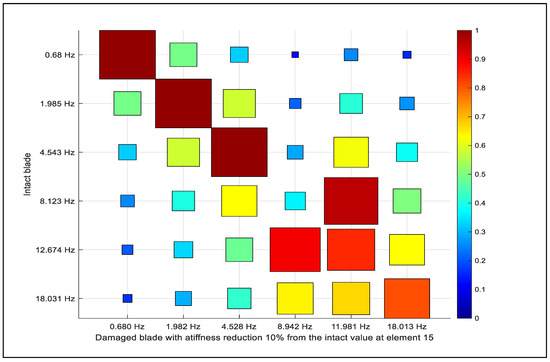
Figure 17.
The variation in the calculated translation MAC index for 5MW NREL blade affected by a stiffness reduction of 10% at element 15.
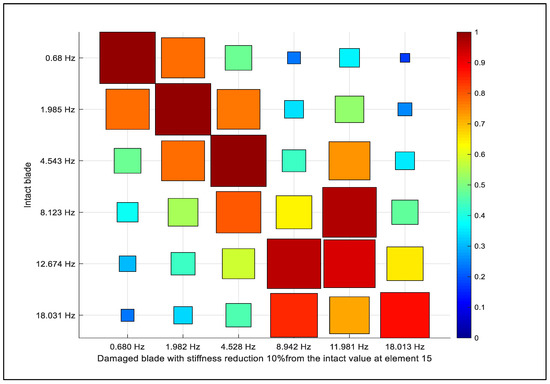
Figure 18.
The variation in the calculated angular MAC index for 5MW NREL blade affected by a stiffness reduction of 10% at element 15.
The figures indicate poor correlation after mode 3 using the translational and angular mode shapes. There were inconsistent off-diagonal values starting from the first mode. Moreover, the most erratic diagonal values can be seen in modes 4, 5, and 6. The same result could be seen when the MAC index was applied at element 15. Figure 16 and Figure 17 show a comparison between the intact blade and its damaged counterpart at the last blade quarter. The figures indicate the misaligning and the sensitivity of this section.
In the MAC matrix, the post-fault frequency changed by around 0.5%, but this was not a significant feature as the frequencies may change depending on the conditions under which the measurement is performed, such as temperature or humidity. The main point of the MAC index is to find the deviations in the diagonal values of the MAC matrix. The changes can be seen in Figure 17, where the translation MAC index is represented, and in Figure 18 where the angular MAC index is represented. The significant changes start from mode 4 in both figures.
10. Conclusions
This paper studied the sensitivity of 5MW wind turbine blade sections to the existence of damage. The first mode was adopted to find the CMS and the higher modes were used for the MAC indices. The blade sections’ behaviour was investigated and the effects of damaged elements on the other blade sections were determined. The large size of the offshore wind turbine blades requires numerous sensors to increase the result accuracy, and multiple damage requires a dense sensor network. The National Renewable Energy Laboratory (NREL) 5MW reference wind turbine blade was chosen to predict performance and detect damage. The main conclusions of the study are summarised as follows:
- The model was built on the physical-based model to create a structurally intact paradigm of the OWTB.
- The vibration-based methodology was employed to find the modal characteristics of the healthy offshore wind turbine blade and its damaged counterparts at all chosen sections along the blade span.
- The curvature mode shape was employed to detect the sensitivity of blade sections as the most effective damage index. The results showed that the last quarter of the blade is the most sensitive part of the blade sections.
- The CMS can be applied as a powerful tool to identify the damage, its location, and its severity.
- In the previous studies in the literature, the curvature mode shape as a damage index was used to investigate the simple damaged structure. In this study, the curvature mode shape was used to identify the damage of complicated OWTBs.
- The MAC index can be used to find the behaviour of damaged blade sections. The results demonstrated that the MAC index can detect the faults in WTB performance but it does not indicate the location of the damage. However, it was less effective than the CMS index for diagnostic and decision support.
- The MAC matrices showed that the first three mode shapes were not effective for the existence of damage; however, the higher modes had significant impact.
- The MAC indicated sensitivity as an index in some locations of damage, and the deviation in the higher corresponding mode shapes can be used to compare between the theoretical and sensing data. The comparison between the mode shapes using MAC provides a measure of similarity or deviation in the paired mode shapes. However, it did not have the same effectiveness as the CMS.
- The large size of the OWTBs requires numerous sensors to increase the result accuracy, and multiple damage requires a dense sensor network. Furthermore, the locations of the sensors need more examination because it is complicated to estimate the location of the defect precisely. This study portrayed a blade’s sections’ performance due to stiffness reduction and their sensitivity toward the existence of damage. It was found that element number 14 was the most sensitive one. This can be interpreted as the tendency of the blade to compensate for uneven stiffness distribution along the blade. This conclusion may need more study and this will come in the next paper by applying different damage indices.
Author Contributions
Writing-review and editing, A.A. (Amna Algolfat); review, W.W. and A.A. (Alhussein Albarbar); supervision, W.W. and A.A. (Alhussein Albarbar). All authors have read and agreed to the published version of the manuscript.
Funding
This research received no external funding.
Conflicts of Interest
The authors declare no conflict of interest.
Nomenclature
| L | Blade length (m) |
| D | Rotor diameter (m) |
| E | Modulus of elasticity (N/m2) |
| A | Blade cross-sectional area (m2) |
| I | Blade moment of inertia (m4) |
| f | External force (N) |
| t | Time (s) |
| R | Hub radius (m) |
| g | Gravitational acceleration (m/s2) |
| T | Axial force due to centrifugal tension (N) |
| u | Flap-wise deflection (m) |
| Difference curvature mode shape | |
| x | Distance relative to the blade span (m) |
| ρ | The blade density (kg/m3) |
| Ω | Angular velocity of the blade (r/min) |
| r | blade radius(m) |
| Pitch angle (deg) | |
| Twist angle (deg) | |
| ϑ | Pre-cone angle (deg) |
| ω | Natural frequency(rad/s) |
| Xh | Hub X-axis |
| Yh | Hub Y-axis |
| G | Local gyroscopic matrix |
| M | Local mass matrix |
| K | Local stiffness matrix |
| C | Damping matrix |
| λ | Squares of the natural frequencies |
| Axial tension due to the centrifugal force | |
| Gravity force component | |
| p | The percentage of the damage severity |
| ς | Scalar qualifies the reduction in stiffness |
| Mode shape difference at mode i | |
| NREL | National Renewable Energy Laboratory |
| FEM | Finite element method |
| MSC | Mode Shape Curvature |
| CD | Curvature difference |
| CMS | Curvature mode shapes |
| MAC | Modal assurance criteria |
| OWTB | Offshore wind turbine blade |
References
- Papadimitriou, C. Optimal sensor placement methodology for parametric identification of structural systems. J. Sound Vib. 2004, 278, 923–947. [Google Scholar] [CrossRef]
- Liu, W.; Gao, W.C.; Sun, Y.; Xu, M.J. Optimal sensor placement for spatial lattice structure based on genetic algorithms. J. Sound Vib. 2008, 317, 175–189. [Google Scholar] [CrossRef]
- Pasch, G.; Wischmann, S.; Drichel, P.; Jacobs, G.; Berroth, J. Enhanced method for optimum driving point identification for modal testing. J. Vib. Control 2022, 10775463211064699. [Google Scholar] [CrossRef]
- Ozbek, M.; Meng, F.; Rixen, D.J. Challenges in testing and monitoring the in-operation vibration characteristics of wind turbines. Mech. Syst. Signal Process. 2013, 41, 649–666. [Google Scholar] [CrossRef]
- Jayasundara, N.; Thambiratnam, D.P.; Chan, T.H.; Nguyen, A. Damage detection and quantification in deck type arch bridges using vibration based methods and artificial neural networks. Eng. Fail. Anal. 2020, 109, 104265. [Google Scholar] [CrossRef]
- Kim, H.C.; Kim, M.H.; Choe, D.E. Structural health monitoring of towers and blades for floating offshore wind turbines using operational modal analysis and modal properties with numerical-sensor signals. Ocean. Eng. 2019, 188, 106226. [Google Scholar] [CrossRef]
- Kim, J.T.; Stubbs, N. Crack detection in beam-type structures using frequency data. J. Sound Vib. 2003, 259, 145–160. [Google Scholar] [CrossRef]
- Kessler, S.S.; Spearing, S.M.; Atalla, M.J.; Cesnik, C.E.; Soutis, C. Damage detection in composite materials using frequency response methods. Compos. Part B Eng. 2002, 33, 87–95. [Google Scholar] [CrossRef]
- Pandey, A.K.; Biswas, M.; Samman, M.M. Damage detection from changes in curvature mode shapes. J. Sound Vib. 1991, 145, 321–332. [Google Scholar] [CrossRef]
- Dawari, V.B.; Vesmawala, G.R. Structural damage identification using modal curvature differences. IOSR J. Mech. Civ. Eng. 2013, 4, 33–38. [Google Scholar]
- Galvanetto, U.; Violaris, G. Numerical investigation of a new damage detection method based on proper orthogonal decomposition. Mech. Syst. Signal Process. 2007, 21, 1346–1361. [Google Scholar] [CrossRef]
- Cao, M.; Qiao, P. Novel Laplacian scheme and multiresolution modal curvatures for structural damage identification. Mech. Syst. Signal Process. 2009, 23, 1223–1242. [Google Scholar] [CrossRef]
- Jonkman, J.; Butterfield, S.; Musial, W.; Scott, G. Definition of a 5-MW Reference Wind Turbine for Offshore System Development; National Renewable Energy Lab. (NREL): Golden, CO, USA, 2009.
- Kaewniam, P.; Cao, M.; Alkayem, N.F.; Li, D.; Manoach, E. Recent advances in damage detection of wind turbine blades: A state-of-the-art review. Renew. Sustain. Energy Rev. 2022, 167, 112723. [Google Scholar] [CrossRef]
- Jiang, S.; Lin, P.; Chen, Y.; Tian, C.; Li, Y. Mixed-signal extraction and recognition of wind turbine blade multiple-area damage based on improved Fast-ICA. Optik 2019, 179, 1152–1159. [Google Scholar] [CrossRef]
- Awaja, F.; Zhang, S.; Tripathi, M.; Nikiforov, A.; Pugno, N. Cracks, microcracks and fracture in polymer structures: Formation, detection, autonomic repair. Prog. Mater. Sci. 2016, 83, 536–573. [Google Scholar] [CrossRef]
- Javadi, M.; Najafi, N.J.; Abhari, M.K.; Jabery, R.; Pourtaba, H. 4E analysis of three different configurations of a combined cycle power plant integrated with a solar power tower system. Sustain. Energy Technol. Assess. 2021, 48, 101599. [Google Scholar] [CrossRef]
- Javadi, M.A.; Ghomashi, H.; Taherinezhad, M.; Nazarahari, M.; Ghasemiasl, R. Comparison of Monte Carlo Simulation and Genetic Algorithm in Optimal Wind Farm Layout Design in Manjil Site Based on Jensen Model. In Proceedings of the 7th Iran Wind Energy Conference (IWEC2021), Shahrood, Iran, 17–18 May 2021; pp. 1–4. [Google Scholar]
- Shohag, M.A.; Hammel, E.C.; Olawale, D.O.; Okoli, O.I. Damage mitigation techniques in wind turbine blades: A review. Wind. Eng. 2017, 41, 185–210. [Google Scholar] [CrossRef]
- Algolfat, A.A.; Wang, W.; Albarbar, A. Dynamic Responses Analysis of A 5MW NREL Wind Turbine Blade Under Flap-Wise and Edge-Wise Vibrations. J. Dyn. Monit. Diagn. 2022, 1, 208–222. [Google Scholar] [CrossRef]
- Burton, T.; Jenkins, N.; Sharpe, D.; Bossanyi, E. Wind Energy Handbook; John Wiley & Sons: Hoboken, NJ, USA, 2011. [Google Scholar]
- Algolfat, A.; Wang, W.; Albarbar, A. Study of centrifugal stiffening on the free vibrations and dynamic response of offshore wind turbine blades. Energies 2022, 15, 6120. [Google Scholar] [CrossRef]
- Algolfat, A.; Wang, W.; Albarbar, A. Comparison of beam theories for characterisation of a NREL wind turbine blade flap-wise vibration. Proc. Inst. Mech. Eng. Part A J. Power Energy 2022, 236, 1350–1369. [Google Scholar] [CrossRef]
- Dessi, D.; Camerlengo, G. Damage identification techniques via modal curvature analysis: Overview and comparison. Mech. Syst. Signal Process. 2015, 52, 181–205. [Google Scholar] [CrossRef]
- Maia, N.M.; e Silva, J.M. Theoretical and Experimental Modal Analysis; Research Studies Press: Boston, MA, USA, 1997. [Google Scholar]
- Mandell, J.F.; Samborsky, D.D. Composite Materials Fatigue Database: Test Methods, Materials and Analysis; Sandia Report SAND97-3002; Sandia National Laboratories: Albuquerque, NM, USA, 1997.
- Li, Z.; Wen, B.; Dong, X.; Peng, Z.; Qu, Y.; Zhang, W. Aerodynamic and aeroelastic characteristics of flexible wind turbine blades under periodic unsteady inflows. J. Wind. Eng. Ind. Aerodyn. 2020, 197, 104057. [Google Scholar] [CrossRef]
- Jeong, M.S.; Cha, M.C.; Kim, S.W.; Lee, I.; Kim, T. Effects of torsional degree of freedom, geometric nonlinearity, and gravity on aeroelastic behavior of large-scale horizontal axis wind turbine blades under varying wind speed conditions. J. Renew. Sustain. Energy 2014, 6, 023126. [Google Scholar] [CrossRef]


Disclaimer/Publisher’s Note: The statements, opinions and data contained in all publications are solely those of the individual author(s) and contributor(s) and not of MDPI and/or the editor(s). MDPI and/or the editor(s) disclaim responsibility for any injury to people or property resulting from any ideas, methods, instructions or products referred to in the content. |
© 2023 by the authors. Licensee MDPI, Basel, Switzerland. This article is an open access article distributed under the terms and conditions of the Creative Commons Attribution (CC BY) license (https://creativecommons.org/licenses/by/4.0/).