Article

Reliability Assessment of the Configuration of Dynamic Uninterruptible Power Sources: A Case of Data Centers

1
Mining Industry Digital Transformation Lab, Mining Institute, T.F. Gorbachev Kuzbass State Technical University, 28 Vesennya St., 650000 Kemerovo, Russia
2
Department of Theoretical Electrical Engineering and Electrification of Oil and Gas Industry, Gubkin University, 119991 Moscow, Russia
3
Department of Mechanical and Electronic Engineering, Shandong University of Science and Technology, Qingdao 266590, China
4
Institute of Trade and Economy, Siberian Federal University, 79 Svobodny Av., 660041 Krasnoyarsk, Russia
5
Department of Open Pit Mining, T.F. Gorbachev Kuzbass State Technical University, 28 Vesennya St., 650000 Kemerovo, Russia
*
Author to whom correspondence should be addressed.
Energies 2023, 16(3), 1419; https://doi.org/10.3390/en16031419
Submission received: 27 December 2022 / Revised: 22 January 2023 / Accepted: 24 January 2023 / Published: 1 February 2023

Abstract

:
The number of data centers worldwide is increasing year by year, mostly because of the development of cloud services and applications. In the near future, the rate of construction of data centers will grow, with a corresponding increase in their electrical energy consumption. The requirements of the reliability of the electrical power supply of data centers are one of the highest among industrial power consumers, since uninterrupted power supply is critically important for the continuous functioning of server hardware. The assessment of electrical power supply reliability is one of the most important parts of the design process of data centers. However, the speed of the development of new power equipment does not always make it possible to use classical probabilistic and statistical methods for reliability assessment. Therefore, the development of new methods for reliability assessment based on alternative approaches, which can eliminate the disadvantages of probabilistic and statistical methods, are of great interest. This paper discusses the alternative method for analyzing the reliability of electrical power supply for the case of data centers. The method defines the reliability through the internal information of the system that characterizes the system’s topology, flows of information, energy, and matter in the system.

1. Introduction

A high level of electrical power supply reliability is critically important for the continuous functioning and availability of a data center. The reliability of electrical power supply, in turn, is determined by the reliability and operation efficiency of a power supply system (PSS).
The PSS of the data center is a complex and multi-state system, as a rule including static or dynamic uninterruptible power sources (UPS). The complexity and peculiarities of functioning of such a PSS complicate the reliability assessment and determine special responsibilities for the calculation process [1], while the task of reliability calculation of the PSS can arise both at the design stage and at the stage of reconstruction. As a rule, the results of a reliability calculation help to make the final decision during choosing the most rational configuration of the PSS of the data center.
The PSS configuration of the data center is one of the main criteria for the classification for data centers presented by the Uptime Institute, which classified data centers infrastructure by four levels known as “Tier” [2,3,4]. The core objective of the tier classification is to make a guideline for designing a data center that will deliver the desired level of availability. This classification divides data centers by their capability to allow maintenance and to withstand a failure in PSS. Tier levels from I (the least reliable) to IV (the most reliable) depend on the levels of component redundancy and parallel power supply paths in the PSS which, in turn, are defined by the system availability.
There are different approaches that can be used for a reliability assessment of the data center. According to [5], these approaches could be classified in two groups: analytical and simulation-based approaches.
The most common analytical approaches for data centers‘ reliability assessment are Reliability Block Diagrams (RBD) [6] and fault tree analysis (FTA) [7]. This can be explained by their simplicity and low requirements of the computational capacity. The RBD model was used to perform a reliability assessment of IT infrastructure in [8,9]. An expanded RBD model that considers interconnections between elements of PSS is presented in [10]. The FTA technique for estimation of the failure rates, MTBF, MTTF, MTTR, and the reliability of different UPS topologies was used in [11,12,13,14,15,16,17]. The reliability assessment of data center subsystems using critical analysis (FMECA) and the energy flow model (EFM) is presented in [18]. In [19], for data center resilience evaluation, the authors proposed to use the analytic network process method (ANP) which is useful for decision support and can improve the ability of fault disturbance resistance and emergency response.
It should be noted that the analytical approaches use statistical failure and repair data, which can be taken from common sources for industrial and commercial power systems [20]. However, there are not enough data about data centers’ component failure, which is needed to improve the reliability of data centers. The main reason for this is the secrecy of the internal information of the data centers and their components.
Among simulation-based approaches of reliability assessment, the Markov model [21] and Markov chain Monte Carlo (MCMC) should be noted. The Monte Carlo approach is used in [11,22] for a reliability assessment of UPS. Monte Carlo is one of the most popular simulation-based approaches for reliability assessment. The Monte Carlo approach is mainly used to generate time-dependent failure and repair events of the system components using probability distribution function and estimate the possible outcomes of an uncertain event. Aside from Monte Carlo, stochastic Petri nets [10], MCMC [21] and a hybrid approach [23] are also used for the reliability modeling of data centers.
The methods mentioned above are based on probabilistic and statistical approaches. Their feature and at the same time the main disadvantage is the necessity of a large amount of initial statistical data about the reliability and physical properties of system components. For this reason, the use of such methods is difficult for systems at the design stage.
In the research works of many scholars, it is noted that current conditions (complexity and multilevel structure modern engineering systems, active implementation of renewable energy sources, etc.) determine the necessity for the further development of existing methods of reliability assessment, for complex engineering systems in general [24,25] and specifically for PSS [26,27].
Professor G. Razgildeev, in [26], formulated the direction of the further development of the theory of reliability in relation to the PSS quite clearly; namely, the development of techniques that combine the methodology of probabilistic and statistical methods with approaches which allow the characterization of the physical essence of the system. In this case, the primary task is to establish the dependences of the main characteristics that determine the functioning process of the PSS, with its physical properties.
Nowadays, methods of reliability and efficiency assessment of engineering systems that are based on the system structural research are of great interest. In structural research, a system is understood as an independent holistic object for which the model is built, reflecting in the most general form an element distribution structure and their interconnections. In this case, the properties of system elements are insignificant, it is rather the totality and types of oriented interconnection between its elements that are important.
The best way to describe the structure of the system is to build an oriented graph G(S, P), where S = {s1, s2,…, sm} is the set of graph vertices and P = {p1, p2,…, pm} is the set of graph edges. This graph is built on the base of the functional scheme of the system. Graph vertices correspond to the elements of the system; oriented graph edges correspond to the linkages between elements. The obtained oriented graph is the universal tool for a reliability assessment of almost any engineering system, since it allows the obtaining of different reliability indicators (such as state-of-the art and the alternative one [27,28]), applying various mathematical methods.
A number of scholars use graph theory in research. Man Cheol Kim in [25] offers the use of a reliability graph with general gates for reliability analysis of complex systems that can be modeled with perfect nodes and unreliable arcs; Mike Brian Ndawula in [29] made a reliability assessment of electrical networks using Markov’s chain methodology and a graph view of systems; Young Ho Chae in [30] used a factor graph based approach for a reliability and safety assessment of the engineering systems of a nuclear power station; Rui He in [31] offers an integrated approach for a reliability assessment of closed-loop systems using element of the graph theory.
This article has the following structure—the second section provides a description of the proposed method for informational analysis of the PSS. Section 3 considers the use of cases of reliability indicators assessment using state-of-the-art and proposed methods. Section 4 compares the results of a reliability calculation using different methods. Section 5 discusses the usage of the proposed method and its advantages. Finally, the sixth section contains the conclusion of the article.

2. State-of-the-Art and Proposed Methods for Reliability Assessment

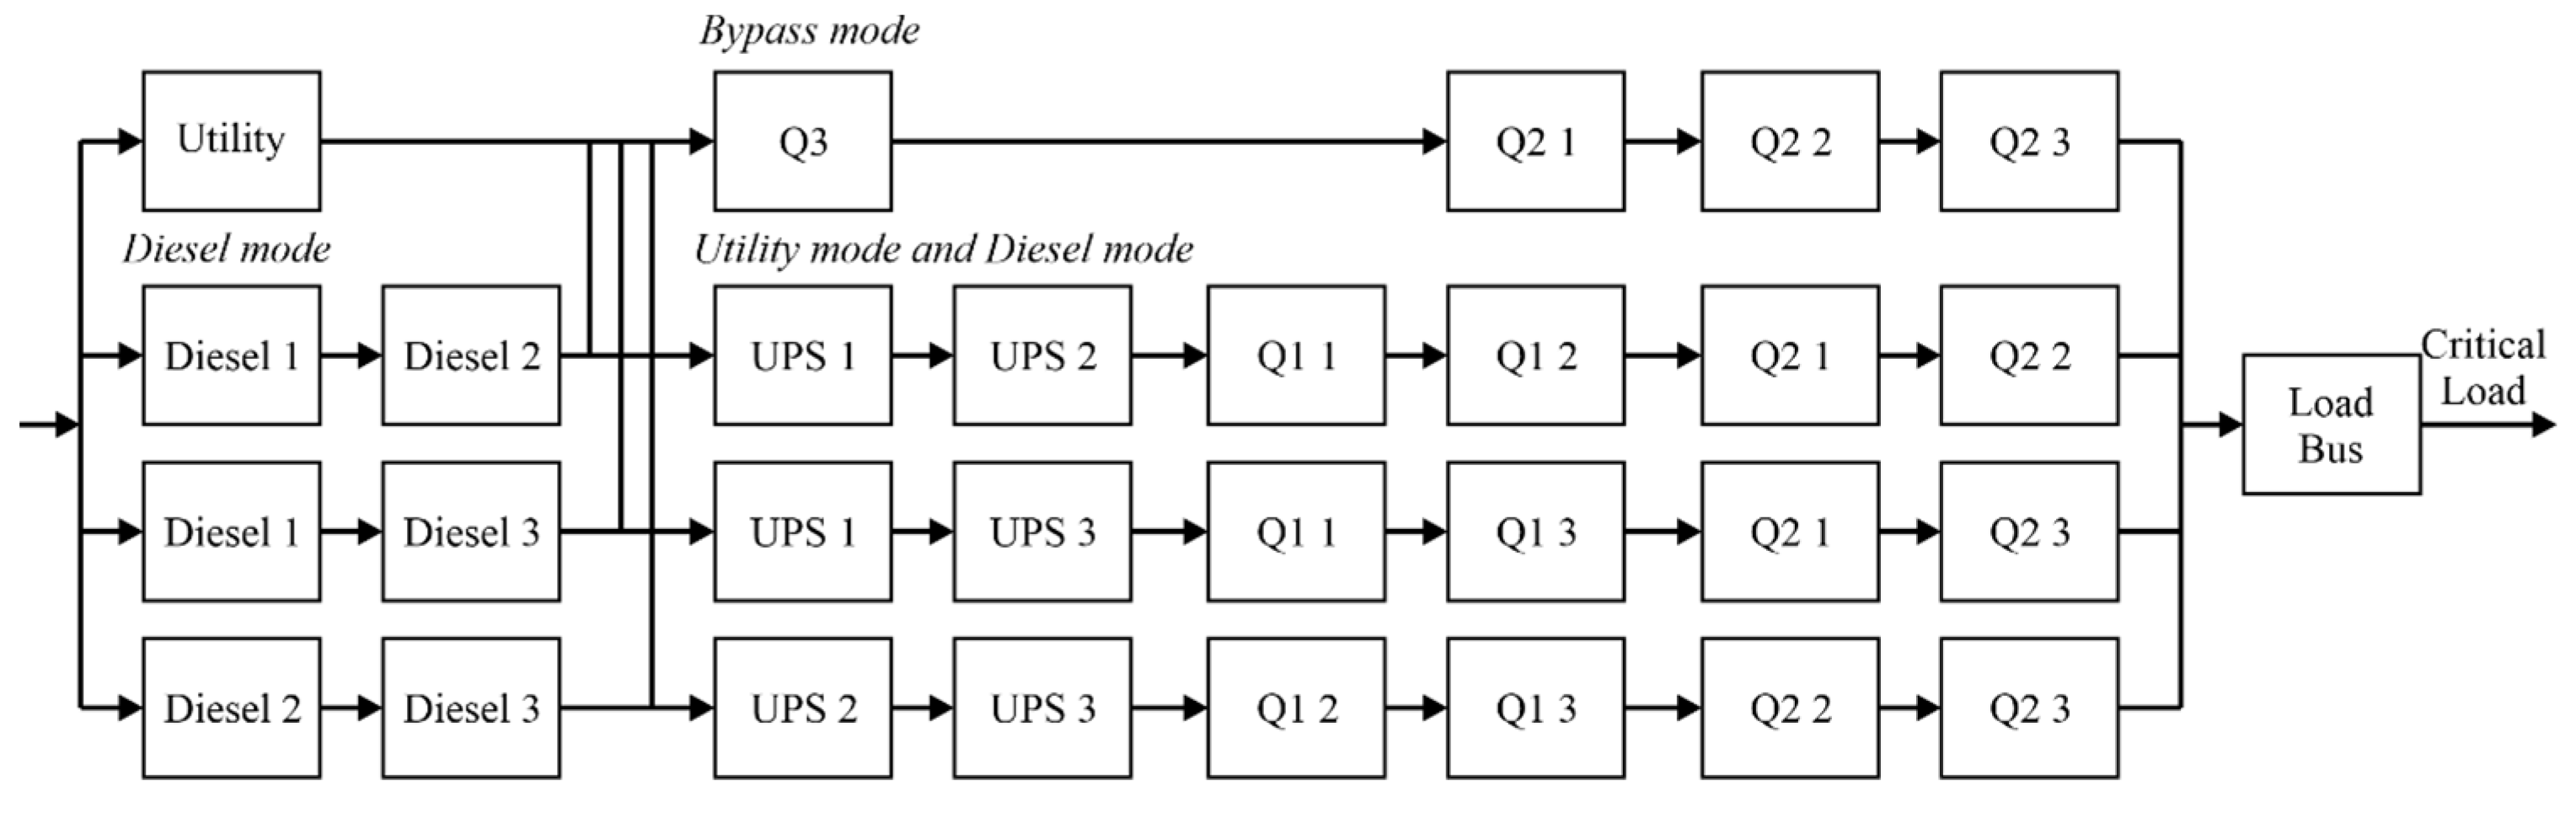
2.1. Reliability Block Diagram

Availability (A) is the long-term average fraction of the time that a repairable component or a system is in service and performs its intended function satisfactorily. There are two common measures of availability—inherent and operational availability—but for analyzing the system design inherent availability is more useful tool [32]. In this paper, the term “availability” means inherent availability.
The basis for the calculation of availability is the failure rate (λ) of a component or a system expressed as the probability per unit time that a component or a system experiences a failure at time t [33]. Next, using the failure rate, mean time between failures (MTBF) can be defined, showing the average time the equipment performed its intended function between failures, and mean time to repair (MTTR), showing the average time it takes to repair the failure and get the equipment back into service.
Availability is mathematically defined using the following MTBF and MTTR:
A = M T B F M T B F + M T T R
One more important term is the reliability (R). Reliability is the probability that a unit or a system will operate for a specified period of time under design operating conditions without failure. For a constant failure rate, reliability as a function of time R(t) is
R ( t ) = e λ t
It is obvious that all mentioned factors are interrelated and necessary for the definition of the “reliability” of a system. However, in [32] it is noted that, during analysis of how reliable the component or a system is, the most important metrics are availability and reliability, and these two metrics should be used together during a reliability assessment.

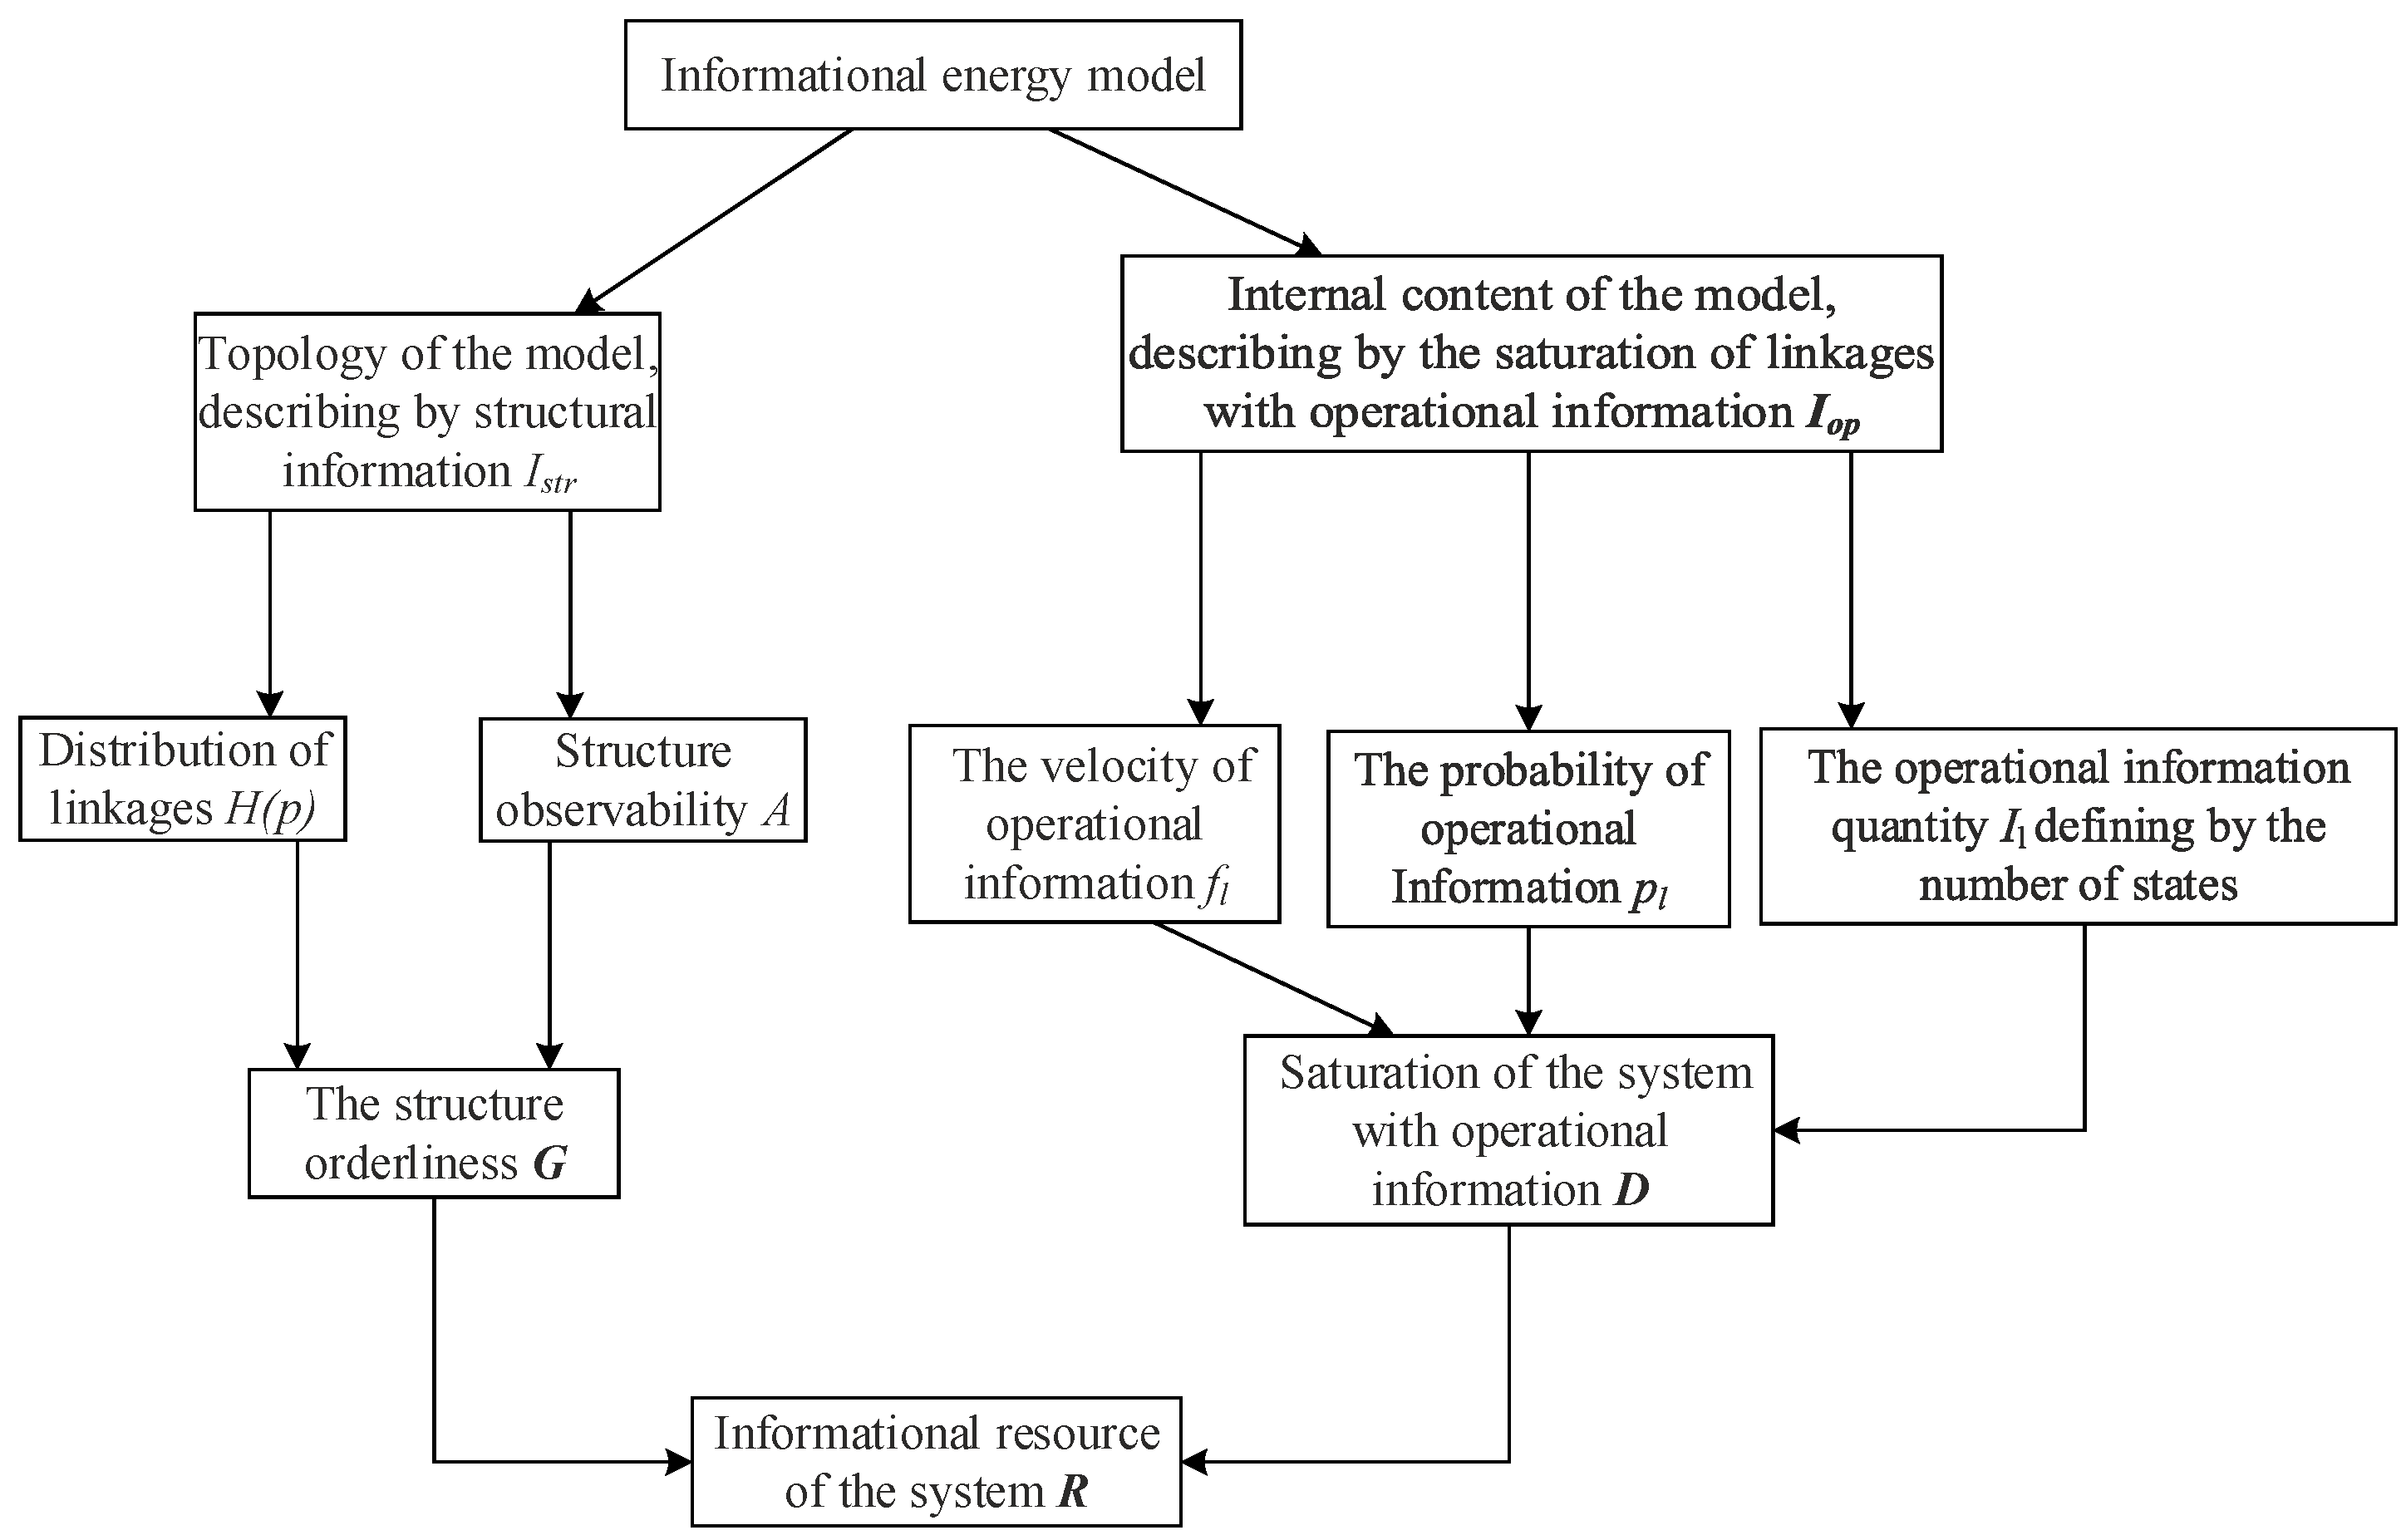
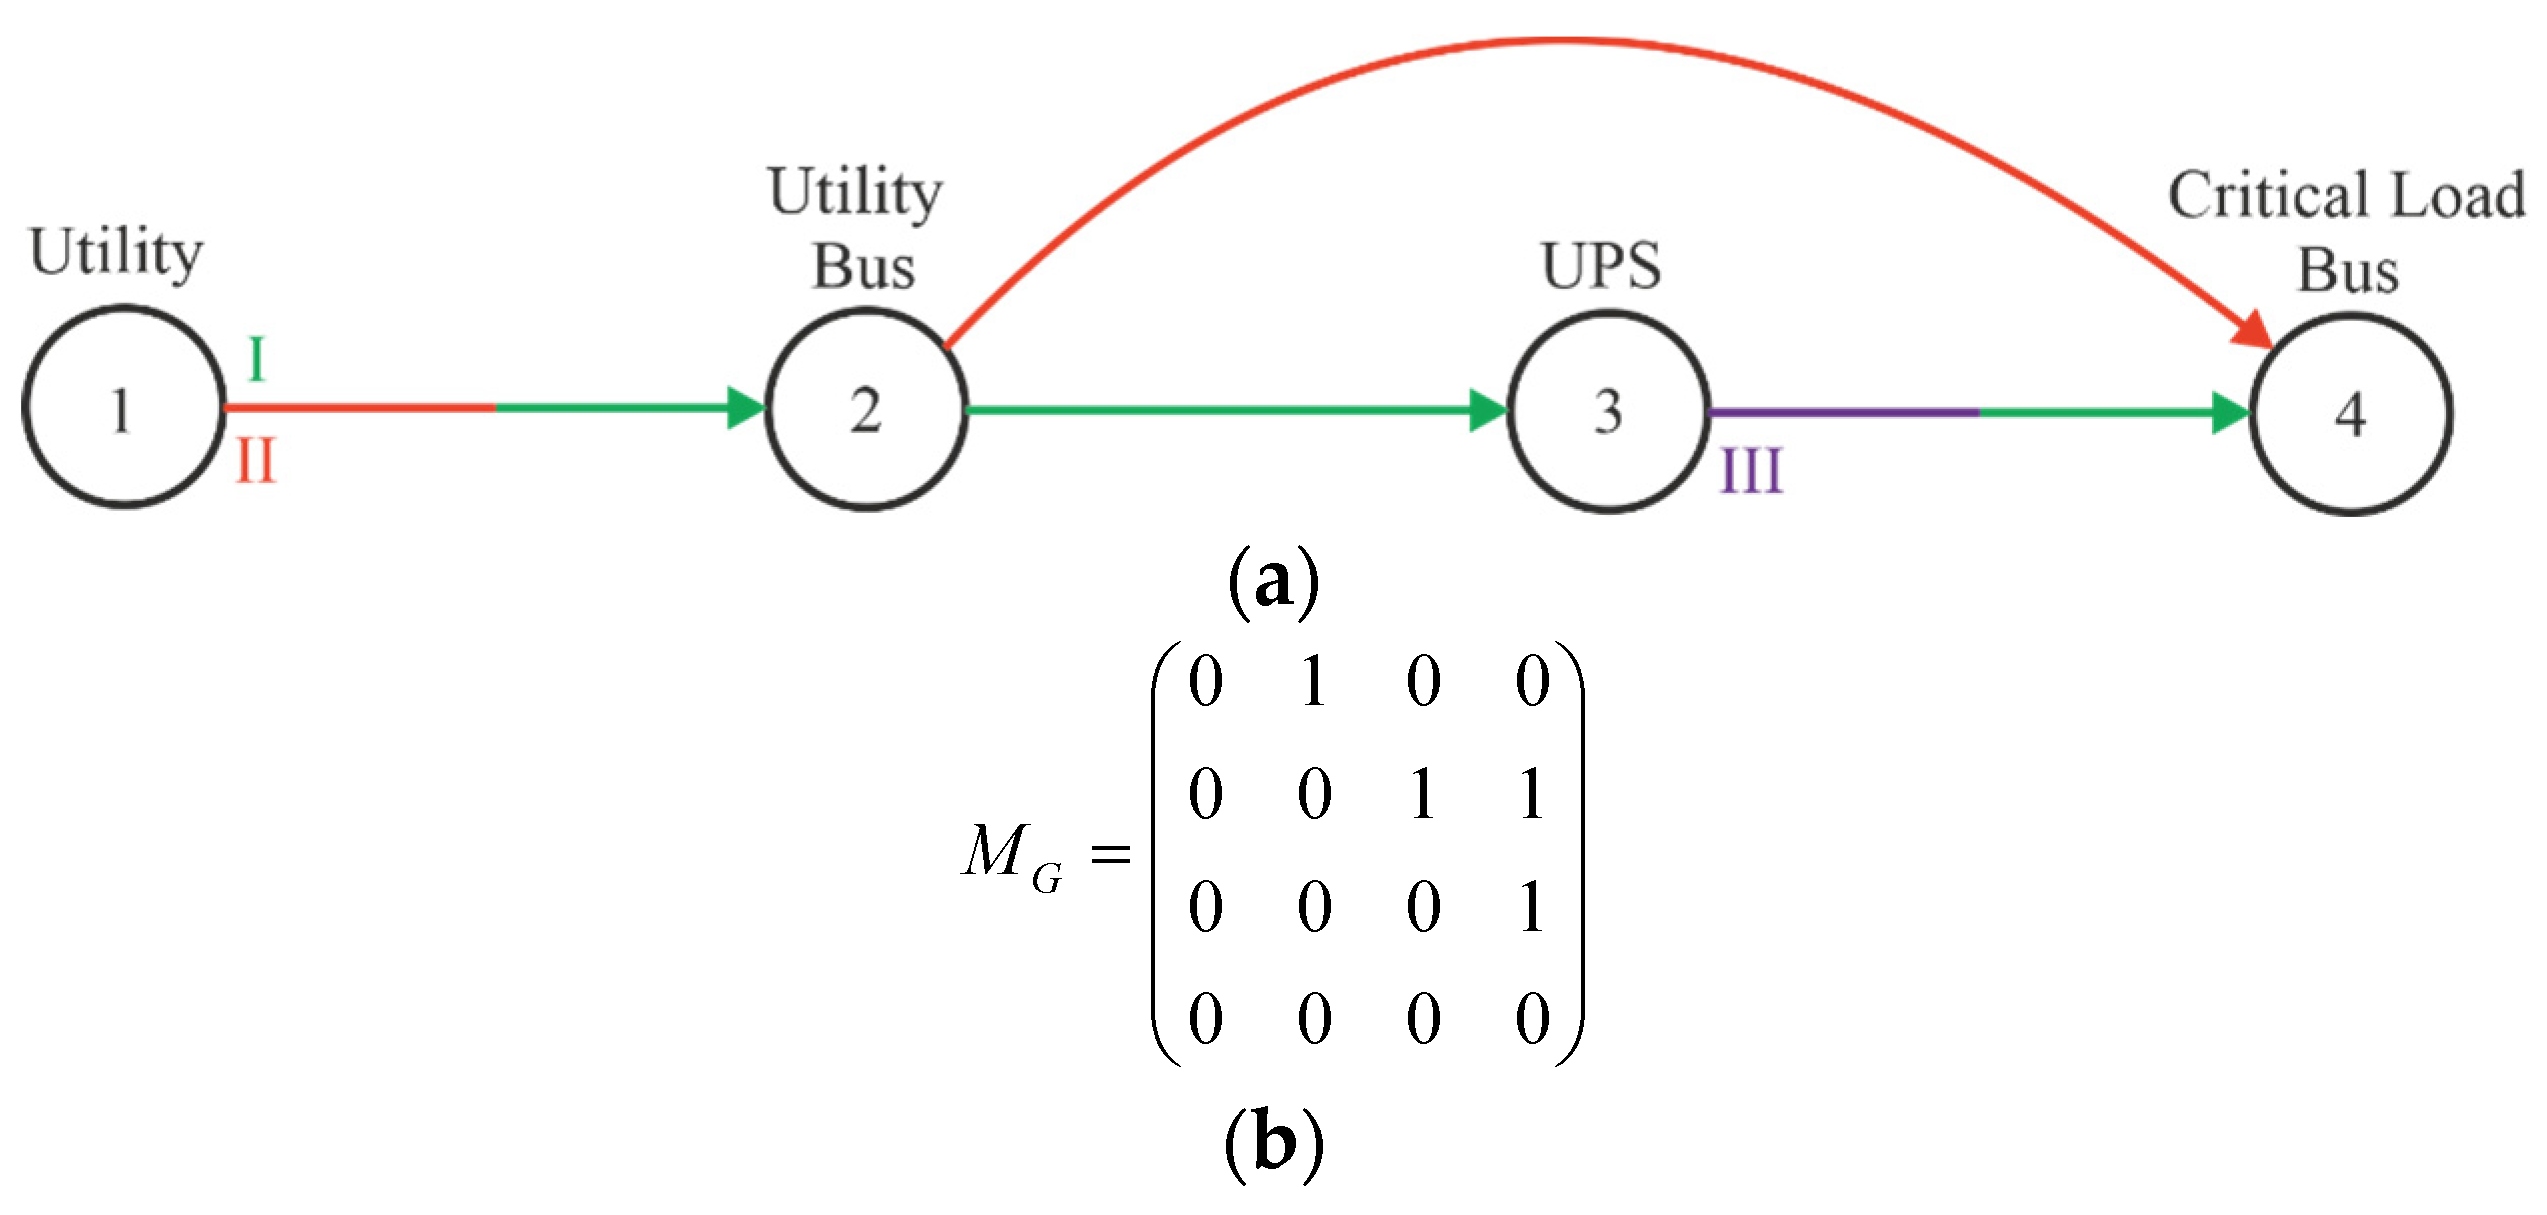
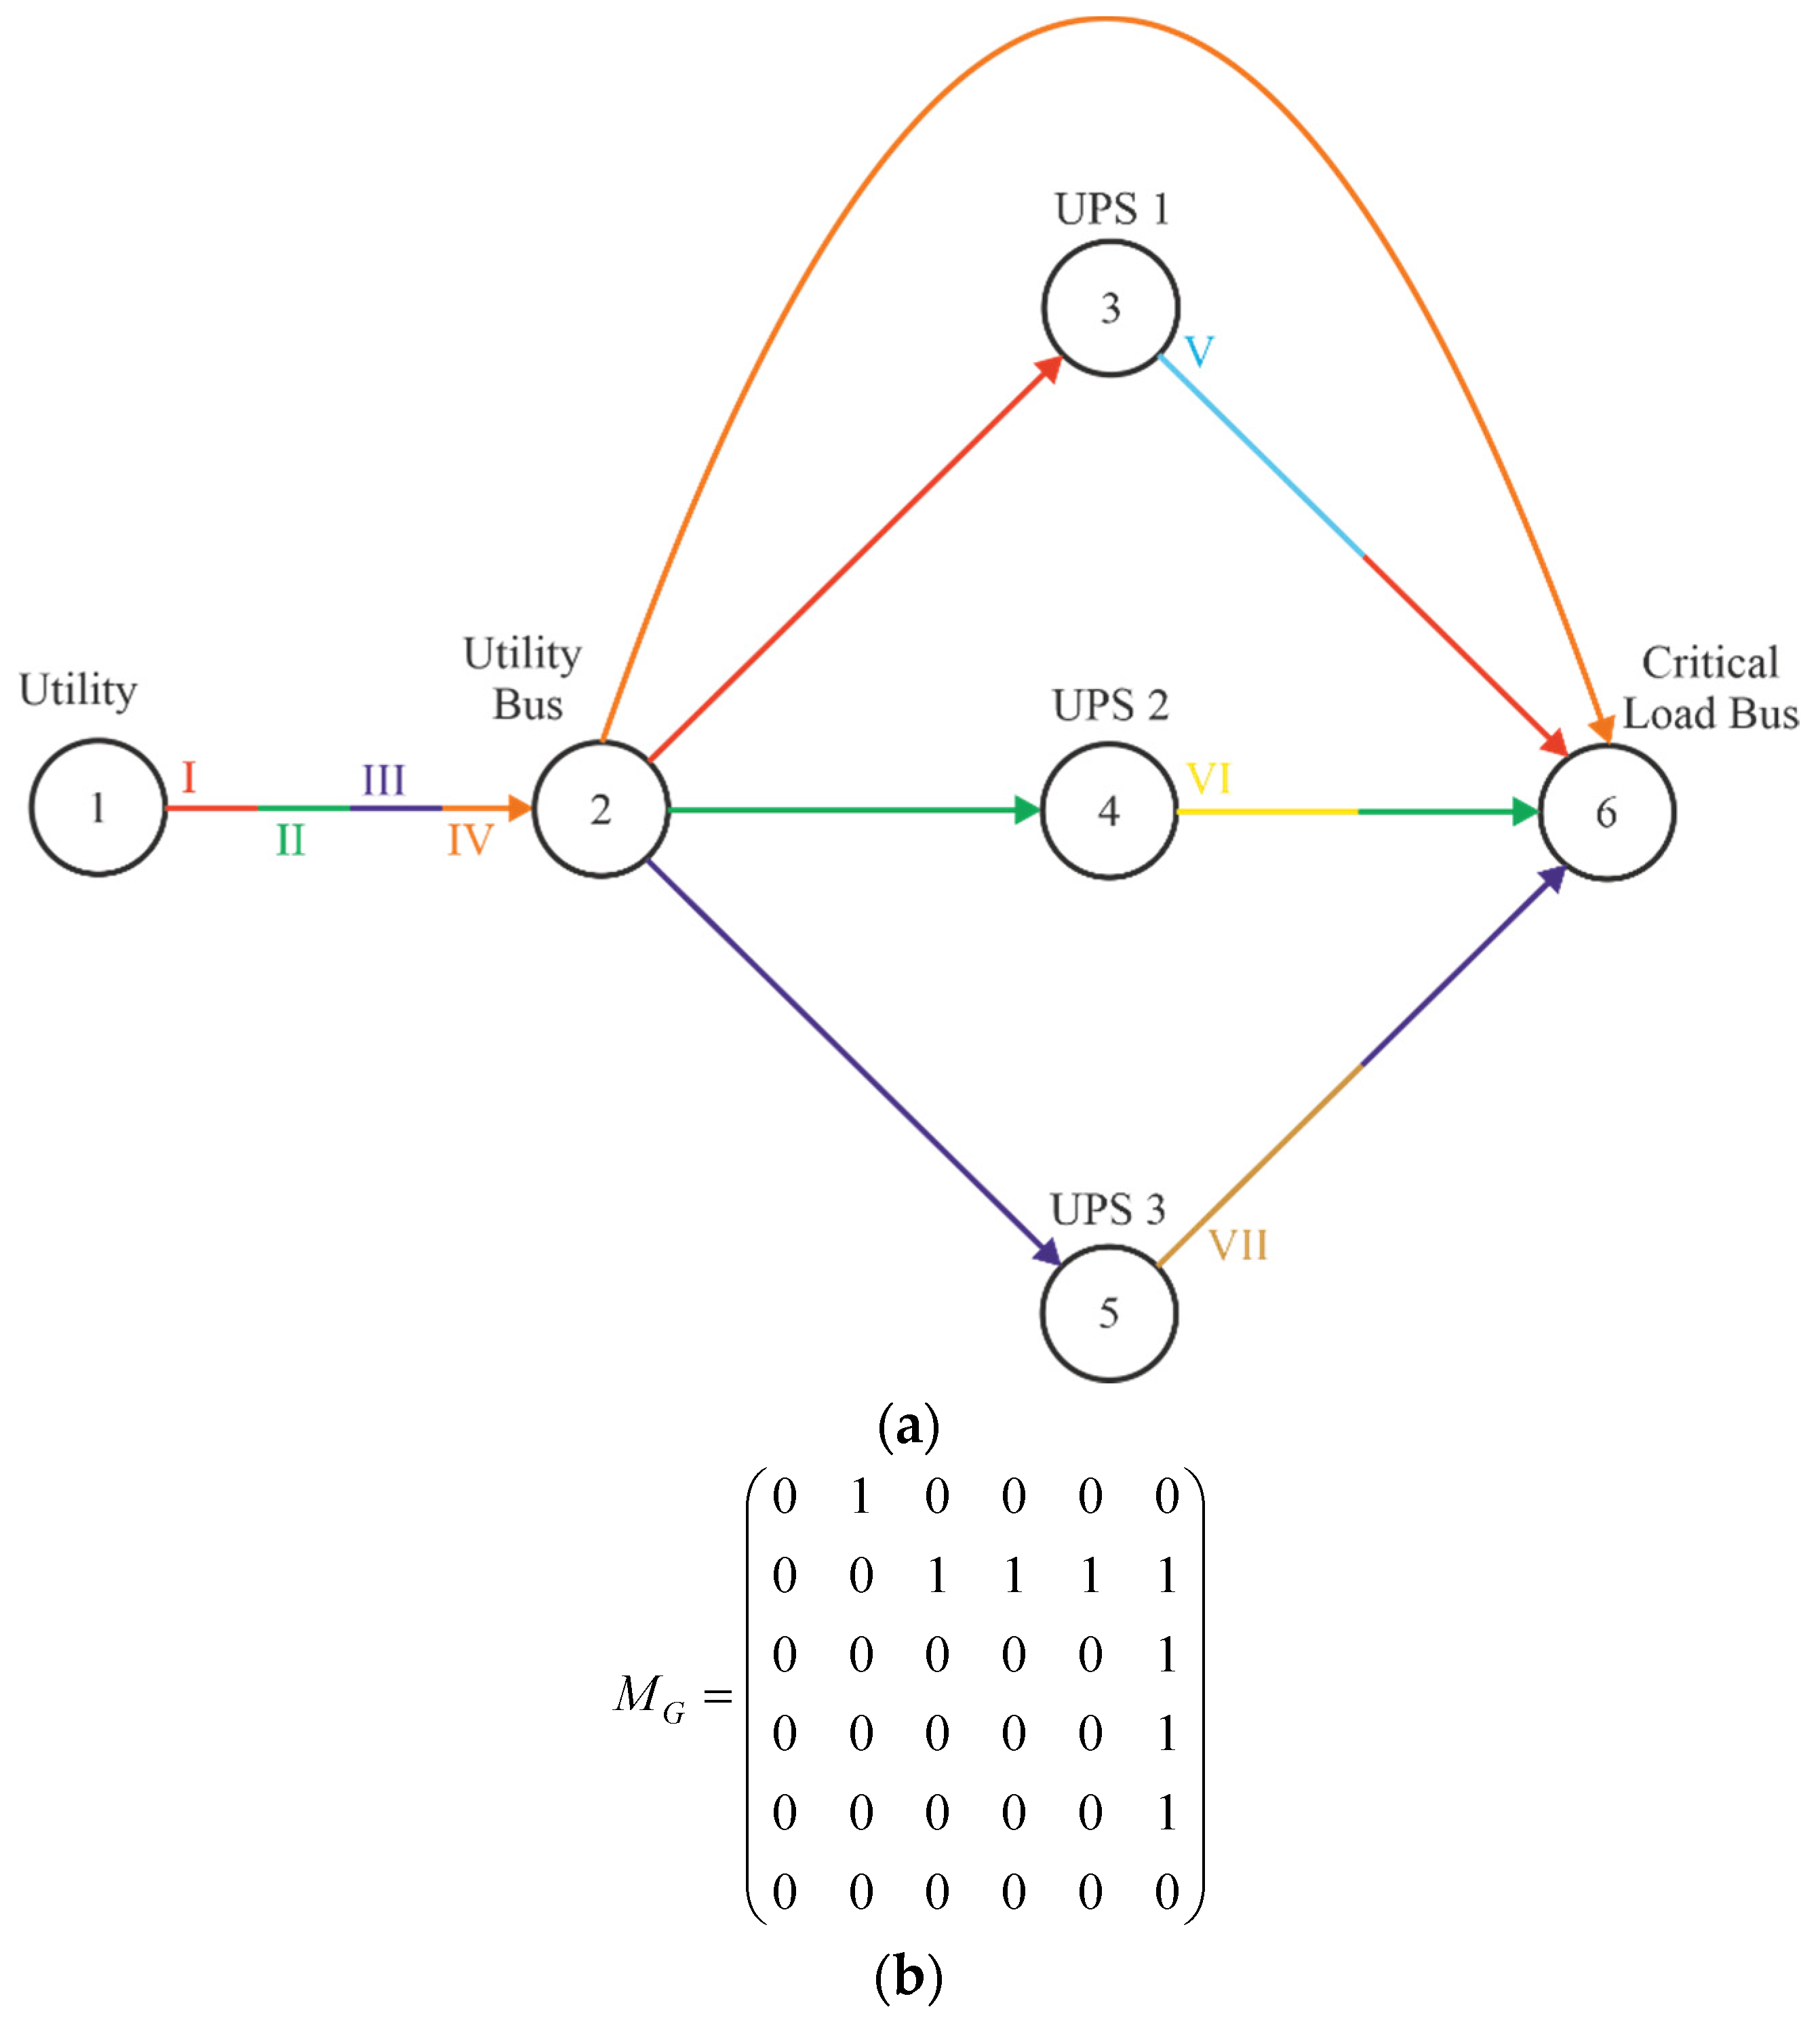
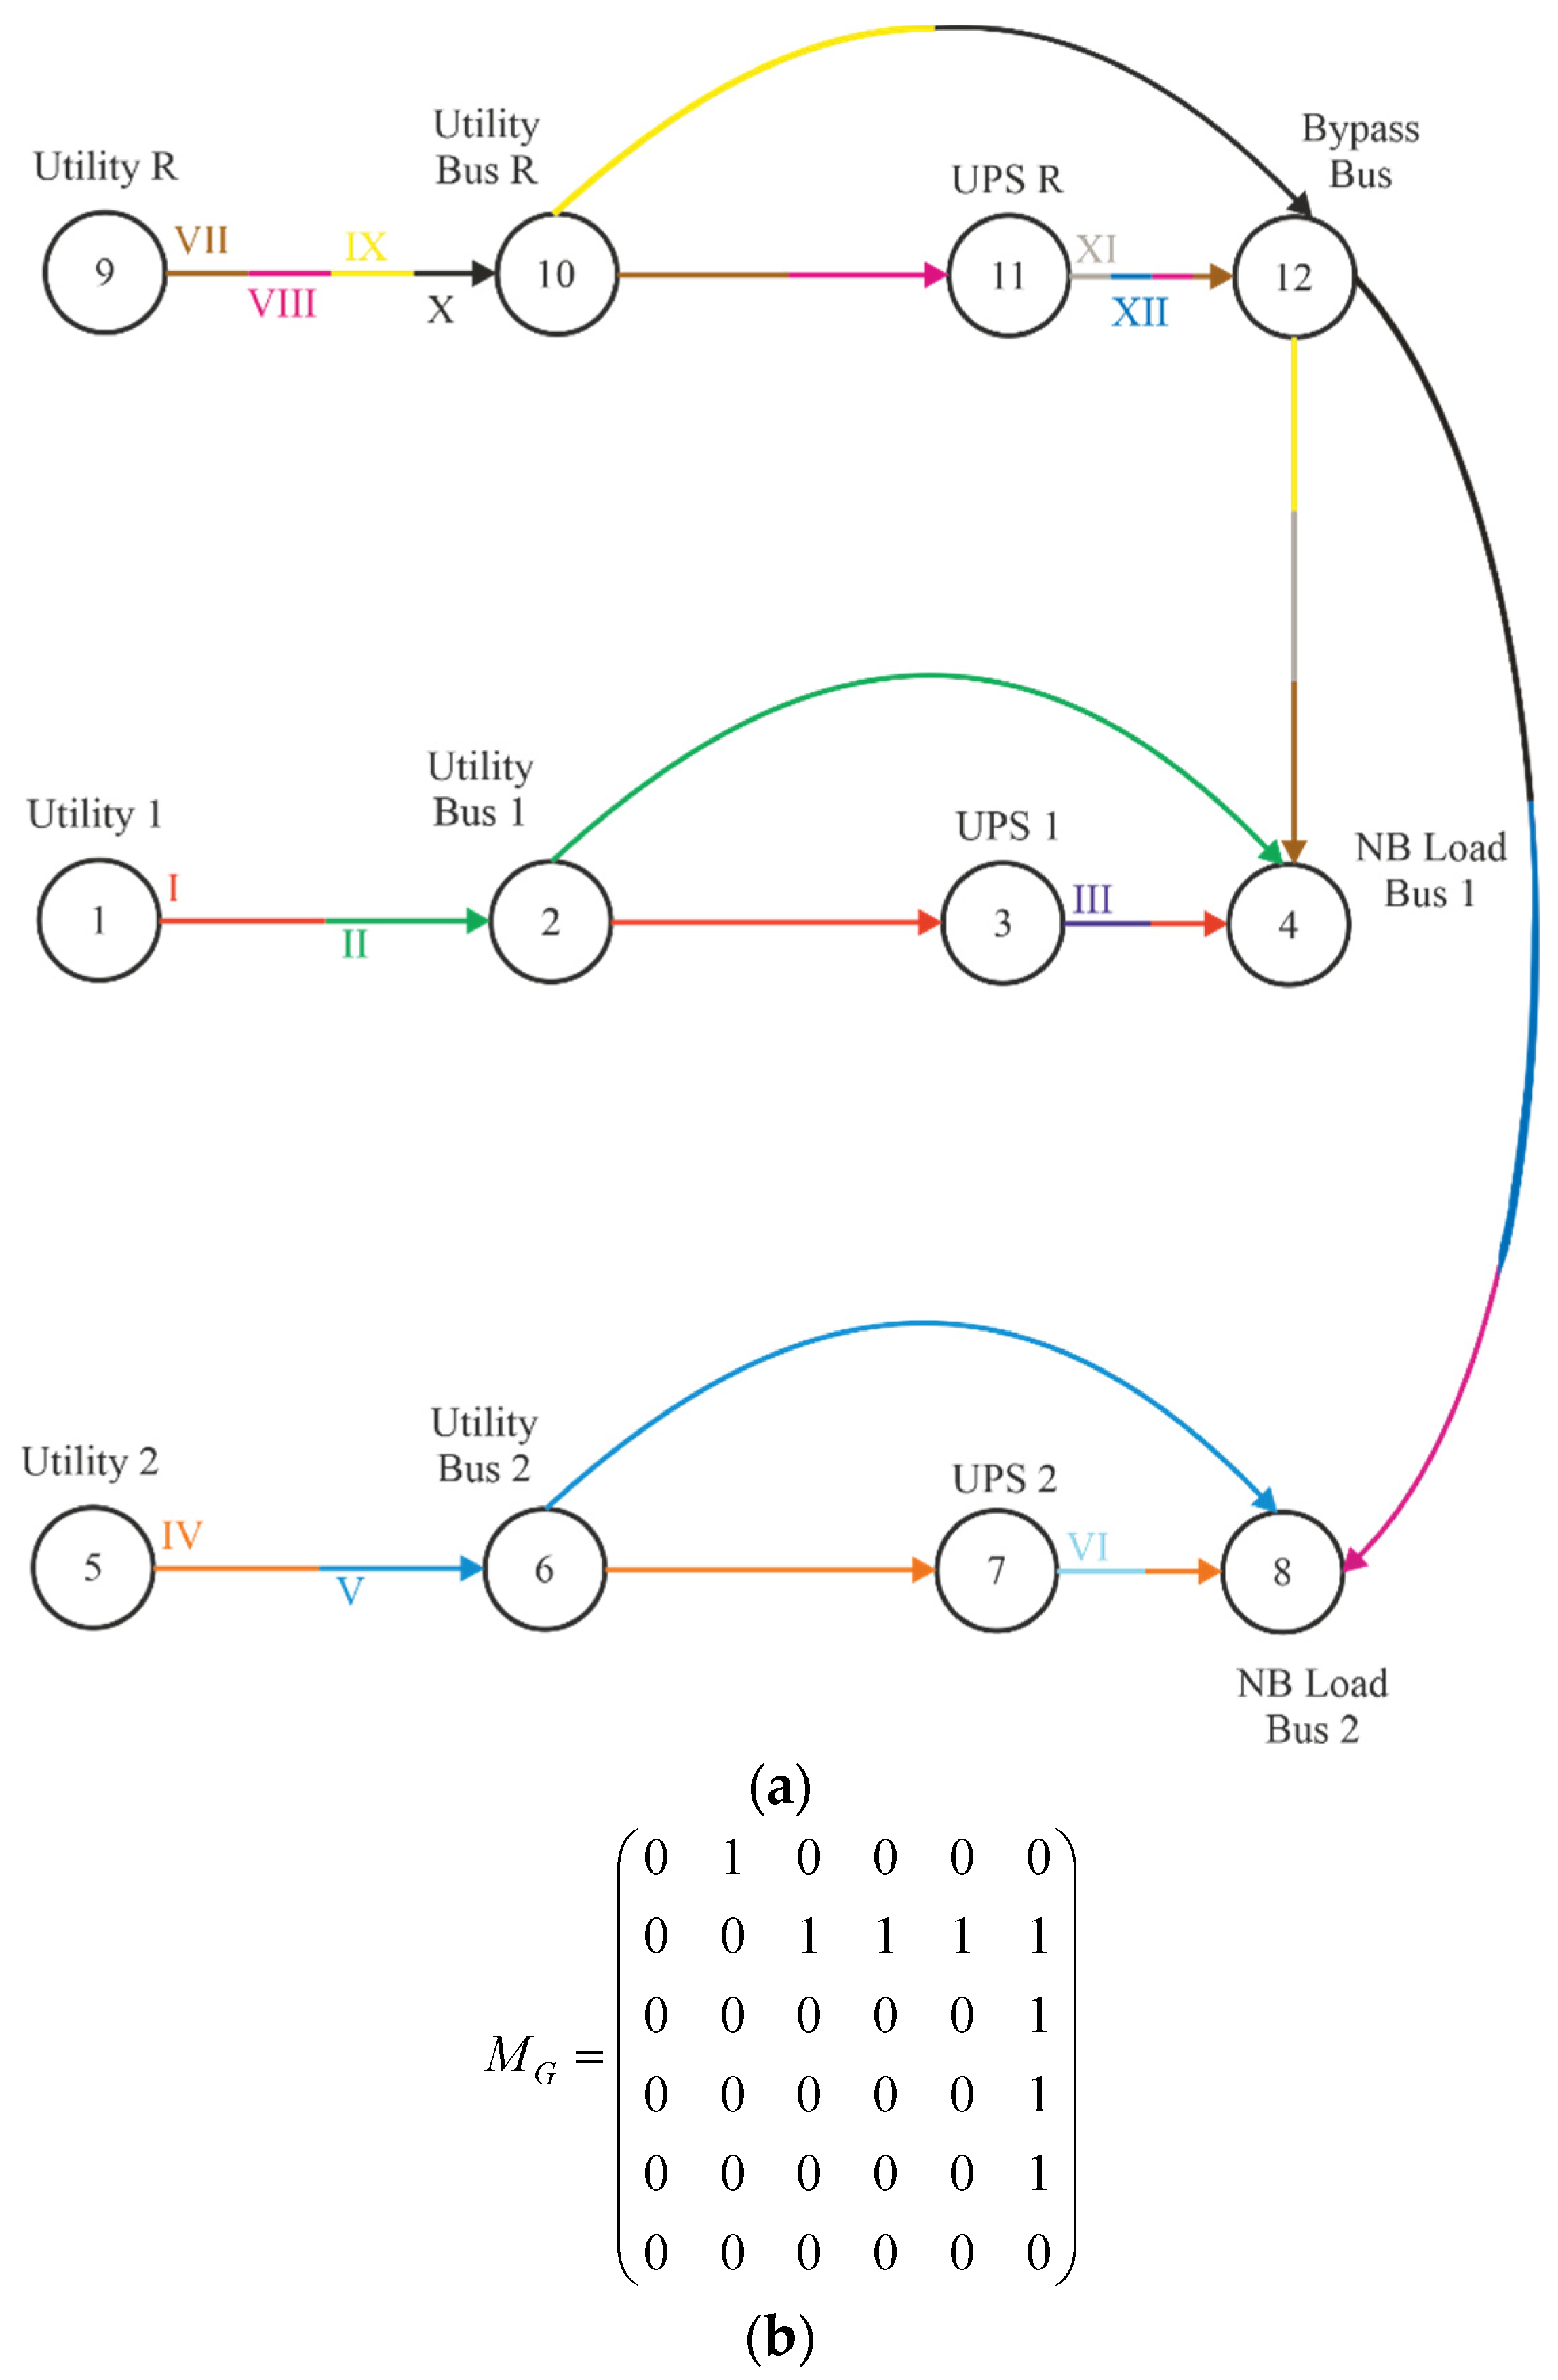
2.2. Informational Analysis Concept

The proposed method has been successfully applied in a number of scientific and practical tasks to assess the reliability, safety and functional efficiency of explosion-proof electrical equipment and the PSS of mining and industrial enterprises [34,35,36]. In [35], it was discovered that there is a strong correlation between the state-of-the-art reliability indicators of the external PSS and the proposed integral indicator that evaluates the quality of the structure of the complex system–structure orderliness of the system.
To assess the state of the internal information of PSS, an informational energy model (IEM) of a system is used. The IEM is an oriented graph whose vertices, depending on the degree of detail, are various technological elements of a system (for example, distribution substations, buses, electrical engineering equipment of end consumers, etc.); the graph edges reflect the paths for energy flows, information, and matter, which circulate in a system (power transmission lines, information and control circuits, etc.). The structure of the IEM is presented in Figure 1.
Information analysis of the power supply system is carried out in stages.
At the first stage, the indicators which characterized the state of the system structural information are defined: an adjacency indicator A, the entropy of the structure H(p) and the integral indicator—the structure orderliness G (an in-depth description of the structural indicators definition is shown in [36]).
In the next stage, the assessment of the operational operation is carried out. For this specific way of the movement of information, energy and matter in the IEM are determined and, next, the information saturation of each way is calculated. The information saturation of the graph l-way is determined using the formula [34]:
v l = p l f l I l ,   bit / s
where Il is the operational information quantity on the graph l-way, defining the possible number of technical states on the given way; fl is the velocity of operational information shifting on the graph l-way; pl is the probability of obtaining reliable operational information from the graph l-way; lm is the number of ways in a system graph.
The inner saturation of all the graph paths of the operational information system can be defined according to the C. Shannon formula [37]:
I q = q = 1 S q p k q log 2 p k q ,   b i t
where pkq is the probability of k-state on the q-way appears; Sq is the quantity of possible states on the q-way.
With the absence of reliable probabilities of states on the way, it is possible to admit that the given events are equally possible. In this case, the quantity of operational information of the way will be maximum and defined according to the formula [35]
I l = log 2 ( Q l м ) , bit
Q l м = l = 1 M l Q l i v M l
where Q l i v is the number of possible states of i-edges, included in l-way, and Ml is the number of edges of l-way.
The velocity of operational information moving in transit is defined as
f l = 1 i = 1 m T l i , 1 / s
where Tli is the time of determining the state in the i-th edge of the lth way, s; m is the number of edges in the way.
The main indicator which characterizes the operational information in the system is the complex operational indicator D [36,38]:
D = l = 1 l m v l = l = 1 l m p l f l I l ,   bit / s ,
where lm is the number of ways in the system’s graph.
In practical tasks of the evaluation of reliability and efficiency of complex systems created on a hierarchical principle (for example, ergatic systems of control of the electrical power supply of industrial enterprises), certain paths of the circulation of operational information have a particular influence on the functioning of a system, i.e., for a more accurate analysis of the state of operational information of a system, it is necessary to rank the flows of information according to the degree of significance. For such cases, it is convenient to use the “price” approach, in which each bit of operational information has its own “price” ci in scores, which depends on the degree of element influence on the functioning of the system.
In the article calculations, the “prices” were considered during the evaluation of the operational information quantity, using the formula
Q l м = l = 1 M l c l i Q l i v M l
where cli is the “price” of the operational information of i-element in l-way, measured in scores.
Concerning the research, for the questions of the assessment of reliability of the electrical power supply of data centers, taken as the object of study in this article, the “price” approach allows to take into account the difference in electrical power supply using UPS—the “protected” path, and “unprotected” (for example, in the “bypass” mode during maintenance or repair UPS).
The main criterion for the functional efficiency of the complex system according to the proposed method is the information resource of the system R (stage 8), the value of which is formed by the structural G and the operational components D:
R = f ( G , D ) Max
The indicator is taken for the system information resource:
R = G D ,   bit / s
The maximum of the system information resource can be observed in the systems with an ordered structure which have an optional quantity of structural information and the maximum possible (economically viable) saturation of operational information linkages.
It is assumed that the scope of the proposed method will be the following:
  • The proposed method can be used for a preliminary assessment of options for the reconstruction of the PSS of different industrial enterprises;
  • The proposed method can be used during the creation of complex multilevel reliability models, where there is a problem of the correctness of the mathematical description of the simulated objects;
  • The proposed method can be used as a supplement to state-of-the-art methods in the formation of an enterprise PSS development strategy.

3. Use Cases

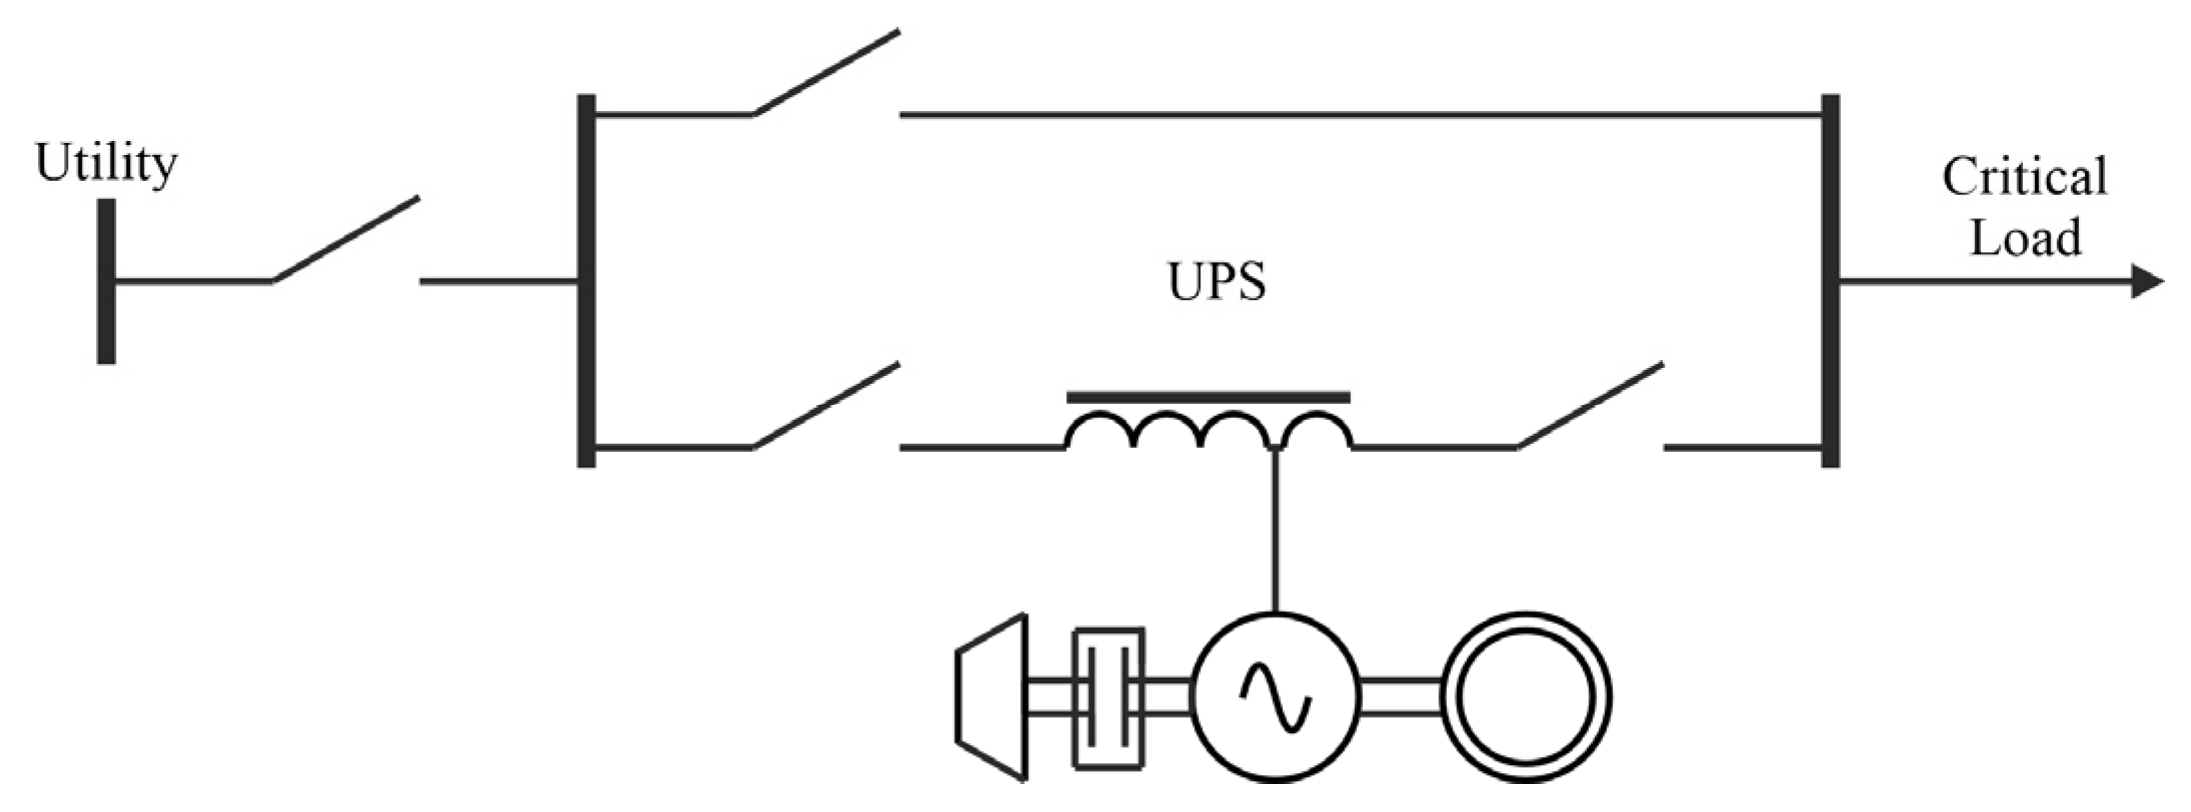
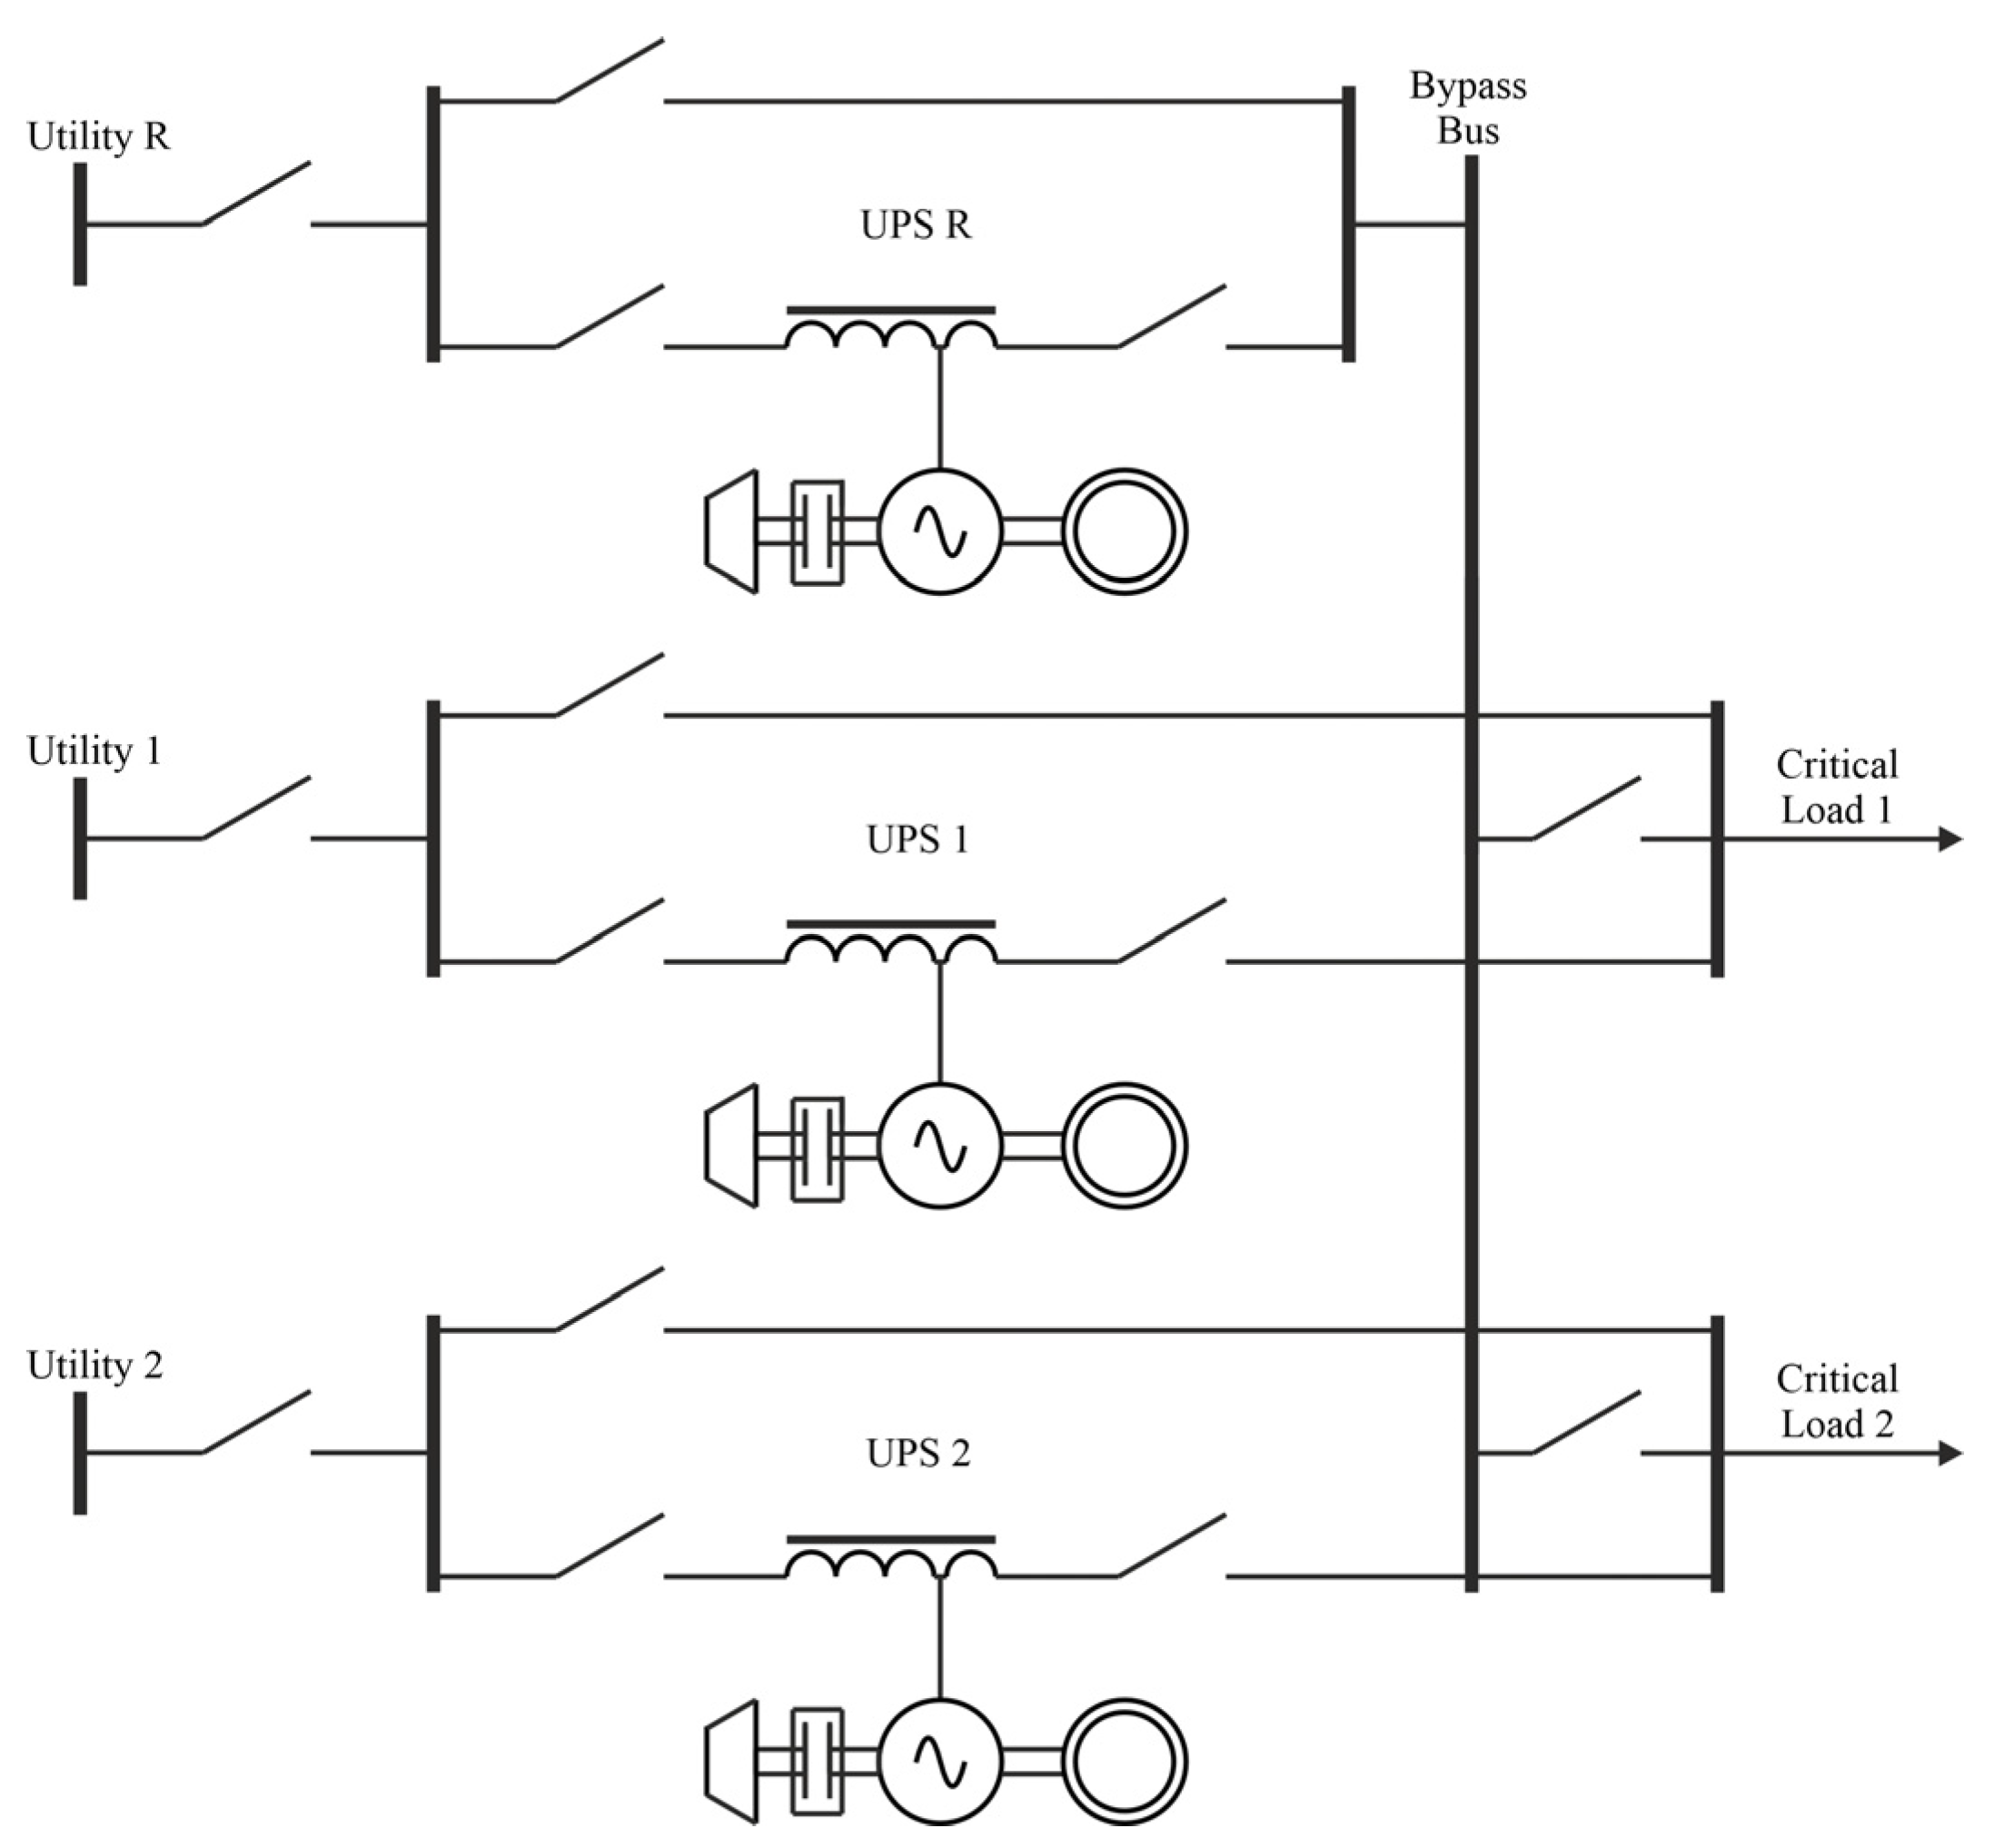
3.1. General Information

When designing the PSS for a data center or developing options to increase the output power of the PSS of an existing data center, the task of choosing a rational scheme of the PSS becomes relevant, subject to the requirements for electrical power supply reliability in accordance with standards, regulations, and specifications. A common scheme of the PSS data center is shown in Figure 2.
The main component of the data center power supply system is the UPS. Traditionally, UPS are divided into static and dynamic. Static UPS use batteries as energy storage, while dynamic UPS use flywheels as kinetic energy storage. In this article, the information analysis of the PSS with UPS of the second type is carried out, using the example of classic dynamic UPS—Diesel Rotary Uninterruptible Power Supply (DRUPS).
The DRUPS with diesel engine conditions the power supply and protects against power interruptions. The failure mode considered in the current reliability analysis is the interruption of the critical load. The critical load is supplied in utility mode, bypass mode or diesel mode. The interruption of critical load will occur in the event of the three modes failing simultaneously.
In utility mode, the critical load is supplied by the regular power supply and, at the same time, the generator maintains the speed of the kinetic energy storage. In the case of a failure in the UPS system, the utility mode is transferred to bypass mode. In bypass mode, critical load is still provided by the utility power supply but is unconditioned. In the event of a utility power failure, the UPS system transfers to diesel mode. The generator, first driven by the kinetic energy storage and then by the diesel engine, supplies power to the critical load.

3.2. System Configurations Assessment

Usually, the PSS with DRUPS are combined to systems which contain combinations of serial, parallel and bridge configurations. The most common systems’ configurations are (in this article, due to the large size of the principal schemes of the PSS, only three configurations are shown):
(1)
Single System (Figure 3)
(2)
Parallel System (Figure 4)
(3)
Cross Link
(4)
Isolated Parallel
(5)
Isolated Redundant (Figure 5)
(6)
Distributed Redundant

3.2.1. State-of-the-Art Reliability Indicators

At present, probabilistic and statistical reliability indicators are the most widely used: component failure rate λc, MTBF, MDT, MTTR; the average component availability Ac.
MTBF calculations were performed with RBD diagrams according to the standard [6], using the initial data presented in [39,40,41,42,43,44,45,46,47]. An example of an RBD diagram for a PS configuration is shown in Figure 6.
The results of the reliability calculation for all configurations are shown in Table 1.

3.2.2. PSS Informational Analysis
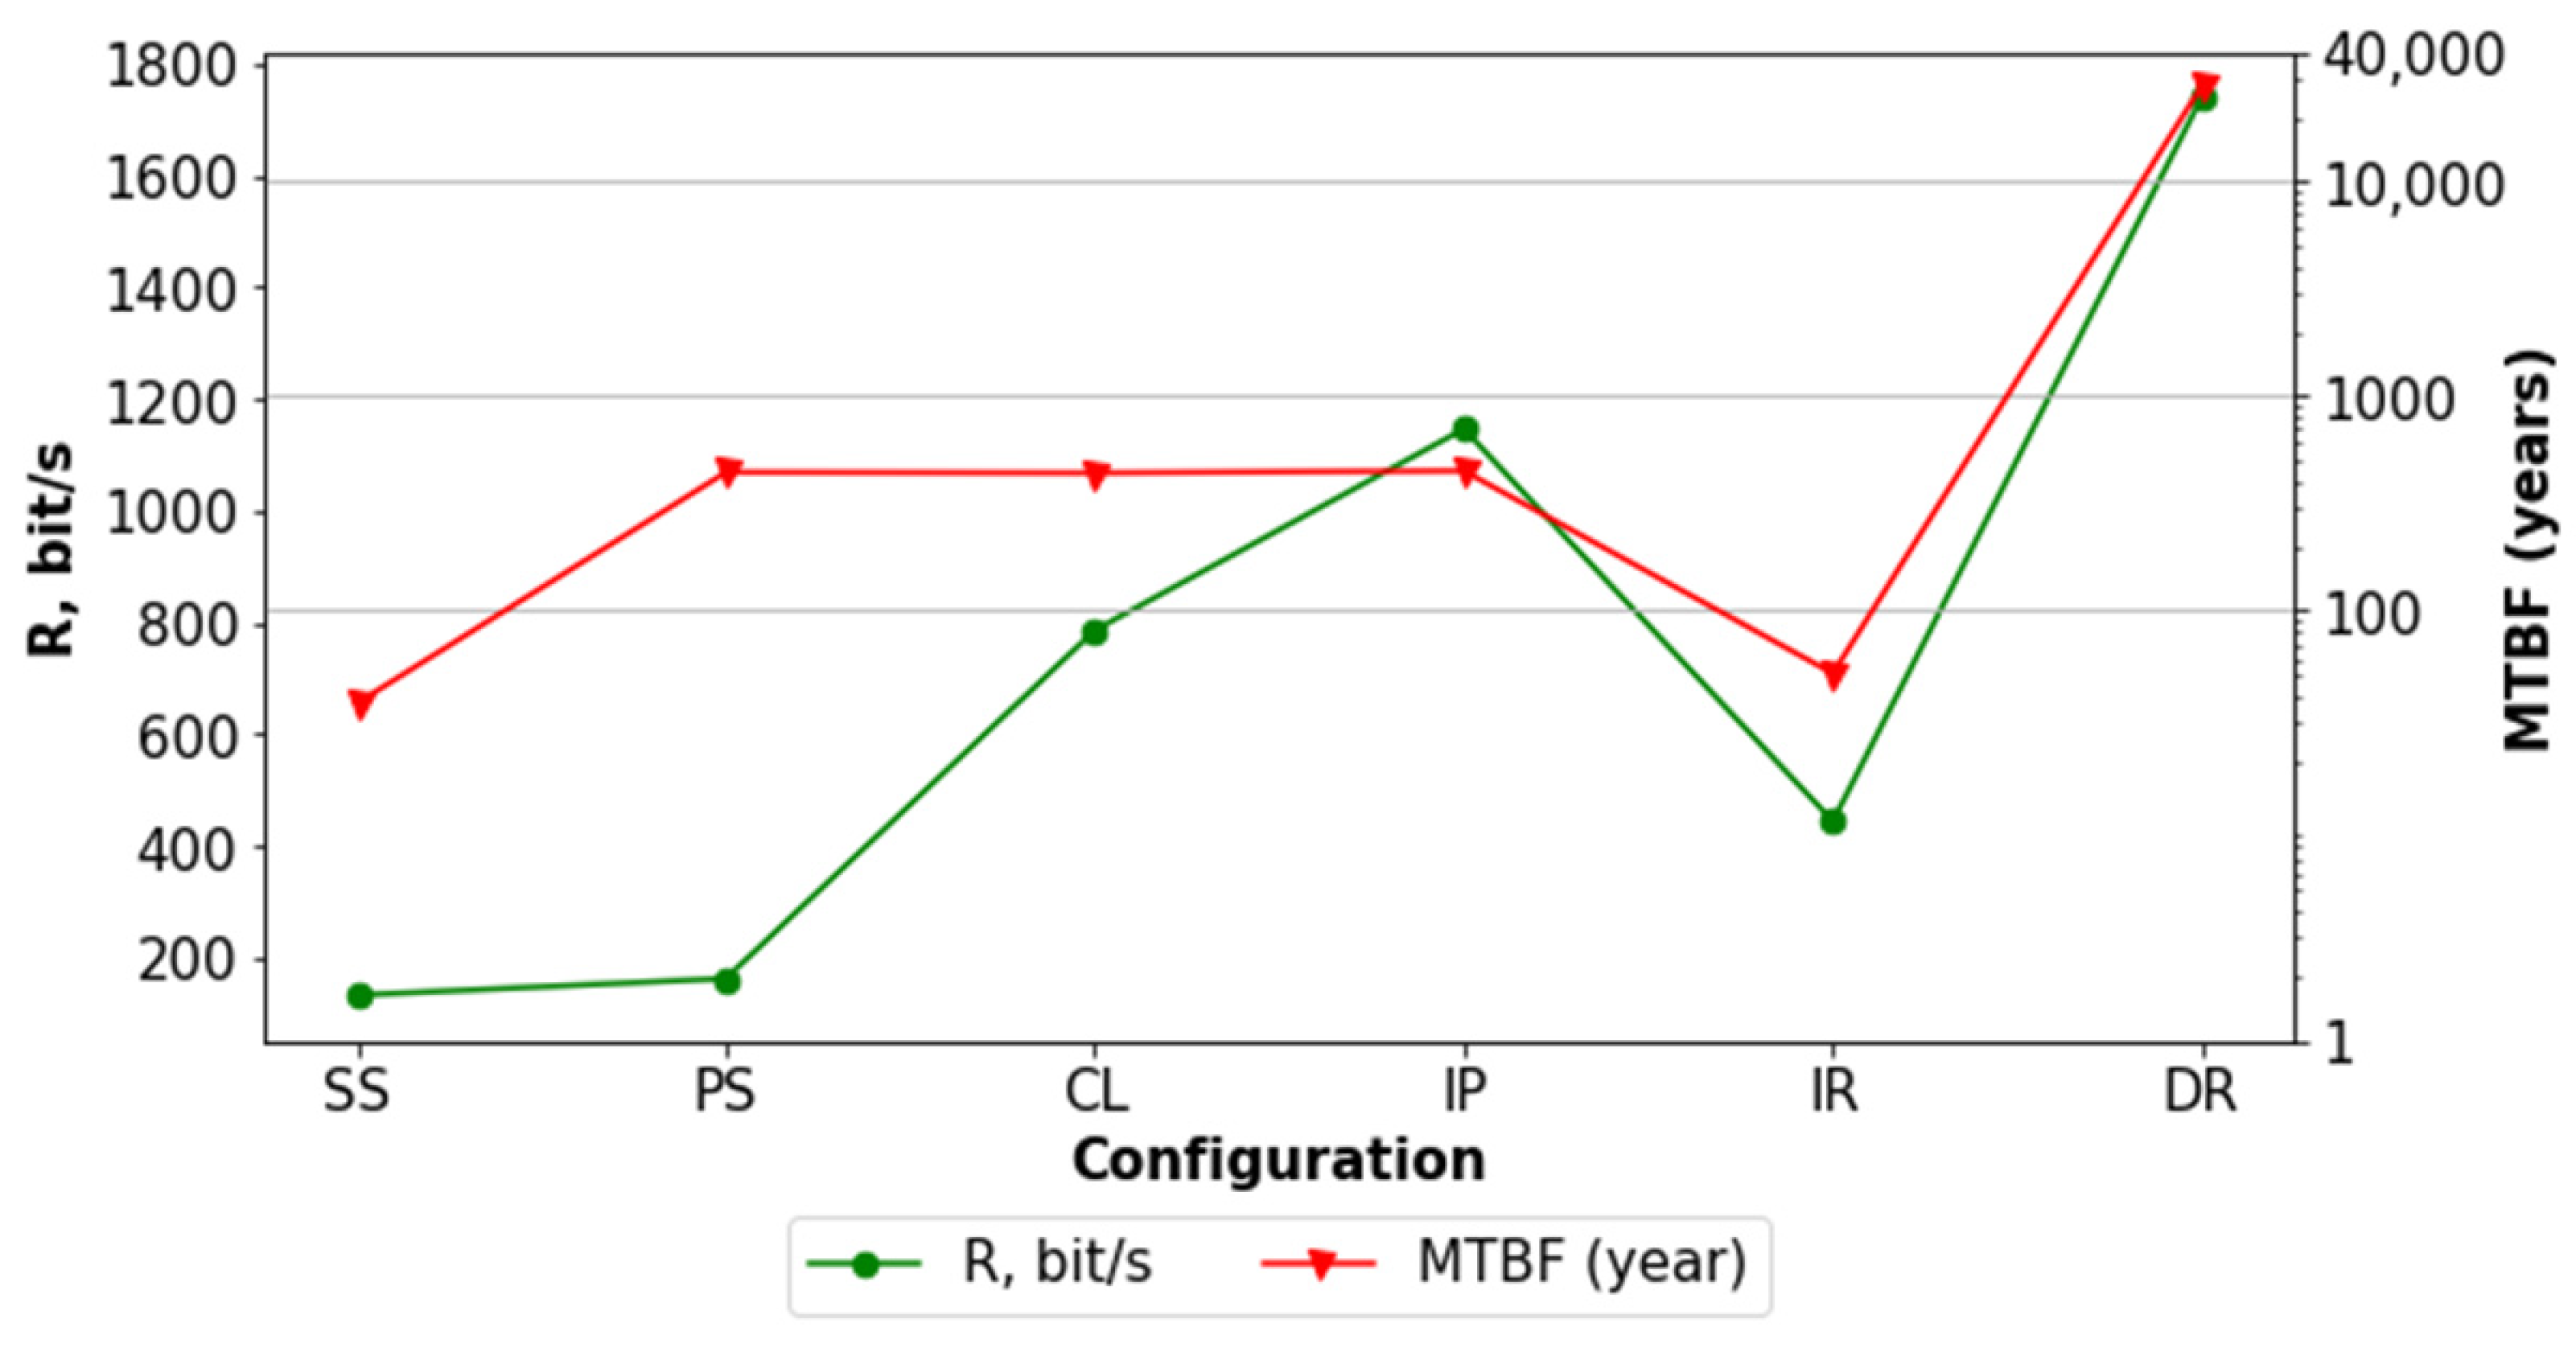
Informational analysis of the PSS is considered in the article for each configuration; oriented graphs (Figure 7, Figure 8 and Figure 9) and adjacency matrixes were made, and the calculation of proposed structural indicators was carried out.
The calculation of informational indicators for each path and of the movement of operational information were done using Formulas (4)–(9). Each path is shown on configuration’s graph using its unique color and roman numeral. Roman numeral place near the first element of the path and colored in the same color as the path. By tracing edges of one color, starting at the first element, all the elements and edges of the particular path can be identified.
As an example of the calculation of operational indicators, the calculation for the Parallel System is shown in Table 2. The results of the structural and operational indicators are shown in Table 3.
When filling in Table 2 and Table 3, the following states in edges were considered: “switched on”, “switched off” and “emergency shutdown” states of circuit breakers; for fl value, the cutin speed of circuit breakers was considered; the values of pl were taken from [39,40,41,42,43,44,45,46,47].

4. Results

The results for all six configurations with relative MTBF (year) indexes are shown in Table 4 and the comparison in the form of a graph is shown in Figure 10.
The data in Figure 10 show that the MTBF and R parameters generally correlate to each other with a correlation coefficient of 0.793(0.829). It is also obvious that the maximum and minimum values of the MTBF and R parameters coincide (for the SS and DR configuration). However, for the DR configuration, a significantly greater increase in the value of the MTBF indicator is observed, which raises certain doubts about its objectivity.
It should be noticed that the distribution of MTBF and R values for PS, CL, and IP configurations is somewhat different. This discrepancy can be explained by the gradual increase in the number of redundant paths in the PS, CL, and IP configuration structures, which has a significant impact on the R parameter, while the MTBF parameter is less sensitive to this property of the configurations.
Additionally, the values of the MTBF and R parameters for the IR configuration are somewhat ambiguous. Both parameters are characterized by a decrease in the calculated value; however, for R, the decrease is less sharp than for MTBF. This fact can be explained by there being twice as many paths in the IR structure as in PS (6 versus 12), which, as noted above, significantly affects the parameter R.

5. Discussion

Based on the obtained results and correlation coefficients, it can be noted that the proposed method makes it possible to determine the preliminary reliability characteristics of the PSS at the design stage using the minimum amount of initial data. Moreover, the method makes it possible to illustrate the individual advantages of specific PSS configurations more clearly.
Such an approach allows assessment from the reliability point of view of different projects of PSS configurations for data centers without detailed analysis of special characteristics of applied equipment which, in turn, saves time and project budget. There is no need to carry out complex and costly detailed reliability assessments of each configuration in the first stage, it is only necessary to find the best configuration using the proposed method and, next, make all necessary calculations for this best configuration.
The proposed method can be expanded with different cost indicators. This will enable integrated technical and economic assessment of the different configurations of PSS in the early stages of construction or reconstruction.
Cost indicators can be calculated with the help of special matrices (with the same dimension as the vertex adjacency matrix), which identify the cost indicators of interest. Such cost indicators can have a technical or economical nature; for example, line load factors, tangents of the phase shift angle in the line, average lengths of communication lines, capital and operating expenditures. Based on these matrices, it will become possible to estimate the weighted average cost of the power supply system.
The cost of communication means the cost of the elements to which the corresponding connection is directed: the cost of cables, the cost of transmitted information, the electricity cost, etc.
In the future, these parameters should be considered when developing the proposed methodology.

6. Conclusions

This article presents a description of the information resource assessment method used to determine the reliability indicators of dynamic UPS.
The main advantage of the proposed method is that it makes it possible to evaluate the functional efficiency of complex systems with a minimum set of initial data that consider energy and information flows.
Compared to state-of-the-art methods, the proposed method does not require information about the value of the uptime of each UPS element. Obtaining such information can be difficult when considering options for the reconstruction of existing power supply schemes.
As an example, the authors considered the power supply scheme of a data center when choosing the UPS configuration of which the method of evaluating the information resource was used. As a result, a correlation was established between the MTBF and R.
In the future, the method can be improved by including the human factor in the model, and estimating the recovery time of power supply and cost indicators.

Author Contributions

Methodology, K.V.; Formal analysis, K.V. and F.N.; Resources, K.V. and A.E.; Writing—original draft, K.V., F.N., S.Z. and Q.C.; Writing—review and editing, Q.C.; Visualization, F.N. and K.V.; Project administration, K.V. and A.E. All authors have read and agreed to the published version of the manuscript.

Funding

This research was funded by Ministry of Science and Higher Education of the Russian Federation grant number 075-03-2021-138/3.

Institutional Review Board Statement

Not applicable.

Informed Consent Statement

Not applicable.

Data Availability Statement

Not applicable.

Conflicts of Interest

The authors declare no conflict of interest.

Abbreviations

ANP Analytic Network Process
CLCross Link
DRDistributed Redundant
DRUPSDiesel Rotary Uninterruptible Power Supply
FMECAFailure Mode, Effects And Criticality Analysis
FTAFault Tree Analysis
IEMInformational Energy Model
IPIsolated Parallel
IRIsolated Redundant
ITInformation Technology
MCMCMarkov Chain Monte Carlo
MDTMean Down Time
MTBFMean Time Between Failures
MTTFMean Time To Failure
MTTRMean Time To Repair
PSParallel System
PSSPower Supply System
RBDReliability Block Diagrams
SSSingle System
UPSUninterruptible Power Source

References

  1. Zio, E. Reliability engineering: Old problems and new challenges. Reliab. Eng. Syst. Saf. 2009, 94, 125–141. [Google Scholar] [CrossRef]
  2. Ahmed, K.M.U.; Alvarez, M.; Bollen, M.H. Reliability Analysis of Internal Power Supply Architecture of Data Centers in Terms of Power Losses. Electr. Power Syst. Res. 2021, 193, 107025. [Google Scholar] [CrossRef]
  3. Arno, R.; Friedl, A.; Gross, P.; Schuerger, R.J. Reliability of Data Centers by Tier Classification. IEEE Trans. Ind. Appl. 2011, 48, 777–783. [Google Scholar] [CrossRef]
  4. Turner, W.P.; Seader, J.H.; Renaud, V.; Brill, K.G. Tier Classification Define Site Infrastructure Performance; Uptime Institute: New York, NY, USA, 2006; Available online: https://fsta.dk/wp-content/uploads/2019/06/Tier-Classifications-Define-Site-Infrastructure-Performance.pdf (accessed on 26 December 2022).
  5. Ahmed, K.M.U.; Bollen, M.H.J.; Alvarez, M. A Review of Data Centers Energy Consumption and Reliability Modeling. IEEE Access 2021, 9, 152536–152563. [Google Scholar] [CrossRef]
  6. IEC 61078:2016; Reliability Block Diagrams. 2016. Available online: https://webstore.iec.ch/publication/25647 (accessed on 26 February 2022).
  7. IEC 61025:2006; Fault Tree Analysis (FTA). International Electrotechnical Commission: Geneva, Switzerland, 2006.
  8. Barthelme, A.; Xu, X.; Zhao, T. A hybrid AC and DC distribution architecture in data centers. In Proceedings of the IEEE Energy Conversion Congress and Exposition (ECCE), Cincinnati, OH, USA, 1–5 October 2017. [Google Scholar] [CrossRef]
  9. Thomas, M.S.; Ali, I. Reliable, Fast, and Deterministic Substation Communication Network Architecture and its Performance Simulation. IEEE Trans. Power Deliv. 2010, 25, 2364–2370. [Google Scholar] [CrossRef]
  10. Robidoux, R.; Xu, H.; Xing, L.; Zhou, M. Automated Modeling of Dynamic Reliability Block Diagrams Using Colored Petri Nets. IEEE Trans. Syst. Man, Cybern. Part A Syst. Humans 2009, 40, 337–351. [Google Scholar] [CrossRef]
  11. Rahmat, M.K.; Sani, M.N. Fault tree analysis in UPS reliability estimation. In Proceedings of the 4th International Conference on Engineering Technology and Technopreneuship (ICE2T), Kuala Lumpur, Malaysia, 27–29 August 2014. [Google Scholar] [CrossRef]
  12. Chalermarrewong, T.; Achalakul, T.; See, S.C.W. Failure Prediction of Data Centers Using Time Series and Fault Tree Analysis. In Proceedings of the IEEE 18th International Conference on Parallel and Distributed Systems, Singapore, 17–19 December 2012; pp. 794–799. [Google Scholar] [CrossRef]
  13. Leelipushpam, G.J.; Jebadurai, I.J.; Jebadurai, J. Fault Tree Analysis based Virtual Machine Migration for Fault-Tolerant Cloud Data Center. J. Integr. Des. Process. Sci. 2021, 23, 73–89. [Google Scholar] [CrossRef]
  14. Sanusi, A.; Yusuf, I. Reliability assessment and profit analysis of distributed data center network topology. Life Cycle Reliab. Saf. Eng. 2022, 11, 75–86. [Google Scholar] [CrossRef]
  15. Chaari, F.; Chiementin, X.; Zimroz, R.; Bolaers, F.; Haddar, M. (Eds.) Smart Monitoring of Rotating Machinery for Industry 4.0; Springer International Publishing: Cham, Switzerland, 2022; Volume 19. [Google Scholar] [CrossRef]
  16. Pinto, C.A.; Farinha, J.T.; Raposo, H.; Galar, D. Stochastic versus Fuzzy Models—A Discussion Centered on the Reliability of an Electrical Power Supply System in a Large European Hospital. Energies 2022, 15, 1024. [Google Scholar] [CrossRef]
  17. Rahmat, M.K.; Karim, A.Z.A.; Salleh, M.N. Uninterruptible Power Supply System Configurations: Reliability & Cost-Benefit Analysis. In Proceedings of the IEEE 7th International Conference on Power and Energy (PECon), Kuala Lumpur, Malaysia, 3–4 December 2018; pp. 252–256. [Google Scholar]
  18. Bennaceur, W.M.; Kloul, L. Formal models for safety and performance analysis of a data center system. Reliab. Eng. Syst. Saf. 2019, 193, 106643. [Google Scholar] [CrossRef]
  19. Xiahou, X.; Chen, J.; Zhao, B.; Yan, Z.; Cui, P.; Li, Q.; Yu, Z. Research on Safety Resilience Evaluation Model of Data Center Physical Infrastructure: An ANP-Based Approach. Buildings 2022, 12, 1911. [Google Scholar] [CrossRef]
  20. Koval, D.O.; O’Donnell, P.; Institutional Cooperation. IEEE Recommended Practice for the Design of Reliable Industrial and Commercial Power Systems. In IEEE Std 493-2007 (Revision of IEEE Std 493-1997); IEEE: New York, NY, USA, 2007; 383p. [Google Scholar] [CrossRef]
  21. Gang, W.; Mao-Sheng, D.; Xiao-Hua, L. Analysis of UPS system reliability based on Monte Carlo approach. In Proceedings of the IEEE Region 10 Conference TENCON 2004, Chiang Mai, Thailand, 24 November 2004. [Google Scholar] [CrossRef]
  22. Smith, W.E.; Trivedi, K.S.; Tomek, L.A.; Ackaret, J. Availability analysis of blade server systems. IBM Syst. J. 2008, 47, 621–640. [Google Scholar] [CrossRef]
  23. de Lima Melo, F.F.; de Almeida Callou, G.R.; Teixeira Gomes de Sousa, E. Sensitivity Analysis of Data Center Electrical Infrastructures Considering Aspects of Dependability and Cost. IEEE Lat. Am. Trans. 2021, 19, 235–242. [Google Scholar] [CrossRef]
  24. Ushakov, I.A. Course of the Theory of Systems Reliability; Drofa: Moscow, Russia, 2008. [Google Scholar]
  25. Kim, M.C. Reliability block diagram with general gates and its application to system reliability analysis. Ann. Nucl. Energy 2011, 38, 2456–2461. [Google Scholar] [CrossRef]
  26. Razgildeev, G.I. Reliability of Electromechanical Systems and Electrical Equipment: Training; Kuzbass State Technical University: Kemerovo, Russia, 2005. [Google Scholar]
  27. Varnavskiy, K.; Chen, Q.; Nepsha, F. Structure orderliness assessment of grid development to improve the reliability of coal mine external electrical power supply. Electr. Power Syst. Res. 2020, 183, 106283. [Google Scholar] [CrossRef]
  28. Heylen, E.; Deconinck, G.; Van Hertem, D. Review and classification of reliability indicators for power systems with a high share of renewable energy sources. Renew. Sustain. Energy Rev. 2018, 97, 554–568. [Google Scholar] [CrossRef]
  29. Ndawula, M.B.; Hernando-Gil, I.; Li, R.; Gu, C.; De Paola, A. Model order reduction for reliability assessment of flexible power networks. Int. J. Electr. Power Energy Syst. 2020, 127, 106623. [Google Scholar] [CrossRef]
  30. Chae, Y.H.; Kim, S.G.; Seong, P.H. Reliability of the system with loops: Factor graph based approach. Reliab. Eng. Syst. Saf. 2020, 208, 107407. [Google Scholar] [CrossRef]
  31. He, R.; Chen, G.; Shen, X.; Jiang, S. Reliability assessment of repairable closed-loop process systems under uncertainties. ISA Trans. 2020, 104, 222–232. [Google Scholar] [CrossRef]
  32. Turner, W.P.; Seader, J.H.; Brill, K.G. Industry Standard Tier Classifications Define Site Infrastructure Performance; The Uptime Institute: New York, NY, USA, 2005. [Google Scholar]
  33. Afsharnia, F. Failure Rate Analysis. In Failure Analysis and Prevention; IntechOpen: London, UK, 2017; p. 216. [Google Scholar]
  34. Matveev, V.N. Informational assessment of a system. Bull. KuzSTU 2001, 2, 63–68. [Google Scholar]
  35. Matveev, V.N. Mine Switching Devices of a New Safety Level; Kuzbass State Technical University: Kemerovo, Russia, 2001. [Google Scholar]
  36. Varnavskiy, K.; Matveev, V.N. Analysis of ways to improve the efficiency of operation of power supply systems of industrial enterprises. Ind. Power Eng. 2016, 4, 14–18. [Google Scholar]
  37. Shannon, C.E.; Weaver, W. The Mathematical Theory of Communication, 16th ed.; The University of Illinois Press: Urbana, IL, USA, 1971. [Google Scholar]
  38. Matveev, V.N.; Mikryukov, A.; Romanenko, T.Y. Assessment of the safety and efficiency of power supply of the ‘Kedrovskiy’ open pit coal mine. Bull. KuzSTU 2005, 2, 43–46. [Google Scholar]
  39. Handbook of Reliability Prediction Procedures for Mechanical Equipment; Naval Surface Warfare Center Carderock Division: West Bethesda, MD, USA, 2011; Available online: http://everyspec.com/USN/NSWC/download.php?spec=NSWC-10_RELIABILITY_HDBK_JAN2010.045818.pdf (accessed on 26 January 2023).
  40. Electronic Parts Reliability Data—EPRD-2014. Quanterion Solutions Incorporated. 2014. Available online: https://www.quanterion.com/product/publications/electronic-parts-reliability-data-eprd-2014/ (accessed on 19 January 2023).
  41. Nonelectronic Parts Reliability Data Publication (NPRD-2016). Quanterion Solutions Incorporated. 2016. Available online: https://www.quanterion.com/product/publications/nonelectronic-parts-reliability-data-publication-nprd-2016/ (accessed on 19 January 2023).
  42. Mrowca, B. Emergency Diesel Generator Failure Review 1999–2001; Information Systems Laboratories, Inc.: Rockville Pike, MD, USA, 2011. [Google Scholar]
  43. International Energy Agency. Generic Component Reliability Data for Research Reactor PSA, IAEA, IAEA-TECDOC-930. 1997. Available online: https://www.iaea.org/publications/5582/generic-component-reliability-data-for-research-reactor-psa (accessed on 19 January 2023).
  44. ISO 281:2007; Rolling Bearings—Dynamic Load Ratings and Rating Life. ISO: Geneva, Switzerland, 2007. Available online: https://www.iso.org/standard/38102.html (accessed on 19 January 2023).
  45. Jardine, A.K.S.; Tsang, A.H.C. Maintenance, Replacement, and Reliability: Theory and Applications, 2nd ed.; CRC Press: Boca Raton, FL, USA, 2013. [Google Scholar]
  46. Kececioglu, D. Maintainability, Availability and Operational Readiness Engineering Handbook; Prentice Hall: Upper Saddle River, NJ, USA, 1995. [Google Scholar]
  47. Wang, W.; Dell’Anno, M.; Zeh, C. Approximation of Mean Time Between Failures with Maintenance. Int. J. Perform. Eng. 2007, 3, 382. [Google Scholar] [CrossRef]
Figure 1. The generalized structure of the IEM.
Energies 16 01419 g001
Figure 2. The data center PSS.
Energies 16 01419 g002
Figure 3. Configuration of the Single System.
Energies 16 01419 g003
Figure 4. Configuration of Parallel System.
Energies 16 01419 g004
Figure 5. Configuration of Isolated Redundant.
Energies 16 01419 g005
Figure 6. An example of an RBD diagram for a PS configuration.
Energies 16 01419 g006
Figure 7. Configuration of Single System: (a) Oriented graph; (b) Adjacency matrix.
Energies 16 01419 g007
Figure 8. Configuration of Parallel System: (a) Oriented graph; (b) Adjacency matrix.
Energies 16 01419 g008
Figure 9. Configuration of Isolated Redundant: (a) Oriented graph; (b) Adjacency matrix.
Energies 16 01419 g009
Figure 10. Comparison of R and MTBF for the configuration of special PSSs.
Energies 16 01419 g010
Table 1. Reliability indicators for configurations of continuous electrical power supply systems with dynamic UPS.
Configurationλ, 1/Hours A M T B F ,   H o u r s M T B F ,   Y e a r s
Single system3.10 × 10−60.999949306,60035
Parallel system (2/3)2.59 × 10−70.9999973,810,600435
Cross link (3/4)2.61 × 10−70.9999973,793,080433
Isolated Parallel (2/3)2.55 × 10−70.9999973,898,200445
Isolated Redundant (2/3)2.25 × 10−60.999949420,48048
Distributed Redundant (2/3)4.09 × 10−91.000000243,659,40027,815
Table 2. Determination of operational information amount in the Parallel System.
PathPath’s
Edges
QliвQlmIl, Bit
End-to-end path I1–23Q1 = (3 + 4 + 6)/3 = 42
2–33
3–63 × 2 *
End-to-end path II1–23Q2 = (3 + 4 + 6)/3 = 42
2–43
4–63 × 2
End-to-end path III1–23Q3 = (3 + 4 + 6)/3 = 42
2–53
5–63 × 2
End-to-end path IV3–63 × 2Q4 = 6/1 = 62.585
End-to-end path V4–63 × 2Q5 = 6/1 = 62.585
End-to-end path VI5–63 × 2Q6 = 6/1 = 62.585
End-to-end path VII1–23Q7 = (3 + 3)/2 = 4.52.17
2–63
*—“2” means the “price” ci of edge: if edge stay after UPS unit it means that power is protected, if before it is not protected and ci = “1”.
Table 3. Determination of informational indicators in the Parallel System.
Indicator Paths
I–IIIIV–VIVII
Il, bit22.5852.17
pl0.99948640.99958380.9998790
fl, s−1202020
Dl, bit/s39.97951.67843.393
G = 0.819; D = 318.365 bit/s; R = 260.877 bit/s
Table 4. Information indicators of PSS’s configuration.
ConfigurationIndicatorsMTBF
(Years)
GD, Bit/sR, Bit/s
Single System (SS)0.715186.682133.40535
Parallel System (PS)0.464263.283162.922433
Cross Link (CL)0.4641128.447786.134445
Isolated Parallel (IP)0.792965.0081146.22948
Isolated Redundant (IR)0.723526.542444.44227,815
Distributed Redundant (DR)0.6861775.7671740.166435
Disclaimer/Publisher’s Note: The statements, opinions and data contained in all publications are solely those of the individual author(s) and contributor(s) and not of MDPI and/or the editor(s). MDPI and/or the editor(s) disclaim responsibility for any injury to people or property resulting from any ideas, methods, instructions or products referred to in the content.

