
The Use of a Regulating Transformer for Shaping Power Flow in the Power System

Abstract
:1. Introduction
1.1. Planned and Unplanned Power Flows
1.2. Organization of the Research Problem
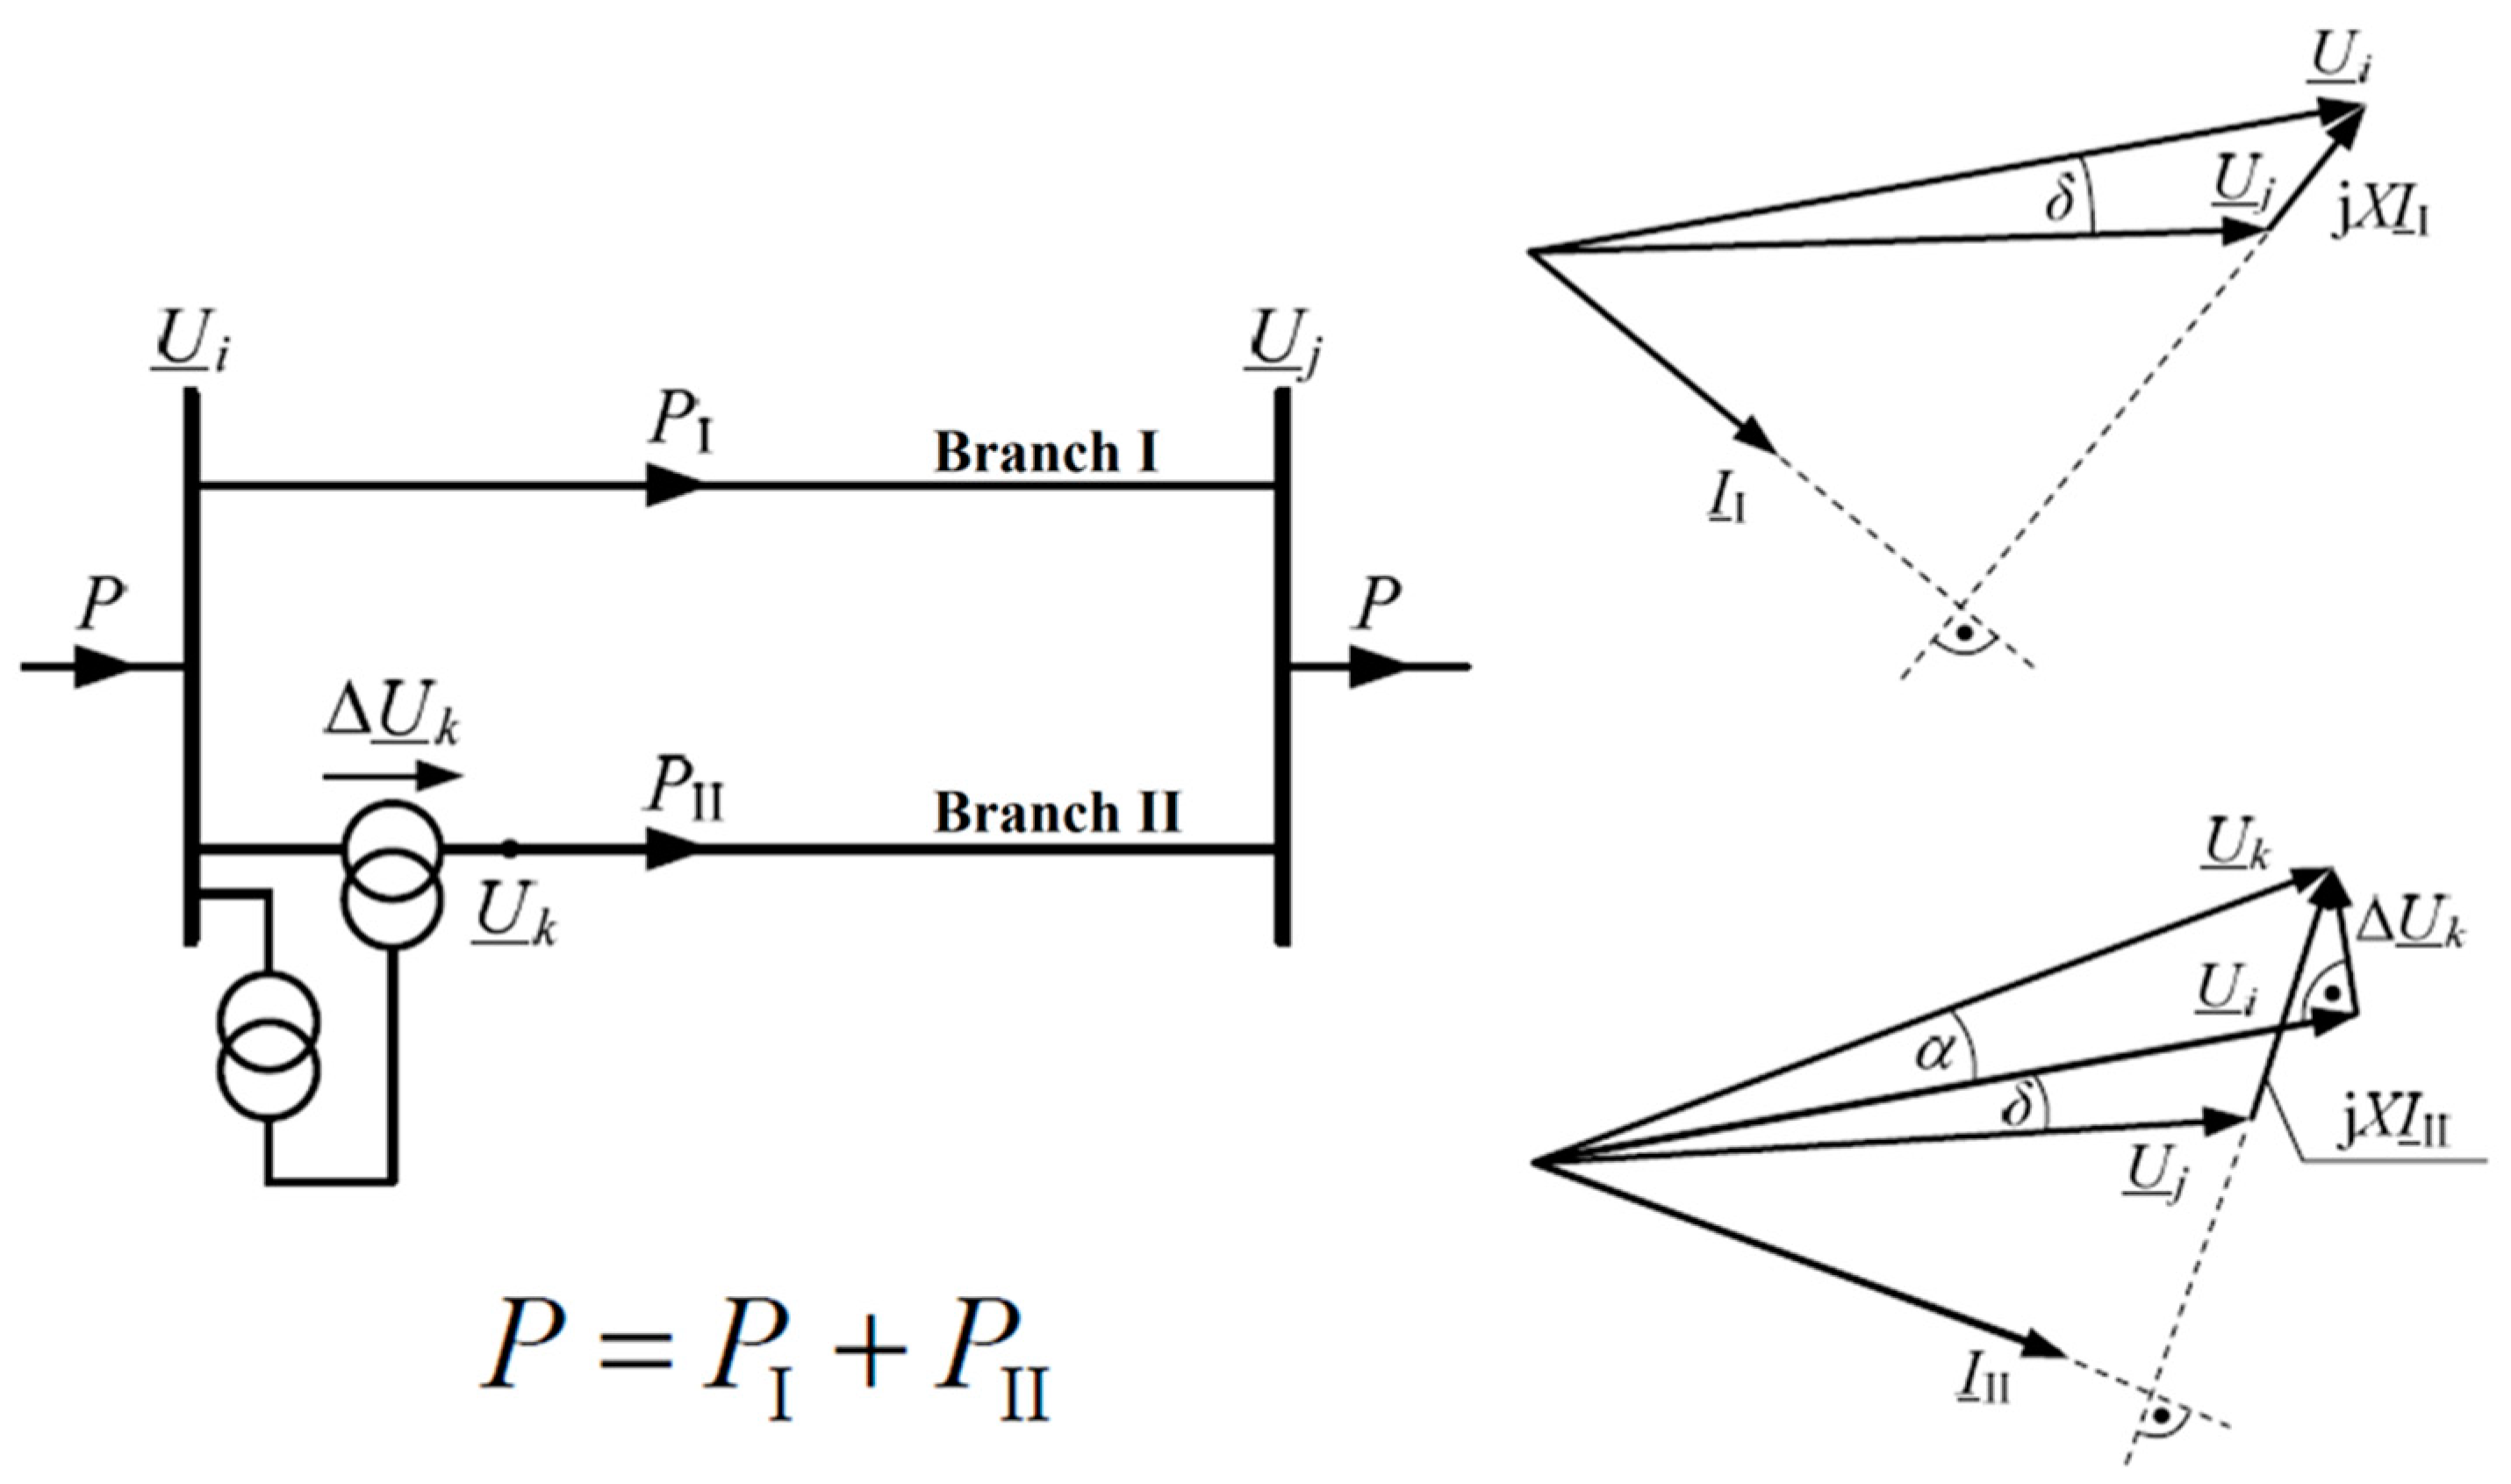
2. Power Flow Regulation
2.1. Parameters of Power Flow Change
- —the active power at the end of the line ij;
- —the phase voltage modules at the beginning (i) and at the end (j) of the line;
- —the load angle (difference of the bus voltage arguments at the beginning and end of the line, = );
- —the line reactance ij.
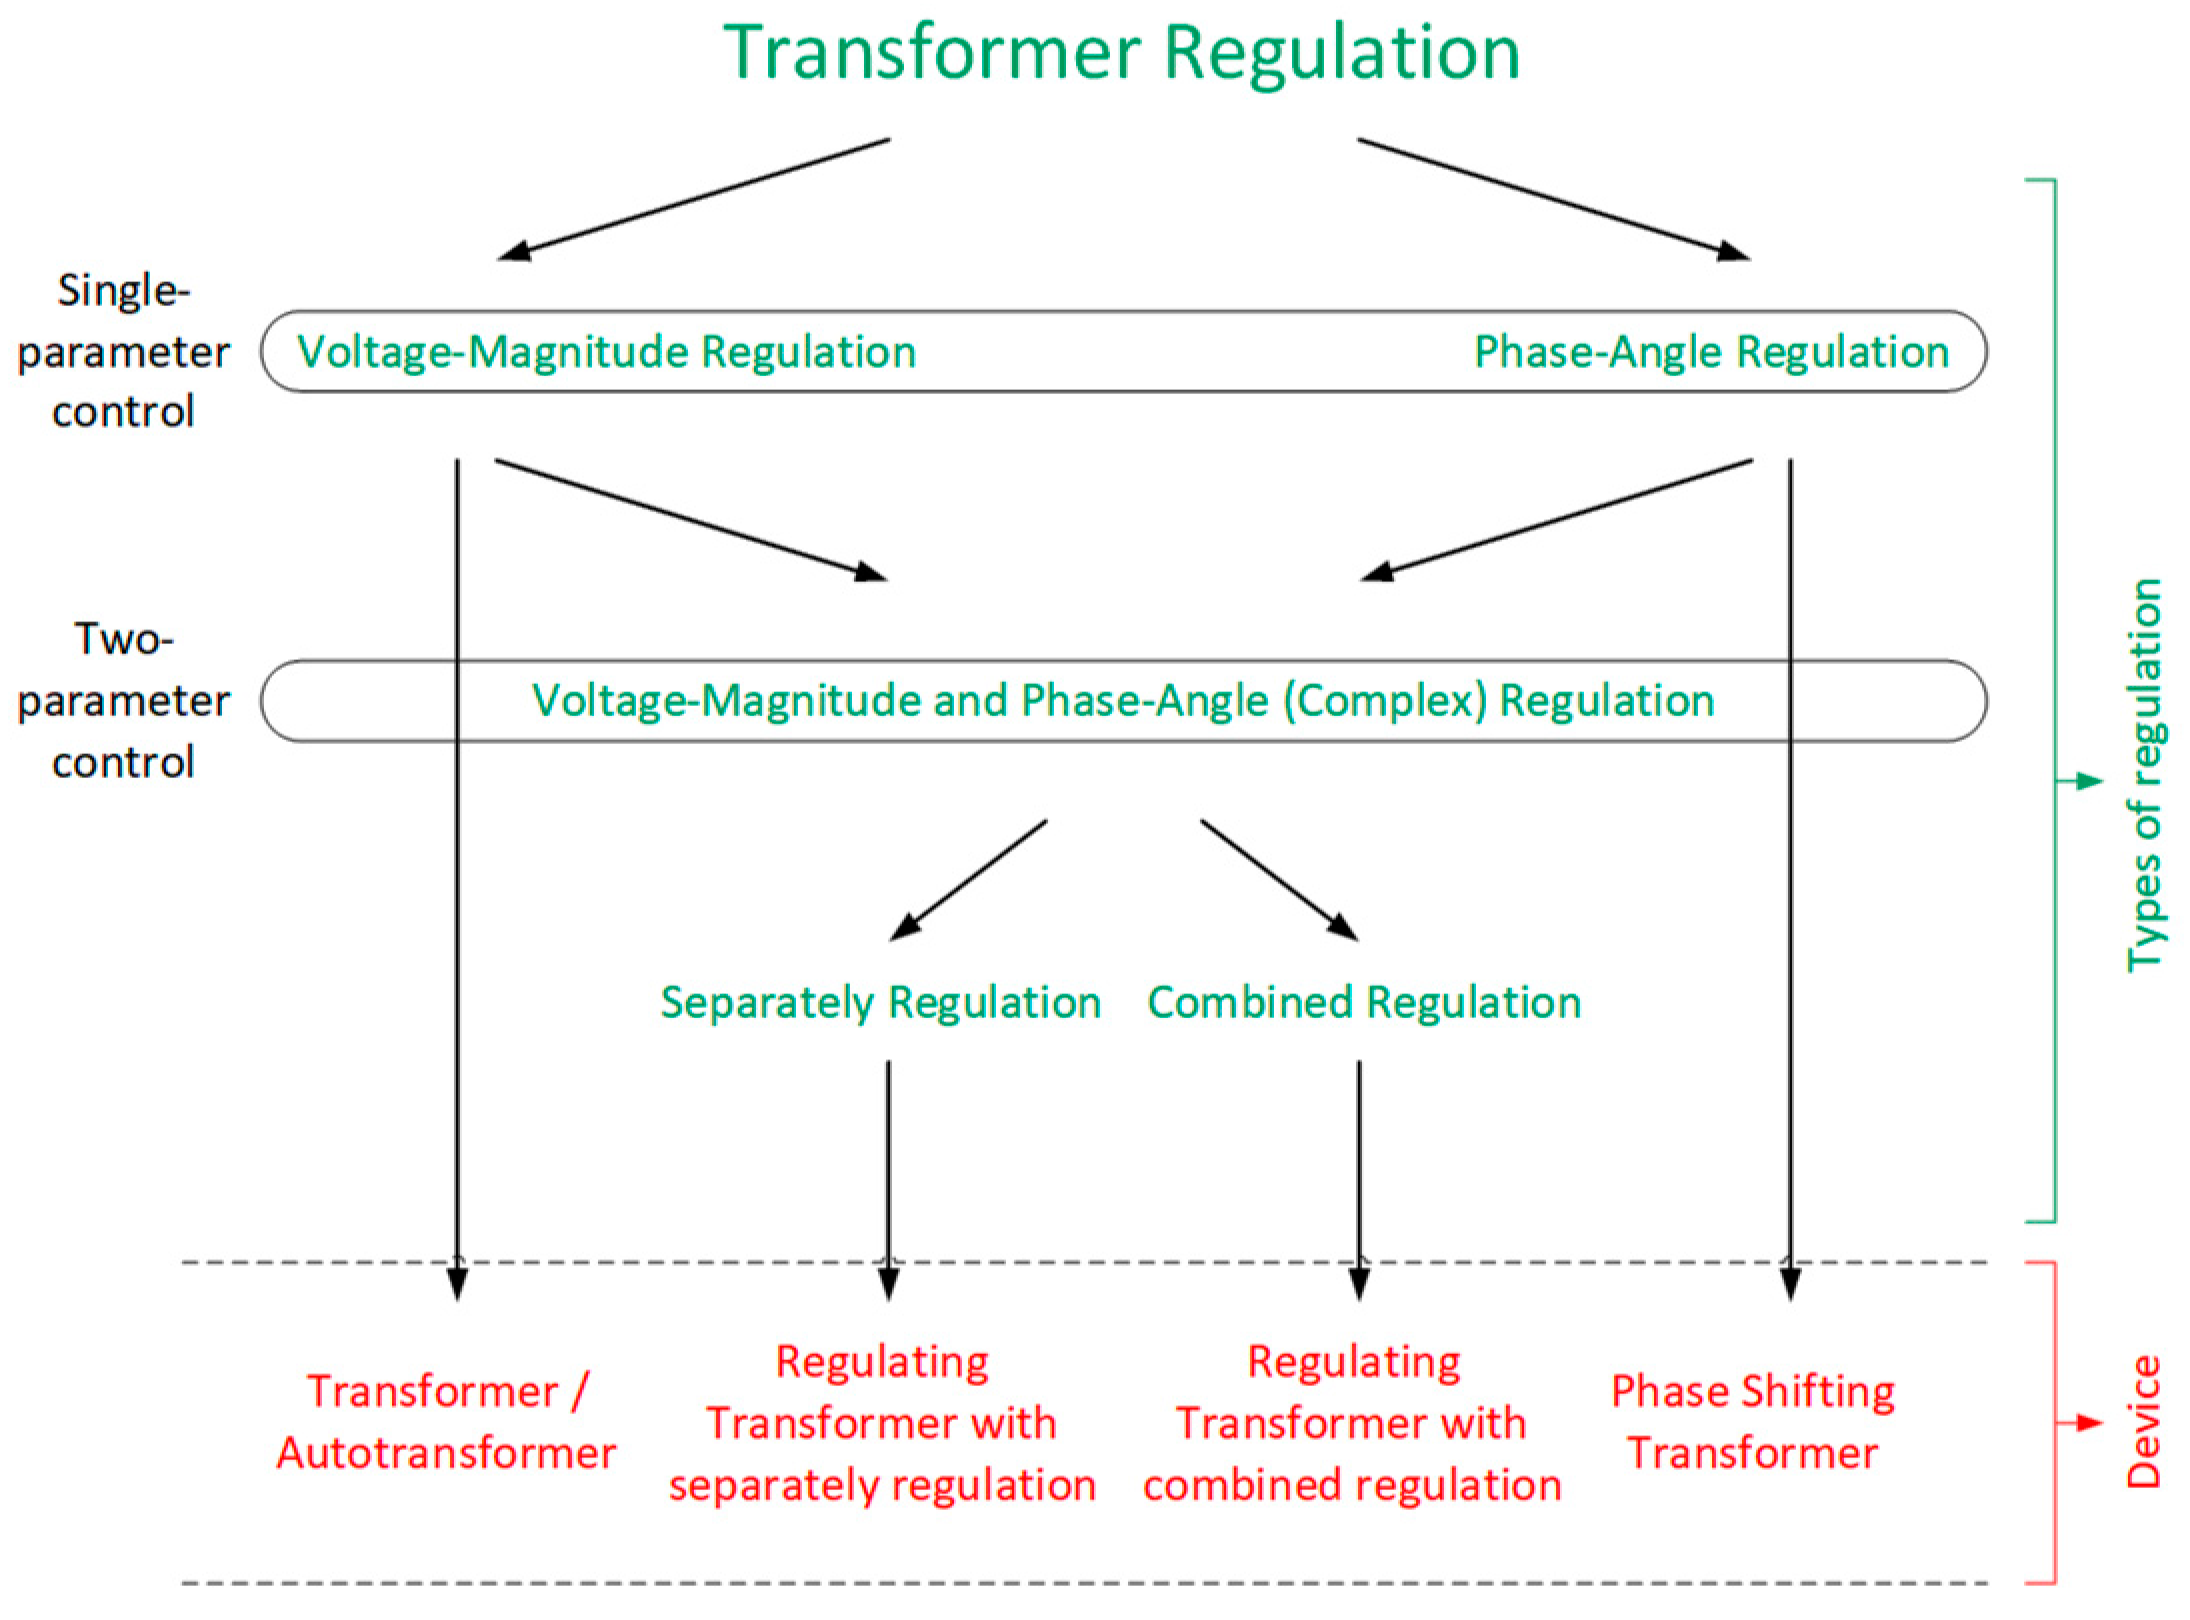
2.2. Transformer Regulation: Voltage Magnitude and Phase Angle
- voltage magnitude regulation (in-phase transformers, autotransformers);
- phase angle regulation (phase-shifting transformers);
- voltage magnitude and phase angle regulation (complex regulation).
- separately—in the case of such solutions, voltage magnitude regulation is usually performed on the main unit (in-phase transformer or autotransformer) of the regulation transformer, while phase angle regulation is performed on the phase-shifting transformer; both types of regulation mentioned can be performed separately/independently (i.e., the regulation of a given voltage parameter–modulus or phase angle–does not change the second voltage parameter);
- combined (dependent voltage magnitude and phase angle regulation)–voltage magnitude and phase angle regulation are performed on the in-phase transformer with q connected phase-shifting transformer on the third winding; both types of regulation are performed interdependently (i.e., the regulation of one voltage parameter–modulus or phase angle–changes the other voltage parameter).
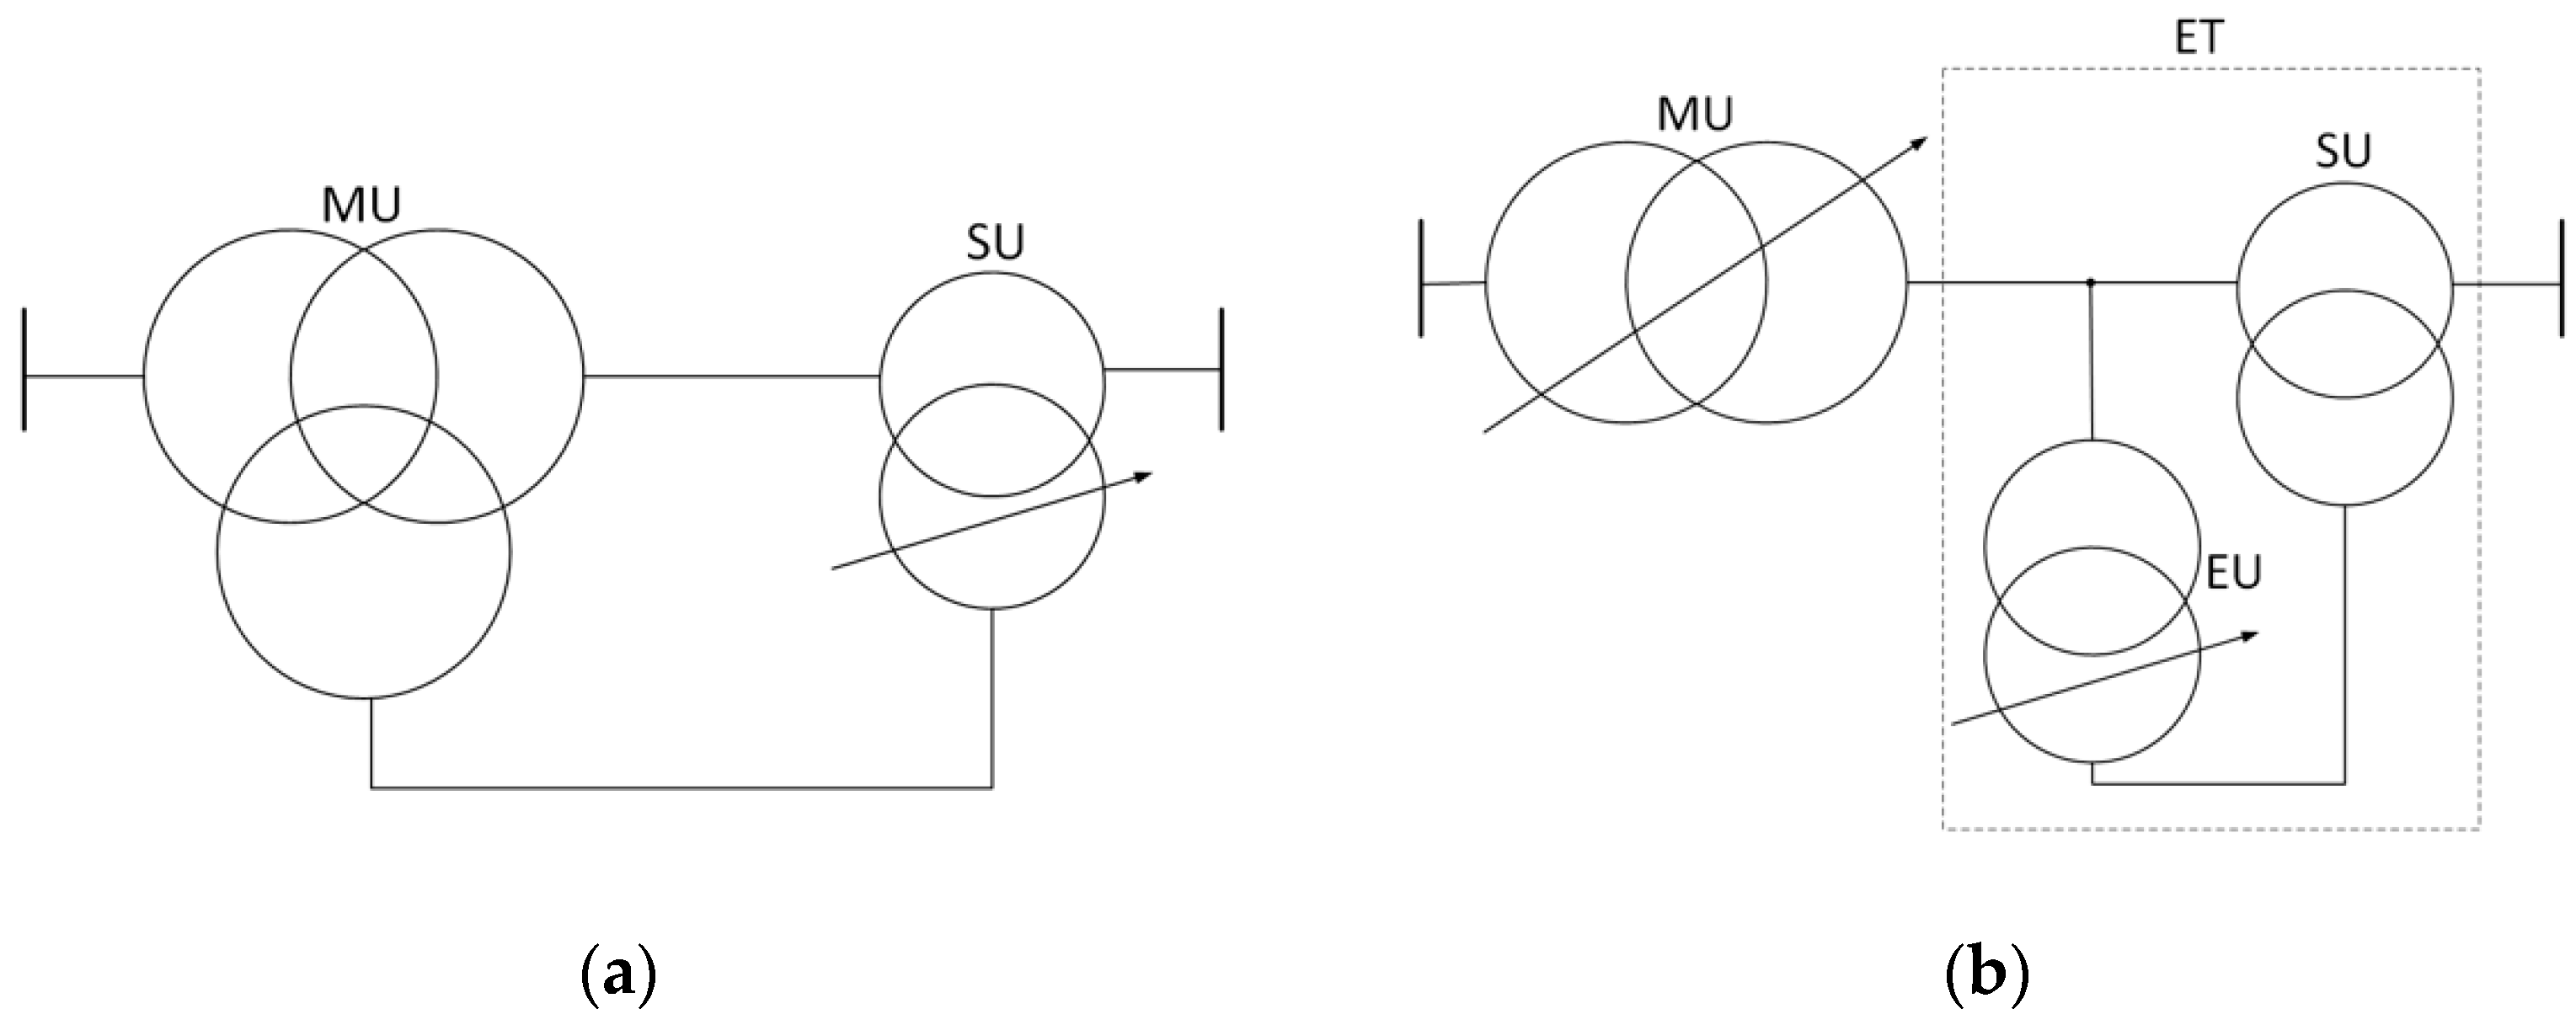
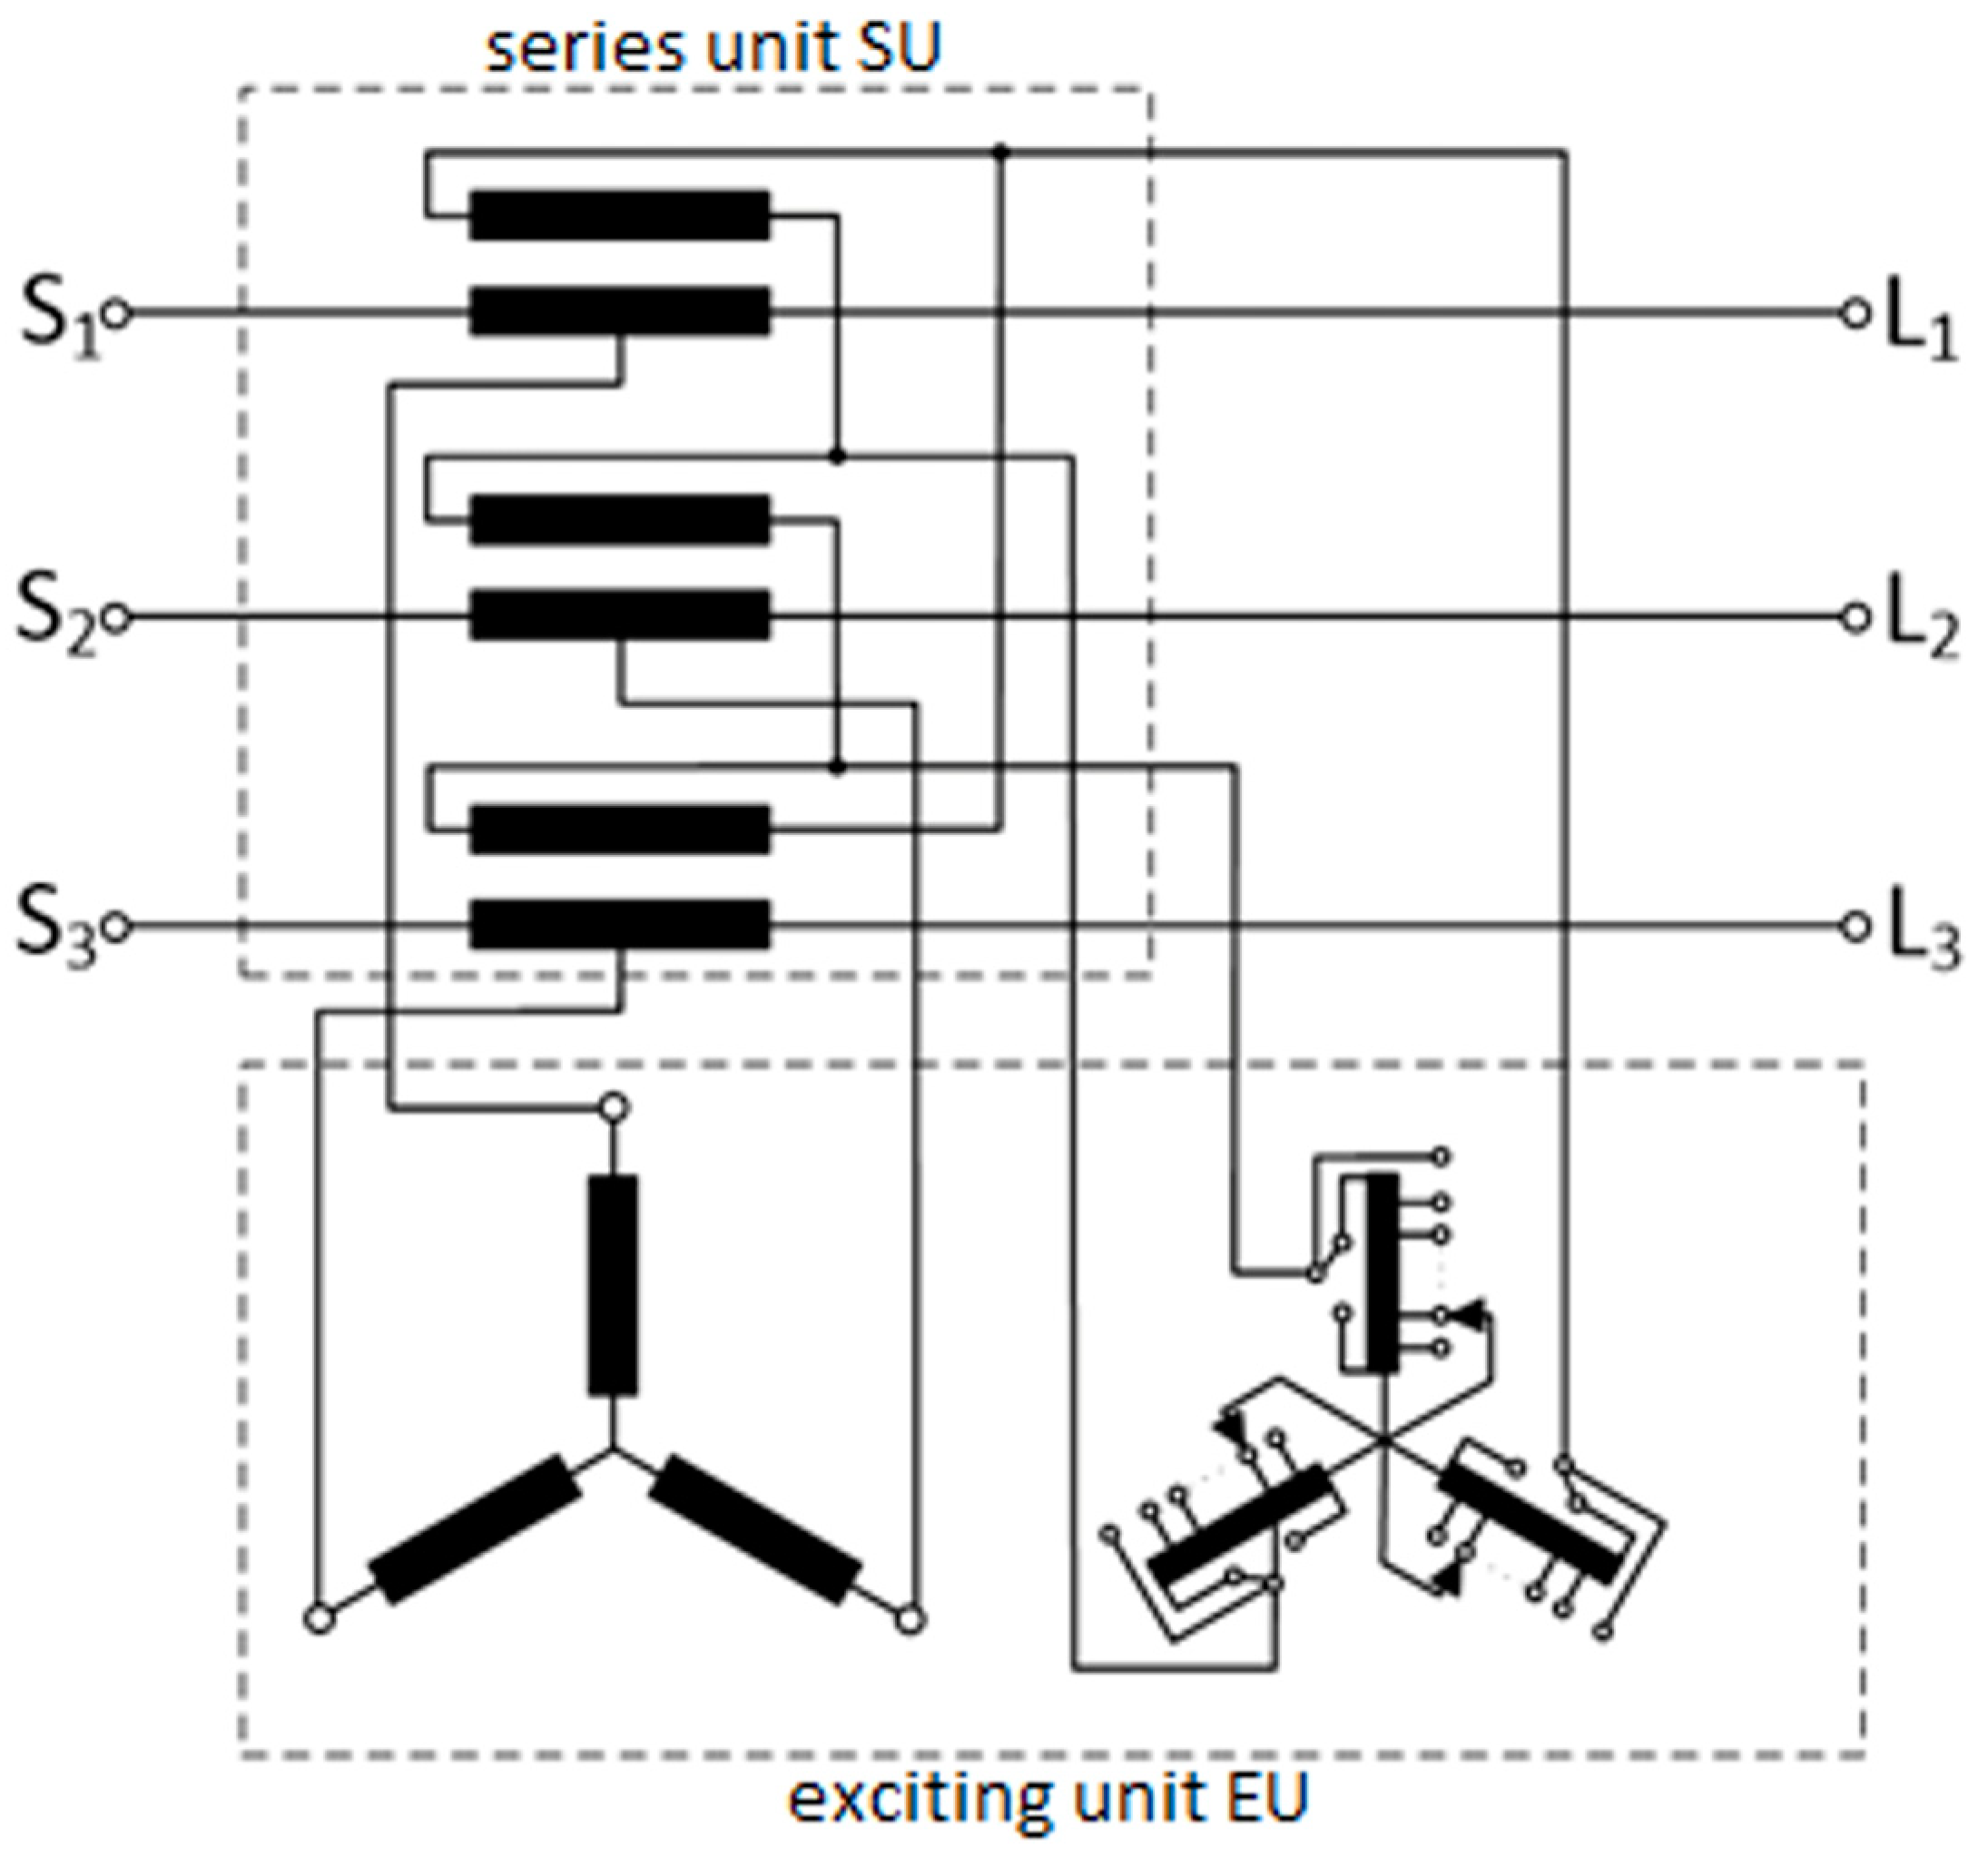
2.3. Regulating Transformer
3. The Effects of Regulation with the Use of Transformer Units
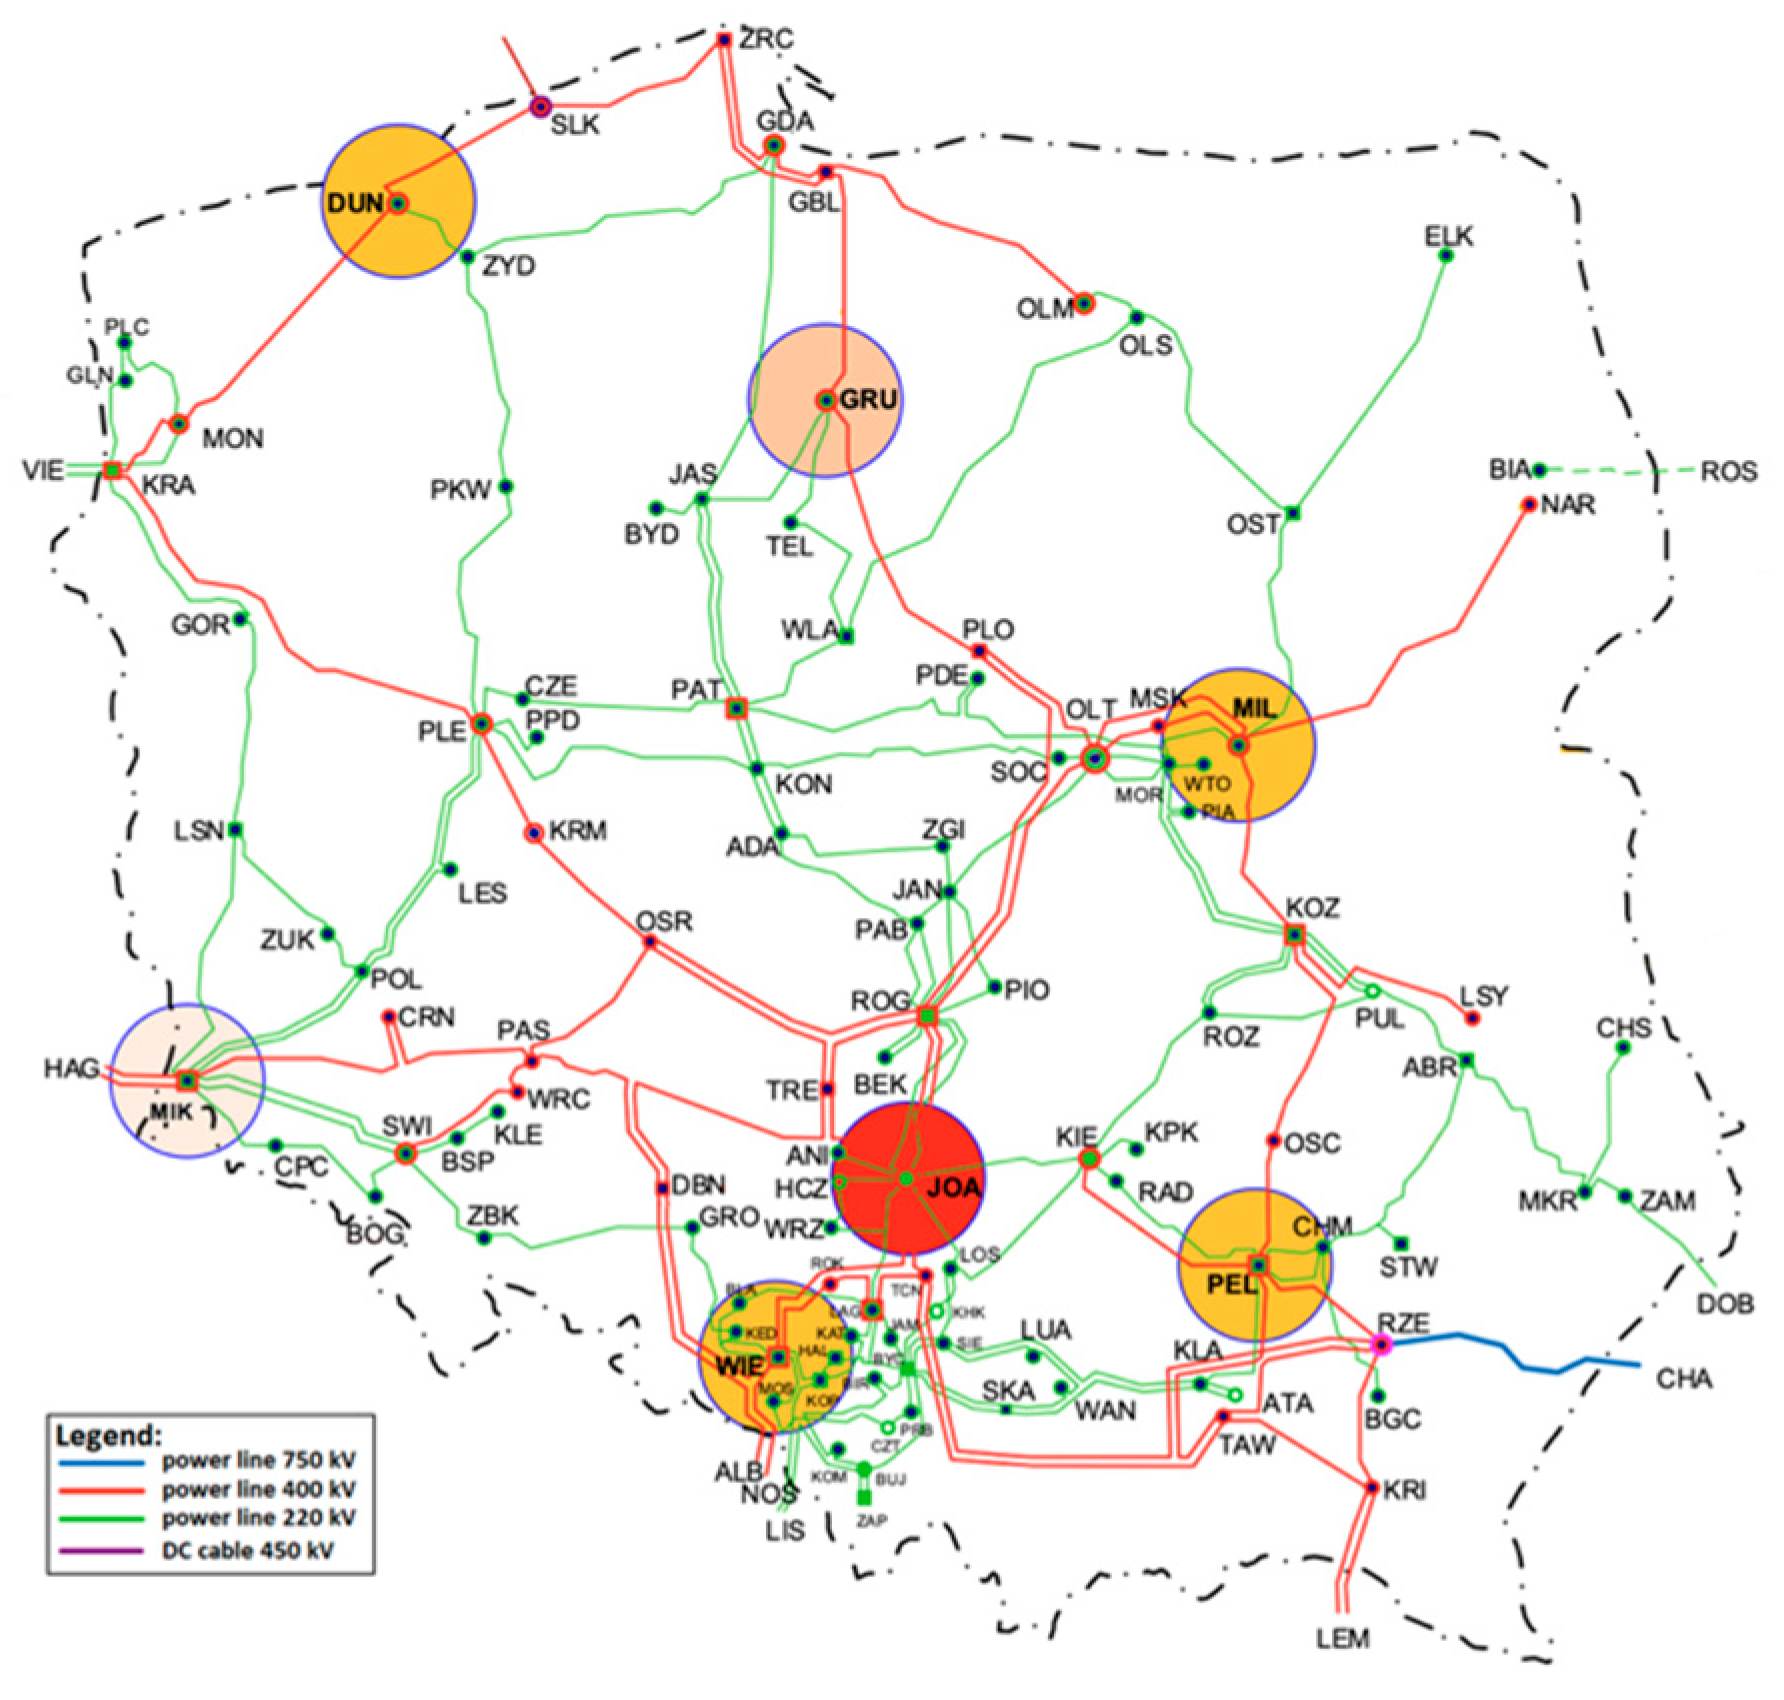
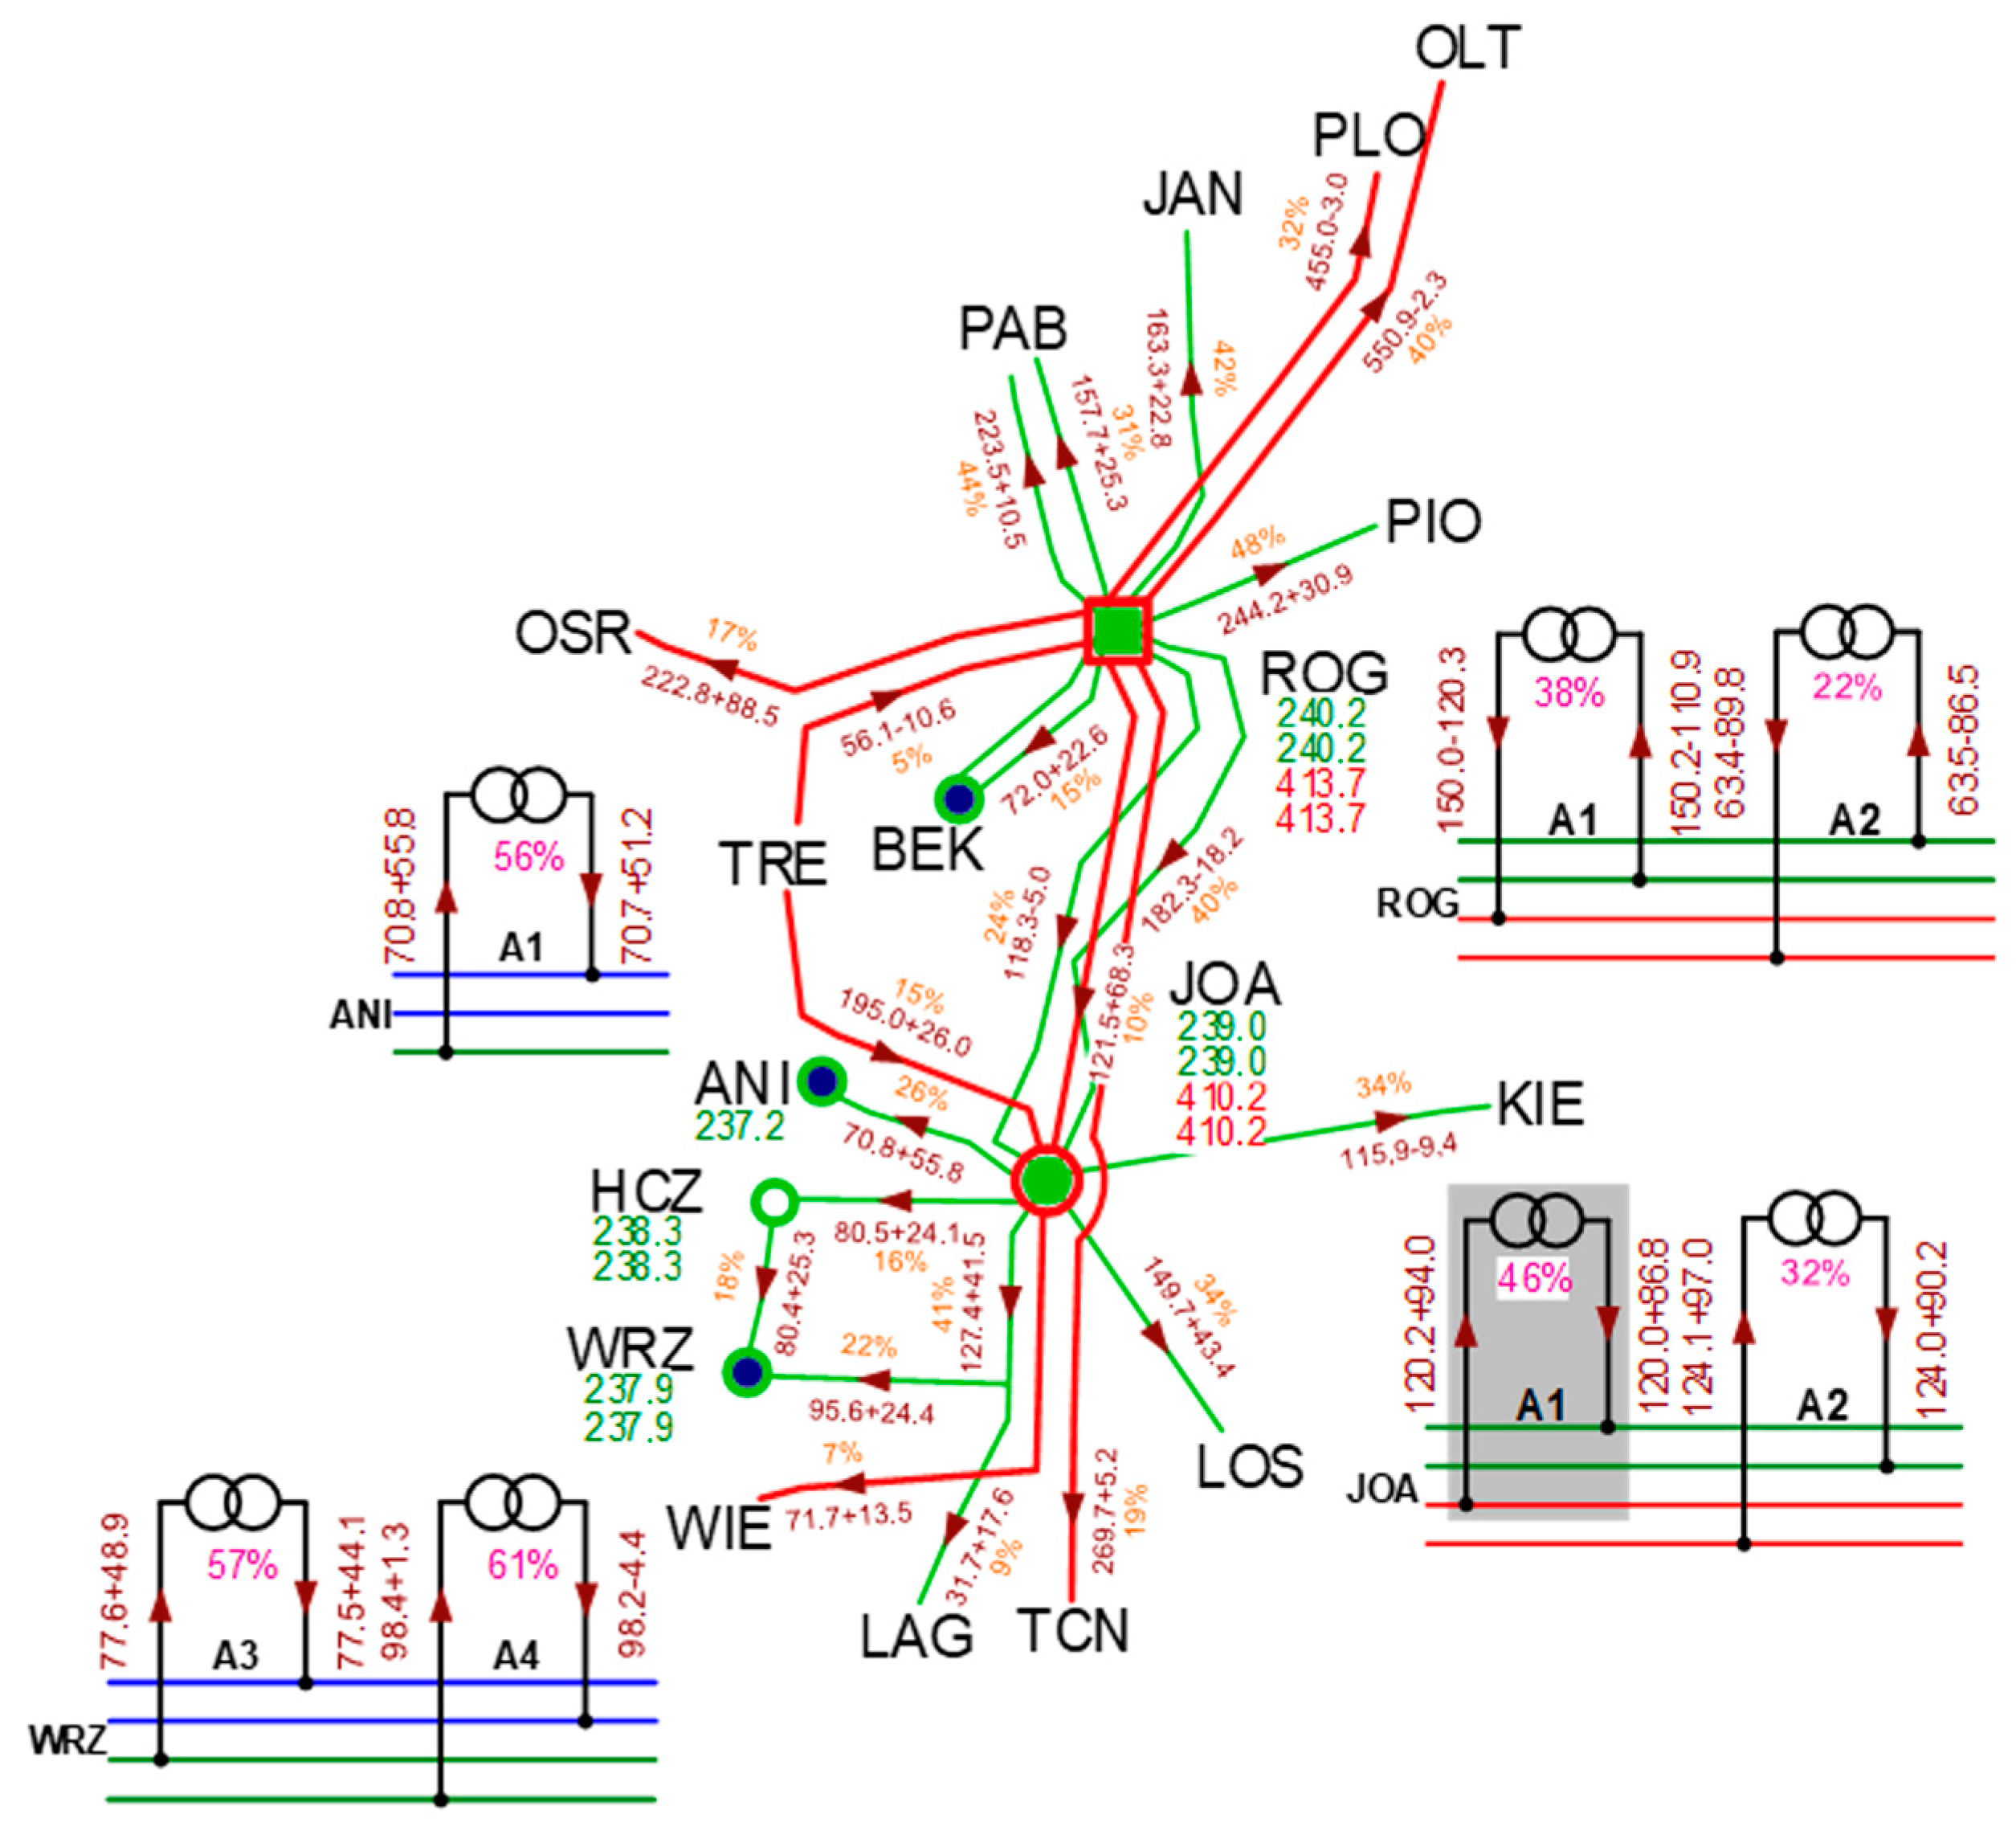
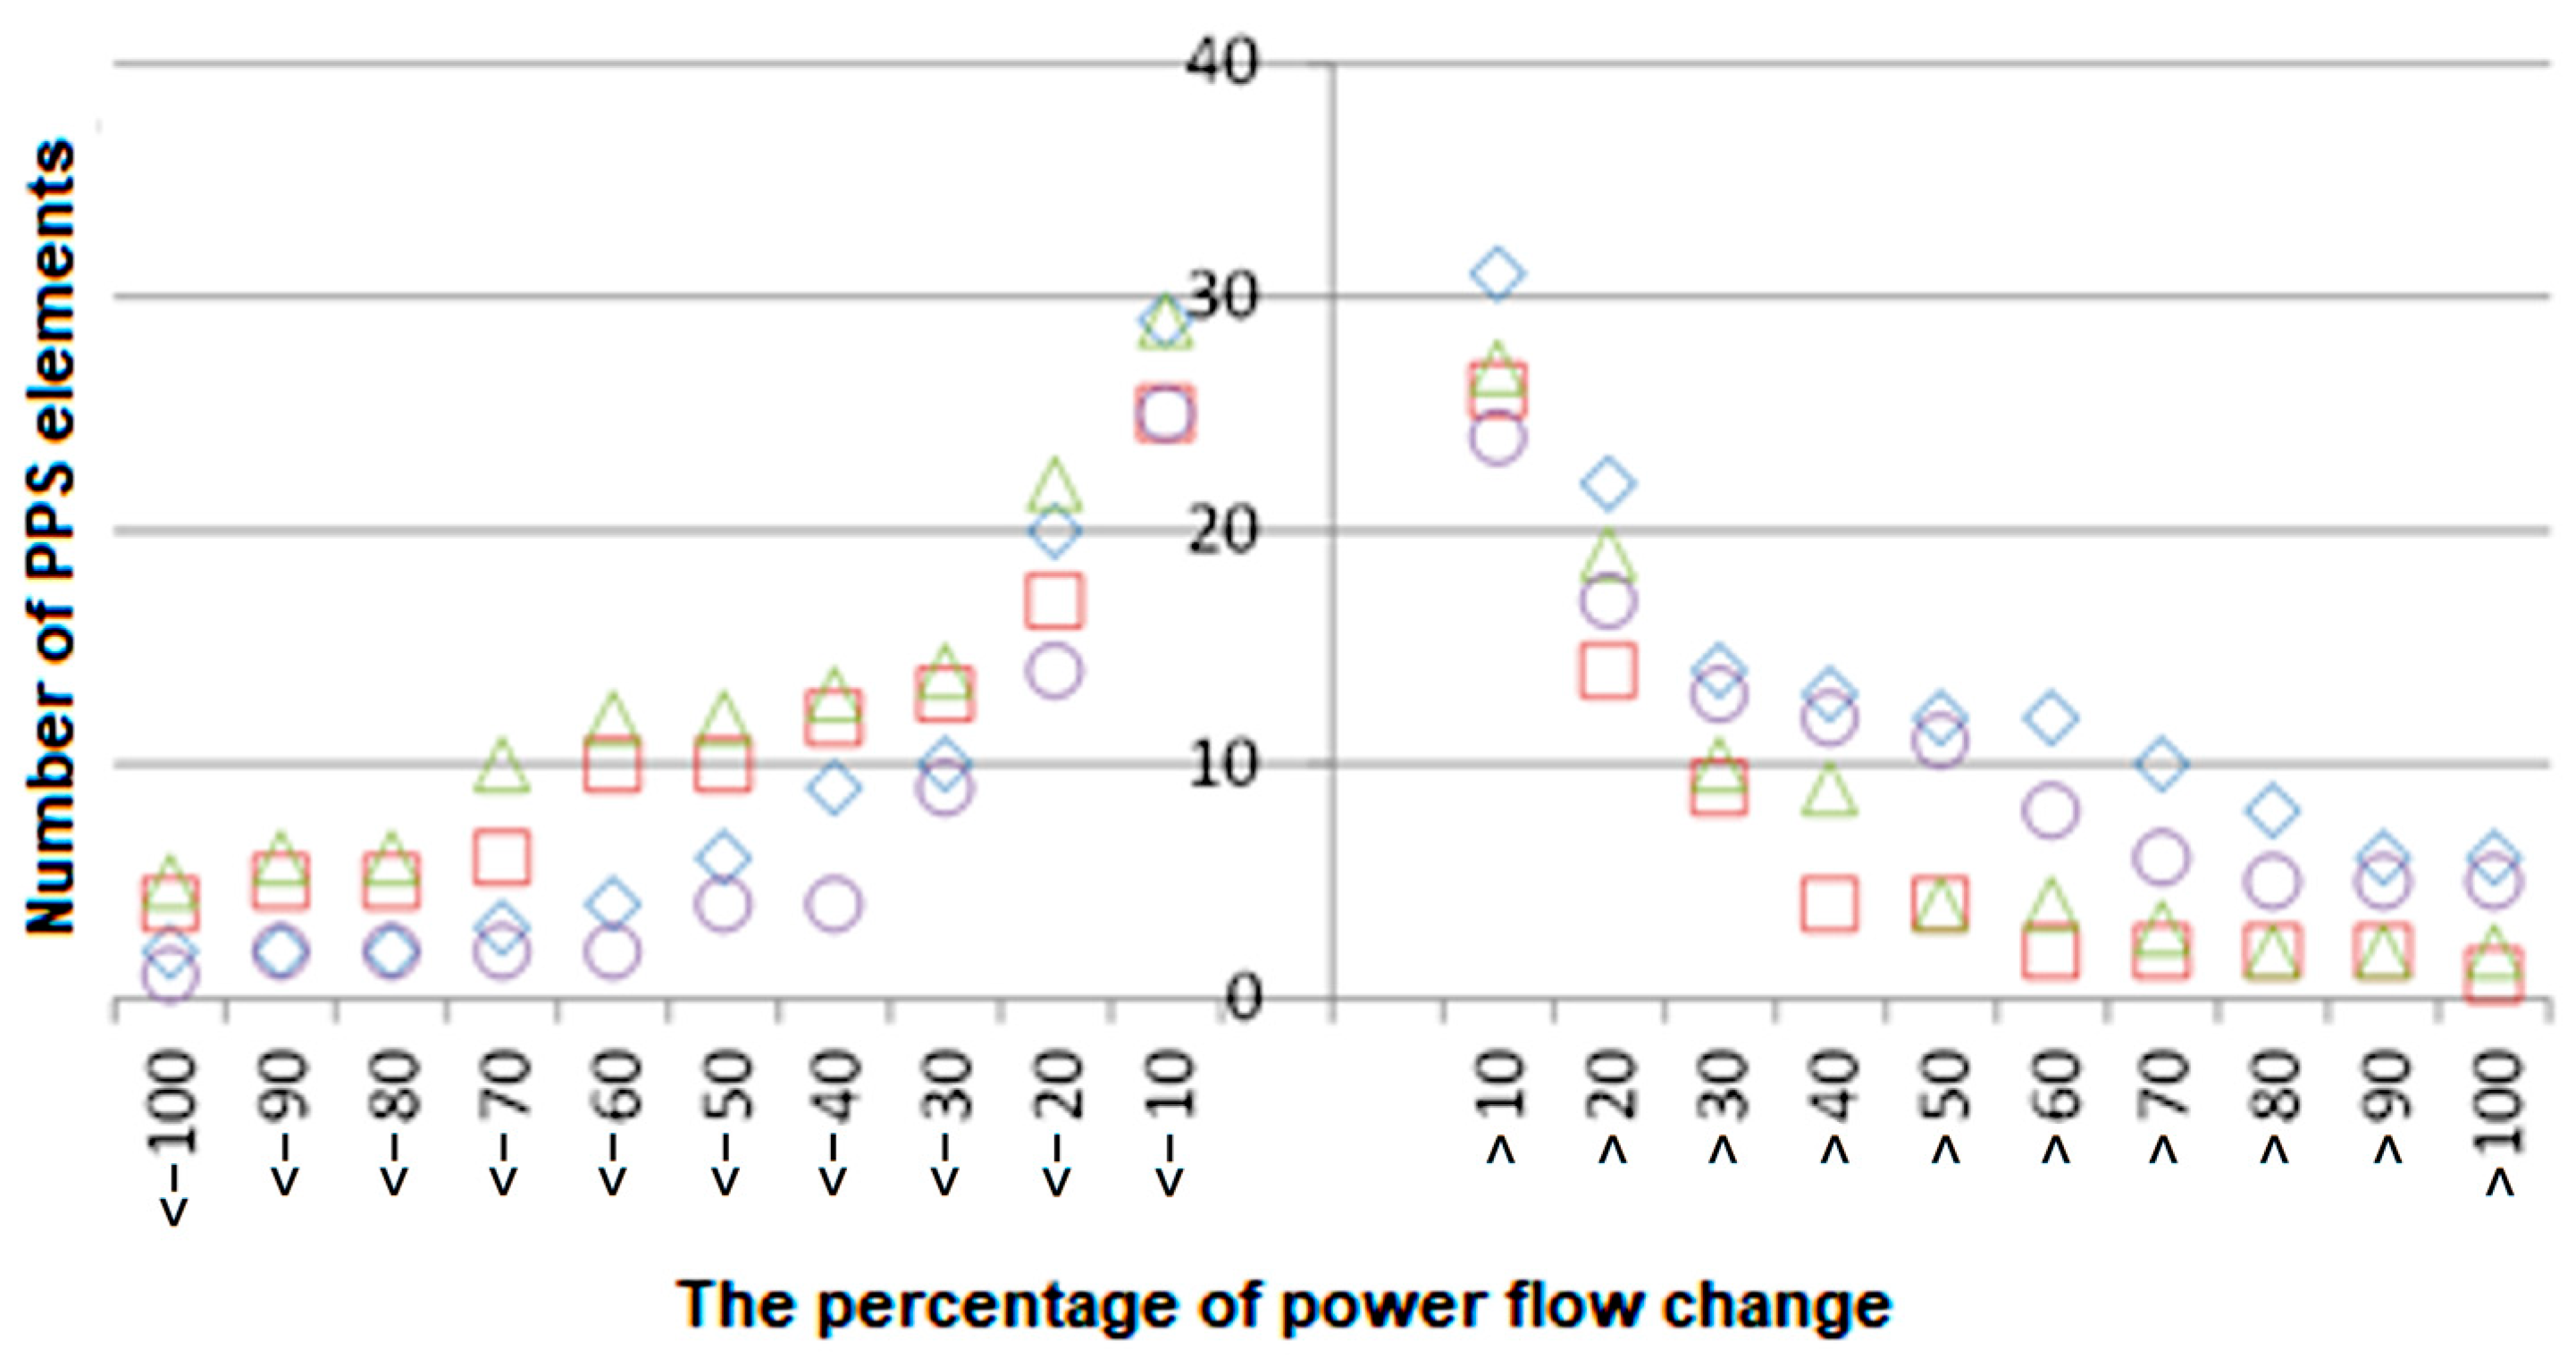
3.1. Analysis of the Possibility of Regulation in the Polish National Power System
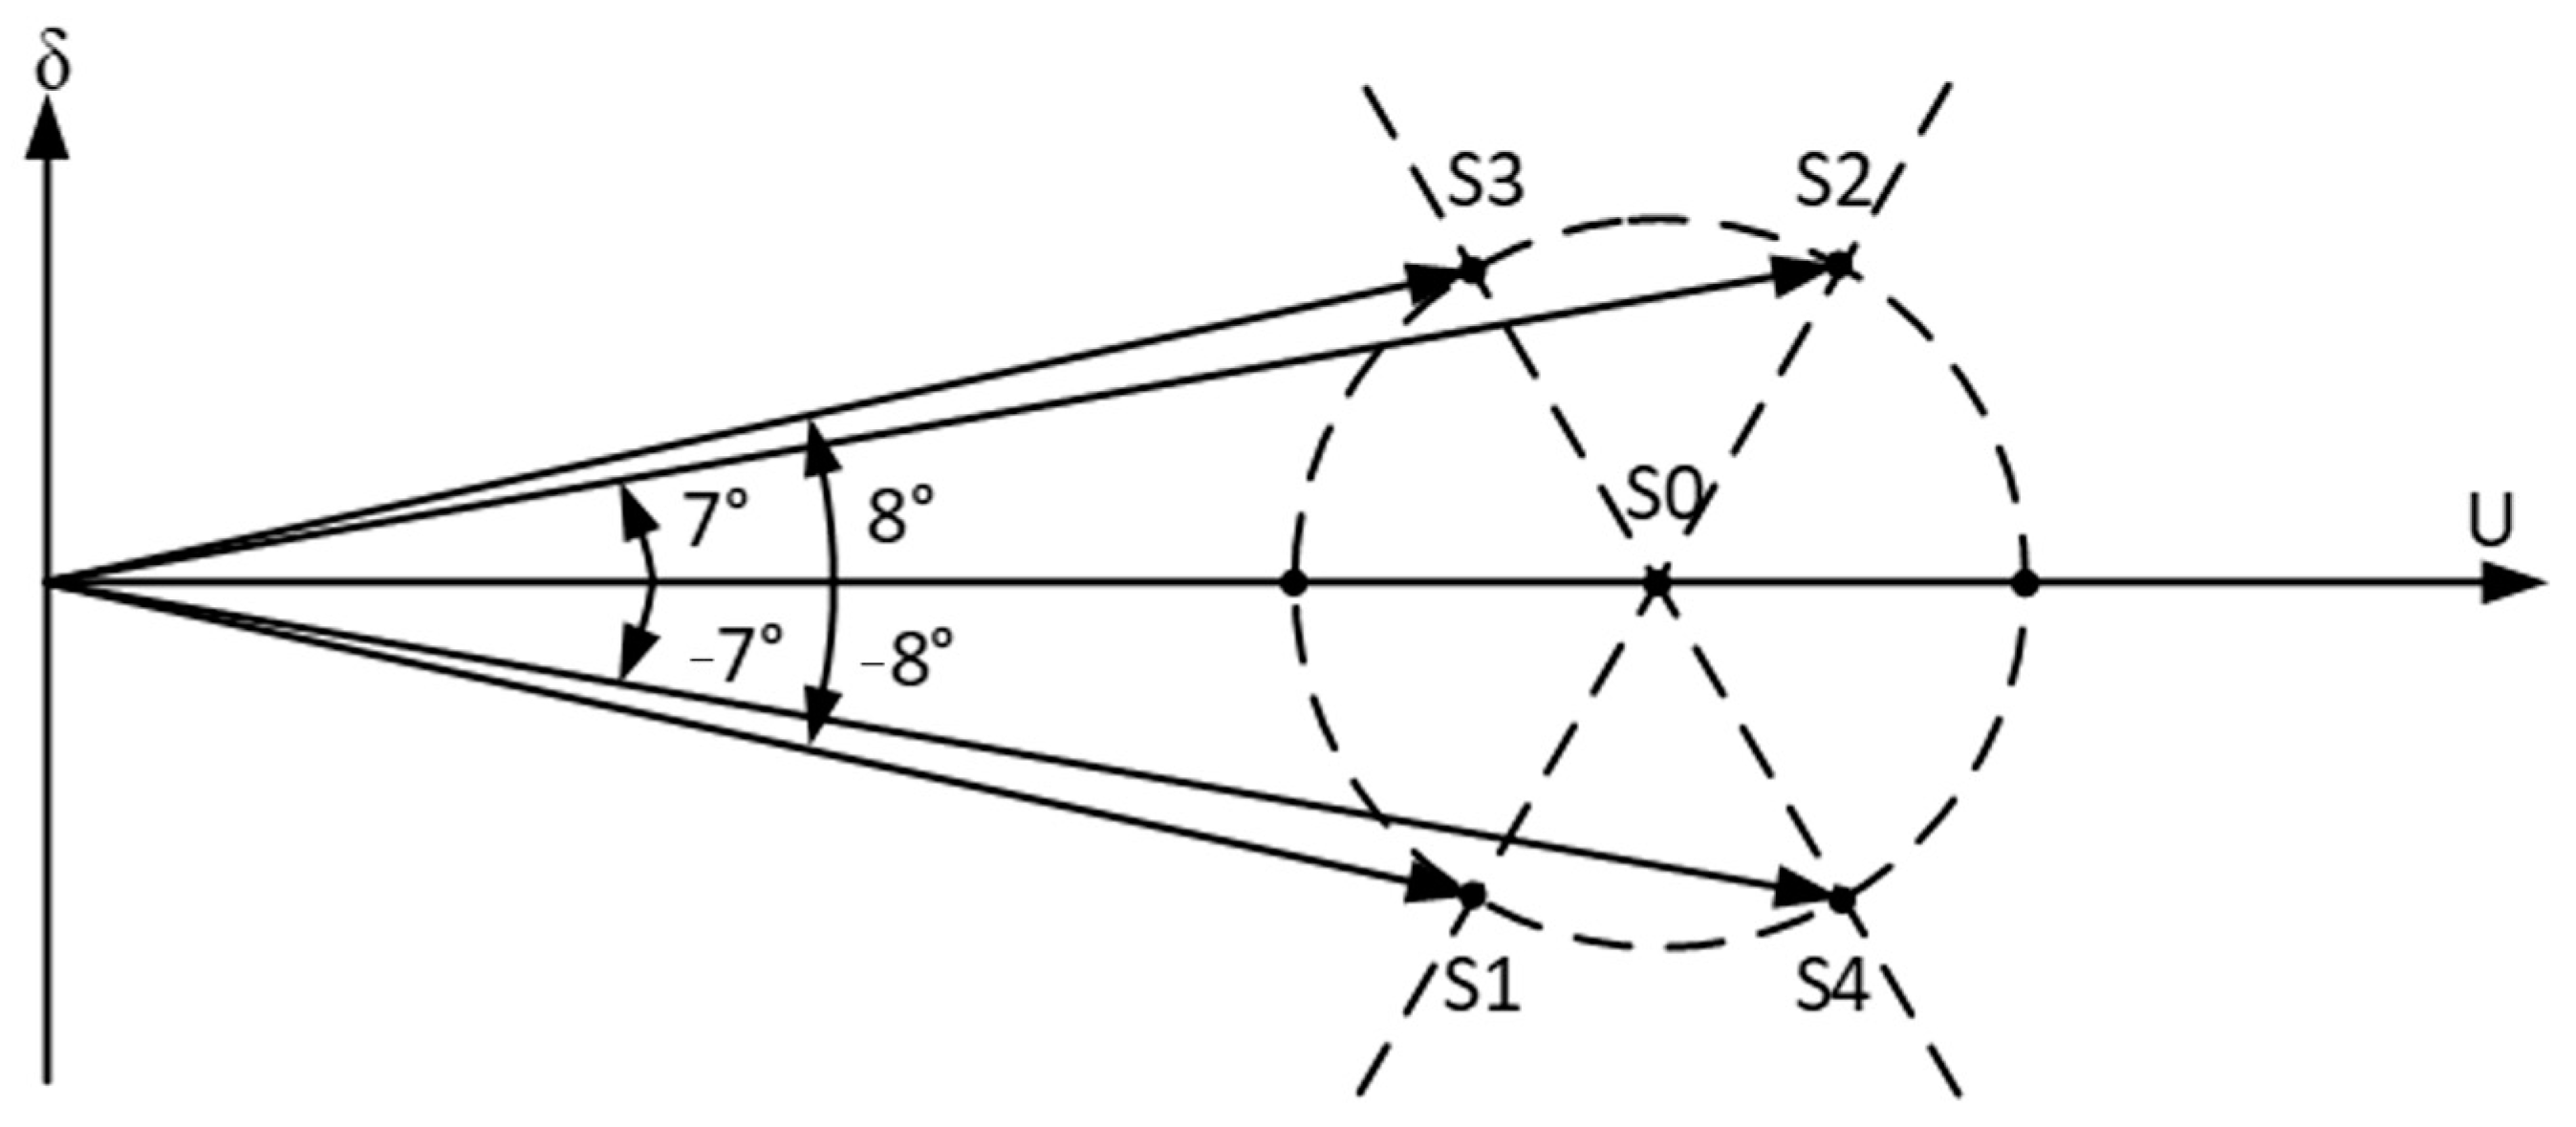
- scenario S1: regulation angle δ = −120°, tap 1;
- scenario S2: regulation angle δ = −120°, tap 19;
- scenario S3: regulation angle δ = 120°, tap 1;
- scenario S4: regulation angle δ = 120°, tap 19.
- —the active power flow through the transformer for the S0 scenario;
- —the active power flow through the transformer for the Sx scenario (x = 1…4);
- —the transformer load ratio for the S0 scenario;
- —the transformer load ratio for the Sx scenario (x = 1…4).
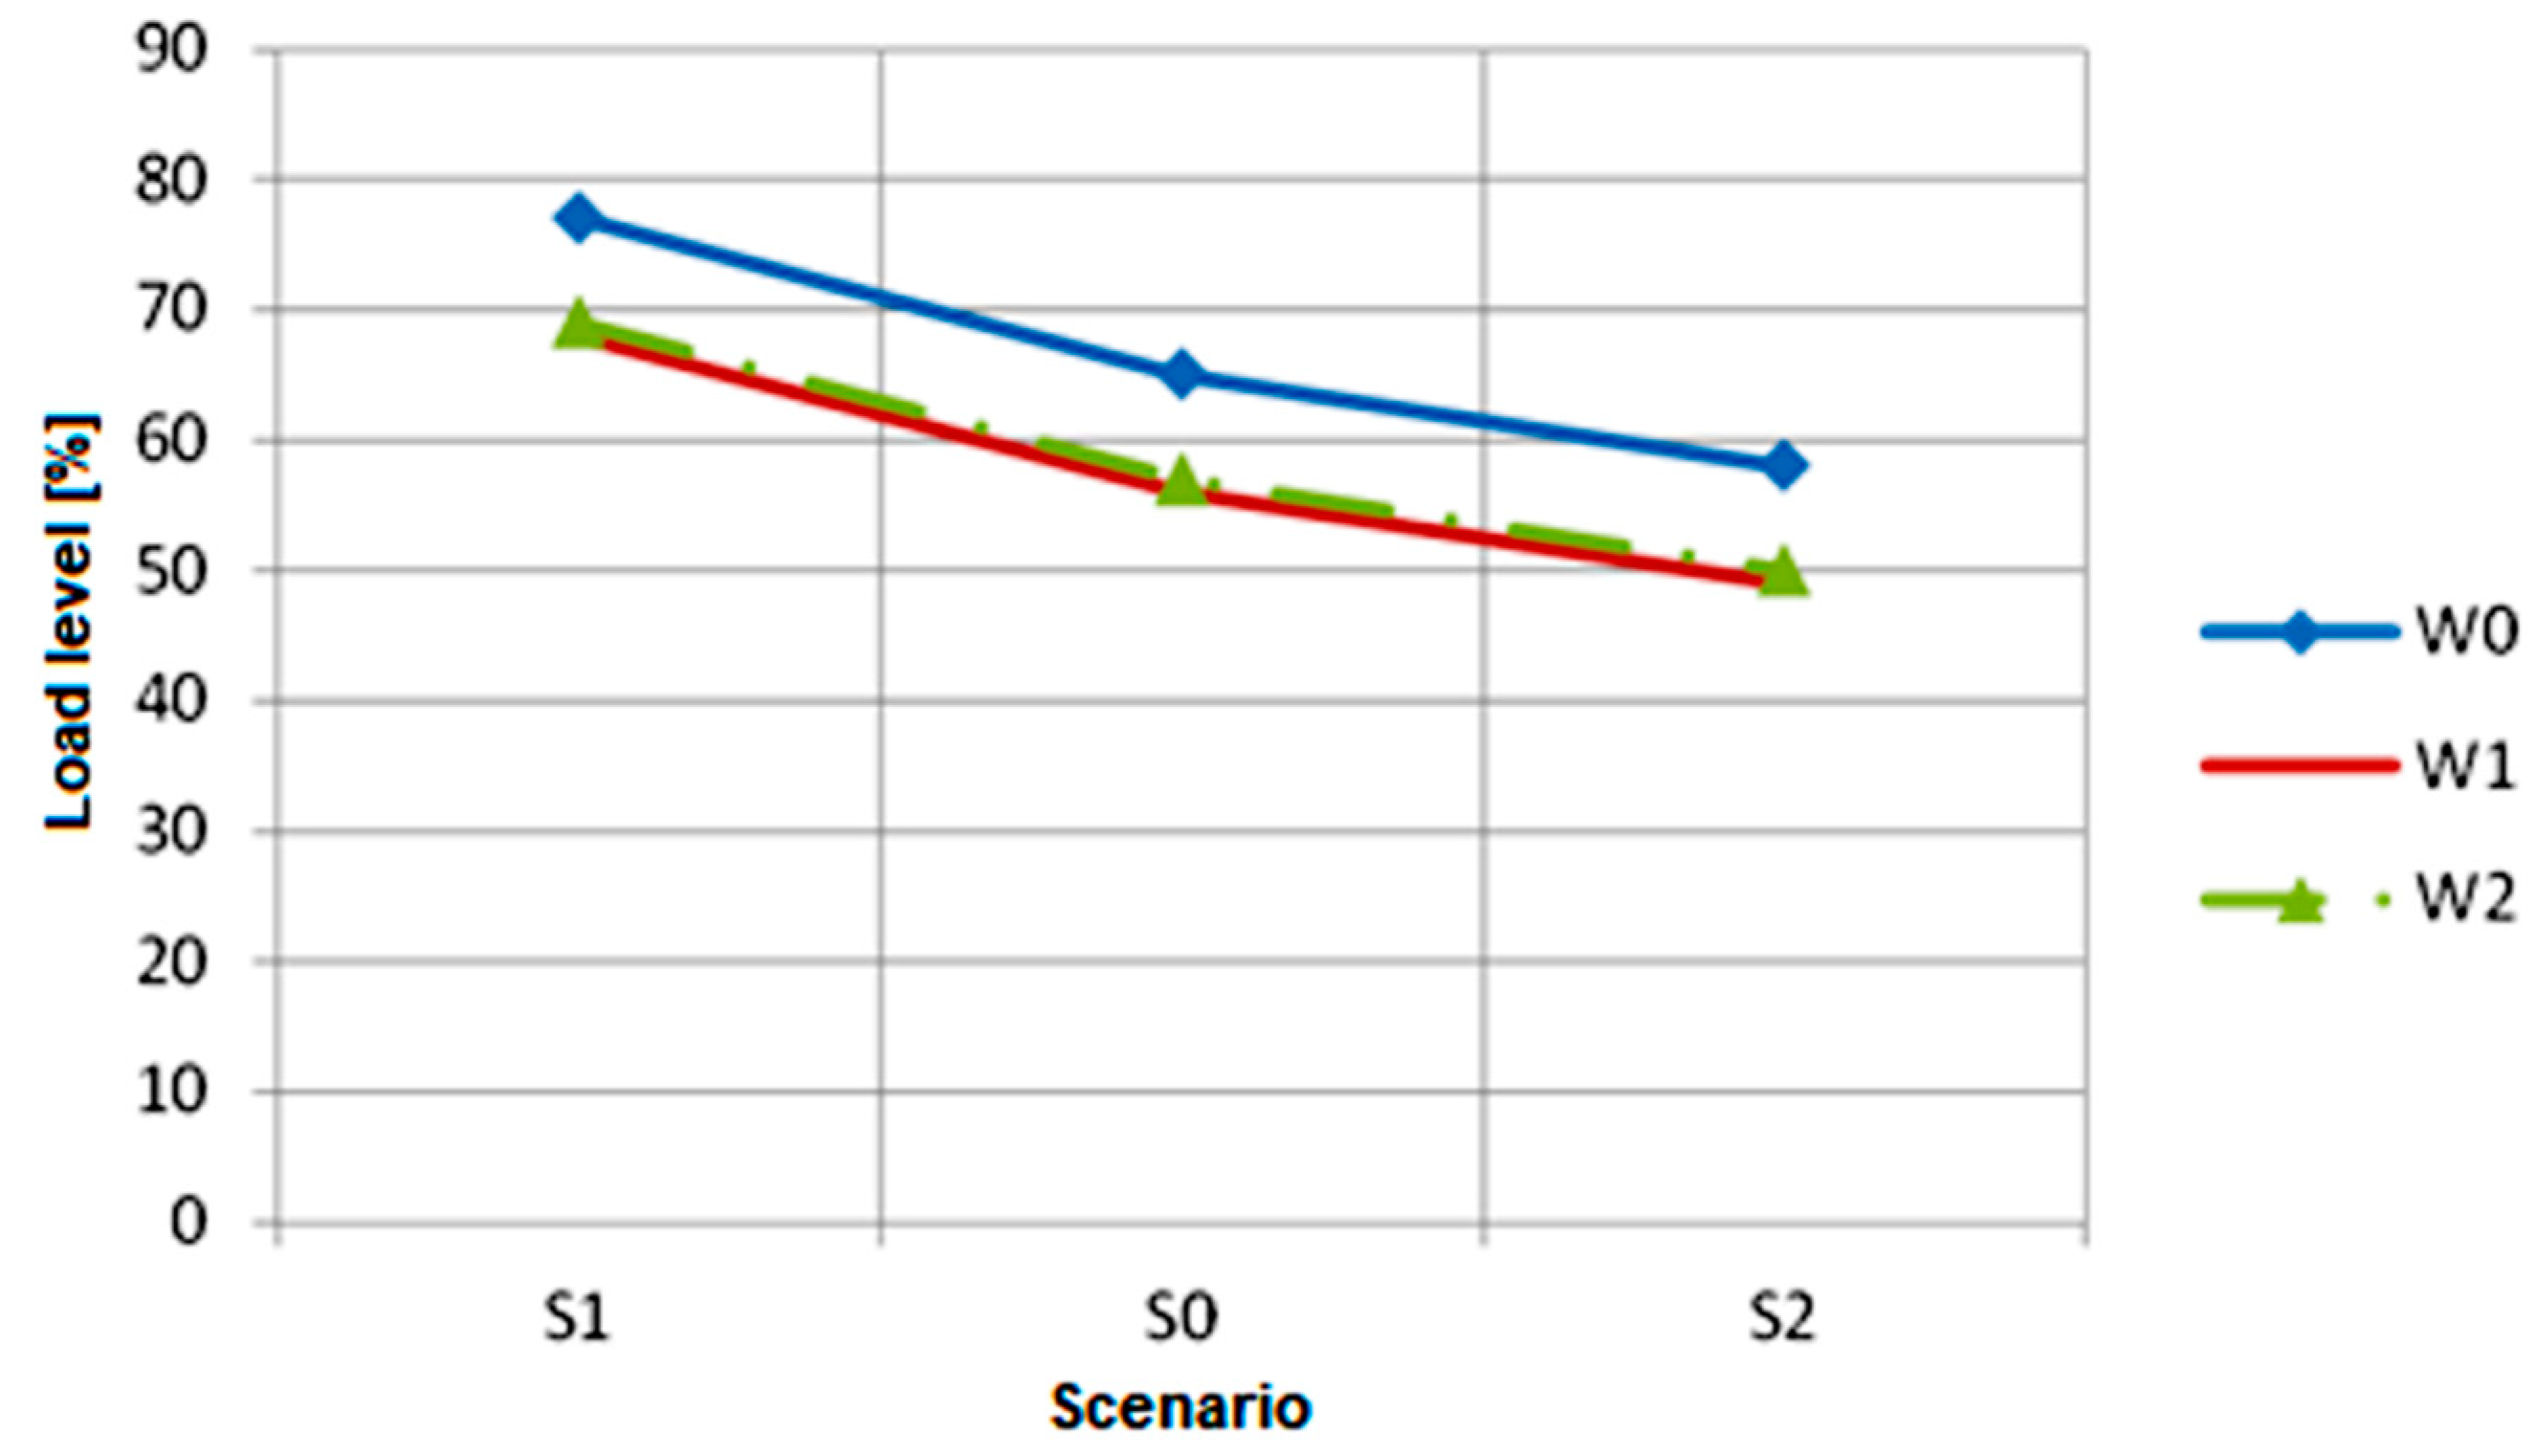
- W0—normal grid topology;
- W1—220 kV Joachimów-Huta Częstochowa line outage;
- W2—400 kV Płock-Rogowiec and 400 kV Rogowiec-Ołtarzew lines outage.
3.2. Summary of the Analysis
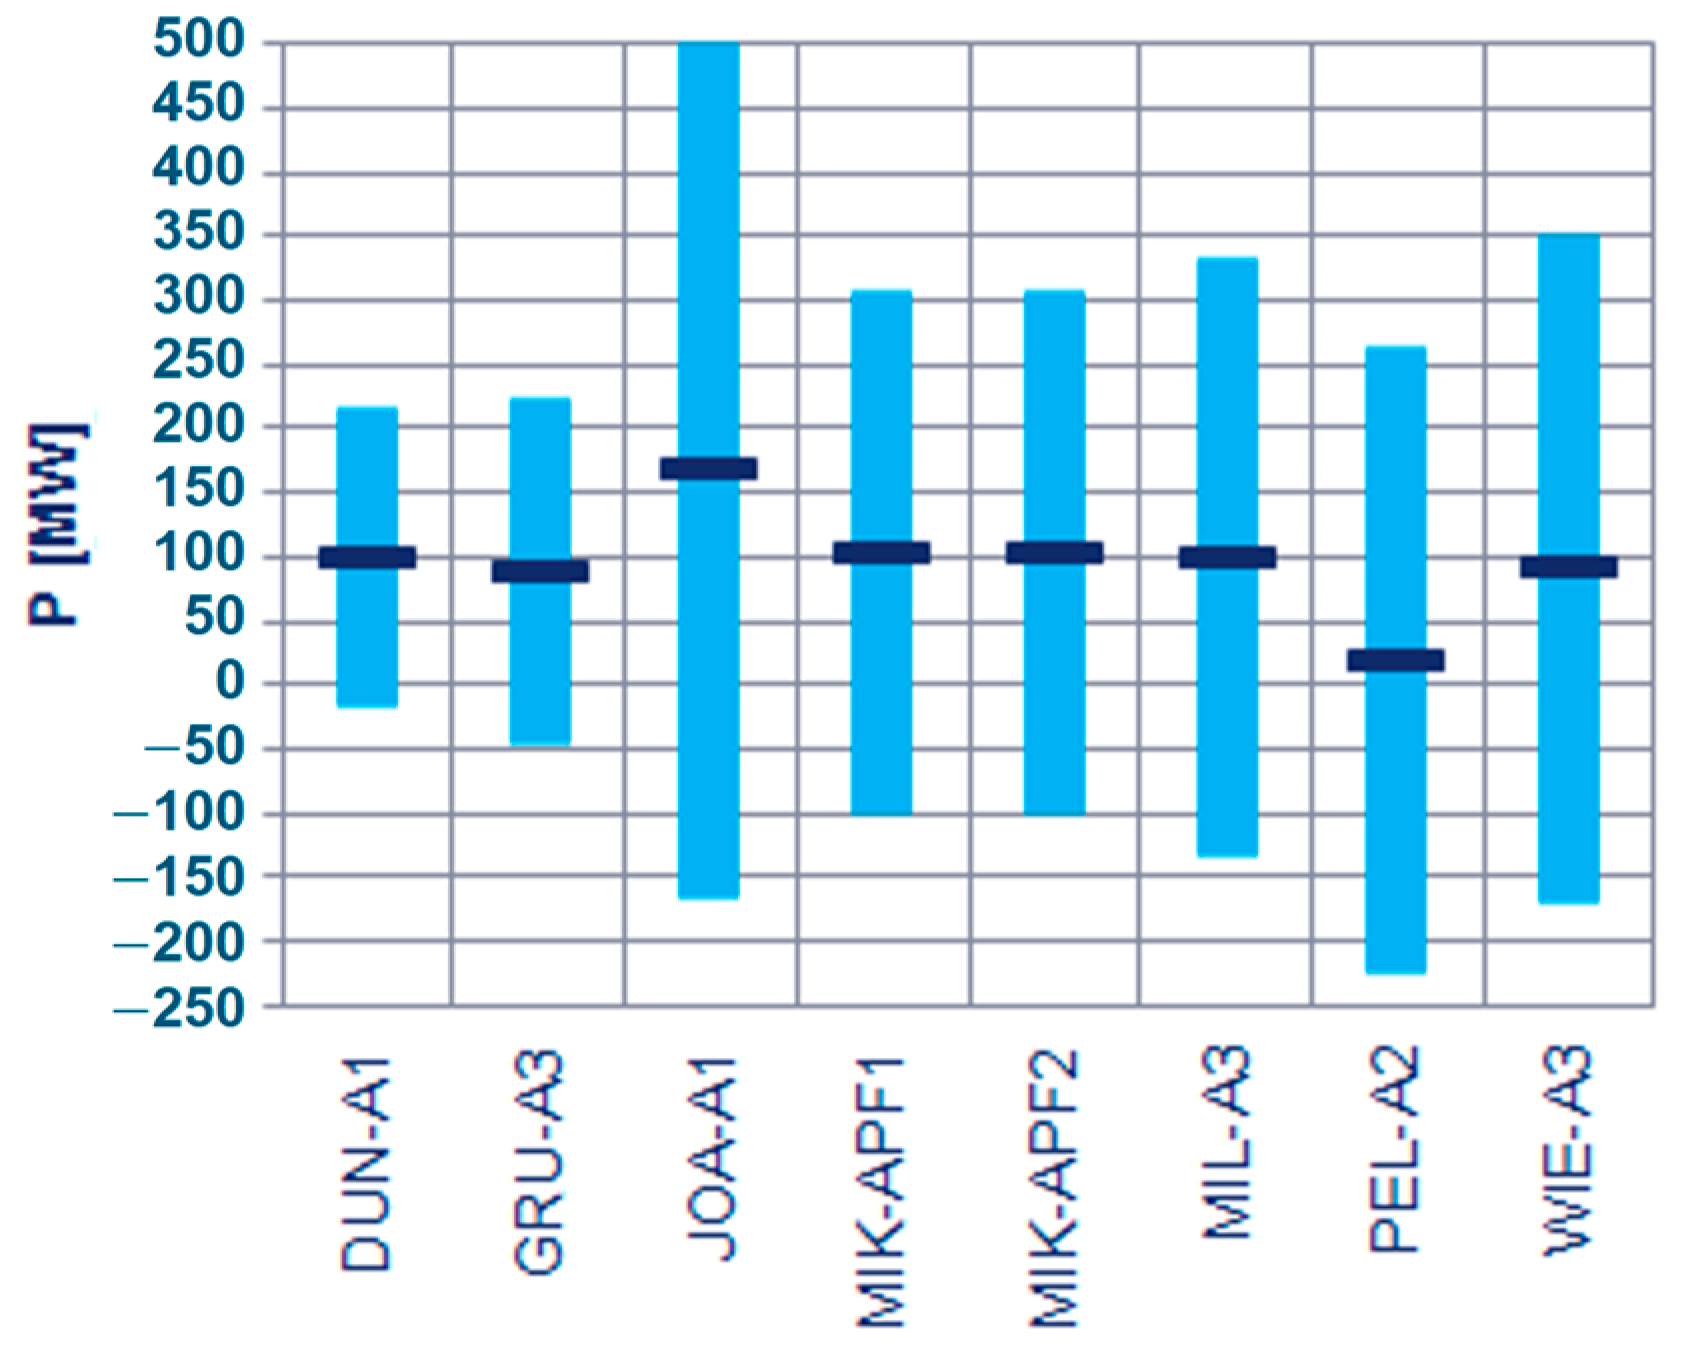
- The implementation of phase-angle regulation by transformer units with complex regulation allows for control over active power flows through these transformers. Thus, it is possible to control the power flow in the network environment of the place where these units are installed. In the Polish national power system, this applies in particular to the 400 kV and 220 kV networks. The main effect of this regulation relates to the amount of power (load) flow in the transformer set.
- The capacity of the considered regulating transformers depends on their design parameters (range of changes in the regulation angle ratio δ, values of equivalent impedance, etc.) and their place of installation in the national power system (including the short-circuit power and the structure of the network environment on both sides of the transformer). It is advisable to use such a control solution for the distribution of power flows between 220 kV and 400 kV transmission lines.
- For transformers with combined regulation, the change in the regulation angle ratio is accompanied by a change in the voltage ratio (for a regulation angle δ different from 0°). Then, simultaneously with the change in the phase shift angle of the nodal voltages, the voltage module changes. The interdependence that occurs is disadvantageous because it limits the possibilities of freely controlling the operating conditions of the network. In particular, it may refer to the emergency states of the NPS.
- For transformer sets with combined regulation installed in the NPS, changing the regulation angle requires not only switching off the entire transformer set but also changing the phase connection sequence between individual components of this set. This makes it impossible to quickly control power flows in the emergency states of the NPS that require immediate reactions. Therefore, it should be assumed that for this type of unit, uninterrupted operation is determined by the system of connections between the main unit and extension unit.
4. Mathematical Model of Regulation Optimization with the Use of Transformer Units
4.1. Nodal Admittance Matrix
- the nodal voltage vector;
- the nodal current vector;
- the nodal admittance matrix;
- the nodal impedance matrix.
- —the one-side shunt admittance;
- —the ground admittance;
- —the series admittance.
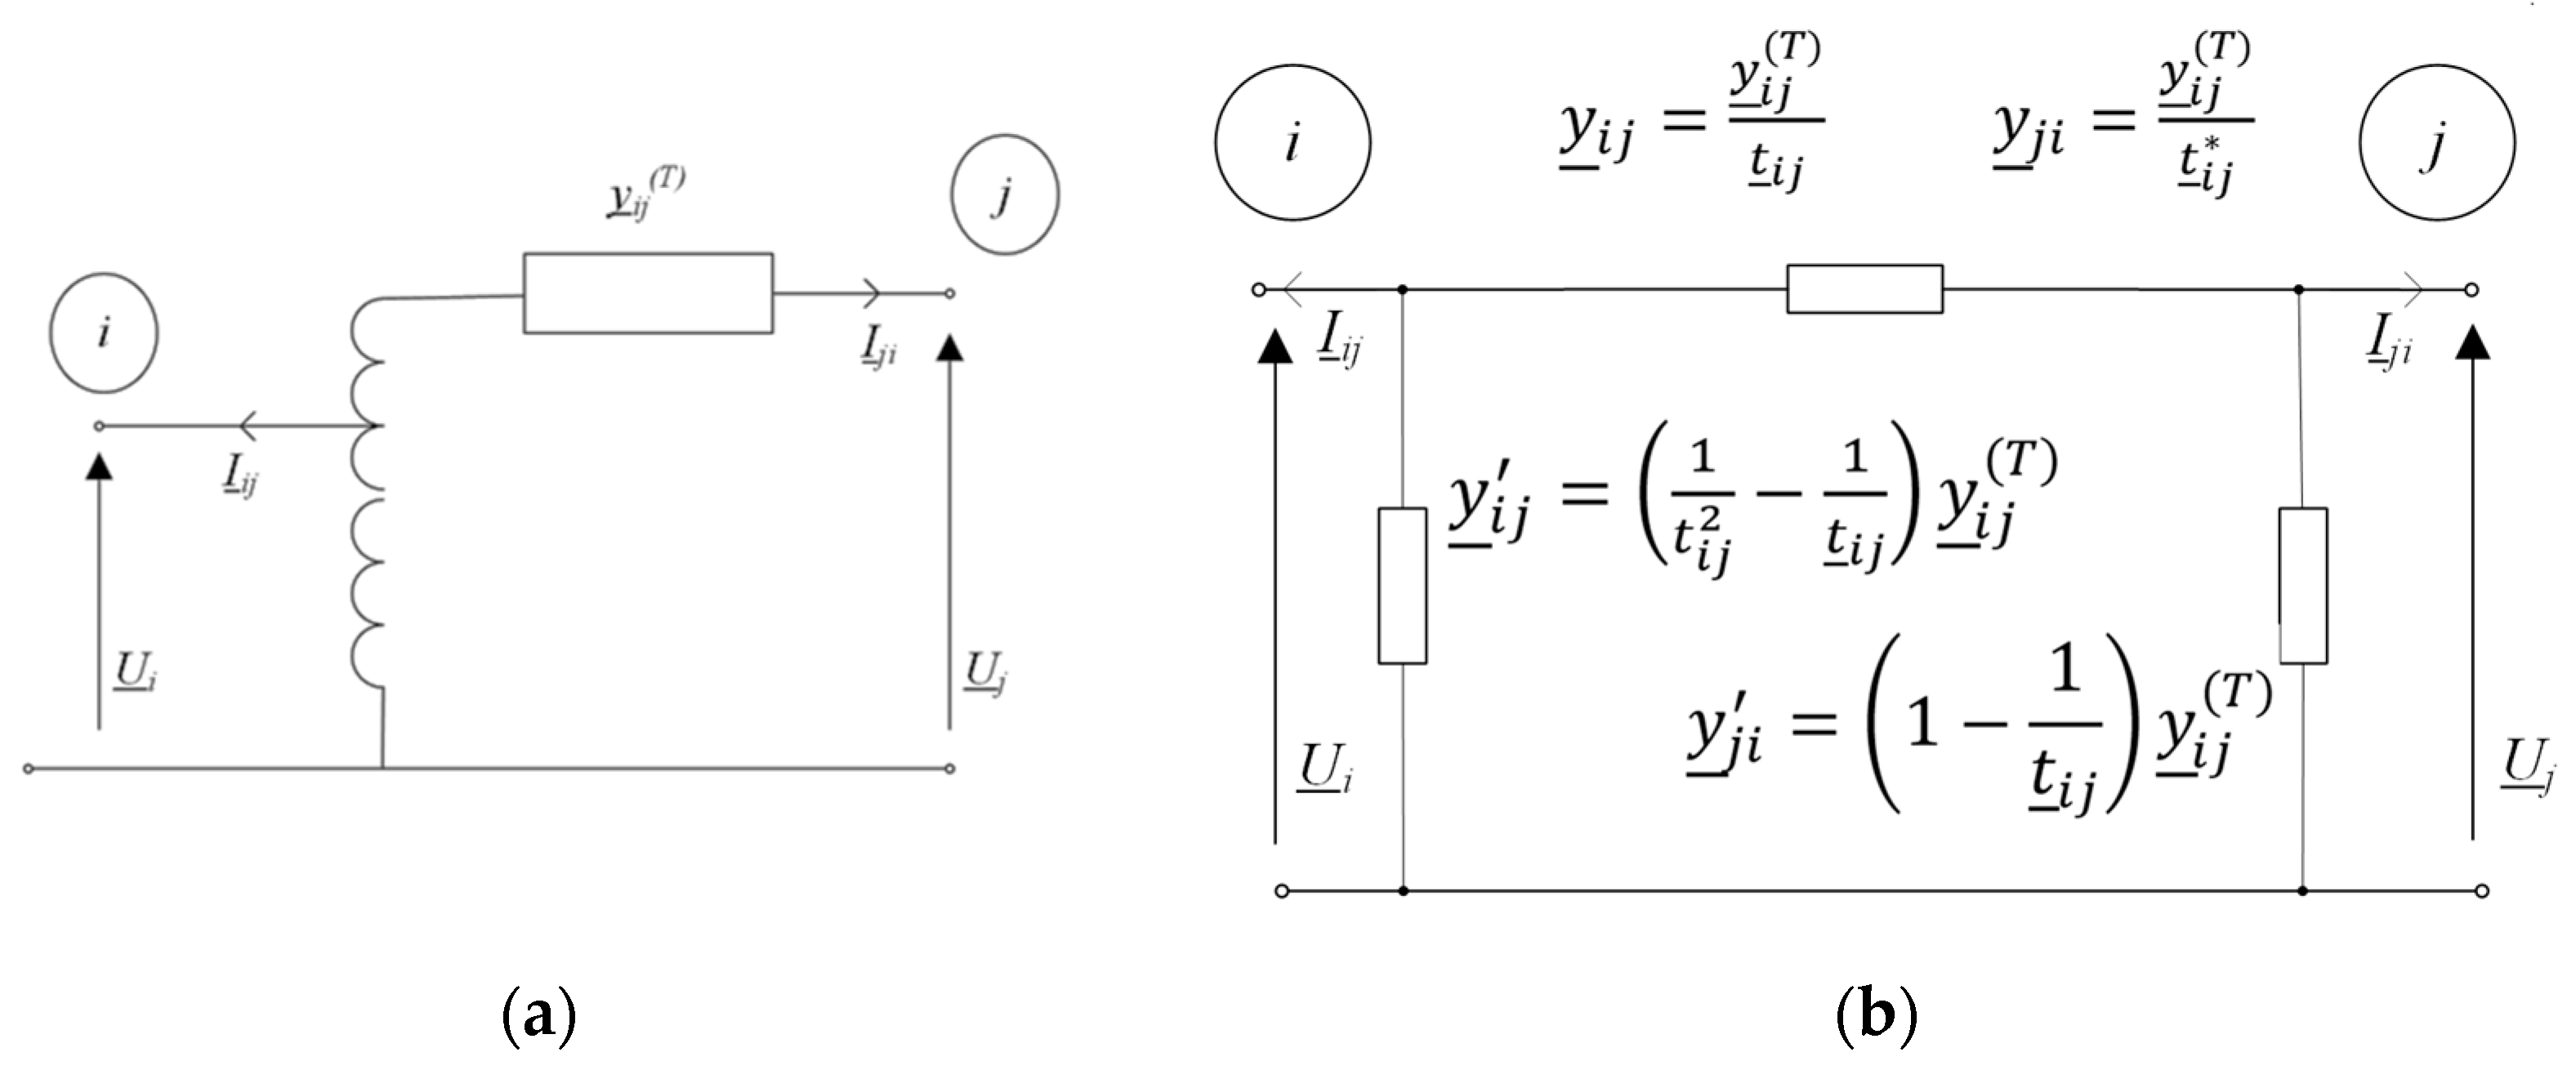
4.2. Admittance Parameters of the Transformer Set
- —diagonal elements of the admittance matrix in node i before connecting the transformer set;
- —diagonal elements of the admittance matrix in node j before connecting the transformer set,
- while non-diagonal elements take values calculated from the equation:
4.3. New Locations for the Installation of Regulating Transformers
4.3.1. Example 1
- —the power flow through the network branch “after” shifter control;
- —the power flow through a network branch in a given network without the use of regulation;
- —the power flow through the network branch as a result of the application of regulation.
- —phase angle of the voltage between nodes i-j without the regulation;
- —phase angle of the voltage between nodes i-j after the regulation;
- —phase angle entered by the PST.
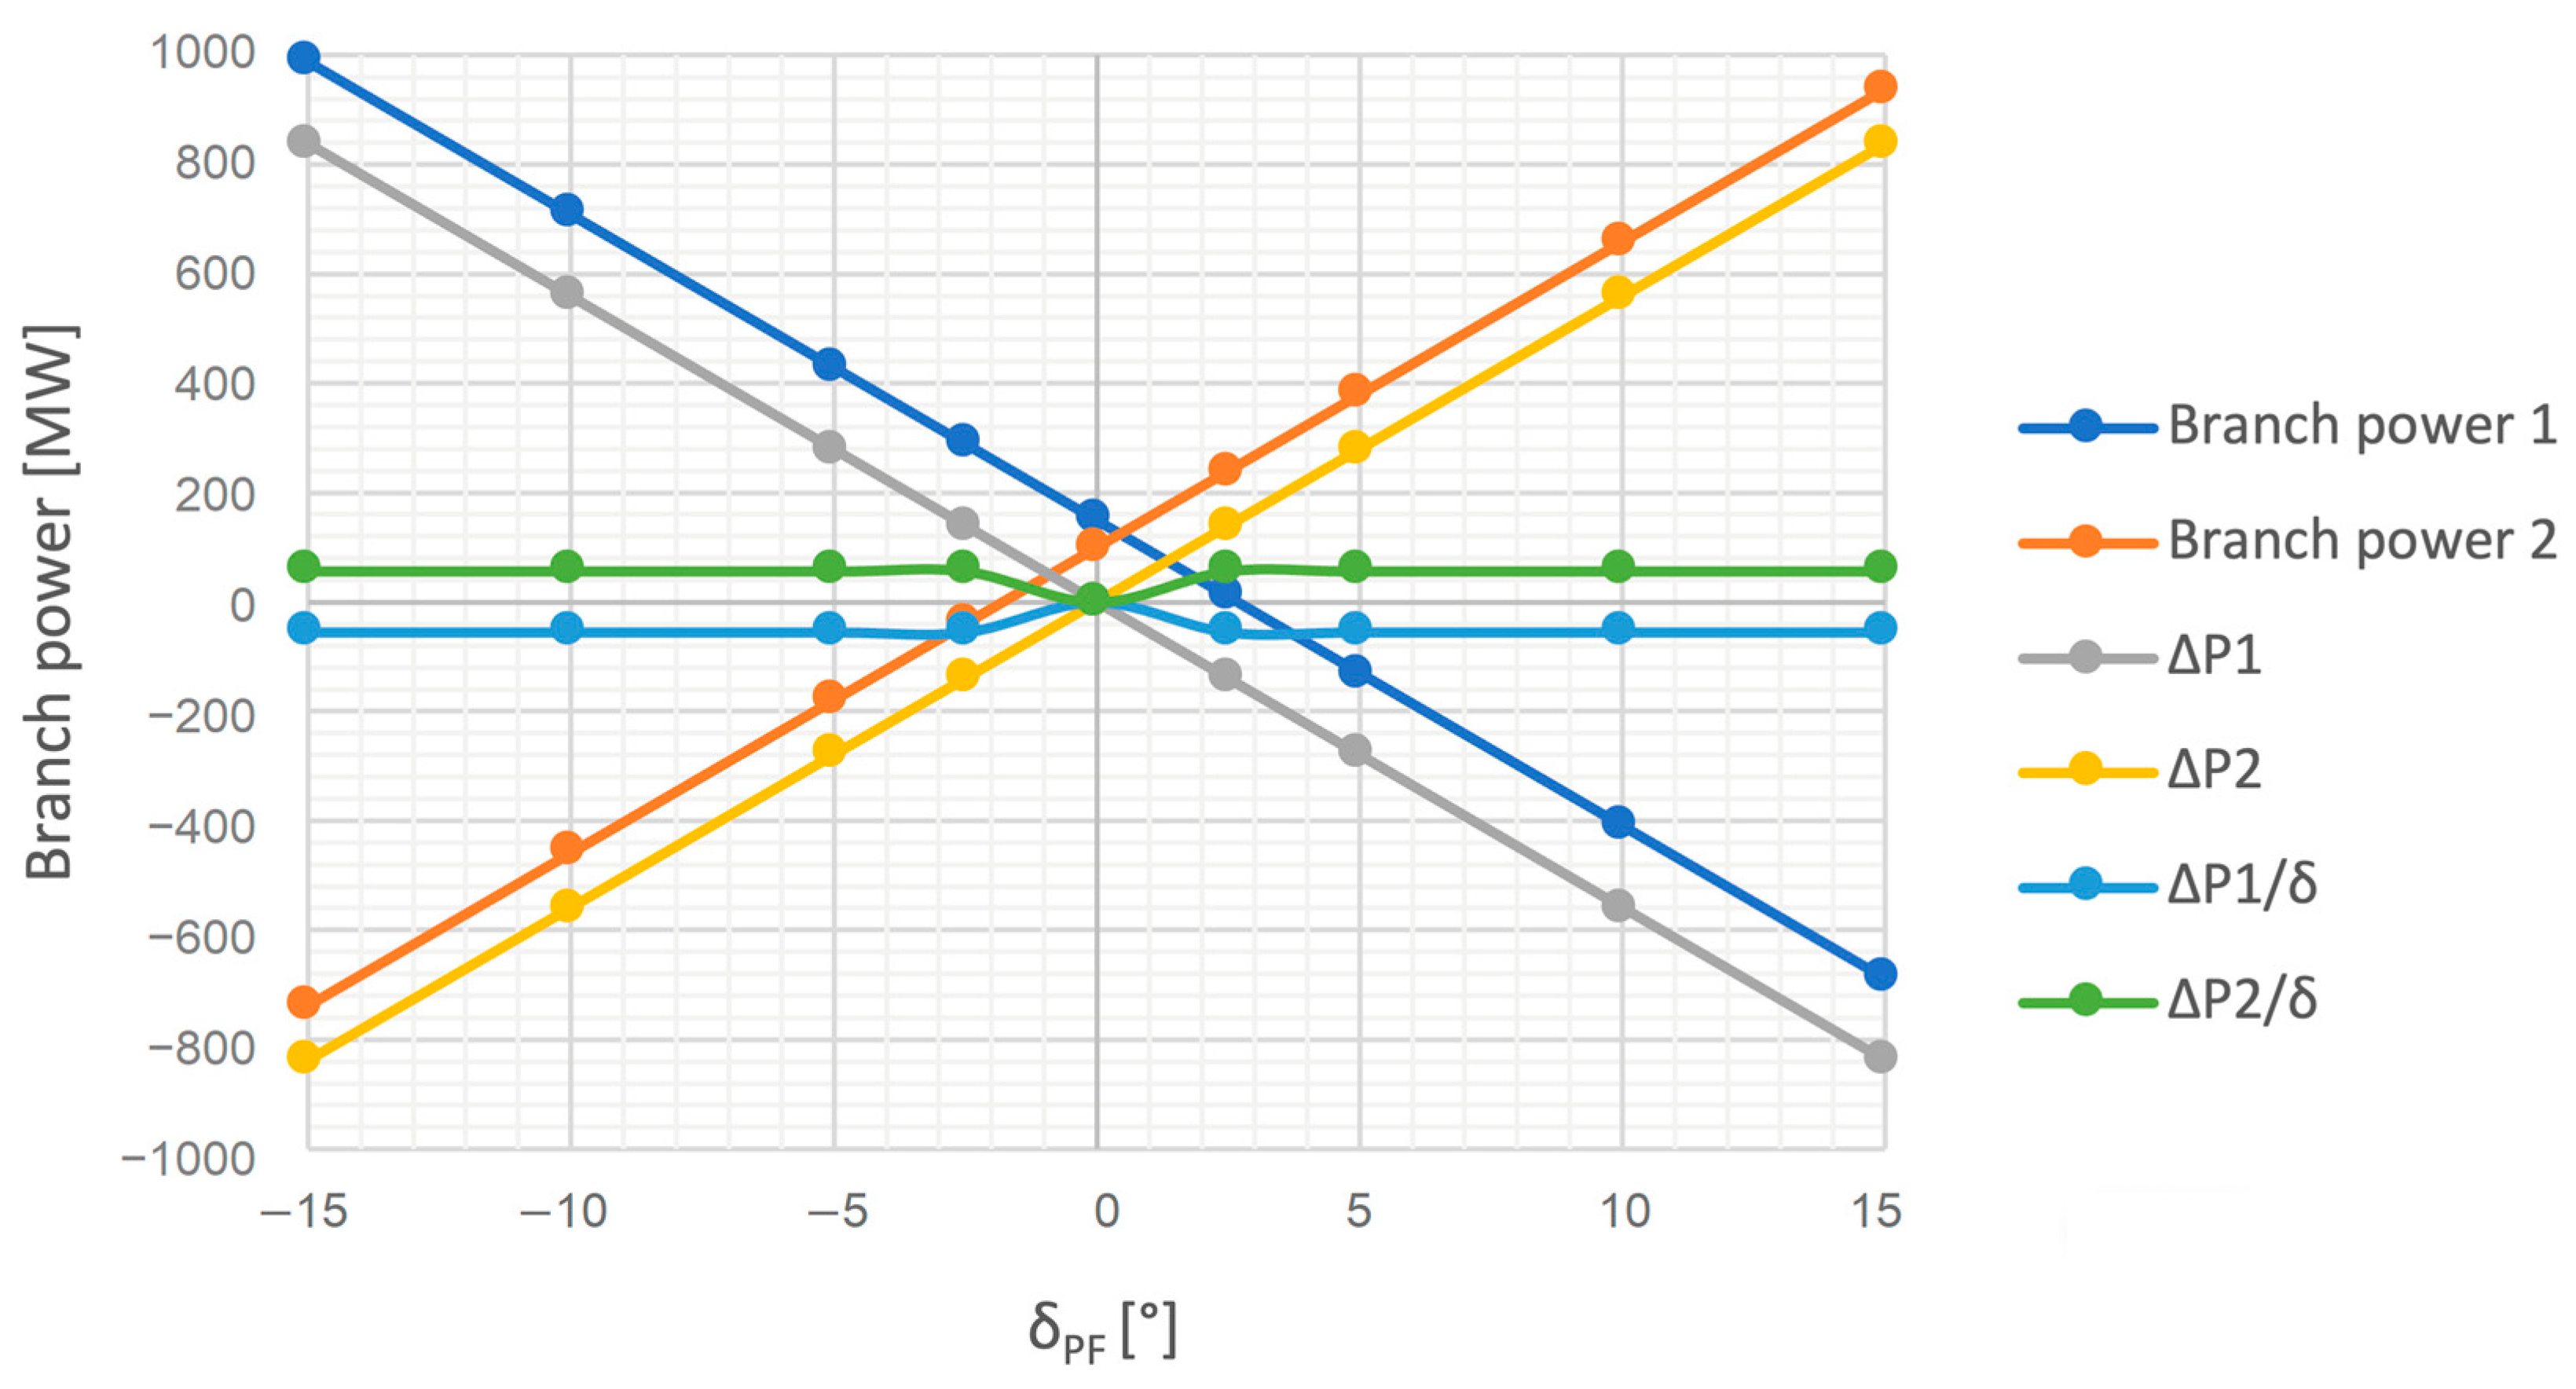
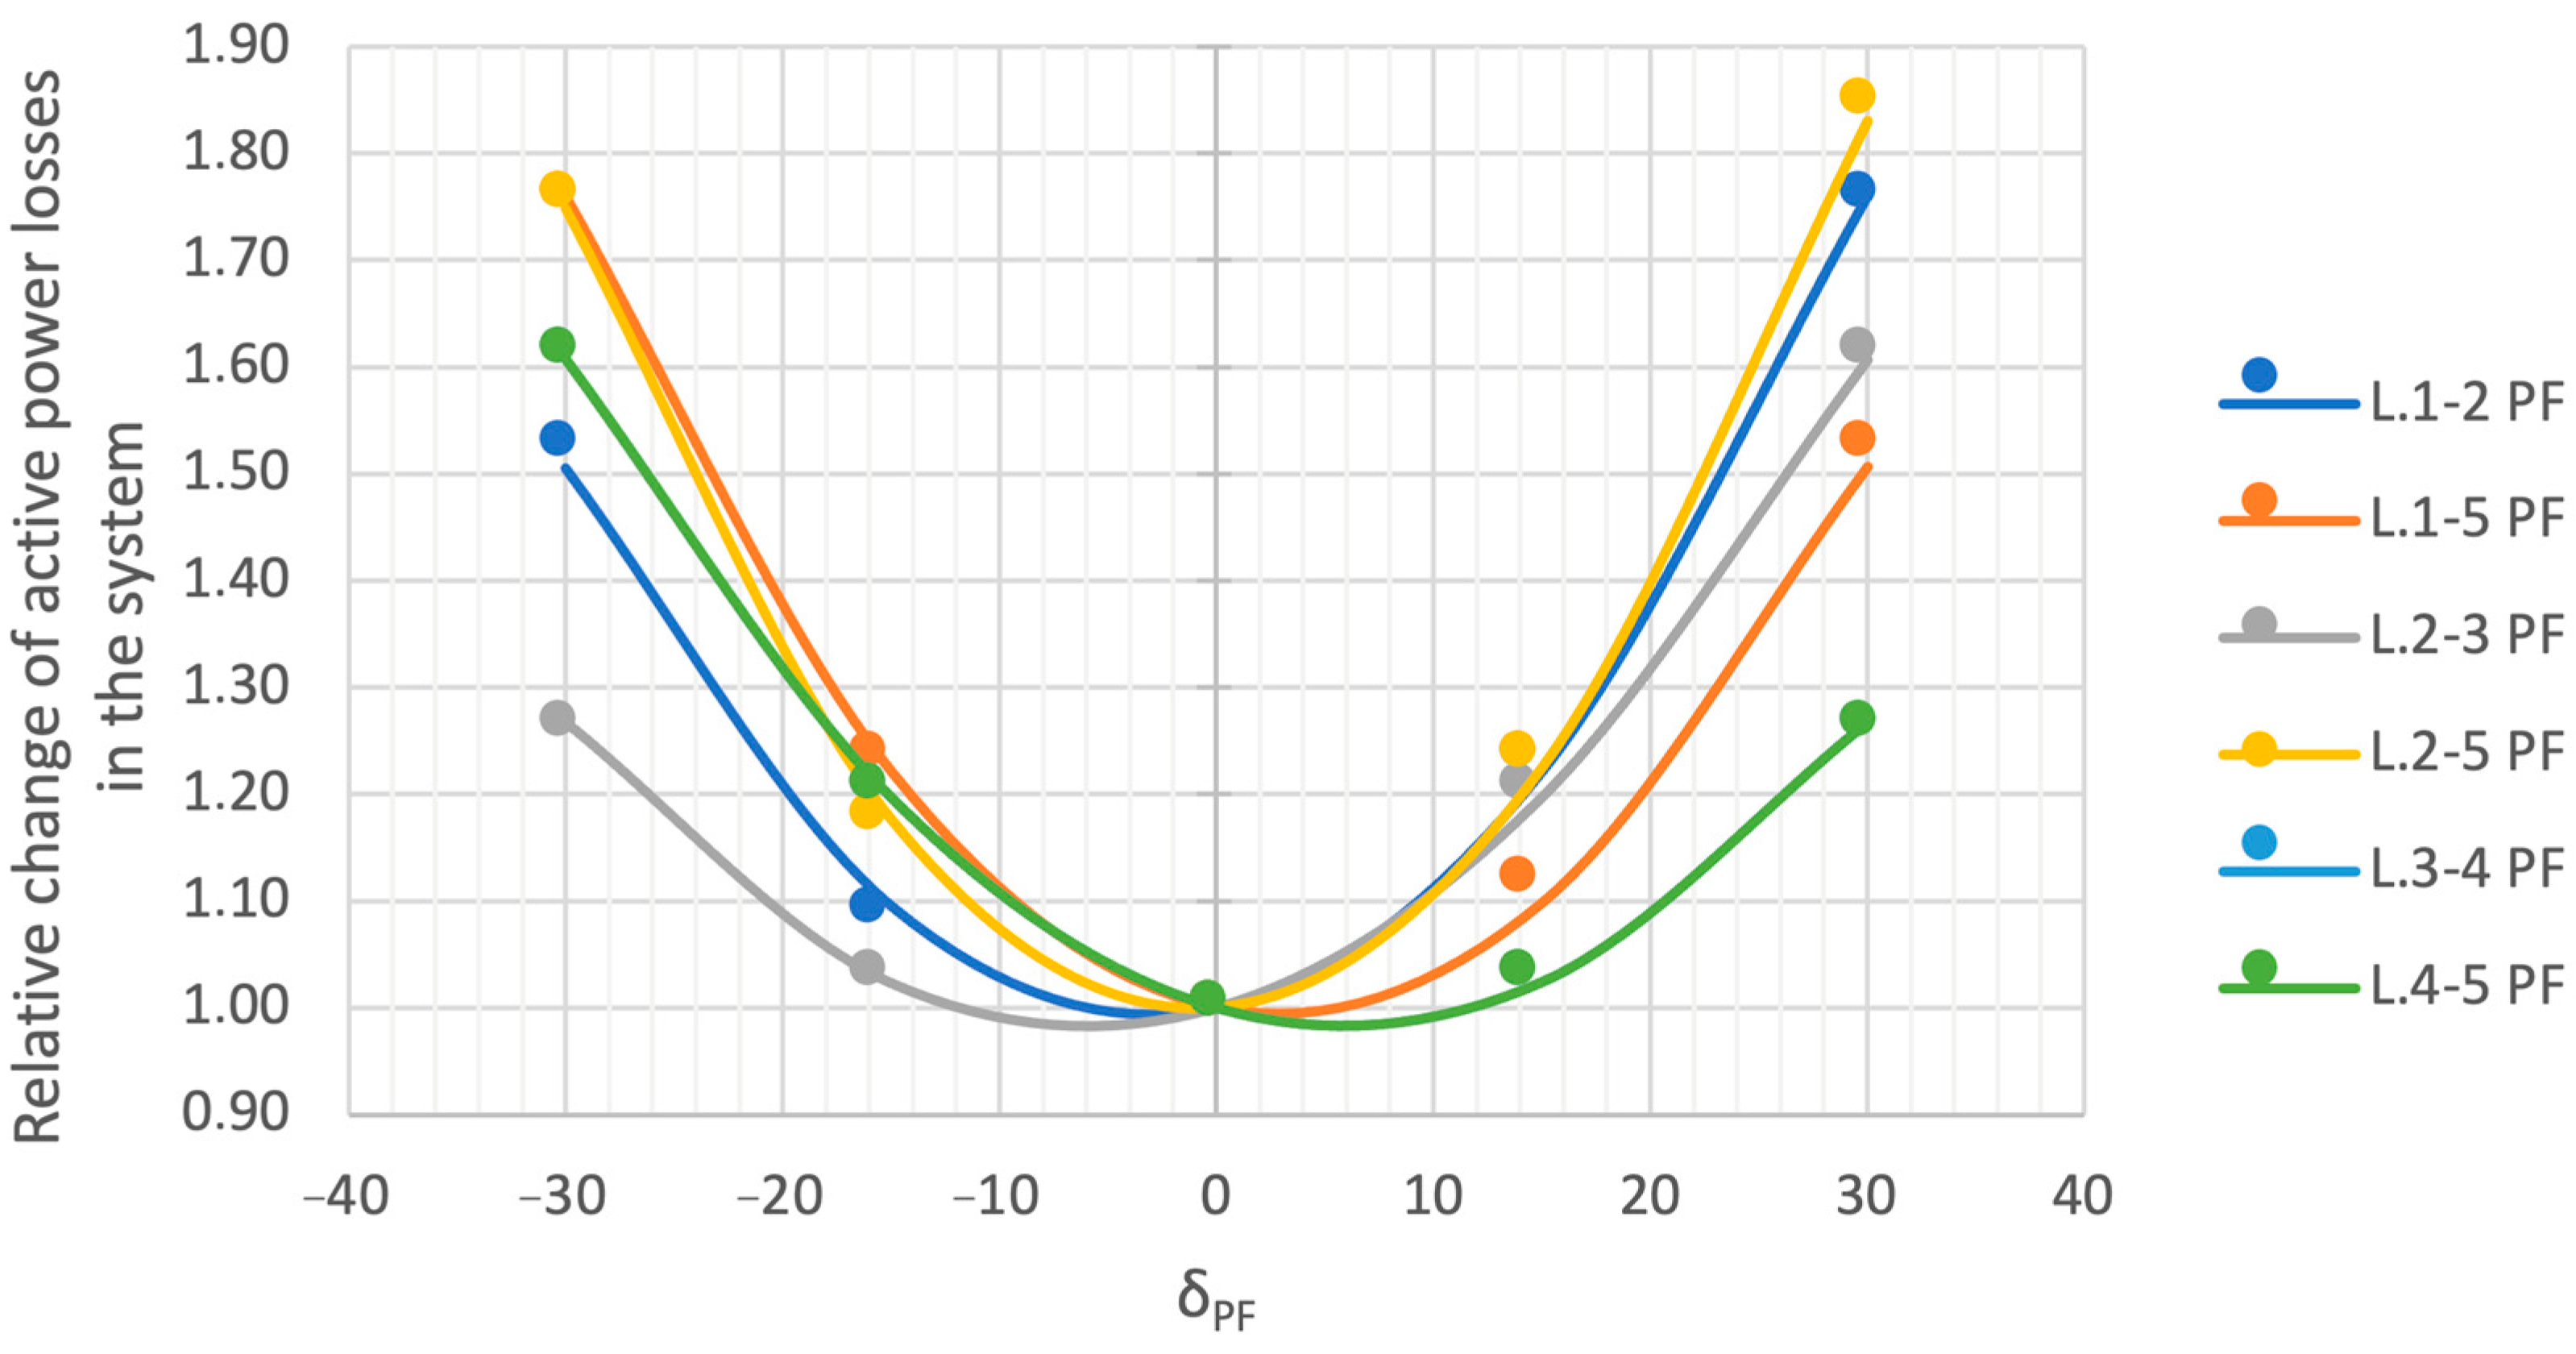
- —the power flow change in the network as a result of using phase shifter control;
- —the phase shifter adjustment angle at which the power change occurs;
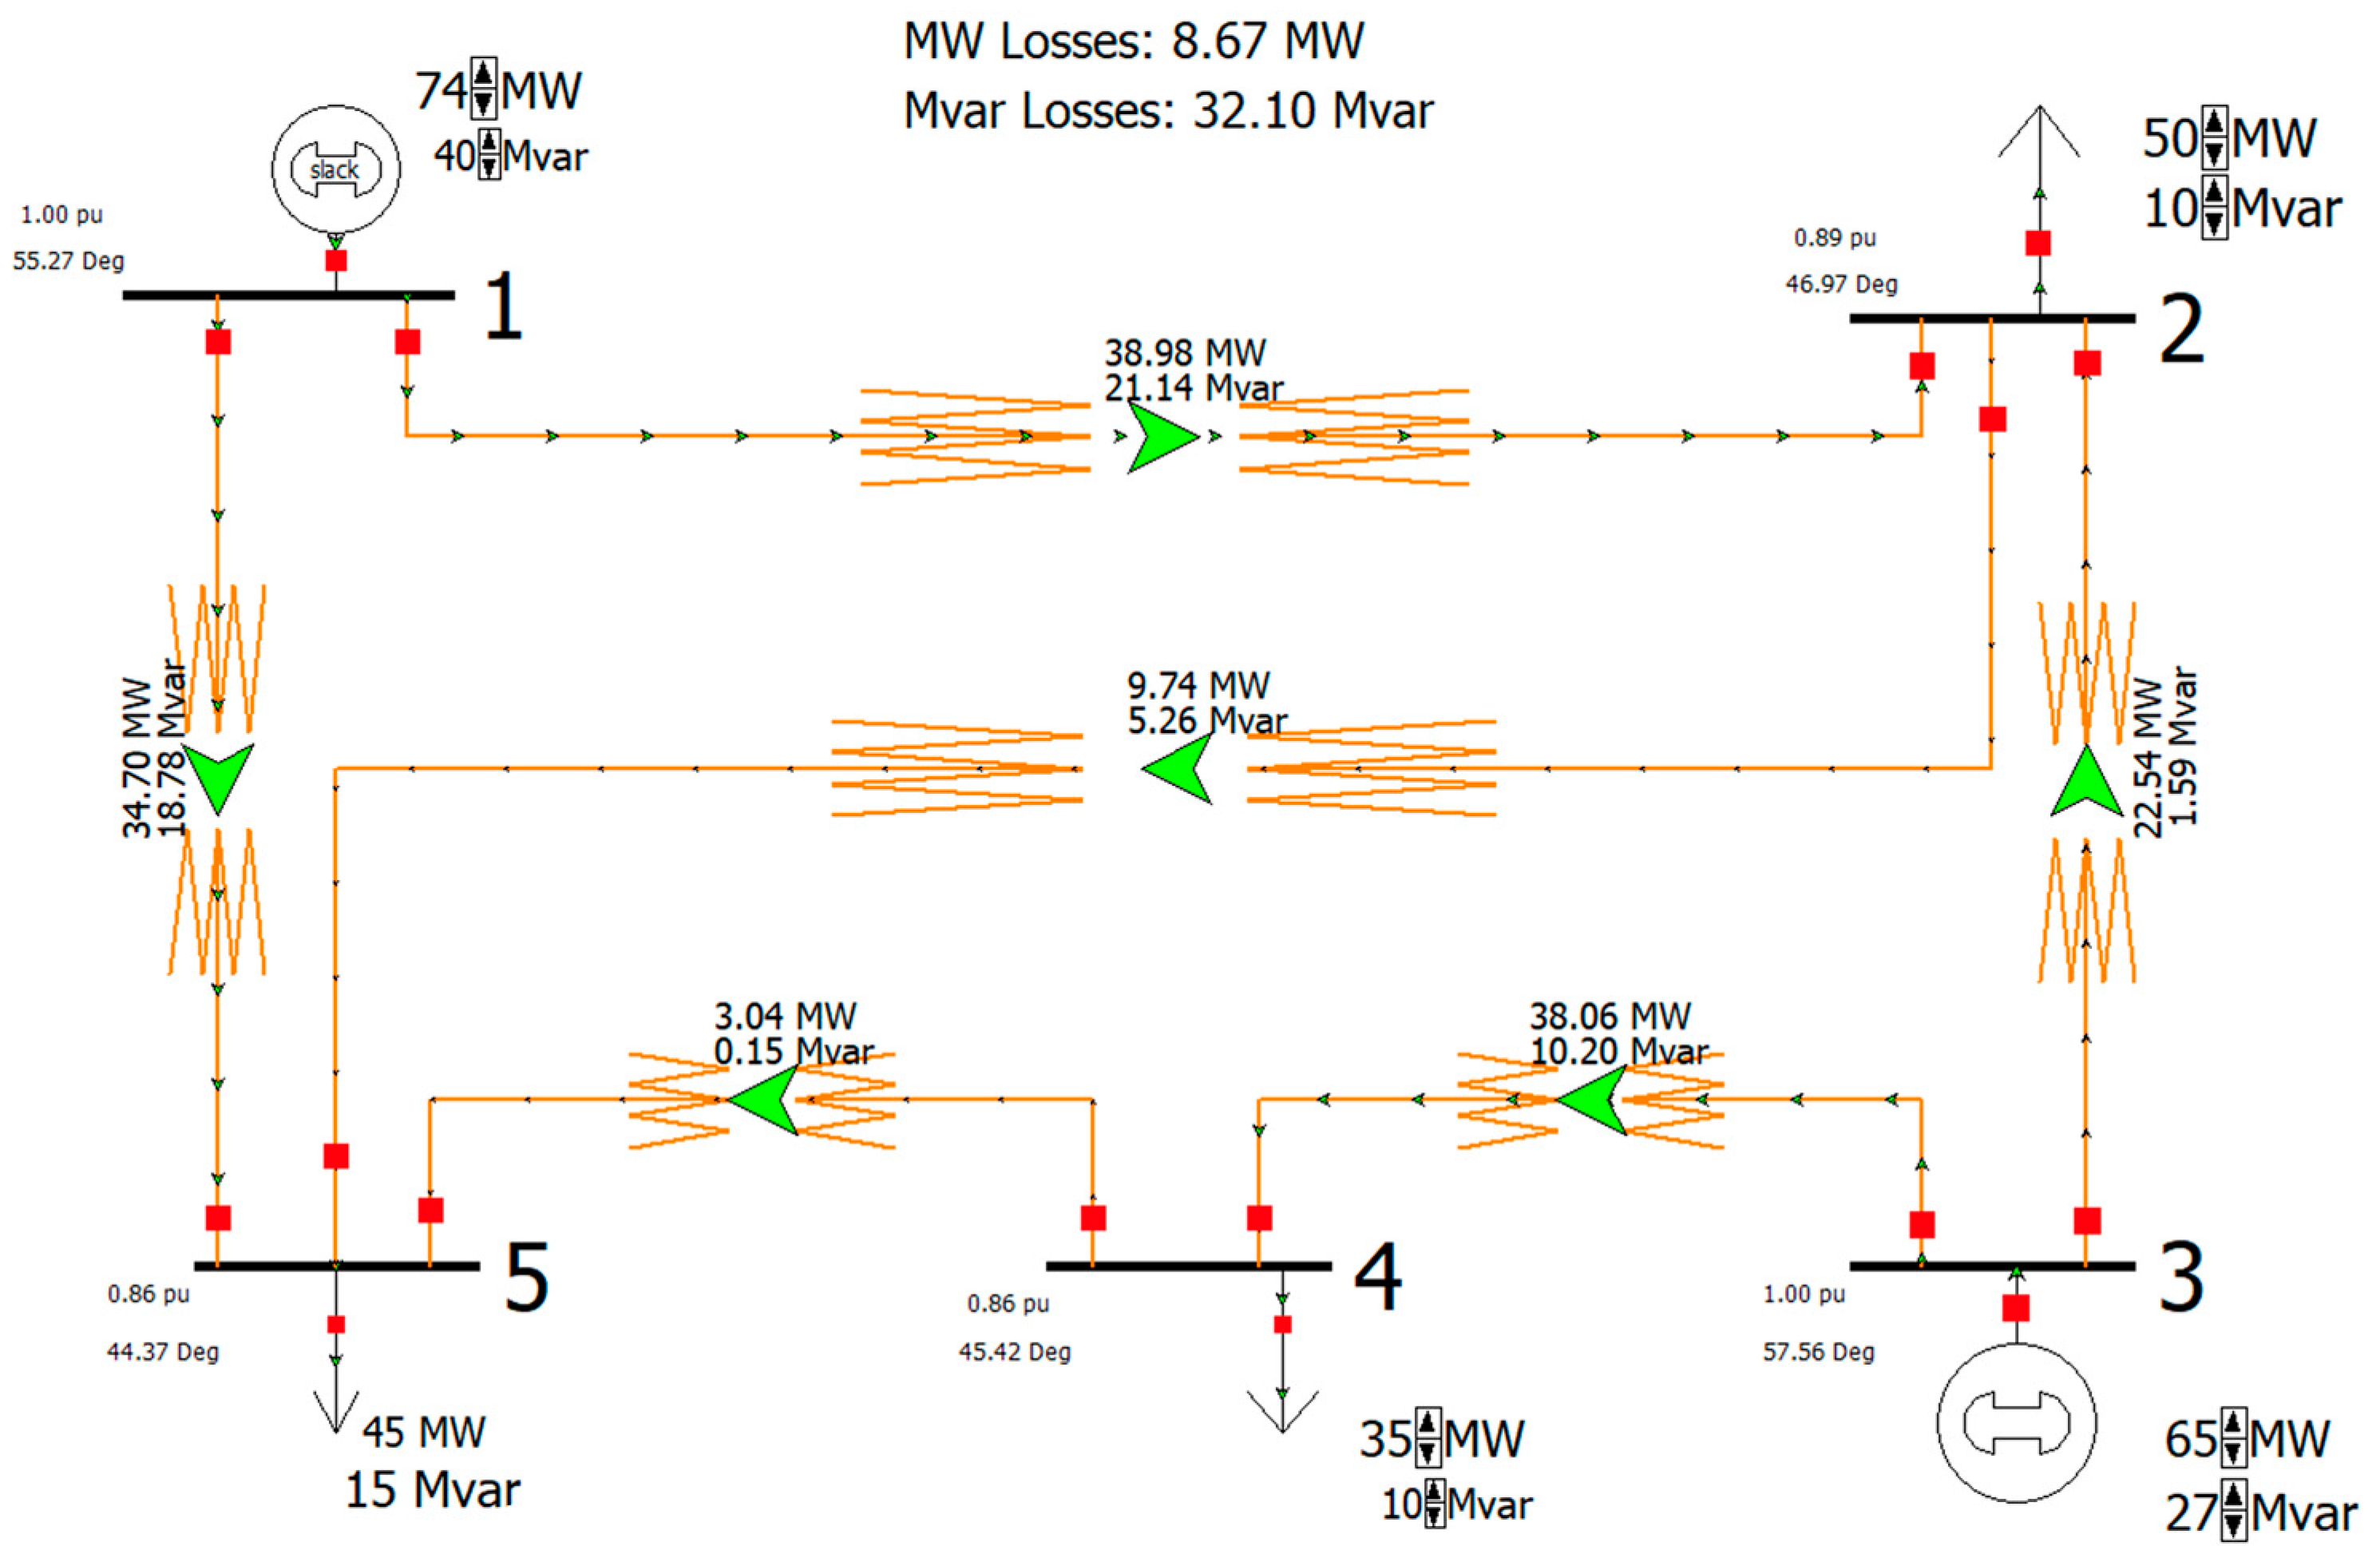
4.3.2. Example 2
4.3.3. Example 3
4.3.4. Summary of Test Analyses
- Transformer units with complex regulation are a very simple method of controlling active and reactive power flows in the power system. The regulation is based on the change in network admittance.
- Each change in the complex ratio of the transformer (both the voltage magnitude and the phase angle) generates an increase in power losses in the system. The settings should therefore be a compromise between increasing losses and the need to obtain new regulatory capacity.
- The transformer unit with complex regulation is modeled as an asymmetric ∏-equivalent. The complex ratio, depending on the selected taps, changes the series and shunt parameters, affecting only the change in admittance of the non-diagonal branches in which such a unit is installed.
- When analyzing the search for new locations for this type of devices, one should take into account the maximization of the regulatory capacity while minimizing network losses.
5. Algorithm of Searching for New Locations for Regulating Transformers
5.1. Algorithm for Searching for New Locations
5.2. Summary of the Algorithm
6. Conclusions
Author Contributions
Funding
Data Availability Statement
Conflicts of Interest
References
- Polskie Sieci Elektroenergetyczne. Available online: www.pse.pl (accessed on 21 July 2022).
- Transformacja Energetyczna w Polsce—Edycja 2022. Available online: https://www.forum-energii.eu/public/upload/articles/files/Raport_Transformacja%20energetyczna%20Polski_2022.pdf (accessed on 21 July 2022).
- Rozwój I Potencjał Energetyki Odnawialnej w Polsce. Available online: https://pie.net.pl/wp-content/uploads/2021/04/PIE-Raport_OZE.pdf (accessed on 21 July 2022).
- Lubośny, Z. Farmy Wiatrowe w Systemie Elektroenergetycznym, 1st ed.; Wydawnictwo Naukowo-Techniczne: Warsaw, Poland, 2016. [Google Scholar]
- Paska, J. Rozproszone Źródła Energii, 1st ed.; Oficyna Wydawnicza Politechniki Warszawskiej: Warsaw, Poland, 2017. [Google Scholar]
- Bulat, H.; Franković, D.; Vlahinić, S. Enhanced Contingency Analysis—A Power System Operator Tool. Energies 2021, 14, 923. [Google Scholar] [CrossRef]
- Lin, Z.; Hu, Z.; Song, Y. Distribution Network Expansion Planning Considering N-1 Criterion. IEEE Trans. Power Syst. 2019, 34, 3. [Google Scholar] [CrossRef]
- Ren, H.; Dobson, I.; Carreras, B.A. Long-term Effect od the n-1 Criterion on Cascading Line Outages in an Evolving Power Transmission Grid. IEEE Trans. Power Syst. 2008, 23, 1217–1225. [Google Scholar] [CrossRef]
- Kremens, Z.; Sobierajski, M. Analiza Systemów Elektroenergetycznych, 1st ed.; Wydawnictwo Naukowo-Techniczne: Warsaw, Poland, 1996. [Google Scholar]
- Gryszpanowicz, K.; Robak, S.; Machowski, J. Analizy Sieciowe w Planowaniu Rozwoju Systemu Elektroenergetycznego, 1st ed.; Oficyna Wydawnicza Politechniki Warszawskiej: Warsaw, Poland, 2016. [Google Scholar]
- Machowski, J.; Białek, J.; Bumby, J. Power System Dynamics. Stability and Control; Jon Wiley & Sons: Chichester, NY, USA, 2008. [Google Scholar]
- Van Hertem, D.; Verboomen, J.; Purchala, K.; Belmans, R.; Kling, W.L. Usefulness of DC Power Flow for Active Power Flow Analysis with Flow Controlling Devices. In Proceedings of the 8th IEE International Conference on AC and DC Power Transmission, London, UK, 28–31 March 2006. [Google Scholar]
- Van Hertem, D.; Verboomen, J.; Belmans, R.; Kling, W.L. Power Flow controlling devices: An overview of their working principles and their application range. In Proceedings of the 2005 International Conference on Future Power Systems, Amsterdam, The Netherlands, 18 November 2005. [Google Scholar]
- Mahomed, S.A.; Abdel-Moamen, M.A.R. Phase-Shifting Transformers’ Model for Optimal Load Flow Formulation. In Proceedings of the 2018 Twentieth International Middle East Power Systems Conference (MEPCON), Cairo, Egypt, 18–20 December 2018. [Google Scholar]
- Kawaura, Y.; Yamanouchi, S.; Ichihara, M.; Iwamoto, S.; Suetsugu, Y.; Higashitani, T. Phase-shifting transformer application to power-flow adjustment for large-scale PV penetration. In Proceedings of the 2016 IEEE Region 10 Conference (TENCON), Singapore, 22–25 November 2016. [Google Scholar]
- Dong, L.Y.; Zhang, L.; Crow, M.L. A New Strategy for the Unified Power Flow Controller. In Proceedings of the 2002 IEEE Power Engineering Society Winter Meeting, New York, NY, USA, 27–31 January 2002. [Google Scholar]
- Ding, T.; Bo, R.; Bie, Z.; Wang, X. Optimal Selection of Phase Shifting Transformer Adjustment in Optimal Power Flow. IEEE Trans. Power Syst. 2017, 32, 2464–2465. [Google Scholar] [CrossRef]
- Yu, M.; Yuan, J.; Li, Z.; Li, F.; Yang, X.; Zhang, W.; Xu, S.; Mei, J. Power Flow Optimization and Economic Analysis Based on High Voltage Phase Shfting Transformer. Energies 2022, 15, 2363. [Google Scholar] [CrossRef]
- Kocot, H.; Korab, R.; Owczarek, R.; Przygrodzki, M.; Żmuda, K. Countermeasures for Dealing with Uncheduled Power Flows within an Interconnected Power System; Elektryka: Szczecin, Poland, 2015. [Google Scholar]
- Owczarek, R. Optymalizacja Nastaw Przesuwników Fazowych Instalowanych w Liniach Transgranicznych Połączonego Systemu Elektroenergetycznego w Stanach Ustalonych. Ph.D. Thesis, Silesian University of Technology, Gliwice, Poland, 2019. [Google Scholar]
- Meeus, L.; Purchala, K.; Degli Esposti, C.; Han Vertem, D.; Belmans, R. Regulated Cross-Border Transmission Investments in Europe. In Proceedings of the 2005/2006 IEEE/PES Transmission and Distribution Conference and Exhibition, Dallas, TX, USA, 21–24 May 2006. [Google Scholar]
- Bresesti, P.; Sforna, M.; Allegranza, V.; Canever, D.; Vailati, R. Application of Phase Shifting Transformers for a secure and efficient operation of the interconnection corridors. In Proceedings of the IEEE Power Engineering Society General Meeting, Denver, CO, USA, 6–10 June 2004. [Google Scholar]
- Machowski, J. Regulacja Systemu Elektroenergetycznego, 2nd ed.; Oficyna Wydawnicza Politechniki Warszawskiej: Warsaw, Poland, 2017. [Google Scholar]
- Jezierski, E. Transformatory, 1st ed.; Wydawnictwo Naukowo-Techniczne: Warsaw, Poland, 1983. [Google Scholar]
- Harlow, J.H. Electric Power Transformer Engineering, 1st ed.; CRC Press: Boca Raton, FL, USA; Taylor & Francis Group: Boca Raton, FL, USA, 2004. [Google Scholar]
- C57.135-2011; IEEE Guide for the Application, Specification and Testing of Phase-Shifting Transformers. The Institute of Electrical and Electronics Engineers, Inc.: New York, NY, USA, 2011.
- Verboomen, J.; Van Hertem, D.; Schavemaker, P.H.; Kling, W.L.; Belmans, R. Phase Shifting Transformers: Principles and Applications. In Proceedings of the 2005 International Conference of Future Power Systems, Amsterdam, The Netherlands, 18 November 2005. [Google Scholar]
- Seitlinger, W. Phase Shifting Transformers Discussions of Specific Characteristics; CIGRE Session: Paris, France, 1998; pp. 12–306. [Google Scholar]
- Ziemianek, S. Model matematyczny zespołu transformatorowego z trapezoidalnym zakresem regulacji przekładni zespolonej do analiz ustalonych i quasiustalonych stanów pracy symetrycznych fazowo. Przegląd Elektrotechniczny 2013, 89, 143–151. [Google Scholar]
- Albrechtowicz, P.; Szczepanik, J. The Comparative Analysis of Phase Shifting Transformers. Energies 2021, 14, 4347. [Google Scholar] [CrossRef]
- Albrechtowicz, P.; Rozegnał, B.; Cisek, P. Comparison of Phase-Shifting Transformers Properties. Energies 2022, 15, 6224. [Google Scholar] [CrossRef]
- Mclver, J. Phase Shifting Transformers—Principles, Design Aspects and Operation; SIEMENS Energy, Inc.: Weiz, Austria, 2013. [Google Scholar]
- Cano, J.; Mojumdar, R.; Norniella, J.; Orcajo, G. Phase Shifting Transformer model for direct approach power flow studies. Int. J. Electr. Power Energy Syst. 2017, 91, 71–79. [Google Scholar] [CrossRef]
- Kulkarni, S.V.; Khaparde, S.A. Transformer Engineering: Design and Practice; Marcel Dekker, Inc.: New York, NY, USA, 2004; ISBN 0-8247-5653-3. [Google Scholar]
- Reddy, T.; Gulati, A.; Khan, M.I.; Koul, R. Application of Phase Shifting Transformer in Indian Power System. Int. J. Comput. Electr. Eng. 2012, 4, 2. [Google Scholar] [CrossRef]
- Verboomen, J.; Van Hertem, D.; Schavemaker, P.H.; Kling, W.L.; Belmans, R. Border-Flow Control by means of Phase Shifting Transformers. In Proceedings of the 2007 IEEE Lausanne Power Tech, Lausanne, Switzerland, 1–5 July 2007. [Google Scholar]
- Verboomen, J.; Van Hertem, D.; Schavemaker, P.H.; Kling, W.L.; Belmans, R. Coordination of phase shifters by means of multi-objective optimisation. In Proceedings of the 41st International Universities Power Engineering Conference, Newcastle upon Tyne, UK, 6–8 September 2006. [Google Scholar]
- Verboomen, J.; Papaefthymiou, G.; Kling, W.L.; Van der Sluis, L. Use of Phase Shifting Transformers for Minimising Congestion Risk. In Proceedings of the 10th International Conference on Probablistic Methods Applied to Power Systems, Rincon, PR, USA, 25–29 May 2008. [Google Scholar]
- Verboomen, J. Optimisation of Transmission Systems by Use of Phase Shifting Transformers. Ph.D. Thesis, Technical University of Delft, Delft, Belgium, 2008. [Google Scholar]
- Jing, W.; Yong, T.; Chang, X.; Xinglei, C.; Yi, W.; Ning, A. Research on Power Flow Algorithm of Power System with UPFC. In Proceedings of the International Conference on Power System Technology, Guangzhou, China, 6–8 November 2018. [Google Scholar]
- Kohan, V.; Conka, Z.; Kolcun, M.; Karabinos, M.; Havran, P.; Stefko, R.; Tailor, R.J. Use of Flexible Alternating Current Transmission System to improve power system operation—Damping oscilation and power flow control. In Proceedings of the IEEE 4th International Conference and Workshop in Óbuda on Electrical and Power Engineering, Budapest, Hungary, 17–18 November 2021. [Google Scholar]
- Relić, F.; Marić, P.; Glavaš, H.; Petrović, I. Influence of FACTS Device Implementation on Performance of Distribution Network with Integrated Renewable Energy Sources. Energies 2020, 13, 5516. [Google Scholar] [CrossRef]
- Kramer, A.; Ruff, J. Transformers for phase angle regulation considering the selection of on-load tap-changers. IEEE Trans. Power Deliv. 1998, 13, 518–525. [Google Scholar] [CrossRef]
- Robbins, B.A.; Zhu, H.; Dominguez-Garcia, A.D. Optimal Tap Settings of Voltage Regulation Transformers in Unbalanced Distribution Systems. IEEE Trans. Power Syst. 2016, 31, 256–267. [Google Scholar] [CrossRef]
- Przygrodzki, M.; Rzepka, P.; Szablicki, M. Application of Voltage-regulating and Phase Shifting Transformers to Control Power Flows in the Power System. Acta Energetica 2015, 4, 87–93. [Google Scholar] [CrossRef]
- Albrechtowicz, P. Zastosowanie Przesuwników Fazowych do Regulacji Rozpływów Mocy w Systemach Elektroenergetycznych. Ph.D. Thesis, Cracow University of Technology, Cracow, Poland, 2022. [Google Scholar]
- Machowski, J.; Lubośny, Z. Stabilność Systemu Elektroenergetycznego, 1st ed.; Wydawnictwo Naukowe PWN S.A.: Warsaw, Poland, 2018. [Google Scholar]
- European Network of Transmission System Operators for Electricity. Phase Shift Transformers Modelling; ENTSOE: Brussels, Belgium, 2014. [Google Scholar]

| Value | Values of Individual Quantities Depending on the Adopted Scenario Setting the Transformer Regulation Parameters | |||||
|---|---|---|---|---|---|---|
| Scenario | S0 | S1 | S2 | S3 | S4 | |
| PT | MW | 120.2 | −255.9 | 411.4 | 496.7 | −175.1 |
| β | % | 46.0 | 83.0 | 158.0 | 156.0 | 109.0 |
| Scenario Difference | - | S1–S0 | S2–S0 | S3–S0 | S4–S0 | |
| ΔPT | % | - | −312.8 | 242.1 | 313.0 | −245.6 |
| Δβ | % | - | 37.0 | 112.0 | 110.0 | 63.0 |
| Node No. (Starting) | Node No. (End) | Rij pu | Xij pu | pu |
|---|---|---|---|---|
| 1 | 2 | 0.090 | 0.380 | j0.020 |
| 1 | 5 | 0.150 | 0.550 | j0.030 |
| 2 | 3 | 0.300 | 0.750 | j0.025 |
| 2 | 5 | 0.097 | 0.410 | j0.020 |
| 3 | 4 | 0.120 | 0.510 | j0.015 |
| 4 | 5 | 0.100 | 0.450 | j0.020 |
| Node | Type | Voltage U | Phase Angle | Generator Pi | Generator Qi | Load Pi | Load Qi |
|---|---|---|---|---|---|---|---|
| pu | deg. | MW | MVar | MW | MVar | ||
| 1 | Uδ | 1.1 | 0 | 72.18 | 47.03 | 0 | 0 |
| 2 | PQ | 0.981 | −6.335 | 0 | 0 | −50 | −10 |
| 3 | PQ | 1.048 | 3.773 | 65 | 16.79 | 0 | 0 |
| 4 | PQ | 0.937 | −6.896 | 0 | 0 | −35 | −10 |
| 5 | PQ | 0.946 | −8.098 | 0 | 0 | −45 | −15 |
| Line Number | Series Line Admittance | One-Side Shunt Line Admittance | Node No. | Ground Admittance |
|---|---|---|---|---|
| i–j | pu | pu | i | pu |
| 1–2 | 0.590163–j2.491803 | j0.020 | 1 | j0.050 |
| 1–5 | 0.461538–j1.692307 | j0.030 | 2 | j0.065 |
| 2–3 | 0.459770–j1.149425 | j0.025 | 3 | j0.040 |
| 2–5 | 0.546511–j2.309742 | j0.020 | 4 | j0.035 |
| 3–4 | 0.437158–j1.857923 | j0.015 | 5 | j0.070 |
| 4–5 | 0.470588–j2.117647 | j0.020 |
| Node No. | Type | Voltage U | Phase Angle | Generator Pi | Generator Qi | Load Pi | Load Qi |
|---|---|---|---|---|---|---|---|
| pu | deg. | MW | MVar | MW | MVar | ||
| 1 | Uδ | 1.06 | 0.86 | 1.6 | 44.98 | 0 | 0 |
| 2 | PQ | 1.04 | 0 | 120 | −4.1 | 21.7 | 12.7 |
| 3 | PQ | 1.02 | −0.52 | 95 | 0 | 94.2 | 19 |
| 4 | PQ | 1.02 | −1.88 | 0 | 0 | 47.8 | −3.9 |
| 5 | PQ | 1.02 | −1.91 | 0 | 0 | 7.6 | 1.6 |
| 6 | PQ | 1.07 | −2.37 | 25 | 7.03 | 11.2 | 7.5 |
| 7 | PQ | 1.06 | −3.66 | 0 | 0 | 0 | 0 |
| 8 | PQ | 1.09 | −4.41 | 20 | 16.29 | 0 | 0 |
| 9 | PQ | 1.05 | −5.39 | 0 | 0 | 29.5 | 16.6 |
| 10 | PQ | 1.05 | −5.28 | 0 | 0 | 9 | 5.8 |
| 11 | PQ | 1.05 | −5.11 | 0 | 0 | 3.5 | 1.8 |
| 12 | PQ | 1.05 | −5.44 | 0 | 0 | 6.1 | 1.6 |
| 13 | PQ | 1.05 | −5.55 | 0 | 0 | 13.5 | 5.8 |
| 14 | PQ | 1.03 | −6.42 | 0 | 0 | 14.9 | 5 |
| Line Number | Series Line Admittance |
|---|---|
| i–j | pu |
| 1–2 | 5.00–j15.26 |
| 1–5 | 1.03–j4.23 |
| 2–3 | 1.14–j4.78 |
| 2–4 | 1.69–j5.12 |
| 2–5 | 1.70–j5.19 |
| 3–4 | 1.99–j5.07 |
| 4–5 | 6.84–j21.58 |
| 4–7 | –j4.89 |
| 4–9 | –j1.86 |
| 5–6 | –j4.26 |
| 6–11 | 1.96–j4.09 |
| 6–12 | 1.53–j3.18 |
| 6–13 | 3.10–j6.10 |
| 7–8 | –j5.68 |
| 7–9 | –j9.09 |
| 9–10 | 3.9–j10.37 |
| 9–14 | 1.42–j3.03 |
| 10–11 | 1.88–j4.40 |
| 12–13 | 2.49–j2.25 |
| 13–14 | 1.11–j2.31 |
| Algorithm Step | Step Description |
|---|---|
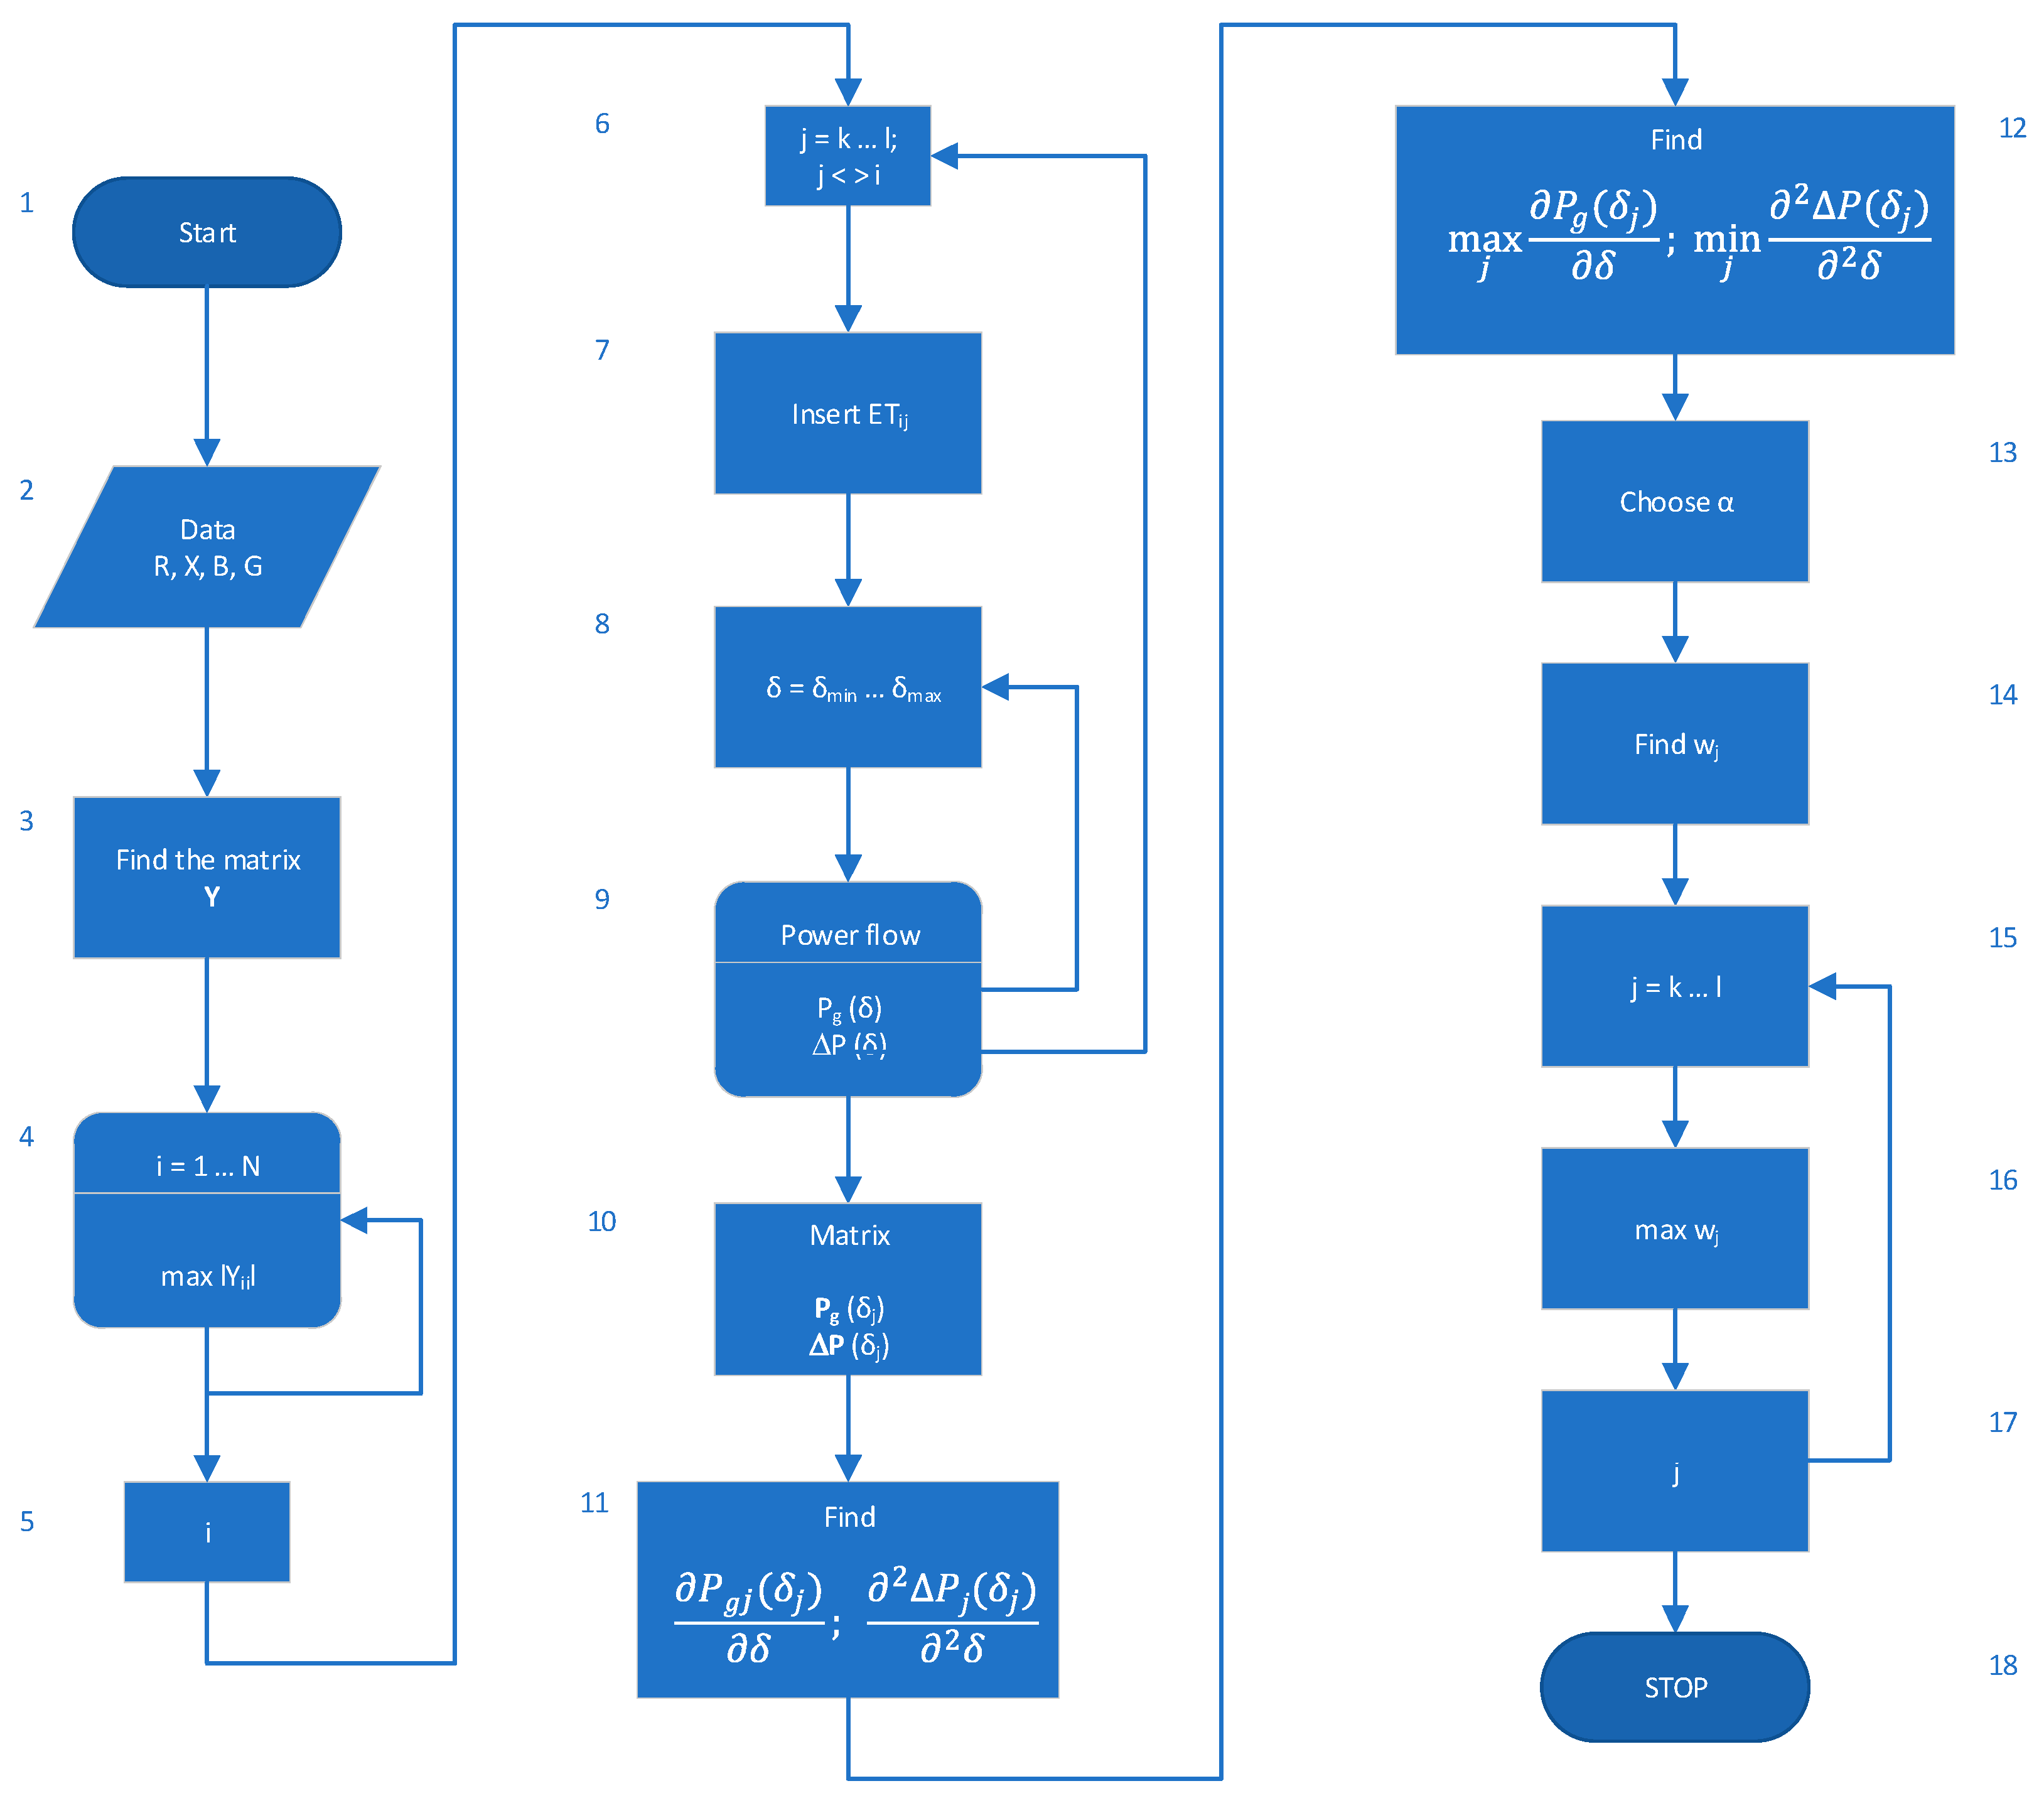
| 1 | Start—the beginning of the analysis; |
| 2 | Enter branch data—the parameters of R, X, B, and G network system elements are taken into account. The analysis assumed the full model of network elements in the form of a ∏-equivalent; |
| 3 | Determine the Y matrix—on the basis of the given elements, the nodal admittance matrix of the tested network system is determined. This matrix is created from definition (1) by summing up the parameters of the previously prepared Π-equivalents, respectively; |
| 4 | Max|Yii|—the diagonal element of the nodal admittance matrix with the largest absolute value is selected; |
| 5 | i—the index of the element with the highest absolute value that specifies the location of the transformer connection node; |
| 6 | j = k … l—the index of the node adjacent to the i-th node. The branch in which the extension transformer (ET) is analyzed is determined; |
| 7 | Insert ETij—a ET transformer is inserted into the selected branch “ij”. One should model ET as a ∏- equivalent on the basis of the dependence from Chapter 4.2; |
| 8 | δ = δmin … δmax—this determines the range of the regulation angle analysis. This angle may vary depending on the design of the transformer used or the guidelines of the power system operator; |
| 9 | Pg(δ) i ΔP(δ) flow—perform power flow using the Newton–Raphson method and calculate branch flows and total power losses in successive loops as a function of control angle δ; |
| 10 | Matrix Pg(δj), ΔP(δj)—matrices of the results obtained in step 9 are created; |
| 11 | Find and —using the values determined in step 10 and determine the first derivative of the branch flows with respect to the control angle δ and the second derivative power loss in relation to the control angle δ; |
| 12 | Find —for the results of step 11. The maximum change in branch flows among the considered ones, and the minimum value of the loss factor are determined. |
| 13 | Assume α—the weight between power flow flexibility and losses should be assumed:
|
| 14 | Determine —the required regulation coefficient should be determined, determining the suitability of a given location for the transformer for regulation while maintaining the weight of both component parameters according to the dependence: where , ; ; |
| 15, 16 | Determine —determine the control factor with the highest value in accordance with the relationship: |
| 17 | Determine node j—on the basis of the selected regulation coefficient, define node j. The selected node is also the end of the branch (branch ij) in which the regulating transformer should be connected. There is therefore a selected branch, ij, in which installing the ET meets the purpose of the algorithm. The goal is to maximize the transmission capacity of the system while keeping power losses at a low level. |
| 18 | Stop—end of analysis. |
| Features | Analytical Premises | Algorithmic Implementation |
|---|---|---|
| Versatility | It is necessary to keep the analysis simple and to standardize the calculations as much as possible. | The simplicity of the analysis results from the use of well-known calculation methods, such as the Newton-Raphson method for calculating power flows and power losses. The use of relative units also deters the algorithm from different voltages in the analyzed network. |
| Accuracy | It is necessary to apply the appropriate accuracy in calculations because, as a result of the implementation of the algorithm, a specific network branch in which ET should be used can be obtained. | The accuracy of the analysis is carried out by means of a detailed model of network elements, and thus an accurate mapping of the network topology is achieved using the admittance matrix, Y. |
Disclaimer/Publisher’s Note: The statements, opinions and data contained in all publications are solely those of the individual author(s) and contributor(s) and not of MDPI and/or the editor(s). MDPI and/or the editor(s) disclaim responsibility for any injury to people or property resulting from any ideas, methods, instructions or products referred to in the content. |
© 2023 by the authors. Licensee MDPI, Basel, Switzerland. This article is an open access article distributed under the terms and conditions of the Creative Commons Attribution (CC BY) license (https://creativecommons.org/licenses/by/4.0/).
Share and Cite
Żurek, S.; Przygrodzki, M. The Use of a Regulating Transformer for Shaping Power Flow in the Power System. Energies 2023, 16, 1548. https://doi.org/10.3390/en16031548
Żurek S, Przygrodzki M. The Use of a Regulating Transformer for Shaping Power Flow in the Power System. Energies. 2023; 16(3):1548. https://doi.org/10.3390/en16031548
Chicago/Turabian StyleŻurek, Szymon, and Maksymilian Przygrodzki. 2023. "The Use of a Regulating Transformer for Shaping Power Flow in the Power System" Energies 16, no. 3: 1548. https://doi.org/10.3390/en16031548