Article

The Use of a Regulating Transformer for Shaping Power Flow in the Power System

by
Szymon Żurek
1,* and
Maksymilian Przygrodzki
1,2
1
Department of Power System and Control, Faculty of Electrical Engineering, Silesian University of Technology, 44-100 Gliwice, Poland
2
PSE Innowacje Sp. z o.o., Al. Jerozolimskie 132, 02-305 Warsaw, Poland
*
Author to whom correspondence should be addressed.
Energies 2023, 16(3), 1548; https://doi.org/10.3390/en16031548
Submission received: 14 December 2022 / Revised: 16 January 2023 / Accepted: 19 January 2023 / Published: 3 February 2023
(This article belongs to the Special Issue Research on Power System Control and Optimization)

Abstract

:
The current situation in world energy requires a new approach to the control of the power flow in power systems. On the one hand, regulations within the EU require the transition to renewable energy. On the other hand, there are no conventional sources available. Thus, there is a need to use known control tools in non-standard applications. One such example is the use of a regulating transformer inside the power grid to use it to shape the power flow in the system. This article presents a proposal of an algorithm for determining new locations for regulating transformers from the point of view of active power control. By analyzing the parameters of the power grid, it is possible to determine which branch of the grid is the most suitable for installing a regulating transformer in it. The use of a regulating transformer inside the grid improves the transmission capabilities of the national power system.

1. Introduction

1.1. Planned and Unplanned Power Flows

The transformations in the power sector that have taken place in recent years have resulted in significant changes in the functioning of national power systems and cross-border connections in Central Europe. The reasons behind this lie in the liberalization of electricity markets and the large-scale integration of renewable sources. One of the main effects of these changes is the increase in unplanned compensatory flows of active power between interconnected systems (also known as loop flows). These flows primarily reduce the operational security of interconnected national power systems, reduce the transmission capacity of cross-border connections made available to electricity market participants, and increase transmission losses. All of this worsens the economics of UCTE operation.
Unplanned flows adversely affect not only the entire interconnected UCTE system but also national power systems (NPS). Specifically, NPSs not only experience an increase in transmission losses but above all they experience significant overloads on network elements such as transmission lines and power transformers. As a result, there are also large voltage drops and, consequently, an increase in reactive power flows in power systems in order to align the voltage levels.
The increasing number of cases in which the safe operation conditions of an NPS in Europe is not maintained increases the risk of accidents with a wide scope. Hence, it is increasingly important for power system operators (TSO) (including the Polish TSO [1]) to control active power flows.
One method of power flow regulation is the use of phase-shifting transformers (PSTs). These are special transformers installed in power grids (most often on cross-border lines) which adjust the load angle of the network. This angle is the difference of the nodal voltage arguments at the beginning and end of the branch. The change load angle is determined by adjusting the ratio of these transformers. As a result of regulating the angle, it is possible to change the active power flow in the power system. Such regulation influences not only the change in active power in the network branches in which they are installed but also the power flows in their closer and more distant network neighborhood. Ratio adjustment in this type of transformer is possible through the use of an on-load tap changer (OLTC). This element is subjected to significant operational stress during tap changes. This affects its failure rate and thus can increase the failure rate of the entire transformer unit. Nevertheless, over the years, a proper procedure has been developed that helps to verify the technical condition of transformers. Current technology allows for the ongoing monitoring of the operating parameters of these devices (e.g., voltage, load current, winding temperatures, etc.), and time periods have been established after which appropriate service activities should be performed (e.g., oil tests, the inspection of the tap changer, silica gel replacement, winding insulation measurements, etc.). All these factors affect the failure-free operation of transformers with OLTCs for many years. Thus, TSOs are more and more willing to install such devices not only on cross-border lines but also inside NPSs.
In the Polish power system, transformers are widely used to connect networks with different voltage levels (i.e., 400 kV/220 kV, 220 kV/110 kV, and 400 kV/110 kV). Regulation needs lead to the widespread use of transformers with on-load voltage ratio regulation. In addition, in power substations that have specific technical and operational conditions, phase shifters connected in series with autotransformers are also used. The oldest devices of this type still in use dates from 1970. Figure 1 shows seven locations of regulating transformers with voltage and phase angle regulation.
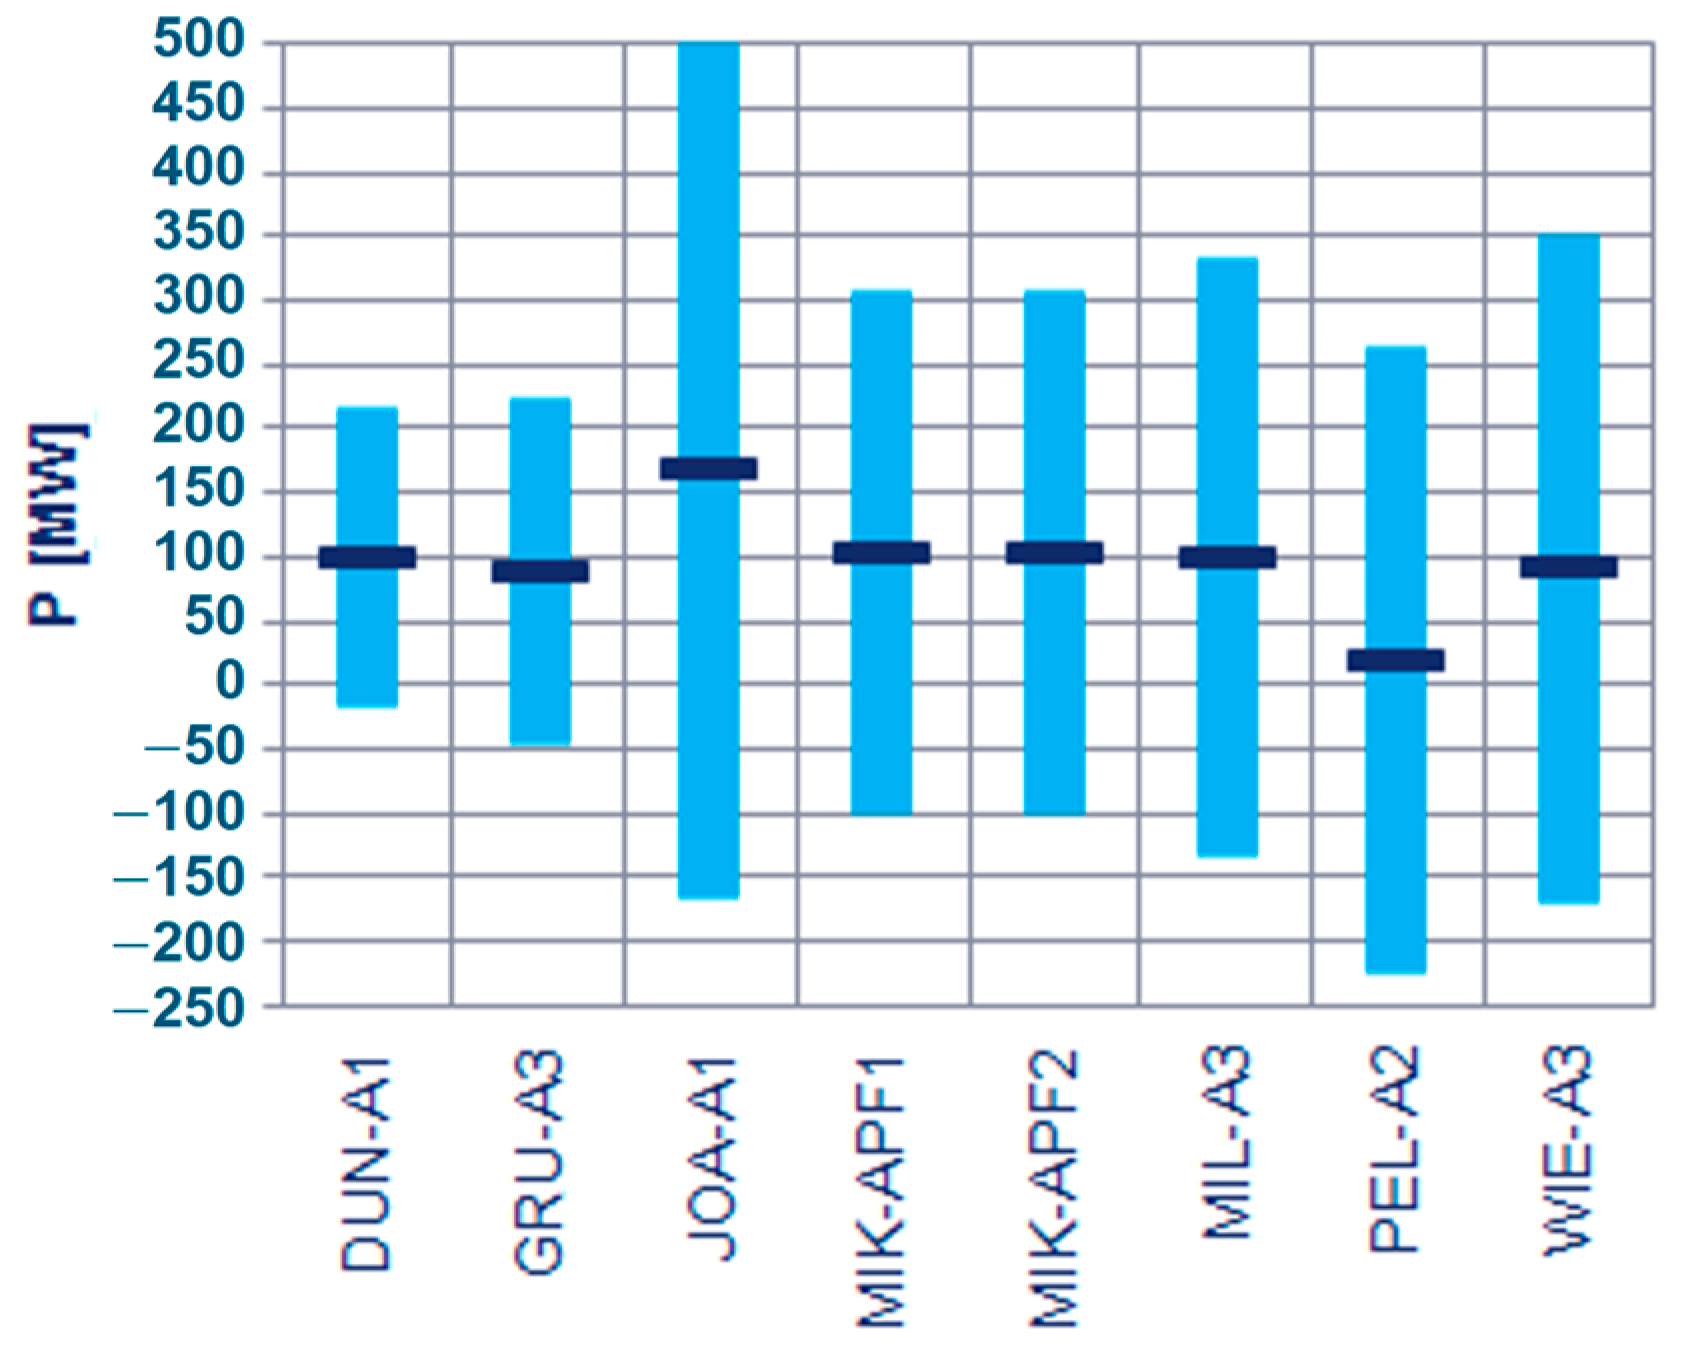
The use of this type of transformer unit allows for the availability of active power regulation in a wide range. By investigating their possibilities of use, the range of changes in power flows obtained by these transformers was obtained, with the results being shown in Figure 2.
The presented regulating possibilities (Figure 2) allows for the correction of power flows caused mainly by unscheduled flows, so-called transit and loop flows. The transformers reduce the risk of exceeding the long-term permissible load capacity and make it possible to limit the adjustments made to the work schedules of power plants.
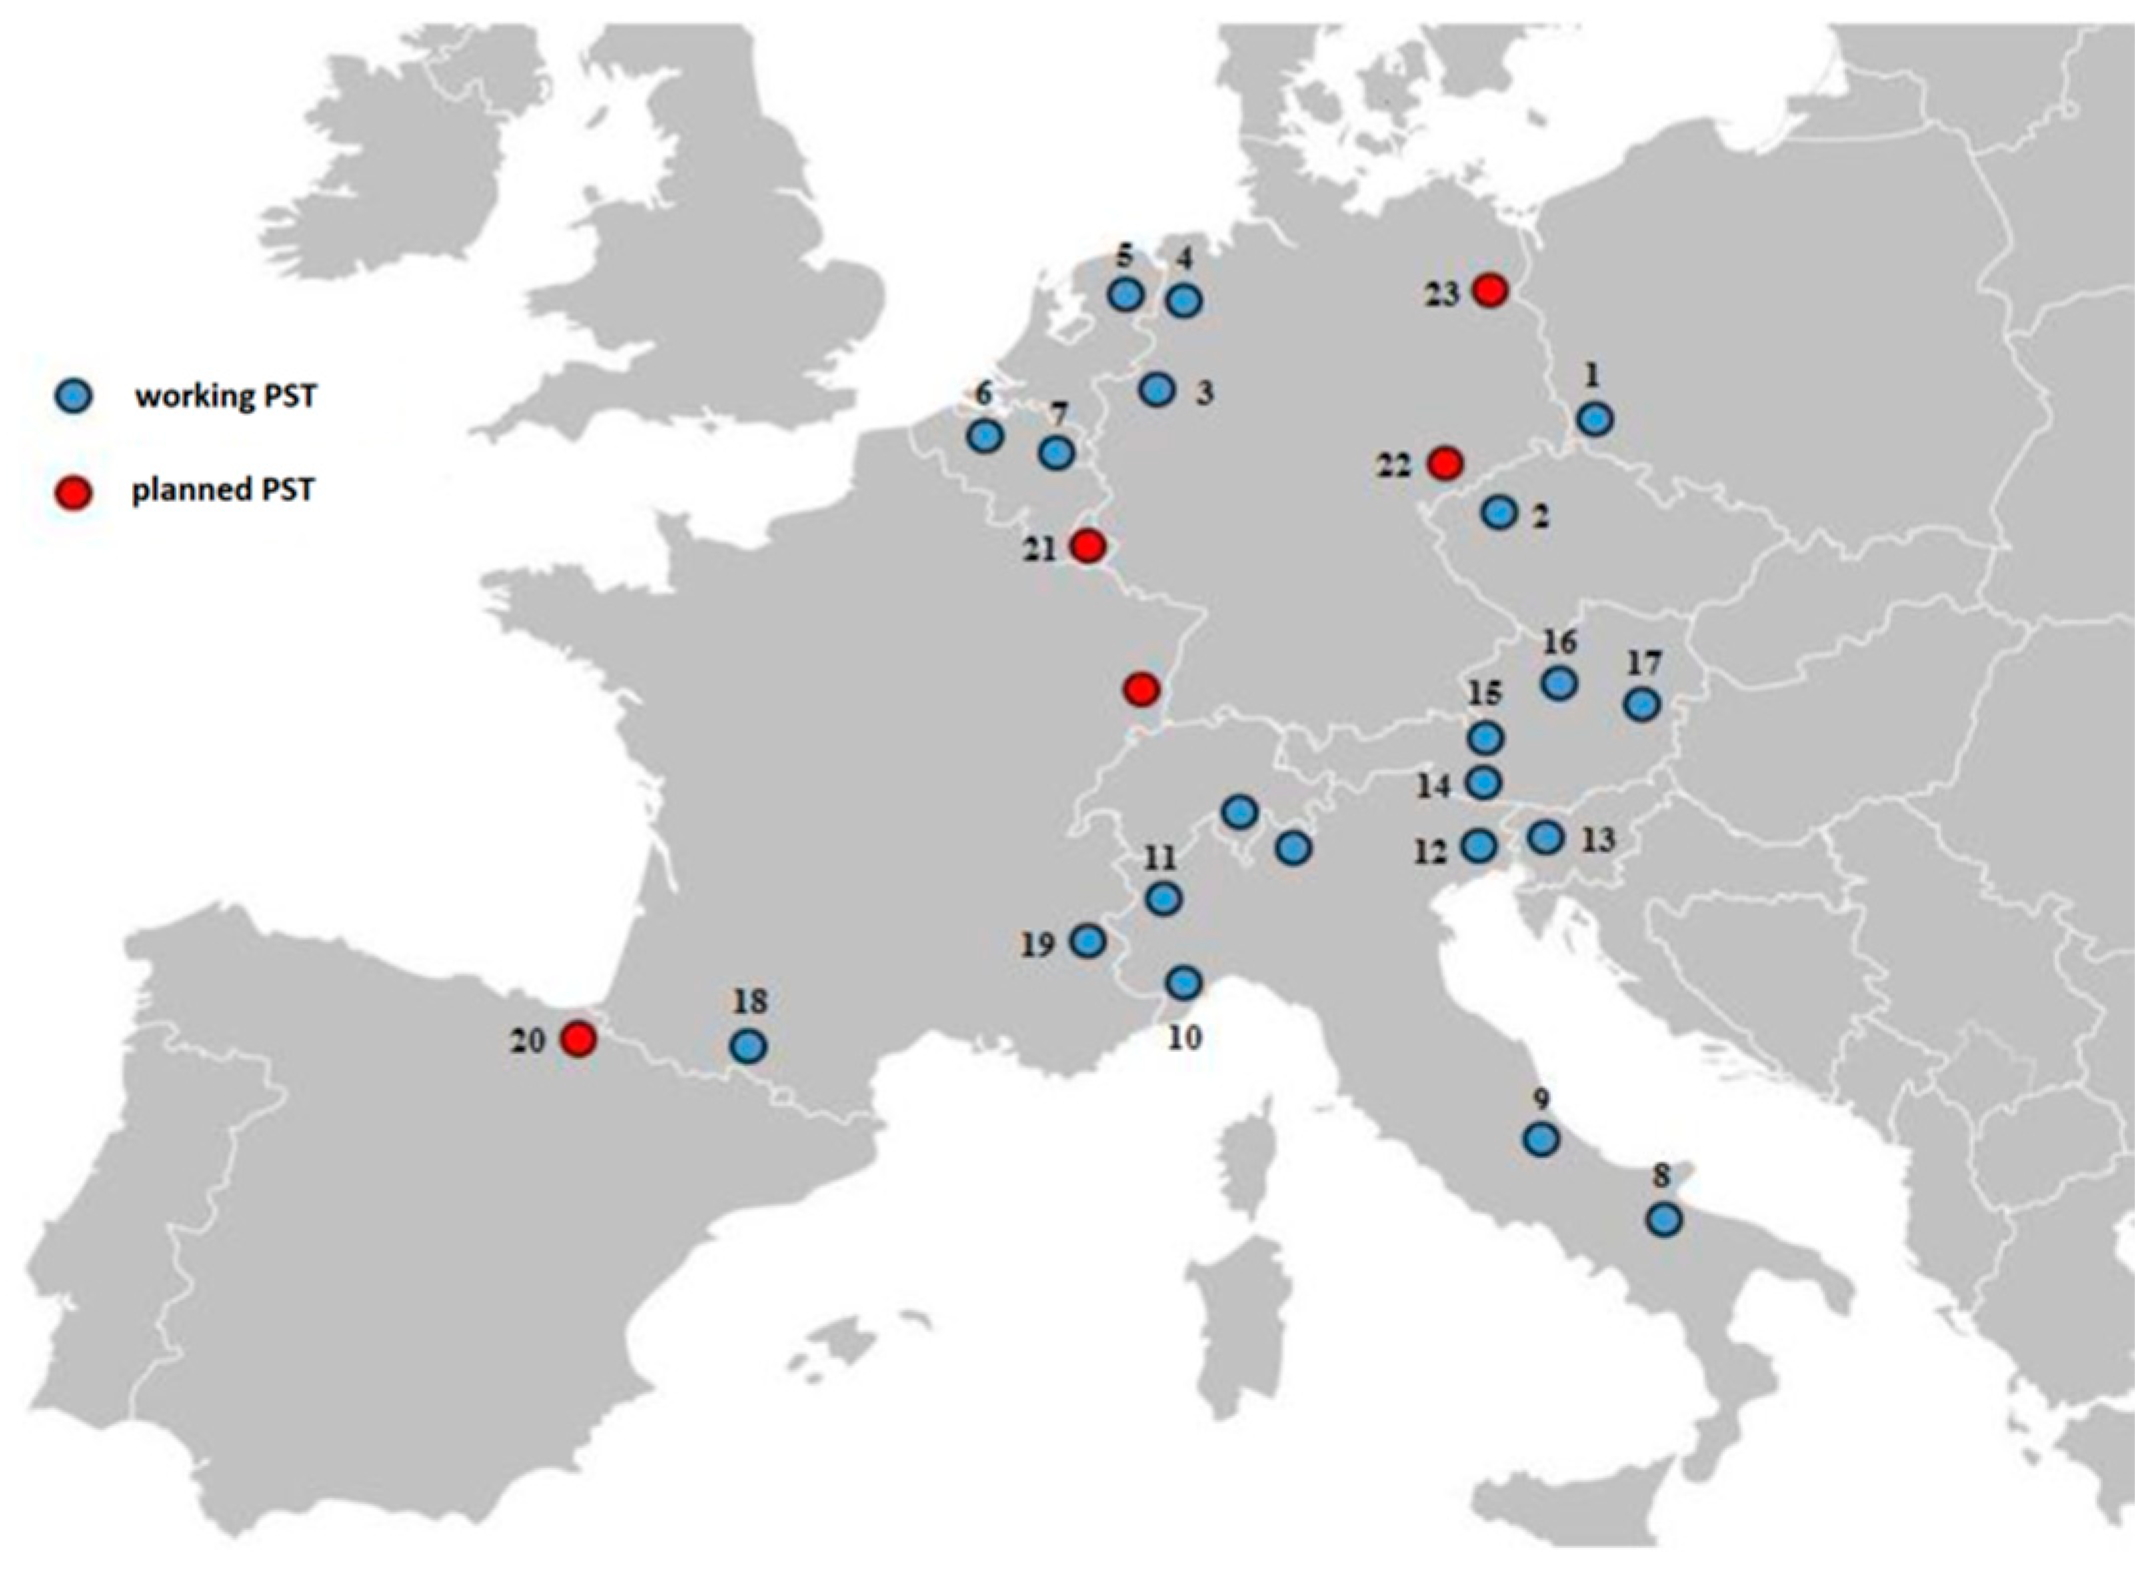
Loop flows and transit flows cause significant problems and not only within national networks. The operational capacity of the cross-border exchange line is deteriorating due to a significant reduction in (or the exhaustion of its) transmission capacity. Market transmission capacities are deteriorating, but emergency imports and exports of energy are also becoming impossible. To improve this situation, phase shifters with OLTC regulations are used on an increasing scale in the UCTE region (Figure 3). The use of this type of equipment is considered the preferred cost-free remedy (it does not change the cost of generation). Using only countermeasures, such as using a DC loop or redispatching, will not solve the problem. Figure 3 shows the location of the current (black) and future (red) PST installations in international strings.

1.2. Organization of the Research Problem

The process of planning the placement of regulating transformers and their regu-lation is complicated. Taking into account the technical limitations of transformers using on-load tap changers, it is possible to use such devices in a modern power system. These devices can be a basic cost-free countermeasure for correcting the flow of active power and maintaining voltage parameters. Chapter 2 of this article contains information on the regulation of active and reactive power in the power system. The background of scientific research on the issue under consideration is presented (based on a literature review), and the network parameters responsible for the change in power flow as well as the types of regulation used in transformers are determined. The structure and principle of operation of a regulating transformer are also presented. By limiting the subject of research to a transformer unit using voltage magnitude and phase angle regulation, Chapter 3 presents the possible effects in terms of control of the use of regulating transformers. The analyses were carried out according to data from the Polish power system. Then, Chapter 4 presents a mathematical analysis of the parameters of the power system with the aim of obtaining an algorithm that determines the location of new regulating transformers in the NPS. Chapter 4 presents three examples that illustrate the control method and the effects of regulation in a test system. The parameters of the test system are first described, followed by subsequent cases with conclusions. Chapter 5 of the article contains an algorithm with which it is possible to determine the most advantageous location of a regulatory transformer in the system. The article ends with a summary.

2. Power Flow Regulation

The increasing number of renewable sources (RESs) [1,2,3,4,5] that depend on the weather conditions inside an NPS change the power balance structure and affect the geographical distribution of generation sources. In the case of Poland, most conventional generation sources are located in central or southern Poland. Such a system forces power flows from the south to the north of the country. The development of RESs changes the directions of power flow. On days with high RES generation, the transmission network operates in unfavorable conditions with a small safety margin. Moreover, on days with a large gradient of wind generation changes, the directions of power flow in the PS change in a way that is difficult to predict. This has a negative impact on compliance with the basic criterion of occupational safety of PSs, the so-called N-1 criterion [6,7,8]. This criterion ensures such a safety margin that in the event of switching off any of the PPS components (a line, transformer, busbar section, or generator, etc.), the remaining elements in operation can take the load of the switched-off element without violating technical limitations. Otherwise, cascading shutdowns of successive NPS elements may occur, leading in extreme cases to a catastrophic failure (blackout).
The problem of power flow in power system is the basic problem of many scientific studies [6,9,10,11,12,13,14,15,16,17,18,19]. Due to economic and legal conditions in the field of renewable energy sources, there is a growing interest in the problem of unplanned power flows in the UCTE system. These flows were described in [19,20]. Unplanned power flows are called loop flows. They cause unplanned transfers of active power not only on international exchange lines but above all on internal lines of individual power systems included in the UCTE. In order to limit these power transfers, the operators of individual countries take a number of remedial measures. The undertaken remedial actions are described in [21]. One solution is the use of phase shifters connected in series in international lines [22]. Phase-shifting transformers are a special type of regulating transformer and are described in [11,23,24,25,26,27,28,29,30,31,32,33]. A description of the parameters of regulating transformers, their construction, and their principles of operation can be found in [9,11,23,24,25,32]. The literature on the subject is supplemented by a number of standards issued by the international scientific community of the IEEE Power and Energy Society. The most important publications describing the properties of power transformers for power flow control in NPSs are [15,24,25,26,34,35]. Most authors focus on presenting the issue of power flows in the context of the reduction in circular flows in the UCTE. The most important items on this topic include numerous publications by Jody Verboomen [12,13,27,36,37,38,39]. In [27], the authors provide an overview of existing technologies for phase-shifter transformers. The classification of PST devices is also introduced in [27], and a digital model is presented which makes it possible to demonstrate the advantages of PST in a real-time simulator. The authors of [36] provide a diagram of the PST control system which allows for the even loading of cross-border connections. In [20,37], the authors describe a method of optimizing the PST setting using the particle swarm method. Optimization leads to the achievement of specific operating points that fulfil the given objective function. This function determines the minimum balancing cost, the minimum circular flows, the minimum losses in the transmission network, and can ensure the largest possible margin in terms of permissible long-term load. Another important publication is [15]. That study defines the conditions for optimizing power flows assuming the high saturation of the grid with photovoltaic (PV) installations. The method demonstrates the possibility of calculating the LPS index that allows for the calculation of changes in the power flow on the line based on the PST phase shift angles. The most recent publications on this topic include [18]. This publication specifies methods for optimizing the tap settings of regulating transformers and estimates the costs of using PSTs in comparison to alternative methods. One alternative method to control the power distribution is the use of FACTS devices [40,41,42]. Thanks to the use of power electronics, these devices have much better dynamic properties (faster and smooth regulation), at the expense of increasing the complexity of the control system and the investment cost.
Most of the available publications define the method of optimizing PST settings installed on international exchange lines [12,13,14,15,16,17,27,28,36,37,38,43]. Due to the regional nature of the described loop flows and their impact on the Polish NPS, few people have noticed the described problem. For this reason, there is a lack of publications in the literature that define the behavior and methods for optimizing the arrangement of phase shifters installed “inside” the NPS. Therefore, there is a need to perform an algorithm for selecting the location of the regulating transformer to meet the selected optimization criterion.

2.1. Parameters of Power Flow Change

In transmission networks, the control of active power flows consists of changing the flow without changing the total generated power. The relationship is used here, which determines the flow of active power through a single inductive transmission line [23]:
P i j = U i U j X i j sin ( δ i j ) ,
where:
  • P i j —the active power at the end of the line ij;
  • U i , U j —the phase voltage modules at the beginning (i) and at the end (j) of the line;
  • δ i j —the load angle (difference of the bus voltage arguments at the beginning and end of the line, δ i j = δ i δ j );
  • X i j —the line reactance ij.
Equation (1) shows that the active power flowing in the transmission line can be changed by changing the nodal voltages Ui and Uj, the reactance value, Xij, and load angle, δij. The possibilities of changing the active power by changing the node voltages are small because these voltages must be close to the rated value and cannot be changed in a wide range. Much greater possibilities in terms of changing the active power flow are provided by changing the reactance of the transmission line by using so-called series compensation [23]. However, the most effective way of changing the active power (from negative to positive values) is by adjusting the load angle, δij.

2.2. Transformer Regulation: Voltage Magnitude and Phase Angle

One of the basic devices used to regulate the energy parameters is a transformer or a transformer set with transmission ratio regulation. The regulation is made by changing the position of the tap-changer. This results in a step change in the transmission ratio of the transformer/transformer set. In high-power transformers, the regulation is performed without disconnecting the transformer from the network, i.e., under load. Transformers equipped with systems for changing the transmission ratio under load are often called regulating transformers because the regulating process can be carried out by appropriate changes in the transmission ratio of these transformers. The types of regulation that can be carried out by means of a regulating transformer depend on the design properties of the transformer/transformer set (and its role in the power system). In practice, regulating transformers can be used in the process of regulating the voltage, reactive power, and active power [44].
The following types of control can be realized by transformers [45]:
  • voltage magnitude regulation (in-phase transformers, autotransformers);
  • phase angle regulation (phase-shifting transformers);
  • voltage magnitude and phase angle regulation (complex regulation).
Complex regulation enables the voltage module and the voltage phase angle to be adjusted. It can be implemented in two ways [20,23,25,46,47]:
  • separately—in the case of such solutions, voltage magnitude regulation is usually performed on the main unit (in-phase transformer or autotransformer) of the regulation transformer, while phase angle regulation is performed on the phase-shifting transformer; both types of regulation mentioned can be performed separately/independently (i.e., the regulation of a given voltage parameter–modulus or phase angle–does not change the second voltage parameter);
  • combined (dependent voltage magnitude and phase angle regulation)–voltage magnitude and phase angle regulation are performed on the in-phase transformer with q connected phase-shifting transformer on the third winding; both types of regulation are performed interdependently (i.e., the regulation of one voltage parameter–modulus or phase angle–changes the other voltage parameter).
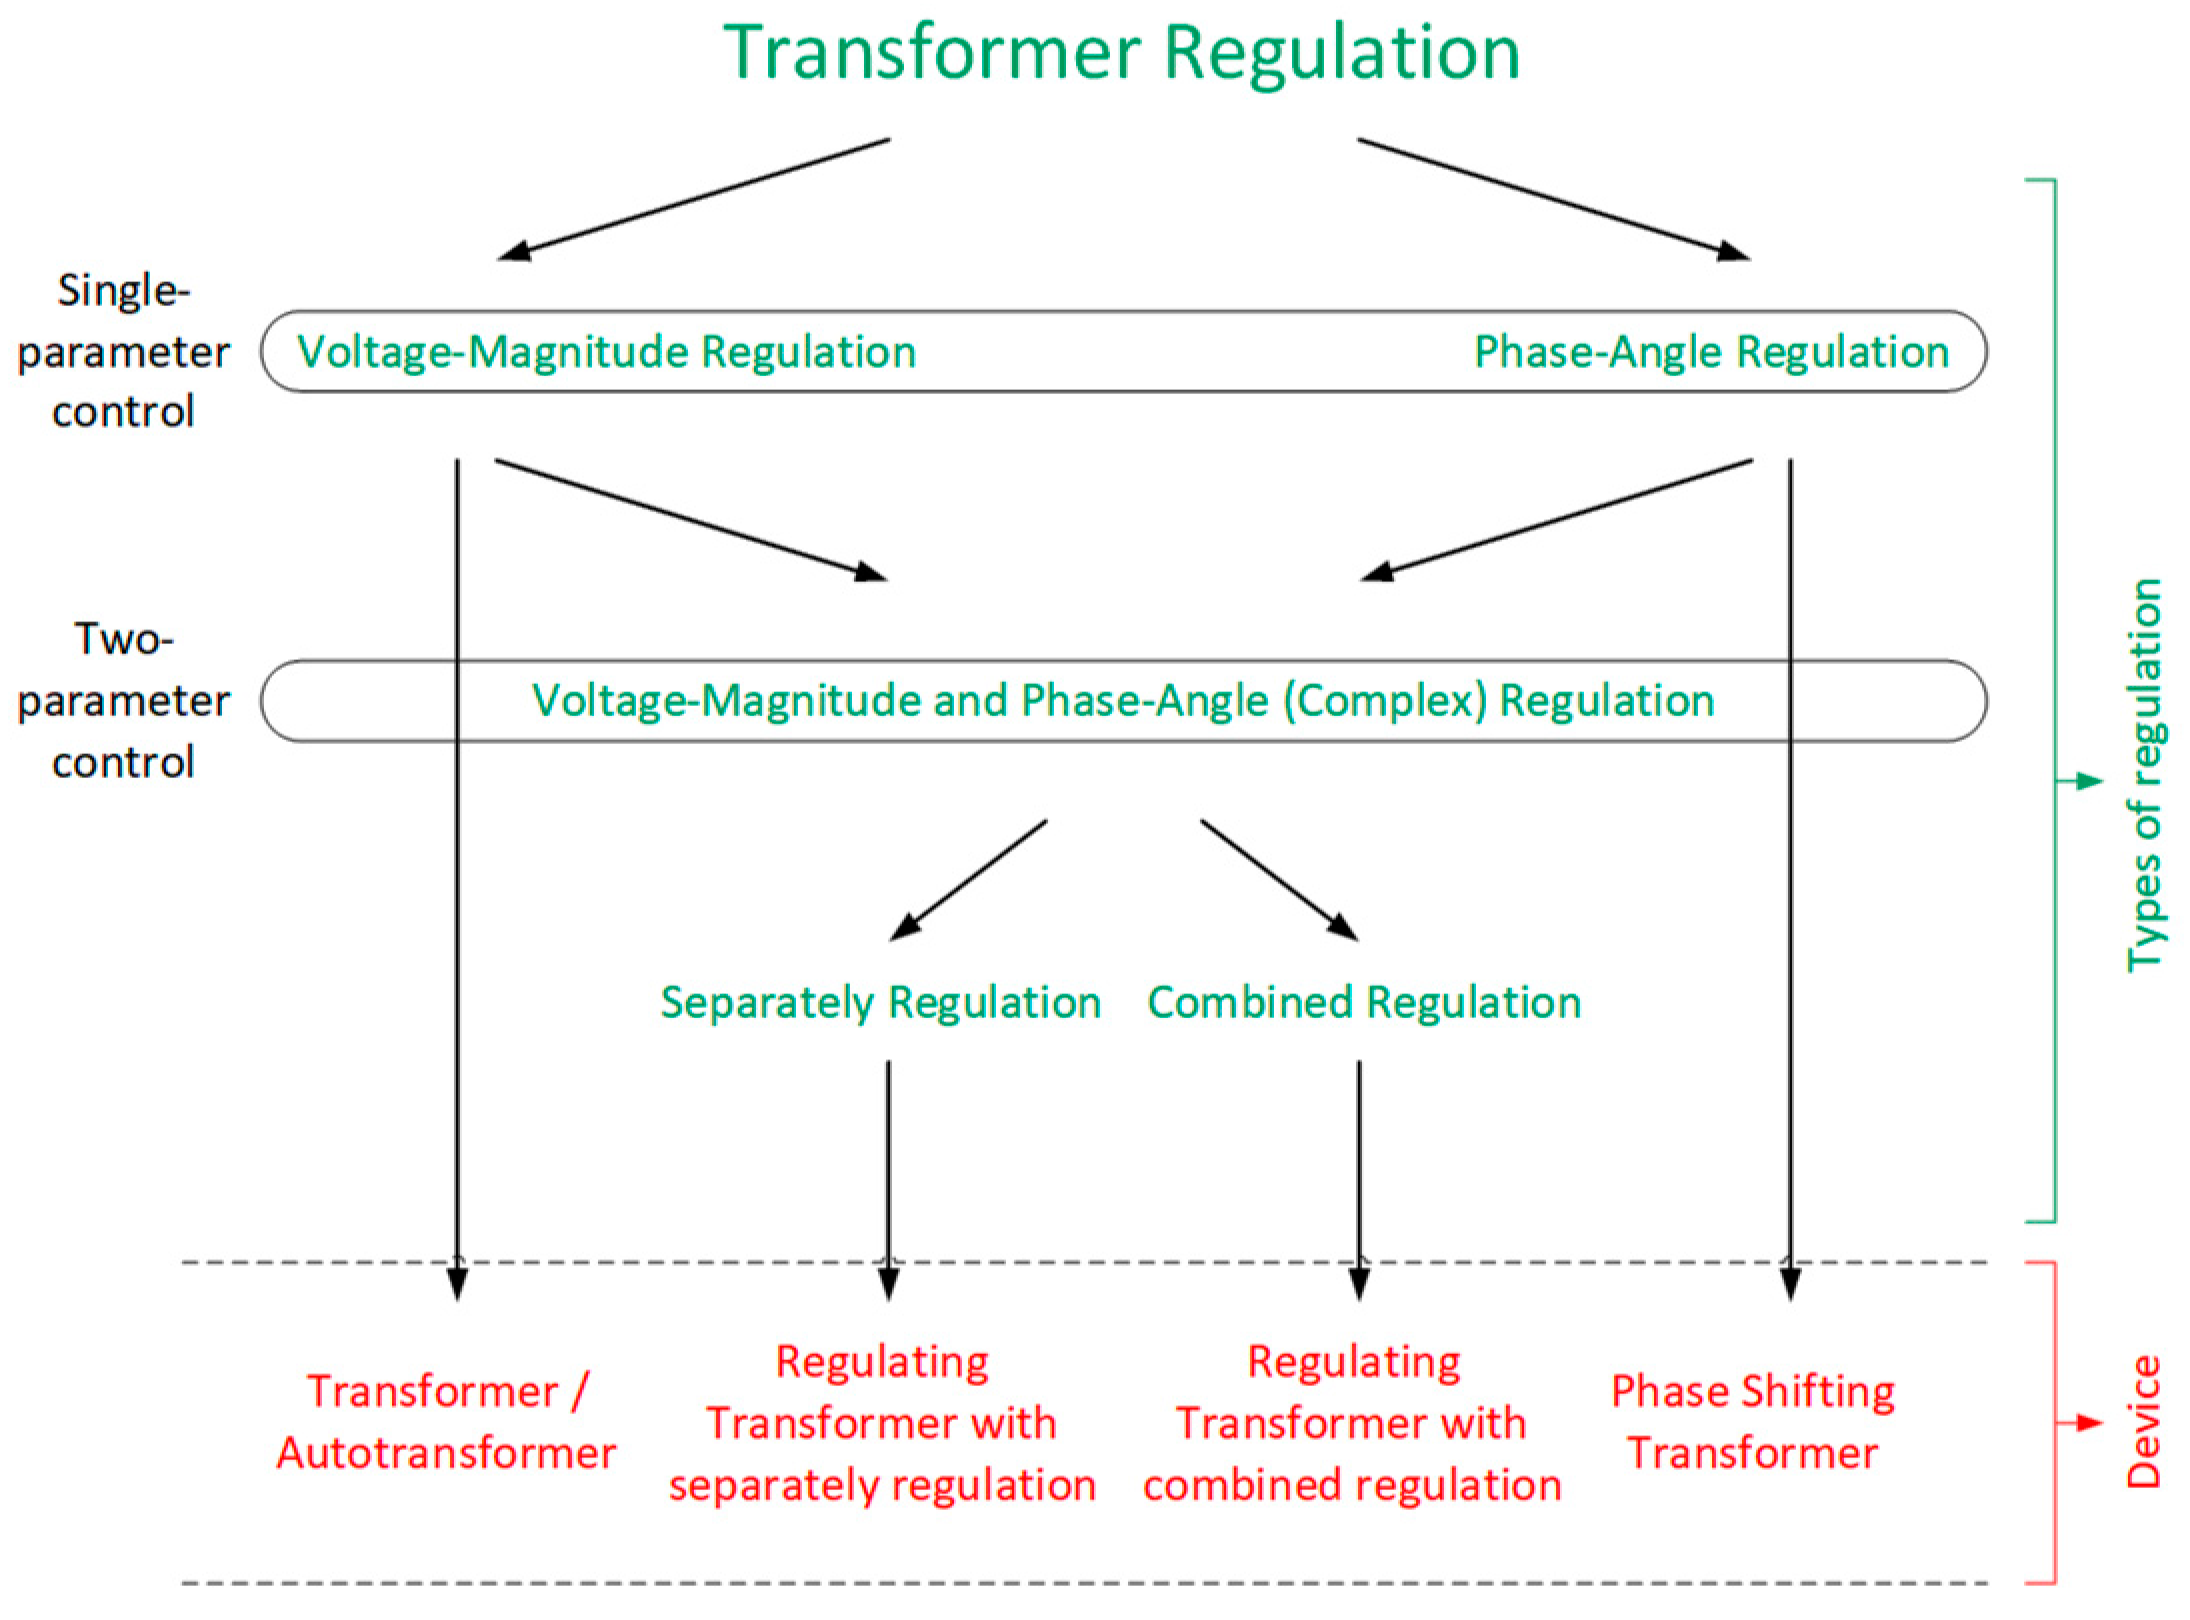
The assignment of the presented types of regulation to electric power devices that enable the implementation of voltage magnitude regulation, phase angle regulation, and complex regulation is presented in Figure 4. The devices that perform voltage magnitude regulation (voltage module regulation) are transformers and autotransformers with the on-load adjustment of transformer taps. Phase-shifting transformers are designed to perform only phase angle regulation (the regulation of the voltage phase angle). On the other hand, voltage magnitude and phase angle regulation (the adjustment of the module and the phase angle of the voltage) is possible thanks to regulating transformer units consisting of a main unit (a transformer with the on-load adjustment of transformer taps) and a phase-shifting transformer.

2.3. Regulating Transformer

The types of regulation that can be implemented with a given transformer/transformer set depend, among others, on its design features [23,24,25]. In terms of construction, regulating transformers may differ, inter alia, in terms of the number of taps, the location and method of making the tap changer, the number of transformers included in the transformer unit, and the method of connecting these transformers.
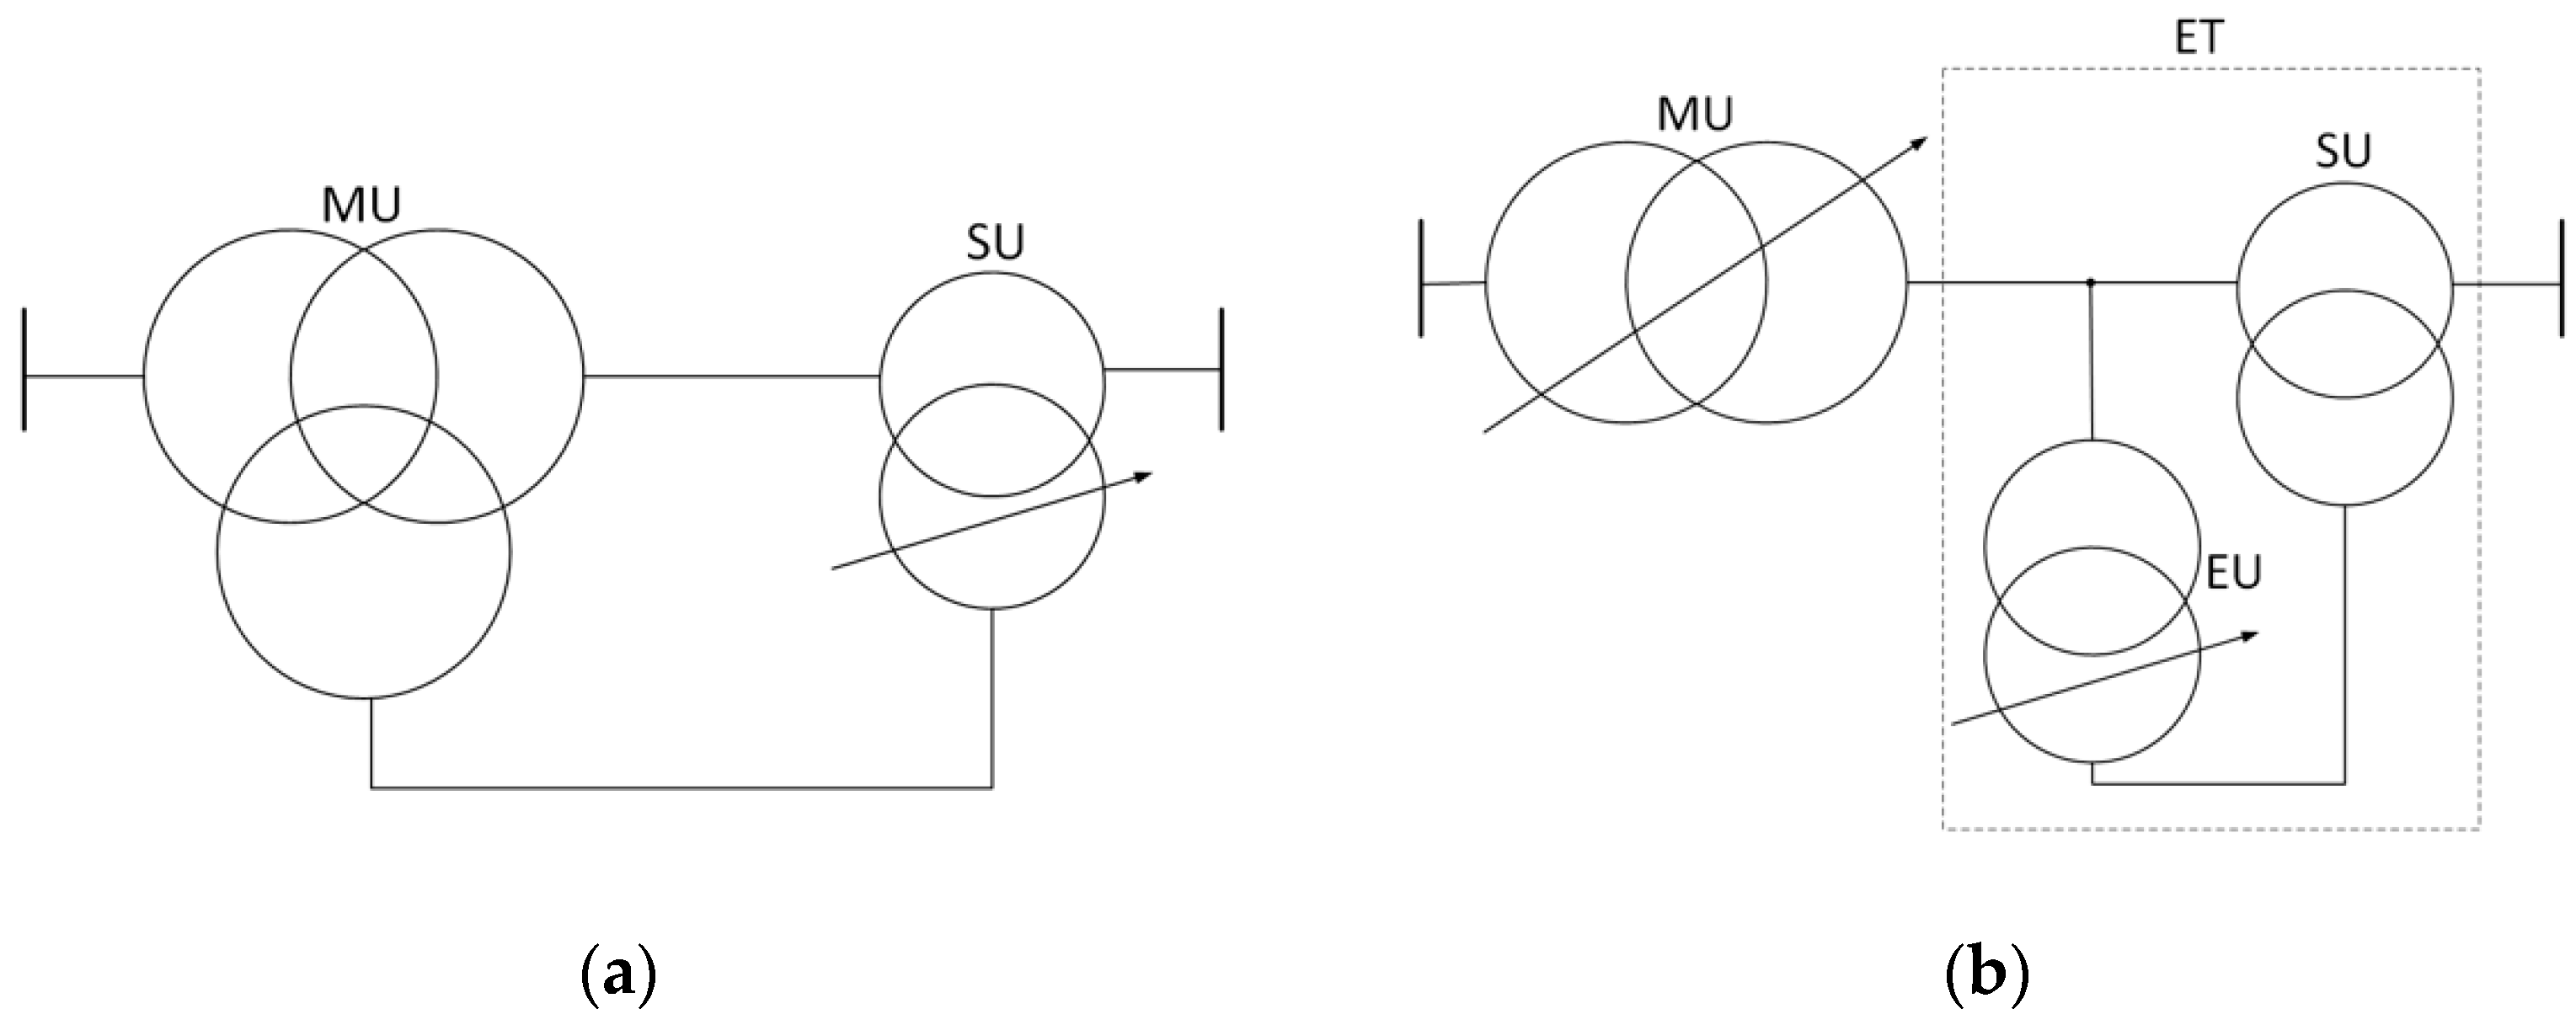
Figure 5 shows exemplary schematic diagrams of regulating transformers (RT) enabling voltage magnitude and phase angle regulation. These transformers are most often made in the form of transformer units consisting of a main unit (MU) and a phase-shifting unit (PST). The main unit is a transformer (or auto-transformer) that interfaces networks with different voltage ratings. The extension transformer (ET), depending on the version, may consist of one or two transformers: a series transformer (SU) and an exciting transformer (EU).
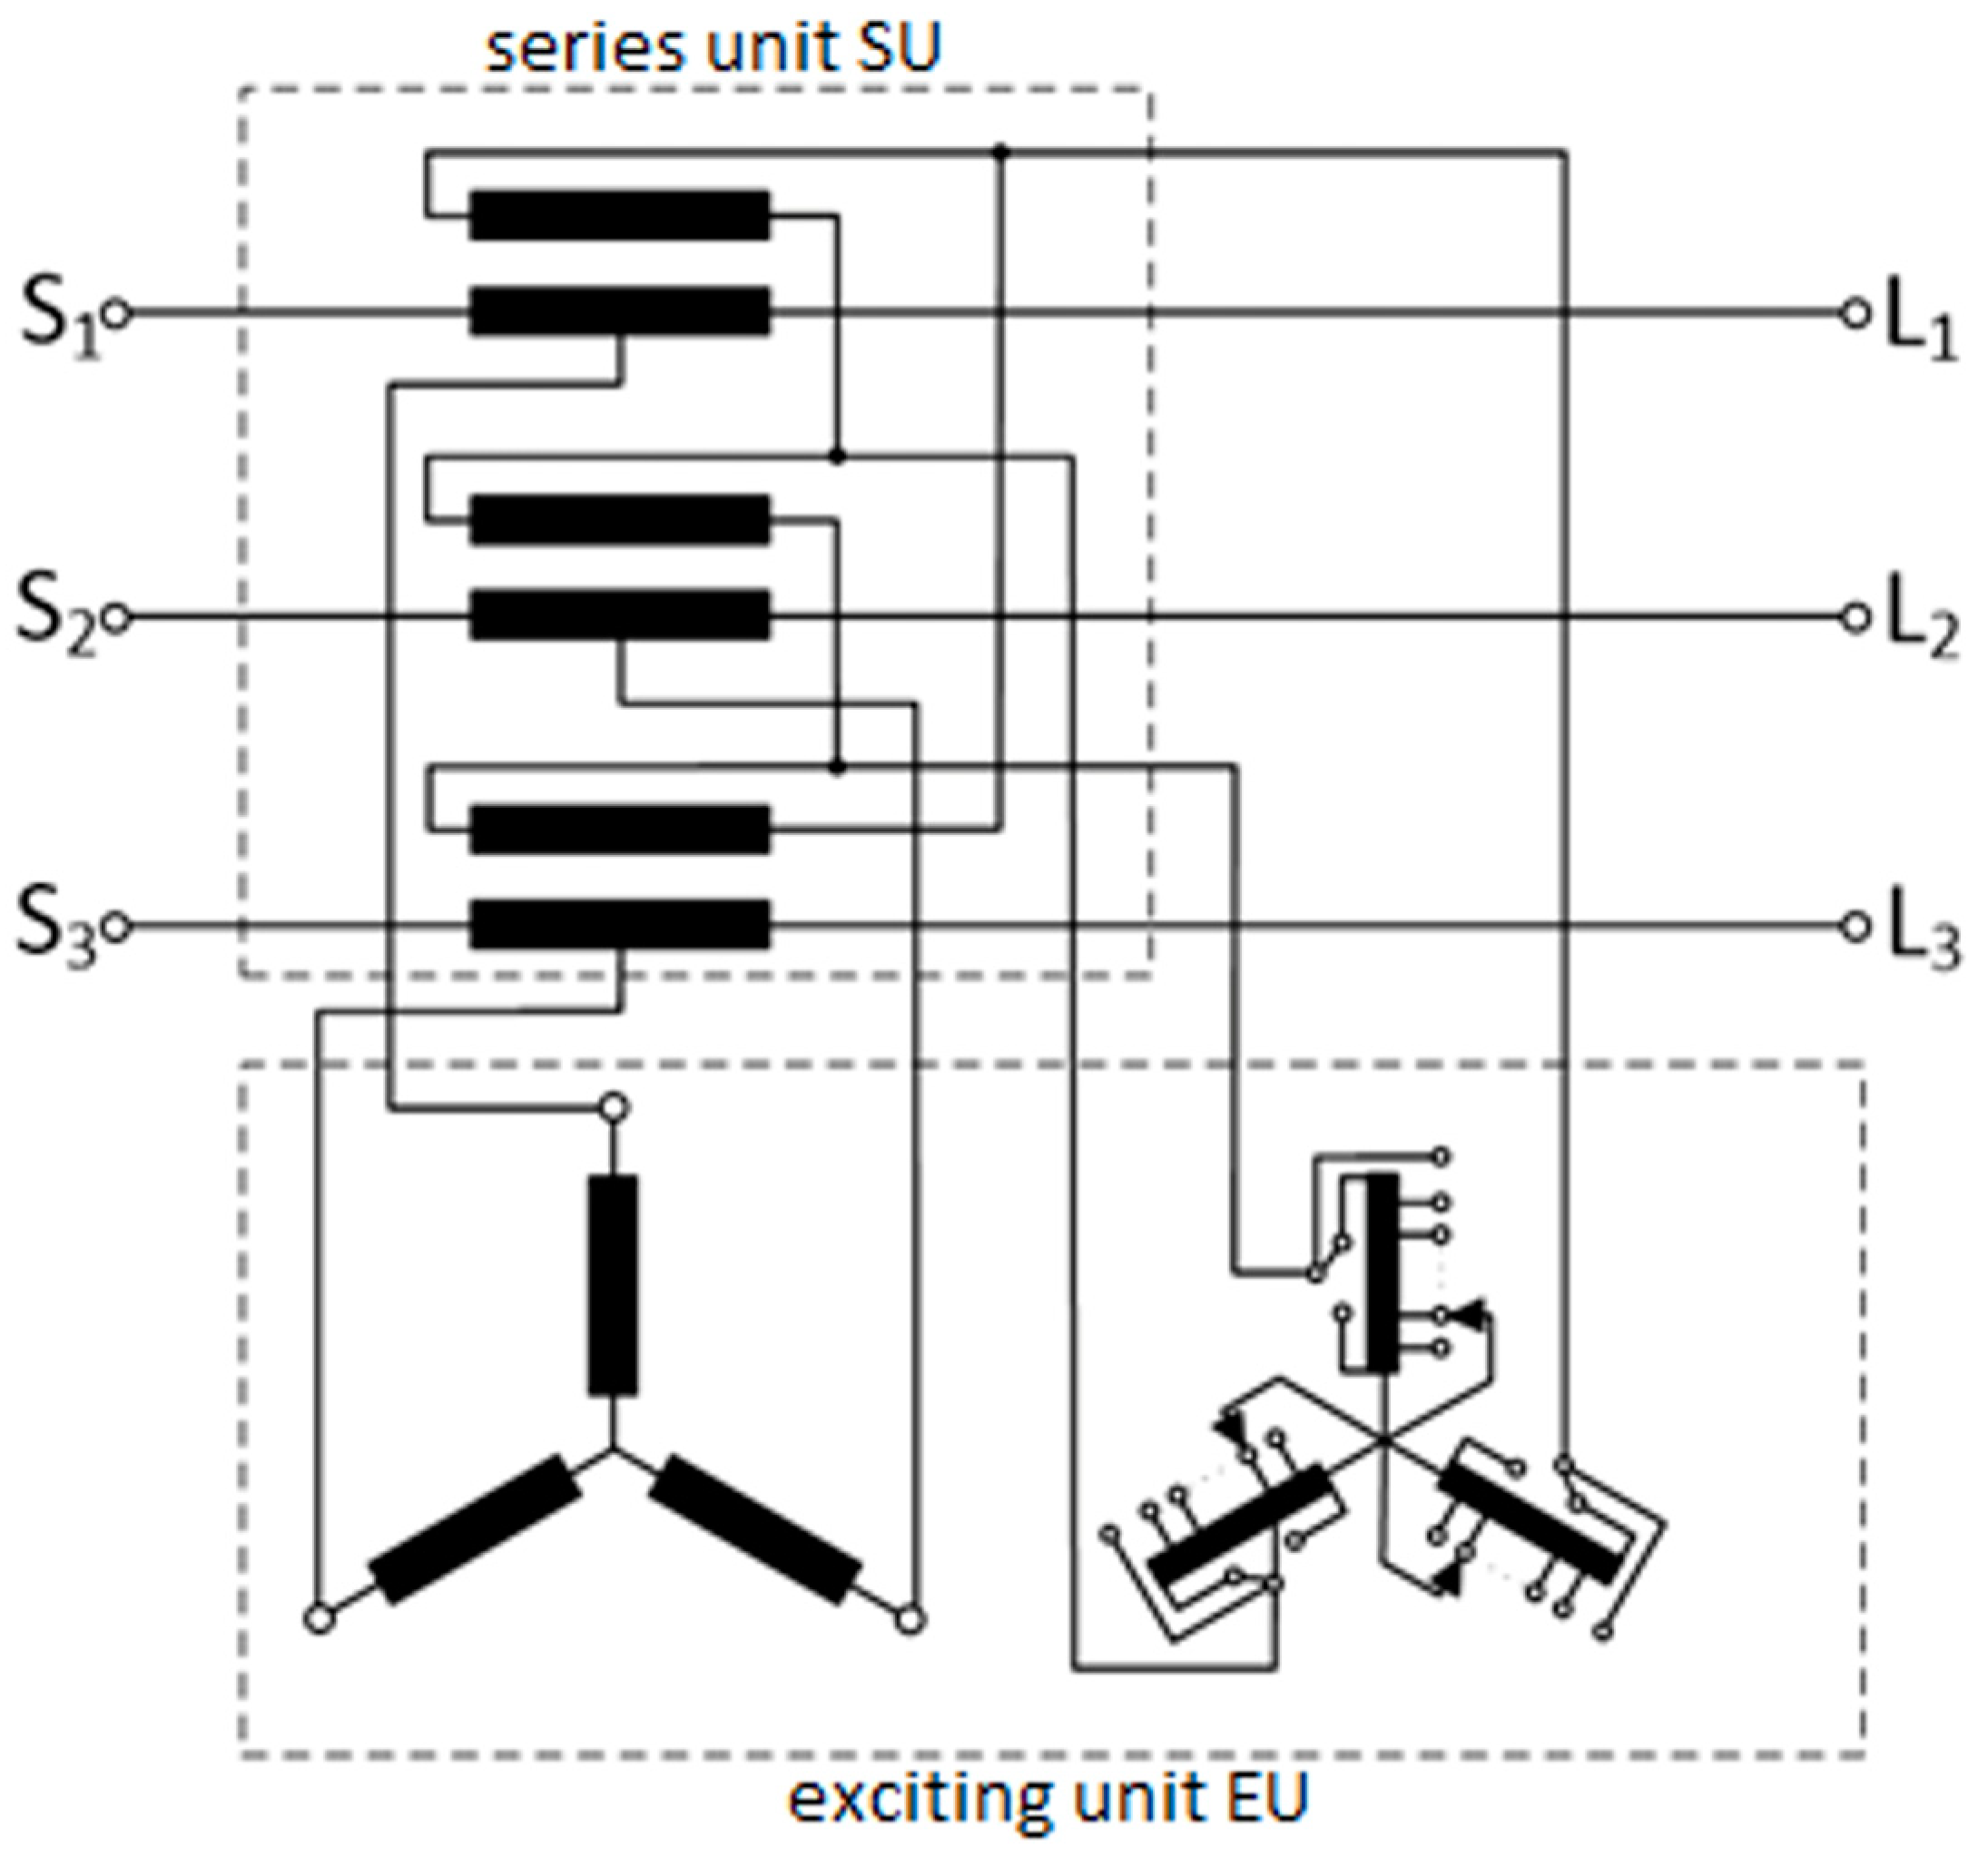
The series unit is mainly responsible for adjusting the phase shift angle between the voltages at both ends of the entire assembly. The windings of the individual phases of the series unit (SU) on the high voltage side are neither star-connected nor delta-connected. They are included in the transmission system in series (hence the term series transformer). The low voltage windings can be supplied with phase or phase-to-phase voltages from the exciting unit or directly from the third main unit winding. The role of the exciting unit is to provide the series unit with a voltage of appropriate magnitude, a phase angle, and a phase sequence. The role of the exciting unit can also be played by the third winding of the main unit (Figure 5a). However, equipping the adding unit with an exciting unit (Figure 5b) is operationally more convenient. For example, in the event of a faulty tap-changer or phase-shifting transformer, SU and EU units can be by-passed. This will enable the operation of the transformer unit, then composed only of the main unit, so that damaged devices can be repaired without the long-term downtime of the entire unit. An example of a three-phase connection diagram of an exciting unit and a series unit is shown in Figure 6.
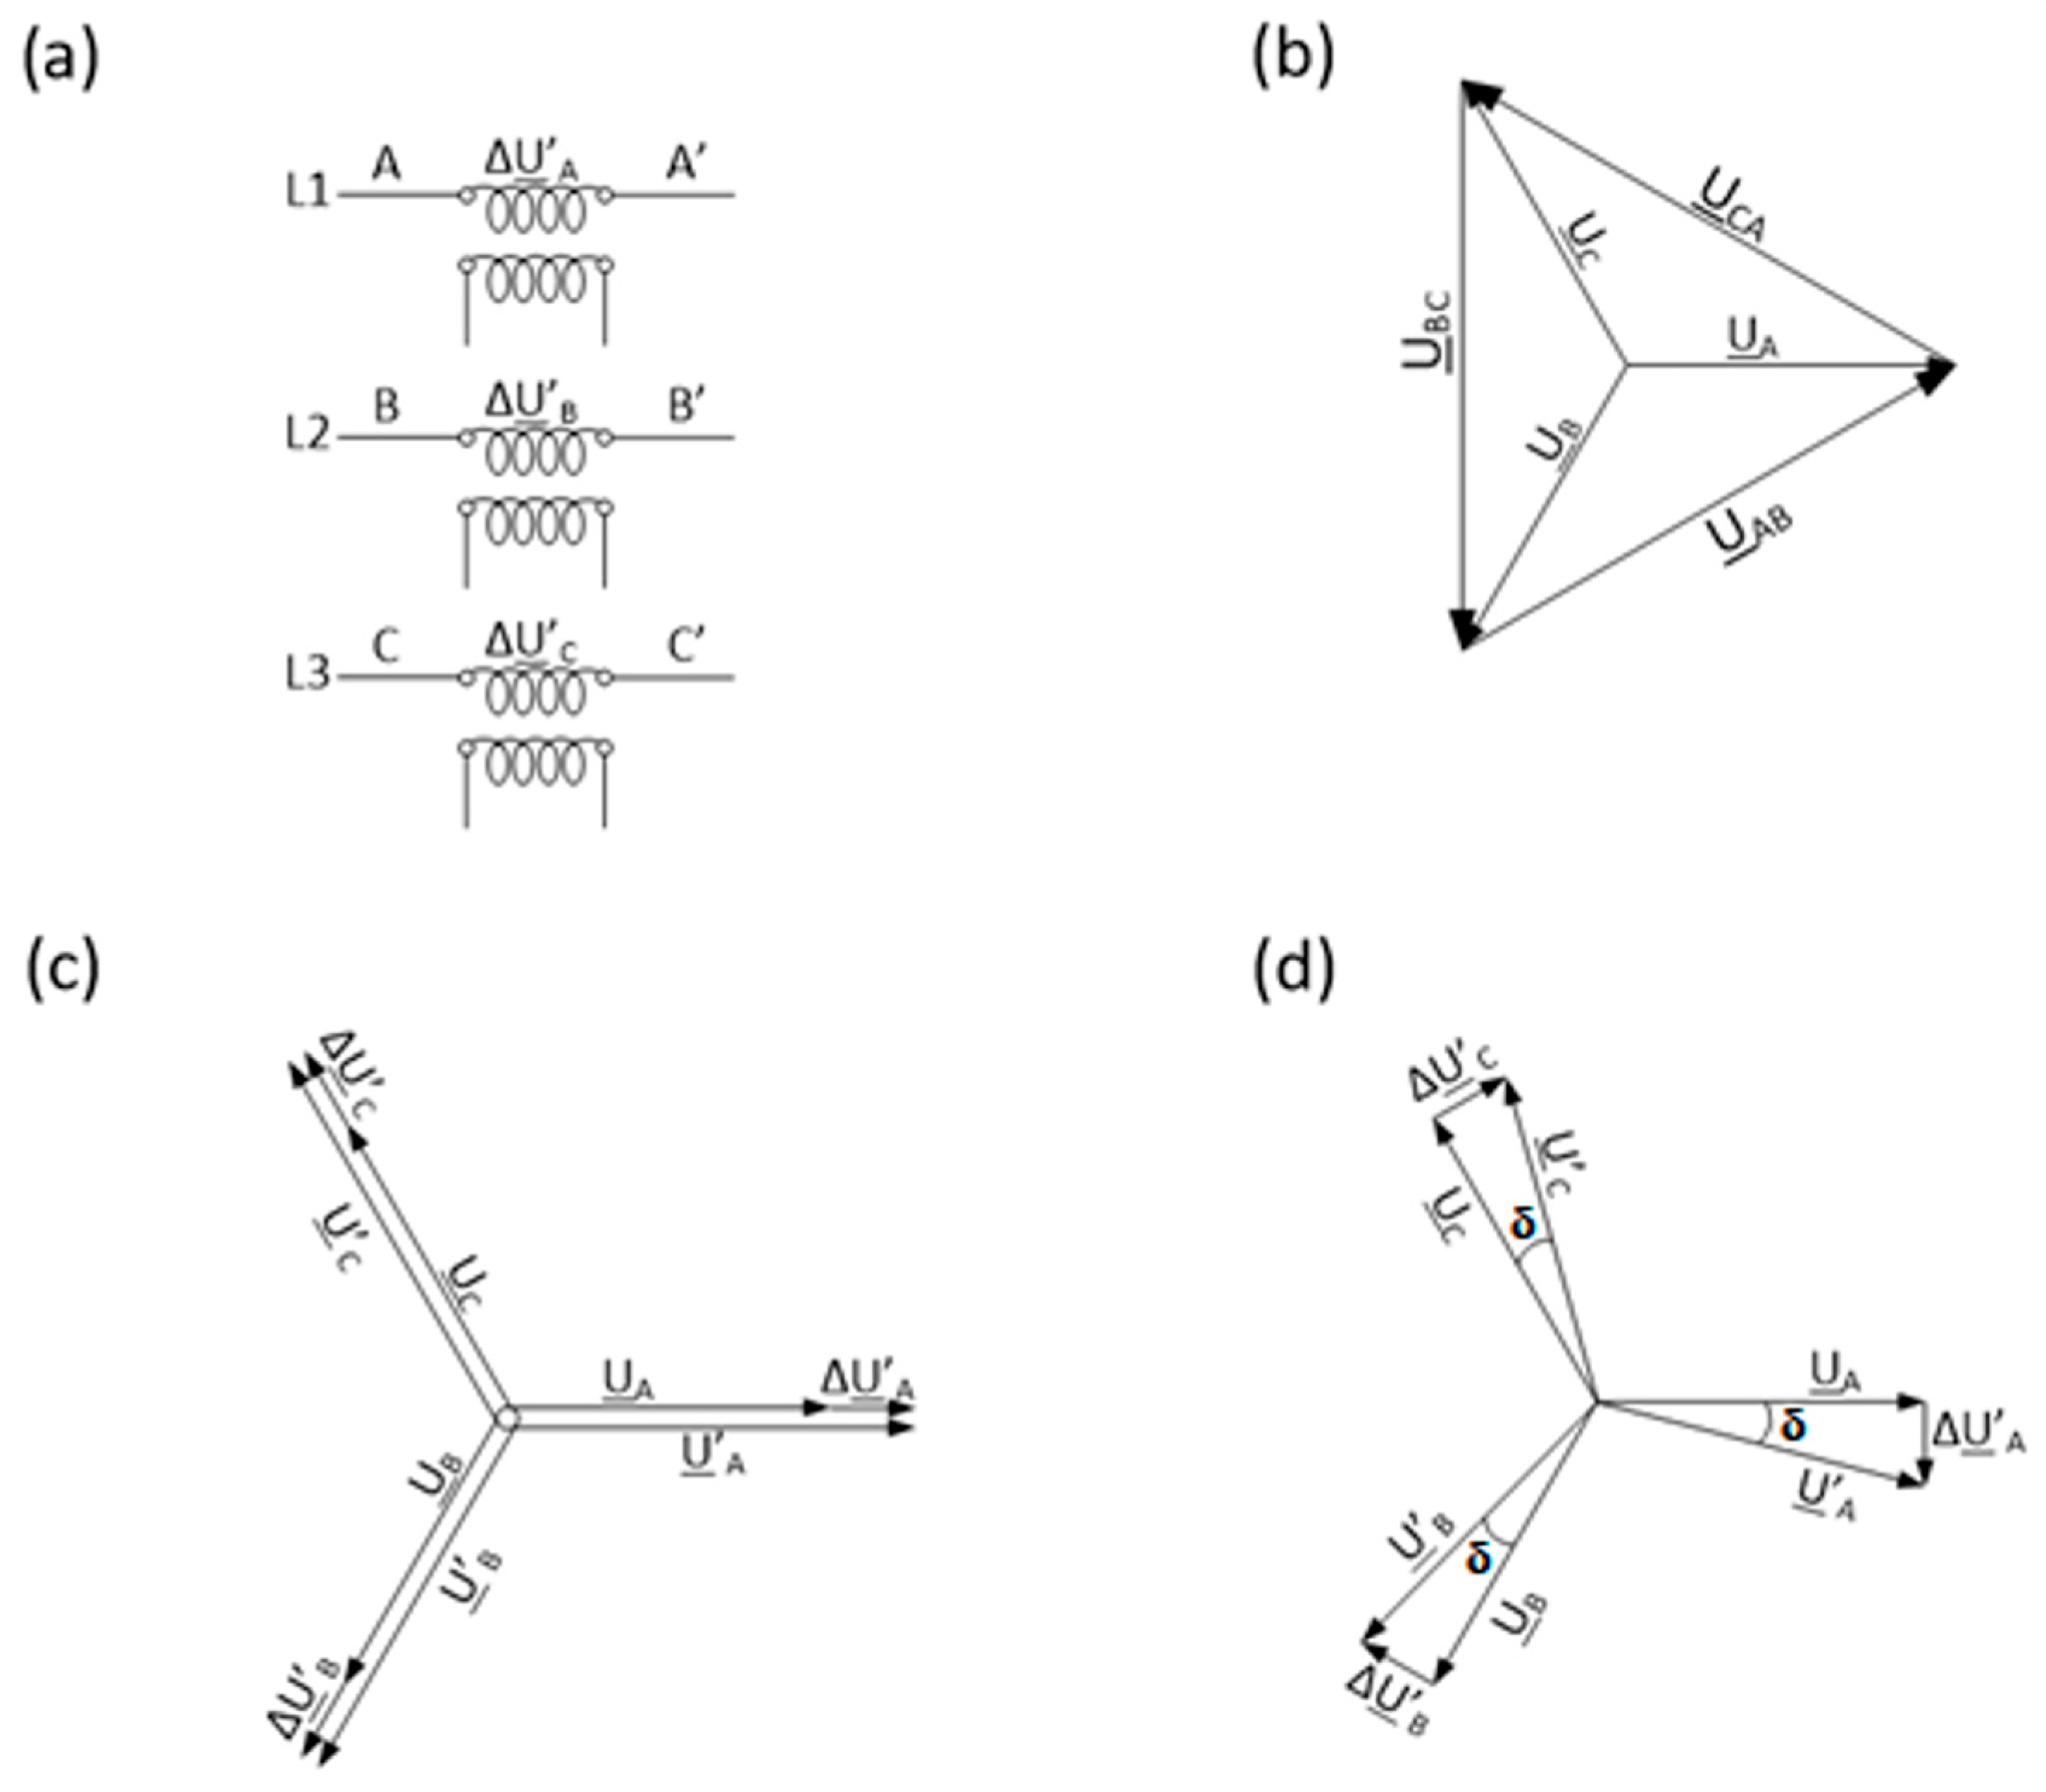
The basic types of regulation that can be implemented with a series unit are presented with the use of phasor diagrams in Figure 7 [23,24,25]. The voltages introduced to the individual phases of the transmission system through the series unit (additional voltages ΔUA’, ΔUB’, and ΔUC’) are proportional to the voltages with which the primary windings of this transformer are supplied (the vectors of supply voltage: UA, UB, and UC). The phasor diagrams of the phase voltage vectors and the interphase voltage vectors (Figure 7b) show that the phase voltage vectors are shifted by π/2 in relation to the interphase voltage vectors of adjacent phases. The use of this fact, when supplying an additional or excitation transformer, allows for the shift in the voltage, ΔU, to be obtained (Figure 7d).
In the case of supplying the series transformer from the exciting transformer with phase voltages of an unchanged phase sequence (UA, UB, UC), the additional voltages are obtained in the form of: ΔUA’ = βUA, ΔUB’ = βUB, and ΔUC’ = βUC, where β is the complex ratio of the exciting transformer and the series transformer. Then (Figure 7c), the voltage vectors UA’, UB’, and UC’ at the output of the serial winding of the series unit are in phase with the voltage vectors UA, UB, and UC supplying (at the input of the series winding) the series unit. In such a case, the transformer set serves only to change the voltage value in the transmission system (the voltage phase angle value remains unchanged). This type of regulation is called voltage magnitude regulation. The effect of implementing this kind of regulation in a transformer set is equivalent to that achieved in conventional transformers and autotransformers by tap regulation. As a result, both the transformer ratio and the voltage magnitude change.
Another effect of regulation is obtained when supplying the second voltage side of the series transformer with the inter-phase voltages of adjacent phases (or phase voltages with a changed phase sequence). In such a case, additional voltages are obtained in the form of: ΔUA’ = γUBC, ΔUB’ = γUCA, and ΔUC’ = γUAB, where γ is the complex ratio of the exciting transformer and the series transformer. The vectors of these voltages are shifted in phase by π/2 in relation to the voltage vectors UA, UB, and UC before the series unit. The π/2 angle is obtained for the case of supplying the series transformer with phase-to-phase voltages of the respective adjacent phases. In the case of supplying with phase voltages with a changed phase sequence, the angle value depends on the phase sequence. As a result, the voltage vectors at the output of the serial winding of the series unit (UA’, UB’, and UC’) are out of phase by the angle δ in relation to the voltage vectors of the series unit (UA, UB, and UC). It should be noted that the value of the angle δ depends on the length of the additional voltage (ΔUA’, ΔUB’, and ΔUC’). Thus, a change in the length of the vectors (module) of the boost voltages enables the adjustment of the voltage phase angle downstream of the transformer unit. This method of regulation is called combined regulation.

3. The Effects of Regulation with the Use of Transformer Units

When examining the validity of the regulation carried out with the use of transformer units with complex regulation, analyses were carried out in which the network effects of the performed regulation were examined. For this purpose, the models of regulatory transformers were parameterized so that they reflected real systems. The analyses took into account the model of the transformer unit with combined regulation. The model of such a unit was defined as an integrated object representing the main unit and the extension unit of the real transformer unit.

3.1. Analysis of the Possibility of Regulation in the Polish National Power System

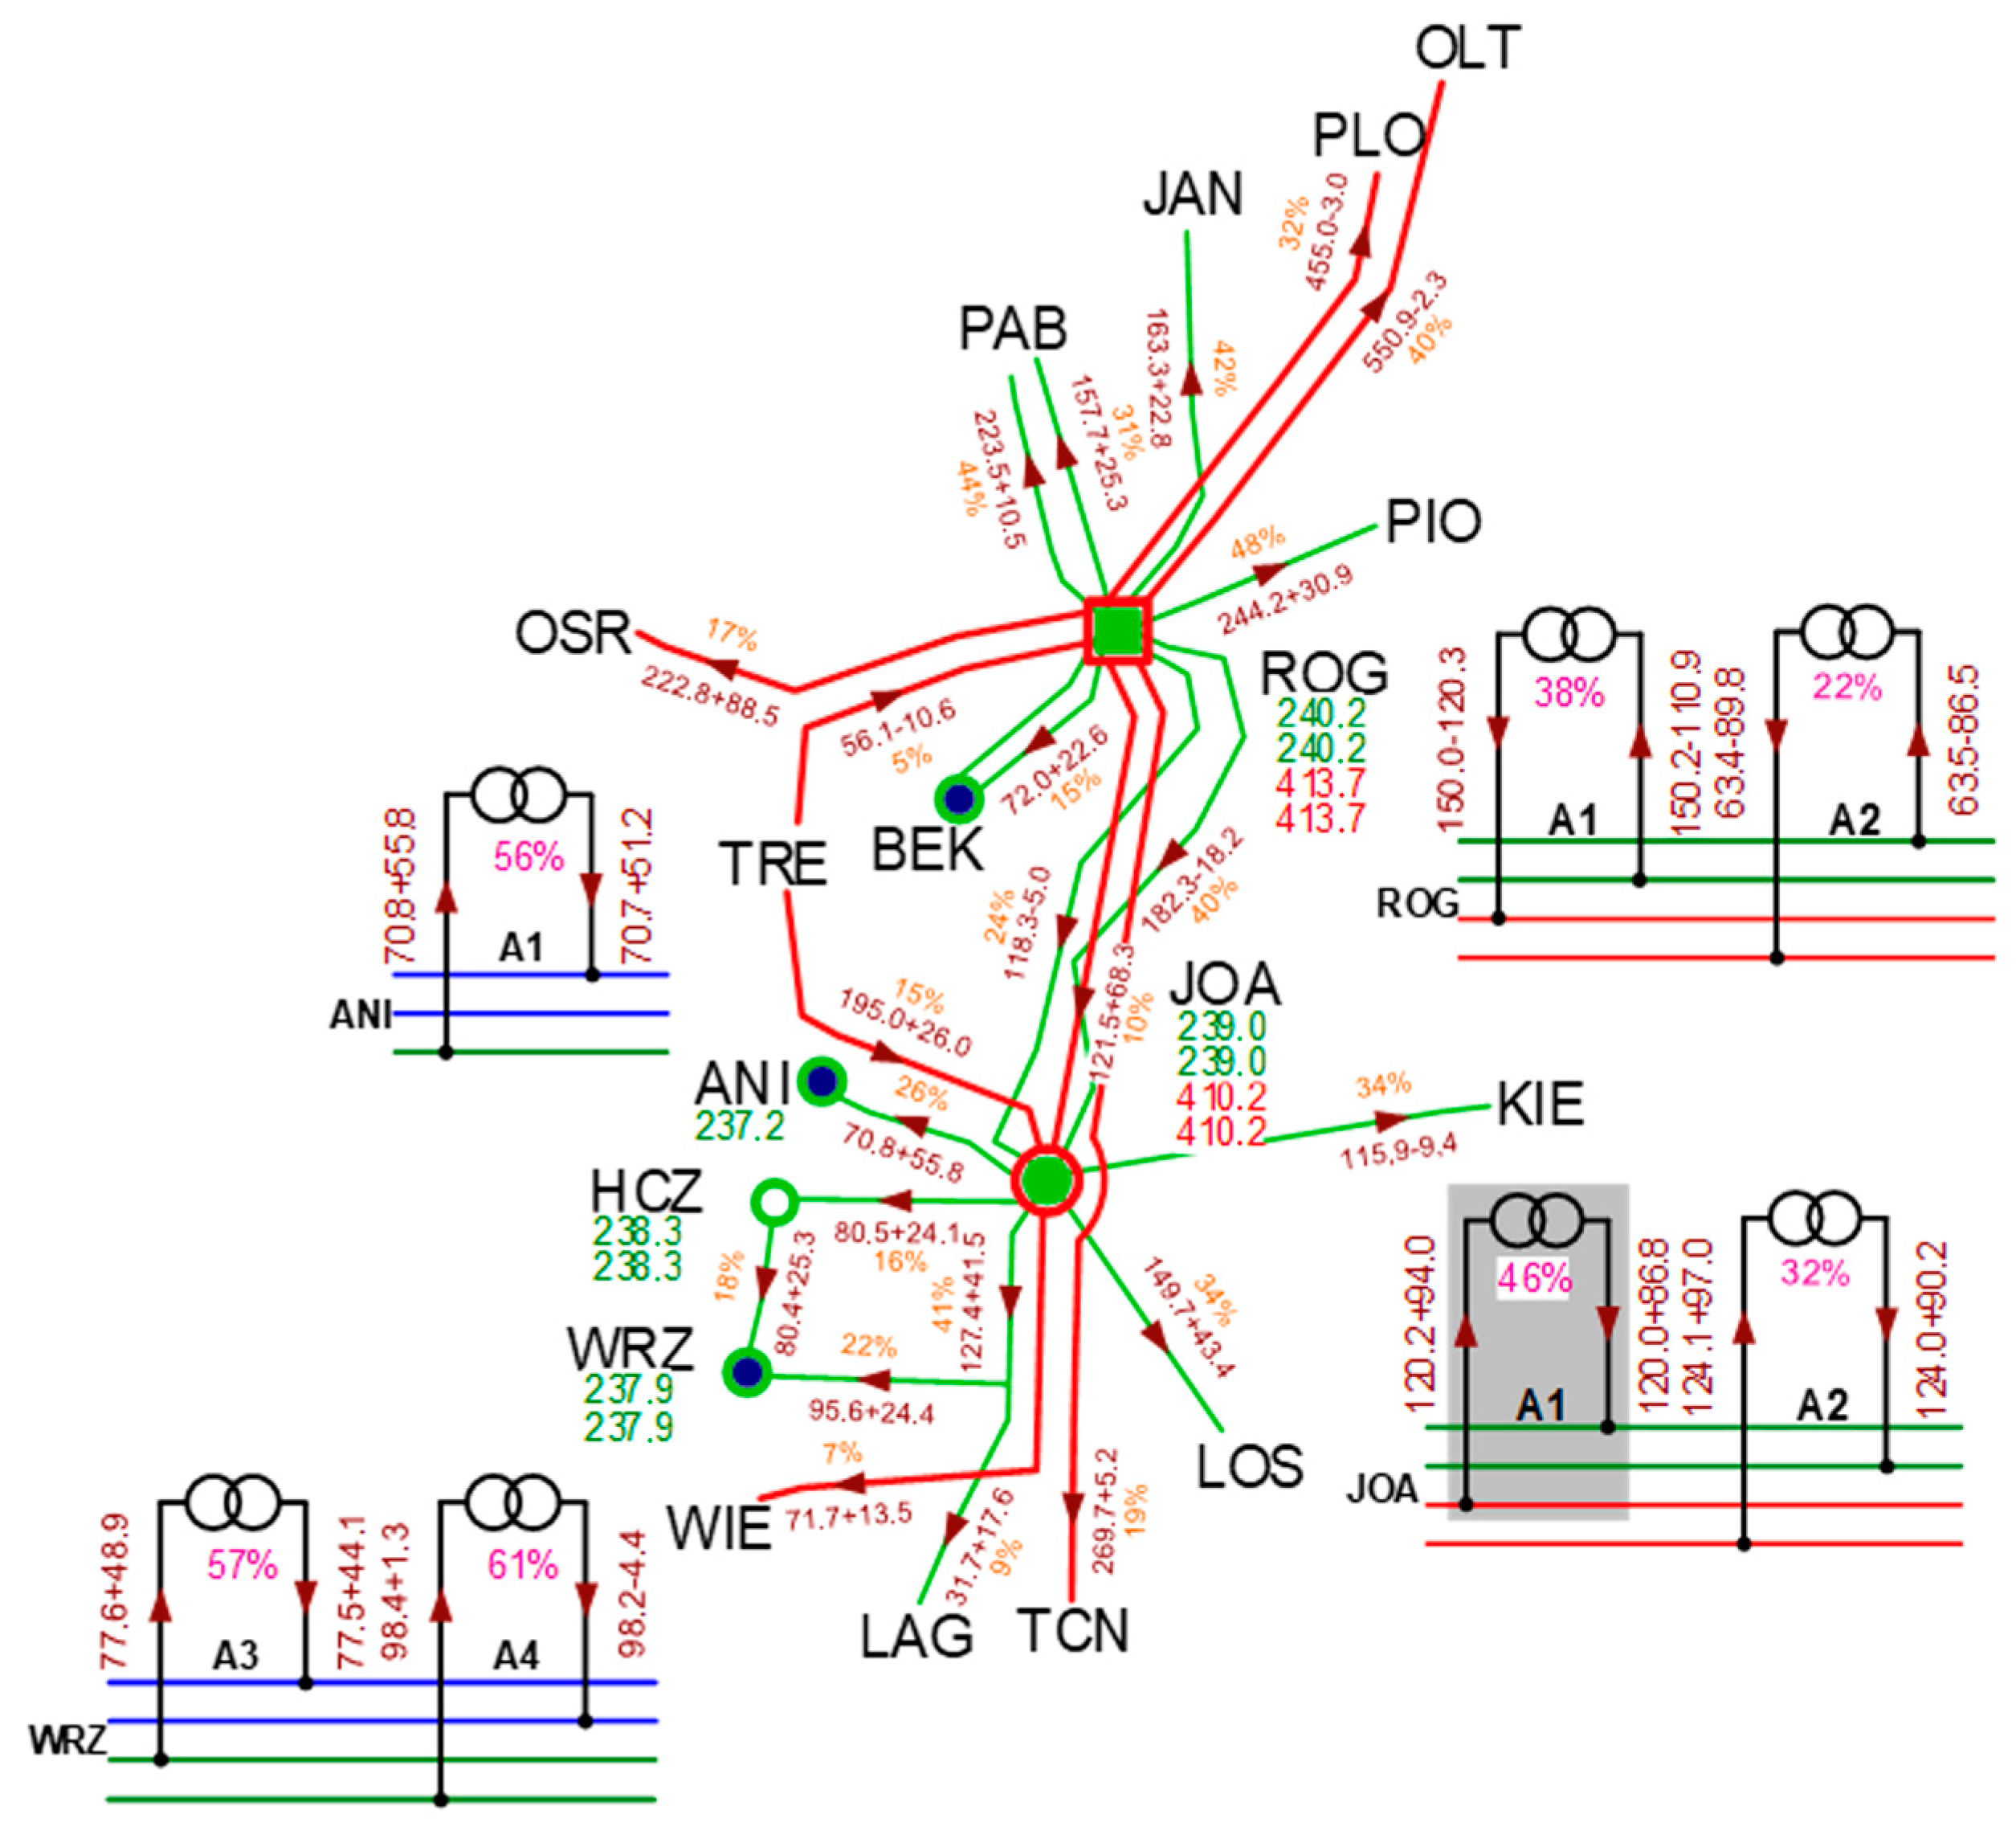
The work of transformer units was analyzed in a meshed system of 400 kV and 220 kV of the Polish national power system model. The network system was analyzed, as were the structure and set of the network elements which reflect the current state of the NPS at the winter peak load. The reference system was the base system without complex regulation, hereinafter referred to as the base scenario S0. The calculations focused on determining the value of active power flows on the NPS elements. Figure 8 shows the power flows in the direct network environment of the substation with an installed transformer set with a regulation (the transformer is highlighted with a gray background). The transformer A1, installed in the Joachimów bus, was selected in the analysis.
Four work scenarios were analyzed while examining the effects of the transformer unit with complex regulation (Figure 9):
  • scenario S1: regulation angle δ = −120°, tap 1;
  • scenario S2: regulation angle δ = −120°, tap 19;
  • scenario S3: regulation angle δ = 120°, tap 1;
  • scenario S4: regulation angle δ = 120°, tap 19.
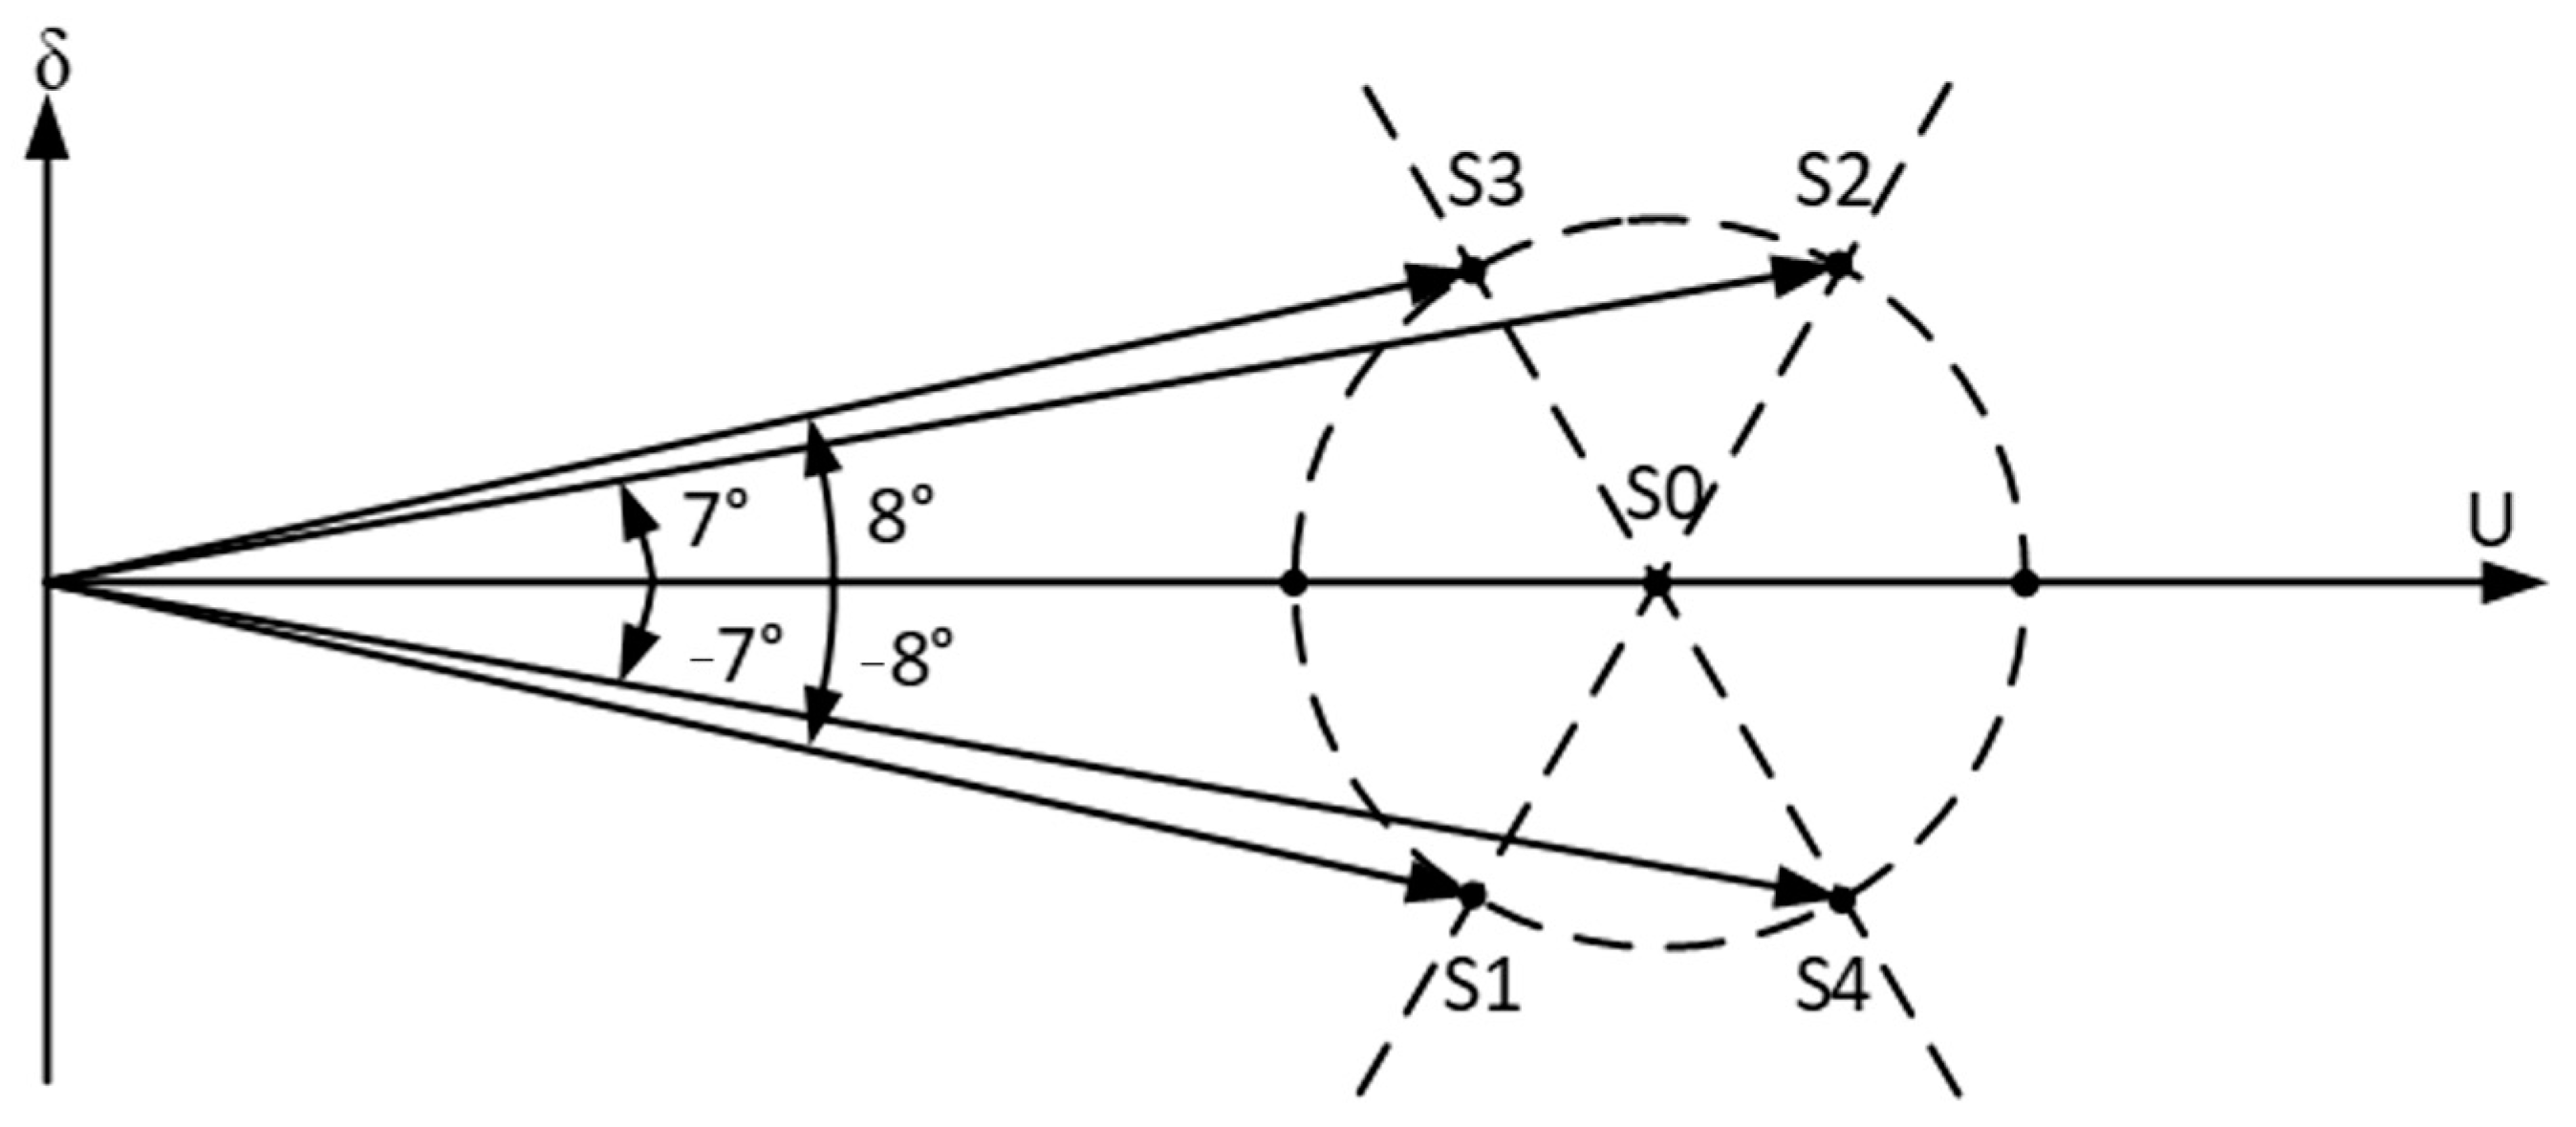
Figure 9. Scenarios for setting the regulation parameters of a regulating transformer.
Energies 16 01548 g009
Figure 9 shows the parameters of the voltage vector used in the regulation.
By analyzing the obtained results, the changes in the value of active power flows were calculated, dictated by the change in the scenario for the settings of the transformer regulating parameters. Changes in the values of the observed quantities were determined in relation to the given value of the specific quantity for the S0 scenario (base scenario) in accordance with Equations (2) and (3):
Δ P T = P T S x P T S O P T S O ,
where:
  • P T S O —the active power flow through the transformer for the S0 scenario;
  • P T S x —the active power flow through the transformer for the Sx scenario (x = 1…4);
Δ β = β S x β S O ,
where:
  • β S O —the transformer load ratio for the S0 scenario;
  • β S x —the transformer load ratio for the Sx scenario (x = 1…4).
Table 1 shows the power flows and load levels as well as the change in these values as a result of changing the settings of the JOA-A1 transformer (corresponding to the given scenario).
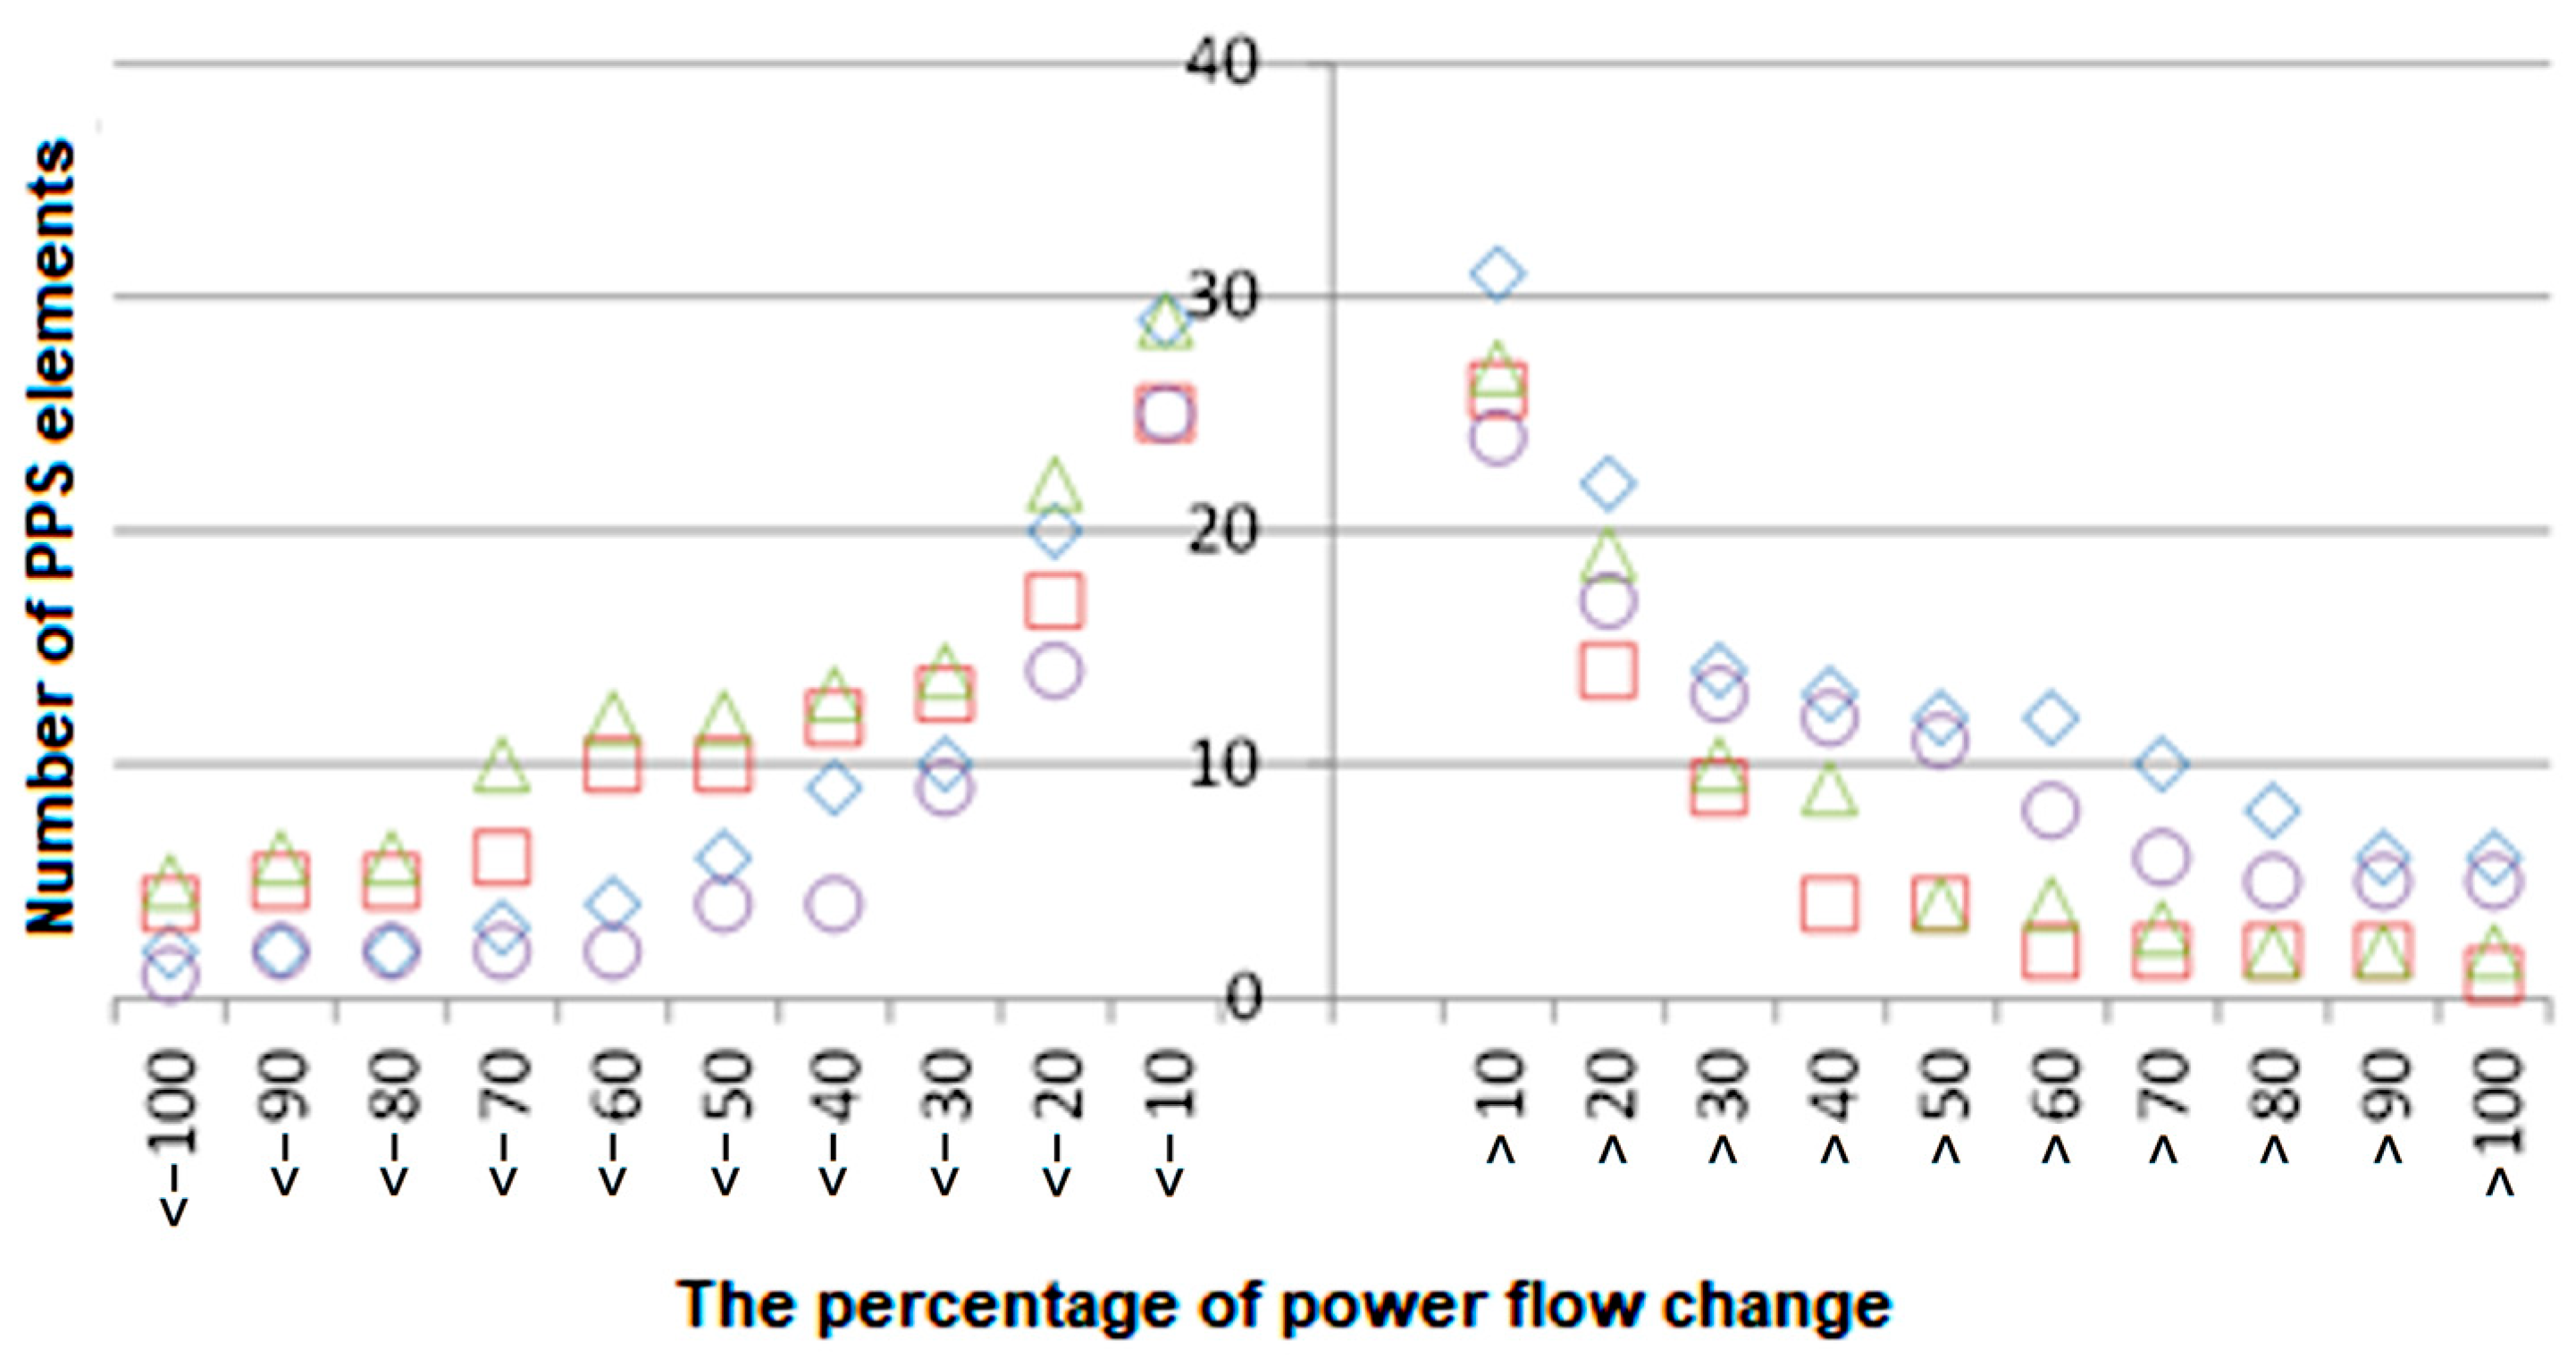
Figure 10 shows the dependence of the number of network elements affected by the change in operating conditions (expressed in the level of power flow) as a result of a change in the scenario of setting the regulating parameters of the considered transformer unit with complex regulation as well as the range of the flow change. Only elements for which the change in flow exceeded 10% were taken into account in the chart.
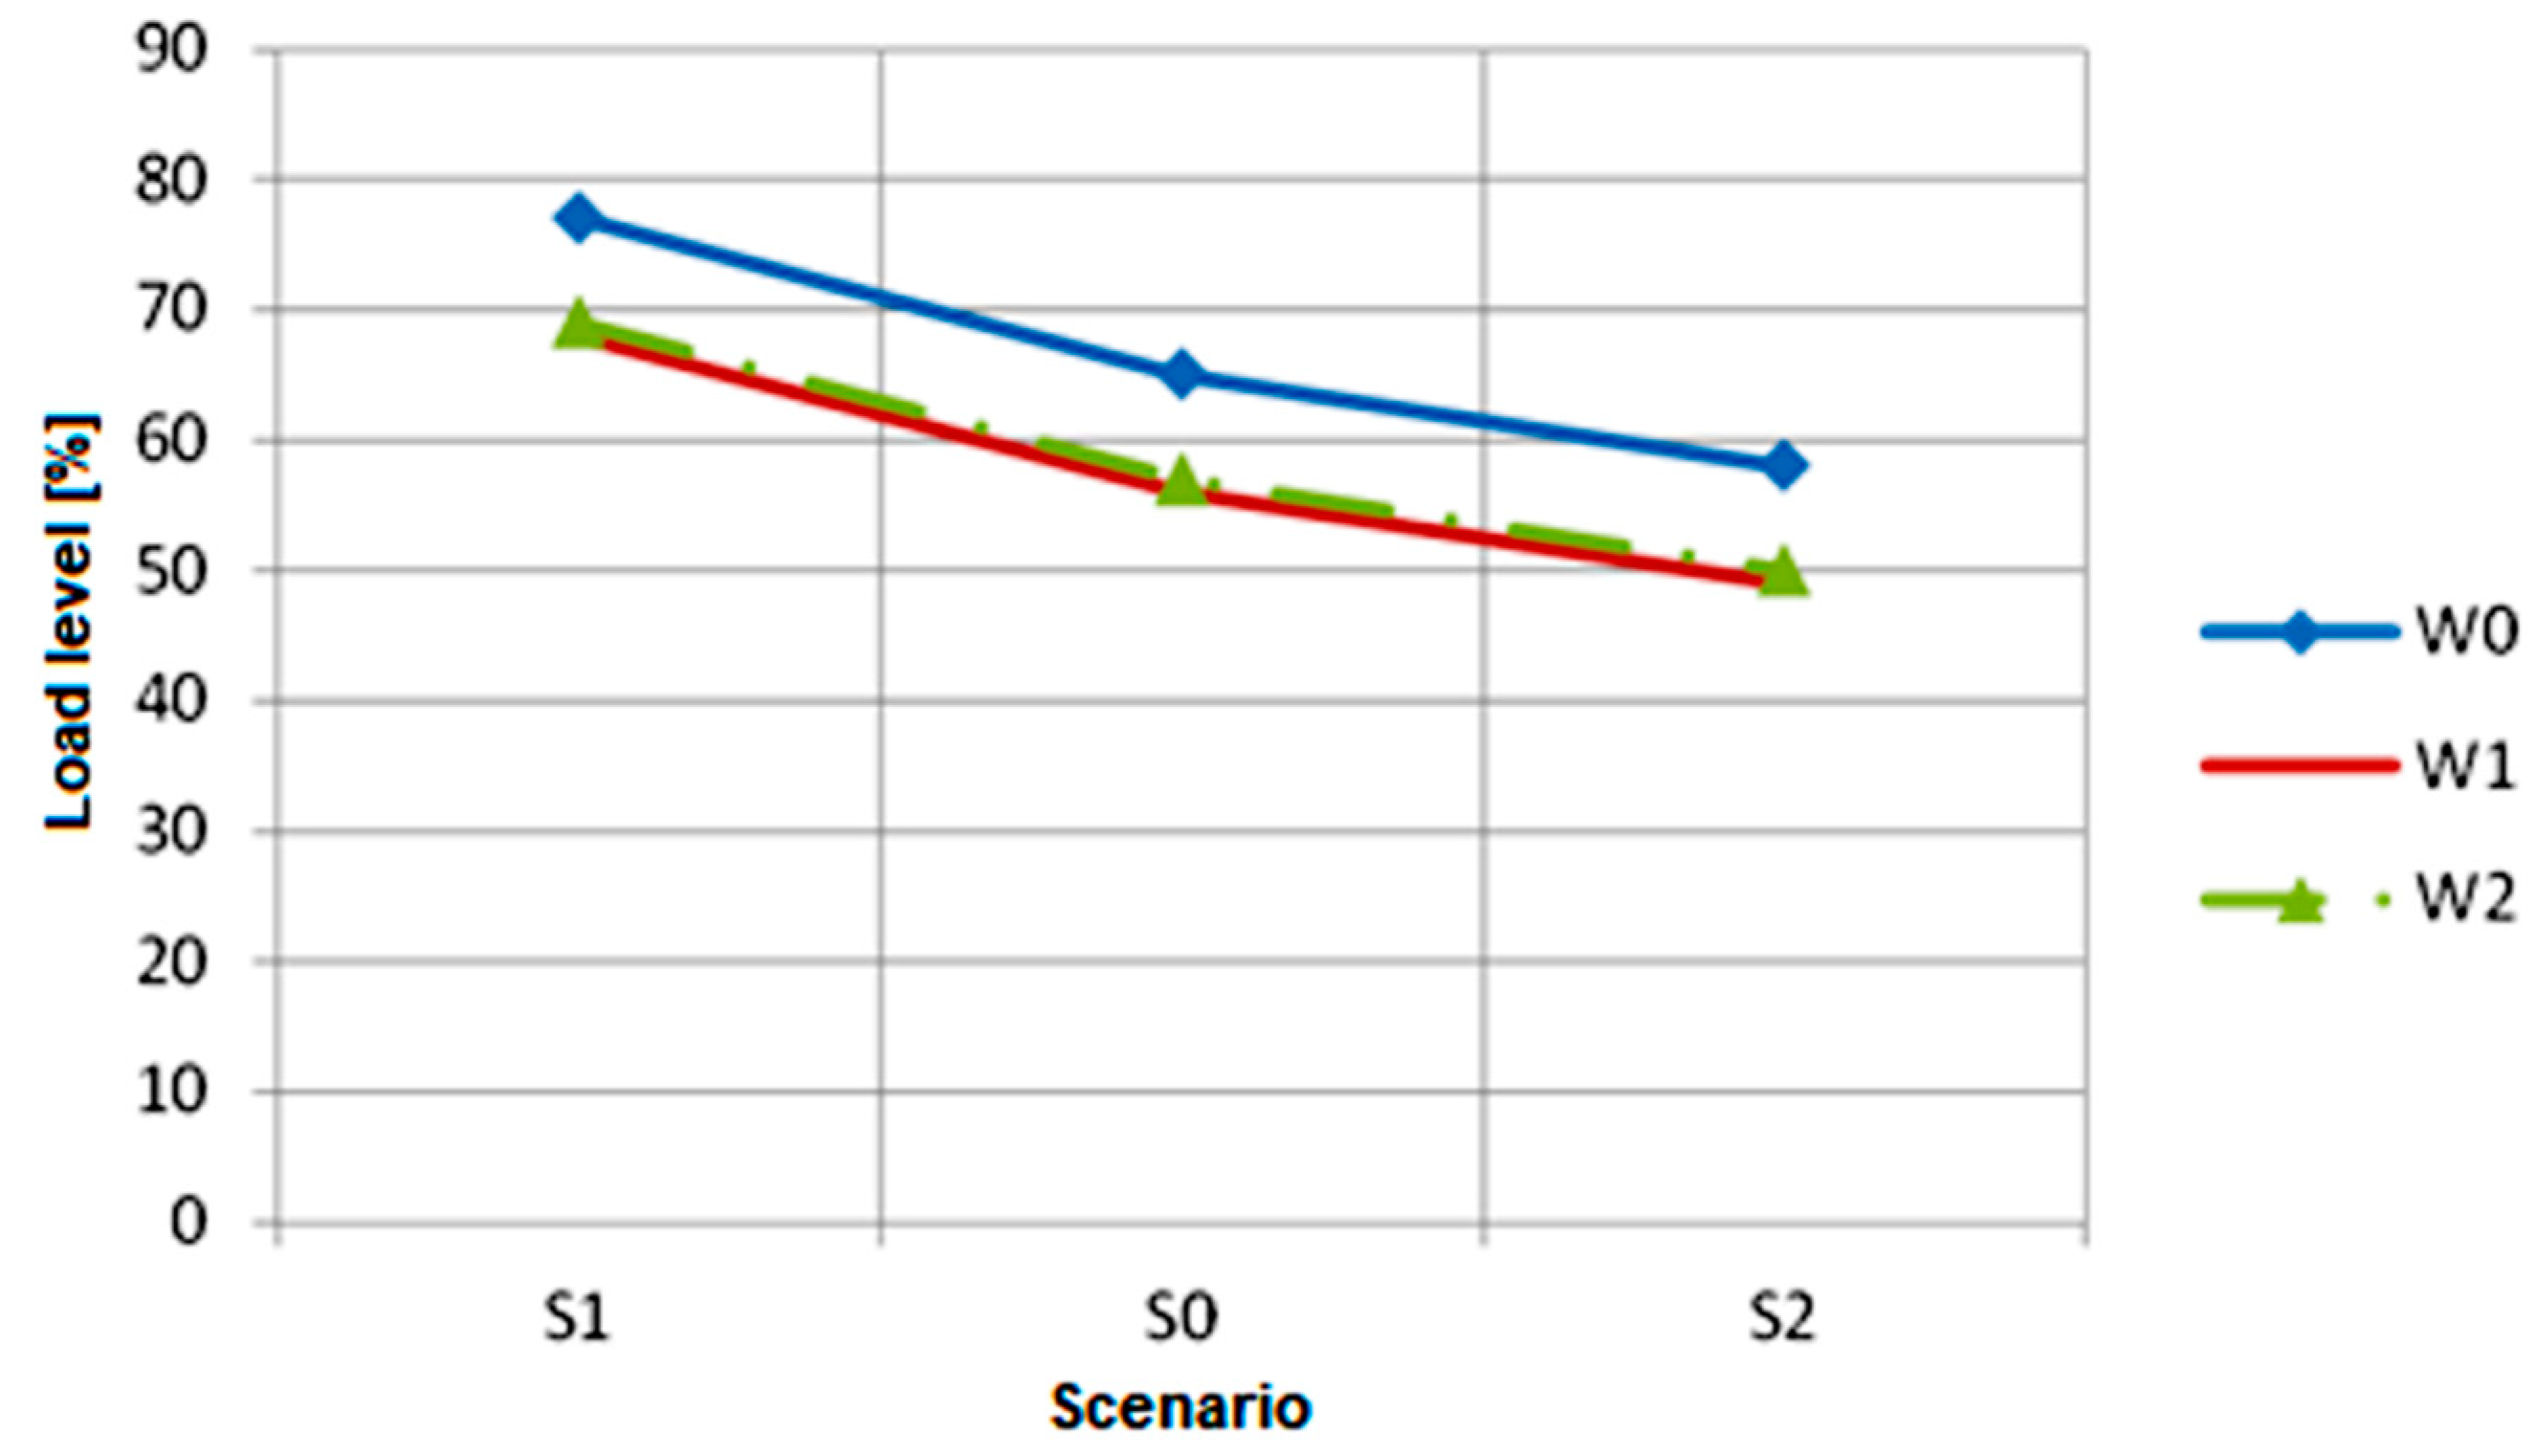
Apart from the analysis of power flow in normal states for the NPS, a variant analysis was carried out taking into account the outages of network elements. The calculations took into account the regulation scenarios S1 and S2 as well as the base scenario S0. While analyzing the influence of complex regulation performed with the JOA-A1 400/220 kV transformer, the following variants in the network operation were considered:
  • W0—normal grid topology;
  • W1—220 kV Joachimów-Huta Częstochowa line outage;
  • W2—400 kV Płock-Rogowiec and 400 kV Rogowiec-Ołtarzew lines outage.
Figure 11 shows the change in the load degree of the selected transmission line (220 kV Joachimów-Rogowiec) as a function of the scenario of setting the JOA-A1 transformer regulating parameters.

3.2. Summary of the Analysis

  • The implementation of phase-angle regulation by transformer units with complex regulation allows for control over active power flows through these transformers. Thus, it is possible to control the power flow in the network environment of the place where these units are installed. In the Polish national power system, this applies in particular to the 400 kV and 220 kV networks. The main effect of this regulation relates to the amount of power (load) flow in the transformer set.
  • The capacity of the considered regulating transformers depends on their design parameters (range of changes in the regulation angle ratio δ, values of equivalent impedance, etc.) and their place of installation in the national power system (including the short-circuit power and the structure of the network environment on both sides of the transformer). It is advisable to use such a control solution for the distribution of power flows between 220 kV and 400 kV transmission lines.
  • For transformers with combined regulation, the change in the regulation angle ratio is accompanied by a change in the voltage ratio (for a regulation angle δ different from 0°). Then, simultaneously with the change in the phase shift angle of the nodal voltages, the voltage module changes. The interdependence that occurs is disadvantageous because it limits the possibilities of freely controlling the operating conditions of the network. In particular, it may refer to the emergency states of the NPS.
  • For transformer sets with combined regulation installed in the NPS, changing the regulation angle requires not only switching off the entire transformer set but also changing the phase connection sequence between individual components of this set. This makes it impossible to quickly control power flows in the emergency states of the NPS that require immediate reactions. Therefore, it should be assumed that for this type of unit, uninterrupted operation is determined by the system of connections between the main unit and extension unit.

4. Mathematical Model of Regulation Optimization with the Use of Transformer Units

The effects presented in Chapter 3, resulting from the ability to regulate active power in the NPS using transformer units, may be used as planned by the TSO to regulate power flows within the system. The scale of the effects can be enhanced by optimizing the location of transformer units and selecting their parameters.
When looking for a place in the NPS to install a new transformer set with complex regulation, an analysis should be made using the network model and the relevant procedure.

4.1. Nodal Admittance Matrix

Based on the nodal potential method, the power grid equations can be written in admittance (4) or impedance form (5).
I W Z = Y W Z U W Z
U W Z = Z W Z I W Z
where:
  • U W Z the nodal voltage vector;
  • I W Z the nodal current vector;
  • Y W Z the nodal admittance matrix;
  • Z W Z the nodal impedance matrix.
The nodal admittance matrix Y W Z is created by definition, while the nodal impedance matrix Z W Z is obtained by inverting the nodal admittance matrix (6):
Z W Z = Y W Z 1
The node admittance matrix reflects the topology of the considered power network. Diagonal elements of Y _ i i (7) are complex quantities and are equal to the eigenvalues of nodes, y _ i i (the eigenvalue of a node is the algebraic sum of all admittances connected directly to a given node), while the non-diagonal elements, Y _ i j (8), of the nodal admittance matrix are also the quantities complex and are equal to the mutual admittance (the mutual admittance of two nodes is the series admittance of the branch connecting these nodes with the opposite sign) of pairs of nodes (series admittance with a minus sign).
Y _ i i = j = 1 i 1 w ( y _ i j 2 + y _ i j ) = y _ i + j = 1 i 1 w y _ i j i = 1 , 2 , ,   w
Y _ i j = y _ i j                                 i = 1 , 2 , ,   w   ;     i j
where:
  • y _ i j 2 —the one-side shunt admittance;
  • y _ i —the ground admittance;
  • y _ i j —the series admittance.

4.2. Admittance Parameters of the Transformer Set

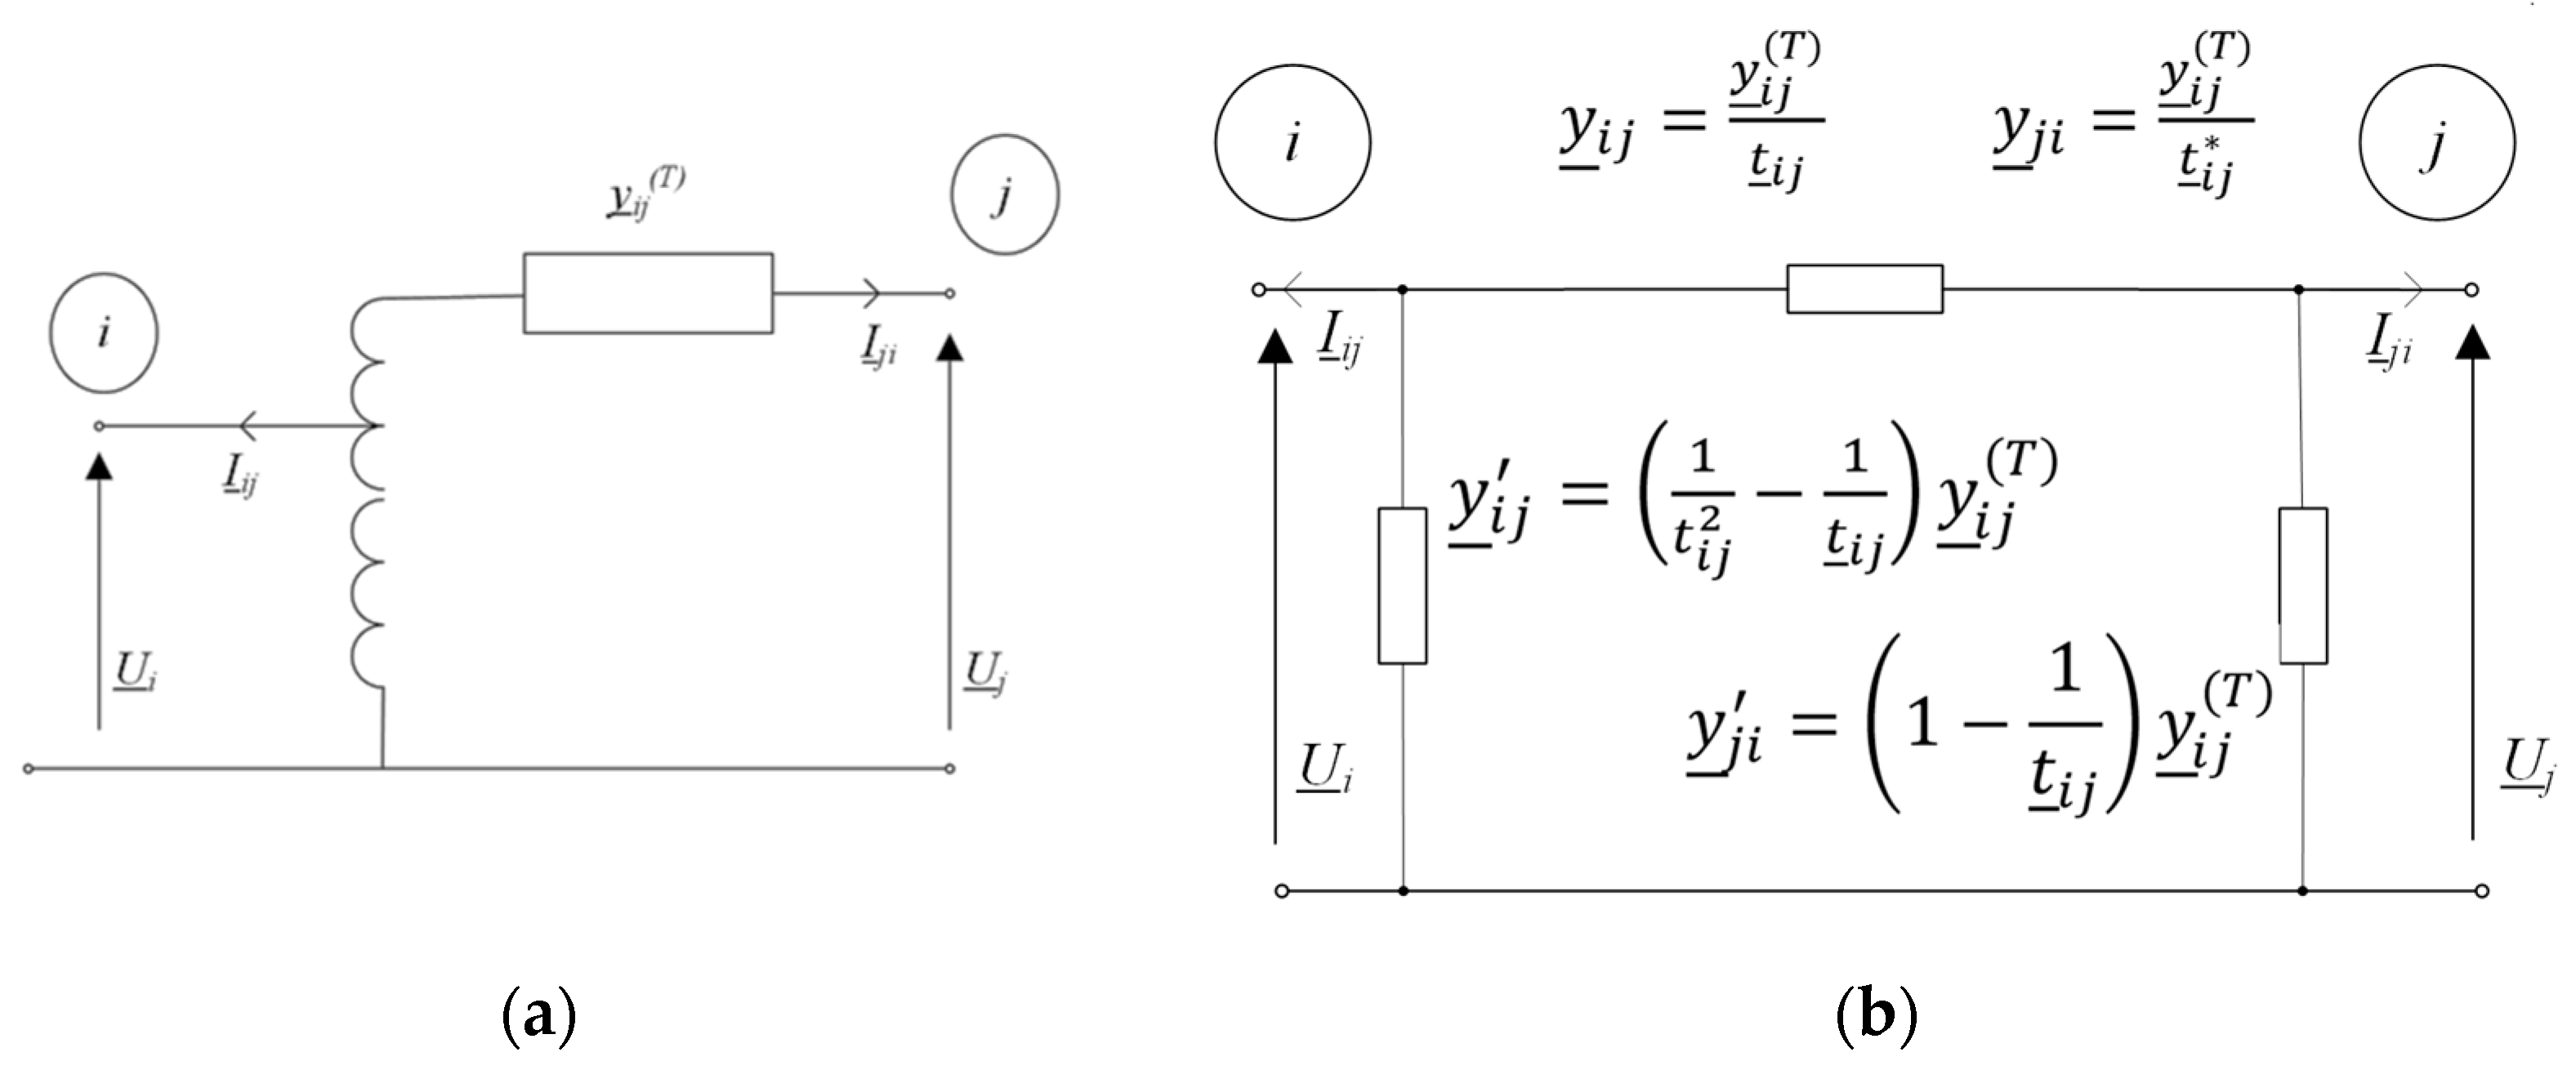
Transformer units with complex regulation are modeled separately in the steady state calculations as transformers with complex transmission [48]. Transformers with an extra-nominal complex ratio are represented as an equivalent model, consisting of an ideal transformer with a complex ratio, t _ i j = t i j e j δ i j , and a series-connected equivalent longitudinal admittance, y _ i j ( T ) (Figure 12a).
Transformers are modeled on the Π-type four-pole equivalent (Figure 12b), whose parameters are a function of the transformer’s complex ratio, t _ i j , and its equivalent series admittance, y _ i j ( T ) (Figure 12b). However, since the shunt parameters of the resulting Π-equivalent are not the same, y _ i j y _ j i , the direction of connection must be taken into account.
If a transformer set with the parameters shown in Figure 12a is connected between two nodes, i and j, then in the elements of the nodal admittance matrix, new values are calculated from the equation:
Y _ i i = Y _ i i ( u ) + y _ i j ( T ) t i j 2
Y _ j j = Y _ j j ( u ) + y _ i j ( T )
where:
  • Y _ i i ( u ) —diagonal elements of the admittance matrix in node i before connecting the transformer set;
  • Y _ j j ( u ) —diagonal elements of the admittance matrix in node j before connecting the transformer set,
  • while non-diagonal elements take values calculated from the equation:
Y _ i j = y _ i j ( T ) t _ i j
Y _ j i = y _ i j ( T ) t _ i j *
where: t _ i j * = t i j e j δ i j the conjugate complex transformer ratio.

4.3. New Locations for the Installation of Regulating Transformers

The choice of the location for the transformer set in terms of obtaining the broadest possible regulatory scope is one of the key issues for the TSO. Looking for the dependencies linking the transformer control parameters with the power grid parameters, three network systems were analyzed: (a) example 1—a single-mesh simple network model, (b) example 2—an IEEE 5-bus single-voltage network system, and (c) example 3—a 14-bus dual-voltage IEEE network. In all examples, the voltage phase angle regulation was used, that is, only phase-angle regulation. Calculation examples were made using the PowerWorld program.

4.3.1. Example 1

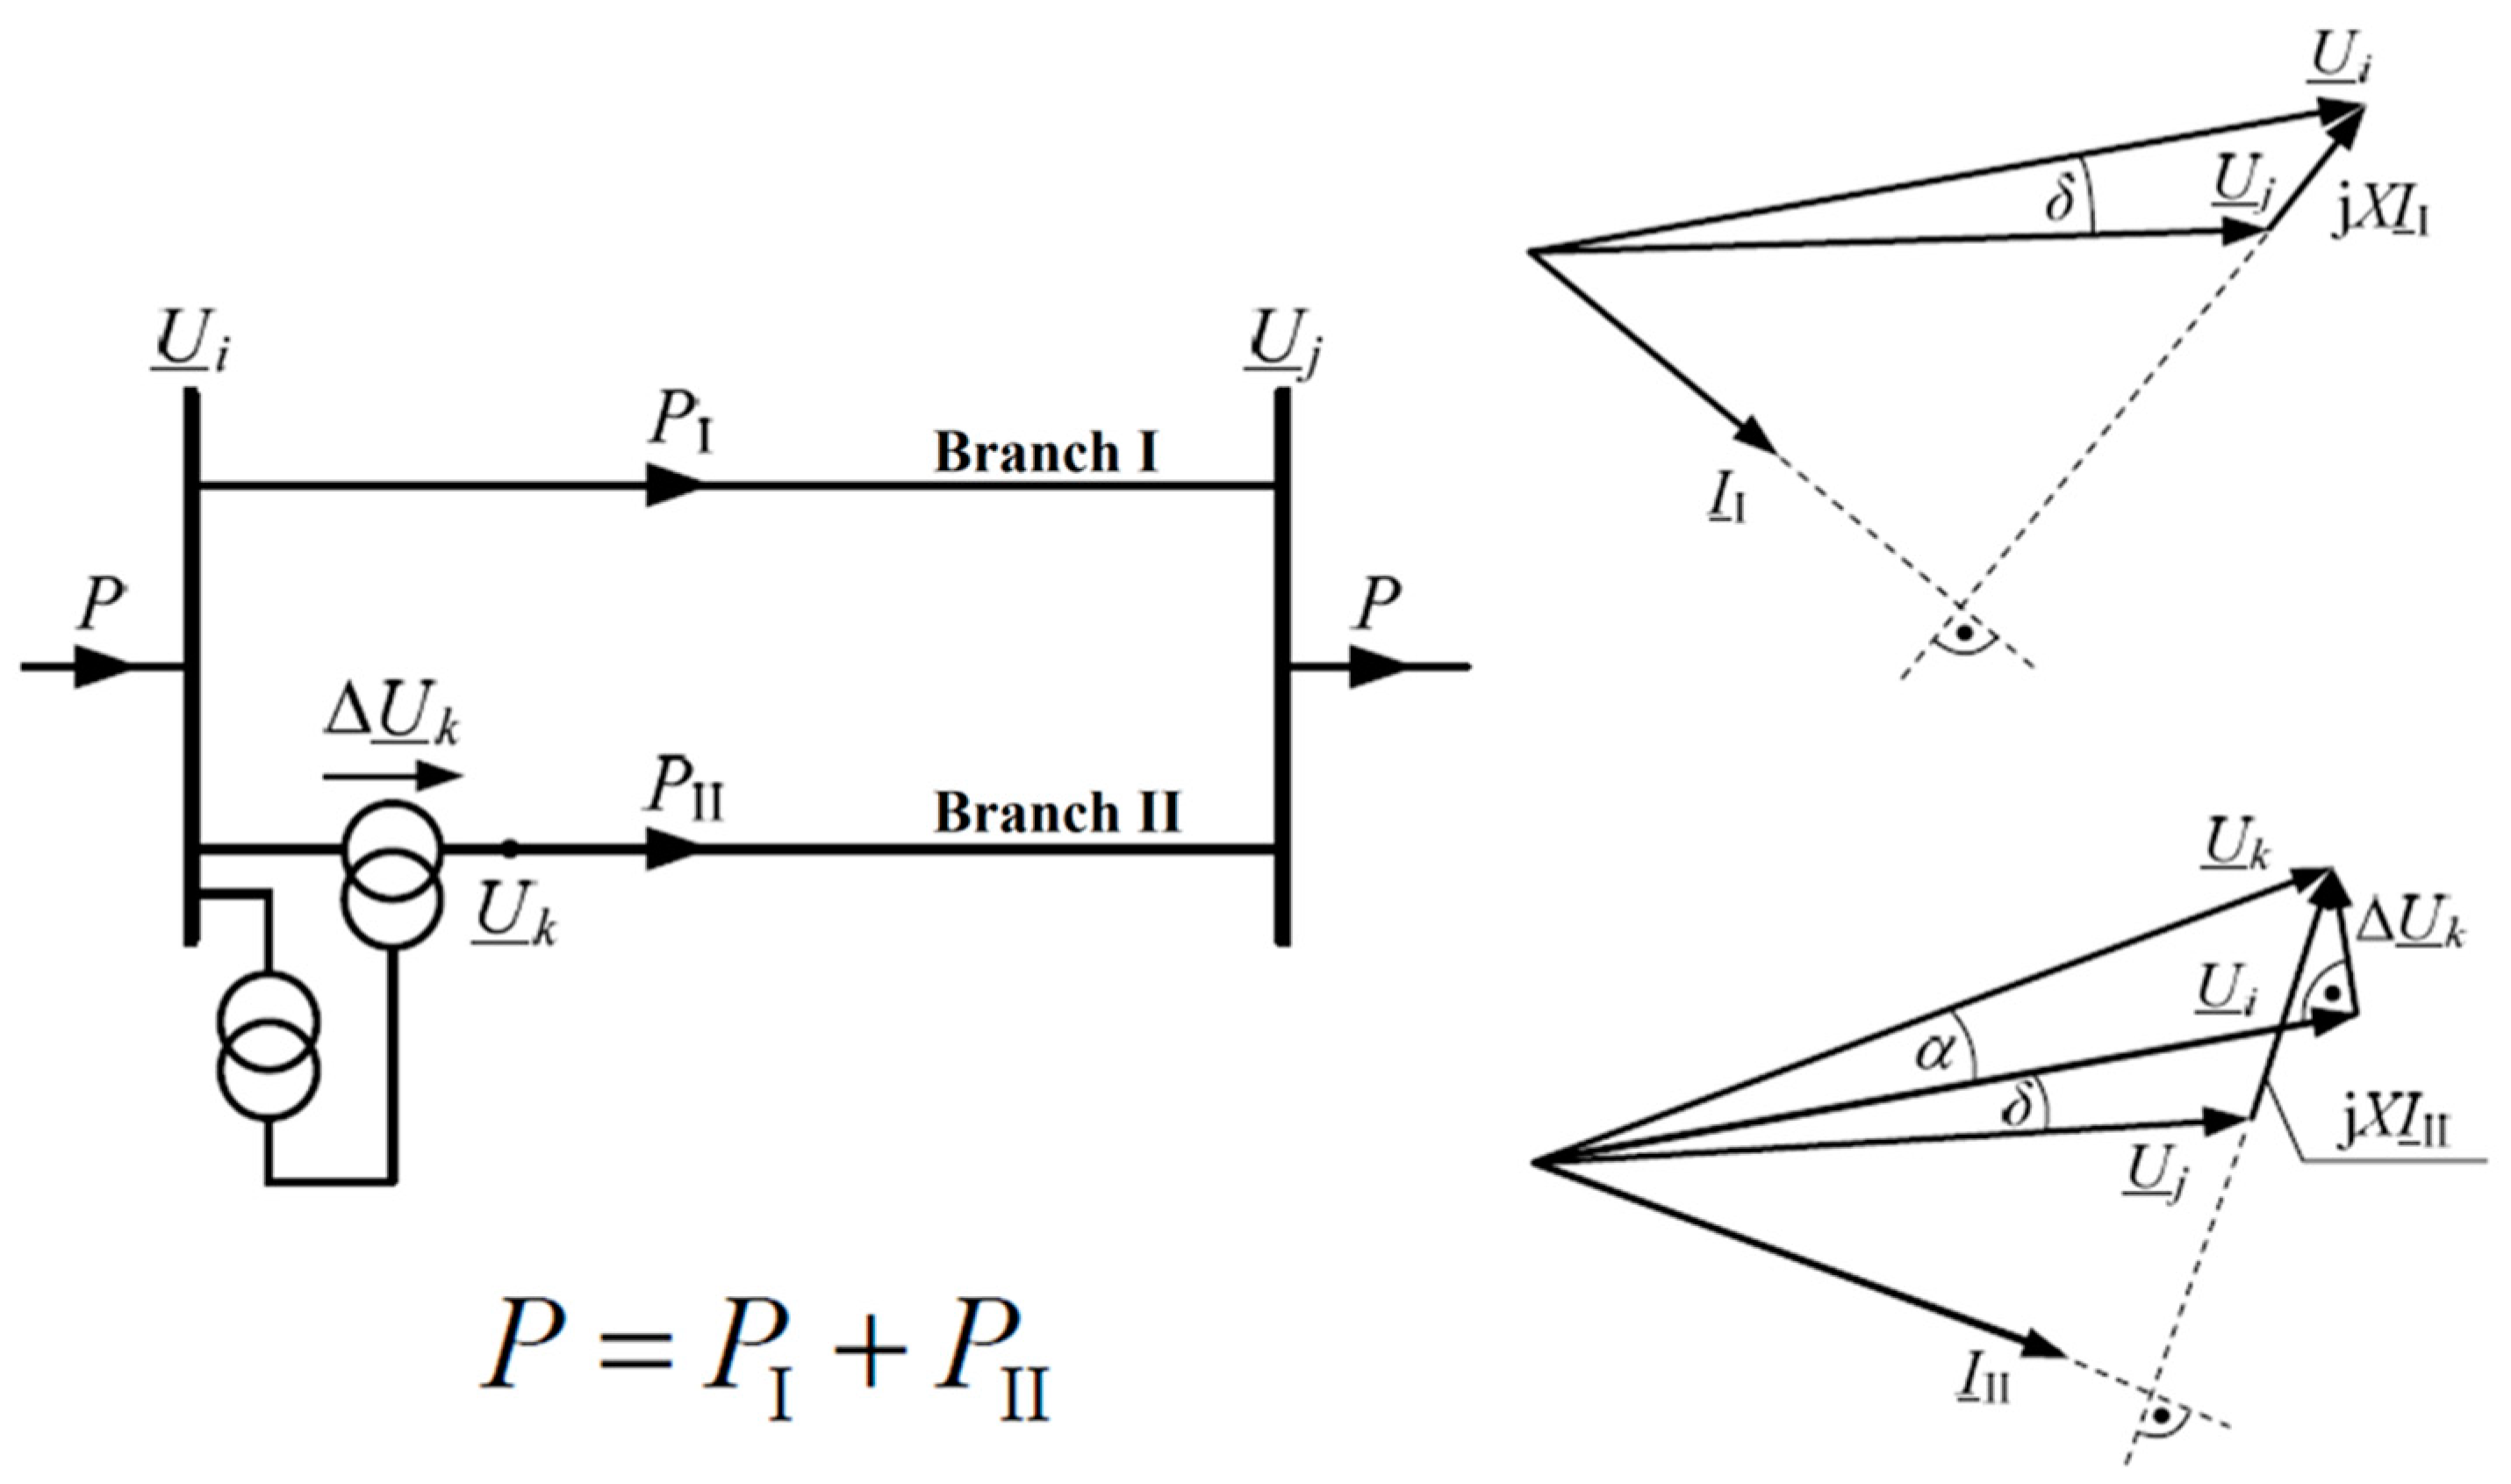
The idea of the method that allows for the adjustment of the load angle by means of the PST is presented in the Figure 13.
It was assumed that two parallel transmission lines I and II (Figure 13) have the same parameters, and, as a result of the power flow that was formed in the entire network, the voltages at the beginning and at the end of the transmission system in question assume the value of U i and U j , with the difference being arguments (load angle) being δ i j . The reactance of the line between two nodes i and j is X i j . Under the assumptions made, branch I carries active power determined by the equation:
P I = U i U j X i j sin ( δ i j )
In branch II, the PST is installed, which introduces the add-on voltage, Δ U , perpendicular to the voltage at the beginning of the line, U i . As a result, the resultant voltage, U k , behind PST ( U k = U i + Δ U k ) is shifted in phase with respect to the voltage, U i , by the angle δ P F , and the load angle for branch II is equal to ( δ i j + δ P F ). Now the reactance X i j consists of the reactance of line between nodes k and j ( X k j ) and the reactance of the PST between nodes i and k ( X P F ).
Power flows through branch II, determined by the formula:
P I I = U k U j X k j + X P F sin ( δ i j + δ P F )
Using the phase shifter control, the total power introduced to the system as well as the output power from the considered network system is equal to the sum of the branch powers ( P = P I + P I I ). It is a simplified relationship without losses.
Using the superposition method, the following relationship can be written:
P g = P g 0 + Δ P g
where:
  • P g —the power flow through the network branch “after” shifter control;
  • P g 0 —the power flow through a network branch in a given network without the use of regulation;
  • Δ P g —the power flow through the network branch as a result of the application of regulation.
Using the Equation (15) to describe the power flows P I and P I I , it is possible to obtain:
P I = P I 0 + Δ P I = U i U j X i j sin ( δ i j ) = U i U j X i j sin ( δ i j 0 ) + Δ P I
P I I = P I I 0 + Δ P I I = U k U j X k j + X P F sin ( δ i j + δ P F ) = U k U j X k j + X P F sin ( δ i j 0 ) + Δ P I I
where:
  • δ i j 0 —phase angle of the voltage between nodes i-j without the regulation;
  • δ i j —phase angle of the voltage between nodes i-j after the regulation;
  • δ P F —phase angle entered by the PST.
In the considered example, the DC model was used, assuming no voltage drop, | U i | = | U j | = | U k | = U . In such a case, after appropriate transformations, the power forced in the system by the phase shifter amounts to:
Δ P I = U i U j X i j sin ( δ i j ) U i U j X i j sin ( δ i j 0 ) = U 2 X i j ( sin ( δ i j ) sin ( δ i j 0 ) )
Δ P I = U 2 X i j 2 cos δ i j + δ i j 0 2 sin δ i j δ i j 0 2
and
Δ P I I = U k U j X k j + X P F sin ( δ i j + δ P F ) U k U j X k j + X P F sin ( δ i j 0 ) Δ P I I = U 2 X k j + X P F ( sin ( δ i j + δ P F ) sin ( δ i j 0 ) )
Δ P I I = ( U 2 X k j + X P F ) 2 cos ( δ i j + δ P F + δ i j 0 2 ) sin ( δ i j + δ P F δ i j 0 2 )
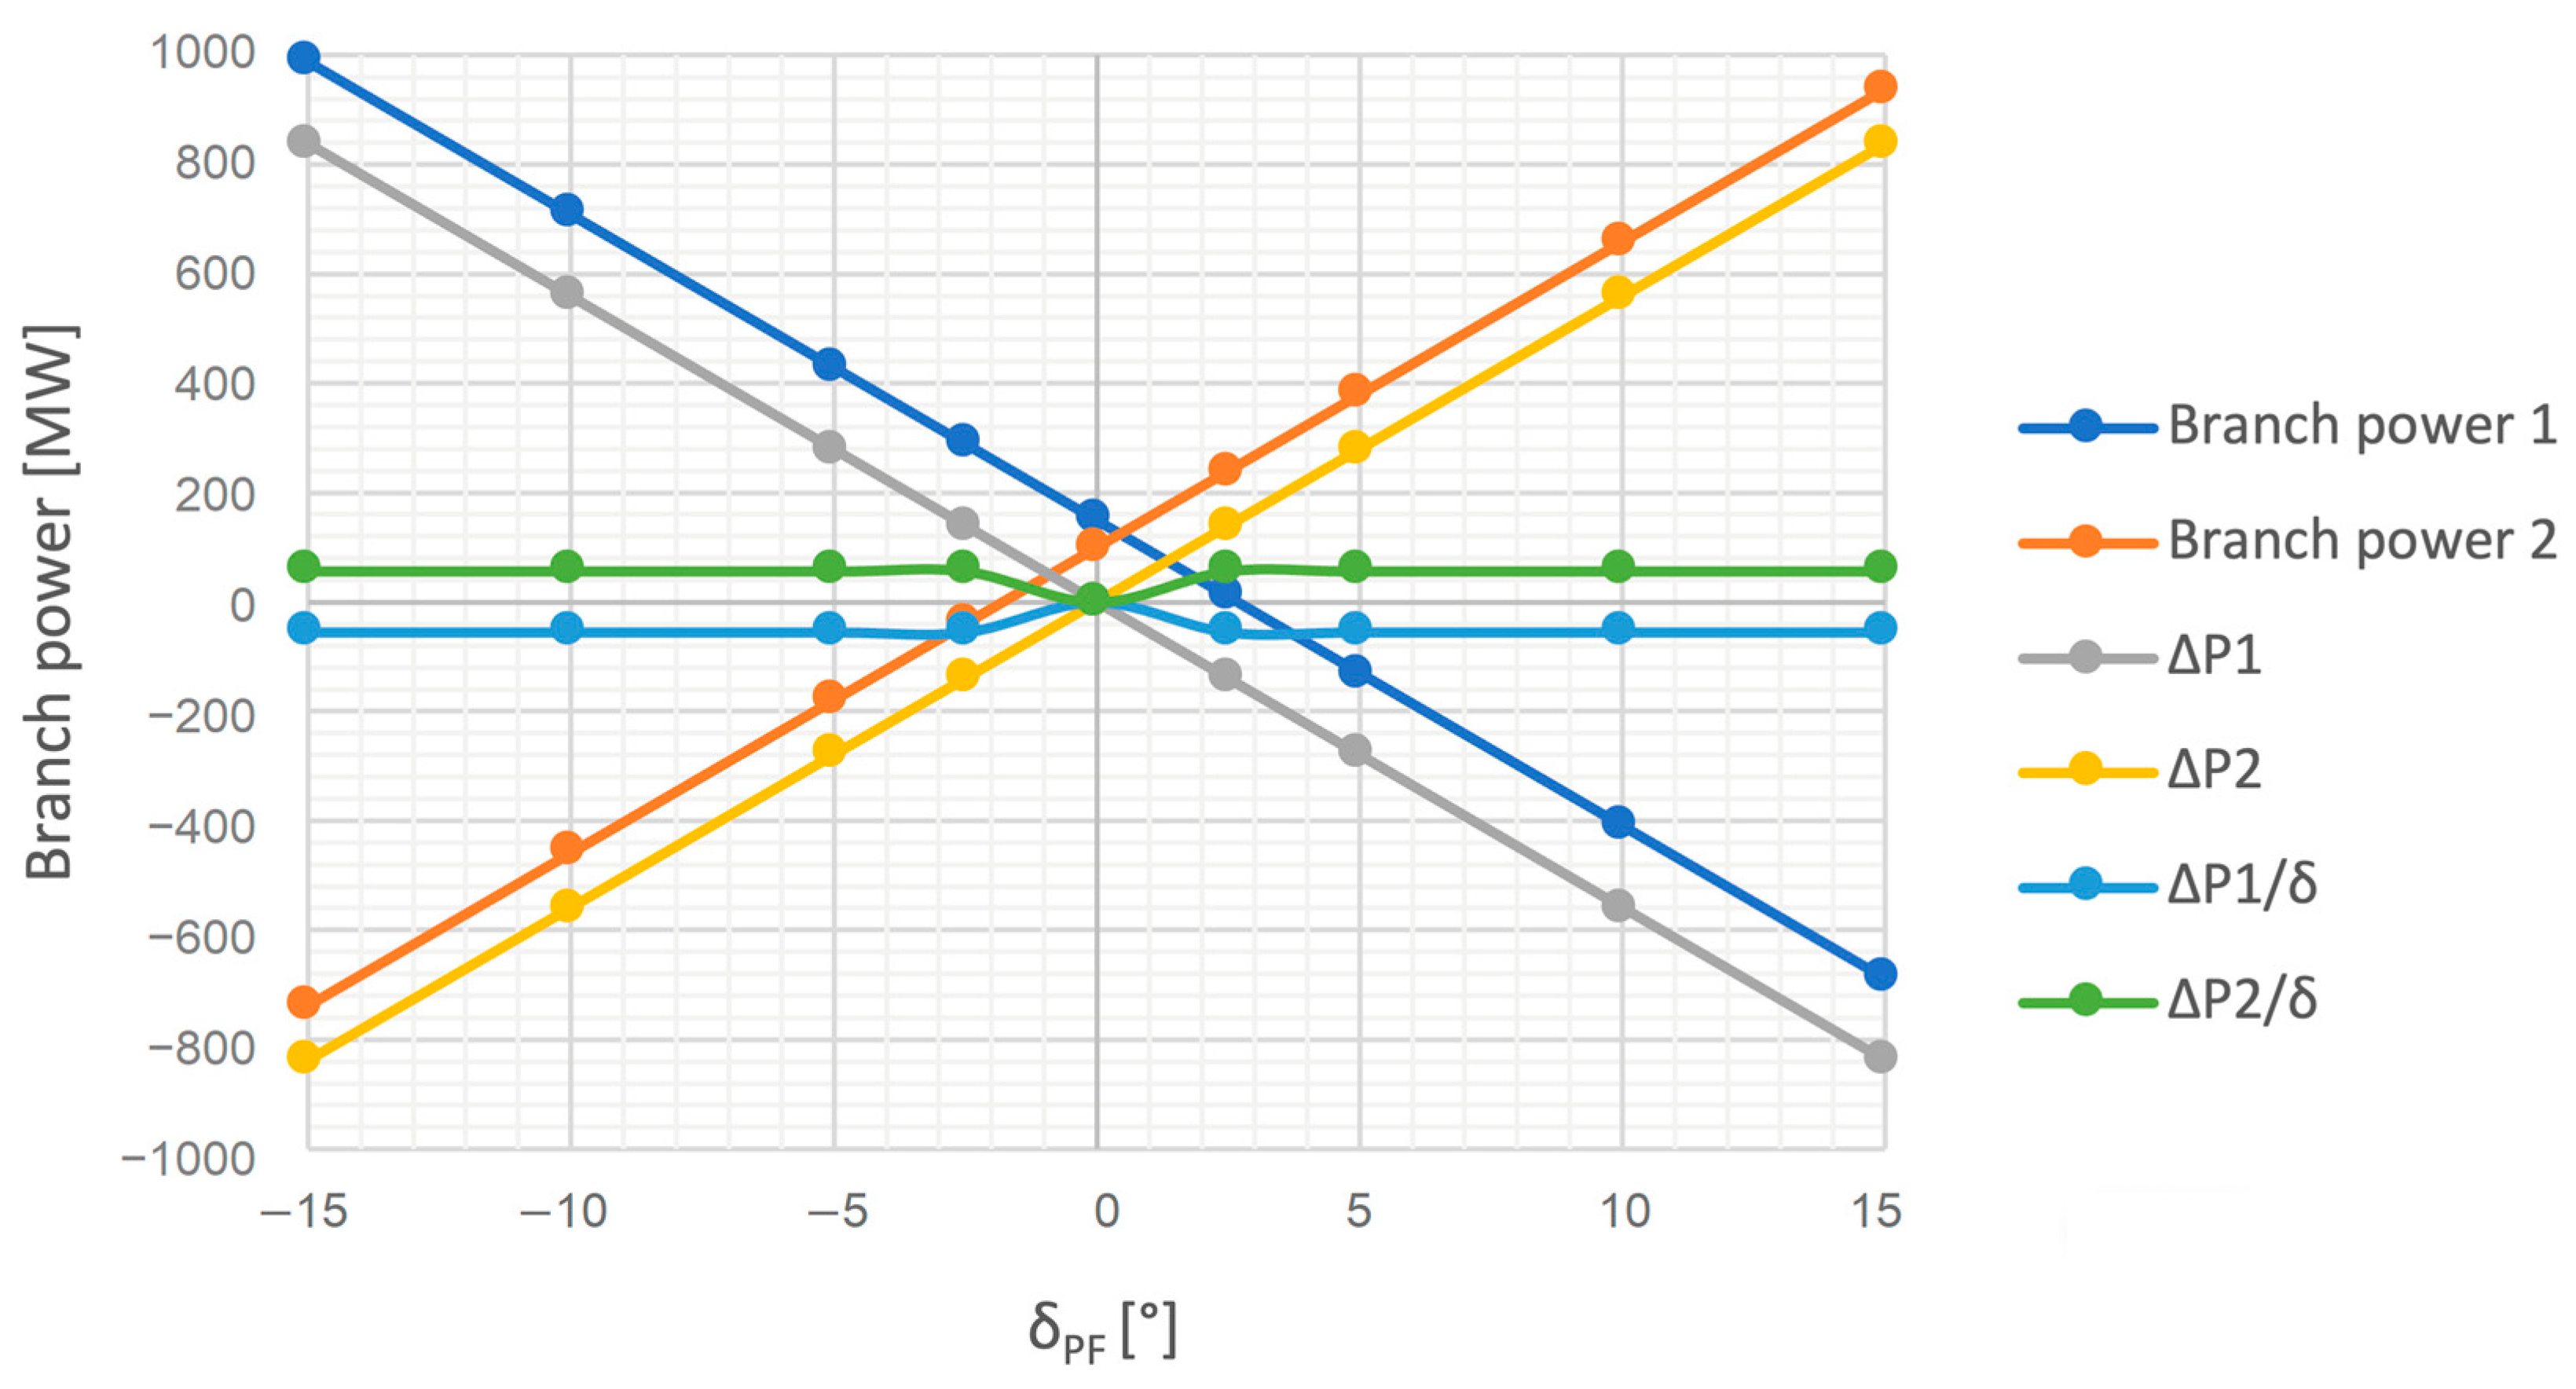
To sum up, Equations (19) and (21) determine the power change in the considered network system, which is introduced by the phase shifter. Note that the total power injected into the system does not change. Only the flows P I and P I I are changed with the same power, because in this particular example, Δ P I = Δ P I I . Power changes are presented in Figure 14.
The phase shifter control introduces a linear change in power and the ratio of the power introduced into the system as a result of the regulation to the angle α P F being constant. This ratio was defined as the regulation factor:
w r = Δ P g δ P F
where:
  • Δ P g —the power flow change in the network as a result of using phase shifter control;
  • δ P F —the phase shifter adjustment angle at which the power change Δ P g occurs;
Based on the Equations (19), (21), and (22), a correlation between the value of the coefficient w r and the branch reactance can be seen. The greater the branch reactance, the lower the regulation coefficient w r will be, while the lower the branch reactance, the greater the regulation coefficient will be w r .

4.3.2. Example 2

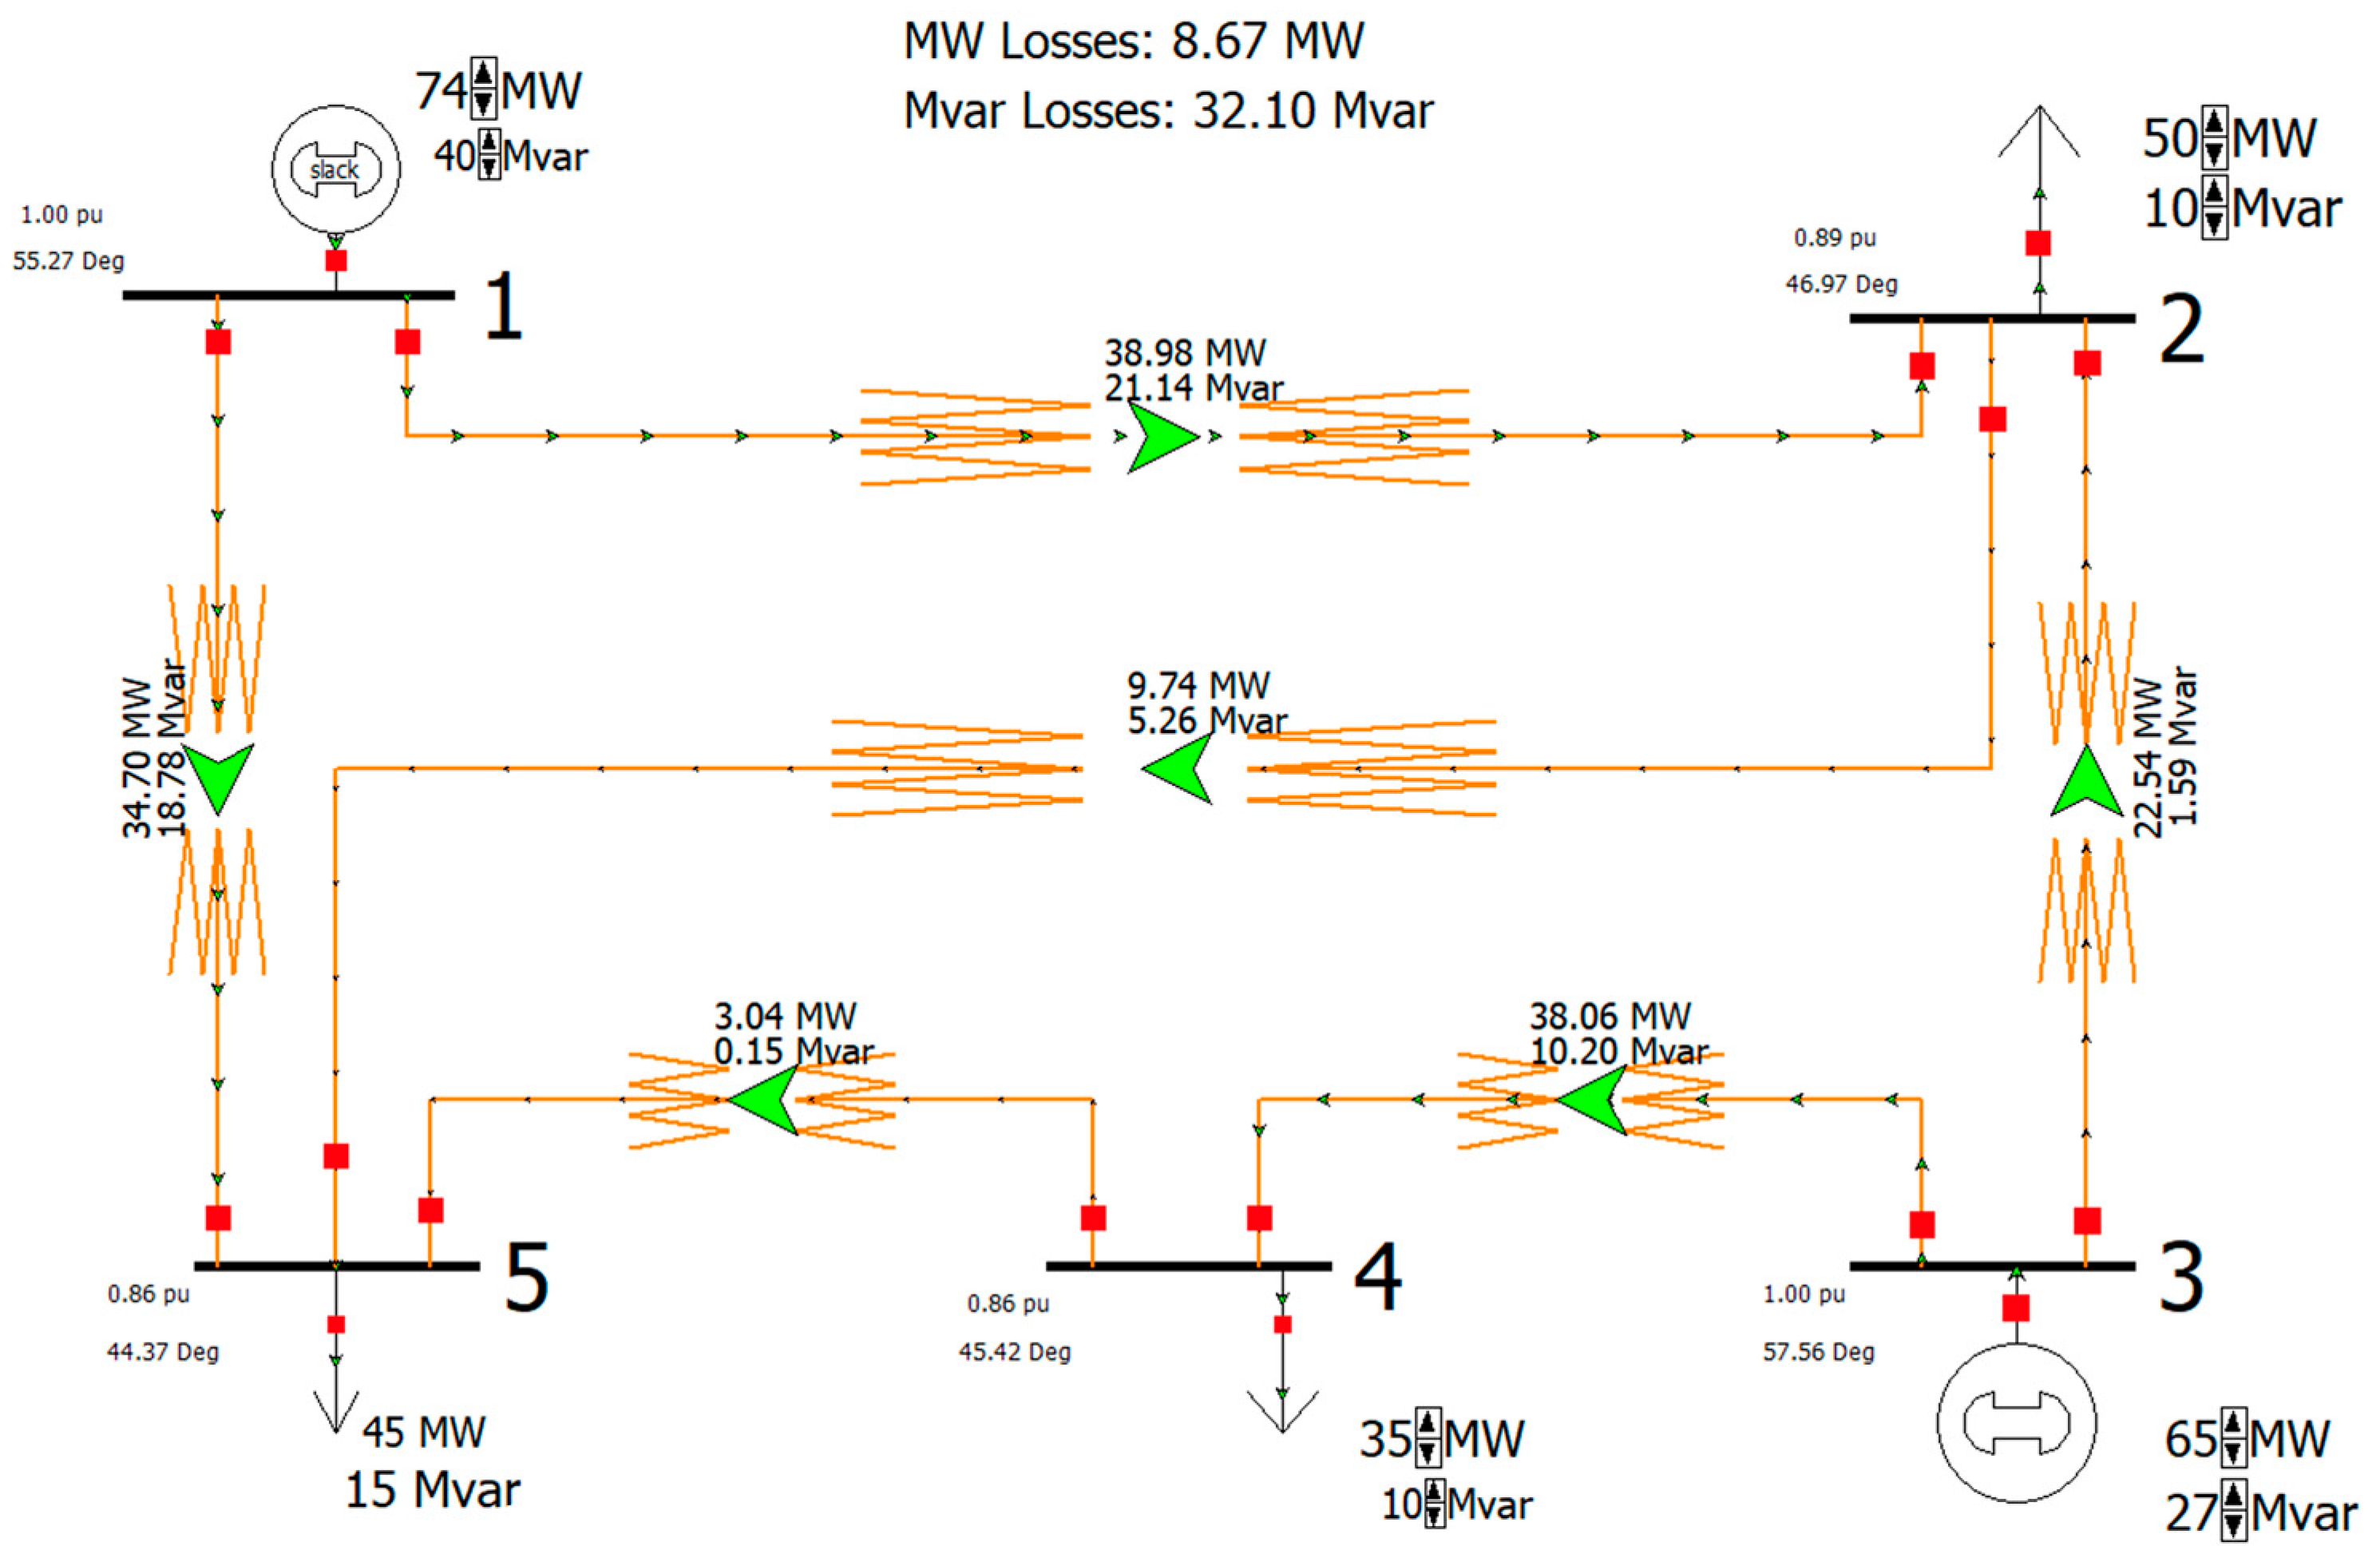
Another example is based on data published in [9] concerning a 5-bus IEEE test system (Figure 15). The branch and nodal data of this system are given in Table 2 and Table 3. The relative units refer to the base power 100 MVA.
Based on the parameters listed in Table 2, all the series and shunt admittances of the lines as well as the ground admittances of the nodes were determined and summarized in the Table 4.
The system nodal admittance matrix has the following general form:
Y w z = [ Y _     11 Y _     12 0 Y _     21 Y _     22 Y _     23 0 Y _     32 Y _     33           0 Y _     15 0 Y _     25 Y _     34 0 0 0 Y _     43 Y _     51 Y _     52 0           Y _     44 Y _     45 Y _     54 Y _     55 ]
The nodal admittance matrix of the 5-bus IEEE system at the neutral tap (regulation angle PF = 0°) takes the values:
Y w z = [ 1.05 j 4.18 0.59 + j 2.49 0 0.59 + j 2.49 1.6 j 5.95 0.46 + j 1.15 0 0.46 + j 1.15 0.9 j 3.01           0 0.46 + j 1.69 0 0.55 + j 2.31 0.44 + j 1.86 0 0 0 0.44 + j 1.86 0.46 + j 1.69 0.55 + j 2.31 0           0.91 j 3.98 0.47 + j 2.12 0.47 + j 2.12 1.48 j 6.12 ]
Certain modifications were made to the 5-node IEEE test system modeled in PowerWorld. The modification of the test system consisted of introducing a phase shifter with admittance parameters equal to the parameters corresponding to the line to each branch. The modification allows for the observation of changes in the flow of active and reactive power in the system, regulating only the change in the load angle within ±30°. The range of changes in the load angle results directly from the activities carried out by the TSO. The power flow was calculated using the Newton–Raphson method.
The following parameters were observed in the system: active power flow in the branch, reactive power flow in the branch, active power losses, reactive power losses, and changes in the admittance matrix parameters during regulation.
The amounts of received power and the amounts of generated power were not changed; only the balancing bus covered the current increase in losses in the considered system.
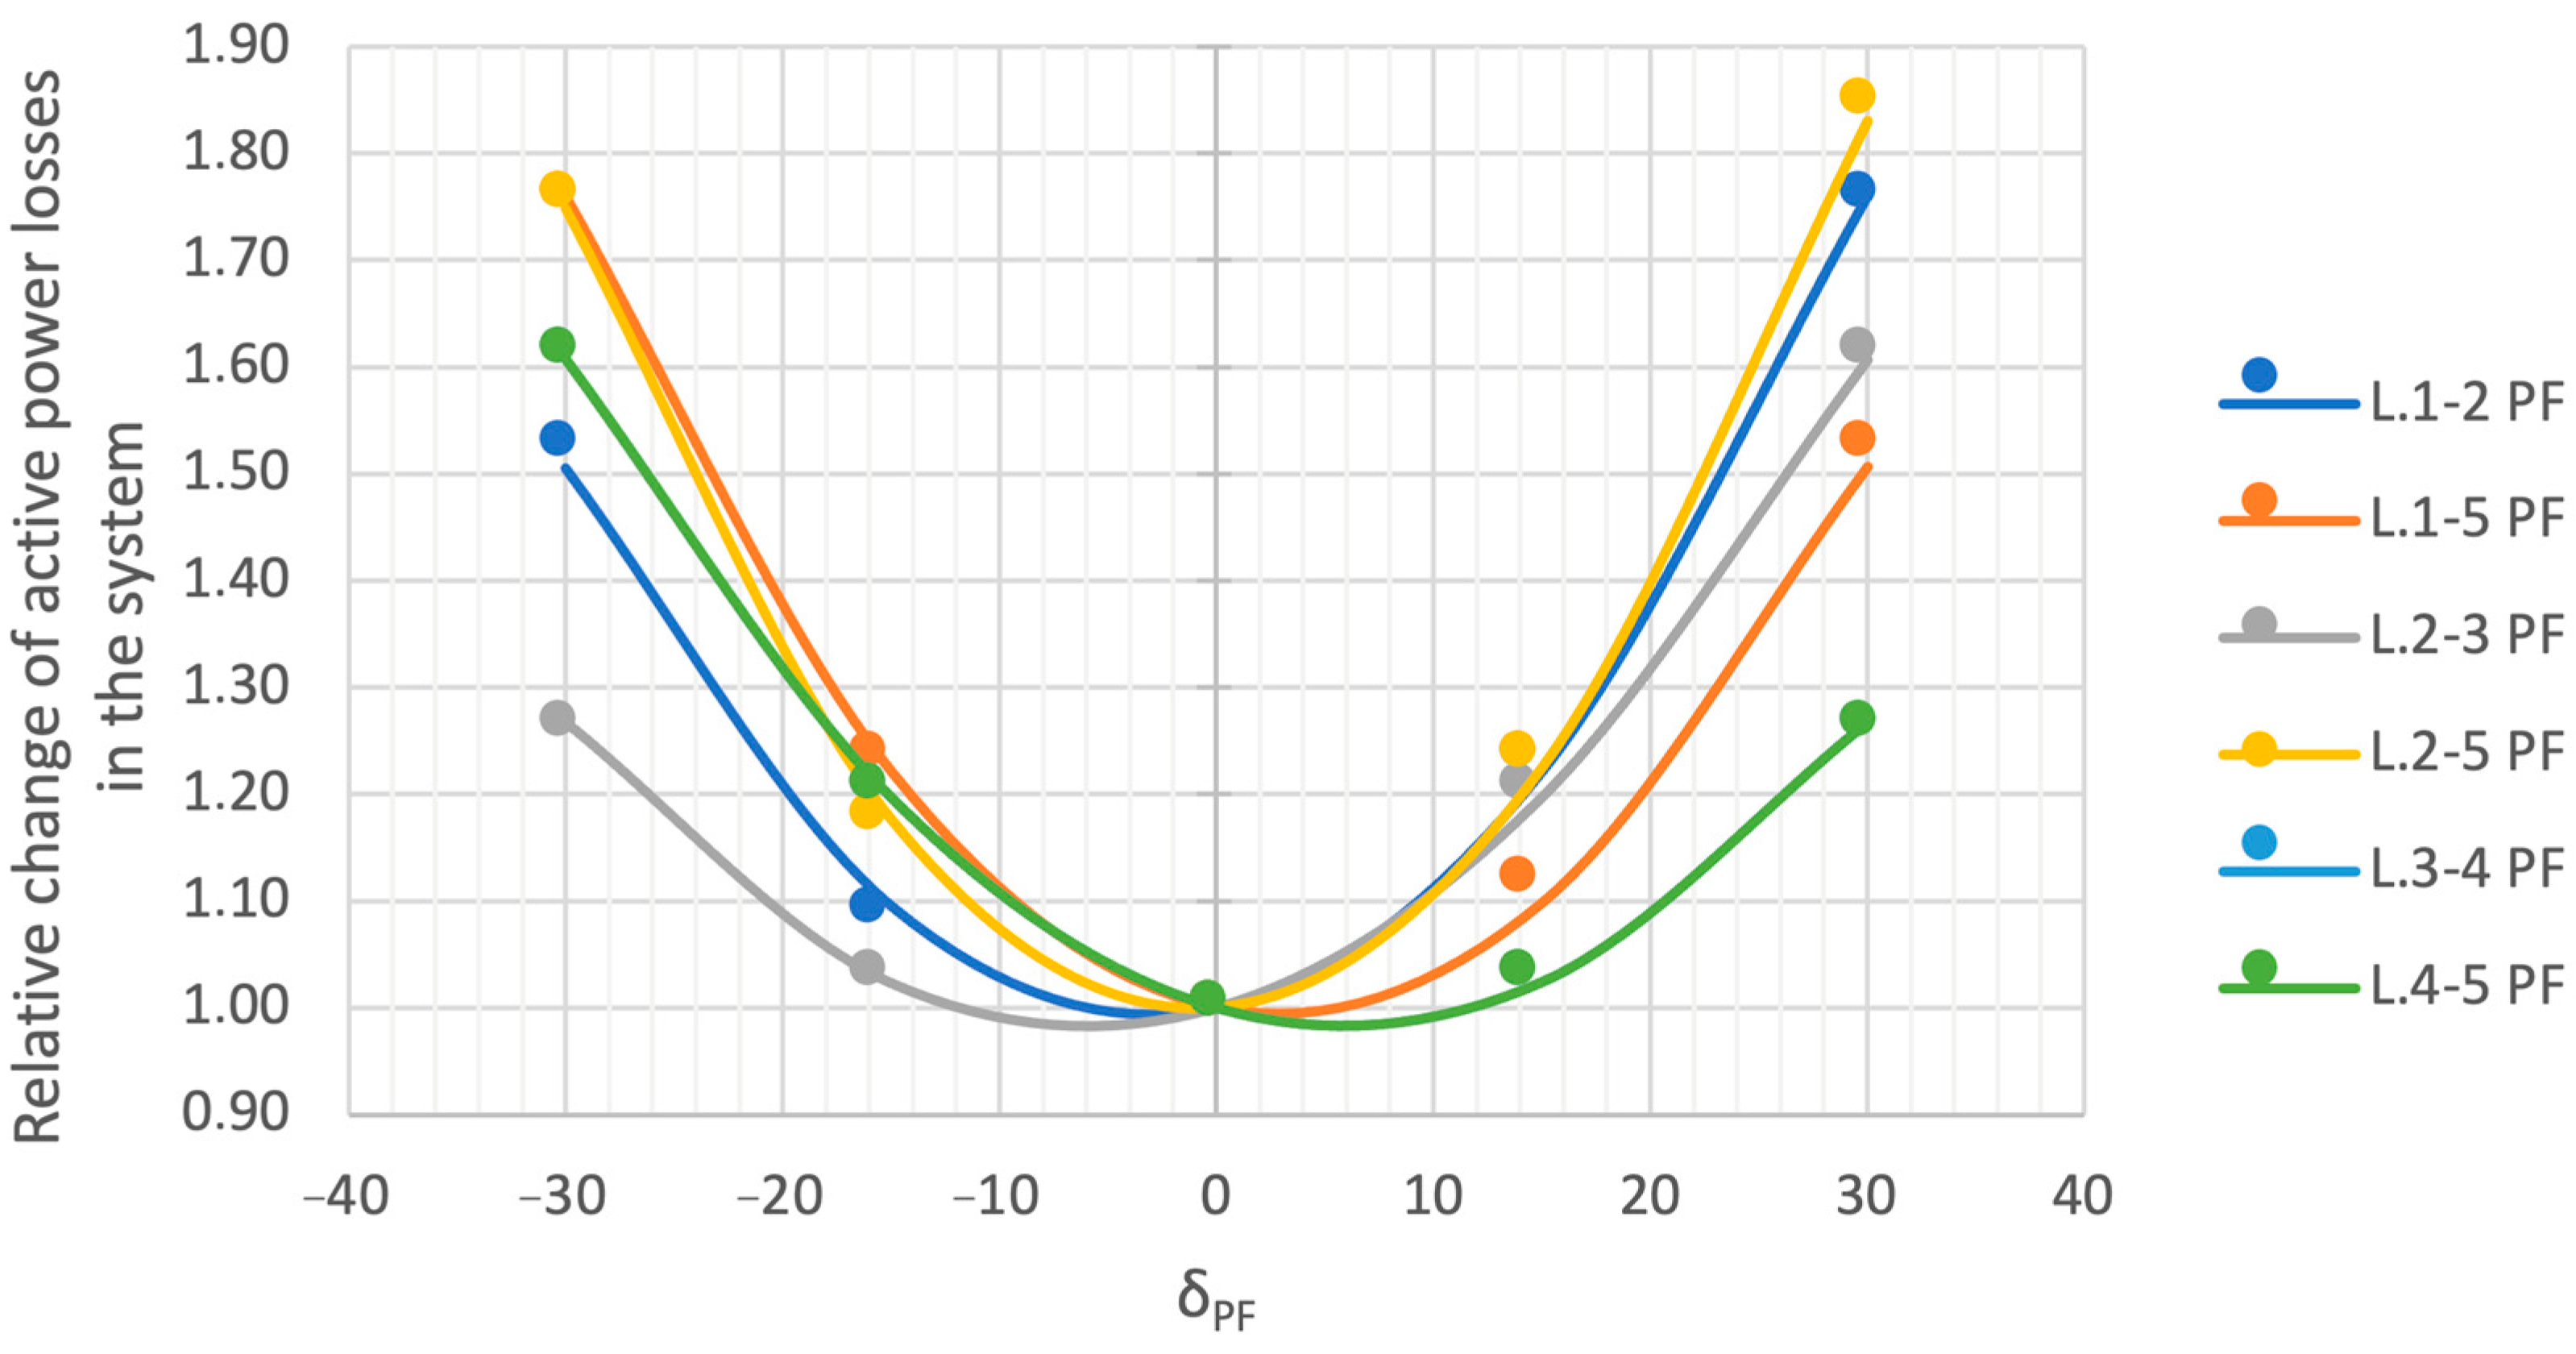
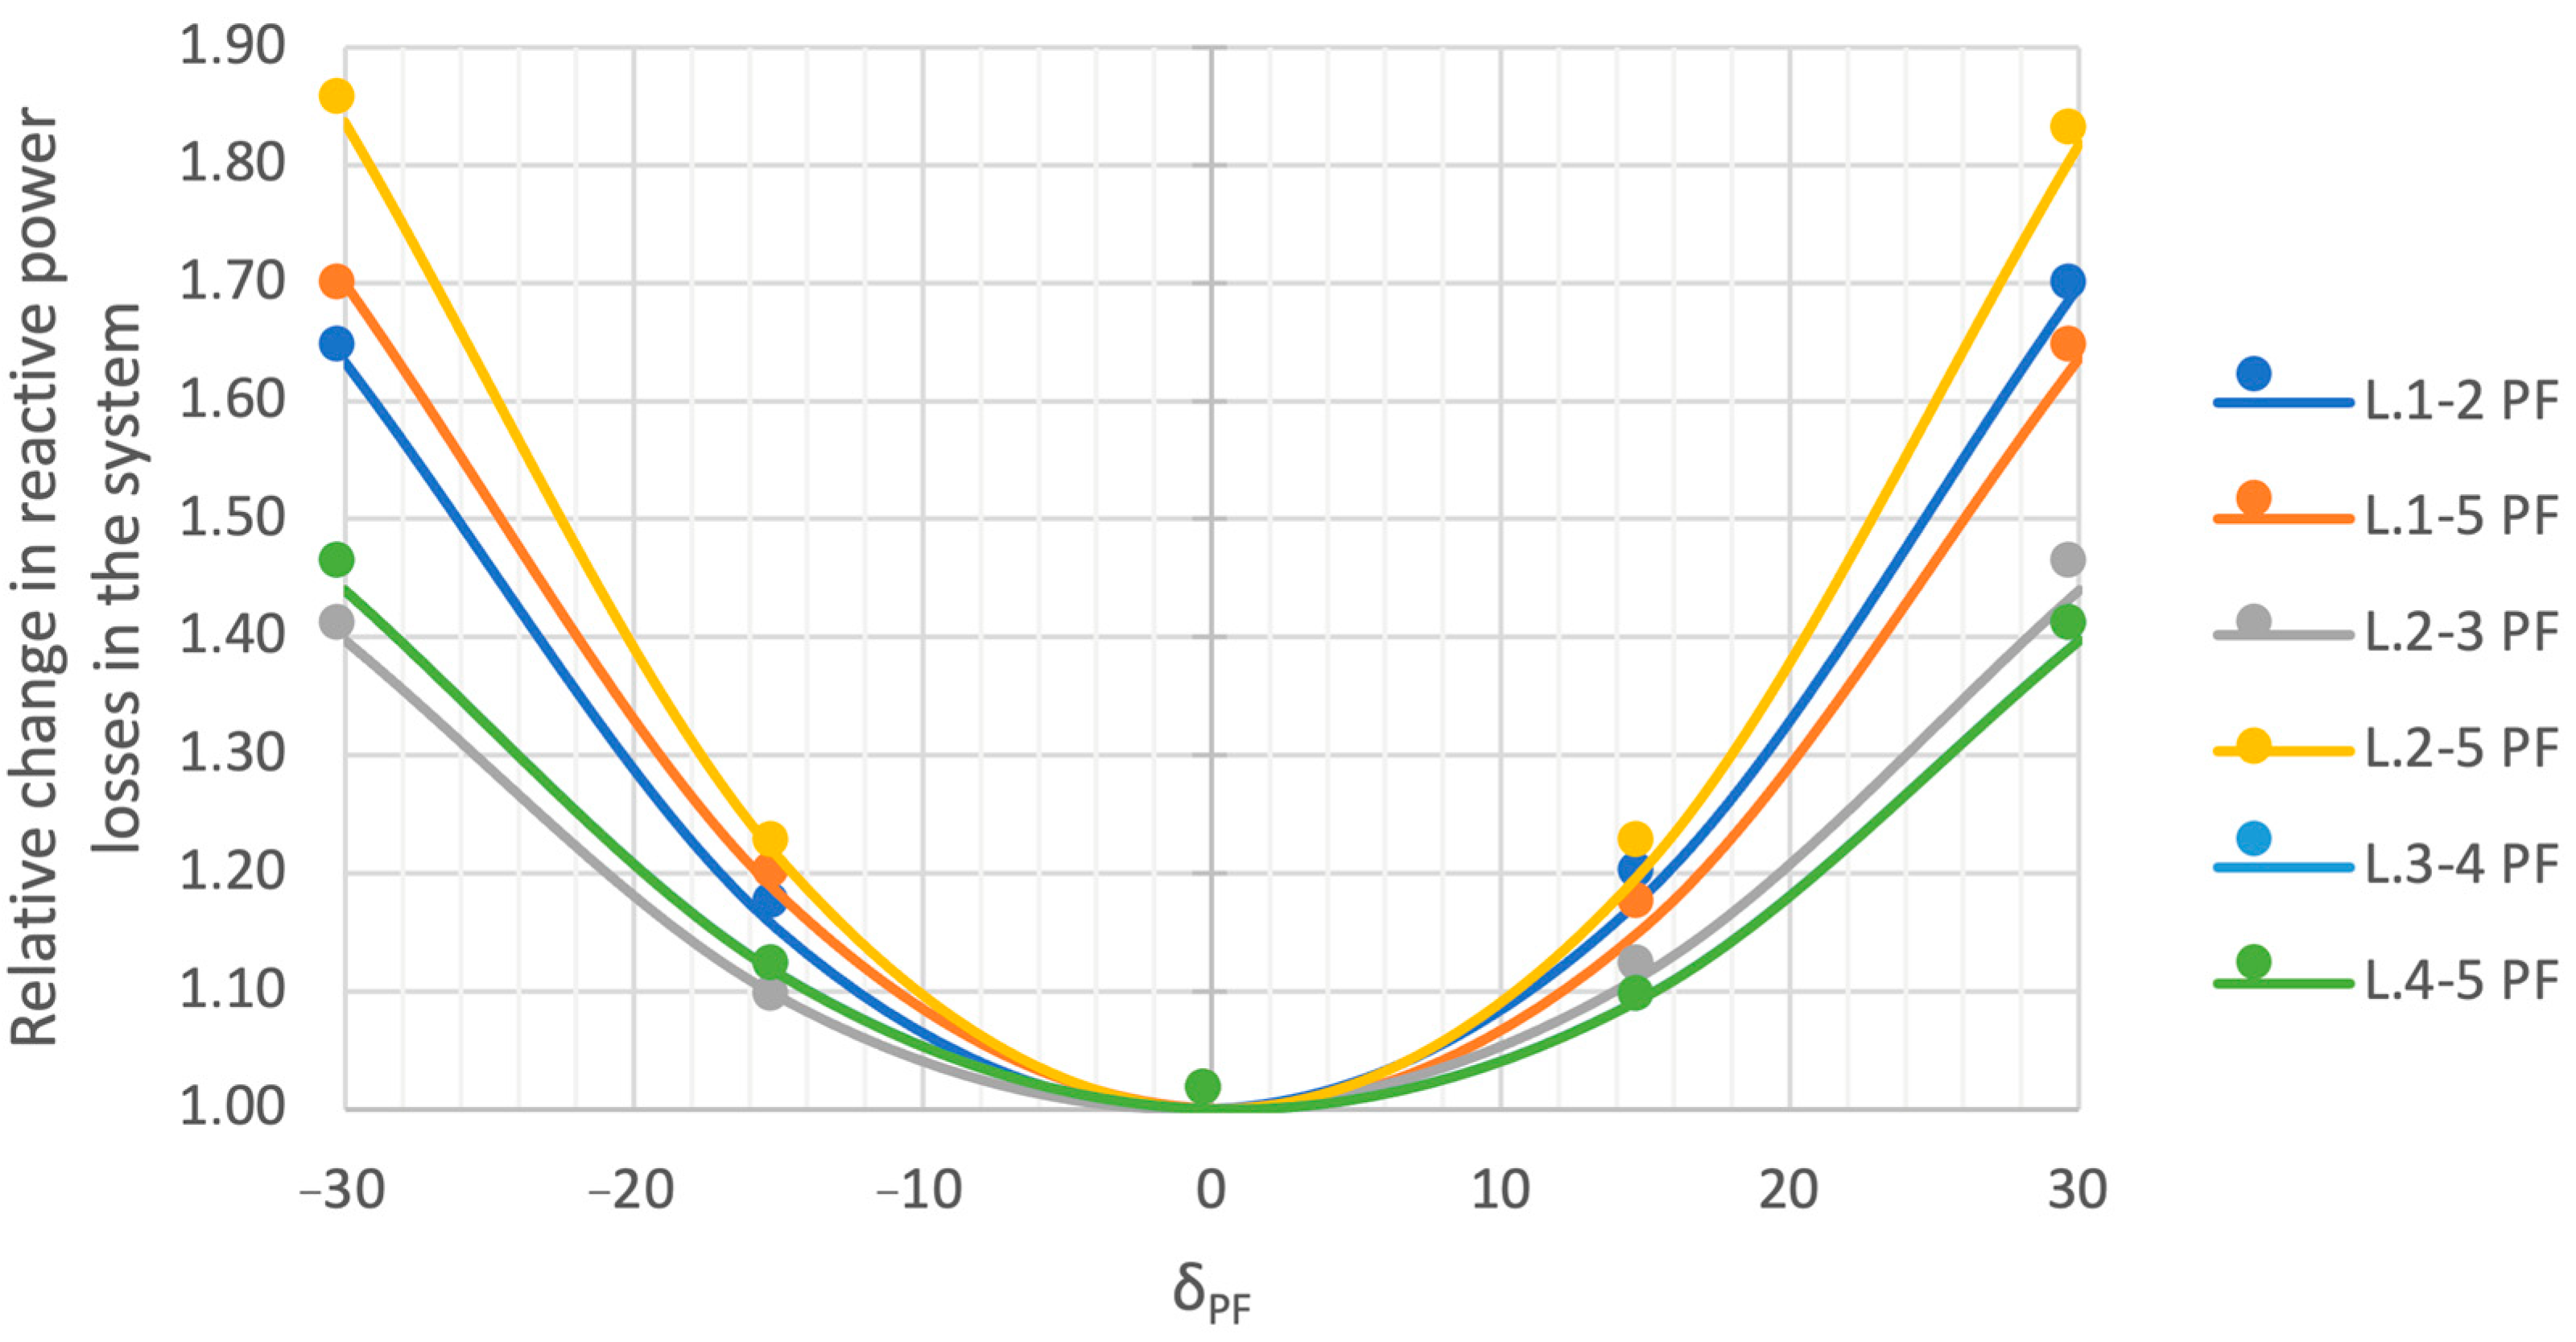
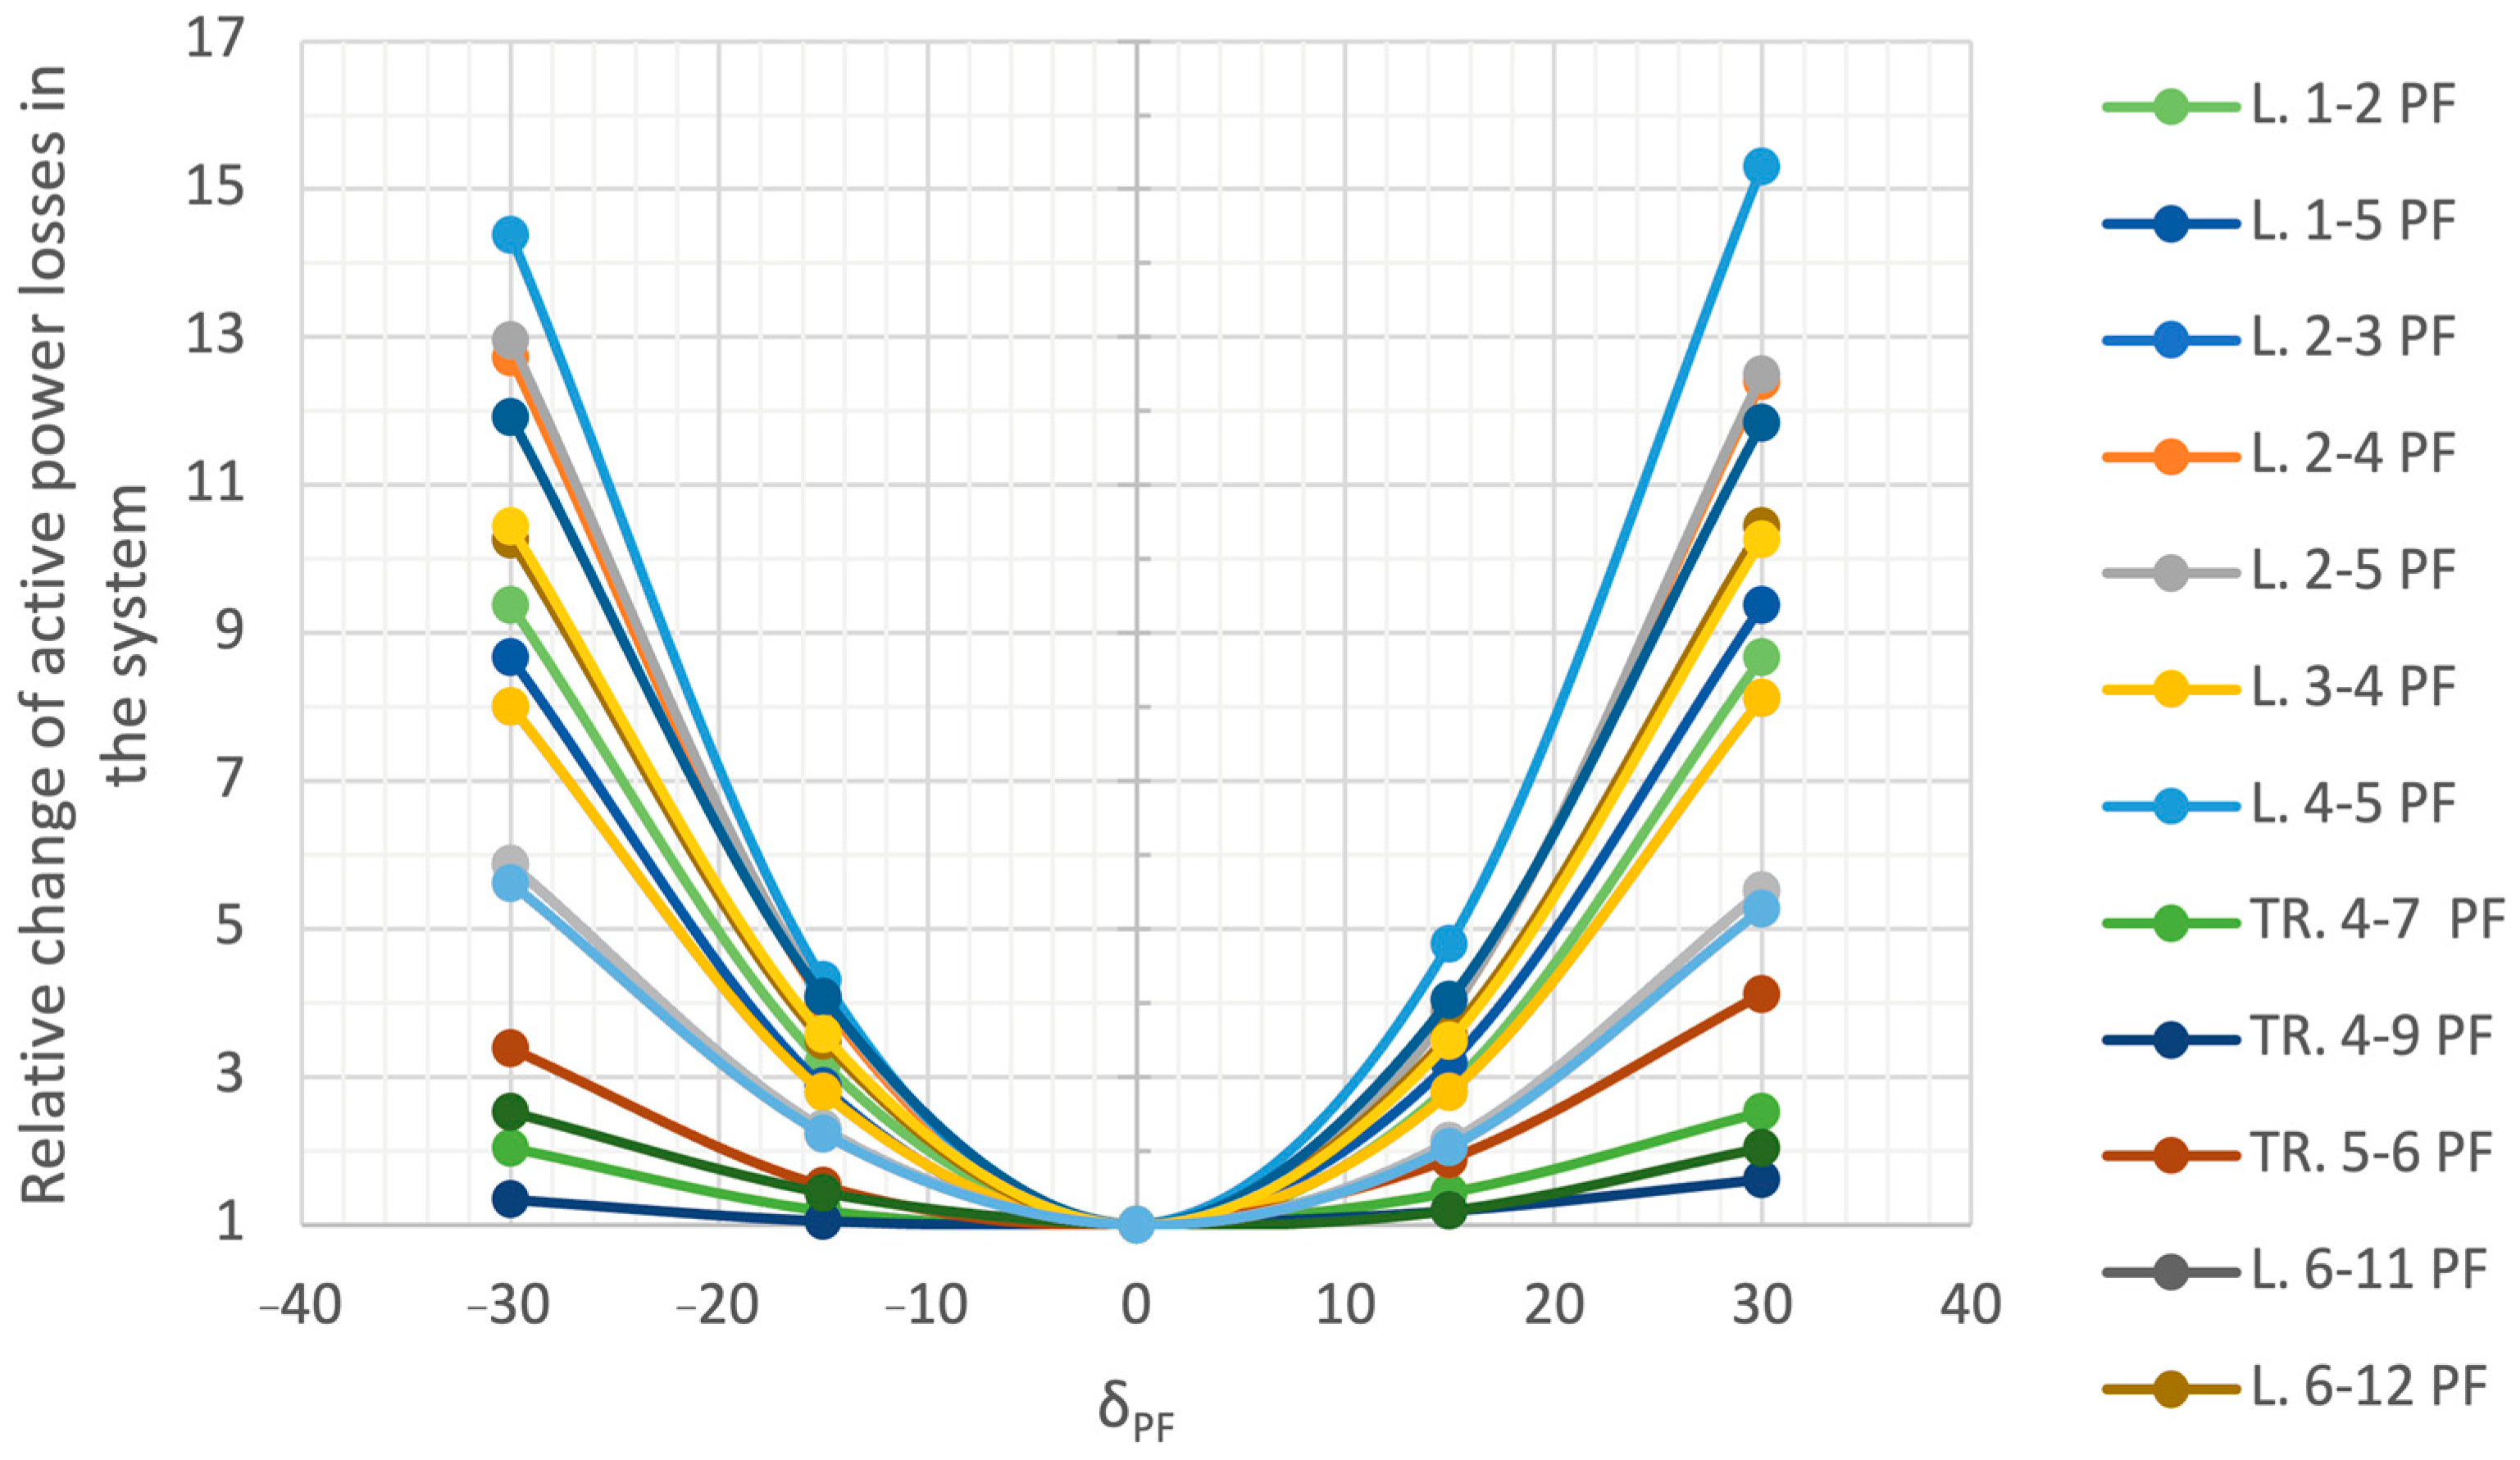
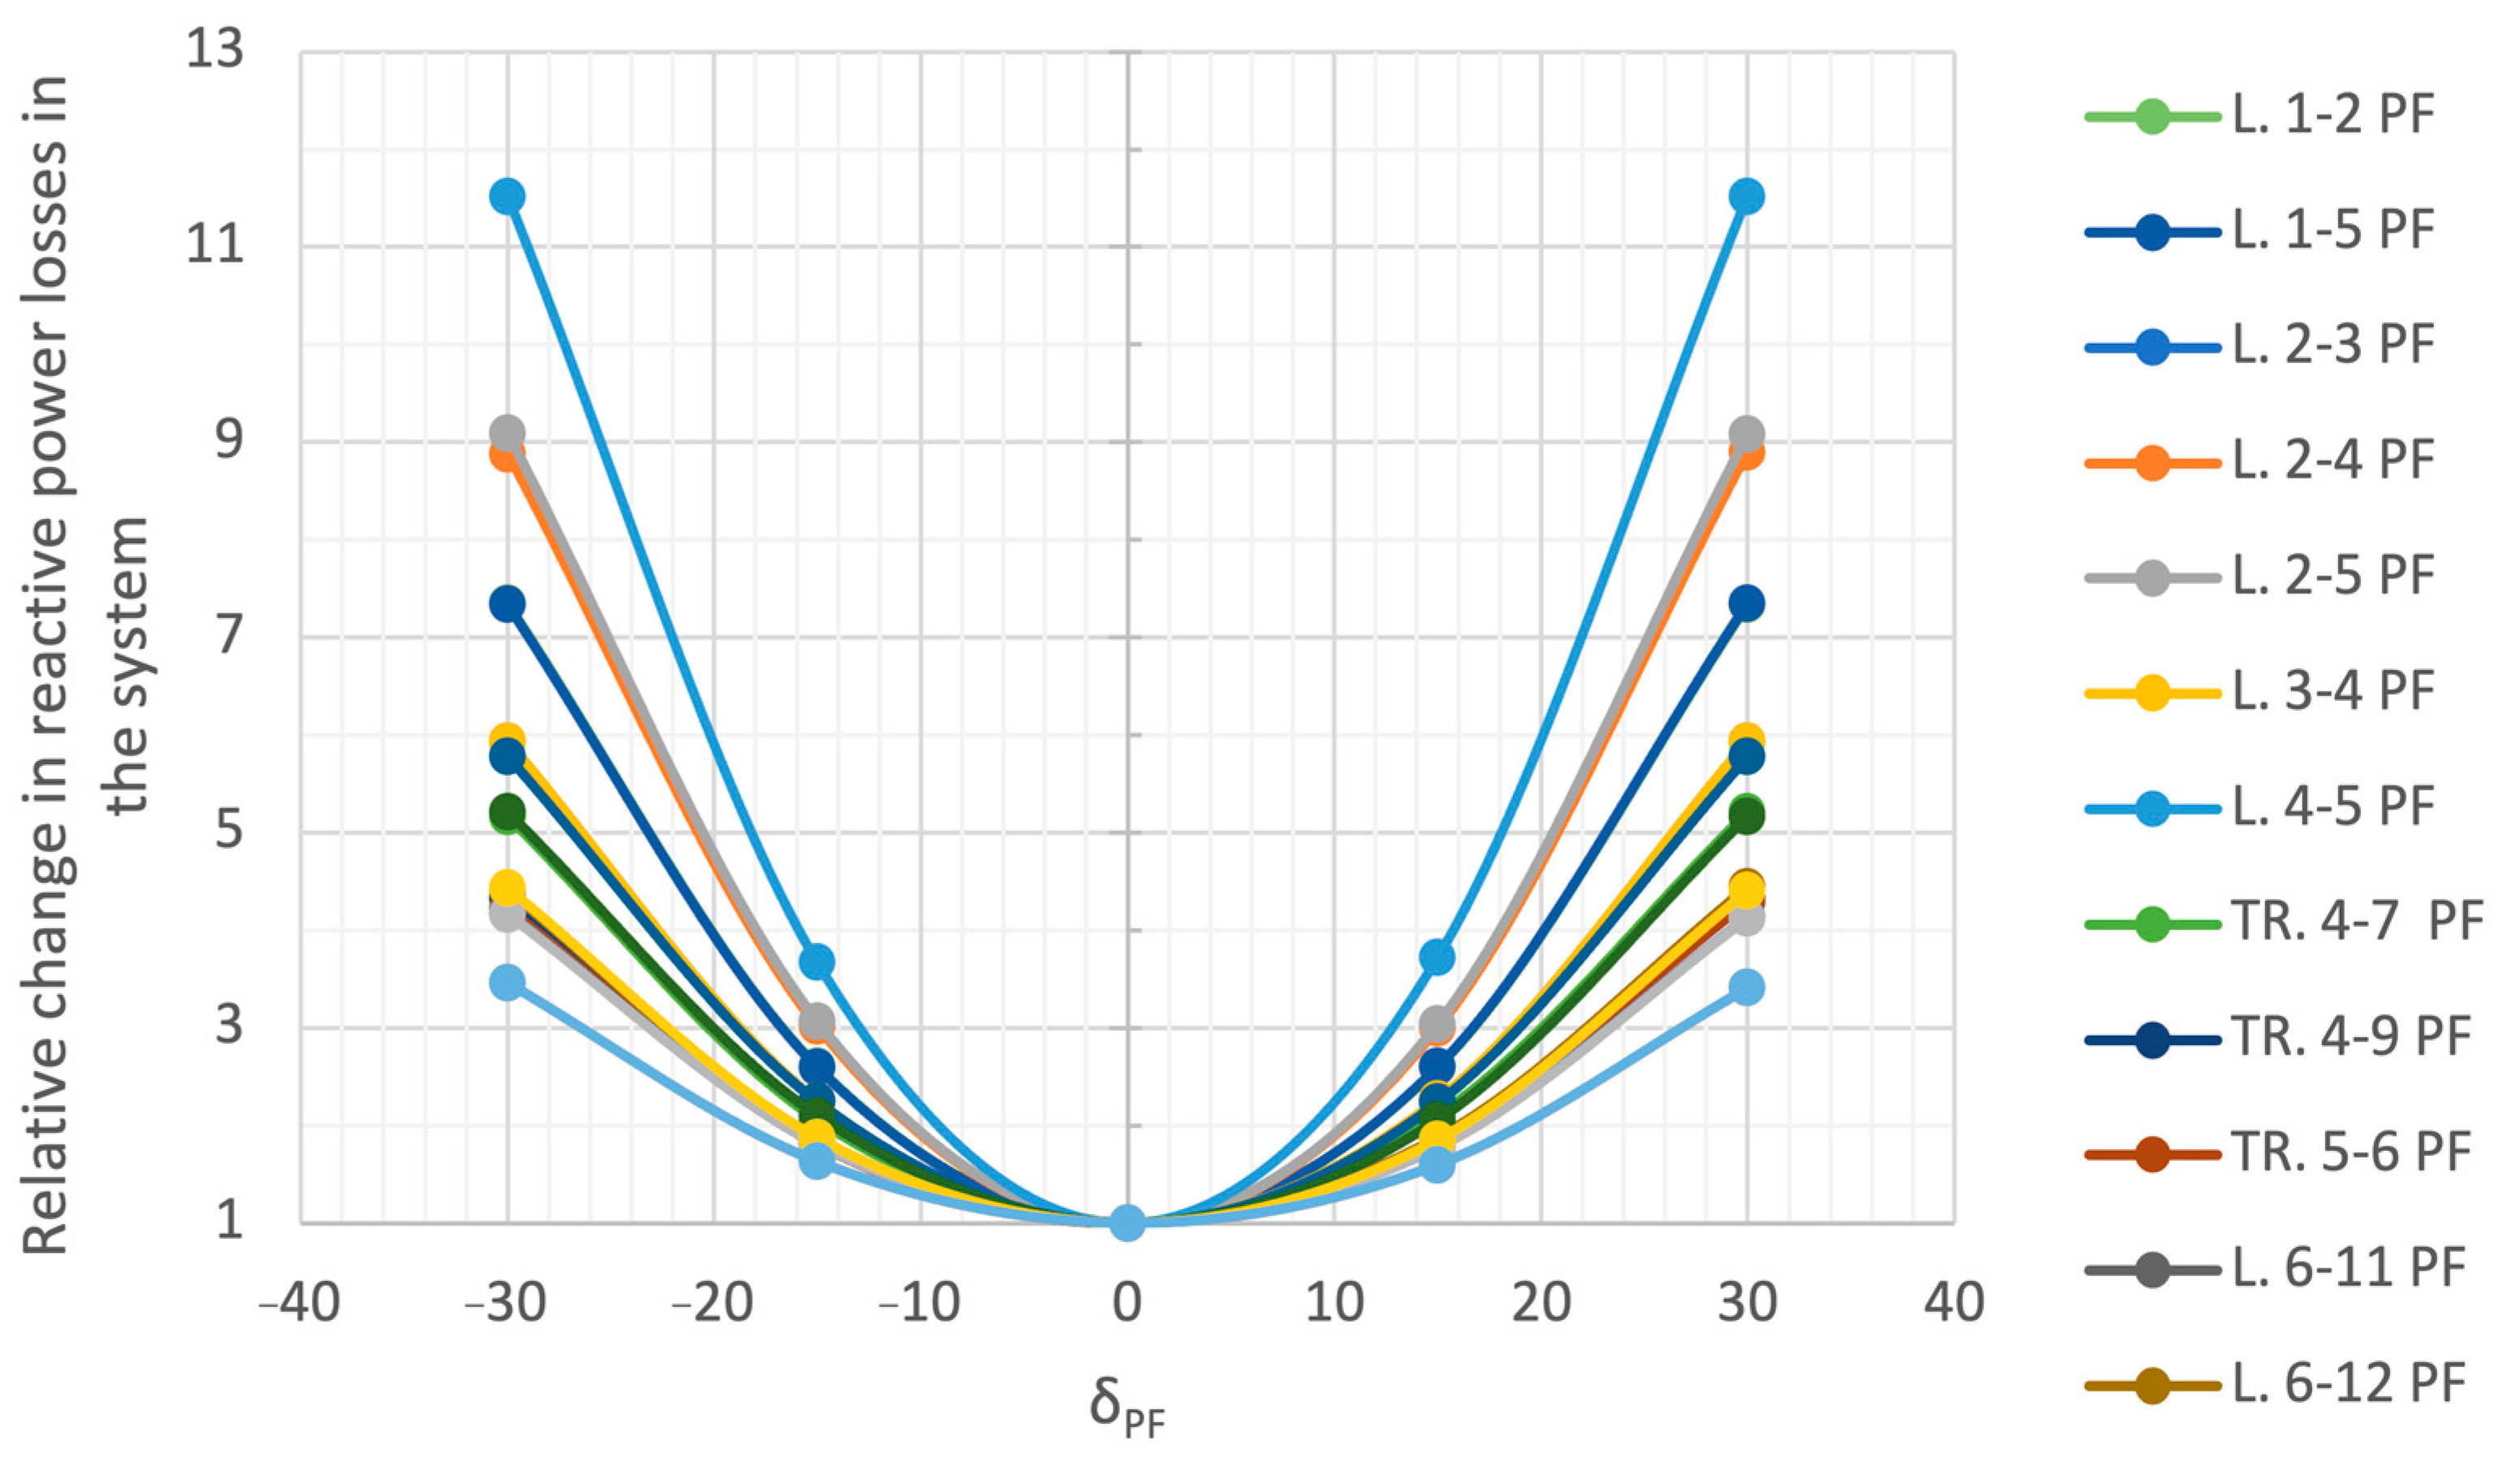
On the basis of the obtained results, the dependencies of changes in active power losses (Figure 16) and reactive power losses (Figure 17) were plotted in the system as a function of the load angle. These charts clearly show that any change in the load angle significantly increases the power losses in the system.
The admittance matrix of the tested network system changes only in those matrix elements that are directly related to the complex ratio of the transformer. The change concerns only non-diagonal elements corresponding to the parameters of the branch in which the phase shifter is installed. The values of these elements can be determined from Equations (11) and (12). The diagonal elements of the nodes do not change.

4.3.3. Example 3

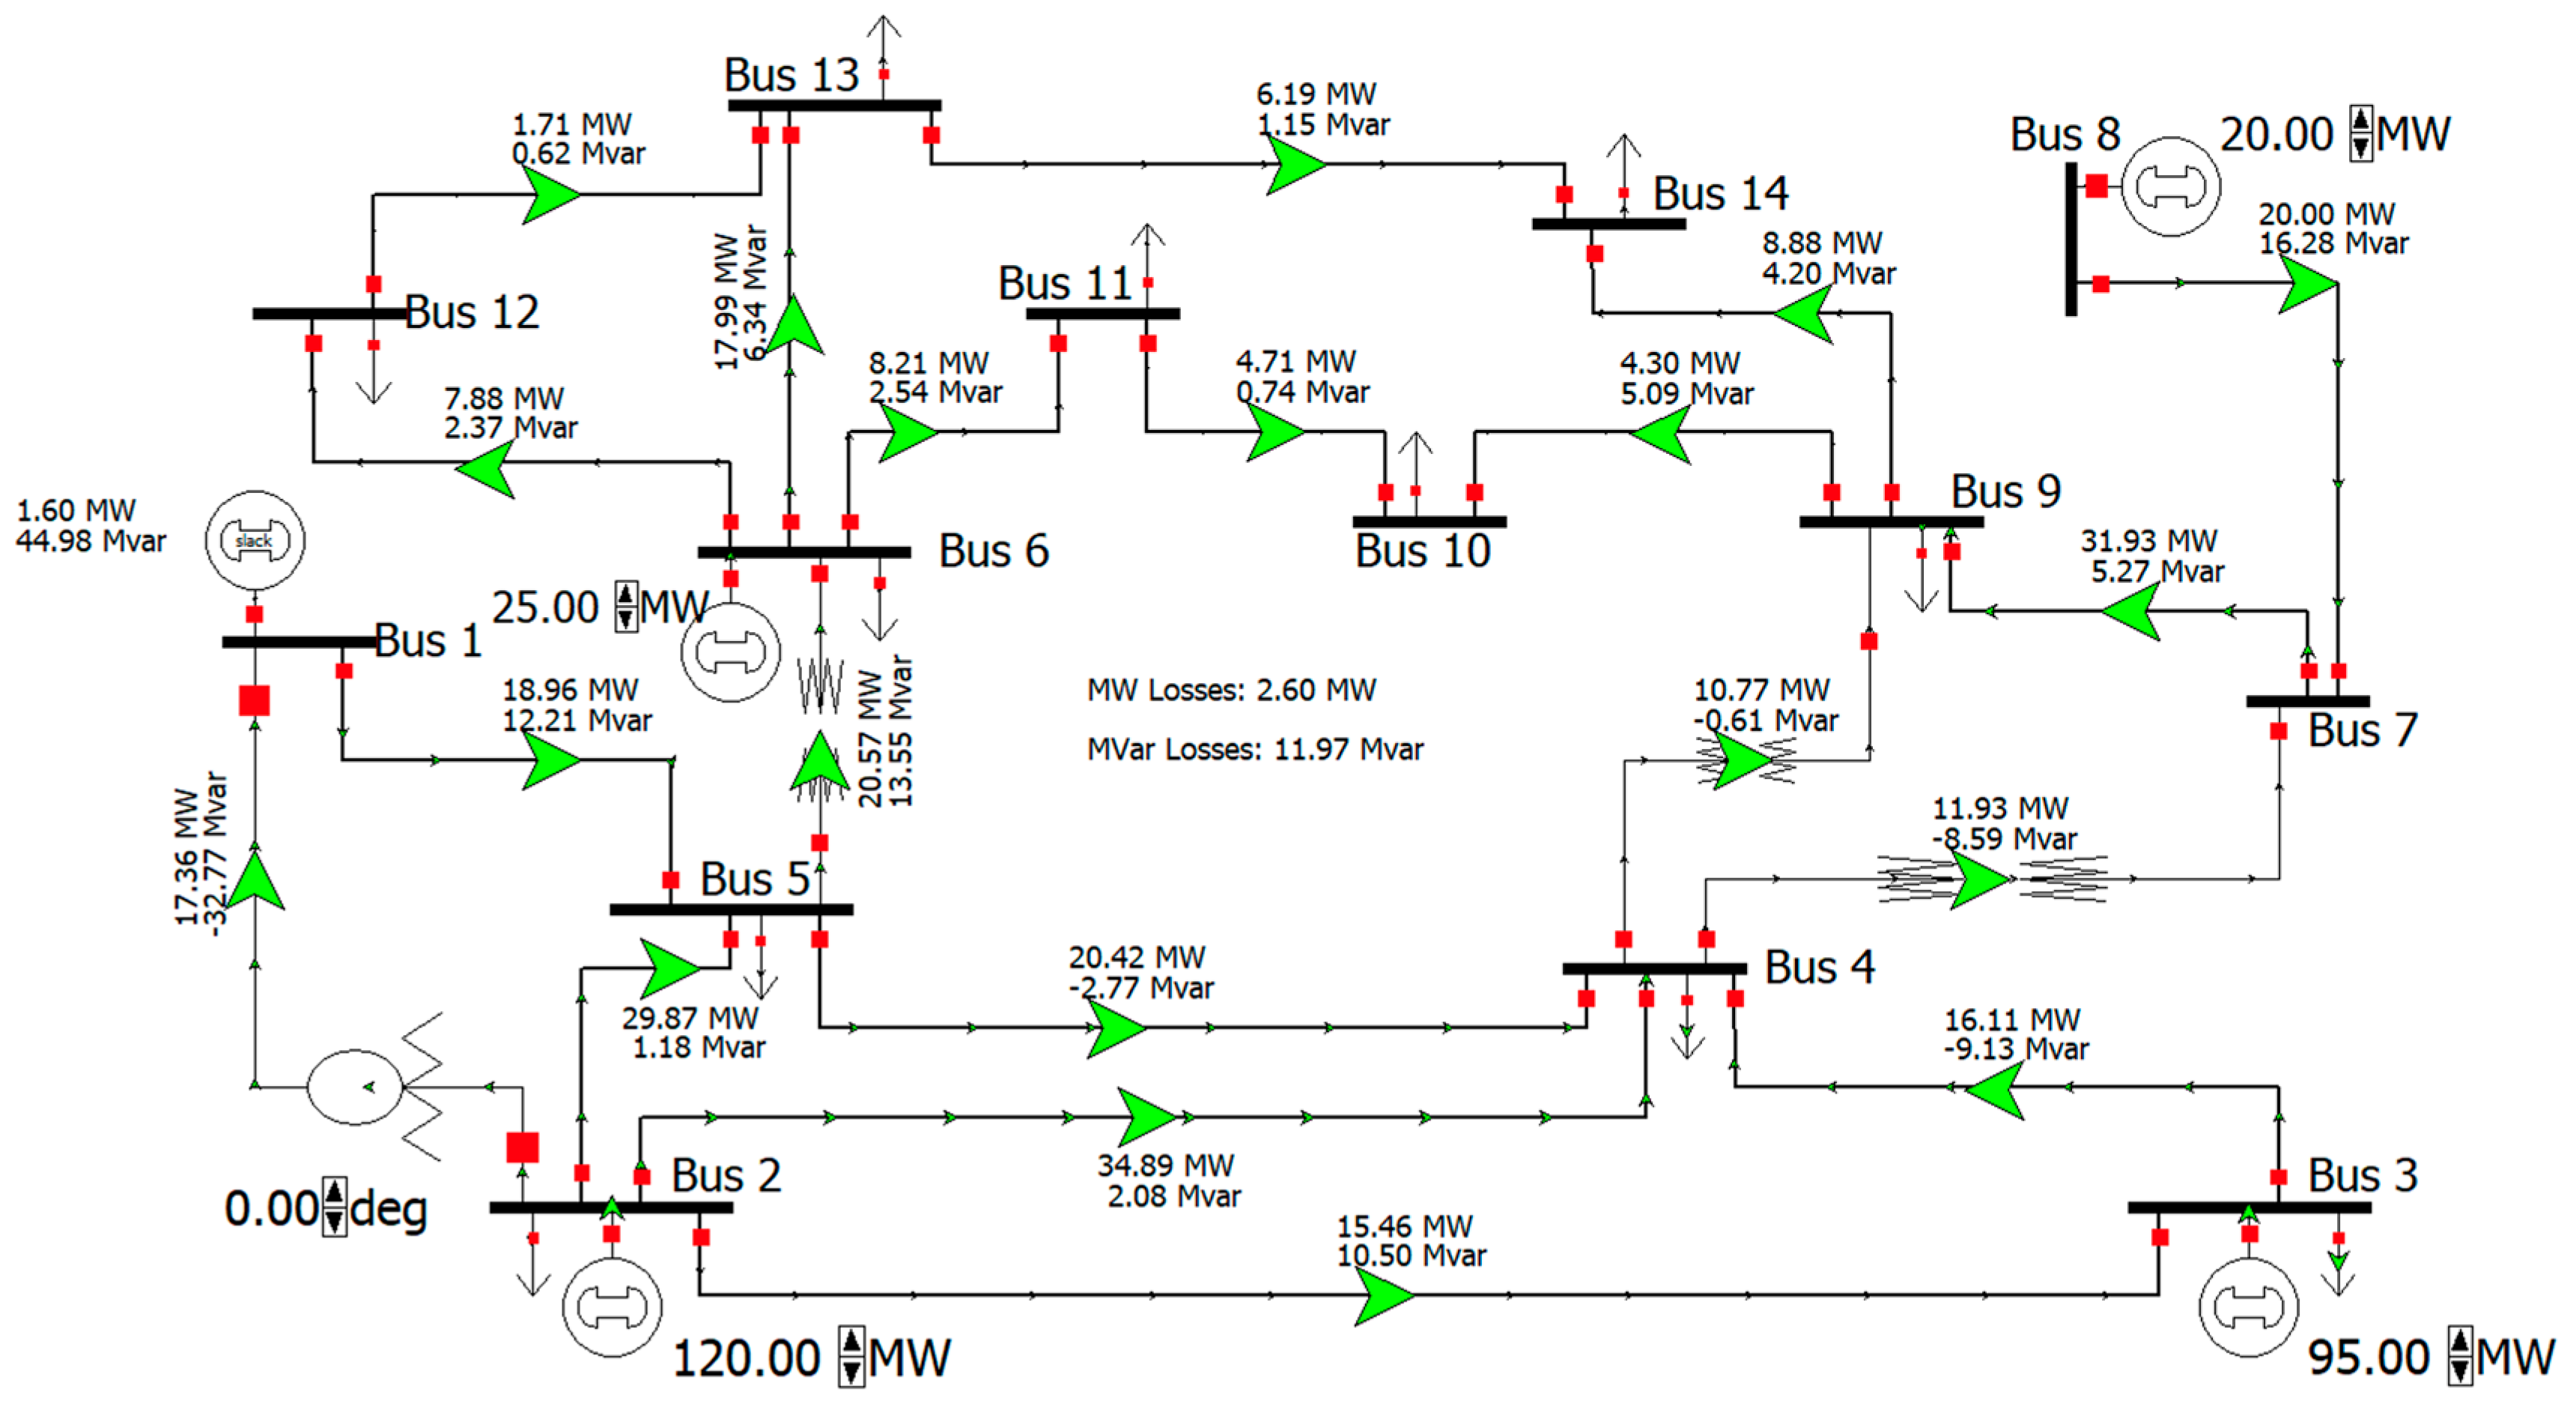
While confirming the conclusions from the previous examples, the test system was developed to include a larger number of nodes and two voltage levels. The 14-bus IEEE (14 W) test system was used. Figure 18 shows a schematic of the test system.
The complete branch and nodal data of this system are given in Table 5 and Table 6. The relative units refer to a basic power of 100 MVA.
Based on the parameters listed in Table 2, all the series and shunt admittances of the lines as well as the ground admittances of the nodes were determined (Table 4).
Finding the optimal operating point of the tested system is much more complicated and must take into account a number of factors influencing its changes. The system should meet the conditions of the basic N-1 criterion with the least possible impact on the increase in power losses. When the phase shifter is in a neutral position (tap 0°), natural flow takes place. Changing the shifter’s catch, which requires a change in the load angle, artificially changes the operating point of the system and removes it from the “natural” flow, introducing an increase in active and reactive power losses. The power losses in the 14 W system are shown in the Figure 19 and Figure 20.
The 14 W IEEE diagram is based on two subsystems with different rated voltages: 220 kV and 110 kV. Due to this fact, the influence of both of the control components of the transformer set on the parameters of the system can be noticed. The 14 W model uses regulating transformers with separately complex regulation. This regulation affects the flow of reactive power in the system and the flow of active power independently of each other. By changing both parameters, it is possible to achieve a compromise consisting of minimizing the power losses in the system, which is a desirable feature.

4.3.4. Summary of Test Analyses

  • Transformer units with complex regulation are a very simple method of controlling active and reactive power flows in the power system. The regulation is based on the change in network admittance.
  • Each change in the complex ratio of the transformer (both the voltage magnitude and the phase angle) generates an increase in power losses in the system. The settings should therefore be a compromise between increasing losses and the need to obtain new regulatory capacity.
  • The transformer unit with complex regulation is modeled as an asymmetric ∏-equivalent. The complex ratio, depending on the selected taps, changes the series and shunt parameters, affecting only the change in admittance of the non-diagonal branches in which such a unit is installed.
  • When analyzing the search for new locations for this type of devices, one should take into account the maximization of the regulatory capacity while minimizing network losses.

5. Algorithm of Searching for New Locations for Regulating Transformers

When choosing the optimal location to install a transformer set with separately complex regulation in the network, a number of technical and economic factors should be taken into account. For safety reasons, the goal is to find a bus in the network where the effects of regulation will allow for a wide range of regulation to be achieved. An important factor is also the minimization of network losses, that is, taking into account the economic effects of regulation.

5.1. Algorithm for Searching for New Locations

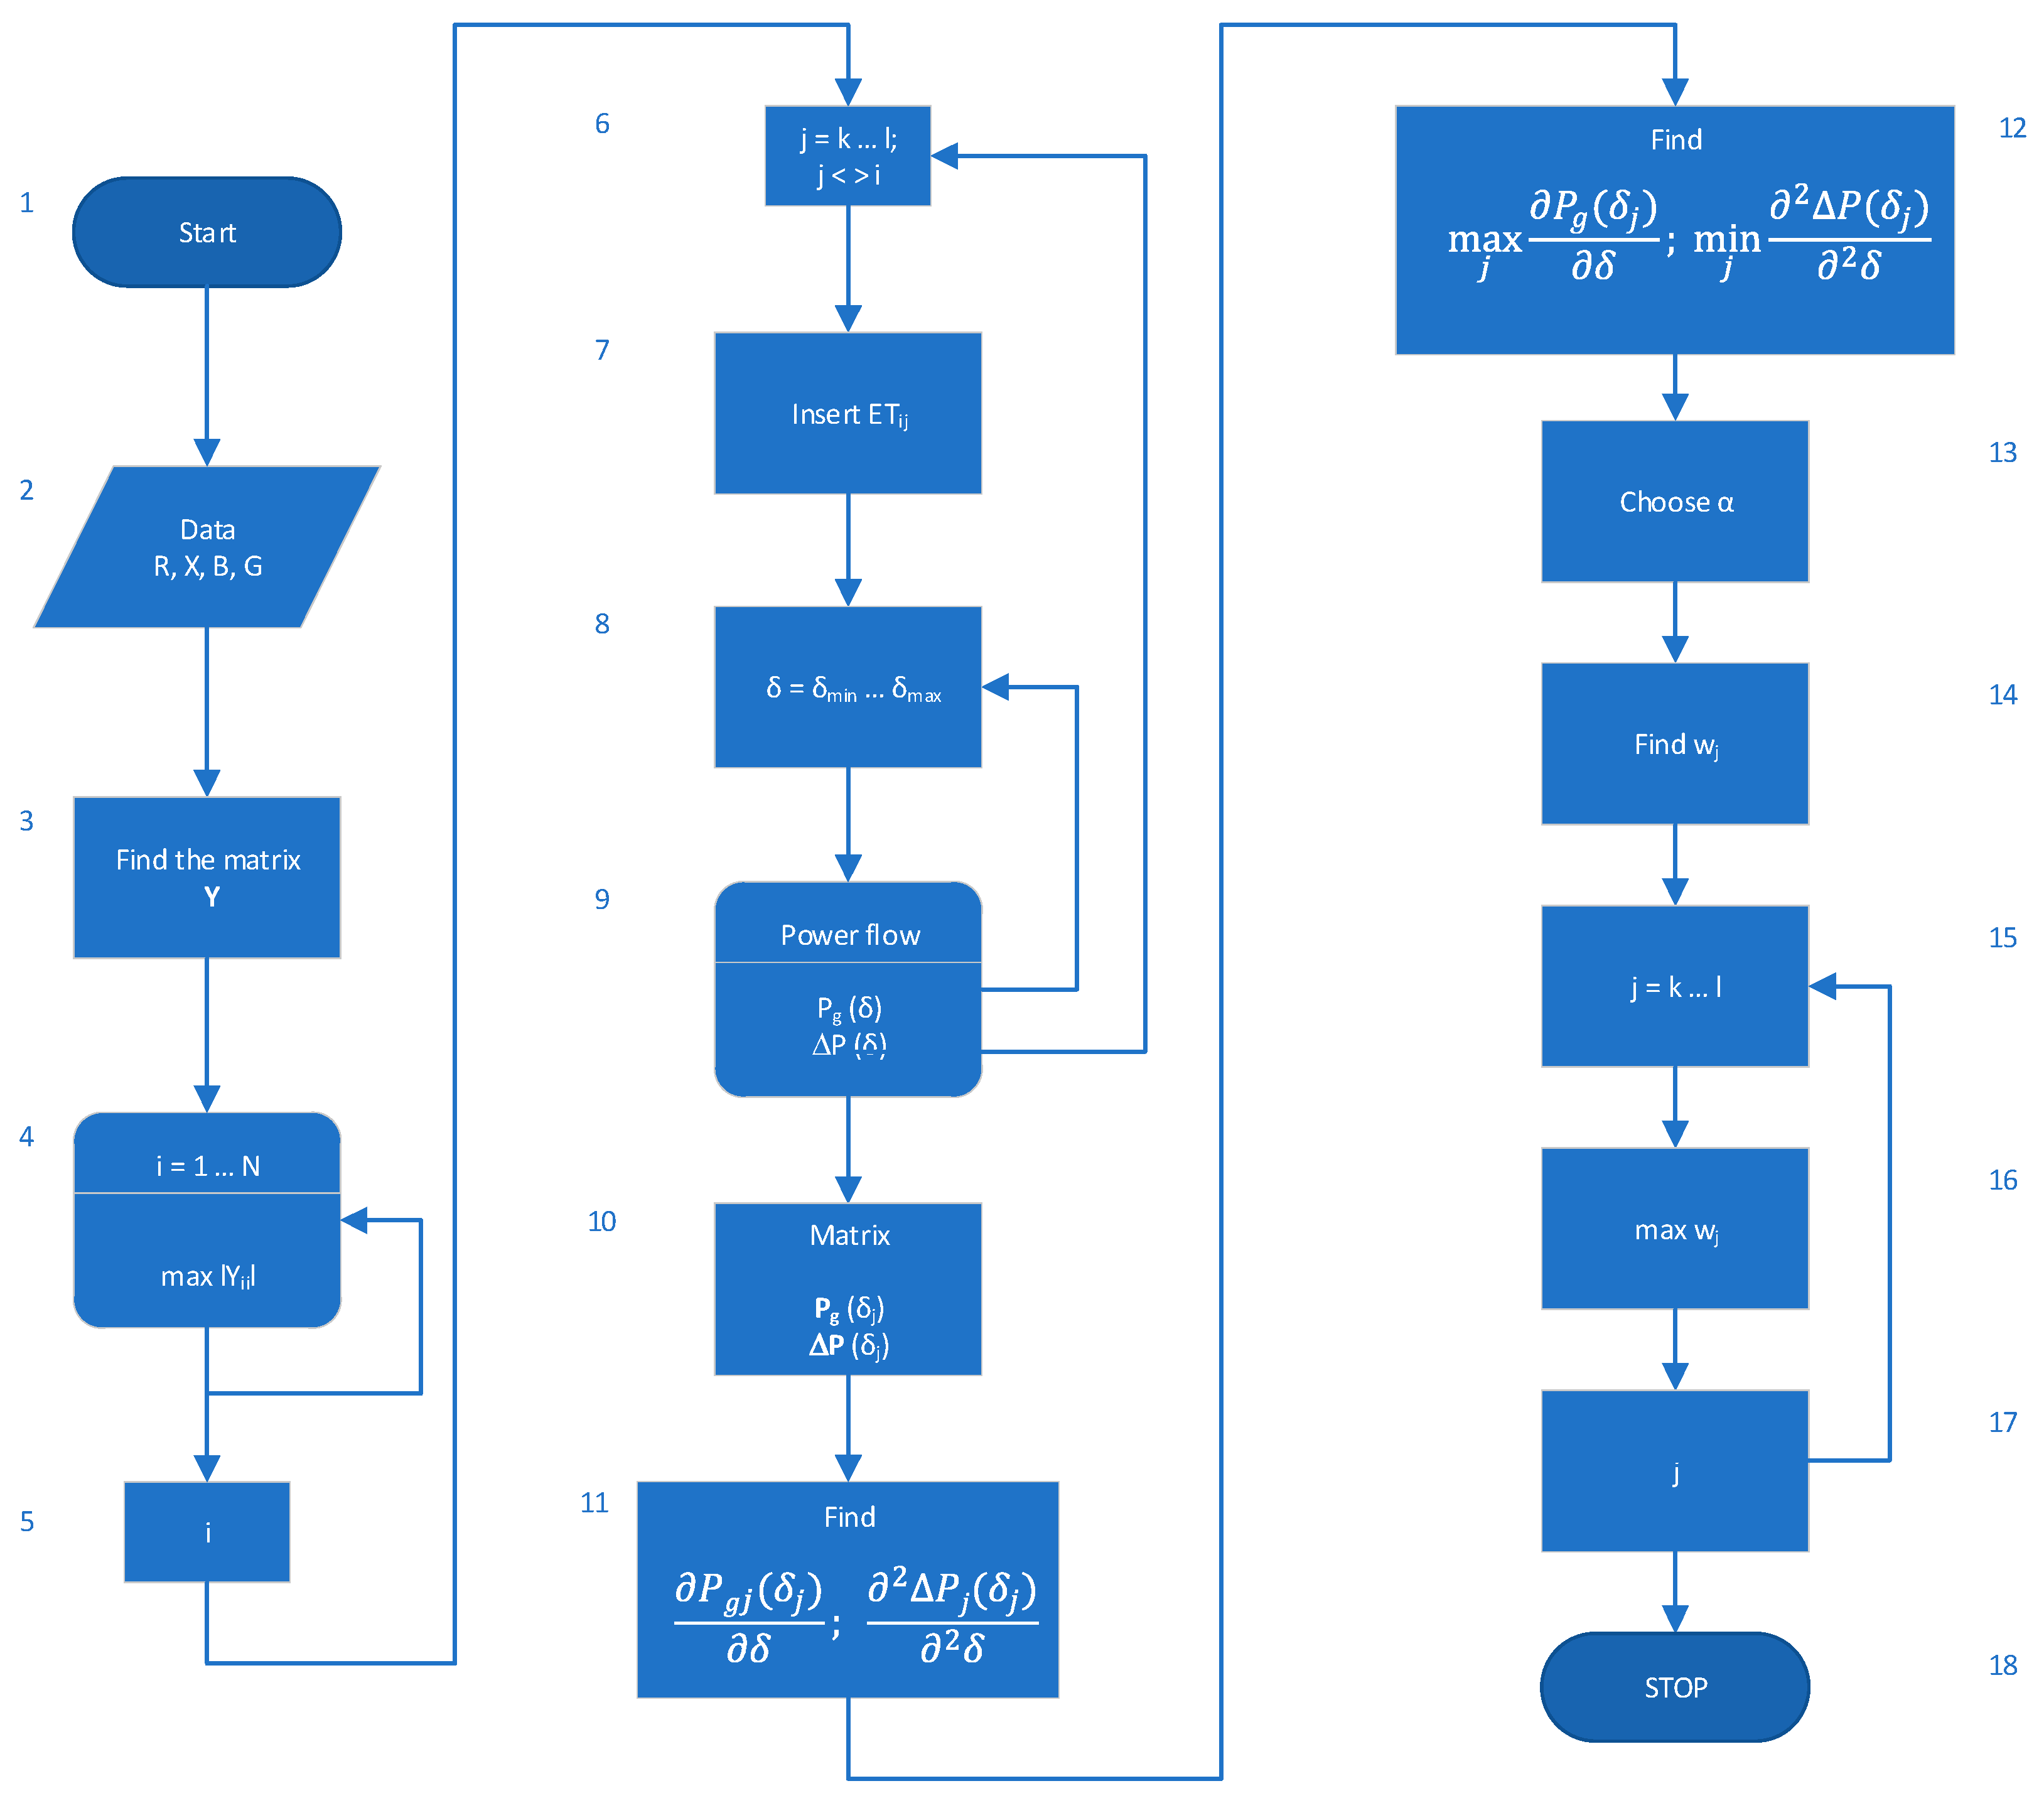
The developed algorithm taking into account these factors is shown in Figure 21 and described in the Table 7. The results needed to execute the algorithm were obtained from the analyses carried out in the PowerWorld program, based on the above examples.

5.2. Summary of the Algorithm

The proposed algorithm is used to determine new locations for regulating transformers. The algorithm easily locates the parameters of the power grid responsible for changes in flows in the grid. On this basis, the network node with the most favorable effects is determined. The features of the proposed algorithm are listed in the Table 8.

6. Conclusions

Regulating transformers can be used in network control measures by each transmission system operator. Increasingly frequent unscheduled power flows caused by the variability of RES generation and the volatility of international exchange balances force TSOs to look for new regulatory possibilities. Regulating transformers can not only mitigate unfavorable active power flows caused by the displacement of current generation (e.g., wind power) but also help to regulate the voltage in the grid nodes with a sudden increase in photovoltaic generation and with significant unscheduled transmission. Thanks to the use of inverters configured in such a way that they increase the voltage at the grid terminals, photovoltaic generation contributes to the generation of inductive reactive power in a stepwise manner and, consequently, increases the voltage at all voltage levels. A sudden increase in international exchange balances causes an increased load on system components, which leads to significant voltage drops in the transmission grid. Thanks to regulating transformers, there is an additional possibility of correcting the voltage of the transmission grid in various conditions and the possibility of correcting the load distribution in the transmission network. The use of transformers with OLTC regulation, thanks to the universality of the solution, reduces investment costs, and refined operating procedures reduce the risk of failure of the transformer unit. Thus, the economics of the solution is very attractive, especially when compared to the costs of congestion. Therefore, there is a need to develop algorithms that would allow for the assessment of grid conditions, the assessment of regulatory possibilities, and changes in the operating points of regulating transformers in a coordinated manner. The result of these activities should be the safe operation of the power grid, ensuring the certainty of electricity supply to the end user.

Author Contributions

Conceptualization, M.P.; methodology, M.P. and S.Ż.; validation, M.P. and S.Ż.; formal analysis, M.P.; investigation, S.Ż.; writing—original draft preparation, M.P. and S.Ż.; writing—review and editing, M.P.; visualization, S.Ż. All authors have read and agreed to the published version of the manuscript.

Funding

This research received no external funding.

Data Availability Statement

Not applicable.

Conflicts of Interest

The authors declare no conflict of interest.

References

  1. Polskie Sieci Elektroenergetyczne. Available online: www.pse.pl (accessed on 21 July 2022).
  2. Transformacja Energetyczna w Polsce—Edycja 2022. Available online: https://www.forum-energii.eu/public/upload/articles/files/Raport_Transformacja%20energetyczna%20Polski_2022.pdf (accessed on 21 July 2022).
  3. Rozwój I Potencjał Energetyki Odnawialnej w Polsce. Available online: https://pie.net.pl/wp-content/uploads/2021/04/PIE-Raport_OZE.pdf (accessed on 21 July 2022).
  4. Lubośny, Z. Farmy Wiatrowe w Systemie Elektroenergetycznym, 1st ed.; Wydawnictwo Naukowo-Techniczne: Warsaw, Poland, 2016. [Google Scholar]
  5. Paska, J. Rozproszone Źródła Energii, 1st ed.; Oficyna Wydawnicza Politechniki Warszawskiej: Warsaw, Poland, 2017. [Google Scholar]
  6. Bulat, H.; Franković, D.; Vlahinić, S. Enhanced Contingency Analysis—A Power System Operator Tool. Energies 2021, 14, 923. [Google Scholar] [CrossRef]
  7. Lin, Z.; Hu, Z.; Song, Y. Distribution Network Expansion Planning Considering N-1 Criterion. IEEE Trans. Power Syst. 2019, 34, 3. [Google Scholar] [CrossRef]
  8. Ren, H.; Dobson, I.; Carreras, B.A. Long-term Effect od the n-1 Criterion on Cascading Line Outages in an Evolving Power Transmission Grid. IEEE Trans. Power Syst. 2008, 23, 1217–1225. [Google Scholar] [CrossRef]
  9. Kremens, Z.; Sobierajski, M. Analiza Systemów Elektroenergetycznych, 1st ed.; Wydawnictwo Naukowo-Techniczne: Warsaw, Poland, 1996. [Google Scholar]
  10. Gryszpanowicz, K.; Robak, S.; Machowski, J. Analizy Sieciowe w Planowaniu Rozwoju Systemu Elektroenergetycznego, 1st ed.; Oficyna Wydawnicza Politechniki Warszawskiej: Warsaw, Poland, 2016. [Google Scholar]
  11. Machowski, J.; Białek, J.; Bumby, J. Power System Dynamics. Stability and Control; Jon Wiley & Sons: Chichester, NY, USA, 2008. [Google Scholar]
  12. Van Hertem, D.; Verboomen, J.; Purchala, K.; Belmans, R.; Kling, W.L. Usefulness of DC Power Flow for Active Power Flow Analysis with Flow Controlling Devices. In Proceedings of the 8th IEE International Conference on AC and DC Power Transmission, London, UK, 28–31 March 2006. [Google Scholar]
  13. Van Hertem, D.; Verboomen, J.; Belmans, R.; Kling, W.L. Power Flow controlling devices: An overview of their working principles and their application range. In Proceedings of the 2005 International Conference on Future Power Systems, Amsterdam, The Netherlands, 18 November 2005. [Google Scholar]
  14. Mahomed, S.A.; Abdel-Moamen, M.A.R. Phase-Shifting Transformers’ Model for Optimal Load Flow Formulation. In Proceedings of the 2018 Twentieth International Middle East Power Systems Conference (MEPCON), Cairo, Egypt, 18–20 December 2018. [Google Scholar]
  15. Kawaura, Y.; Yamanouchi, S.; Ichihara, M.; Iwamoto, S.; Suetsugu, Y.; Higashitani, T. Phase-shifting transformer application to power-flow adjustment for large-scale PV penetration. In Proceedings of the 2016 IEEE Region 10 Conference (TENCON), Singapore, 22–25 November 2016. [Google Scholar]
  16. Dong, L.Y.; Zhang, L.; Crow, M.L. A New Strategy for the Unified Power Flow Controller. In Proceedings of the 2002 IEEE Power Engineering Society Winter Meeting, New York, NY, USA, 27–31 January 2002. [Google Scholar]
  17. Ding, T.; Bo, R.; Bie, Z.; Wang, X. Optimal Selection of Phase Shifting Transformer Adjustment in Optimal Power Flow. IEEE Trans. Power Syst. 2017, 32, 2464–2465. [Google Scholar] [CrossRef]
  18. Yu, M.; Yuan, J.; Li, Z.; Li, F.; Yang, X.; Zhang, W.; Xu, S.; Mei, J. Power Flow Optimization and Economic Analysis Based on High Voltage Phase Shfting Transformer. Energies 2022, 15, 2363. [Google Scholar] [CrossRef]
  19. Kocot, H.; Korab, R.; Owczarek, R.; Przygrodzki, M.; Żmuda, K. Countermeasures for Dealing with Uncheduled Power Flows within an Interconnected Power System; Elektryka: Szczecin, Poland, 2015. [Google Scholar]
  20. Owczarek, R. Optymalizacja Nastaw Przesuwników Fazowych Instalowanych w Liniach Transgranicznych Połączonego Systemu Elektroenergetycznego w Stanach Ustalonych. Ph.D. Thesis, Silesian University of Technology, Gliwice, Poland, 2019. [Google Scholar]
  21. Meeus, L.; Purchala, K.; Degli Esposti, C.; Han Vertem, D.; Belmans, R. Regulated Cross-Border Transmission Investments in Europe. In Proceedings of the 2005/2006 IEEE/PES Transmission and Distribution Conference and Exhibition, Dallas, TX, USA, 21–24 May 2006. [Google Scholar]
  22. Bresesti, P.; Sforna, M.; Allegranza, V.; Canever, D.; Vailati, R. Application of Phase Shifting Transformers for a secure and efficient operation of the interconnection corridors. In Proceedings of the IEEE Power Engineering Society General Meeting, Denver, CO, USA, 6–10 June 2004. [Google Scholar]
  23. Machowski, J. Regulacja Systemu Elektroenergetycznego, 2nd ed.; Oficyna Wydawnicza Politechniki Warszawskiej: Warsaw, Poland, 2017. [Google Scholar]
  24. Jezierski, E. Transformatory, 1st ed.; Wydawnictwo Naukowo-Techniczne: Warsaw, Poland, 1983. [Google Scholar]
  25. Harlow, J.H. Electric Power Transformer Engineering, 1st ed.; CRC Press: Boca Raton, FL, USA; Taylor & Francis Group: Boca Raton, FL, USA, 2004. [Google Scholar]
  26. C57.135-2011; IEEE Guide for the Application, Specification and Testing of Phase-Shifting Transformers. The Institute of Electrical and Electronics Engineers, Inc.: New York, NY, USA, 2011.
  27. Verboomen, J.; Van Hertem, D.; Schavemaker, P.H.; Kling, W.L.; Belmans, R. Phase Shifting Transformers: Principles and Applications. In Proceedings of the 2005 International Conference of Future Power Systems, Amsterdam, The Netherlands, 18 November 2005. [Google Scholar]
  28. Seitlinger, W. Phase Shifting Transformers Discussions of Specific Characteristics; CIGRE Session: Paris, France, 1998; pp. 12–306. [Google Scholar]
  29. Ziemianek, S. Model matematyczny zespołu transformatorowego z trapezoidalnym zakresem regulacji przekładni zespolonej do analiz ustalonych i quasiustalonych stanów pracy symetrycznych fazowo. Przegląd Elektrotechniczny 2013, 89, 143–151. [Google Scholar]
  30. Albrechtowicz, P.; Szczepanik, J. The Comparative Analysis of Phase Shifting Transformers. Energies 2021, 14, 4347. [Google Scholar] [CrossRef]
  31. Albrechtowicz, P.; Rozegnał, B.; Cisek, P. Comparison of Phase-Shifting Transformers Properties. Energies 2022, 15, 6224. [Google Scholar] [CrossRef]
  32. Mclver, J. Phase Shifting Transformers—Principles, Design Aspects and Operation; SIEMENS Energy, Inc.: Weiz, Austria, 2013. [Google Scholar]
  33. Cano, J.; Mojumdar, R.; Norniella, J.; Orcajo, G. Phase Shifting Transformer model for direct approach power flow studies. Int. J. Electr. Power Energy Syst. 2017, 91, 71–79. [Google Scholar] [CrossRef]
  34. Kulkarni, S.V.; Khaparde, S.A. Transformer Engineering: Design and Practice; Marcel Dekker, Inc.: New York, NY, USA, 2004; ISBN 0-8247-5653-3. [Google Scholar]
  35. Reddy, T.; Gulati, A.; Khan, M.I.; Koul, R. Application of Phase Shifting Transformer in Indian Power System. Int. J. Comput. Electr. Eng. 2012, 4, 2. [Google Scholar] [CrossRef]
  36. Verboomen, J.; Van Hertem, D.; Schavemaker, P.H.; Kling, W.L.; Belmans, R. Border-Flow Control by means of Phase Shifting Transformers. In Proceedings of the 2007 IEEE Lausanne Power Tech, Lausanne, Switzerland, 1–5 July 2007. [Google Scholar]
  37. Verboomen, J.; Van Hertem, D.; Schavemaker, P.H.; Kling, W.L.; Belmans, R. Coordination of phase shifters by means of multi-objective optimisation. In Proceedings of the 41st International Universities Power Engineering Conference, Newcastle upon Tyne, UK, 6–8 September 2006. [Google Scholar]
  38. Verboomen, J.; Papaefthymiou, G.; Kling, W.L.; Van der Sluis, L. Use of Phase Shifting Transformers for Minimising Congestion Risk. In Proceedings of the 10th International Conference on Probablistic Methods Applied to Power Systems, Rincon, PR, USA, 25–29 May 2008. [Google Scholar]
  39. Verboomen, J. Optimisation of Transmission Systems by Use of Phase Shifting Transformers. Ph.D. Thesis, Technical University of Delft, Delft, Belgium, 2008. [Google Scholar]
  40. Jing, W.; Yong, T.; Chang, X.; Xinglei, C.; Yi, W.; Ning, A. Research on Power Flow Algorithm of Power System with UPFC. In Proceedings of the International Conference on Power System Technology, Guangzhou, China, 6–8 November 2018. [Google Scholar]
  41. Kohan, V.; Conka, Z.; Kolcun, M.; Karabinos, M.; Havran, P.; Stefko, R.; Tailor, R.J. Use of Flexible Alternating Current Transmission System to improve power system operation—Damping oscilation and power flow control. In Proceedings of the IEEE 4th International Conference and Workshop in Óbuda on Electrical and Power Engineering, Budapest, Hungary, 17–18 November 2021. [Google Scholar]
  42. Relić, F.; Marić, P.; Glavaš, H.; Petrović, I. Influence of FACTS Device Implementation on Performance of Distribution Network with Integrated Renewable Energy Sources. Energies 2020, 13, 5516. [Google Scholar] [CrossRef]
  43. Kramer, A.; Ruff, J. Transformers for phase angle regulation considering the selection of on-load tap-changers. IEEE Trans. Power Deliv. 1998, 13, 518–525. [Google Scholar] [CrossRef]
  44. Robbins, B.A.; Zhu, H.; Dominguez-Garcia, A.D. Optimal Tap Settings of Voltage Regulation Transformers in Unbalanced Distribution Systems. IEEE Trans. Power Syst. 2016, 31, 256–267. [Google Scholar] [CrossRef]
  45. Przygrodzki, M.; Rzepka, P.; Szablicki, M. Application of Voltage-regulating and Phase Shifting Transformers to Control Power Flows in the Power System. Acta Energetica 2015, 4, 87–93. [Google Scholar] [CrossRef]
  46. Albrechtowicz, P. Zastosowanie Przesuwników Fazowych do Regulacji Rozpływów Mocy w Systemach Elektroenergetycznych. Ph.D. Thesis, Cracow University of Technology, Cracow, Poland, 2022. [Google Scholar]
  47. Machowski, J.; Lubośny, Z. Stabilność Systemu Elektroenergetycznego, 1st ed.; Wydawnictwo Naukowe PWN S.A.: Warsaw, Poland, 2018. [Google Scholar]
  48. European Network of Transmission System Operators for Electricity. Phase Shift Transformers Modelling; ENTSOE: Brussels, Belgium, 2014. [Google Scholar]
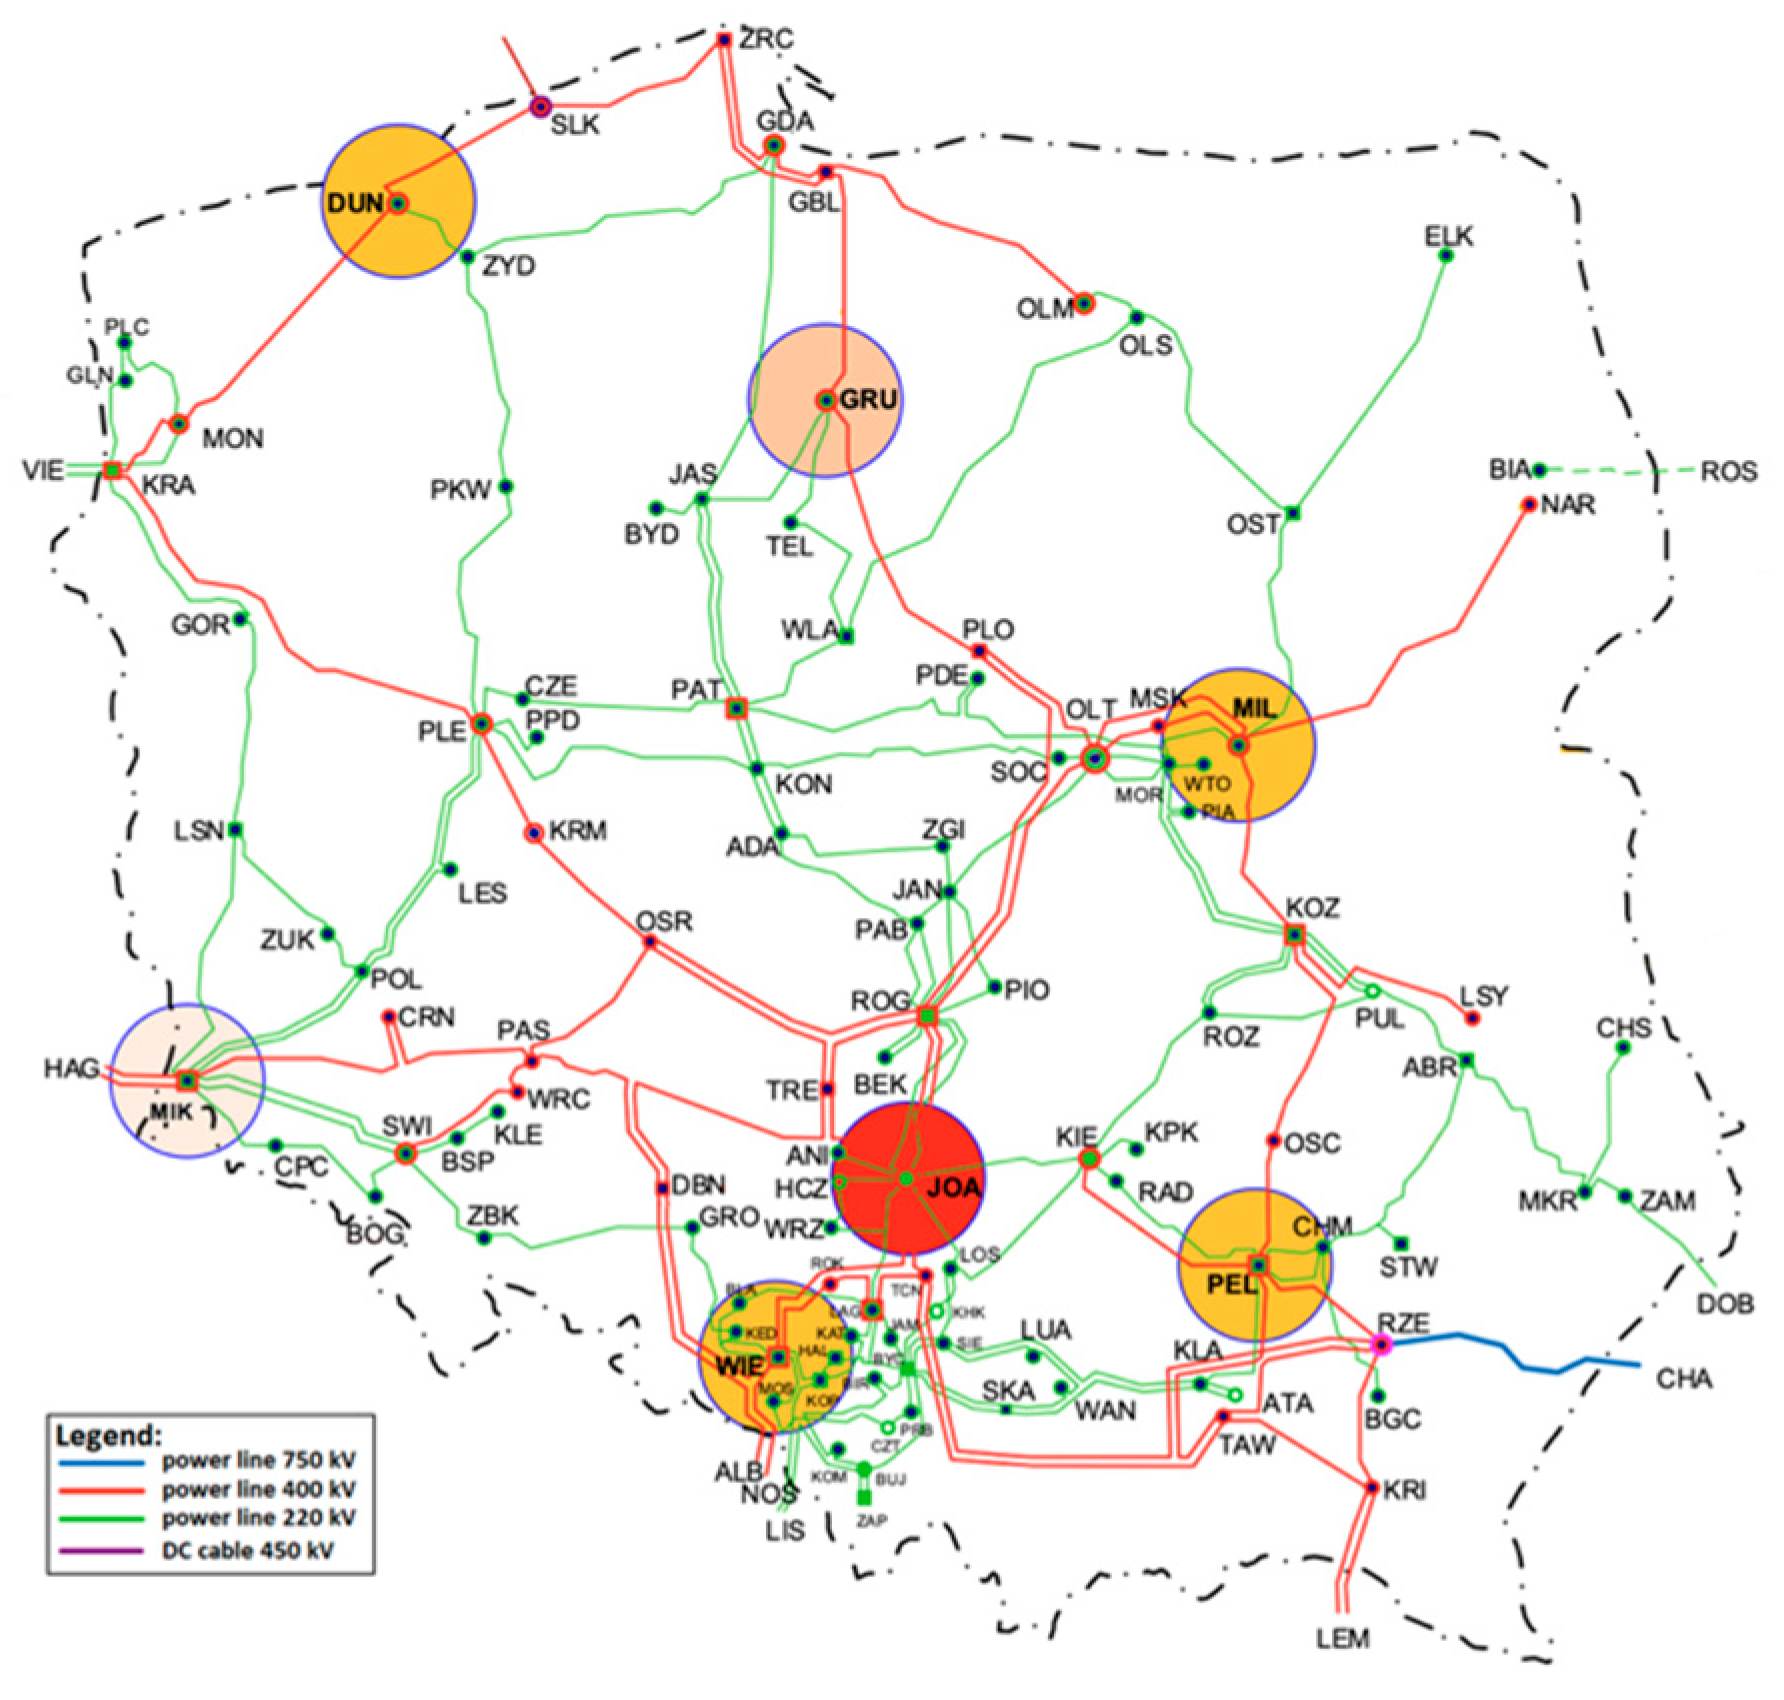
Figure 1. Locations of control transformers in the Polish power system.
Energies 16 01548 g001
Figure 2. Maximum changes in the power flow of regulating transformers in the Polish NPS.
Energies 16 01548 g002
Figure 3. Locations of working and planned PSTs to be installed in the UCTE.
Energies 16 01548 g003
Figure 4. Types of regulation and transformer devices implementing them [48].
Energies 16 01548 g004
Figure 5. Examples of schematic diagrams of a regulating transformer: (a) power supply of the series transformer from the third winding of the main unit; (b) powering the series transformer from the exciting transformer.
Energies 16 01548 g005
Figure 6. Schematic diagram of a regulating transformer exciting unit, where S1–S3 means three-phase source terminals and L1–L3 respectively means load terminals.
Energies 16 01548 g006
Figure 7. The idea of regulating transformer regulation: (a) series transformer winding; (b) phase voltages and phase-to-phase voltages supplying the series unit; (c,d) phase voltages at the output of the series unit (Figure (c)—for voltage-magnitude regulation; Figure (d)—for phase-angle regulation).
Energies 16 01548 g007
Figure 8. Power flows in the substation with the JOA-A1 transformer and in its network vicinity.
Energies 16 01548 g008
Figure 10. Dependence of the number of PPS elements on the direction and range of power flow change for various control scenarios of the JOA-A1 transformer.
Energies 16 01548 g010
Figure 11. Changes in the load level on the 220 kV line on the Joachimów–Rogowiec relation for various variants of the PPS operation and scenarios for the transformer control settings.
Energies 16 01548 g011
Figure 12. Replacement scheme: (a) with an autotransformer, (b) ∏-type four-pole equivalent.
Energies 16 01548 g012
Figure 13. Single circuit: branch I without PST, branch II with PST, voltage vector diagram.
Energies 16 01548 g013
Figure 14. Graph of the dependence of the branch power as a function of the phase shifter adjustment angle.
Energies 16 01548 g014
Figure 15. IEEE 5-node test system.
Energies 16 01548 g015
Figure 16. Relative active power losses as a function of the control angle PF.
Energies 16 01548 g016
Figure 17. Relative reactive power losses as a function of the control angle PF.
Energies 16 01548 g017
Figure 18. Test 14-node IEEE system.
Energies 16 01548 g018
Figure 19. Relative changes in the active power of the 14 W system as a function of the regulation angle PF.
Energies 16 01548 g019
Figure 20. Relative changes in the reactive power of the 14 W system as a function of the regulation angle PF.
Energies 16 01548 g020
Figure 21. Algorithm for determining the optimal location of the regulating transformer.
Energies 16 01548 g021
Table 1. Active power flows, JOA-A1 transformer load stages, and changes in these quantities for various scenarios setting the transformer control parameters.
ValueValues of Individual Quantities Depending on the Adopted
Scenario Setting the Transformer Regulation Parameters
ScenarioS0S1S2S3S4
PTMW120.2−255.9411.4496.7−175.1
β%46.083.0158.0156.0109.0
Scenario Difference-S1–S0S2–S0S3–S0S4–S0
ΔPT%-−312.8242.1313.0−245.6
Δβ%-37.0112.0110.063.0
Table 2. Branch data of the 5-node IEEE test system [9].
Node No.
(Starting)
Node No.
(End)
Rij
pu
Xij
pu
y - i j / 2
pu
120.0900.380j0.020
150.1500.550j0.030
230.3000.750j0.025
250.0970.410j0.020
340.1200.510j0.015
450.1000.450j0.020
Table 3. Branch data of the 5-node IEEE test system [9].
NodeTypeVoltage
U
Phase
Angle
Generator
Pi
Generator
Qi
Load
Pi
Load
Qi
pudeg.MWMVarMWMVar
11.1072.1847.0300
2PQ0.981−6.33500−50−10
3PQ1.0483.7736516.7900
4PQ0.937−6.89600−35−10
5PQ0.946−8.09800−45−15
Table 4. Series and shunt line admittance and nodal ground admittances [9].
Line
Number
Series Line
Admittance
One-Side Shunt
Line Admittance
Node No.Ground
Admittance
y _ i j y _ i j / 2 y _ i
ijpupuipu
1–20.590163–j2.491803j0.0201j0.050
1–50.461538–j1.692307j0.0302j0.065
2–30.459770–j1.149425j0.0253j0.040
2–50.546511–j2.309742j0.0204j0.035
3–40.437158–j1.857923j0.0155j0.070
4–50.470588–j2.117647j0.020
Table 5. 14-node IEEE test system branch data.
Node No.TypeVoltage
U
Phase
Angle
Generator
Pi
Generator
Qi
Load
Pi
Load
Qi
pudeg.MWMVarMWMVar
11.060.861.644.9800
2PQ1.040120−4.121.712.7
3PQ1.02−0.5295094.219
4PQ1.02−1.880047.8−3.9
5PQ1.02−1.91007.61.6
6PQ1.07−2.37257.0311.27.5
7PQ1.06−3.660000
8PQ1.09−4.412016.2900
9PQ1.05−5.390029.516.6
10PQ1.05−5.280095.8
11PQ1.05−5.11003.51.8
12PQ1.05−5.44006.11.6
13PQ1.05−5.550013.55.8
14PQ1.03−6.420014.95
Table 6. Branch data of the 14-node IEEE test system.
Line
Number
Series Line
Admittance
y _ i j
i–jpu
1–25.00–j15.26
1–51.03–j4.23
2–31.14–j4.78
2–41.69–j5.12
2–51.70–j5.19
3–41.99–j5.07
4–56.84–j21.58
4–7–j4.89
4–9–j1.86
5–6–j4.26
6–111.96–j4.09
6–121.53–j3.18
6–133.10–j6.10
7–8–j5.68
7–9–j9.09
9–103.9–j10.37
9–141.42–j3.03
10–111.88–j4.40
12–132.49–j2.25
13–141.11–j2.31
Table 7. Description of the algorithm.
Algorithm StepStep Description
1Start—the beginning of the analysis;
2Enter branch data—the parameters of R, X, B, and G network system elements are taken into account. The analysis assumed the full model of network elements in the form of a ∏-equivalent;
3Determine the Y matrix—on the basis of the given elements, the nodal admittance matrix of the tested network system is determined. This matrix is created from definition (1) by summing up the parameters of the previously prepared Π-equivalents, respectively;
4Max|Yii|—the diagonal element of the nodal admittance matrix with the largest absolute value is selected;
5i—the index of the element with the highest absolute value that specifies the location of the transformer connection node;
6j = kl—the index of the node adjacent to the i-th node. The branch in which the extension transformer (ET) is analyzed is determined;
7Insert ETij—a ET transformer is inserted into the selected branch “ij”. One should model ET as a ∏- equivalent on the basis of the dependence from Chapter 4.2;
8δ = δmin … δmax—this determines the range of the regulation angle analysis. This angle may vary depending on the design of the transformer used or the guidelines of the power system operator;
9Pg(δ) i ΔP(δ) flow—perform power flow using the Newton–Raphson method and calculate branch flows and total power losses in successive loops as a function of control angle δ;
10Matrix Pgj), ΔP(δj)—matrices of the results obtained in step 9 are created;
11Find P g ( δ ) δ and 2 Δ P ( δ ) 2 δ —using the values determined in step 10 and determine the first derivative of the branch flows with respect to the control angle δ and the second derivative power loss in relation to the control angle δ;
12Find max j P g ( δ j ) δ ;   min j 2 Δ P ( δ j ) 2 δ —for the results of step 11. The maximum change in branch flows among the considered ones, and the minimum value of the loss factor are determined.
13Assume α—the weight between power flow flexibility and losses should be assumed:
  • α > 0.5—the power flow flexibility is crucial;
  • α < 0.5—the economics of power losses is crucial;
14Determine w j —the required regulation coefficient should be determined, determining the suitability of a given location for the transformer for regulation while maintaining the weight of both component parameters according to the dependence:
   w j = α · a j a m a x + ( 1 α ) · b j b m a x
where
a j = P g ( δ ,   j ) δ , a m a x = max j   a j ;
b j = 2 Δ P ( δ ,   j ) 2 δ ;   b m a x = max j   b j ;
15, 16Determine w —determine the control factor with the highest value in accordance with the relationship:
   w = max j   w j
17Determine node j—on the basis of the selected regulation coefficient, define node j. The selected node is also the end of the branch (branch ij) in which the regulating transformer should be connected. There is therefore a selected branch, ij, in which installing the ET meets the purpose of the algorithm. The goal is to maximize the transmission capacity of the system while keeping power losses at a low level.
18Stop—end of analysis.
Table 8. Features of the proposed algorithm.
FeaturesAnalytical
Premises
Algorithmic
Implementation
VersatilityIt is necessary to keep the analysis simple and to standardize the calculations as much as possible.The simplicity of the analysis results from the use of well-known calculation methods, such as the Newton-Raphson method for calculating power flows and power losses. The use of relative units also deters the algorithm from different voltages in the analyzed network.
AccuracyIt is necessary to apply the appropriate accuracy in calculations because, as a result of the implementation of the algorithm, a specific network branch in which ET should be used can be obtained.The accuracy of the analysis is carried out by means of a detailed model of network elements, and thus an accurate mapping of the network topology is achieved using the admittance matrix, Y.
Disclaimer/Publisher’s Note: The statements, opinions and data contained in all publications are solely those of the individual author(s) and contributor(s) and not of MDPI and/or the editor(s). MDPI and/or the editor(s) disclaim responsibility for any injury to people or property resulting from any ideas, methods, instructions or products referred to in the content.