Article

Multi-Point Surrogate-Based Approach for Assessing Impacts of Geometric Variations on Centrifugal Compressor Performance

1
Department of Industrial Engineering, Università degli Studi di Firenze, Via di S. Marta 3, 50139 Florence, Italy
2
Nuovo Pignone Baker Hughes, Baker Hughes, Via Felice Matteucci, 50127 Florence, Italy
*
Author to whom correspondence should be addressed.
Energies 2023, 16(4), 1584; https://doi.org/10.3390/en16041584
Submission received: 14 December 2022 / Revised: 20 January 2023 / Accepted: 1 February 2023 / Published: 4 February 2023
(This article belongs to the Section J2: Thermodynamics)

Abstract

:
The increasing demand for robust and high-performance centrifugal compressor stages has led to the development of several optimization and uncertainty quantification approaches. However, in the industrial scenario, geometric variations of such pre-engineered stages can occur during customer orders or non-conformity evaluations. In this regard, a rapid low-effort quantification of the impact of these changes has become critical for manufacturers. Against this backdrop, the present study provides an approach based on the joint use of computational fluid dynamics (CFDs) and artificial neural networks to instantly assess the impact of geometric variations on the aerodynamic performance and operating range of centrifugal compressor stages. As a theoretical contribution, the research investigates the capacity of a CFD-based surrogate approach for evaluating variations of stage efficiency and work coefficient. On a practical level, a business-friendly tool for stage performance assessment is provided. As an example case study, the approach is applied to a group of stages for medium–high Mach number applications. Results show how the multi-point surrogate approach enables a rapid quantification of stage performance changes without requiring additional CFD analyses. The research lays the foundation for future studies aiming to reduce efforts when assessing geometric variation impacts on centrifugal compressor stages.

1. Introduction

The pursuit of more efficient and cleaner plants is essential to reduce the carbon footprint of the energy sector and to reach carbon neutrality by 2050 [1]. As highlighted by the Energy Trilemma, it is necessary to guarantee a trade-off between environmental sustainability, energy security, and equity [2]. In this context, centrifugal compressors represent key components for many industrial and civil applications. Indeed, the shift induced by the energy transition towards highly intermittent sources (e.g., photovoltaic and wind power) has led to a renewed interest in compressed-air energy storage (CAES) systems [3]. Moreover, carbon capture and storage (CCS) technologies, together with supercritical carbon dioxide (sCO2) systems, seem to be interesting solutions for improving the efficiency of energy cycles and mitigating the effects of climate change [4]. Furthermore, an ever-growing use of centrifugal compressors in sCO2 [5], organic Rankine cycle (ORC) [6], and hydrogen [7] plants emphasizes how these turbomachines are pivotal for the current energy transition [8]. In this context, the rapid and continuous evolution of markets is forcing centrifugal compressor designers to maximize the performance of these machines in ever shorter timescales [9]. The scientific literature has recently shown an increased interest in optimization techniques for turbomachine designs [10,11]. Considering the preliminary design of centrifugal compressors, several optimization techniques were combined with low order models. To this end, Du et al. [12] used a mono-dimensional (1D) model and a genetic algorithm (GA) for the optimization of a sCO2 centrifugal compressor, whereas Bicchi et al. [11] provided a design method based on artificial intelligences (AI) and a 1D single-zone model for fast development of new centrifugal compressor families. Similarly, Massoudi et al. [13] defined an approach for designing centrifugal compressors by means of the combined use of a 1D model and an artificial neural network (ANN). Another example was provided by Li et al. [14], who optimized a low-pressure centrifugal compressor by combining a simulated annealing algorithm with a 1D model. Finally, Wang et al. [15] showed the use of a 1D model and a GA for designing a sCO2 centrifugal compressor. However, the scientific literature does not only report examples of preliminary design optimization. Indeed, advanced three-dimensional (3D) optimization techniques are also provided, while computational fluid dynamics (CFD) often provide a higher level of accuracy in optimizing performance. Omini et al. [16] proposed a hybrid design procedure of a new centrifugal compressor based on CFDs and GA. Ekradi and Madadi [17] presented a procedure for the 3D optimization of a transonic centrifugal compressor impeller with splitter blades by integrating GA, ANN, and a CFD solver. Finally, Ma et al. [18] developed an AI framework to achieve multi-objective optimization of the centrifugal compressor impeller.
Against this backdrop, the previous examples from scientific literature show how aerodynamic optimization is often carried out without considering the possibility of subsequent variations (intentional or unintentional) of the optimized geometry. As proof of this, Panizza et al. [19] and Javed et al. [20] highlighted that, although centrifugal compressors have reached a high level of performance, and even though optimization techniques are now relevant in design development, these machines are still potentially subject to geometric variations capable of altering their performance. Indeed, manufacturers often face uncertainties and performance variations due to errors during production or assembly (unintentional variations) [21]. For this reason, to limit the effect of such variations, several authors in the scientific literature developed approaches for the robust design of centrifugal compressors. In this sense, Javed et al. [20] developed a design approach in which the impeller performance is relatively insensitive to manufacturing uncertainties. Zhu et al. [22] carried out an uncertainty analysis of a centrifugal compressor stage considering both geometric and operational uncertainties. Moreover, Li et al. [23] investigated the effect of geometric uncertainty on the aerodynamic performance of a centrifugal compressor by leveraging a Kriging model. Ju et al. [24] explored how to revise the blade design to compensate the negative effects of inevitable manufacturing uncertainties. Furthermore, Panizza et al. [19] presented a fully automatic procedure to quantify the effect of impeller manufacturing variability on the compression stage performance using CFDs and sparse pseudospectral approximations. Recently, Teng et al. [25] developed a novel approach for the multi-objective aerodynamic robustness optimization by leveraging an ANN-based Kriging model.
The above examples show how the literature provides possible solutions for optimizing centrifugal compressor geometries and reducing their performance variability. However, a robust optimized geometry may still be subject to intentional variations that could alter the performance and operating range of the centrifugal compressor stage. Indeed, constraints imposed during customer orders could also lead to the adjustment of pre-engineered geometries. In those cases, intentional geometric rearrangements are deliberate to better meet customer needs, and generally, they are greater than those considered during uncertainty analyses. Centrifugal compressor manufacturers, in fact, often employ pre-engineered families to quickly derive new centrifugal compressors by adjusting the geometry based on customer constraints [26,27]. Therefore, being able to quickly quantify how much geometric variation impacts the behavior of a centrifugal stage seems attractive to centrifugal compressor manufacturers, especially during (but not limited to) the first phases of a customer order. However, to the best of the authors’ knowledge, an approach to rapidly assess the impact of geometric variations on both the performance and operating range of a centrifugal compressor stage is overlooked by the scientific literature. Indeed, as highlighted by Mosdzien et al. [28], CFD analyses are often chosen to accurately study the impact of possible geometric variations on the aerodynamic performance of a stage, but they are time-consuming and do not allow for immediate feedback. An alternative has been proposed by Du et al. [29] with a quasi-one-dimensional numerical tool applied in a curvilinear coordinate system. However, although this approach allows for rapid assessment of the impact of geometric variations, it is inherently less accurate than CFD analyses. In light of this, the present paper aims to provide a novel approach capable of rapidly and accurately assessing the impact of geometric variations (both intentional and unintentional) on the performance and operating range of centrifugal compressor stages. Specifically, a multi-point surrogate-based approach is developed by combining the benefits of both CFD analyses and ANNs. As an example case study, the proposed approach was applied here to quantify the impact of geometric rearrangements on the performance and operating ranges of a family of impellers for medium-high Mach number applications. The main contribution of this article is twofold: at a theoretical level, it is to investigate the use of CFD simulations with ANNs to provide surrogate-models capable of predicting the impacts of geometric rearrangements of a centrifugal compressor stage. At a practical level, it is to support designers and practitioners in verifying the effects of customer and manufacturing constraints on the performance and operating ranges of centrifugal compressor stages.
After providing some introductions enclosing the theoretical background pertinent to the subjects of interest, the remainder of the paper is structured as follows. In Section 2, the proposed multi-point surrogate approach is provided, while also describing the procedural steps followed to derive it. In Section 3, the proposed approach is applied to the case study of a family of impellers for medium–high Mach number applications, presenting and discussing the achieved results. Finally, in Section 4, some conclusions on this study are proposed.

2. Materials and Methods

Aiming to provide a surrogate model for quantifying the impact of geometric variations on performance and operating range of centrifugal compressors, the present paper focused on the stage provided in Figure 1. However, it is worth mentioning that this approach could be extended, without lacking generality, to different stages, including vaned diffusers or discharge volutes. As shown in Figure 1a, the stages analyzed in the present paper were composed of an inlet duct (Figure 1a, component A), a closed impeller (Figure 1a, component B), a vaneless diffuser (Figure 1a, component C), a crossover bend (Figure 1a, component D), and a return vane channel (Figure 1a, component E).
In the provided approach, three steps were applied for each stage under investigation. In step 1, a set of geometric parameters—whose impact of variations was of interest—was selected. Therefore, a realistic range of rearrangements was associated with each parameter. In step 2, the parametrization of the centrifugal compressor stage was defined, and a dataset of possible geometries was obtained by imposing the geometric variations of step 1. Then, a parametric analysis was performed, by means of CFD simulations, on each geometry belonging to the dataset. Finally, in step 3, the results of the parametric analysis were used to train and validate an ANN. The subsections below describe the above steps in detail, while the results will be explained in Section 3.

2.1. Step 1: Selection of Geometric Parameters

When analyzing the impact of geometrical parameter variations on the performance of centrifugal compressor stages, it is first necessary to select the geometric characteristics of interest (independent parameters). Theoretically, all geometric quantities could be potentially chosen. However, studying geometric parameters, whose variations have negligible effects on performance, could unduly enhance the time and computational cost of the task [11]. Hence, a good practice would be to reduce the number of parameters to be analyzed. To this end, the scientific literature provides several strategies to identify the most impactful parameters. However, the investigation of these strategies and the selection of the optimal one is beyond the scope of the study. Therefore, we only mention that the most impactful parameters can be selected by applying strategies such as the analysis of variance (ANOVA) [30], multi-criteria decision-making techniques, including the analytic hierarchy process (AHP) [31], or simply by leveraging the know-how of company experts. In the present study, according to [32], it was decided that, in order to exploit the experience of those who daily face design and production issues, to consult a group of aerodynamics and manufacturing experts, and select—as independent parameters—the ones which are typically adjusted during redesigns for customer orders (i) or which are potentially subject to manufacturing non-conformities (ii). Table 1 shows the impeller and diffuser characteristics considered in the approach as independent parameters and, thus, modified in the parametric analysis of step 3. The ranges of the variation of Table 1 were set according to the values typically used to adjust pre-engineered geometries during customer orders, since these ranges are greater than those considered for non-conformities.
On the other hand, the geometric quantities of the inlet duct, the crossover bend, and the return vane channel were considered in the approach as dependent parameters (Table 2). These quantities were adjusted to obtain mutually consistent perturbed geometries of the stage. Namely, the parameters in Table 2 were modified to maintain a geometric similitude of the inlet duct and the components downstream of the diffuser (Figure 1a, components A, D, and E).
It is worth mentioning that the dependent parameters of Table 2 were chosen to preserve specific characteristics of the centrifugal compressor stages analyzed in this project. However, these choices do not affect the generality of the approach, as the determination of independent and dependent parameters is inevitably linked to the aim of each specific case where the approach is applied.

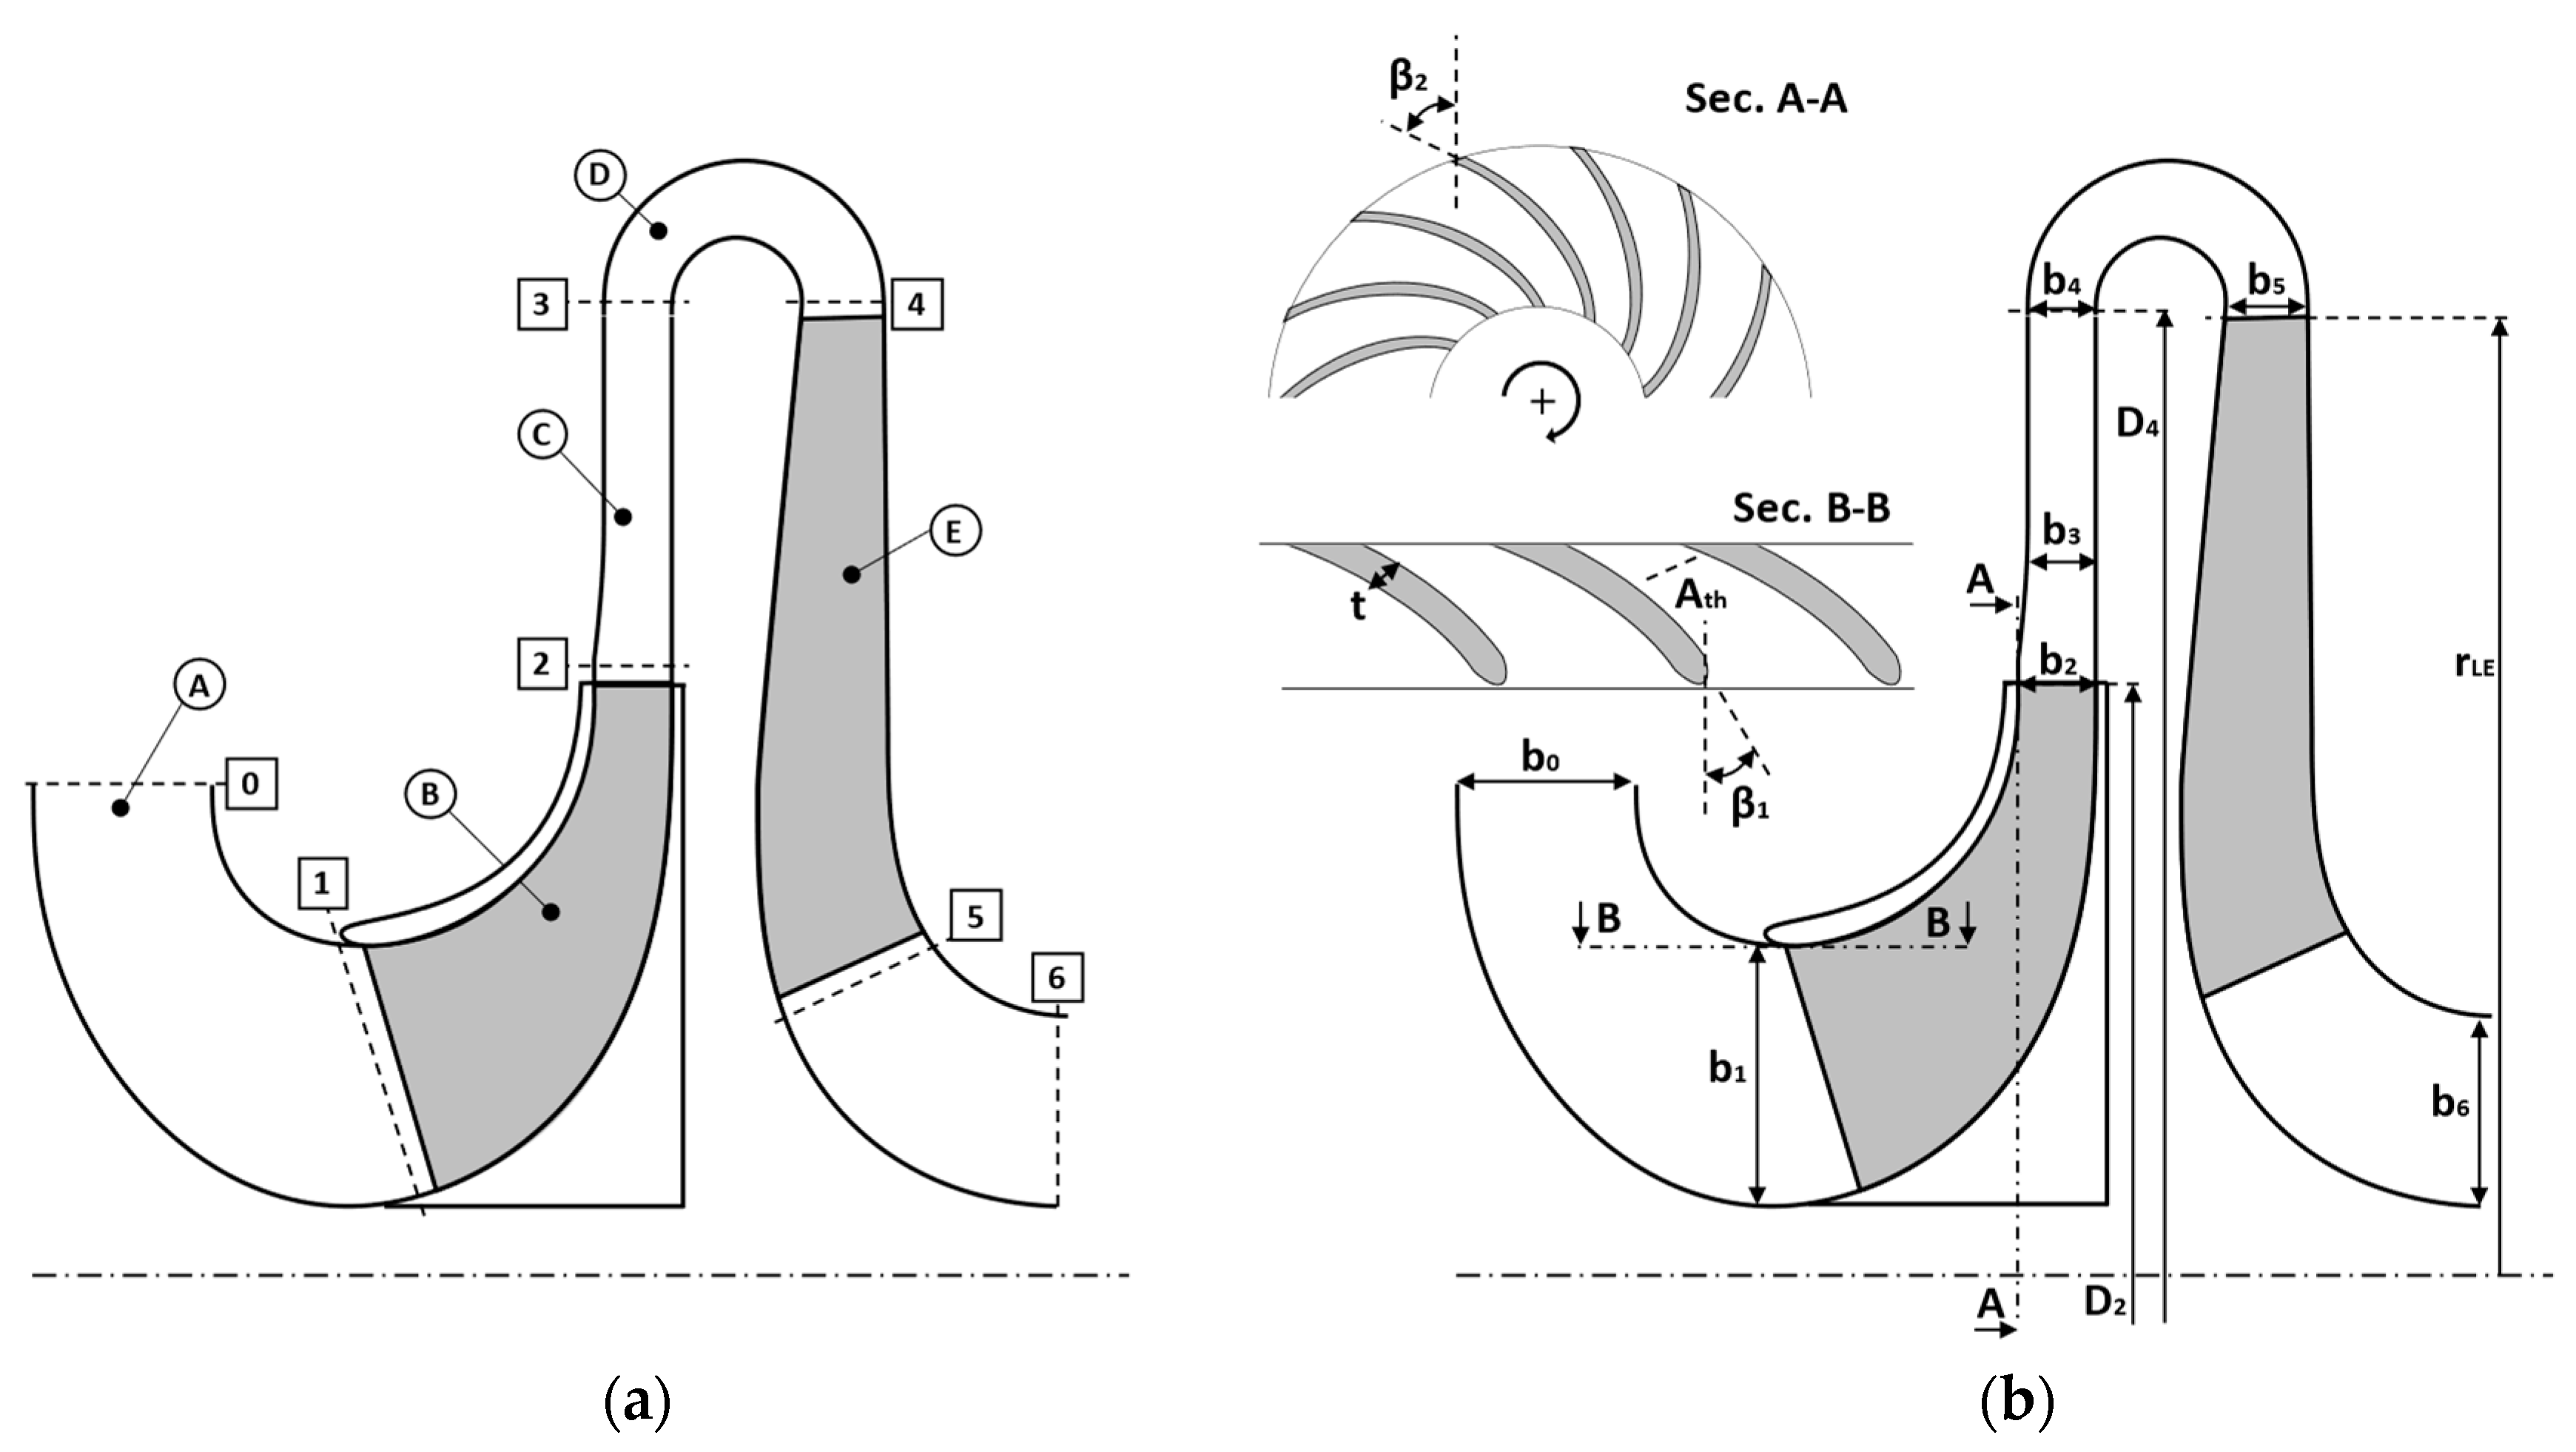
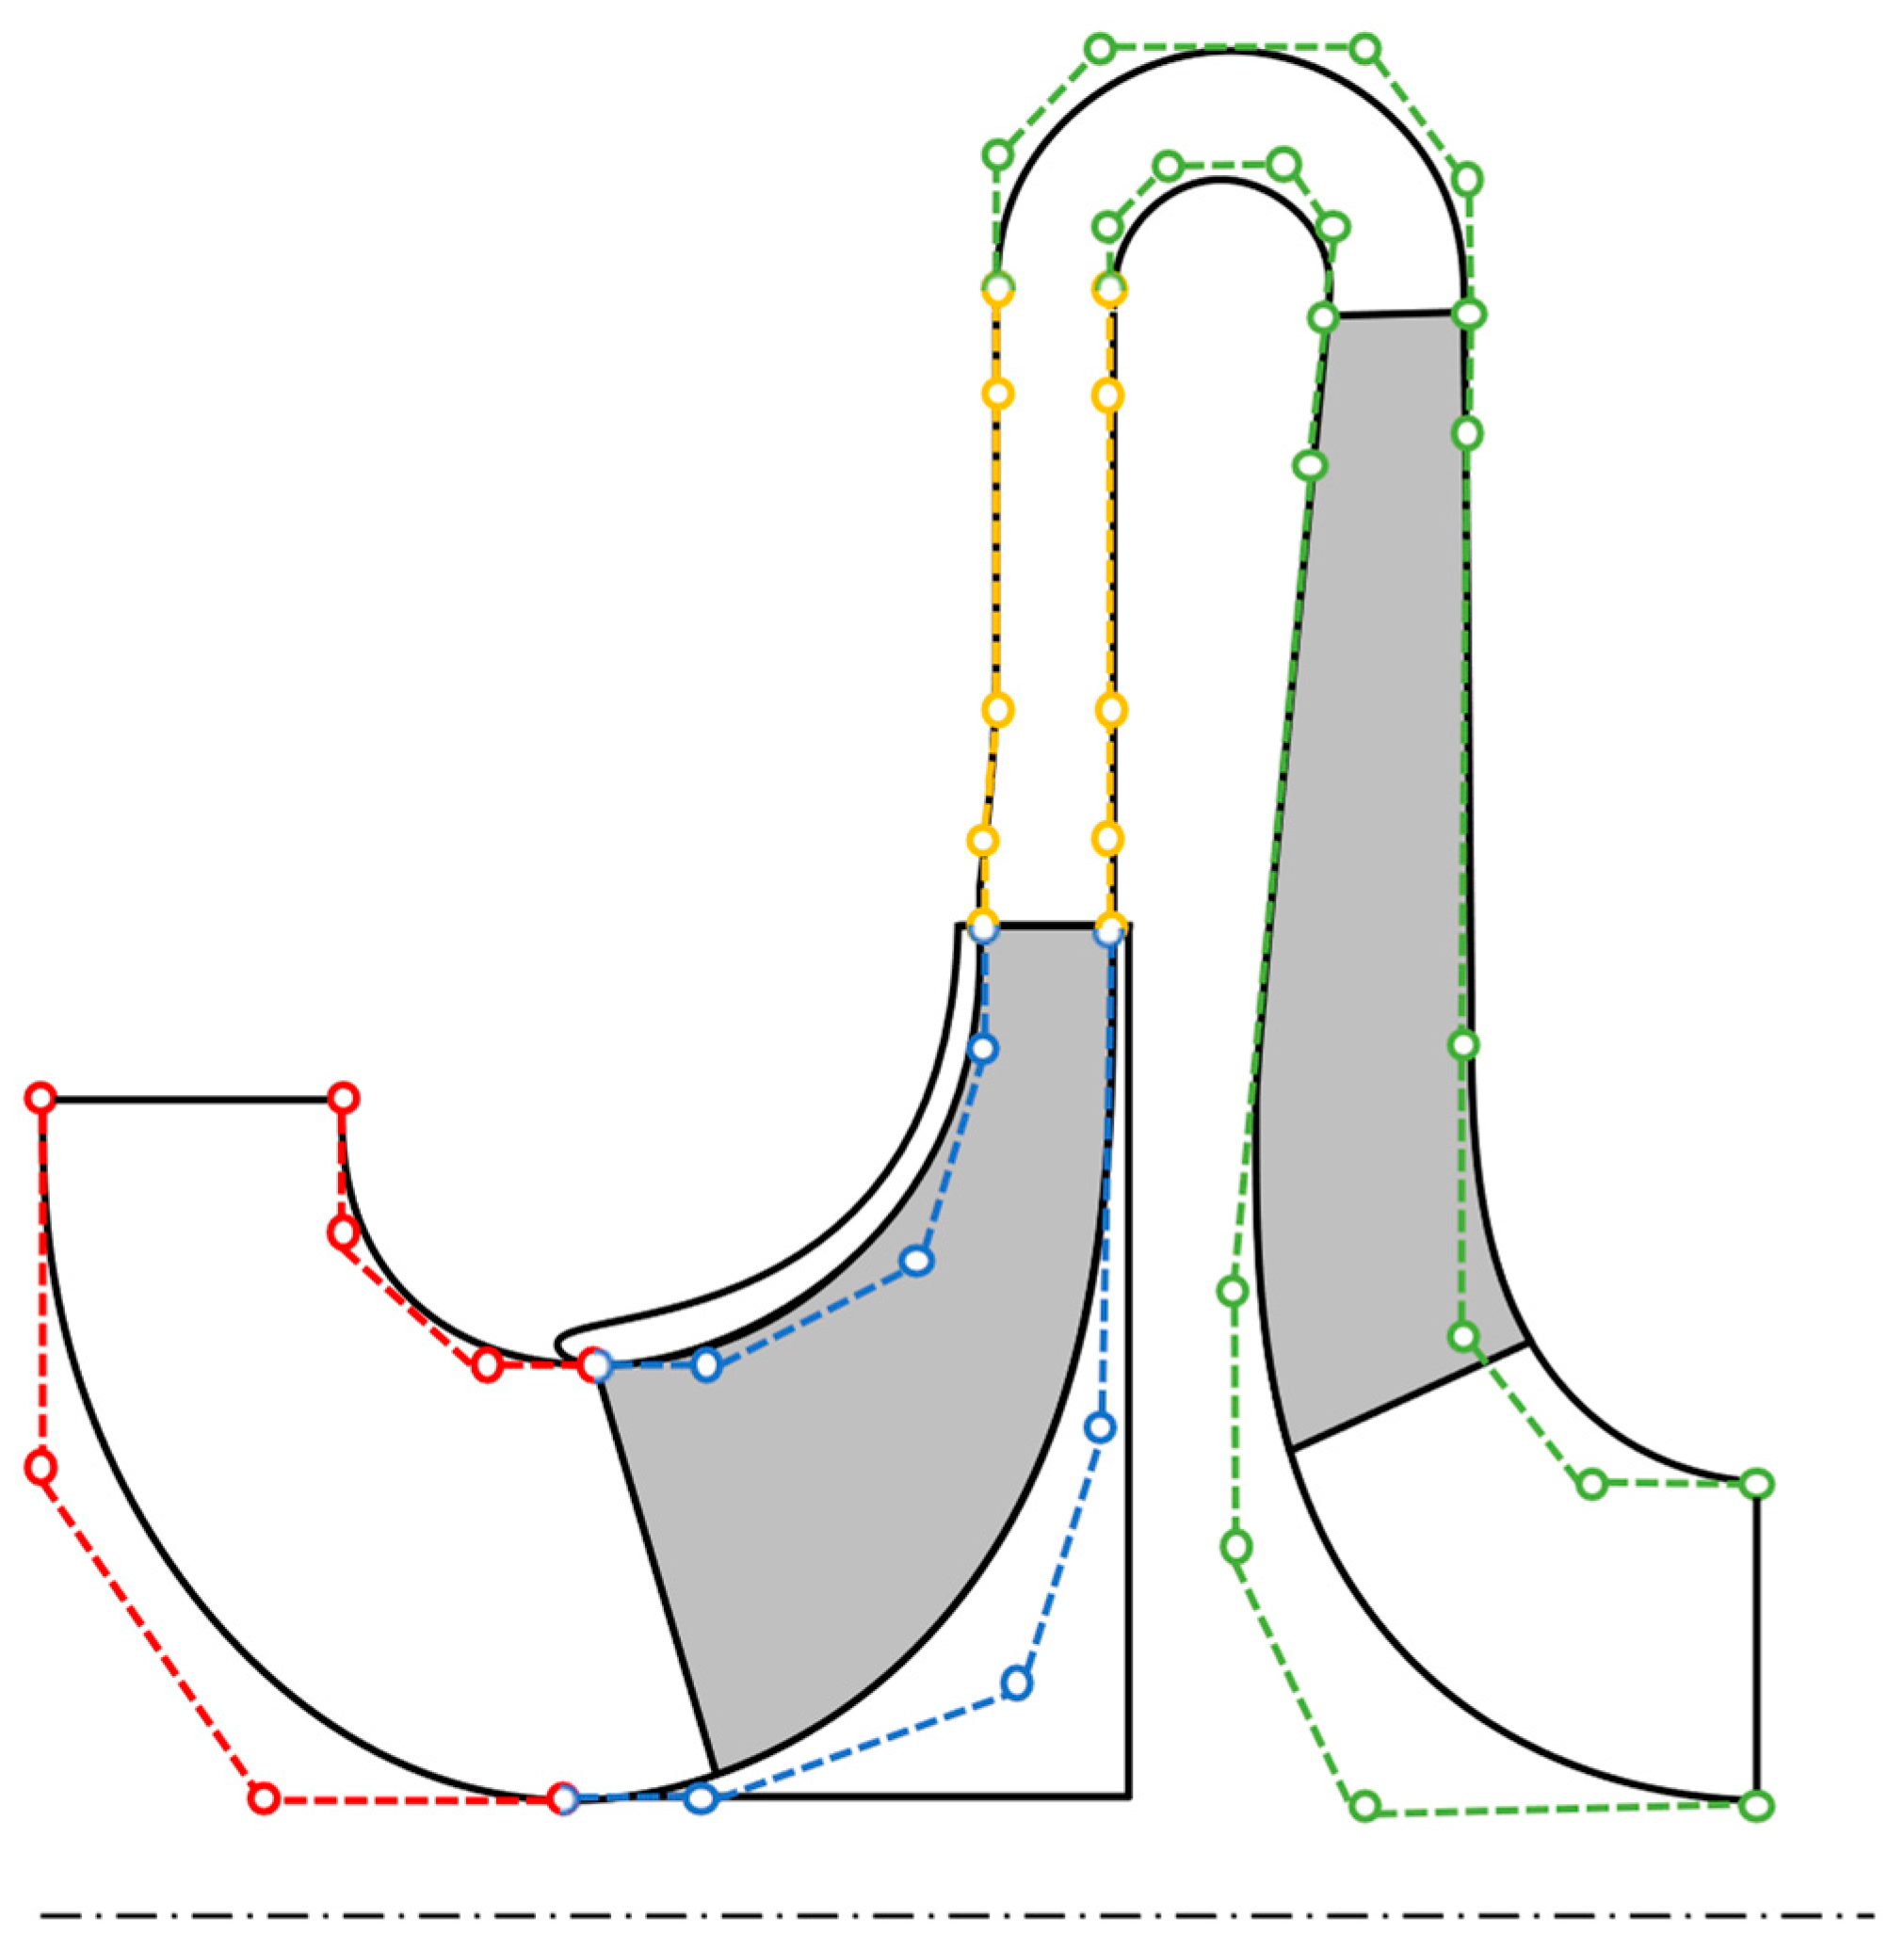
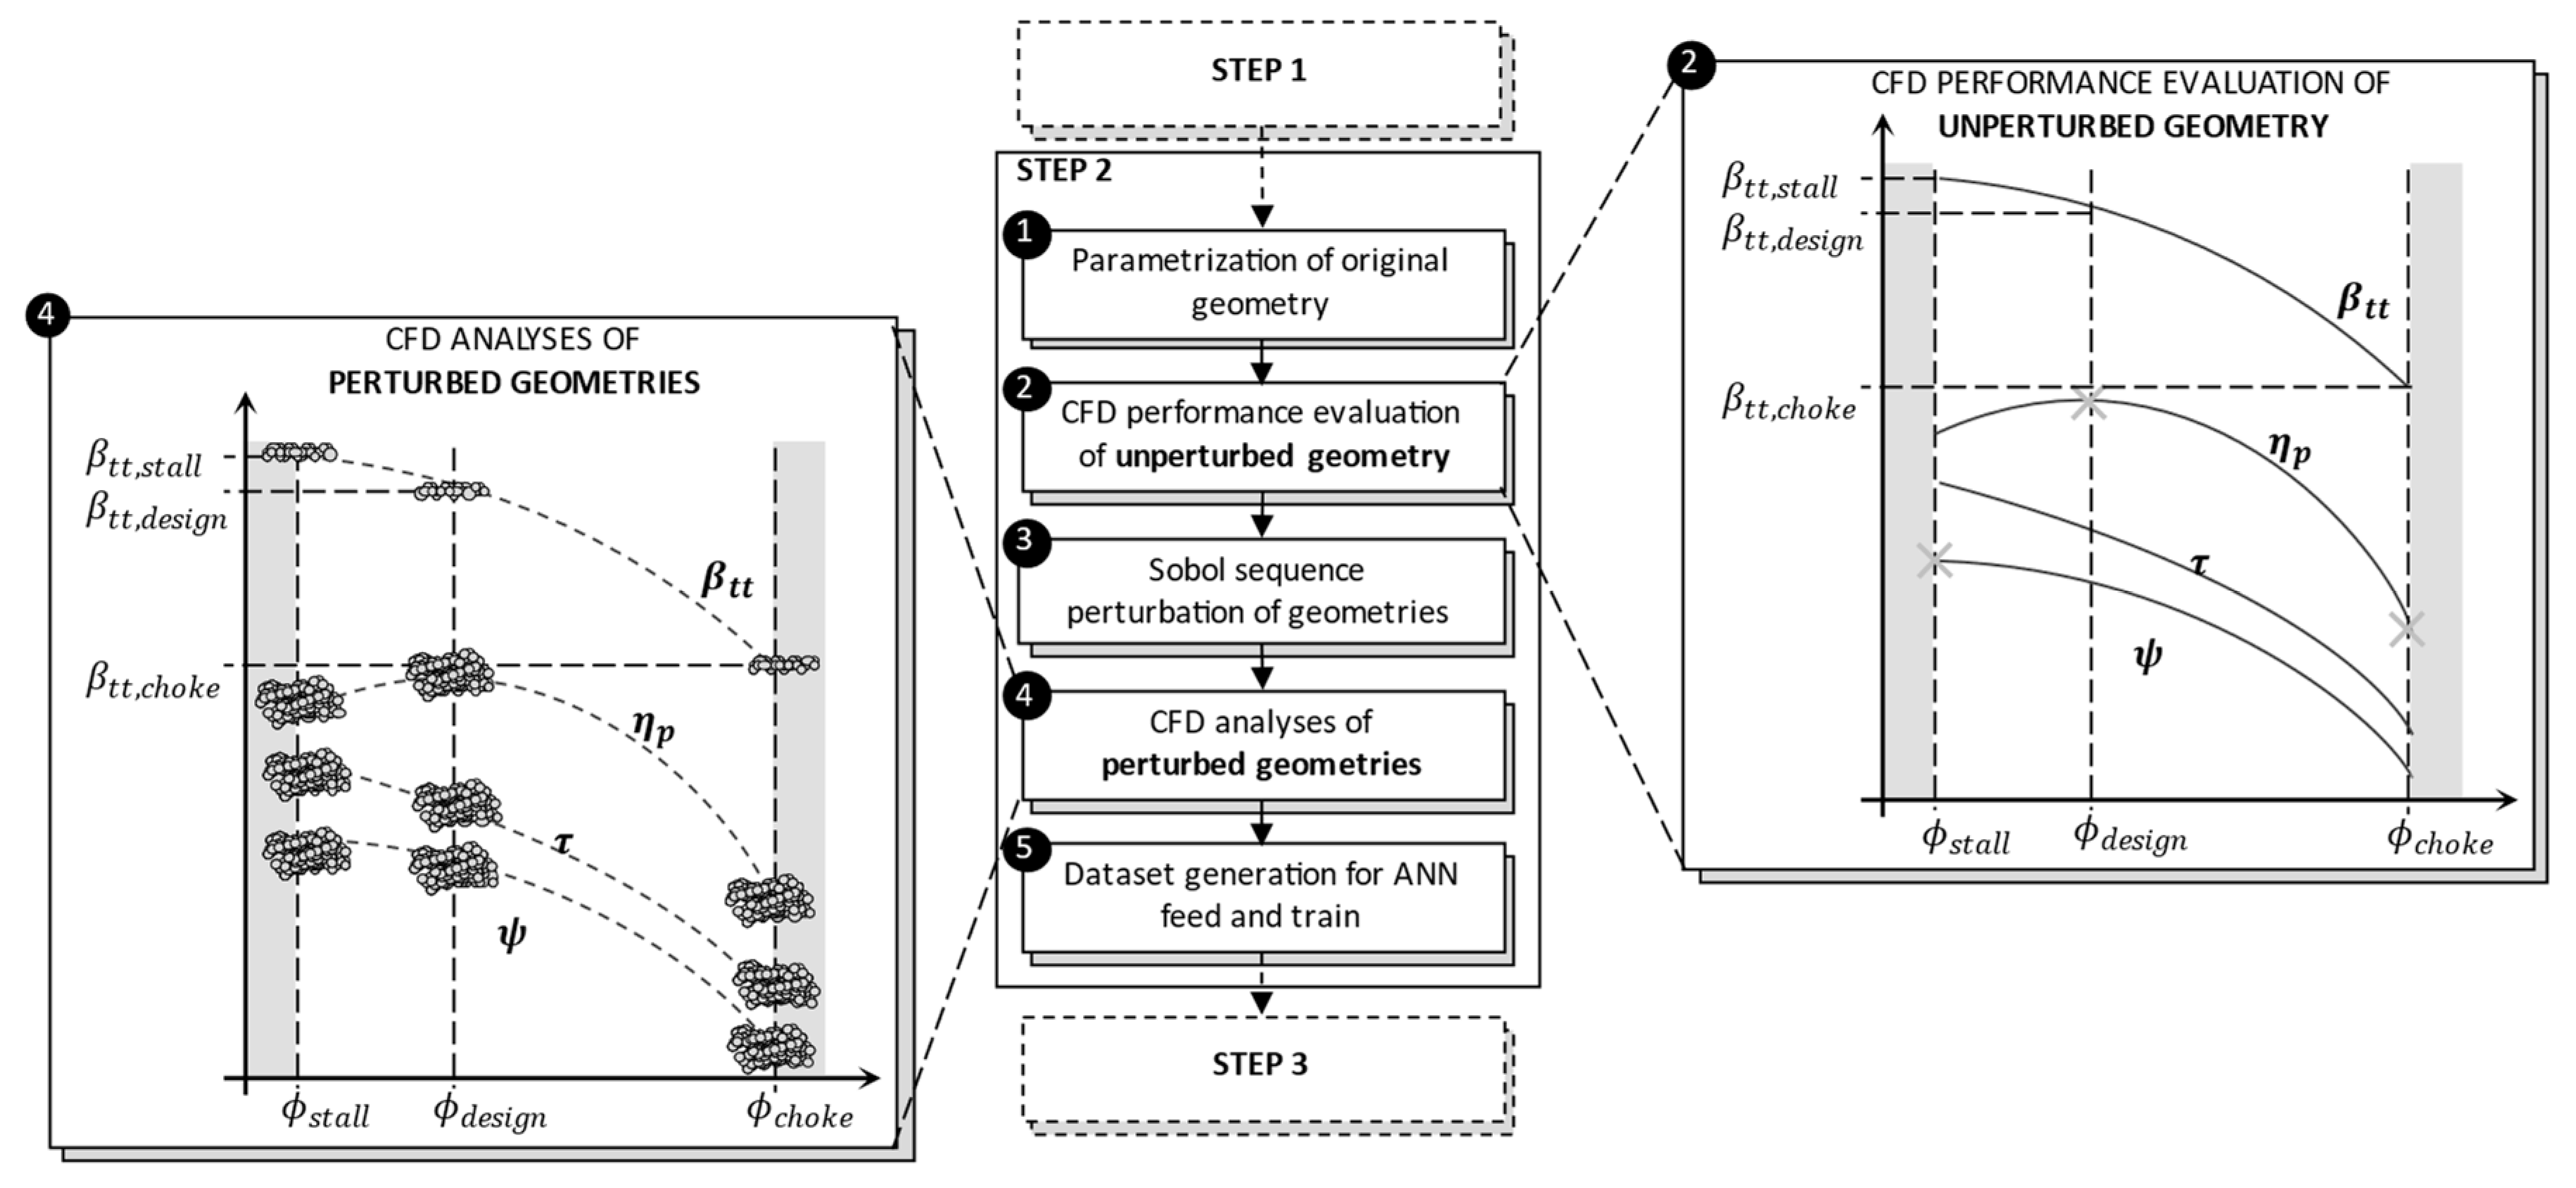
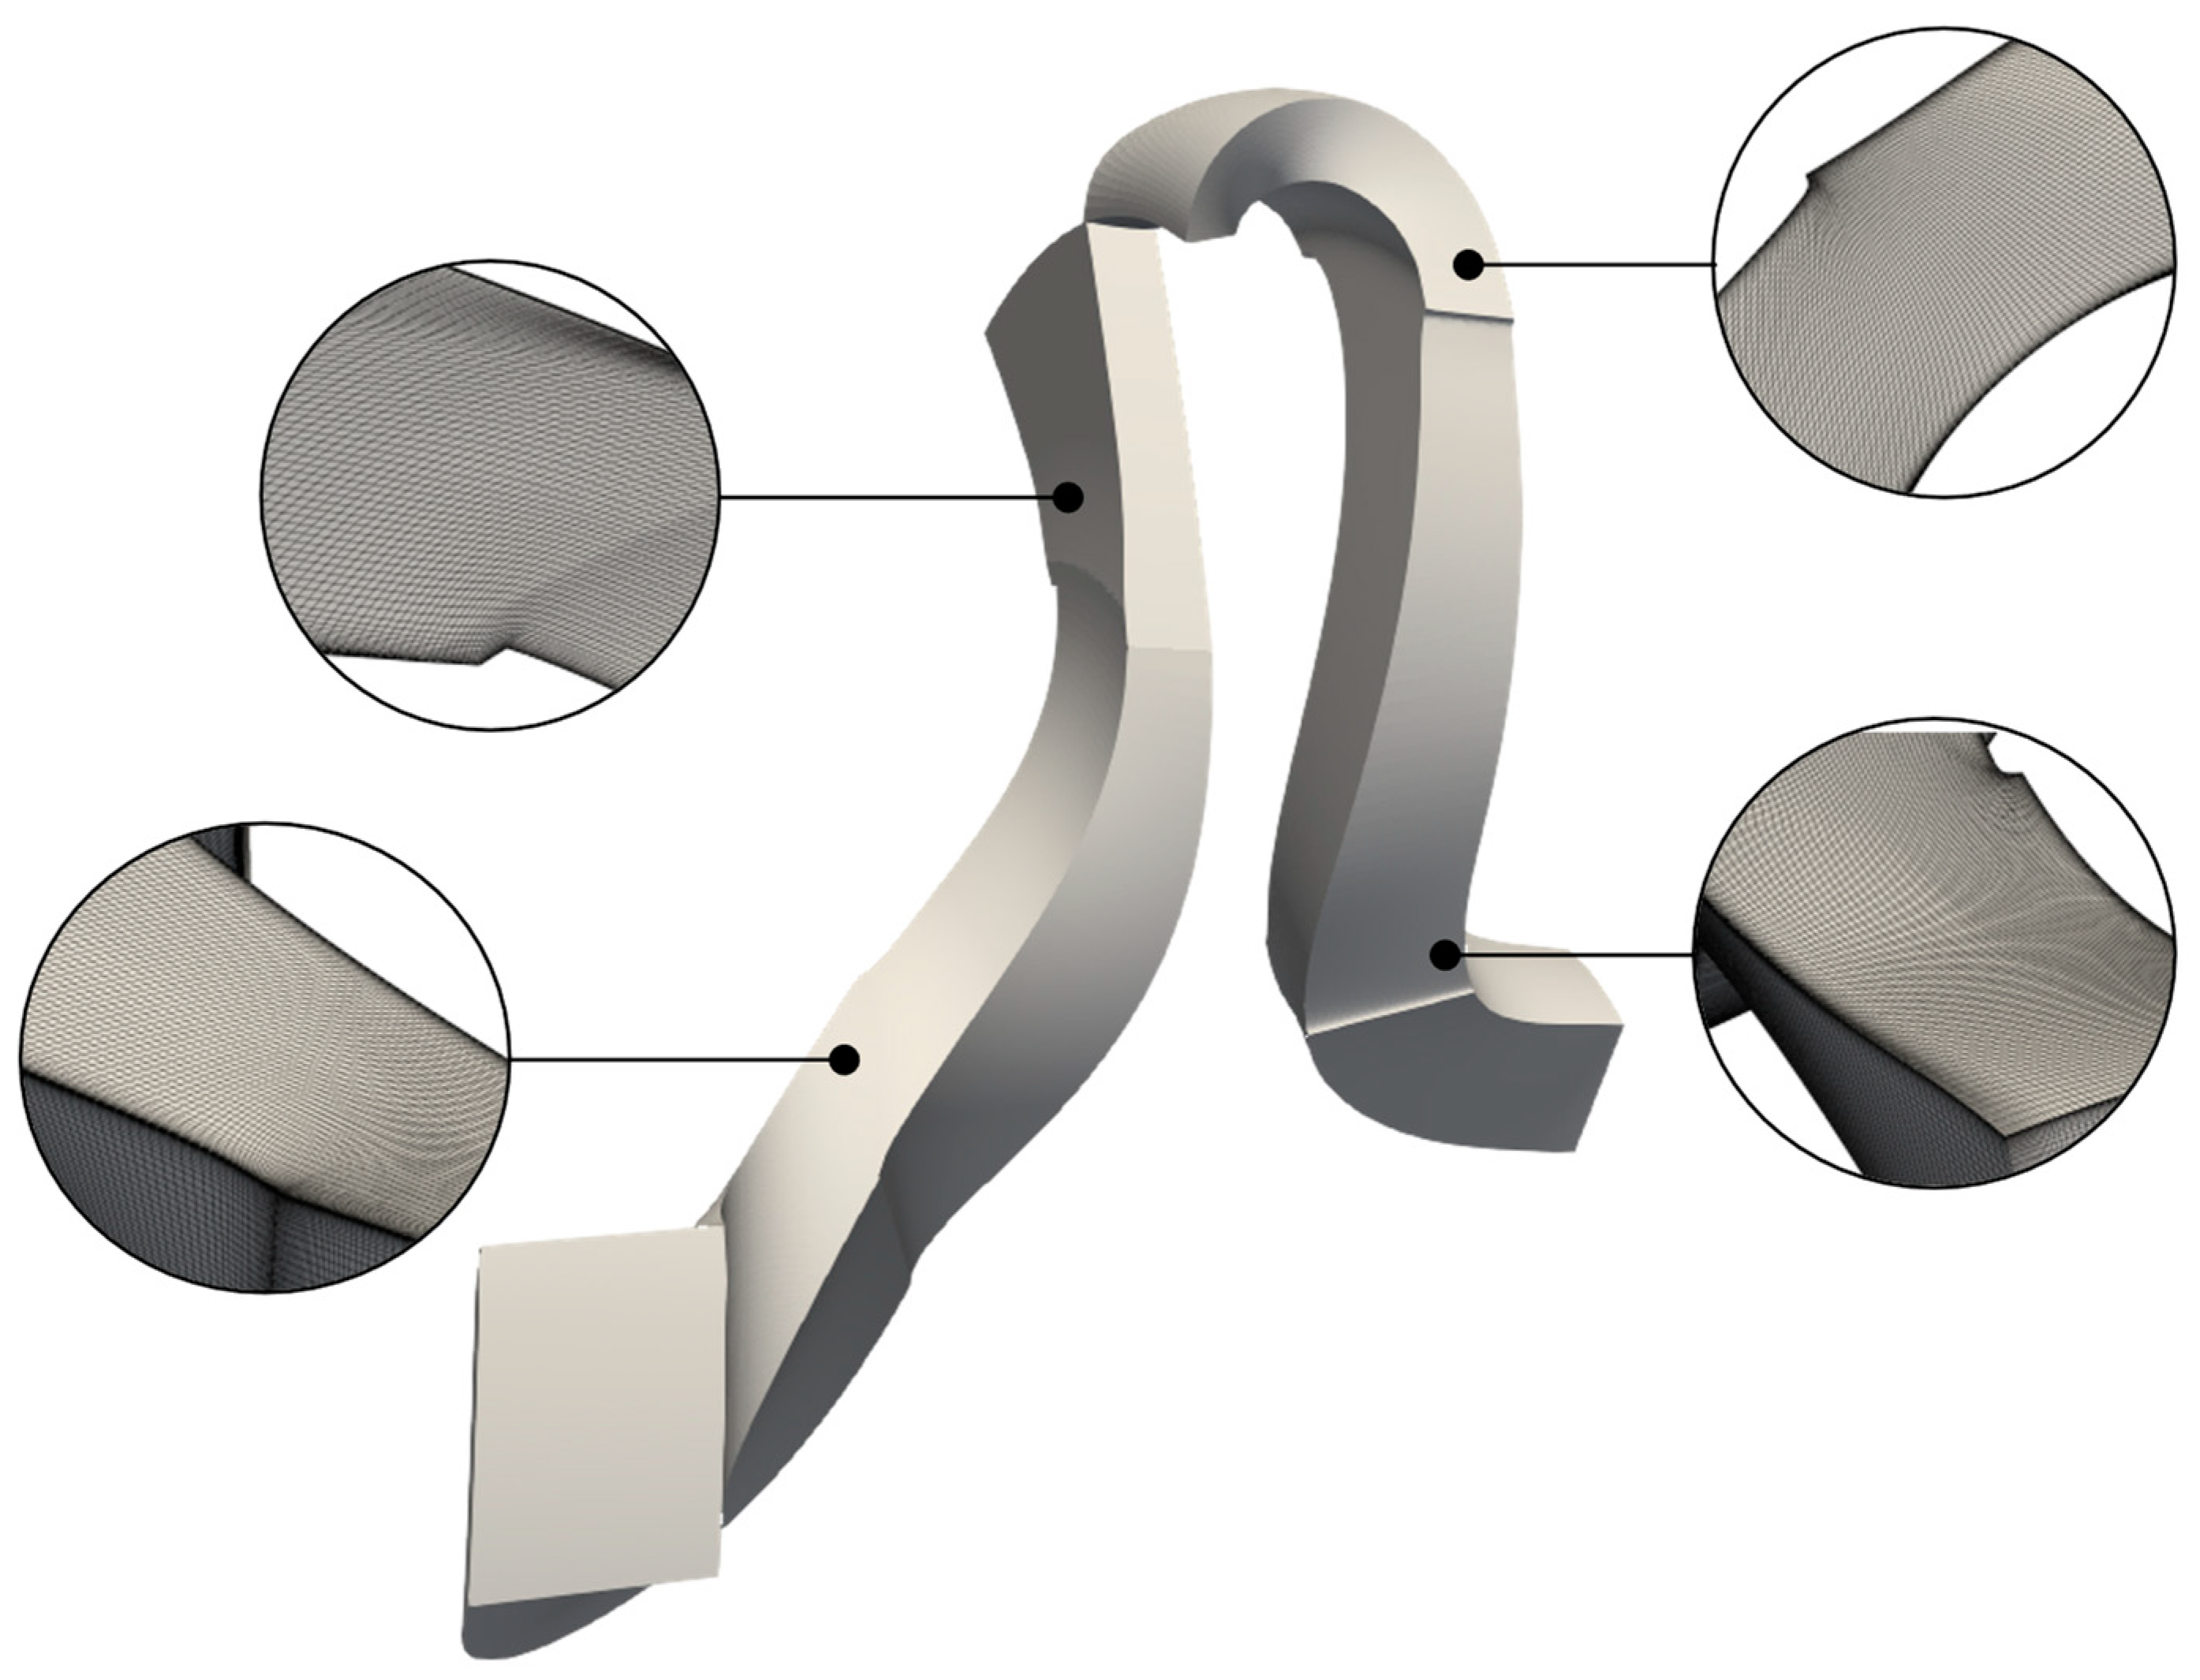
2.2. Step 2: Parametrization of Centrifugal Compressor Stage and Parametric Analysis

After defining the independent geometric parameters in step 1, a parametrization of the stage was carried out by leveraging Bézier curves [33], whose generic formulation is described in Equation (1).
B ( t ) = i = 0 n ( n i ) P i ( 1 t ) n i t i         w i t h   t [ 0 , 1 ] ,
Considering the meridional view shown in Figure 2, the stage end-walls were described with eight Bezier curves as follows:
  • The 3rd order Bezier curves are for inlet duct (Figure 2, red dots).
  • The 4th order Bezier curves are for impeller and diffuser (Figure 2, blue and yellow dots).
  • The 10th order Bezier curves are for crossover bend and return channel (Figure 2, green dots).
In particular, the impeller end-walls were described based on [34], adding supplementary poles (Figure 2, blue dots 2 and 4) to ensure smooth continuity with the other parts [35]. The shape of the inlet duct was frozen (Figure 2, red dots) to preserve the components upstream of the impeller. Instead, the radial position of the poles at the crossover bend inlet (Figure 2, green dots 1), the leading edge (LE) position of return channel blades, and the radial position of poles near the trailing edge (TE) of return channel blades (Figure 2, green dots 8 and 9) were adjusted following Equation (2).
r p o l e   i = c 1 , i   D R + c 2 , i ,
where c 1 , i and c 2 , i are coefficients, which varied from pole to pole (the specific values of c 1 , i and c 2 , i cannot be reported due to non-disclosure agreements). Moreover, to preserve the ratio between b 4 and b 5 , Equation (3) was adopted to adjust the position of poles near LE of the return channel blades (Figure 2, green dots 6 and 7) along the axial direction of the stage.
x p o l e   i = d 1 , i   b 4 + d 2 , i ,
where d 1 , i and d 2 , i are coefficients, which varied from pole to pole. Again, their specific values cannot be reported due to non-disclosure agreements. Finally, 6th order Bezier curves were employed for angle and thickness distributions of impeller blades.
Once the parametric discretization of the centrifugal compressor stage was achieved (task 1 of step 2, Figure 3), three CFD analyses of the original unperturbed compressor stage (the one without variation of geometrical parameters) were performed at stall, design, and choke conditions (task 2 of step 2, Figure 3). The resulting performances at section 2, 3, and 6 (Figure 1a) were then collected in terms of total-to-total pressure ratio ( β t t ), polytropic efficiency ( η p ), work coefficient ( τ ), and polytropic head ( ψ ) following the definitions of Equations (4)–(7) (shown in the specific case of section 6).
β t t = p 06 p 01 ,
η p = k 1 k ln ( p 06 p 01 ) ln ( T 05 T 01 ) ,
τ = c p ( T 06 T 01 ) U 2 2 ,
ψ = τ   η p = c p ( T 06 T 01 ) U 2 2 k 1 k ln ( p 06 p 01 ) ln ( T 06 T 01 ) ,
During the CFD evaluation of the unperturbed stage, the stall condition was defined as the point with the horizontal tangent of ψ , the design condition as the point with the peak of η p , and the choke condition as the point at which η p decreased by 10%. For these conditions, CFD analyses were performed at fixed mass flow rate, defined by means of the non-dimensional flow coefficient ( ϕ ) and peripheral Mach number ( M u ) described in Equations (8) and (9).
ϕ = 4 Q 01 π D 2 2 U 2 ,
M u = U 2 a 01 ,
After performing the CFD analyses of the unperturbed stage, a Sobol quasi-random low discrepancy sequence [36] was adopted to assign a feasible value to independent parameters from step 1. By varying and combining these values, a dataset of 600 different geometries was obtained (task 3 of step 2, Figure 3), and then, a parametric analysis was achieved by performing CFD computations on each geometry (task 4 of step 2, Figure 3). Concerning the Sobol sequence [36], the value of each independent parameter was assigned following Equation (10).
x p q = x l p + S p q · ( x u p x l p )                     with   p = 1 , , P   and   q = 1 , , Q ,
where the total number of compressor geometries was defined with Q , while q was the specific stage, P was the total number of independent parameters from step 1, p was the variable to which x p q was assessed, and S p q was a value determined by the Sobol sequence. Moreover, x l p and x u p were the upper and lower limits of each parameter. The Sobol sequence was adopted instead of Monte Carlo sampling or Latin Hypercube since it is more effective when a large number of independent input variables is affecting a problem [37].
Using the β t t values of the unperturbed compressor stage (baseline) obtained for stall ( β t t , s t a l l ), design ( β t t , d e s i g n ), and choke ( β t t , c h o k e ) conditions during task 2 of step 2, the parametric analysis was performed by running CFDs, with imposed pressure ratio on each perturbed stage, for a total of 1800 simulations per stage (task 4 of step 2, Figure 3). The reason behind imposing pressure ratios was to determine what flow rate the modified centrifugal compressor would achieve to guarantee the same pressure rises. However, an interesting alternative that will be evaluated in future works would be to impose a fixed mass flow rate for the design point and a fixed pressure ratio for the stall and choke conditions. At the end of step 2, by leveraging the analyzed geometries and their performance, a dataset was generated (task 5 of step 2, Figure 3) for feeding and training an ANN in step 3. As a matter of fact, knowing the behavior of the unperturbed geometry, it is possible to associate a geometric variation with a corresponding variation in aerodynamic performance. A summary of the process followed in step 2 is shown in Figure 3.
Focusing on CFD simulations, RANS computations were carried out by means of TRAF code [38]—a 3D viscous solver for the resolution of Reynolds-Averaged Navier–Stokes equations on structured grids [39]. In the project, convective fluxes were discretized with a 2nd order TVD-MUSCL strategy based on the Roe’s upwind scheme, while a central difference scheme was adopted for viscous fluxes. The turbulent closure was achieved with Wilcox’s k-ω model [40], guaranteeing a high level of parallelization with a hybrid OpenMP/MPI architecture [41]. H-type grids were adopted to discretize the computational domain shown in Figure 4. Specifically, an H-type grid was used for the first block composed by the inlet duct, the impeller, and the vaneless diffuser, and another H-type grid was adopted for the second block consisting of the crossover band and the return vane channel.
After a sensitivity analysis, an overall grid of 4.8 million elements was selected. Table 3 describes the outcomes of the sensitivity analysis, which demonstrate that exceeding the number of elements beyond 4.8 million does not lead to changes in the centrifugal compressor performance predicted by the CFD simulations. Boundary conditions were imposed at the inlet and outlet of domain, on solid walls, and between adjacent blade-rows. Concerning the domain inlet, span-wise distribution of total temperature, total pressure, and flow angles were adopted. At the domain outlet instead, the span-wise distribution of static pressure was imposed. For solid walls, no-slip and adiabatic conditions were exploited, whereas a periodicity condition was used between adjacent blade-rows. At the interface between adjacent blocks, the mixing plane approach was adopted to guarantee their coupling. Finally, a full resolution of boundary layer was ensured using near wall grid refinements. All the assumptions adopted for the numerical setup are summarized in Table 4.

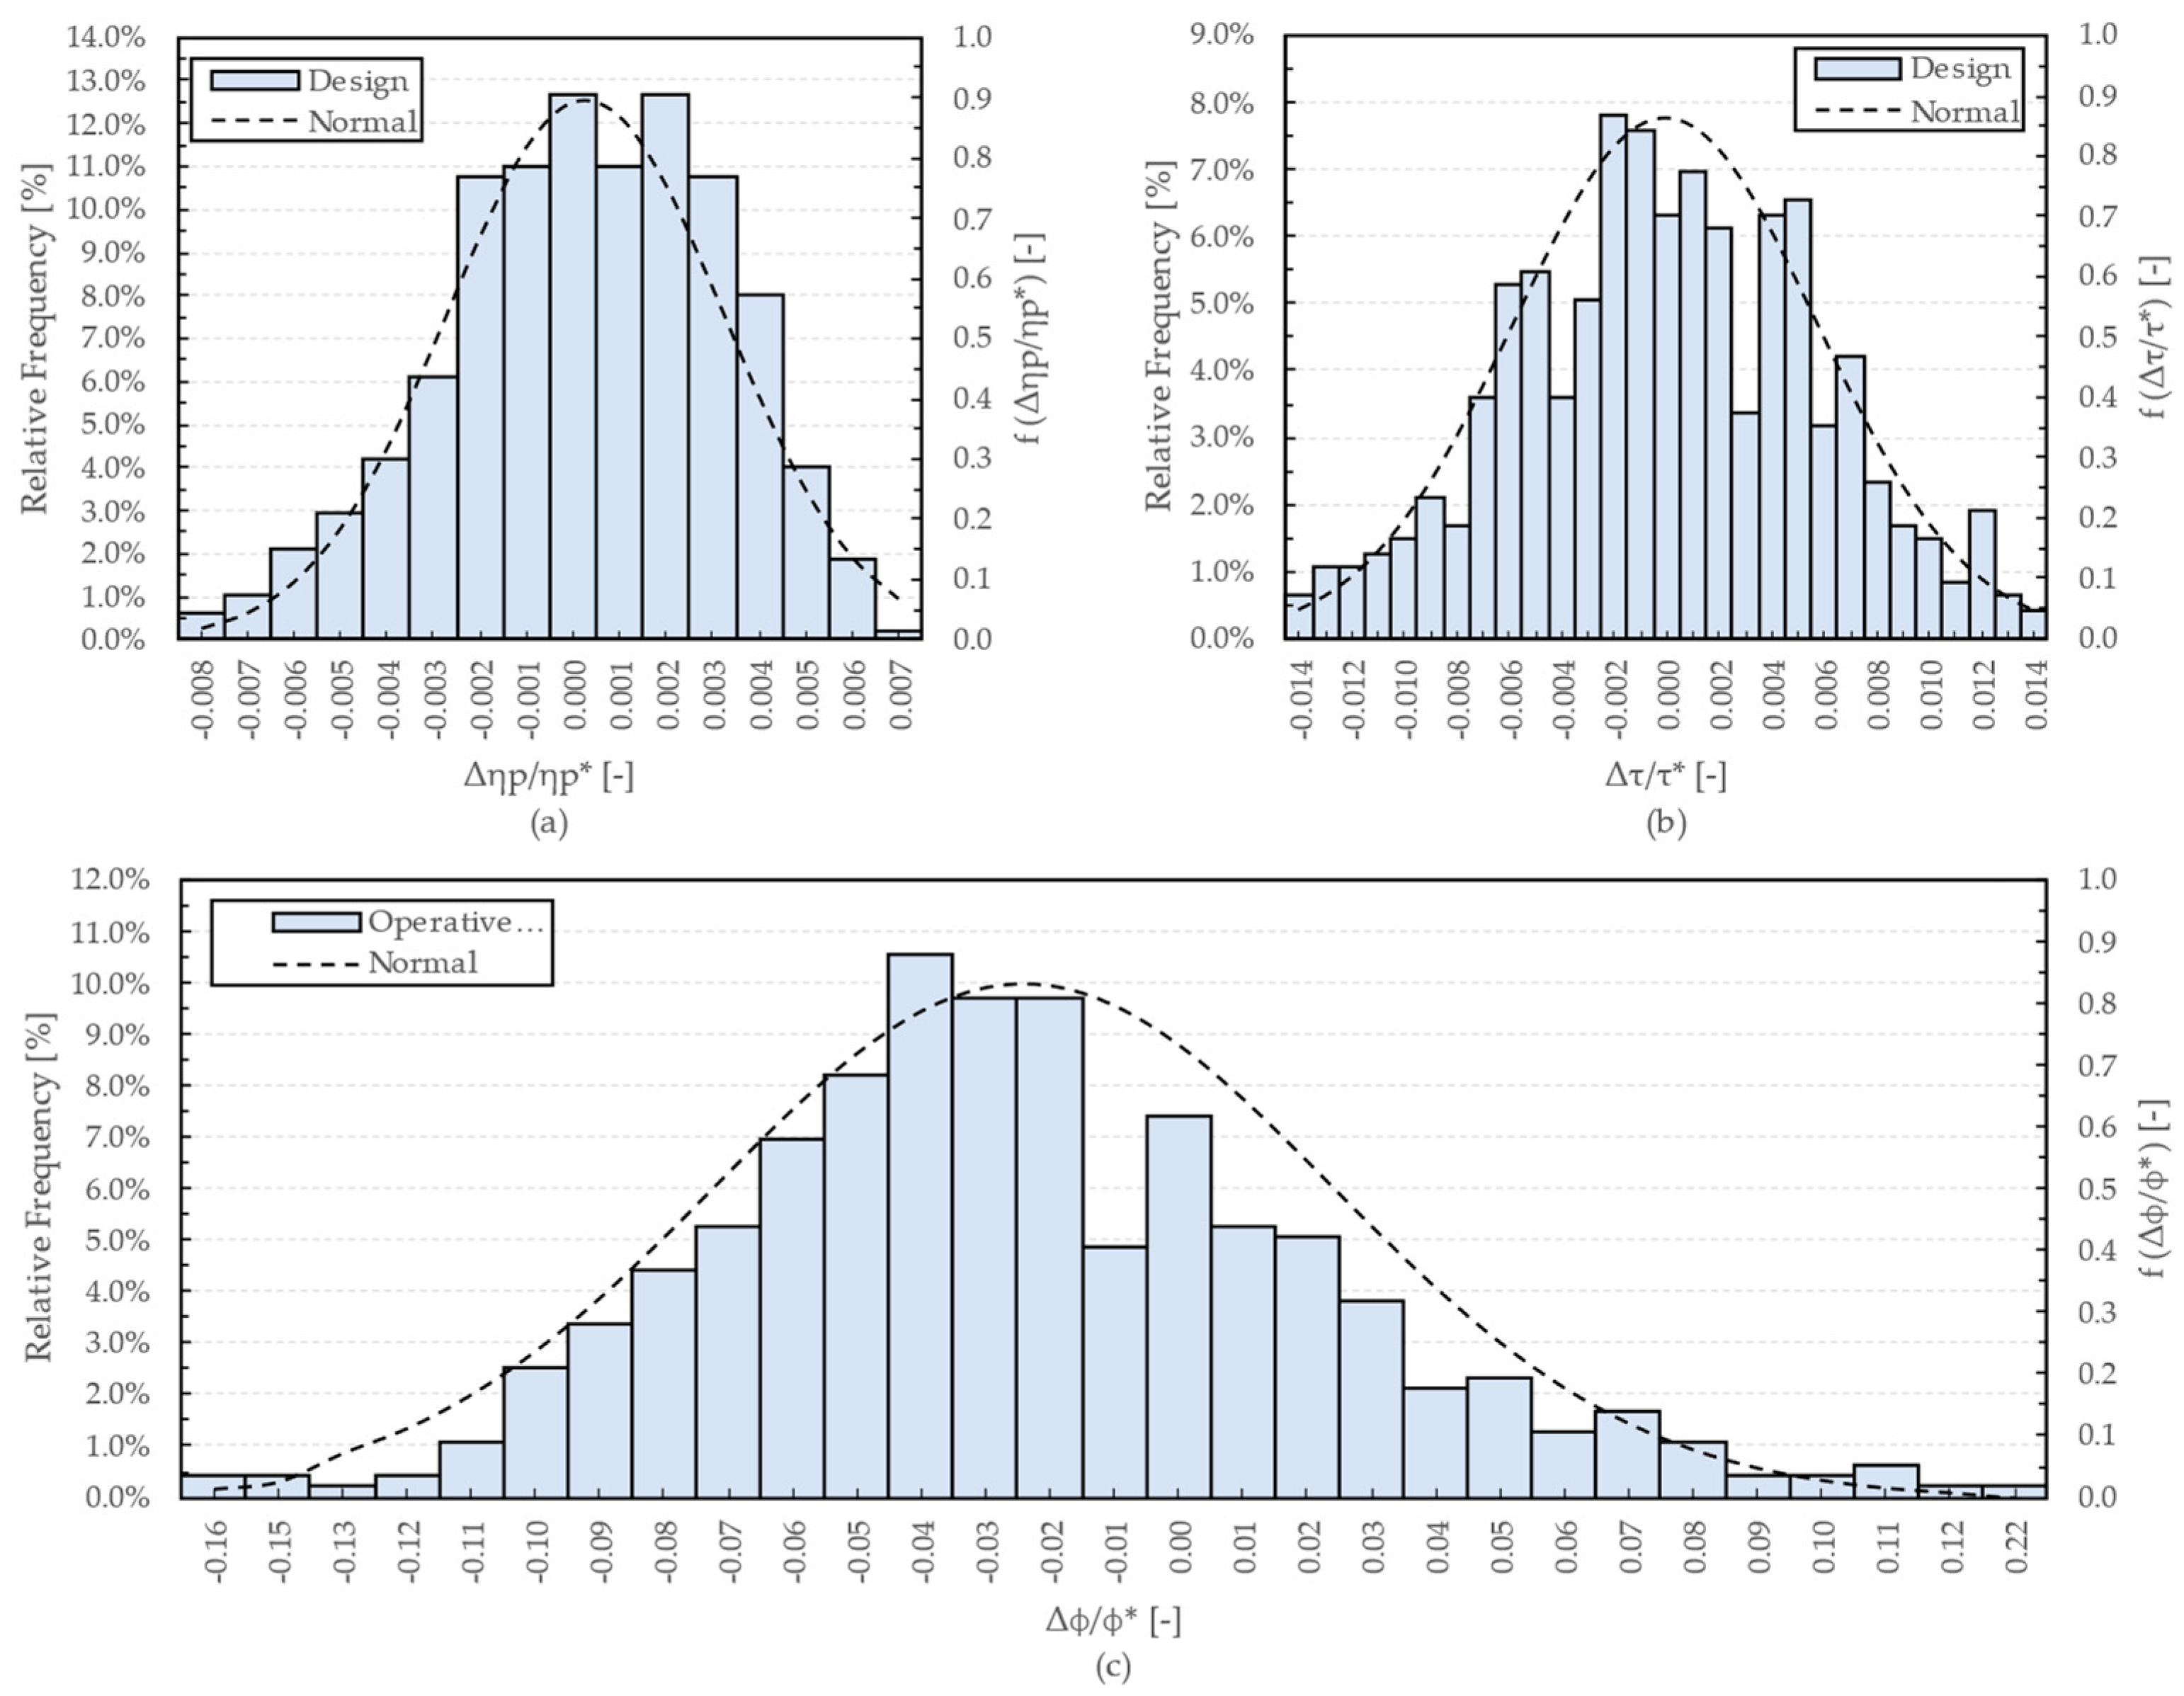
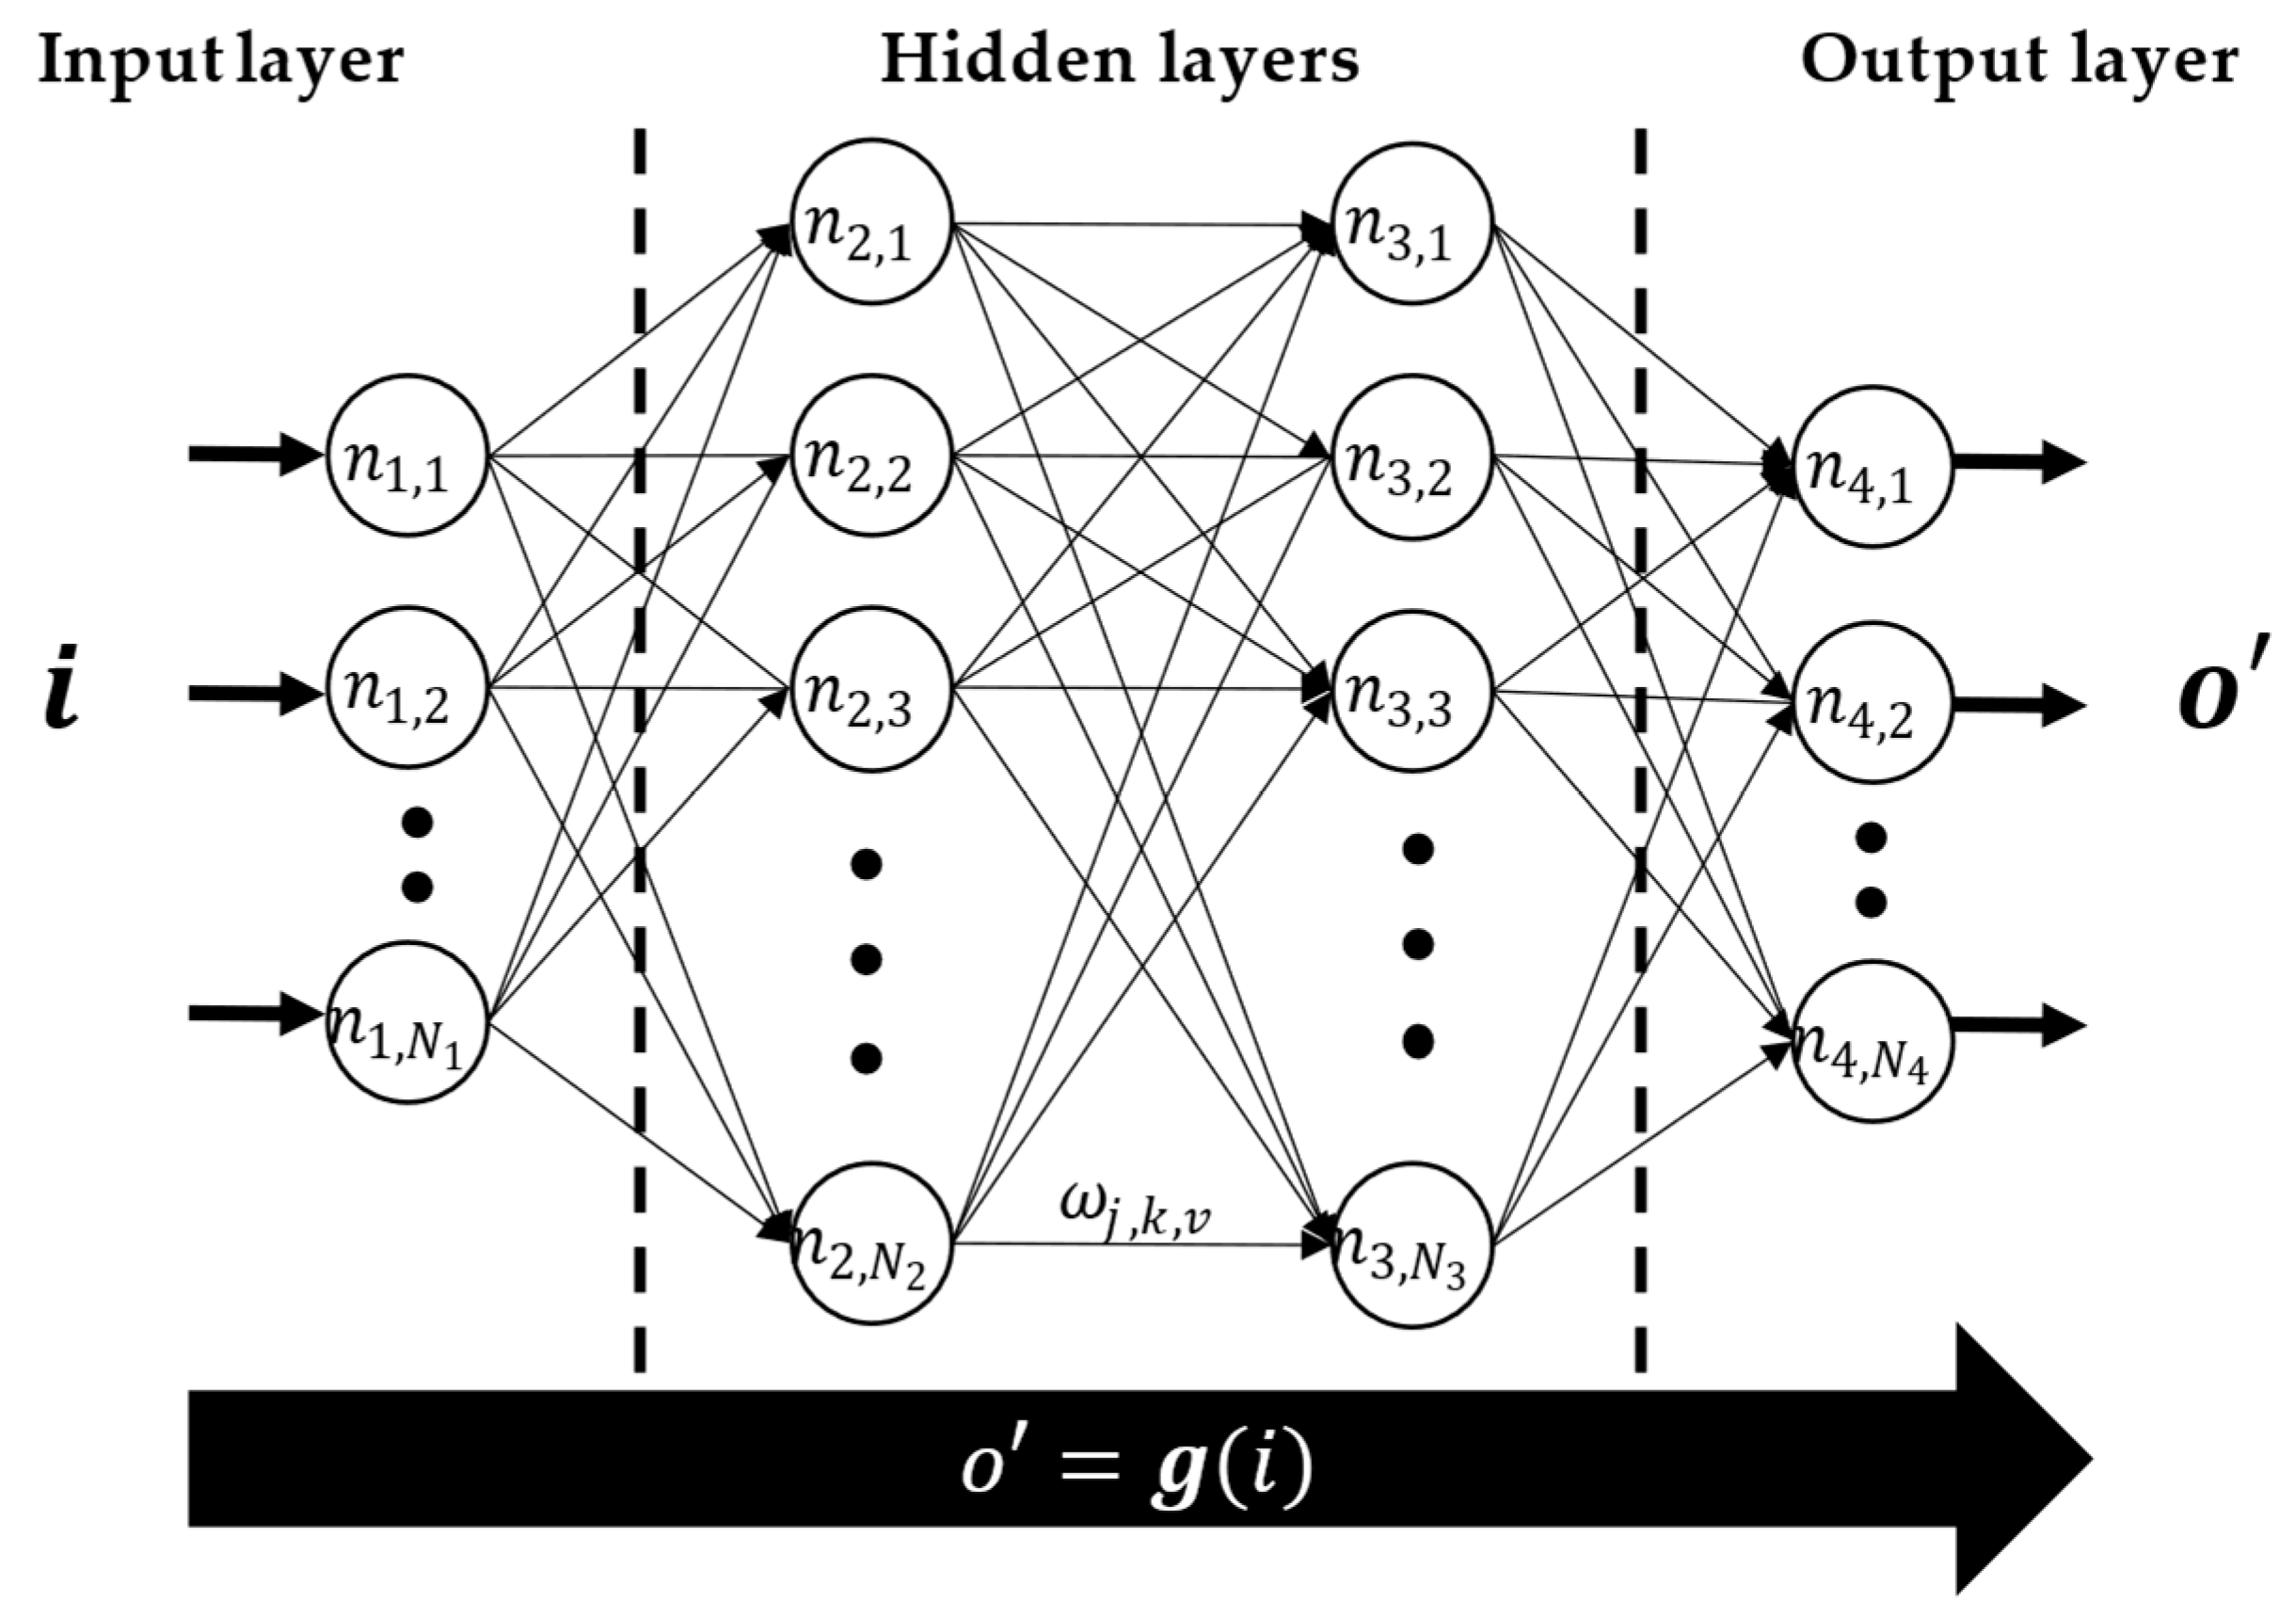
2.3. Step 3: Feed, Train, and Validation of Artificial Neural Network

In step 3, the outcomes of the parametric analysis were collected with the Sobol-based values of independent parameters to feed and train an ANN. The resulting surrogate model provided a response surface, able to reproduce CFD behavior, in predicting the impact of geometric variations on centrifugal compressor performance. Leveraging 70% of the dataset obtained in step 2, a feed-forward ANN with two hidden layers was trained to minimize the difference between the ANN prediction and the CFD results [42]. Instead, the remaining 30% of the dataset was used to test (15%) and validate, with a k-fold cross-validation (15%), the ANN. The development of the feed-forward ANN with two hidden layers was carried out in Python environment based on Keras [43] and TensorFlow [44] packages. Such implementation was performed according to [45]. The learning process of the ANN can be briefly summarized as follows. To a first approximation, the CFD behavior could be considered as a transfer function f , which provides an output vector o from an input vector i following Equation (11).
o = f ( i ) ,
where i includes the stage performance predicted by CFD (Equations (4)–(7)), and o includes the changes in the independent parameters of Table 1. Similarly, starting from the same input vector, the ANN forecast (namely o ) could be described by Equation (12), where g is the behavior learnt by the ANN in the training phase.
o = g ( i ) ,
As aforementioned, the ANN response surface ( g ) represents a surrogate model of CFDs ( f ) . Hence, it is inherently possible that ANN forecasts ( o ) might differ from CFD results ( o ) . In light of this, the training process aims to minimize the prediction error ( δ ) between o and o (Equation (13)).
δ = o o 2 ,
This task involves the recursive execution of the training phase and the frequent adjustment of the weights ω j , k , v used to handle the passage of information through neurons. Finally, having trained the ANN, a k-fold cross-validation process is necessary to understand the reliability of the ANN and to avoid the occurrence of under-fitting and over-fitting problems. In Figure 5, a schematic representation of the trained feed-forward ANN with two hidden layers is shown.

3. Results and Discussion

As an example case study, the approach defined in Section 2 was employed on a family of five impellers for medium–high Mach number applications. However, for the sake of brevity, only three of the five stages composing the compressor family are reported in the following. Specifically, two centrifugal compressor stages were selected as the extremes of the family (characterized by the lowest and the highest mass flows), while the third one was chosen as the intermediate stage of the family (the one designed for medium mass flows). These centrifugal compressor stages (hereafter referred to as low, medium, and high mass flow stage) are representative of the entire family, and therefore, the considerations obtained can be easily extended to the other two stages. In the following, the experimental validation of the CFD numerical setup is provided in Section 3.1, while findings and discussions of the proposed approach are presented in Section 3. For non-disclosure agreements, all the results shown in the figures below are dimensionless.

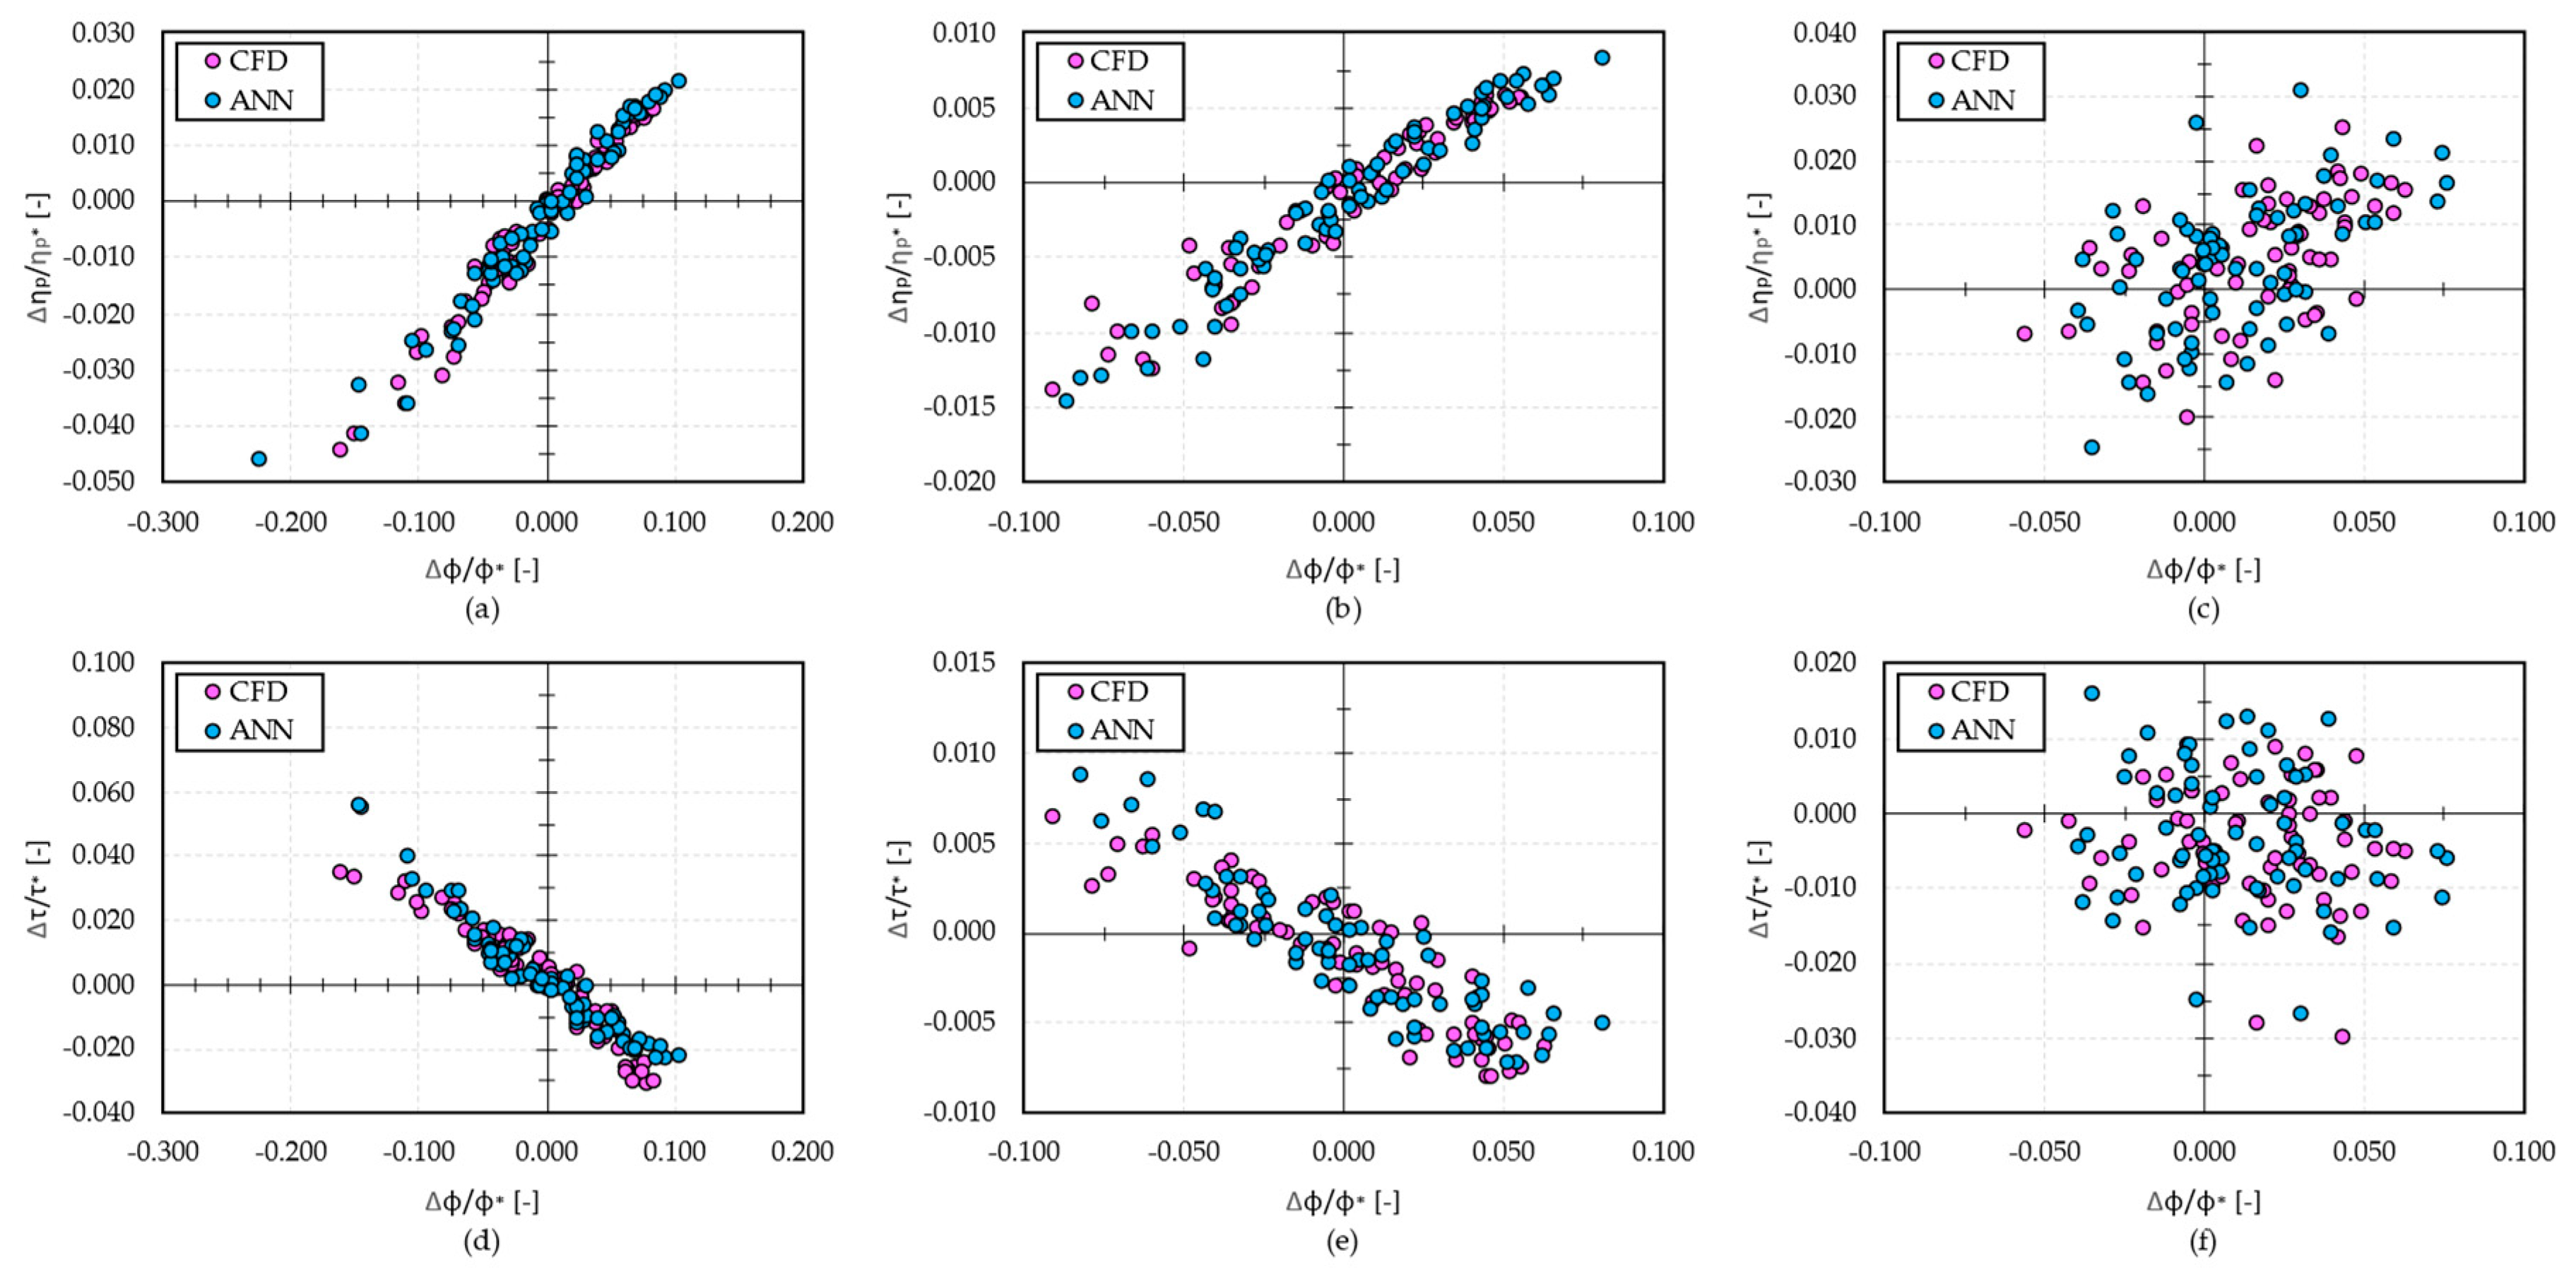
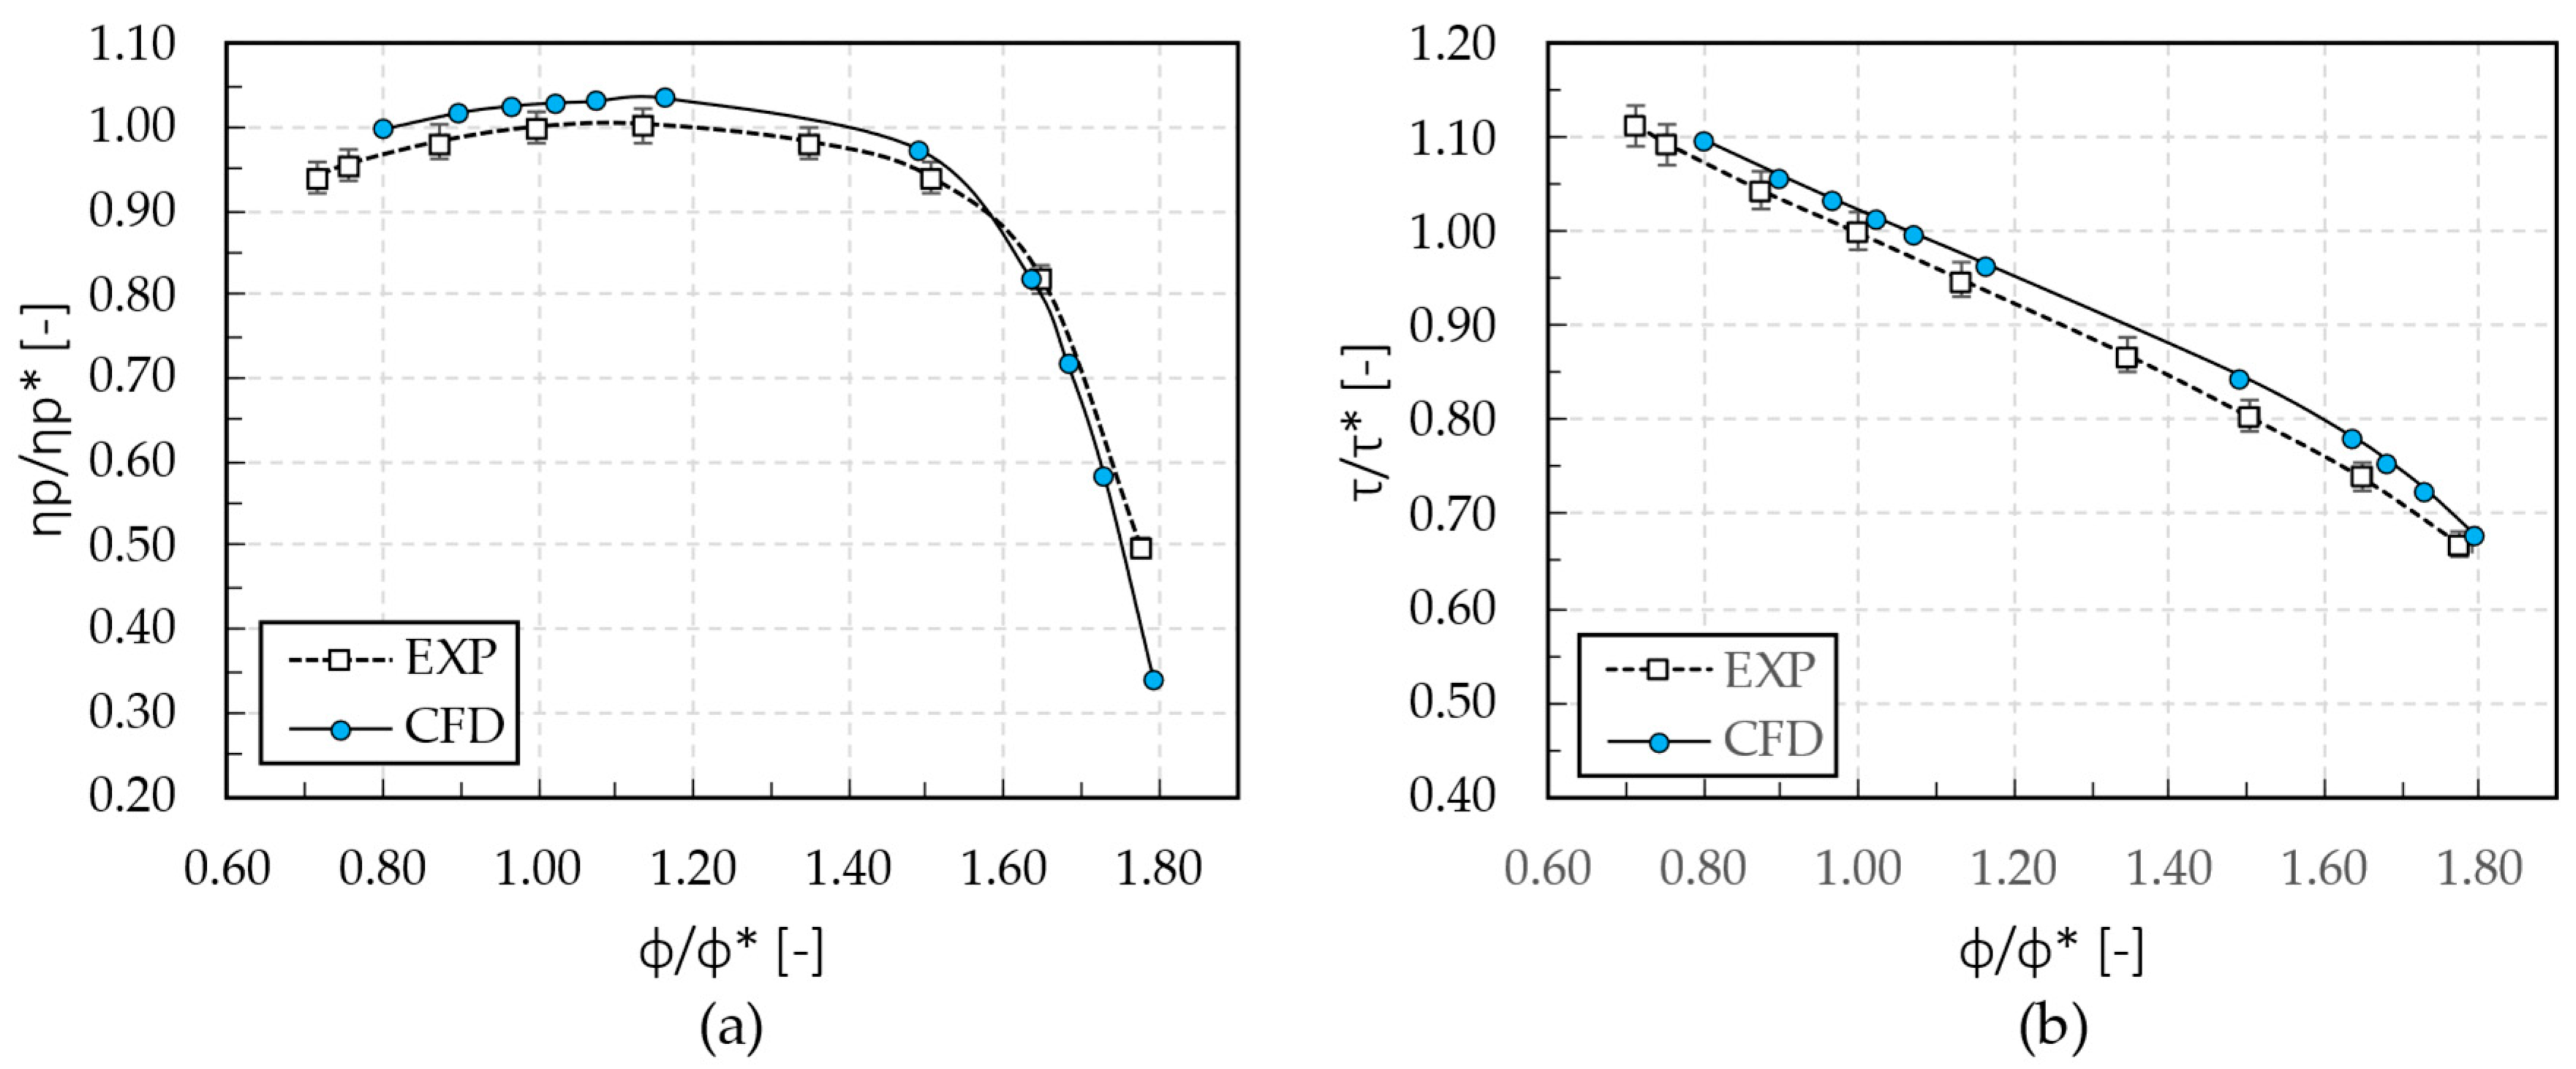
3.1. Experimental Validation

Before starting with the application of the proposed approach, the numerical setup was verified by exploiting experimental data from Baker Hughes. This task was necessary to assess CFD prediction errors. Indeed, simulations were carried out without considering the impeller hub, shroud cavities, and the effects due to parasitic losses. This simplification was required to limit the computational effort during the creation of ANN databases. In this regard, the impact of such a choice on prediction accuracy was evaluated by means of experimental measurements carried out with air, at ambient conditions, on a test rig available in Baker Hughes. Pressure and temperature probes were positioned at each section of Figure 1a. In this way, the aerodynamic performance of the impeller, diffuser, and return channel system were evaluated with an average error of less than 0.04%, 0.10%, and 0.53% for temperature, pressure, and mass flow rate, respectively. Furthermore, starting from the relative uncertainty of each sensor and using an in-house software, a maximum uncertainty of 0.20%, 1.53%, 1.49%, and 0.25% was obtained for β t t , η p , τ , and ψ , respectively. Systematic errors were then assumed to be neglected since the adopted thermocouples were provided with a calibration certificate, and the pressure transducers are calibrated annually.
Focusing, for the sake of brevity, on the stage designed for low mass flows (measurements achieved for the other stages have been omitted), the CFD predictions appear to slightly overestimate the performance of the stage. However, these results can be considered acceptable since they are within (or close to) the error limits of the experimental measurements. In Figure 6, the prediction of the low mass flow stage, in terms of polytropic efficiency (Figure 6a) and work coefficient (Figure 6b), are presented.
In Figure 6, a correct CFD prediction of the choke limit is observed with respect to the experimental data. Instead, the stall limit is not properly estimated by CFD analyses. However, this is inherently unavoidable when using RANS simulation due to the non-stationarity of the stall. Overall, the CFD analyses seem to correctly predict the polytropic efficiency and work coefficient of the stages. Indeed, a maximum overestimation of 1.3% was obtained for the polytropic efficiency of the low mass flow stage (Figure 6a), whereas a maximum overestimation of 0.2% is observed for the work coefficient (Figure 6b). Based on the experience of the Baker Hughes aerodynamics team, it is reasonable to state that these values are within the allowable range. Therefore, experimental validation shows that the numerical setup underlying the proposed approach is correct.

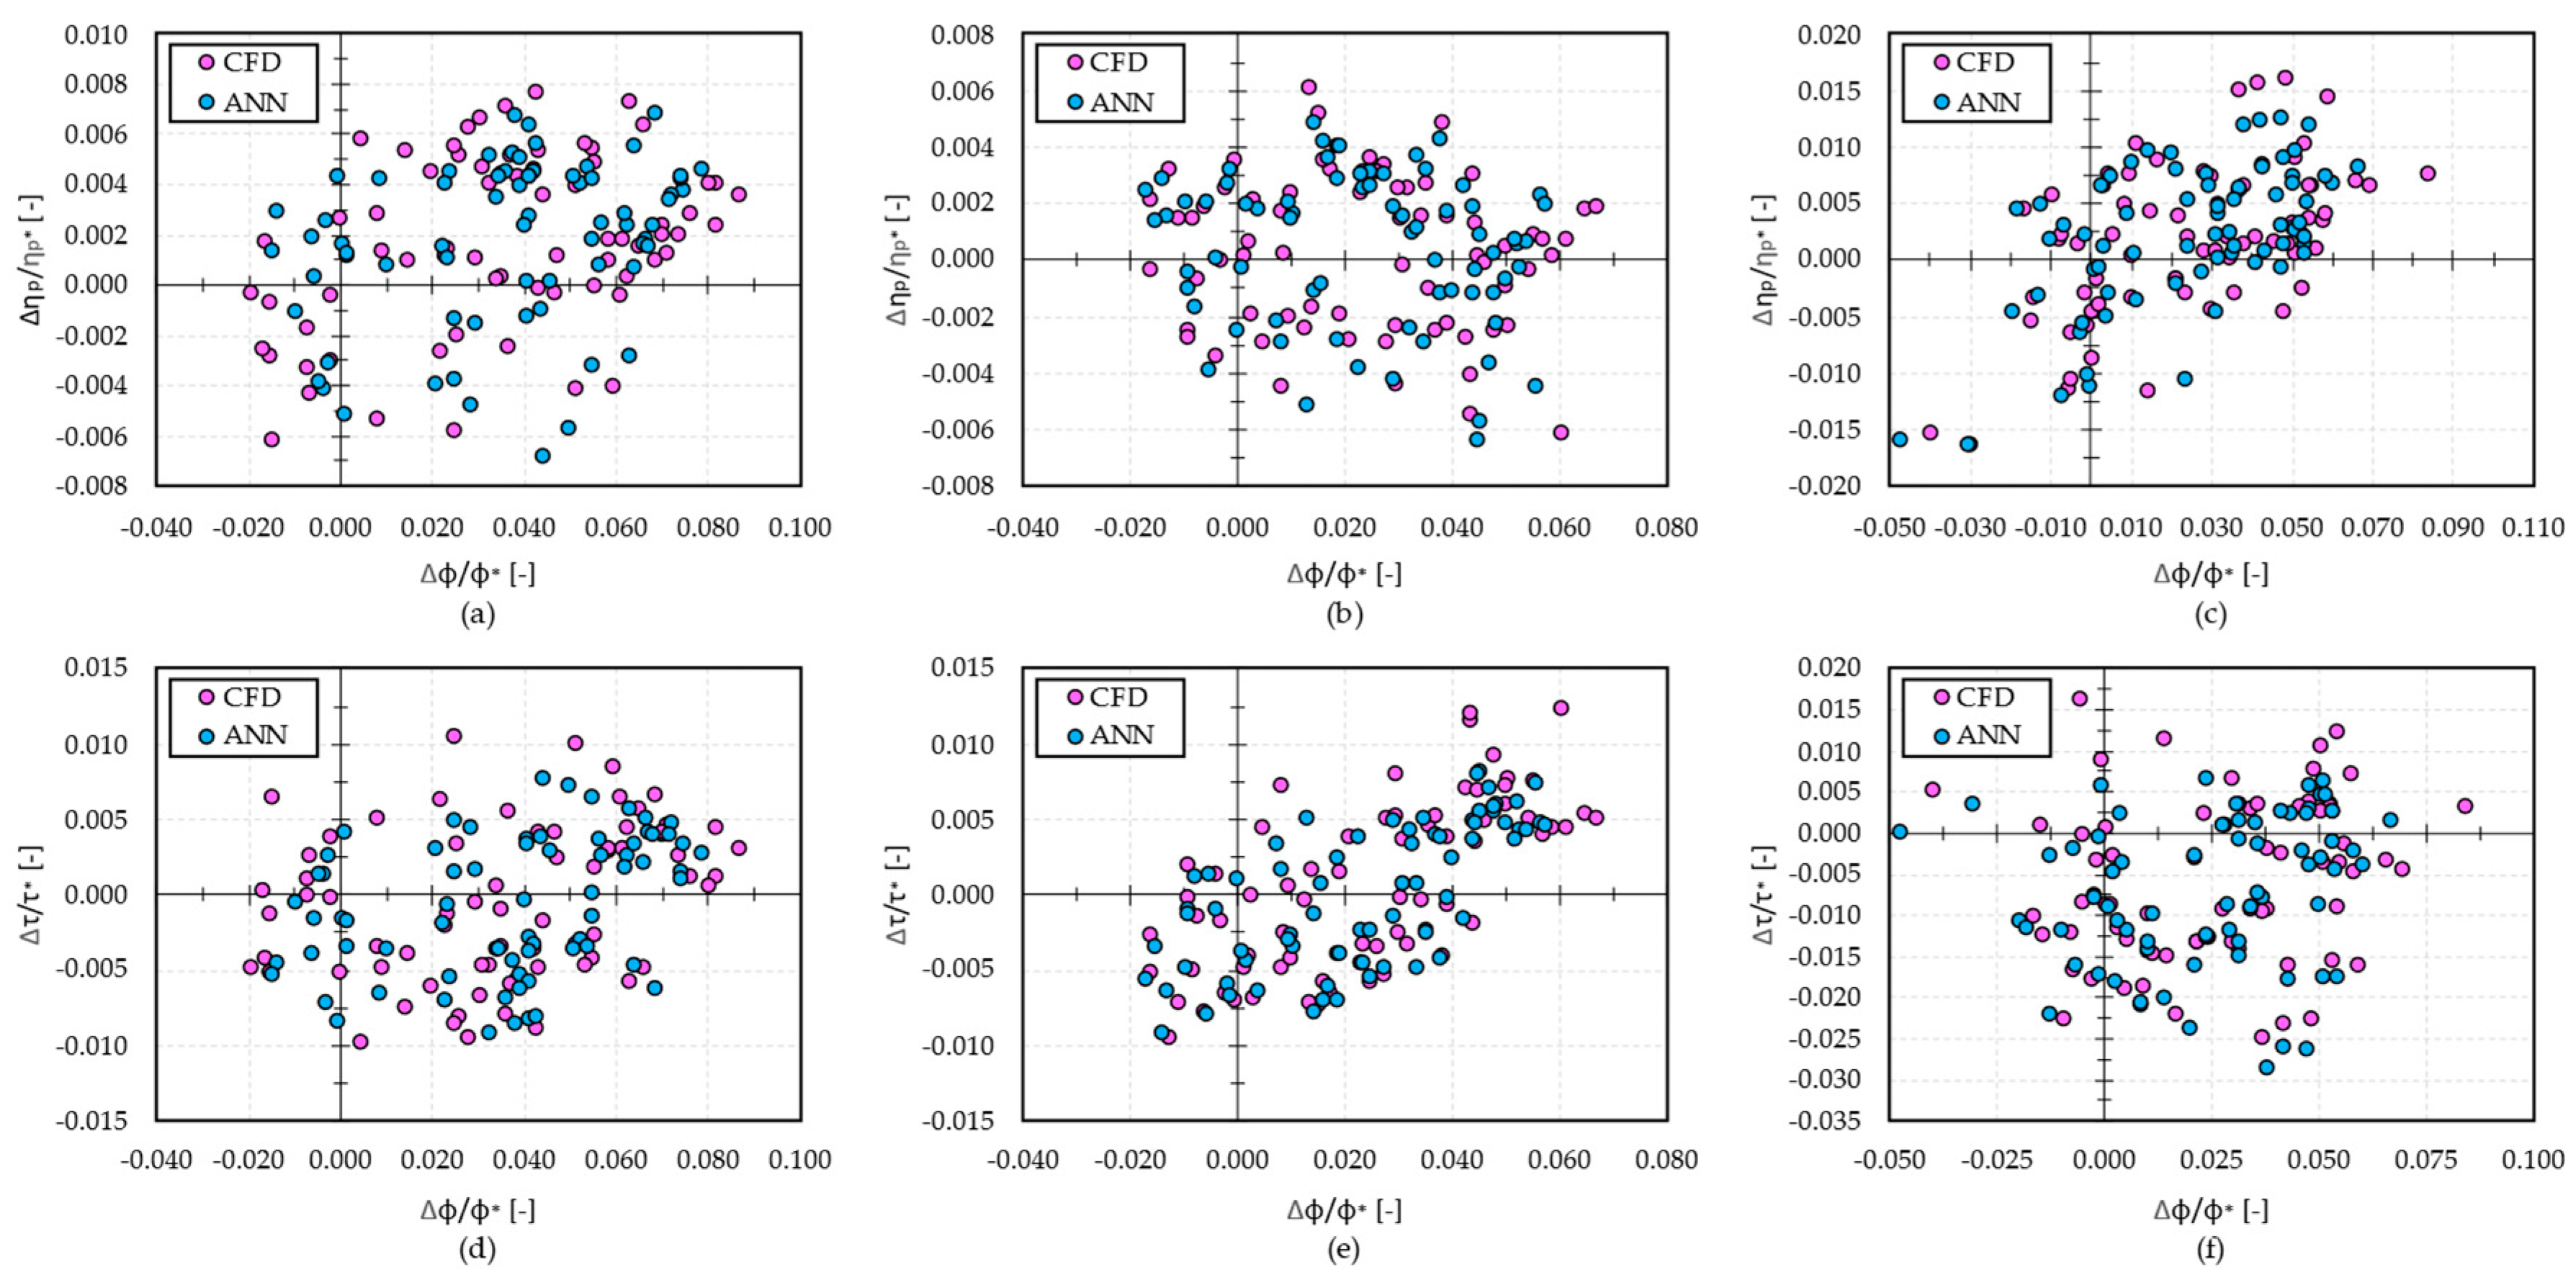
3.2. Results of the Proposed Approach

As aforementioned, in step 1 (Section 2 and Section 2.1) the selection of independent geometric parameters was carried out by consulting a team of aerodynamic and manufacturing experts. Although this classification could be performed with strategies such as ANOVA or AHP, in this case study, the selection was based on which geometric parameters aerodynamic designers have frequently adjusted in recent commissions (i) and which production team has been highlighted as critical to manufacturing non-conformities (ii). After defining the independent parameters of Table 1, a range of realistic values was associated with each parameter based on experts’ know-how. Then, the dependent parameters of Table 2 were defined to guarantee mutually consistent perturbed geometries in the next parametric analysis.
In step 2 (Section 2 and Section 2.2), once the geometric parametrization of the centrifugal compressor stage was defined, a parametric analysis was performed leveraging the CFD analyses and the variations of parameter in Table 1 and Table 2. The results, with the values assumed by independent parameters of Table 1, were then collected in datasets used to feed and train an ANN for each centrifugal compressor stage. Figure 7, Figure 8 and Figure 9 show the performance at section 6 (see Figure 1a) obtained for the low, medium, and high mass flow stages in terms of η p and τ (Equations (5) and (6)) at stall, design, and choke conditions. Specifically, the yellow dots represent the performance of each unperturbed stage (baseline), while the cyan, magenta, and grey dots are the performance of the perturbed geometries assessed during the parametric analyses. Moving from the low mass flow stage (Figure 7) to the high mass flow stage (Figure 9), a lower dispersion of these performance is observed. A comparable trend can also be seen in the mass flow variations at each operating point. Furthermore, by calculating the standard deviation of each distribution, the variations imposed with the Sobol sequence result in a greater dispersion of performance at the stall condition. Similar plots were also derived for β t t and ψ (Equations (4) and (7)). However, for the sake of brevity, these results have been omitted, as well as those for sections 2 and 4 (Figure 1a). Focusing on the design condition of Figure 7a, the stage polytropic efficiency (ηpp*) reached a maximum value of 1.01 (a relative +1% percentage increase from baseline), with a flow coefficient (ϕ/ϕ*) shifted to 1.09 (+9% from baseline). For the same perturbed geometry, the stall condition gains a ηpp* value of 0.99 (+2.1%) with ϕ/ϕ* of 0.93 (+10.7%), whereas, for the choke condition, a value of 0.91 (+1.1%) is obtained for ηpp* with a ϕ/ϕ* of 1.58 (+5.3%). From these results, since the CFD analyses were performed with an imposed pressure ratio, it can be stated that this perturbed geometry is suitable for working with higher mass flow rates. Indeed, the same pressure ratios are reached in this stage with higher mass flow rates compared to the baseline. Therefore, in case this perturbed geometry will work with the same mass flow rates as the baseline stage, a reduction in polytropic efficiency will be obtained. Moreover, the same perturbed stage geometry, in terms of work coefficient (τ/τ*), exhibits a −1.9%, −1.0%, and −0.1% decrease at stall, design, and choke conditions, respectively.
Figure 8a shows a minimum of ηpp* of about 0.99 (−1.0% from baseline) with a ϕ/ϕ* of 0.96 (−4.0% from baseline) and a τ/τ* of 1.00 (+0.0%). The same perturbed stage exhibits, at stall condition, a −2.0% reduction in ηpp*, a gain of +1.9% for τ/τ*, and a shift to lower mass flow rates of −10.6% (ϕ/ϕ* of 0.76 instead 0.85). At choke condition, instead, the perturbed geometry compared to the baseline shows a reduction in ηpp* of about −2.2%, the same value of τ/τ*, and a shift in ϕ/ϕ* of −2.9%. Therefore, this perturbed stage achieved the same pressure ratios of the baseline stage with lower mass flow rates.
In Figure 9, as aforementioned, a lower dispersion of performance is observed. Indeed, the polytropic efficiency (ηpp*) varies from 0.99 to 1.01 at stall (from −1.0% to +1.0% in terms of relative percentage variation respect to baseline), from 0.99 to 1.01 at design (from −1.0% to +1.0%), and from 0.88 to 0.92 at choke condition (from −2.2% to +2.2%). Moreover, the work coefficient (τ/τ*) varies from 1.04 to 1.06 at stall (from −1.0% to +1.0%), from 0.99 to 1.01 at design (from −1.0% to +1.0%), and from a value of 0.81 to 0.86 at choke (from −3.6% to +2.4%). Finally, the flow coefficient (ϕ/ϕ*) varies from 0.82 to 0.97 at stall (from −5.7% to +11.5%), from 0.96 to 1.08 at design (from −4.0% to +8.0%), and from 1.23 to 1.37 at choke condition (from −3.9% to +7.0%).
To better understand the spread of the performance and operating ranges of each perturbed geometry ( q ), the relative frequencies of Δ η p and Δ τ variations at design condition at section 6 are shown in Figure 10, Figure 11 and Figure 12. In addition, Figure 10, Figure 11 and Figure 12 provide the relative frequencies of choke-to-stall operating range variations Δ ϕ . All of the above quantities are described by Equations (14)–(16).
Δ η p = η p , q η p , b a s e l i n e ,
τ = τ q τ b a s e l i n e ,
Δ ϕ = Δ ϕ q Δ ϕ p , b a s e l i n e ,
The relative frequency distributions are also comparable with the Gaussian distributions (dashed lines of Figure 10, Figure 11 and Figure 12) obtained in terms of probability density function f by determining the mean and standard deviation of Δ η p , Δ τ , and Δ ϕ . The distributions shown in Figure 10, Figure 11 and Figure 12 exhibit trends in agreement, with the results provided in the recent scientific literature. In fact, polytropic efficiency and work coefficient trends follow a Gaussian distribution, as previously observed by Panizza et al. [19] and Javed et al. [20]. Recently the outcomes from Li et al. [23] and Tang et al. [25] still confirm these results. Moreover, the relative frequencies reported in Figure 10, Figure 11 and Figure 12 are in line with those obtained by Zhu et al. [22]. However, unlike the above works, in the present research, special attention was also paid to the impact on the operating range of the centrifugal compressor stage. This novel aspect is interesting, especially for applications, such as expander-compressors, where a wide operating range is required. In this prospective, focusing of Figure 10, Figure 11 and Figure 12, the perturbed stages exhibit the same operating range of the baseline with a relative frequency of 6.0%, 5.8%, and 7.5% for low, medium, and high flow stages, respectively.
In step 3, the outcomes of each parametric analysis were used for feeding and training an ANN. Therefore, five ANNs were generated, with one for each centrifugal compressor stage. The ANN hyperparameter tunings were based on a grid search method, minimizing the absolute prediction errors δ . This method was chosen due to its quick and easy implementation. However, in future developments of the project, different approaches, such as those based on evolutionary algorithms, will be explored. In Table 5, the predictive capacity of the meta-model is demonstrated by showing the mean absolute prediction errors ( δ η p , δ τ , and δ Δ ϕ ) committed by the ANN with respect to CFD values at section 6. From the data in Table 5, it is noticeable that the prediction of the polytropic efficiency is subject to greater errors in the choke condition than in the stall one. Conversely, for the work coefficient, the prediction yields larger average errors near the stall condition than at the choke. At design, predictions are less error-prone than in the previous conditions.
Moreover, the results of the ANN training are provided in Figure 13, Figure 14 and Figure 15. In particular, the ANN forecasts (cyan dots) and the CFD evaluations (magenta dots) of each tested geometry are compared in terms of η p and τ at section 6. Similar results were obtained for β t t and ψ , but they are not provided for the sake of brevity. Concerning Figure 13d, the ANN forecasts exhibit a lower predictability when Δϕ/ϕ* are lower than −0.10. The same trend is achieved in Figure 14d. However, in this case, the ANN forecasts of the work coefficient are overestimated, while in Figure 13d, an underestimation of the ANN predictions can be observed.
In the case of Figure 15, the lower dispersion of stage performance leads to a better training of the ANN. In fact, the predictions of the ANN seem to better replicate similar CFD results. However, the mean absolute errors of Table 5 demonstrate that the three ANNs have similar prediction capacities.
Once the ANNs were trained and validated, these meta-models were able to quantify the impact of geometric rearrangements on performance and operating range of each centrifugal compressor stage composing the family in less than 1 s. The same assessment, if performed with CFD calculations, would have taken more than 6 h. This difference is not negligible in the industrial scenario. Indeed, meta-models allow for an immediate evaluation of a modified geometry, avoiding the need to perform CFDs. As a matter of fact, if well-trained, ANN-based meta-models can replicate CFD behavior with high accuracy. Furthermore, these meta-models relieve practitioners in obtaining results without necessarily being experts in computational fluid dynamics. Industrial users can focus on performance without worrying about the correct numerical setup. Moreover, a time-to-market reduction is achievable since several geometries can be evaluated in a rapid and cost-effective way. Finally, manufacturers can provide greater control over the performance of their delivered stages, thus enhancing customer satisfaction. Indeed, meta-models offer immediate feedback on the produced stage once the geometry variation has been measured.

4. Conclusions

The present energy transition is changing the turbomachinery market, driving the development of new technologies and the modification of the existing ones. Against this backdrop, centrifugal compressor designers are required to develop ever more high-performance machines in shorter timeframes. To this end, optimization approaches are currently consolidating in the industrial field, along with robust design techniques for avoiding performance degradations, due to non-conformities. However, a robust optimized geometry may still be subject to intentional variations that could alter the performance and operating range of the centrifugal compressor stage. Therefore, a pivotal topic for compressor manufacturers is the rapid assessment of the impact of geometric variations of centrifugal compressor stages. For these reasons, manufacturers are clamoring for a valid way to quickly evaluate the impact of changes imposed on their pre-engineered geometries according to customer requirements and manufacturing non-conformities. In this context, the joint use of CFD simulations and ANNs represents a valuable way to generate response surfaces, which can be used to highlight impacts of geometry modifications on centrifugal compressor stage performance and operating range. However, the current scientific literature overlooks studies on a multi-point surrogate-based approach involving CFDs and ANNs for achieving this task. To fill this gap, this paper provides and tests, on the case study of a family of impellers for medium–high Mach number applications, a new approach involving three main steps: (i) first, the geometric parameters of each centrifugal compressor stage, whose impact of variations was of interest, were selected, and then, a realistic range of variations was assigned to these parameters; (ii) once the parametrization of the centrifugal compressor stage and a dataset of possible geometries (obtained by imposing the previous geometric variations) was defined, an extensive parametric analysis was performed using CFD simulations for stall, design, and choke conditions; (iii) finally, the results of the parametric analyses were used to train and validate an ANN for each compressor stage, thus achieving response surfaces capable of rapidly assessing the impacts of geometric variations on the centrifugal compressor stage in terms of performance and operating range
The results, demonstrated as the developed multi-point surrogate-based approach, allow instant assessment of the impacts of geometric variations (intentional and unintentional) on a centrifugal compressor stage. Furthermore, research outcomes show how the ANN training with CFD results leads to the definition of surrogate models capable of predicting the stage performance with low absolute errors (below 0.5%) compared to CFD analyses. The study shows that using a trained surrogate model has led to a significant reduction in time when assessing the impact of geometric variations. Indeed, the abrupt execution of CFD analyses, to predict changes in the performance and operating range of a centrifugal compressor stage, is expensive in terms of both time and computational effort (6 h on 32 CPUs of a high-performance computing cluster equipped with CPUs Xeon Gold 6242, 16 cores at 2.80 GHz, and 16 GB Dual Rank DIMMS at 2.93 GHz). In contrast, once training and validation of the ANN are completed, the resulting response surface can immediately predict the impact of geometric variations in less than 1 s on a personal computer.
Overall, the main contribution of the present study is the definition of a multi-point surrogate-based approach combining CFDs and ANNs to rapidly assess the impact of geometric variations in a centrifugal compressor stage. This approach introduces several advantages for centrifugal compressor manufacturers. On the one hand, the ability to quickly assess the impact of intentional geometric variations makes it possible to meet customer needs without resorting to time-consuming and computationally intensive analyses. On the other hand, the developed multi-point surrogate-based approach makes it possible to assess the effects of unintentional geometric variations due to manufacturing or assembly processes. Furthermore, the present approach has the advantage of being able to evaluate different stage geometries to reduce machining waste. Indeed, given a stage with specific performance, the developed tool could be used by machining experts to find a geometry that guarantees the same performance with lower usage of production resources. Moreover, in a mutable scenario as the energy transition, the proposed approach has the potential to evaluate numerous stage solutions without the wasteful use of computational resources. It is worth mentioning that the developed approach can be applied to any centrifugal compressor stage, although the present study focused on the case of a family of impellers for medium–high Mach number applications. Since the main advantages have already been mentioned, it is important to point out the limitations and disadvantages of the proposed approach. As the main disadvantage, several CFD computations are necessary to feed and train ANNs. This results in a tough task in terms of computational effort and expert staff required. Moreover, the achieved results are leveraged by the following simplifying assumptions: the relevant geometric quantities were selected when focusing on a specific type of stage (in other cases, it is not guaranteed that the same geometric characteristics need to be defined as independent parameters), the exact stall condition was not sought but, rather, was defined as the condition where the operational stability of the baseline stage can no longer be guaranteed, and finally, parasitic losses were not considered. Specifically, not including parasitic losses limits the prediction capability of the numerical setup. However, CFD simulation of impeller cavities would entail high computational costs and time. Therefore, the use of simplified external loss correlations during CFD post-processing would overcome this limitation.
Future developments of this research could mean two things: first, to introduce the detailed evaluation of internal and external losses to understand not only the impact of geometric variations on the performance and operational range but also on each individual aerodynamic loss; second, to integrate the ANN train with data from mechanical and manufacturability analyses to provide a more useful tool for customer orders and quality controls. Indeed, mechanical insights could help designers evaluate geometry variations early in customer orders or assess structural integrity after the occurrence of manufacturing non-conformity. Moreover, manufacturability evaluations could prevent designers from defining geometric adjustments during the first phases of customer orders that cannot be guaranteed by a specific machining technique.

Author Contributions

Conceptualization, M.B., E.F.B., E.B. and L.T.; methodology, M.B., M.M. and A.A.; software, M.B. and M.M.; validation, M.B., M.M., and E.F.B.; formal analysis, M.B. and M.M.; investigation, M.B. and E.B.; resources, L.T., E.B. and E.F.B.; data curation, M.B., L.T. and M.M.; writing—original draft preparation, M.B.; writing—review and editing, M.B., E.B., M.M., L.T. and E.F.B.; visualization, M.M. and L.T.; supervision, E.F.B., E.B. and L.T.; project administration, A.A. and L.T.; funding acquisition, A.A. All authors have read and agreed to the published version of the manuscript.

Funding

This research received no external funding.

Data Availability Statement

Not applicable.

Acknowledgments

The authors thankfully acknowledge the centrifugal compressor aerodynamic team of Nuovo Pignone—Baker Hughes for the technical support received during the project.

Conflicts of Interest

The authors declare no conflict of interest.

References

  1. Friedlingstein, P.; O’sullivan, M.; Jones, M.W.; Andrew, R.M.; Hauck, J.; Olsen, A.; Peters, G.P.; Peters, W.; Pongratz, J.; Sitch, S. Global Carbon Budget 2020. Earth Syst. Sci. Data 2020, 12, 3269–3340. [Google Scholar] [CrossRef]
  2. World Energy Trilemma Index. Available online: https://www.worldenergy.org/transition-toolkit/world-energy-trilemma-index (accessed on 12 September 2022).
  3. Heidari, M.; Parra, D.; Patel, M.K. Physical Design, Techno-Economic Analysis and Optimization of Distributed Compressed Air Energy Storage for Renewable Energy Integration. J. Energy Storage 2021, 35, 102268. [Google Scholar] [CrossRef]
  4. Liu, Y.; Wang, Y.; Huang, D. Supercritical CO2 Brayton Cycle: A State-of-the-Art Review. Energy 2019, 189, 115900. [Google Scholar] [CrossRef]
  5. Li, X.; Zhao, Y.; Yao, H.; Zhao, M.; Liu, Z. A New Method for Impeller Inlet Design of Supercritical CO2 Centrifugal Compressors in Brayton Cycles. Energies 2020, 13, 5049. [Google Scholar] [CrossRef]
  6. Rizzi, D.; Rossetti, N. Rethinking the Role of O&G Companies Towards Decarbonisation: How ORC Technology and Gas-Expanders Can Increase the Sustainability of the Sector. In Proceedings of the OMC Med Energy Conference and Exhibition; OnePetro, Ravenna, Italy, 28–30 September 2021. [Google Scholar]
  7. Corbò, S.; Wolfler, T.; Banchi, N.; Furgiuele, I.; Farooq, M. The Role of Turbomachinery in Enabling the Hydrogen Economy. In Proceedings of the Abu Dhabi International Petroleum Exhibition & Conference, Abu Dhabi, United Arab Emirates, 15–18 November 2021. [Google Scholar]
  8. Rockström, J.; Gaffney, O.; Rogelj, J.; Meinshausen, M.; Nakicenovic, N.; Schellnhuber, H.J. A Roadmap for Rapid Decarbonization. Science 2017, 355, 1269–1271. [Google Scholar] [CrossRef] [PubMed]
  9. Xu, C.; Amano, R.S. Empirical Design Considerations for Industrial Centrifugal Compressors. Int. J. Rotating Mach. 2012, 2012, 184061. [Google Scholar] [CrossRef]
  10. Li, Z.; Zheng, X. Review of Design Optimization Methods for Turbomachinery Aerodynamics. Prog. Aerosp. Sci. 2017, 93, 1–23. [Google Scholar] [CrossRef]
  11. Bicchi, M.; Biliotti, D.; Marconcini, M.; Toni, L.; Cangioli, F.; Arnone, A. An AI-Based Fast Design Method for New Centrifugal Compressor Families. Machines 2022, 10, 458. [Google Scholar] [CrossRef]
  12. Du, Y.; Yang, C.; Wang, H.; Hu, C. One-Dimensional Optimisation Design and off-Design Operation Strategy of Centrifugal Compressor for Supercritical Carbon Dioxide Brayton Cycle. Appl. Therm. Eng. 2021, 196, 117318. [Google Scholar] [CrossRef]
  13. Massoudi, S.; Picard, C.; Schiffmann, J. Robust Design Using Multiobjective Optimisation and Artificial Neural Networks with Application to a Heat Pump Radial Compressor. Des. Sci. 2022, 8, e1. [Google Scholar] [CrossRef]
  14. Li, P.-Y.; Gu, C.-W.; Song, Y. A New Optimization Method for Centrifugal Compressors Based on 1D Calculations and Analyses. Energies 2015, 8, 4317–4334. [Google Scholar] [CrossRef]
  15. Wang, J.; Guo, Y.; Zhou, K.; Xia, J.; Li, Y.; Zhao, P.; Dai, Y. Design and Performance Analysis of Compressor and Turbine in Supercritical CO2 Power Cycle Based on System-Component Coupled Optimization. Energy Convers. Manag. 2020, 221, 113179. [Google Scholar] [CrossRef]
  16. Omidi, M.; Liu, S.-J.; Mohtaram, S.; Lu, H.-T.; Zhang, H.-C. Improving Centrifugal Compressor Performance by Optimizing the Design of Impellers Using Genetic Algorithm and Computational Fluid Dynamics Methods. Sustainability 2019, 11, 5409. [Google Scholar] [CrossRef]
  17. Ekradi, K.; Madadi, A. Performance Improvement of a Transonic Centrifugal Compressor Impeller with Splitter Blade by Three-Dimensional Optimization. Energy 2020, 201, 117582. [Google Scholar] [CrossRef]
  18. Ma, C.; Yang, Z.; Jiao, K.; Liu, Z.; Du, Q. Multi-Objective Optimization of the Centrifugal Compressor Impeller in 130 KW PEMFC through Coupling SVM with NSGA-III Algorithms. Int. J. Green Energy 2021, 18, 1383–1395. [Google Scholar] [CrossRef]
  19. Panizza, A.; Valente, R.; Rubino, D.; Tapinassi, L. Impact of Manufacturing Variability on the Aerodynamic Performance of a Centrifugal Compressor Stage with Curvilinear Blades. In Proceedings of the Turbo Expo: Power for Land, Sea, and Air, Seoul, Republic of Korea, 13–17 June 2016; American Society of Mechanical Engineers: New York, NY, USA; Volume 49712, p. V02CT45A027. [Google Scholar]
  20. Javed, A.; Pecnik, R.; Van Buijtenen, J.P. Optimization of a Centrifugal Compressor Impeller for Robustness to Manufacturing Uncertainties. J. Eng. Gas Turbines Power 2016, 138, 112101. [Google Scholar] [CrossRef]
  21. Liu, Y.; Qin, R.; Ju, Y.; Spence, S.; Zhang, C. Impact of Realistic Manufacturing Uncertainties on the Aerodynamic Performance of a Transonic Centrifugal Impeller. In Proceedings of the Turbo Expo: Power for Land, Sea, and Air, Seoul, Republic of Korea, 13–17 June 2016; American Society of Mechanical Engineers: New York, NY, USA, 2020; Volume 84096, p. V02DT38A012. [Google Scholar]
  22. Zhu, R.; Ju, Y.; Zhang, C. Effects of Geometric and Operational Uncertainties on Aerodynamic Performance of Centrifugal Compressor Stage. Proc. Instit. Mech. Eng. Part A J. Power Energy 2022, 236, 490–505. [Google Scholar] [CrossRef]
  23. Li, S.; Huang, M.; Liu, X. Geometric Uncertainty Analysis of a Centrifugal Compressor Using Kriging Model. In Proceedings of the IOP Conference Series: Materials Science and Engineering, Shaanxi, China, 8–11 October 2020; IOP Publishing: Bristol, UK, 2021; Volume 1043, p. 052041. [Google Scholar]
  24. Ju, Y.; Liu, Y.; Jiang, W.; Zhang, C. Aerodynamic Analysis and Design Optimization of a Centrifugal Compressor Impeller Considering Realistic Manufacturing Uncertainties. Aerosp. Sci. Technol. 2021, 115, 106787. [Google Scholar] [CrossRef]
  25. Tang, X.; Gu, N.; Wang, W.; Wang, Z.; Peng, R. Aerodynamic Robustness Optimization and Design Exploration of Centrifugal Compressor Impeller under Uncertainties. Int. J. Heat Mass Transf. 2021, 180, 121799. [Google Scholar] [CrossRef]
  26. Lüdtke, K.H. Process Centrifugal Compressors: Basics, Function, Operation, Design, Application; Springer Science & Business Media: Berlin/Heidelberg, Germany, 2004. [Google Scholar]
  27. Casey, M.; Robinson, C. Radial Flow Turbocompressors; Cambridge University Press: Cambridge, UK, 2021. [Google Scholar]
  28. Mosdzien, M.; Enneking, M.; Hehn, A.; Grates, D.; Jeschke, P. Influence of Blade Geometry on Secondary Flow Development in a Transonic Centrifugal Compressor. J. Glob. Power Propuls. Soc. 2018, 2, 429–441. [Google Scholar] [CrossRef]
  29. Du, W.; Li, Y.; Li, L.; Lorenzini, G. A Quasi-One-Dimensional Model for the Centrifugal Compressors Performance Simulations. Int. J. Heat Technol. 2018, 36, 391–396. [Google Scholar] [CrossRef]
  30. Jiang, H.; Dong, S.; Liu, Z.; He, Y.; Ai, F. Performance Prediction of the Centrifugal Compressor Based on a Limited Number of Sample Data. Math. Prob. Eng. 2019, 2019, 5954128. [Google Scholar] [CrossRef]
  31. Li, Y.; Qiu, Z.; Fan, L.; Tan, X.; Qiu, T. State Evaluation of Centrifugal Compressor Unit Based on Parameter Distribution. In Proceedings of the 13th International Conference on Damage Assessment of Structures, Porto, Portugal, 9–10 July 2019; Springer: Singapore, 2020; pp. 386–401. [Google Scholar]
  32. Cantini, A.; De Carlo, F.; Tucci, M. Application of the Lean Layout Planning System in a Leather Bags Manufacturing Plant and Proposal of an Approach to Engage the Company’s Staff in the Research of the Layout Solution. Proc. Summer Sch. Web Bergamo Italy 2020, 1, 9–11. [Google Scholar]
  33. Casey, M.V. A Computational Geometry for the Blades and Internal Flow Channels of Centrifugal Compressors. J. Eng. Gas Turbines Power 1983, 105, 288–295. [Google Scholar] [CrossRef]
  34. Kim, J.-H.; Choi, J.-H.; Husain, A.; Kim, K.-Y. Multi-Objective Optimization of a Centrifugal Compressor Impeller through Evolutionary Algorithms. Proc. Inst. Mech. Eng. Part A J. Power Energy 2010, 224, 711–721. [Google Scholar] [CrossRef]
  35. Cho, S.-Y.; Ahn, K.-Y.; Lee, Y.-D.; Kim, Y.-C. Optimal Design of a Centrifugal Compressor Impeller Using Evolutionary Algorithms. Math. Prob. Eng. 2012, 2012, 752931. [Google Scholar] [CrossRef]
  36. Sobol’, I.M.; Asotsky, D.; Kreinin, A.; Kucherenko, S. Construction and Comparison of High-Dimensional Sobol’generators. Wilmott 2011, 2011, 64–79. [Google Scholar] [CrossRef]
  37. Cantini, A.; Peron, M.; De Carlo, F.; Sgarbossa, F. A Decision Support System for Configuring Spare Parts Supply Chains Considering Different Manufacturing Technologies. Int. J. Prod. Res. 2022, 1–21. [Google Scholar] [CrossRef]
  38. Arnone, A. Viscous Analysis of Three-Dimensional Rotor Flow Using a Multigrid Method. J. Turbomach. 1994, 116, 435–445. [Google Scholar] [CrossRef]
  39. Bicchi, M.; Pinelli, L.; Marconcini, M.; Gaetani, P.; Persico, G. Numerical Study of a High-Pressure Turbine Stage with Inlet Distortions. AIP Conf. Proc. 2019, 2191, 020020. [Google Scholar]
  40. Wilcox, D.C. Turbulence Modeling CFD; DCW industries: La Canada, CA, USA, 1998; Volume 2. [Google Scholar]
  41. Giovannini, M.; Marconcini, M.; Arnone, A.; Dominguez, A. A Hybrid Parallelization Strategy of a Cfd Code for Turbomachinery Applications. In Proceedings of the 11th European Conference on Turbomachinery Fluid Dynamics & Thermodynamics, Madrid, Spain, 23–27 March 2015. [Google Scholar]
  42. Riccietti, E.; Bellucci, J.; Checcucci, M.; Marconcini, M.; Arnone, A. Support Vector Machine Classification Applied to the Parametric Design of Centrifugal Pumps. Eng. Optim. 2018, 50, 1304–1324. [Google Scholar] [CrossRef]
  43. GitHub—Keras-Team/Keras: Deep Learning for Humans. Available online: https://github.com/keras-team/keras (accessed on 19 September 2022).
  44. TensorFlow. 2021. Available online: https://www.tensorflow.org/ (accessed on 19 September 2022).
  45. Agnolucci, A.; Marconcini, M.; Arnone, A.; Toni, L.; Grimaldi, A.; Giachi, M. Centrifugal Compressor Stage Efficiency and Rotor Stiffness Augmentation via Artificial Neural Networks. In Proceedings of the Turbo Expo: Power for Land, Sea, and Air, Online, 7–11 June 2021; American Society of Mechanical Engineers: New York, NY, USA, 2021; Volume 84935, p. V02DT37A014. [Google Scholar]
Figure 1. Meridional view of a centrifugal compressor stage (a) composed of the inlet duct (A), impeller (B), vaneless diffuser (C), crossover bend (D), and return vane channel (E), as well as independent/dependent geometrical parameters of the stage (b).
Energies 16 01584 g001
Figure 2. Parametric discretization of centrifugal compressor end-walls (meridional view).
Energies 16 01584 g002
Figure 3. Schematic summary of tasks pursued in step 2.
Energies 16 01584 g003
Figure 4. Spatial discretization adopted during CFD simulation with TRAF code.
Energies 16 01584 g004
Figure 5. Schematic representation of the ANN used in the present work.
Energies 16 01584 g005
Figure 6. Experimental validation of CFD predictions, in terms of polytropic efficiency (a) and work coefficient (b), at section 6 of the low mass flow stage.
Energies 16 01584 g006
Figure 7. Polytropic efficiency (a) and work coefficient (b) at section 6 derived from parametric analysis on the low mass flow stage.
Energies 16 01584 g007
Figure 8. Polytropic efficiency (a) and work coefficient (b) at section 6 derived from parametric analysis on the medium mass flow stage.
Energies 16 01584 g008
Figure 9. Polytropic efficiency (a) and work coefficient (b) at section 6 derived from parametric analysis on the high mass flow stage.
Energies 16 01584 g009
Figure 10. Low flow stage graphs describing the relative frequencies of Δ η p (a) and Δ τ (b) variations in design condition at section 6, as well as the relative frequency of choke-to-stall operating range variations Δ ϕ (c) with their comparable Gaussian distributions.
Energies 16 01584 g010
Figure 11. Medium flow stage graphs describing the relative frequencies of Δ η p (a) and Δ τ (b) variations at design condition at section 6, as well as the relative frequency of choke-to-stall operating range variations Δ ϕ (c) with their comparable Gaussian distributions.
Energies 16 01584 g011
Figure 12. High flow stage graphs describing the relative frequencies of Δ η p (a) and Δ τ (b) variations at design condition at section 6, as well as the relative frequency of choke-to-stall operating range variations Δ ϕ (c) with their comparable Gaussian distributions.
Energies 16 01584 g012
Figure 13. Comparison of ANN forecasts (cyan dots) and CFD evaluations (magenta dots) at section 6 under stall (a,d), design (b,e), and choke (c,f) conditions for the low flow stage.
Energies 16 01584 g013
Figure 14. Comparison of ANN forecasts (cyan dots) and CFD evaluations (magenta dots) at section 6 under stall (a,d), design (b,e), and choke (c,f) conditions for the low medium stage.
Energies 16 01584 g014
Figure 15. Comparison of ANN forecasts (cyan dots) and CFD evaluations (magenta dots) at section 6 under stall (a,d), design (b,e), and choke (c,f) conditions for the high flow stage.
Energies 16 01584 g015
Table 1. Independent geometrical parameters varied in the approach.
ParameterUnitRange of Variation
Impeller inlet blade angle β 1 deg[−2.0; 2.0]
Impeller outlet blade angle β 2 deg[−2.0; 2.0]
Blade thickness t %[−7.5; 7.5]
Outlet impeller width b 2 %[−5.0; 5.0]
Impeller throat area A t h %[−4.0; 7.5]
Diffusion ratio of diffuser D R = D 4 / D 2 -[−1.6; 1.84]
Table 2. Dependent geometrical parameters adjusted in the approach.
ParameterReason
Inlet width of inlet duct b 0 Fix inlet width of inlet duct
Inlet   width   of   impeller   b 1 Fix inlet width of impeller
Inlet width of crossover bend b 4 Preserve b 3 / b 4 ratio
Inlet width of return vane channel b 5 Preserve b 4 / b 5 ratio
Radial position of return channel blade LE r L E Preserve the ratio between return channel blade length and diffuser D R
Outlet width of return vane channel TE b 6 Preserve TE width
Table 3. Sensitivity analysis outcomes about impacts of spatial discretization on performance.
GridNo. of ElementsPolytropic EfficiencyWork Coefficient
ValueError with G5 [%]ValueError with G5 [%]
G13.4 million0.991−0.91.0090.9
G23.8 million0.995−0.51.0050.5
G34.3 million0.998−0.21.0010.1
G44.8 million1.0000.01.0000.0
G55.3 million1.000-1.000-
Table 4. Summary of assumptions followed for the numerical setup of CFD computations.
Numerical Setup for CFD Computations
Analysis type RANS with adiabatic walls
Grid typeH-type
No. of Elements4.8 million
Convective flux discretization2nd order TVD-MUSCL with Roe’s upwind scheme
Viscous flux discretizationCentral difference scheme
Turbulence closureWilcox’s k-ω model
ParallelizationHybrid OpenMP/MPI architecture
Wall treatmentFull resolution
Near wall grid refinementFirst element of 1.0 × 10⁻⁵ mm (y+ ≤ 1)
Table 5. ANN mean absolute error in predicting polytropic efficiency δ η p , work coefficient δ τ , and operative range δ Δ ϕ .
StallDesignChokeOperative Range
δ η p δ τ δ η p δ τ δ η p δ τ δ Δ ϕ
Low flow stage0.15%0.30%0.07%0.08%0.20%0.14%0.03%
Medium flow stage0.09%0.17%0.04%0.05%0.19%0.11%0.04%
High flow stage0.10%0.08%0.06%0.06%0.12%0.12%0.07%
Disclaimer/Publisher’s Note: The statements, opinions and data contained in all publications are solely those of the individual author(s) and contributor(s) and not of MDPI and/or the editor(s). MDPI and/or the editor(s) disclaim responsibility for any injury to people or property resulting from any ideas, methods, instructions or products referred to in the content.

