Review

Geothermal Play Types along the East Africa Rift System: Examples from Ethiopia, Kenya and Tanzania

1
Edison Spa, Foro Buonaparte 31, I-20121 Milano, Italy
2
DISTAV, Università di Genova, Viale Benedetto XV, 5, I-16132 Genova, Italy
*
Author to whom correspondence should be addressed.
Energies 2023, 16(4), 1656; https://doi.org/10.3390/en16041656
Submission received: 10 December 2022 / Revised: 17 January 2023 / Accepted: 4 February 2023 / Published: 7 February 2023
(This article belongs to the Section H2: Geothermal)

Abstract

:
Based on geophysical, geological and geochemical investigations carried out in the last decade, we reviewed three major geothermal plays that well represent the different structural, volcanological and hydrogeological realms that can be encountered in the East African Rift System (EARS). Alalobeda (Ethiopia) and Menengai (Kenya) are examples of typical geothermal plays of the Eastern Branch of EARS. The former is a fault-leakage-controlled geothermal play located in a graben structure. The heat source is likely deep-seated, widespread magmatism, associated with the lithosphere thinning that regionally affects this area. The reservoir temperature of the water-dominated system ranges from 185 to 225 °C. Menengai can be classified as a convection-dominated magmatic play type. The heat source could be a magmatic intrusion located beneath a caldera. A shallow, liquid-dominated reservoir (with temperatures of 150–190 °C) and an intermediate-deep reservoir, hosting steam and liquid (with temperatures of 230–340 °C), were detected. The Kilambo-Ilwalilo play (Tanzania) is an example of geothermal play of the Western Branch of EARS. It is in a half-graben realm where a regional fault controls the ascending groundwater flow. Reservoir temperatures are about 110–140 °C, and the heat source is provided by lithosphere thinning. The results of this study provide helpful guidelines for future studies on the geothermal resources in the rift.

1. Introduction

Renewable energies are of primary importance for developing countries, which have been putting a big effort into the growth of industrial activities, the enhancement of economic progress and the living conditions of the population. In Africa, renewables have a significant role to play in the electrification process of the continent [1]. Among the several renewable resources, solar and wind have an apparent potential and some successful applications are already in operation (e.g., [2]). However, the potential of these types of renewable energy is unevenly distributed among the different countries. Eastern and Northern Africa have the largest potential for solar and wind applications, while central Africa has the least potential (e.g., [3] and references therein).
Electricity production by hydroelectrical power cannot be ubiquitous, for it depends on climate conditions. In East Africa, especially, hydroelectrical power can be challenging, as this part of the continent is characterised by few precipitations and a recent increase in drought periods [4]. Geothermal energy as a partly unexploited resource represents a possible alternative. Africa’s geothermal potential is predominantly present in the geologically active area of the East African Rift System (EARS), which is currently the most extensive active zone of continental rifting in the world (Figure 1). Due to the high terrestrial heat flow associated with magmatic activity and hydrothermal circulation, EARS is Africa’s most promising and extensive geothermal energy exploration area (see, e.g., [5] for an overview of the geothermal systems along the rift system).
The high geothermal potential estimated for EARS [6] and the successful exploitations of some geothermal plays, such as, e.g., Olkaria, in Kenya [7], had recently accelerated investigations to evaluate the possible further developments of geothermal energy in the rift. This paper reviews data and outcomes of geological, geochemical and geophysical exploration collected during several surveys in the last decade [8]. We focus on three major geothermal plays occurring along the Eastern and Western branches of EARS, namely Alalobeda, Menengai and Kilambo-Ilwalilo (Figure 1), as they can represent the possible variability along the rift system and propose conceptual models of each geothermal play.
Because of the structural and volcanological differences along the rift system, the classification of EARS geothermal plays according to conventional schemes [9] can hardly be applied. Alalobeda, (northern part of the Eastern Branch, Ethiopia) is on the flanks of a rift zone, the Tendaho Graben, neighbouring the Afar triple junction [10]. The Menengai play (southern part of the Eastern Branch) corresponds to a caldera of recent formation, resulting from the intersection of the main structural feature, the Kenya Rift, with minor extensional structures. According to some interpretations, Menengai is the surface evidence of a mantle plume [11,12]. The Kilambo-Ilwalilo geothermal area is situated in the Rungwe volcanic province of Tanzania. It is related to a N W–SE trending fault system at the southern end of the Western branch of EARS. The results and the suggested conceptual models can help future studies for geothermal resource exploration in the rift system.

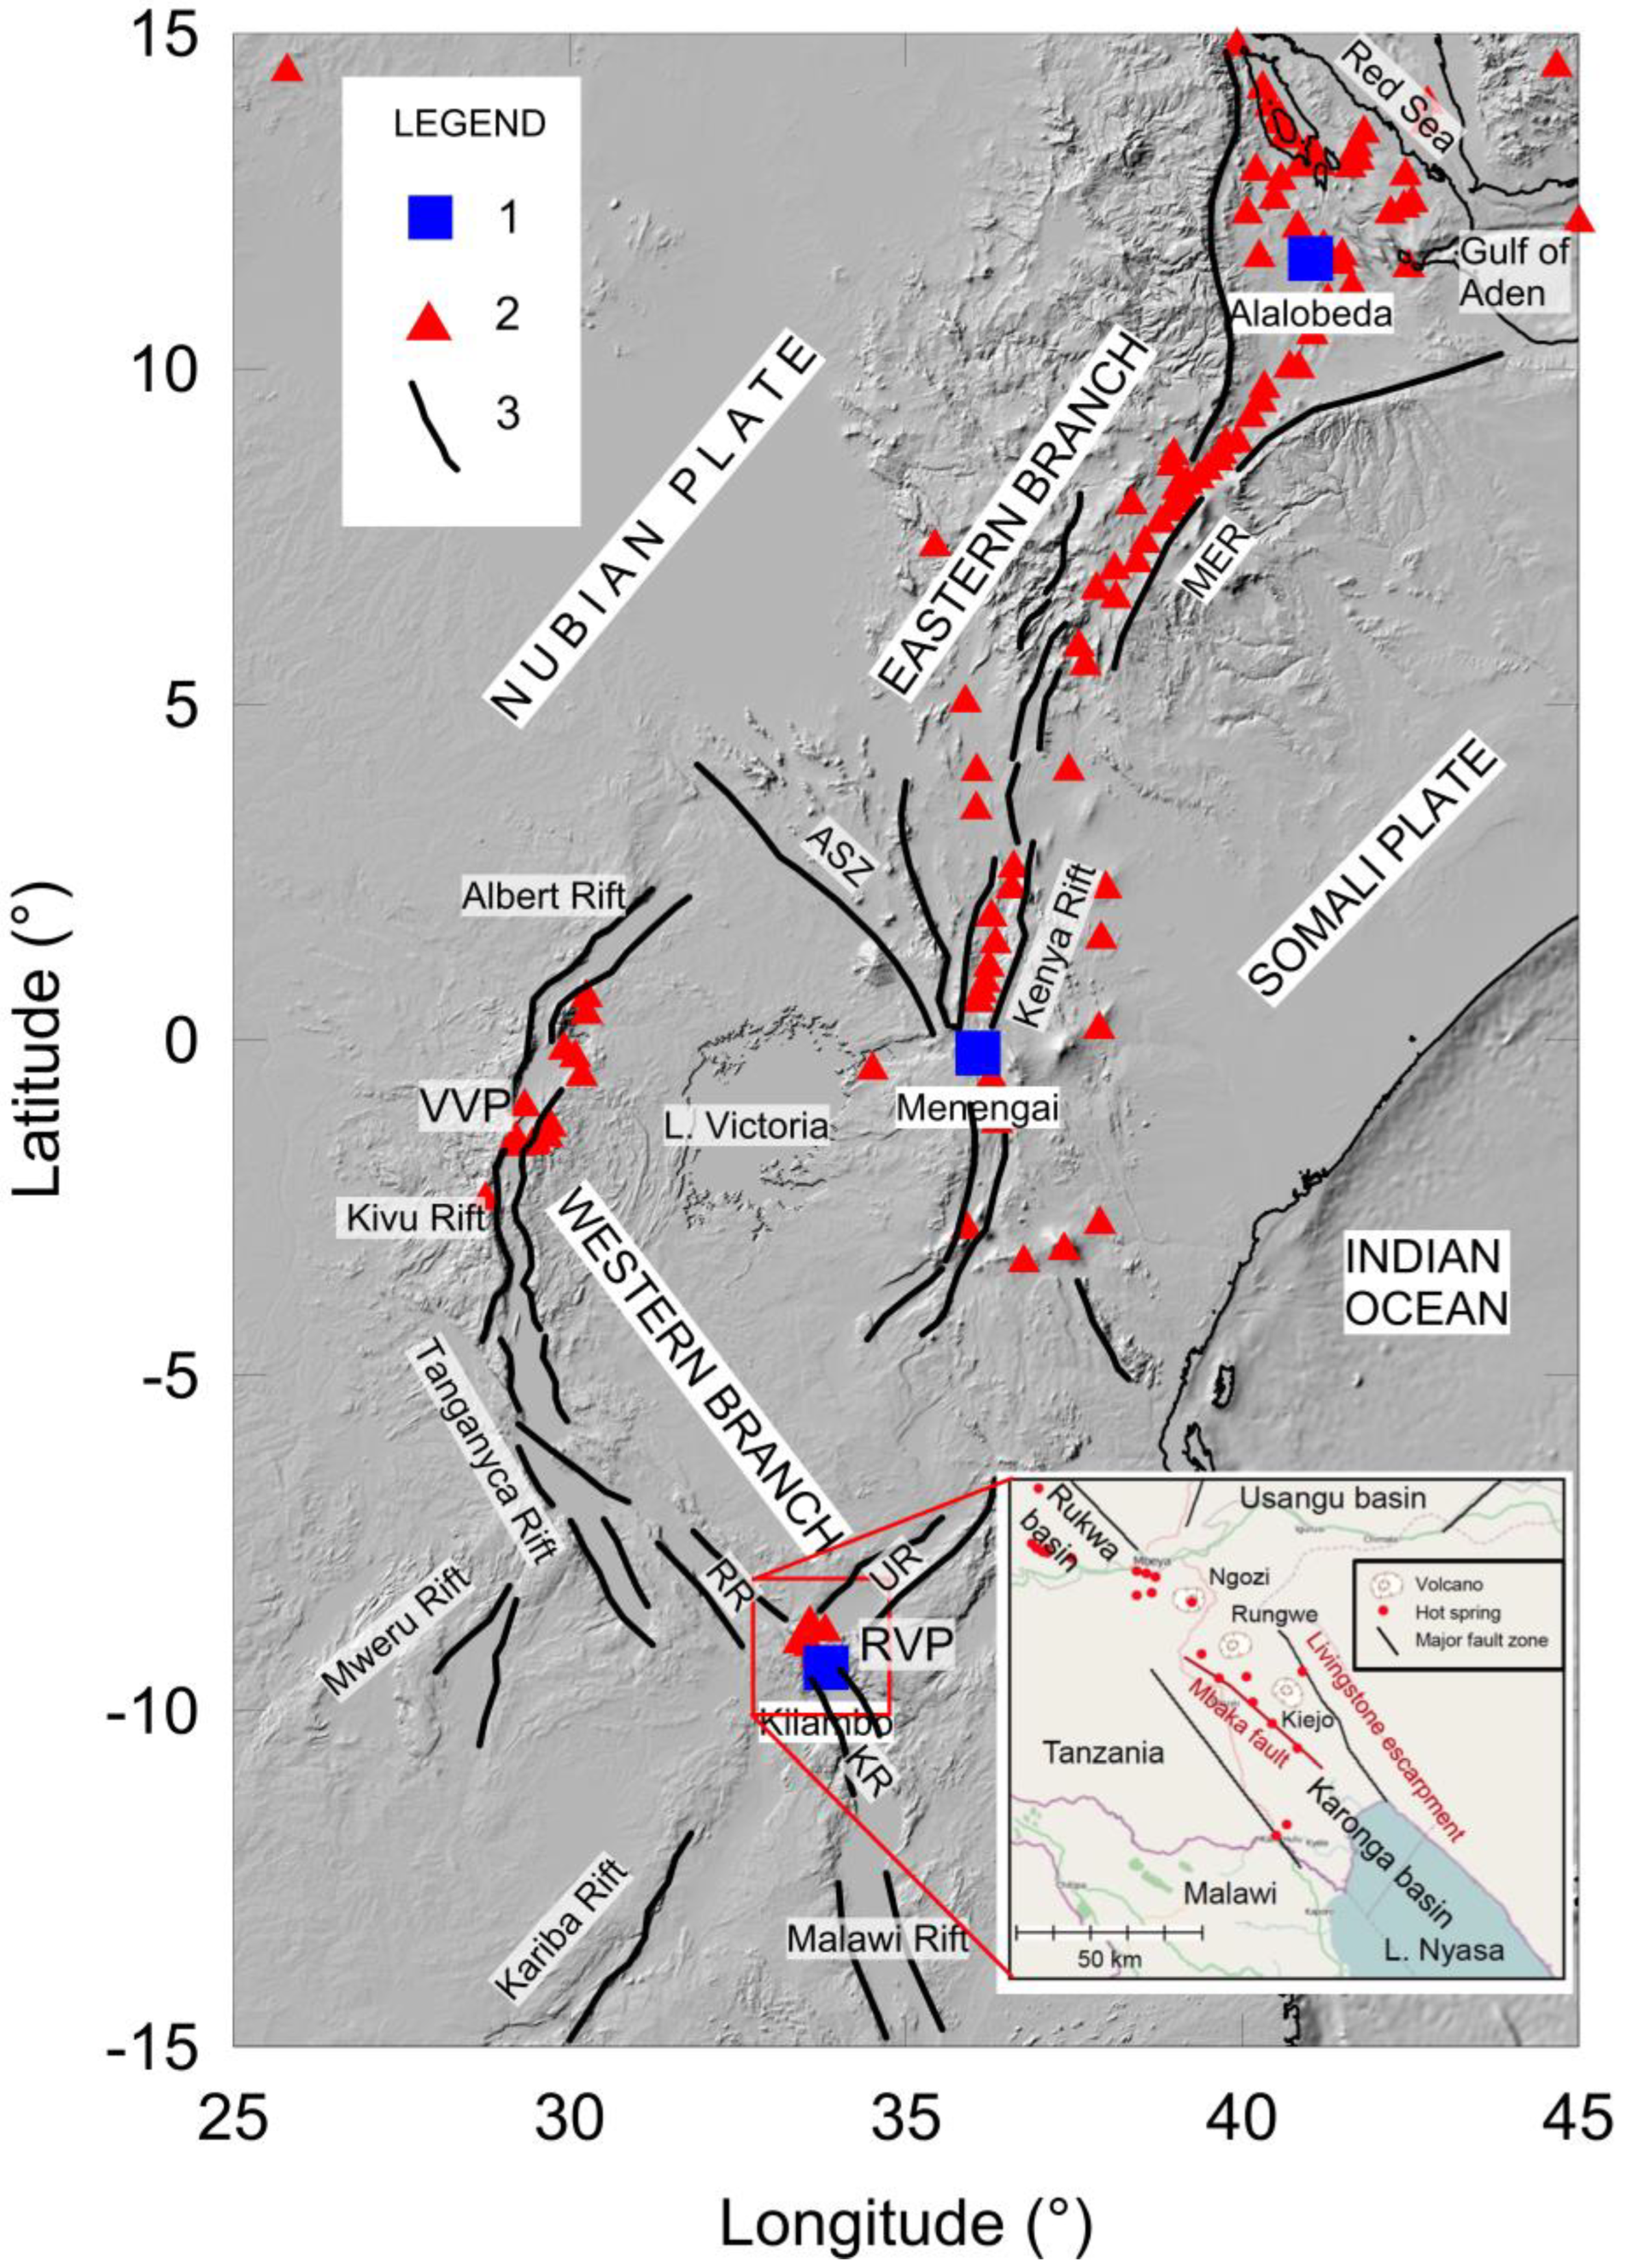
2. Regional Geological Background

EARS can be divided into an Eastern and a Western Branch (Figure 1). The Eastern Branch includes the Afar region, the Main Ethiopian Rift (MER) and the Kenya Rift, south of which it tends to be less well defined. The Western Branch starts south of the Aswa shear zone and continues southwards into the Malawi and Kariba rifts. Within each rift segment, E–W extensional faulting dominates. Extension in other orientations (NW–SE) is occasionally seen along some minor rifts distributing deformation away from the main rift branches, e.g., at the Mweru and Kariba rifts. The Western Branch is seismically active along its entire length, with further distributed deformation to the west of the central rift. Earthquakes along the Eastern Branch are less frequent than along the Western Branch [13].
The development of the rift system primarily occurred within the Proterozoic basement, at the margins of the Archean cratons of central Africa [14]. Based on GPS surveys, Stamps et al. [15] reported that the present-day extension in EARS is fastest at MER (~6.5 mm yr−1) and decreases southwards (~4–0.1 mm yr−1) across the Eastern Branch. The extension rate increases southwards (~1.5–4 mm yr−1) across the Western Branch, between the Aswa shear zone and the Rungwe volcanic province. Receiver function studies [16,17,18], refraction surveys [19,20], and travel times for PmP-phase arrivals [21] showed that the crustal thickness is 40–44 km beneath the Western Branch and 37–42 km beneath the Eastern Branch, whereas it is thinner (13–28 km) in MER and Afar region.
EARS has undergone massive magmatism from the Late Tertiary to the Recent. Volcanism is linked with lithospheric extension and diapiric rise of a lherzolitic asthenospheric wedge that led to the generation of basaltic melts [22]. Cenozoic volcanism is abundant and widespread, especially in the Eastern Branch. In contrast, it is sparse in the south (Figure 1). Volcanic activity started in the northern part of the Eastern Branch about 30 Ma ago, whereas in the Western Branch commenced about 12 Ma ago near the Albert Rift and about 7 Ma ago in the Tanganyika Rift [23].
Most volcanoes are located along the central axis of EARS branches. Still, off-axis volcanoes are also explained by the opening of large tension fractures caused by the reactivation of Precambrian zones of weakness [24]. In the Eastern Branch rift axis, numerous Quaternary shield volcanoes occur, overlying older (Mio-Pliocene) volcanic products. The volcanoes are built mainly of intermediate lavas and the associated pyroclastics, thus indicating the presence of shallow, hot bodies (magma chambers).
In the Western Branch, volcanism is poorer, with the main volcanic areas near Kivu Rift (Virunga volcanic province) and between Rukwa and Malawi rifts, in the Rungwe volcanic province [25,26]. The abundance of potassic alkaline rocks (carbonatites, ultrapotassic mafic rocks and potassic mafic-felsic lava) indicates that melting was deeper than in the Eastern Branch.
Hot springs, fumaroles, and steaming grounds are more abundant in the Eastern Branch (Afar, MER and Kenya Rift), where shallow magma bodies are the most likely heat sources for volcano-hosted high-temperature geothermal systems. In the Western Branch, off the sparse Quaternary volcanic centres, deep circulation of groundwater through the rift master faults is the most likely mechanism for explaining some of the geothermal systems [11].

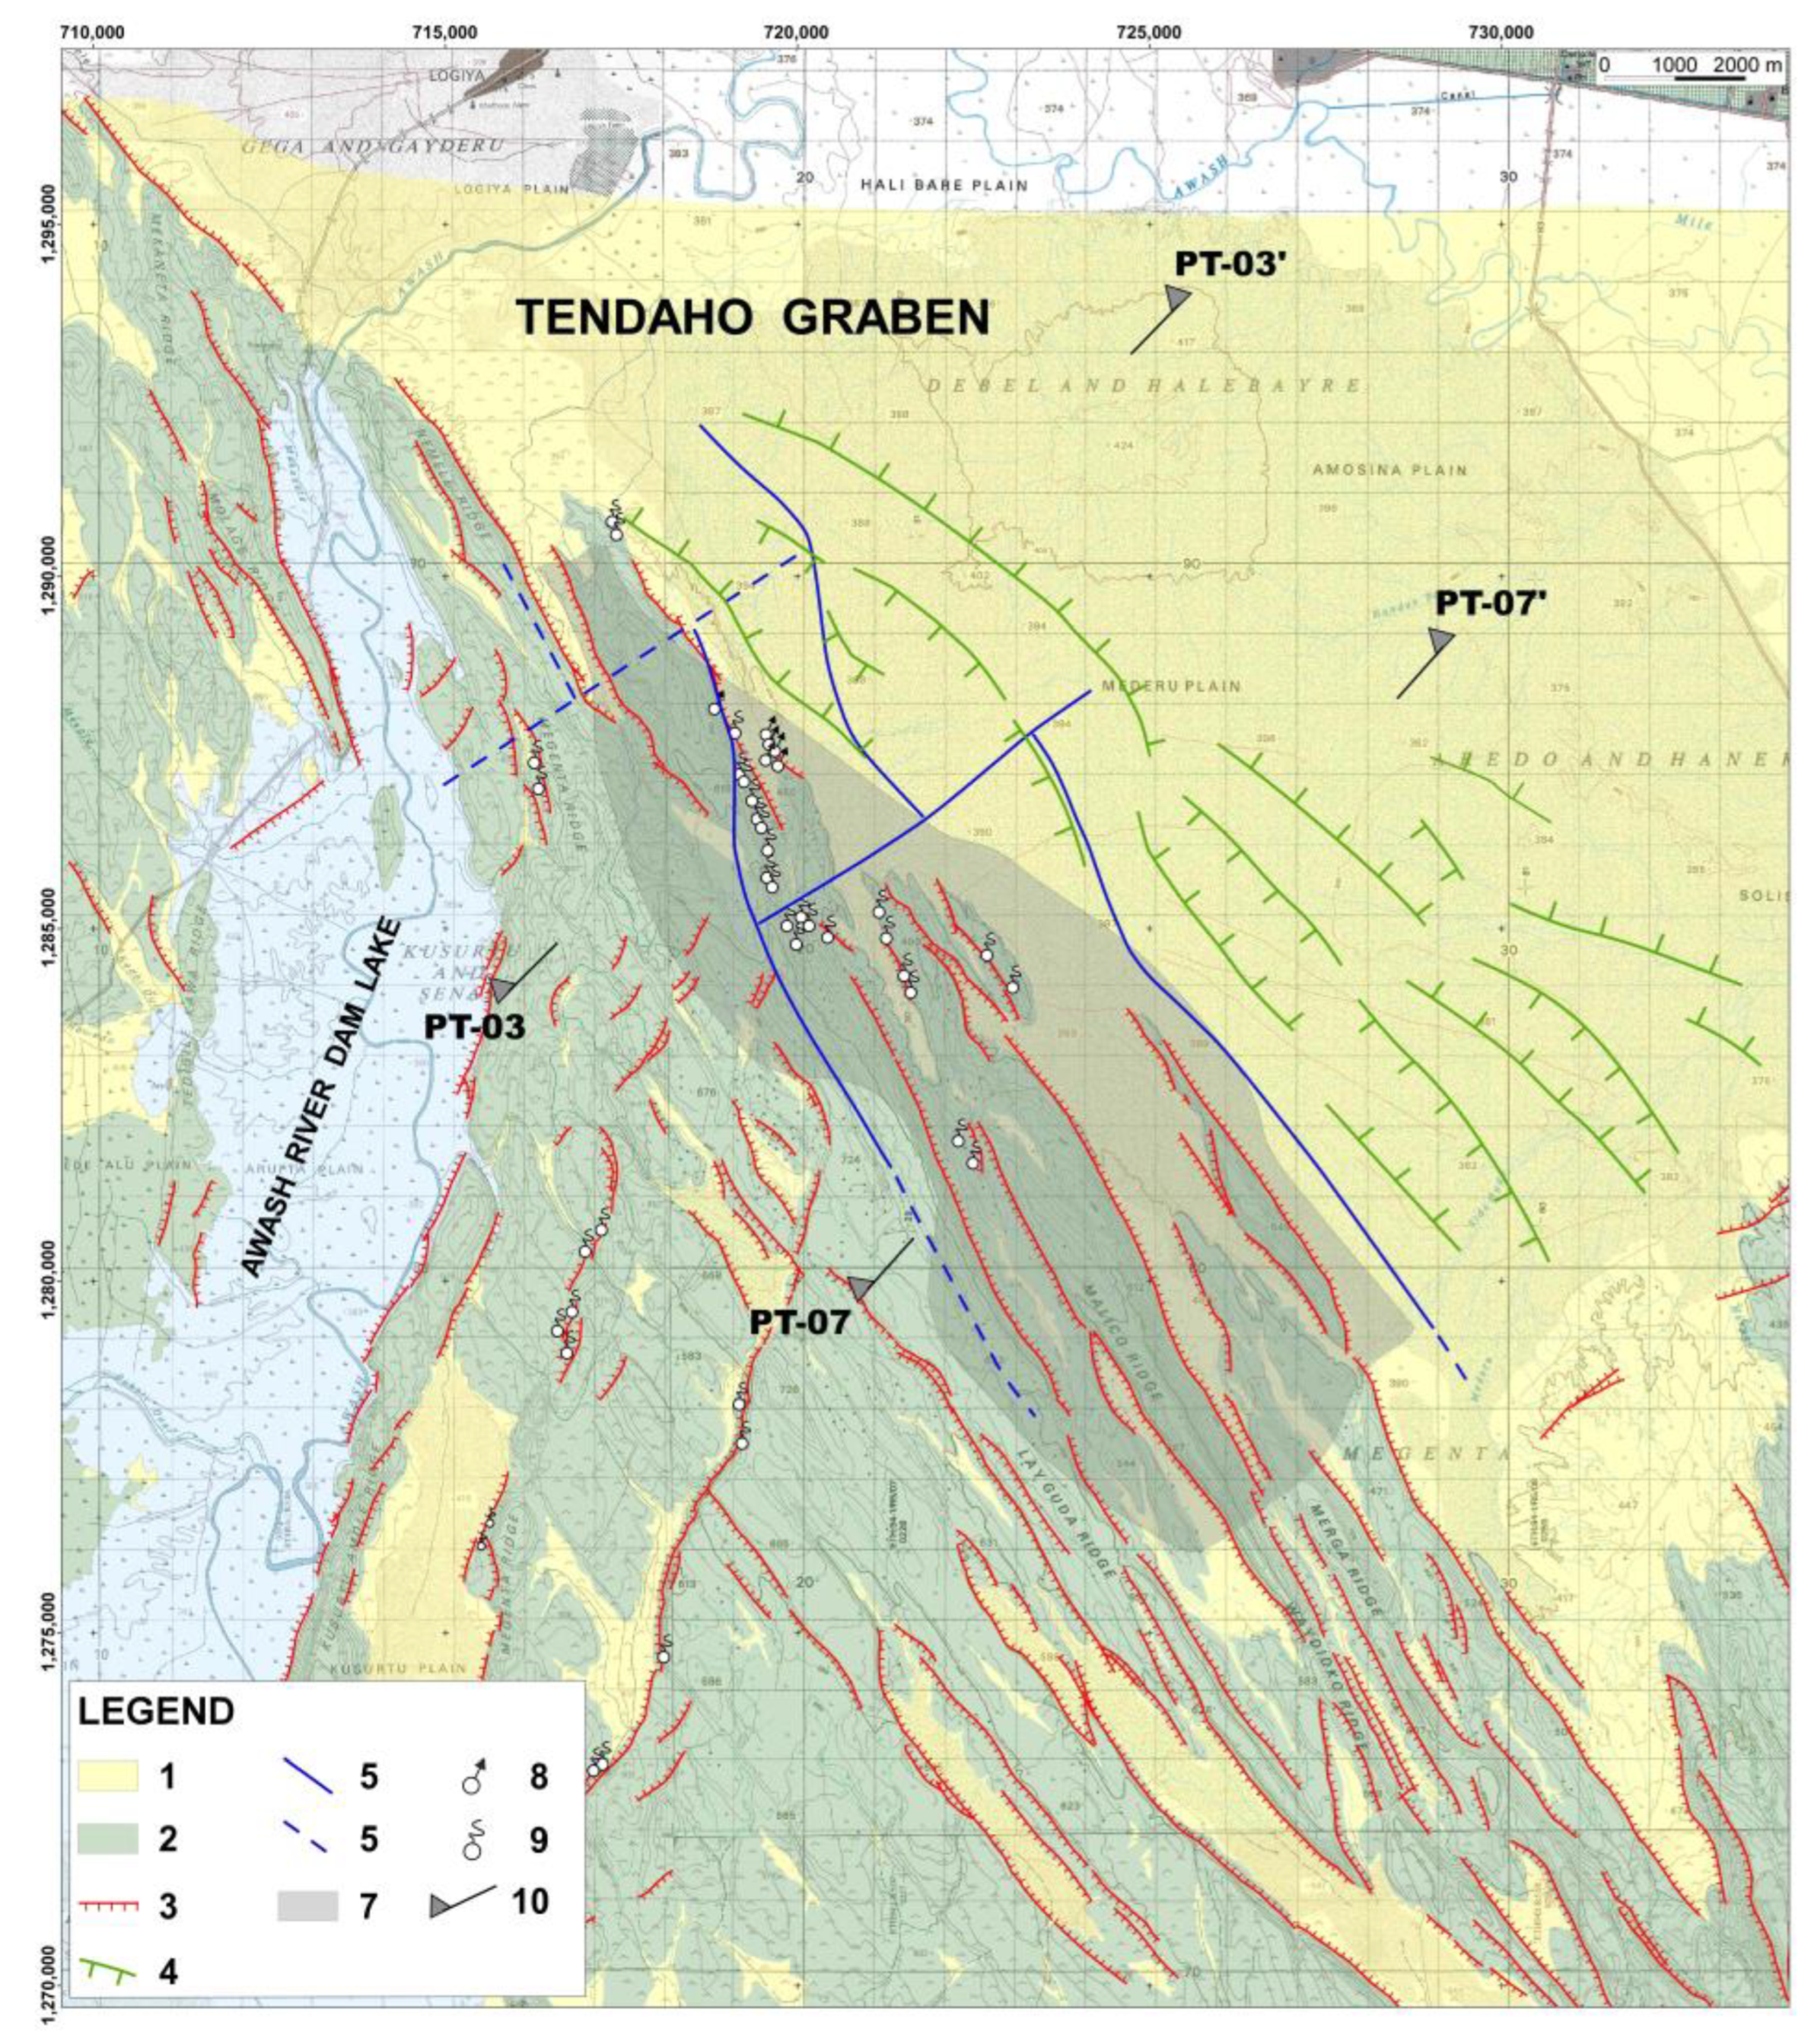
3. North-Eastern Branch: Alalobeda

The Alalobeda geothermal play is in the western sector of the Tendaho Graben (Figure 2). Pliocene-Pleistocene basaltic rocks belonging to the Afar Stratoid Series (ASS) are the main lithotype. ASS basalts have an estimated thickness of 1500 m [27,28]. Basalts are covered by young sedimentary deposits (fluvial-lacustrine sediments of the Tendaho Graben), with local intercalations of basaltic levels. Beneath ASS, the Dahla Formation occurs, composed of an association of basalt with intercalation of ignimbrite and sediment. The Dahla Formation does not crop out in the Alalobeda area, but it was encountered in drillholes in the Dubti-Ayrobera geothermal area, 20 km NW of Alalobeda [29]. This structural pattern is well visible in the ASS outcrops and is dominated by a NW–SE main system of faults following the Red Sea system and the NNE-SSW faults system related to the tectonics of MER.

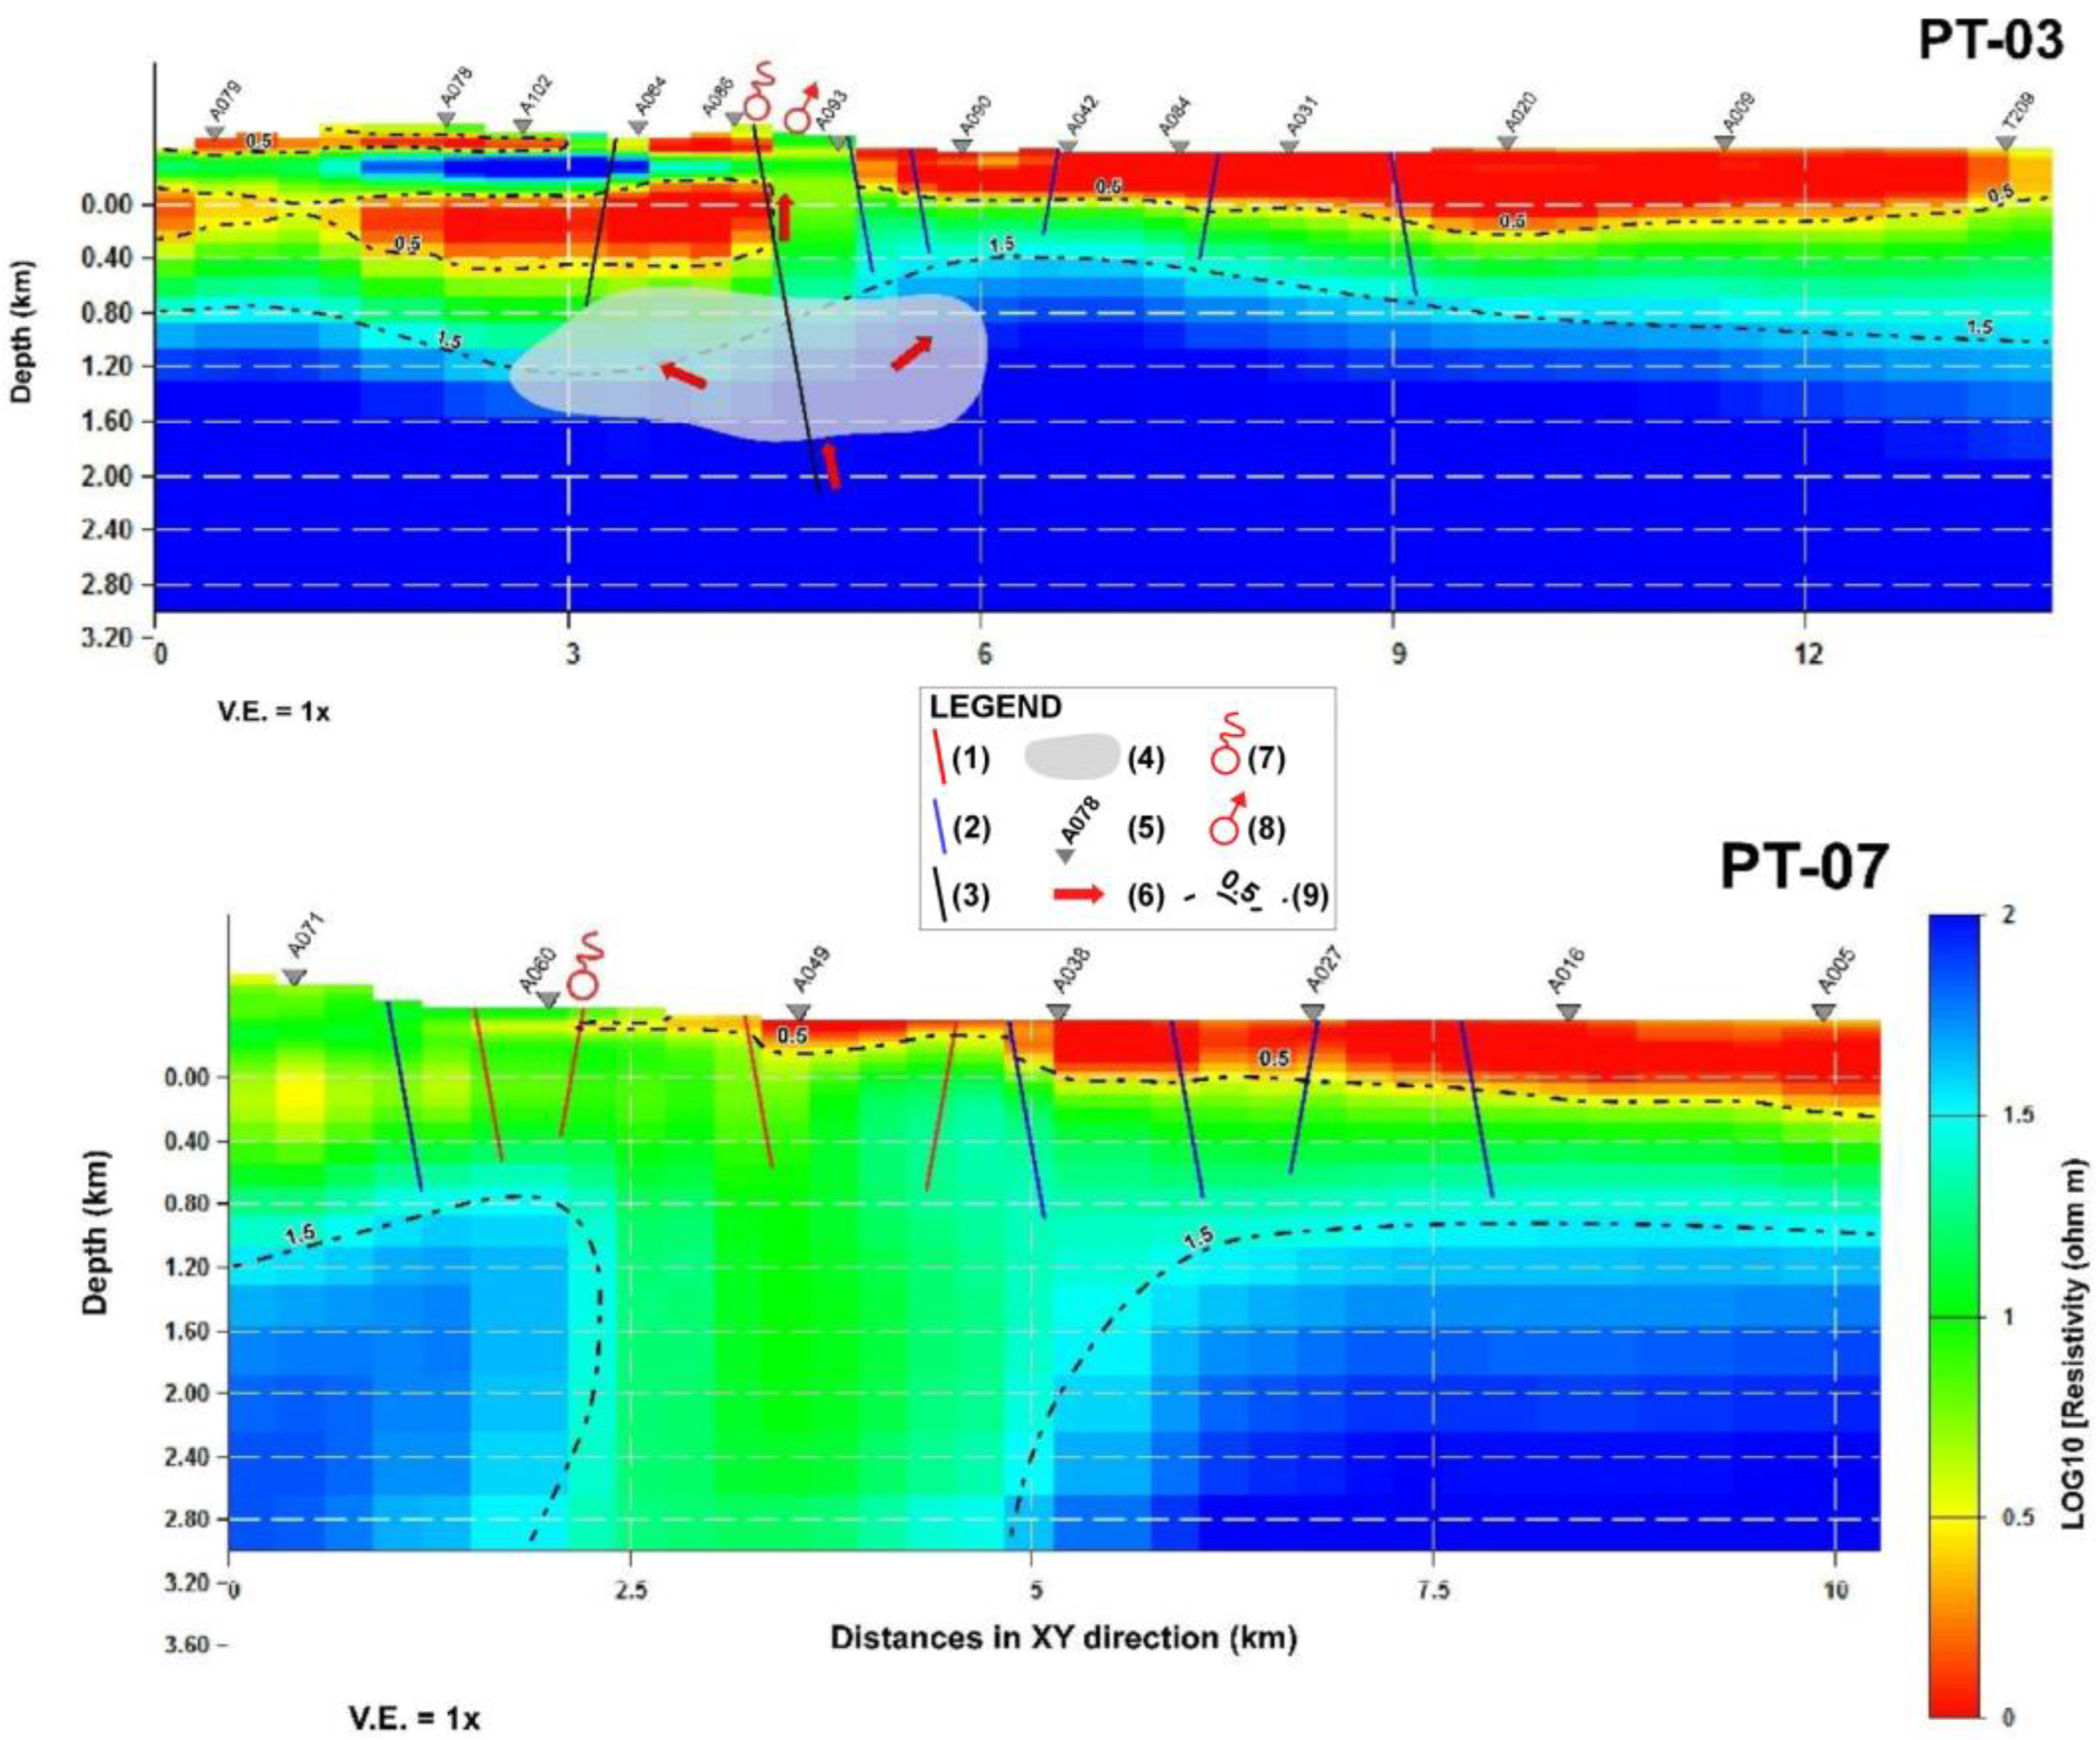
3.1. Geophysical and Geochemical Data

In the Alalobeda play, the picture of the fracture systems inferred from geological observations was recently integrated by three-dimensional magnetotelluric (MT) and gravity data inversion [10,30]. Geophysical results showed that the NW–SE normal fault system also continues beneath the sediments and is offset by NE–SW trending transversal lineaments that may be interpreted as strike–slip faults. Beneath the Tendaho Graben shoulder, a positive density contrast that may correspond to propylitic alteration of ASS was modelled at depths between 1 and 2 km.
The resistivity model showed that the NNE–SSW trending fracture zones beneath the shoulder of the graben continue at depth, but they appear interrupted by the NW–SE main normal fault system. The 3D resistivity model also revealed a deep conductivity anomaly extending to about 4000 m depth in the central part of the investigated area.
Microseismicity data showed that earthquakes are somewhat frequent, mostly shallow and of low magnitude (<4.0) [8]. The maximum density of earthquakes was recorded in a NW–SE elongated zone, matching the maximum concentration of hot springs. Seismicity above this zone may be related to the hydrothermal circulation, which may activate the existent fractures. Below 5 km depth, a clear seismic cut-off was observed. This can be interpreted as the brittle–ductile transition that, for a continental crust, should correspond to 350–600 °C [31,32].
Hot springs, mostly clustered within a narrow zone (700 × 350 m), and fumaroles tend to concentrate along or at the intersection of NNE–SSW and NNW–SSE trending faults (Figure 2). Sodium-chloride type, similar to those found in the exploratory wells of the nearby Dubti-Ayrobera geothermal play [33], and sodium-bicarbonate type waters were sampled at the hot springs [34]. Based on the Na-K and K-Mg geothermometers [35], all samples indicate that the reservoir is close to equilibrium with albite, K-feldspar, chlorite, illite and silica at 200–220 °C. Such temperature is consistent with that inferred from fumaroles gases (on average 185–225 °C). The estimated temperatures and the isotopic composition, which exhibits a relatively low oxygen isotope shift, suggested a water-dominated reservoir. The isotopic composition of the geothermal fluids, compared with the isotopic values of the Ethiopian rainwater, indicated that the reservoir hosts palaeowater [34].
The lack of manifestations in the graben plain does not necessarily mean that groundwater flow does not occur in this zone. Still, it could be partly due to the impervious surface sediment, which may hinder the upwelling of geothermal fluids. However, the sedimentary sequence alone is too thin (~100 m) to impede the escape of the geothermal fluids. Thus, the ASS basalts, together with sediments, may play the role of cap-rock, and the underlying Dahala Formation would act as a reservoir. ASS basalts exhibit very low resistivity values (<5–10 Ω m), but surprisingly there is no evidence of alteration. The low resistivity could be explained with the interaction between magma and sediments, which may result in a mixed material referred to as peperite [36].

3.2. Conceptual Model

The interpretation of the available data argues for a geothermal reservoir likely located below the major hot springs and enclosed between the fractures trending NNW–SSE and the geoelectrical discontinuities trending WSW–ENE (Figure 2). Within this zone, the seismic events are more frequent, and the focal depths are shallower.
Figure 3 shows two cross sections (PT-03 and PT-07) that summarize the geological, geophysical data and present the likely geophysical conceptual model of the Alalobeda play. The area overlying the reservoir (cross-section PT-03) shows an upper unit with a low electrical resistivity of 1–10 Ω m and an average thickness of 1000 m, which may be interpreted as the cap-rock of the geothermal system. Below this unit, resistivity increases to ~100 Ω m, which is much higher than resistivity values of 20–50 Ω m, typically characterizing geothermal reservoirs [37,38,39]. In the central part of the investigated area (cross-section PT-07), a wide low-resistivity zone (<30 Ω m) extends to a considerable depth and might be interpreted as an alteration zone caused by upward flow. We suggest that geothermal fluids migrate from the upward flow zone towards the reservoir driven by the NNW–SSE fault system. The fracture system might also act as an impervious barrier preventing fluid flow in WSW and ENE directions.
Geological and geophysical observations did not argue for a shallow geothermal aquifer (similar to that of Dubti). This is likely due to the impervious nature of the shallow layers. The fluid chemical composition suggests that the Alalobeda geothermal system has no connection with the nearby Dubti system.
In the Dubti-Ayrobera areas, Didana et al. [33] and Stimac et al. [40] claimed that a large intrusive magmatic body, fed by deep mantle sources, is the heat source of the geothermal system. This conclusion was based on results of MT inversions that identified a low-resistivity 15 km wide body at a depth of 5–18 km. MT data from Alalobeda, albeit of good quality, could not resolve the resistivity structure at depths larger than 5 km [30]. Thus, the occurrence of such a deep and huge conductor can be neither proved nor disproved. However, we noticed that the seismic cut-off depth is nearly uniform across the area. Consequently, we may argue that a single magmatic body intrusion in the shallow crust is unlikely. We suggest that diffuse, deep-seated magmatism related to the lithosphere thinning that regionally affects this area [41] could be the heat source in the Alalobeda as in the Dubti-Ayrobera geothermal plays.

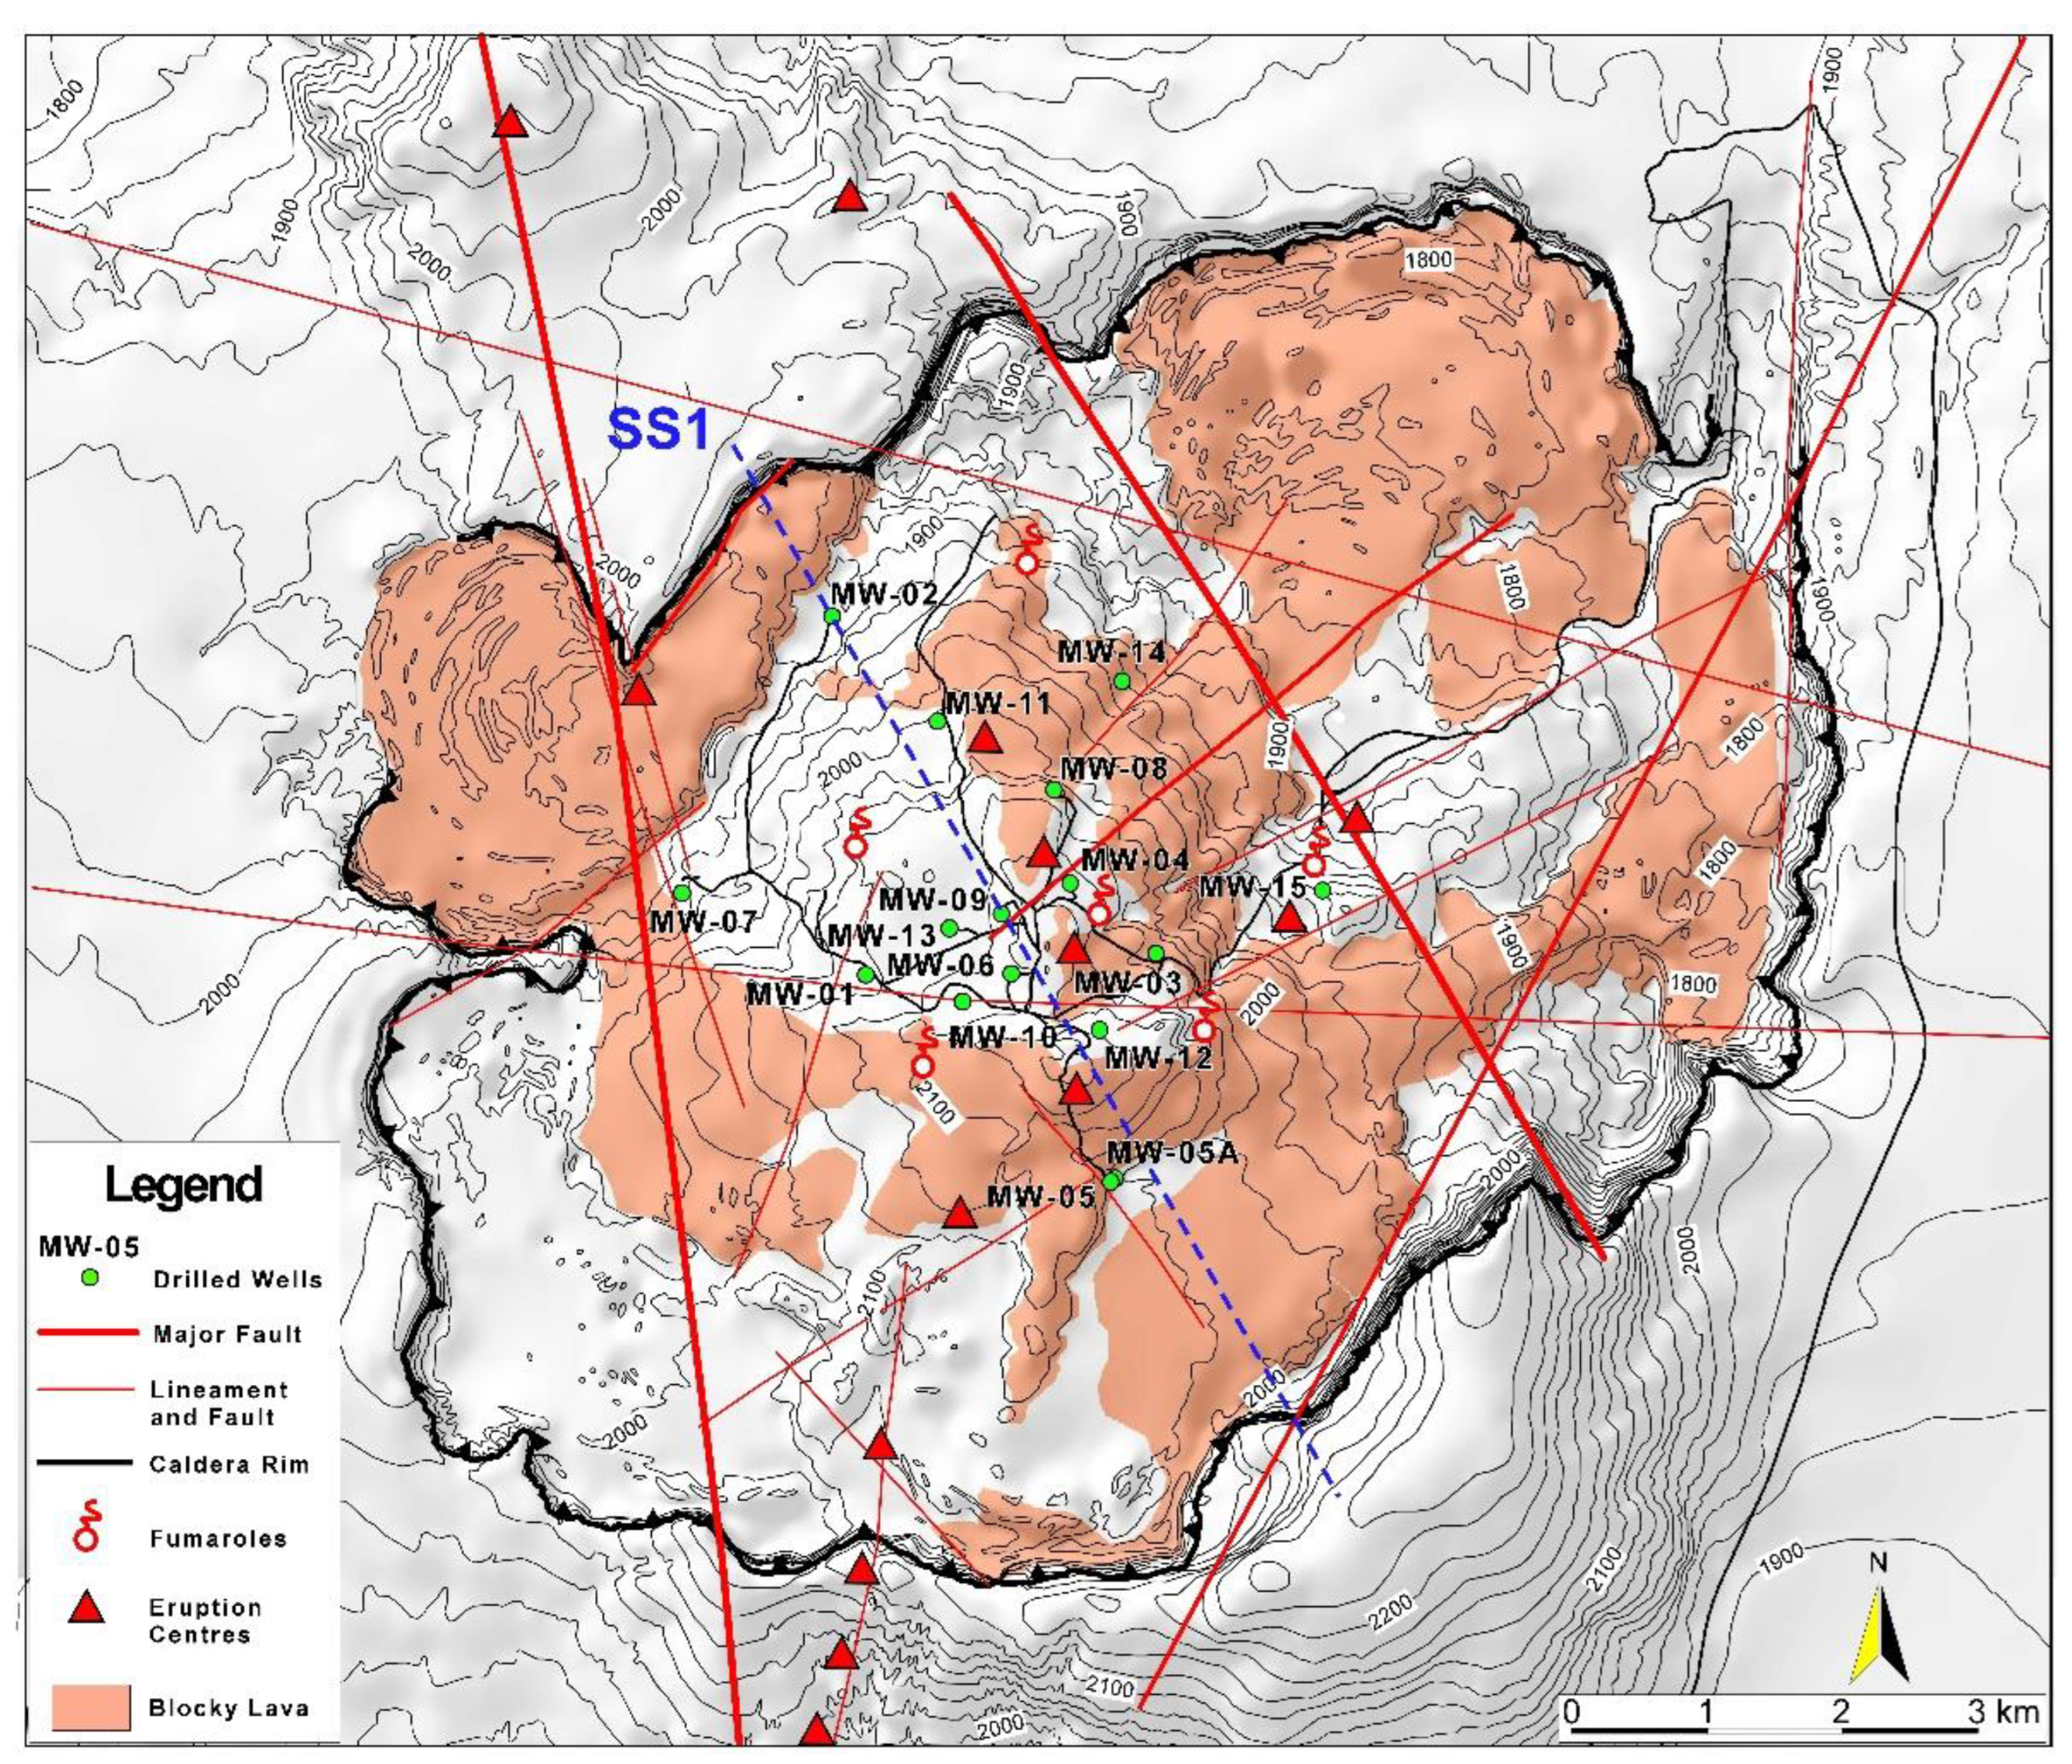
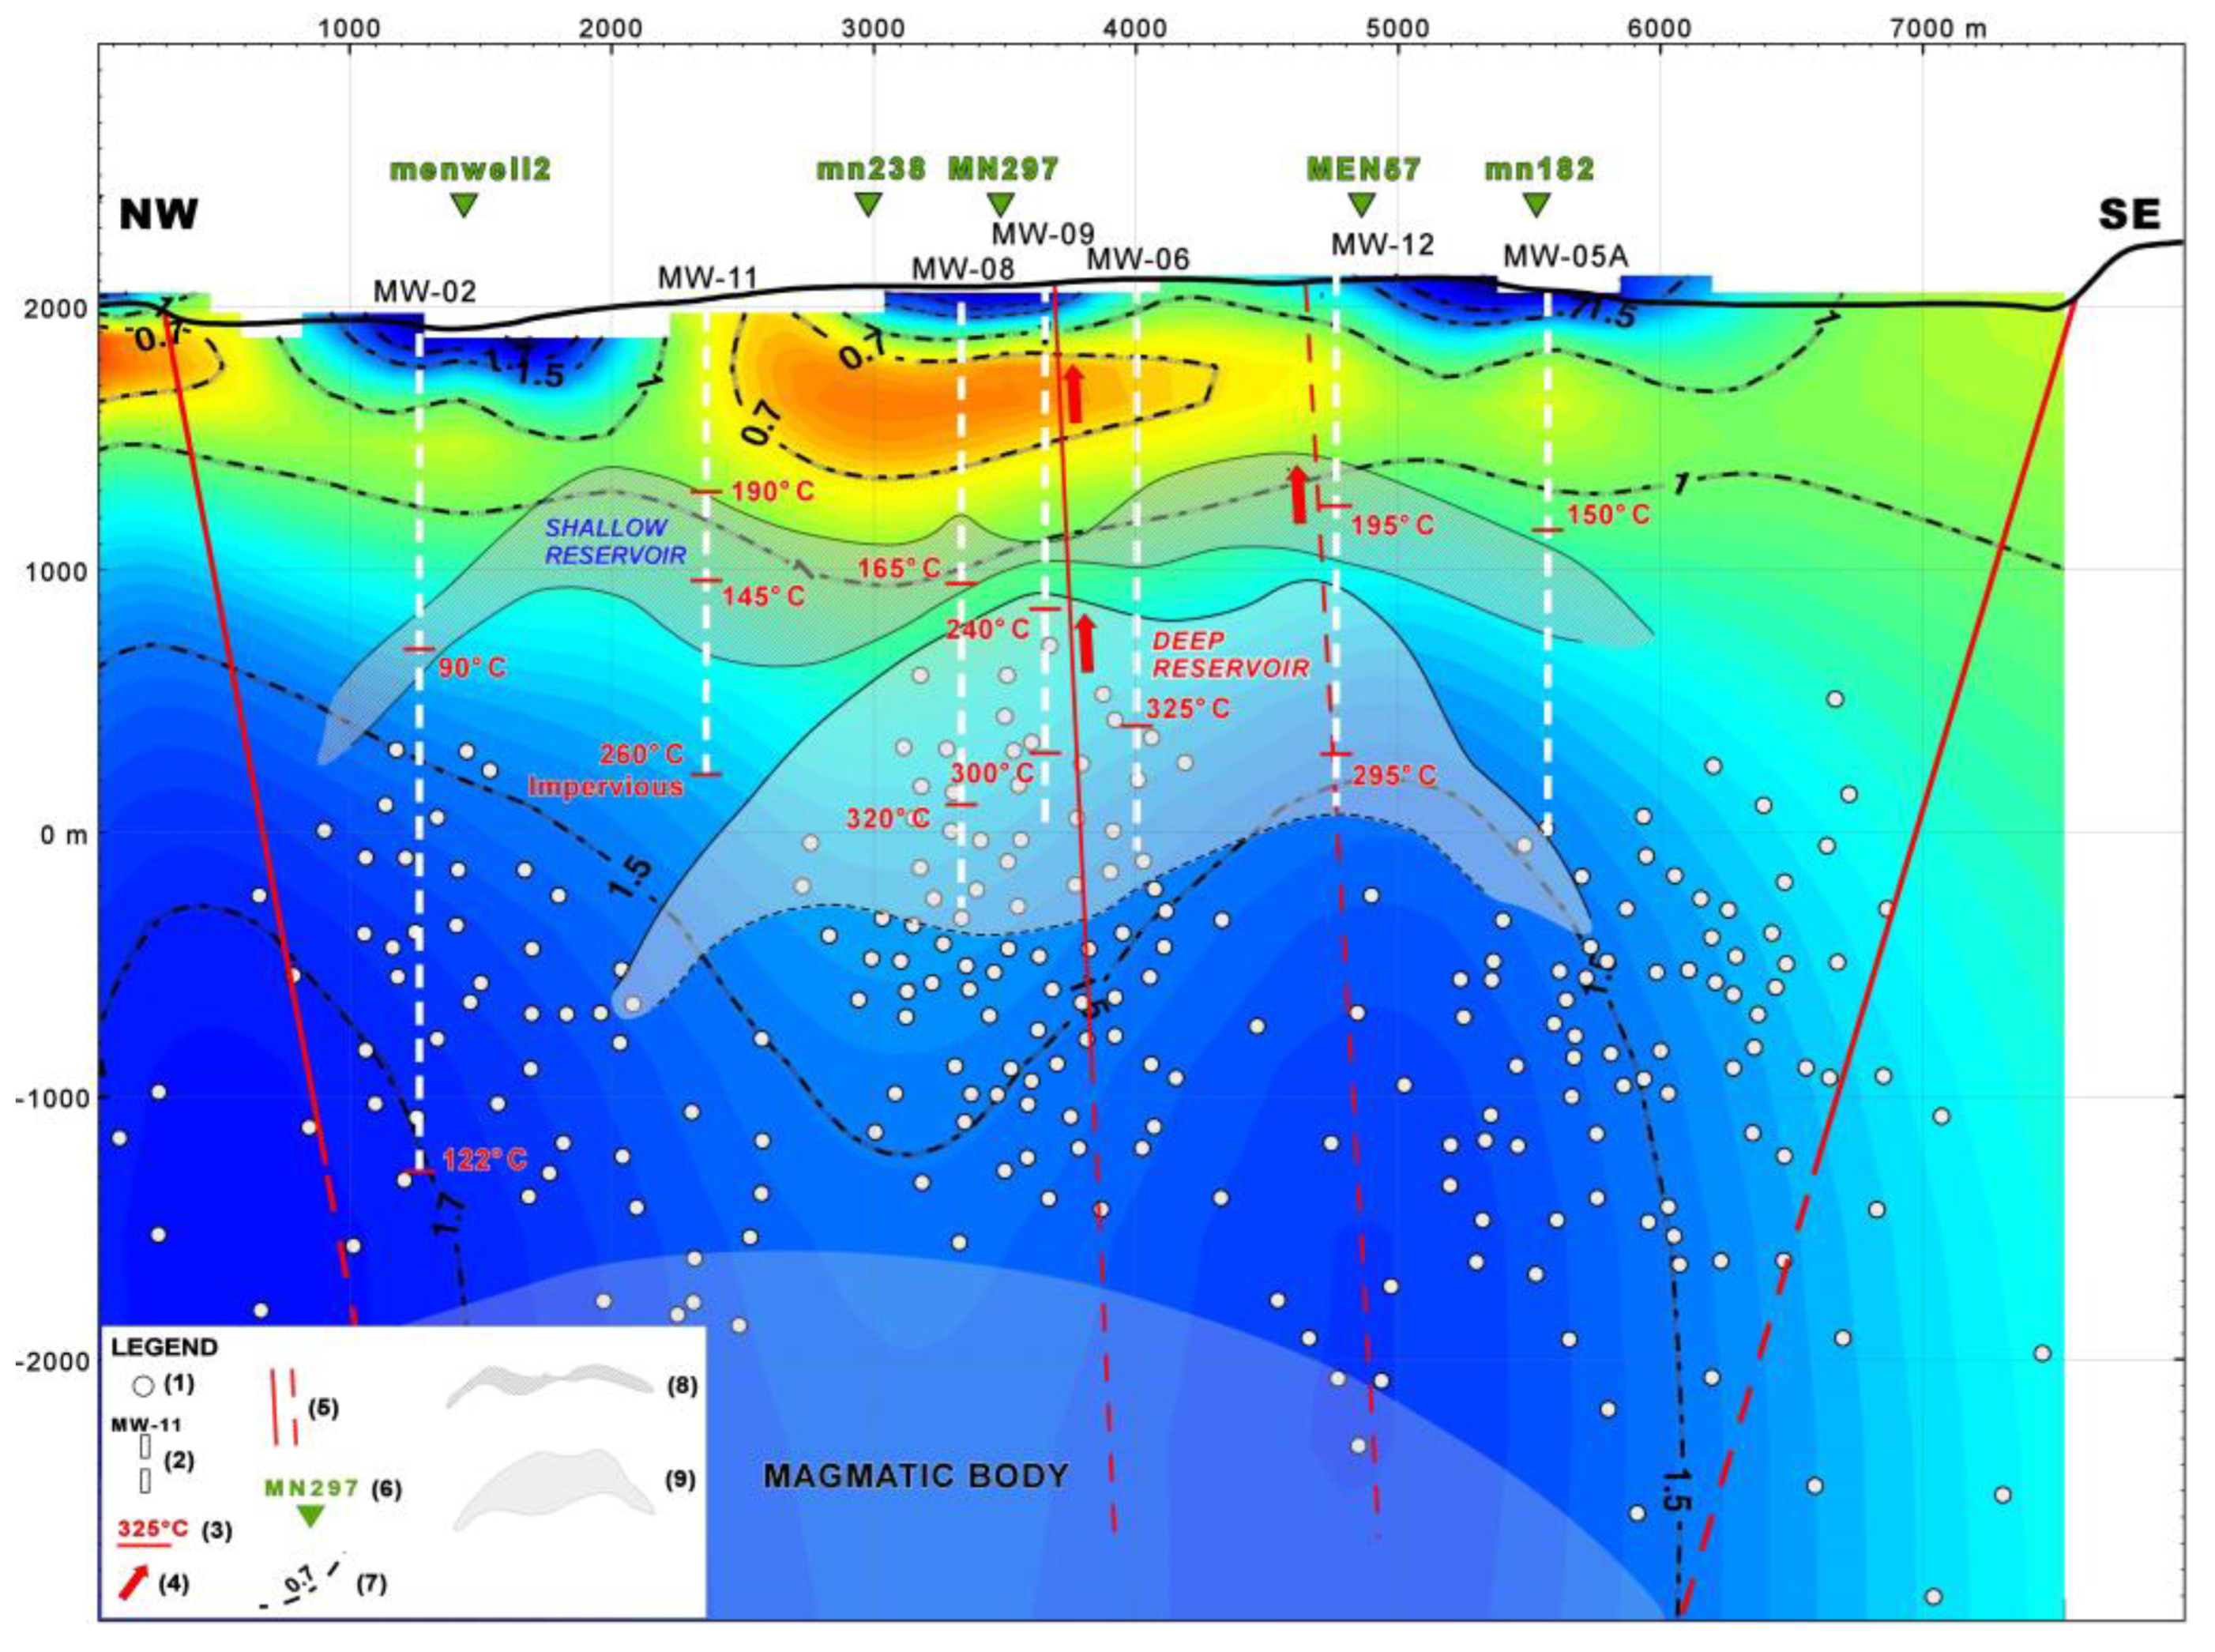
4. South-Eastern Branch: Menengai

The Menengai caldera lies in the central part of the Kenya Rift. The geological and structural pattern is presented in Figure 4. Volcanism has been active since 29 ka ago, as testified by a vast ash flow deposited in the surrounding lakes [42,43]. After this event, the volcanic edifice evolved into the present-day caldera. The formation of the caldera top and a remarkable volume of trachytes are related to another significant eruption dating back to 8 ka. From the numerous ash flows within the caldera, Mibei and Lagat [44] inferred that the last eruption occurred a few hundred years ago.
Blocky lavas of peralkaline–trachytic composition with subordinate pyroclastic intercalations are lithotypes cropping out within the caldera or intersected by the several wells that were drilled in the last decade [45]. Intrusive products progressively increase with depth and towards the central portion of the caldera [46]. Erratic lenses of syenitic intrusive and basaltic rocks were also encountered in some wells, suggesting that magma pulses were injected into the overlying formations as dikes.
The area is affected by a complex pattern of tectonic lineaments, likely due to intense neo-tectonic activity. The dominating fault system, resulting from gravity and remote sensing analyses [47], trends NNW–SSE and is well aligned with eruption centres and fumaroles activity. Another important system of lineaments has a roughly E–W direction. Additional secondary fracture systems with different orientations were also inferred from remote sensing analysis and field observations.
Many terrestrial heat-flow sites are available near the Menengai volcano. The temperature measurements show no significant bias by advective heat transfer. The heat flow ranges from about 40 to 180 mW m−2 and generally decreases with the distance from the caldera. This pattern is similar to other part of the Kenya rift with the highest heat-flow values concentrated near the rift axis [48]. Fumaroles, steaming grounds, and the hot fluids found in the boreholes are additional evidence of hydrothermal activity and the occurrence of a geothermal reservoir.

4.1. Geophysical and Geochemical Data

Gravity and MT data were available within the Menengai caldera and its surroundings [8,49,50]. The analysis of gravity data puts into evidence a well-pronounced positive anomaly in correspondence of the caldera. The anomaly can be modelled with a higher density body (2900 kg m−3) at about 4000 m depth (Figure 5). The density of the body is compatible with gabbroic composition, perhaps formed from cumulates associated with differentiation of a mafic (basaltic) magma. This picture is consistent with seismic travel-time data [51] and the seismic and gravity models by Simiyu and Keller [52], indicating a high-velocity basement.
Two-dimensional inversion of MT data revealed three stratigraphic units: (i) an uppermost resistive unit (50–100 Ω m) with a thickness of 100–300 m; (ii) an underlying upper conductive unit (<5 Ω m) with an average thickness of 600–800 m; (iii) a “resistive basement” (>30 Ω m) (Figure 5). The high-density magmatic body at depth was not revealed by MT modelling. Since resistivity decreases with temperature, this argues for a still hot magmatic body. Additional evidence of anomalous temperature at depth was given by micro-seismicity monitoring of the zone centred on the Menengai caldera [53], showing that the maximum depth of earthquakes is about 3500–4000 m. This depth corresponds to the top of the high-density body inferred from gravity (Figure 5).
All thermal water samples from wells and hot springs belong to the Na-HCO3 facies. Geochemical analysis of these samples and soil gases indicated the occurrence of a shallow, liquid-dominated reservoir (with temperatures of 150–190 °C) and intermediate-deep reservoirs, at least partly hydraulically connected (with temperatures of 230–340 °C), hosting fluids at different vapor/(vapor + liquid) mass ratios [50]. The analysis of the gas equilibrium suggests an increase in vapor/(vapor + liquid) mass ratio not only horizontally, i.e., towards the central caldera zone wherein the vapor-discharging wells MW-06, MW-09, and MW-13 are located, but also with depth.

4.2. Conceptual Model

The availability of direct information from logging and testing of geothermal wells [8] was fundamental to validating the inferences of the geophysical and geochemical investigations. Figure 5 summarises the main geological and geophysical data and shows the conceptual model of the Menengai geothermal field obtained by integrating surface geological and geophysical information and the drilling results.
The stratigraphic sequence, inferred from the boreholes, consists predominantly of trachytic lava. Thus, the degree of hydrothermal alteration and tectonic fracturing controls the permeability. The low-resistivity (<10 Ω m) layer at shallow depth (600–1000 m below ground level) may represent the cap-rock of the reservoir. This layer is somewhat discontinuous and hosts a shallow and relatively cold aquifer. The geothermal reservoirs found by some boreholes are hosted within the 1500–2000 m thick zone with a resistivity of 10–30 Ω m. These values are somehow slightly lower than those typical for a geothermal reservoir.
Borehole logs confirm the occurrence of two distinct reservoirs: (i) a shallow, liquid-dominated reservoir of reduced thickness, sometimes encountered by the wells (in particular, MW-06 and MW-09); (ii) a deeper, vapor-dominated reservoir, crossed by boreholes MW-06, 08, 09, and 12 (Figure 5). The vapor phase tends to reduce laterally, in good agreement with the geochemical data. Boreholes MW-02 and MW-05A generally show lower temperatures (90–150 °C), indicating that both the shallow and deep reservoirs thin laterally.
Temperature values recorded in the geothermal borheoles generally confirmed the inferences from the water and gas geothermometers. Performance measurements in the Menengai wells [8] showed unusually high temperatures, often above 300 °C and even reaching supercritical values (up to 390 °C) at the hole bottom and multiple feed zones over extended wellbore sections. In borehole MW-02, a temperature of 90 °C was recorded in the shallow reservoir. At the bottom hole (about 3000 m depth below ground level), the temperature was only about 120 °C. The temperature gradient is thus very low (15 mK m−1) and may indicate cooling due to leakage of cold water from the shallow aquifer.
The temperature of borehole MW-11 exhibited an apparent inversion, i.e., a decrease from 190 °C at the top (700 m below ground level) to 145 °C in the intermediate-lower portion (1000–1300 m) of the shallow reservoir (Figure 5). Such an inversion may be explained with lateral inflows of colder water within the reservoir. Below the reservoir bottom, the temperature linearly increases to 260 °C with a gradient of about 180 mK m−1, which likely characterizes the borehole conductive (impermeable) portion. Borehole MW-06, 08, 09 and 12 showed that the deep reservoir is characterized by temperatures ranging from 240 to 320 °C, and a maximum thickness of about 1000 m can be estimated.
The fault systems affecting the caldera control the permeability of shallow and deep reservoirs. This turns out from the temperature recorded in borehole MW-03 (see Figure 4 for the location). In this hole, off the secondary fracture system, temperatures are lower than 35–100 °C compared to the other boreholes. The temperature gradient is similar to that of borehole MW-02 (Figure 5), and permeability is limited to very thin levels.
The integrated analysis of micro-earthquake distribution and gravity indicates that the heat source of the geothermal system may be located at 3500–4000 m depth, corresponding to the high-density body inferred from gravity modelling. The seismic cut-off at this depth roughly tracks the upper boundary of the high-density body. If a temperature gradient of 180 mK m−1 is assumed, i.e., characteristic of the impervious zone beneath the deep reservoir, the expected temperature at the top of the high-density body should be about 650 °C. This inferred temperature well matches the expected limit of the brittle-ductile transition [31,32] and agrees with the conclusion by Simiyu [53] that partially molten material may occur at depths between 5 and 6 km. Seismicity above the brittle–ductile transition seems associated with the main fault systems.
Due to a lack of isotopic data of fluids from the deep wells, no information was available on the nature of the deep reservoir recharge water. The recharge likely takes place along the border of the caldera, in correspondence with the major tectonic structures, which may favour the deep infiltration of meteoric water, with a minor contribution from the magmatic system in the form of steam and gas transfer. The main zone of upward flow is situated in the central part of the caldera, and the two major faults running NNW–SSE might act as a hydrogeological barrier.

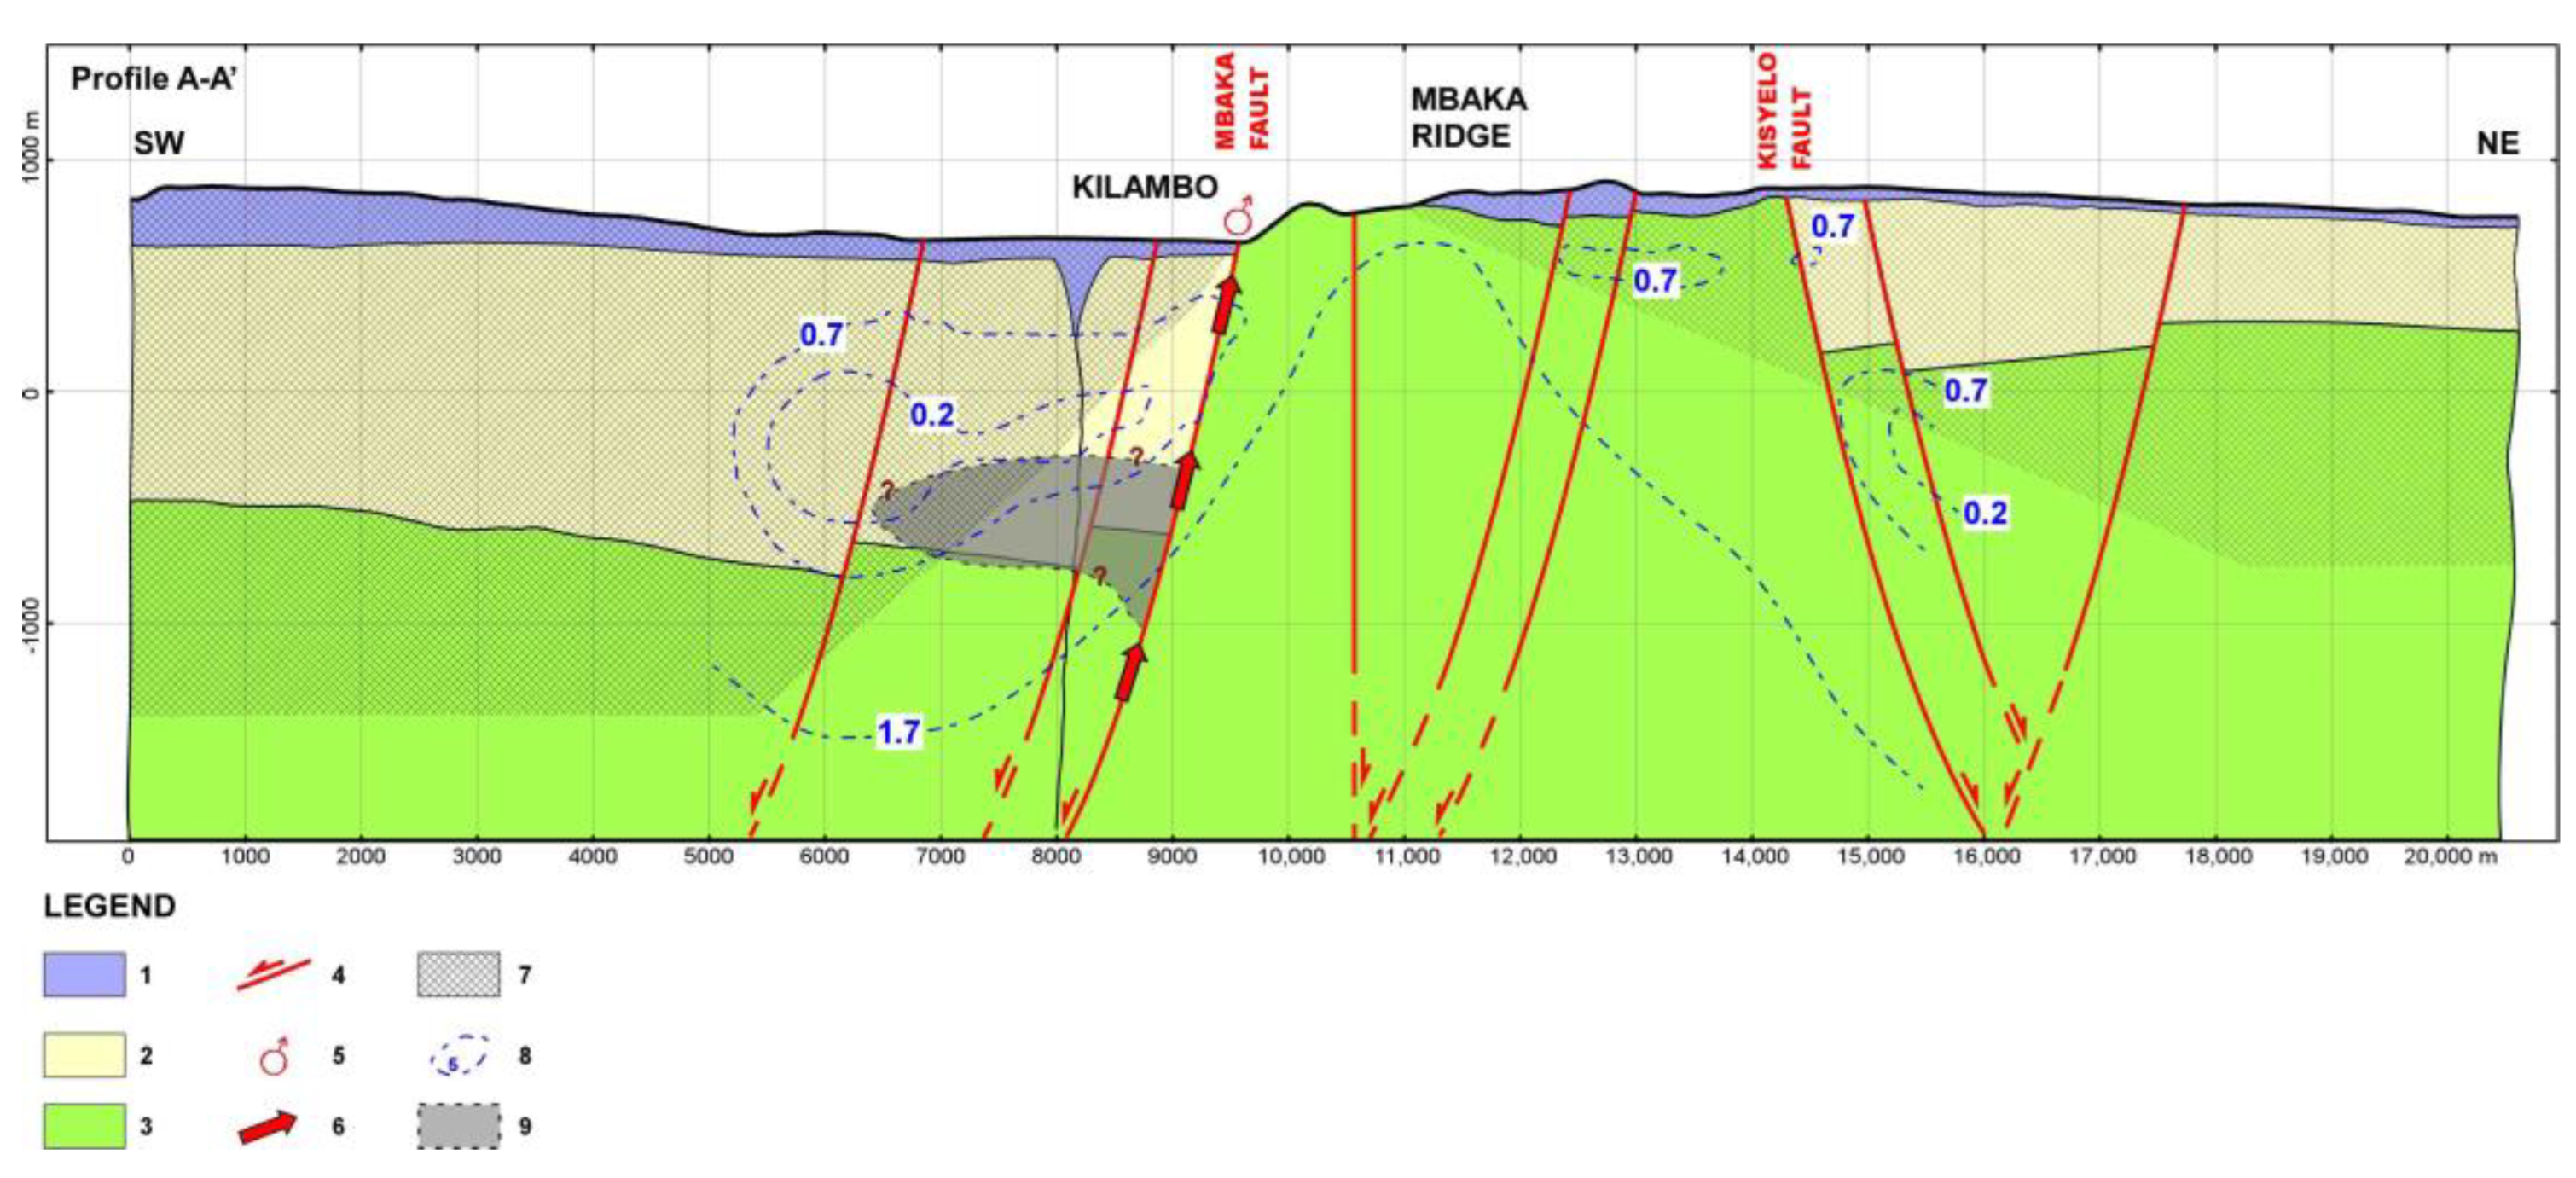
5. Western Branch: Kilambo-Ilwalilo

The Kilambo-Ilwalilo geothermal area (Tanzania) is part of the Rungwe volcanic province, in the Western Branch of EARS (Figure 1). It is located close to the eastern margin of the Karonga Rift, which is dated Late Miocene–Pliocene. Volcanism and faulting in the rift have propagated from south to north from 7 Ma ago to the present [54]. The Karonga basin continues into the Rukwa, and Usangu rift basins. The Karonga basin, is the northernmost sub-basin of the Nyasa rift, and is bordered by the Livingstone fault and the intra-basin, Mbaka transfer fault, both seismically active. During the rifting history, several successive phases occurred, with partial superimposition of a Cenozoic rifting on older Permian–Triassic and Mesozoic events.
The main geothermal manifestations are the Kilambo, Kajala and Ilwalilo hot springs [55] located along the Mbaka fault (Figure 6). The hot springs of Kilambo and Kajala exhibit a total flow rate of 0.015 m3 s−1, with temperatures of 59–64 °C, producing a thermal discharge of 2.5 MW. The hot spring at Ilwalilo has an outlet temperature up to 64 °C, a flow rate of at least 0.005 m3 s−1 and 0.8 MW of thermal yield. The gas vents at Lufundo and Ilwalilo springs are other pieces of evidence of geothermal activity.
The oldest formation cropping out in the area consists of a metamorphic basement, including ortho-gneisses, meta-anorthositic and amphibolitic rocks. This unit occurs on the NE side of the Mbaka Fault (Figure 6) and presents a pronounced schistosity and a dense network of fractures. Consequently, its secondary permeability can be fair. South-west of the Mbaka fault, the basement is covered by Mesozoic sediment. This unit does not crop out in the investigated geothermal area. Neogene–Recent volcanics (trachitic-phonolitic ignimbrites, basaltic lavas and basalts), only a few hundred meters thick, and sediments (siltstones and sandstones) occur east of the Mbaka fault. Volcanic and clastic sediments are overlain by lacustrine deposits [25,54]. Several volcanic centres are present in the area and the tectonic setting is dominated by the NNW–SSE trending Mbaka fault, with secondary N–S and NE–SW trends.

5.1. Geophysical and Geochemical Data

MT and gravity surveys were recently carried out in the Kilambo-Ilwalilo geothermal area [56]. Magnetotelluric data were recorded at 76 stations, located along eight profiles, with a spacing of 750 m. A more detailed sampling was set around the Kilambo thermal springs. A gravity survey, consisting of 108 measurement stations, was performed with a nominal spacing of 700 m along nine lines. Twenty-five additional stations were acquired at about 30 km around the prospect to evaluate the regional gravity field. The dense station grid allowed for detailed geophysical 2D and 3D modelling.
The results of MT 3D inversion showed a resistive body (100–1000 Ω m) in the central portion of the survey area that extends from ground level to depth > 4 km and can be identified as the metamorphic basement cropping-out [56]. The high-resistivity body is surrounded by two conductive zones (<10 Ω m). In the western part of the survey area, the conductive layer is continuous and of a larger thickness (~1000 m), whereas it is thinner and discontinuous in the eastern part. The resistivity of about 50–100 Ω m, observed in the uppermost hundred meters above the conductive zones, is ascribable to the outcrops of Neogene volcanic products. Towards the SE corner of the investigated area, the conductive zone becomes continuous and homogeneously thick, matching the lacustrine sediment presence.
Processing of gravity measurements produced a regional field that is consistent with regional sudies by Ebinger et al. [54] denoting a wide, NW–SE trending, Bouguer anomaly minimum of −160 mGal. The residual Bouguer anomaly shows positive values (>15 mGal) in the central part of the survey area, where the hot springs occur (Figure 6). The positive anomaly can be associated with the high-density high-resistivity metamorphic basement. The residual Bouguer anomaly becomes slightly negative east and west of the gravity high, with a minimum value of −5 mGal.
Data on the geochemical features of the Kilambo-Kajala and Ilwalilo hot springs are reported by Pasqua [8]. The Kilambo-Kajala reservoir has Na-HCO3 chemical composition, likely due to the interaction of meteoric waters with the basement rocks, sustained by the conversion of CO2 to HCO3. The silica geothermometer indicates a reservoir temperature of about 140 °C. δ13C values of CO2 range from −5.5 to −6.0 ‰, suggesting that deep sources chiefly supply CO2. Ilwalilo has the same Na-HCO3 chemical composition; consequently, groundwater likely circulates in rocks of the same type as in Kilambo-Kajala. The reservoir temperature is about 110 °C, as indicated by silica and K-Mg geothermometers. δ13C values of CO2 (−5.6 to −6.4 ‰) point to a deep origin. The type of thermal manifestations, their chemical and isotopic characteristics and estimated temperatures suggest a water-dominated geothermal system.
In addition to water sampling, soil gas monitoring was also carried out at the hot spring sites and Lufundo (see Figure 6 for location). The spatial distribution of soil CO2 flux can be in relation with the deep geothermal fluid circulation and their upwelling along faults and fractures. The total output of deep CO2 was estimated at 12.7 tons/day for Kilambo-Kajala, 0.22 tons/day for Ilwalilo, and 43.0 tons/day for Lufundo. The spatial distribution of the CO2 flux was in good agreement with the NW–SE trending faults/fractures of the Mbaka system and the N–S oriented tectonic structures. Moreover, the hot springs are characterized by relatively low CO2 fluxes. On the contrary, in Lufundo, where hot springs are absent, CO2 flux was higher, with a maximum value of 221 mol·m−2·day−1.

5.2. Conceptual Model

Figure 7 presents a cross-section summarizing all the information obtained from the geological, geophysical and geochemical investigations. The main feature is the low-resistivity layer (<5 Ω m), SW of the Mbaka fault, laying beneath a superficial, medium-resistivity layer, corresponding to Neogene–Recent volcanics. The low resistivity layer might be interpreted as an alteration zone (clay cap) possibly caused by hydrothermal activity affecting the Mesozoic sediment occurring beneath the Neogene–Recent volcanics and at least the shallow part of the underlying metamorphic basement.
Beneath the conductive zone, a reservoir is not visible from MT modelling, as resistivity regularly increases with depth. It might lie between the 5 and 50 Ω m iso-resistivity lines, at about −1000 m above sea level, and consequently may be relatively thin (~500 m). The Mbaka fault may act as a permeability barrier and, thus, define the eastern boundary of the reservoir. The other boundaries are difficult to locate, and, at the present investigation stage, any hypothesis is speculative.
Resistivity increases abruptly (one–two order of magnitude) east of the Mbaka fault, thus indicating that no alteration characterizes the metamorphic basement. At the NE end of the cross-section, where Lufundo gas vents are located, a thin and discontinuous low-resistivity zone, matching the outcrops of volcanic materials, appears over the high resistivity basement. This is evidence that the gas vents do not belong to the same hydrothermal manifestations (hot springs) controlled by the Mbaka fault. The occurrence of another probable fault system, Kisyelo (Figure 6), may be supposed from the resistivity distribution.
Forward 2D gravity modelling indicates that the gravity high can be accounted for by a positive density contrast of 500 kg m−3, corresponding to the metamorphic basement rocks [56]. Because of their small thickness, the Neogene–Recent volcanic rocks alone cannot explain the gravimetric lows at both sides of the cross-section (Figure 7). Therefore, the lower density layer should be as thick as about 1.5–2.0 km and might affect the Mesozoic sediments and part of the metamorphic basement. It could be interpreted as a low-temperature alteration zone and/or groundwater circulation in the Mesozoic sediment and partly in the metamorphic basement. In general, there is a good agreement between the inferred resistivity and density structure, putting into evidence the extension at depth of the Mbaka fault.
From the analysis of the regional Bouguer anomaly, there is no evidence of a magmatic heat source, at least in the uppermost ~10 km depth. The recent volcanic activity of the geothermal area and surroundings likely derives from very deep magma chambers. The regional negative gravity anomaly of 100–200 mGal argues for the principal source of heat related to regional lithosphere thinning. A contribution due to underplating [25] may also be possible, which could be supported by the high CO2 flux of deep origin occurring in the area. The available terrestrial heat-flow measurements in the Karonga rift, southwest of the Kilambo-Ilwalilo area, exhibit values of only about 30 mW m−2 [57]. For thermal conductivity of 0.7 W m−1 K−1 [58], a geothermal gradient of 40 mK m−1 can be inferred This estimate is substantially in agreement with geothermal gradients recently derived from magnetic spectral analysis and 3D gravity inversion by Didas et al. [59]. Under these thermal conditions, the expected reservoir temperature of 110–140 °C could be reached at a depth of about 3 km.
The recharge of the system is supplied by meteoric water, and a likely recharge zone might be located W of the geothermal area at a distance of ~30 km. Groundwater may leak from NW to SE, warm up and flow upwards when encountering the Mbaka fault. The latter might represent the connection between the deep groundwater and the surface. West of the fault, lateral flow at an intermediate depth (~1.5 km) is supported by low resistivity values (Figure 7).

6. Concluding Remarks

The East African Rift System contains thousands-kilometre-long, aligned successions of adjacent extensional basins characterized by recent magmatic activity and hydrothermal circulation. This feature makes EARS Africa’s most exciting area for geothermal potential. The several branches of EARS are marked by the lateral variation of lithosphere thickness and volcanological characteristics. Such a variation reflects on the associated geothermal plays. We presented three of the different geothermal plays of EARS in detail, extensively explored in the last decade. They represent an example of the various structural, volcanological and hydrogeological realms (play types) that may be encountered in EARS.
Alalobeda and Menengai are examples of geothermal play types of the Eastern Branch of EARS. The former is a fault-leakage-controlled geothermal system located in a graben structure. The heat source is related to three superimposed rift systems (Red Sea, Main Ethiopian Rift and the Gulf of Aden). It is likely due to diffuse, deep-seated magmatism associated with the lithosphere thinning that regionally affects this area. The reservoir temperature of this water-dominated system ranges from 185 to 225 °C.
The Menengai geothermal play lies in a volcanic setting. It can be classified as a convection-dominated magmatic play type. The several available thermal data recorded in boreholes and geophysical interpretations indicate that the heat source could be a high-density magmatic intrusion with a temperature of 650 °C, located at 5–6 km depths beneath the caldera. Two reservoirs were detected: a shallow, liquid-dominated one with temperatures of 150–190 °C and an intermediate-deep one hosting steam and liquid with temperatures of 230–340 °C.
A typical example of the Western Branch geothermal play is the fault-leakage controlled system of Kilambo-Ilwalilo. This play is in a half-graben structure, where groundwater flows within permeable layers, reaches the main fault, and flows upwards and laterally. Reservoir temperatures are 110–140 °C and the heat source is provided by mantle uplift. Despite eruption centres around the geothermal area, the primary source of heat may be thus related to regional lithosphere thinning with a possible contribution of magmatism due to underplating.
The exploration of these geothermal plays gave an insight into the variability of the geothermal conditions in the different branches of the East African Rift System. It provided helpful guidelines for future studies aimed at researching geothermal resources in the rift.

Author Contributions

Conceptualization, M.V. and C.P.; methodology, C.P.; software, C.P.; validation, M.V., P.C. and C.P..; formal analysis, P.C. and M.V.; investigation, C.P.; resources, C.P.; data curation, C.P.; writing—original draft preparation, M.V.; writing—review and editing, M.V. and P.C.; visualization, M.V. and C.P.; supervision, M.V. and P.C.; project administration, M.V.; funding acquisition, M.V. All authors have read and agreed to the published version of the manuscript.

Funding

This research was granted by the University of Genoa, Fondi di Ricerca di Ateneo—100022-2020-FRA2019.

Data Availability Statement

Not applicable.

Conflicts of Interest

The authors declare no conflict of interest. The funders had no role in the design of the study; in the collection, analyses, or interpretation of data; in the writing of the manuscript; or in the decision to publish the results.

References

  1. Hafner, M.; Tagliapietra, S.; Falchetta, G.; Occhiali, G. Renewables for Energy Access and Sustainable Development in East Africa; SpringerBriefs in Energy; Springer: Cham, Switzerland, 2019. [Google Scholar] [CrossRef]
  2. Bouhal, T.; Agrouaz, Y.; Kousksou, T.; Allouhi, A.; El Rhafiki, T.; Jamil, A.; Bakkas, M. Technical feasibility of a sustainable Concentrated Solar Power in Morocco through an energy analysis. Renew. Sustain. Energy Rev. 2018, 81, 1087–1095. [Google Scholar] [CrossRef]
  3. Adenle, A.A. Assessment of solar energy technologies in Africa-opportunities and challenges in meeting the 2030 agenda and sustainable development goals. Energy Policy 2018, 137, 111180. [Google Scholar] [CrossRef]
  4. Nicholson, S. Climatic and environmental change in Africa during the last two centuries. Clim. Res. 2001, 17, 123–144. [Google Scholar] [CrossRef]
  5. Hochstein, M.P. Geothermal systems along the East-African Rift. Bulletin d’Hydrogéologie 1999, 17, 301–310. [Google Scholar]
  6. Elbarbary, S.; Abdel Zaher, M.; Saibi, H.; Fowler, A.R.; Saibi, K. Geothermal renewable energy prospects of the African continent using GIS. Geotherm. Energy 2022, 10, 8. [Google Scholar] [CrossRef]
  7. Shi, Y.; Rop, E.; Wang, Z.; Jiang, G.; Wang, S.; Hu, S. Characteristics and formation mechanism of the Olkaria geothermal system, Kenya revealed by well temperature data. Geothermics 2021, 97, 102243. [Google Scholar] [CrossRef]
  8. Pasqua, C. Advances in the Exploration of Geothermal Resources of the East Africa Rift System (EARS). Ph.D. Thesis, University of Genoa, Genoa, Italy, 2019; 136p. [Google Scholar]
  9. Moeck, I.S. Catalog of geothermal play types based on geologic controls. Renew. Sustain. Energy Rev. 2014, 37, 867–882. [Google Scholar] [CrossRef]
  10. Abebe, G.H.; Hersir, G.P.; Benediktsdóttir, A.; Geirsson, H. Multi-Dimensional Inversion of Electromagnetic Data from Alalobeda, Tendaho Geothermal Field in NE-Ethiopia and its Geothermal Significance. In Proceedings of the World Geothermal Congress 2020+1, Reykjavik, Iceland, 24–27 October 2021. [Google Scholar]
  11. Omenda, P.A. The geology and geothermal activity of the East African Rift. In Proceedings of the Short Course VII on Exploration for Geothermal Resources, Organized by UNU-GTP, GDC and KenGen, Naivasha, Kenya, 31 October–23 November 2013. [Google Scholar]
  12. Smith, M. Stratigraphic and structural constraints on mechanisms of active rifting in the Gregory Rift, Kenya. Tectonophysics 1994, 236, 3–22. [Google Scholar] [CrossRef]
  13. Craig, T.J.; Jackson, J.A.; Priestley, K.; McKenzie, D. Earthquake distribution patterns in Africa: Their relationship to variations in lithospheric and geological structure, and their rheological implications. Geophys. J. Int. 2011, 185, 403–434. [Google Scholar] [CrossRef]
  14. Stamps, D.S.; Calais, E.; Saria, E.; Hartnady, C.; Nocquet, J.M.; Ebinger, C.J.; Fernandes, R.M. A kinematic model for the East African Rift. Geophys. Res. Lett. 2008, 35, 1–6. [Google Scholar] [CrossRef]
  15. Chorowicz, J. The East African rift system. J. Afr. Earth Sci. 2005, 43, 379–410. [Google Scholar] [CrossRef]
  16. Last, R.J.; Nyblade, A.A.; Langston, C.A. Crustal structure of the East African Plateau from receiver functions and Rayleigh wave phase velocities. J. Geophys. Res. 1997, 102, 24469–24483. [Google Scholar] [CrossRef]
  17. Dugda, M.T.; Nyblade, A.A.; Julia, J.; Langston, C.A.; Ammon, C.J.; Simiyu, S. Crustal structure in Ethiopia and Kenya from receiver function analysis: Implications for rift development in eastern Africa. J. Geophys. Res. 2005, 110, 1–15. [Google Scholar] [CrossRef]
  18. Cornwell, D.G.; Maguire, P.K.H.; England, R.W.; Stuart, G.W. Imaging detailed crustal structure and magmatic intrusion across the Ethiopian Rift using a dense linear broadband array. Geochem. Geophys. Geosyst. 2010, 11, 1–21. [Google Scholar] [CrossRef]
  19. Prodehl, C.; Jacobs, A.W.B.; Thybo, E.; Dindi, E.; Stangl, R. Crustal structure on the northeastern flank of the Kenya rift. Tectonophysics 1994, 236, 271–290. [Google Scholar] [CrossRef]
  20. Prodehl, C.; Ritter, J.R.R.; Mechie, J.; Keller, G.R.; Khan, M.A.; Jacob, B.; Fuchs, K.; Nyambok, I.; Obel, J.; Riaroh, D. The KRISP 94 lithospheric investigation of southern Kenya: The experiments and the main results. Tectonophysics 1997, 278, 121–147. [Google Scholar] [CrossRef]
  21. Camelbeeck, T.; Iranga, M.D. Deep crustal earthquakes and active faults along the Rukwa trough, eastern Africa. Geophys. J. Int. 1996, 124, 612–630. [Google Scholar] [CrossRef]
  22. Mohr, P.A. Nature of the crust beneath magmatically active continental rifts. Tectonophysics 1992, 213, 269–284. [Google Scholar] [CrossRef]
  23. Keller, G.R.; Prodehl, C.; Mechie, J.; Fuchs, K.; Khan, M.A.; Maguire, P.; Mooney, W.; Achauer, U.; Davis, P.; Meyer, R.; et al. The East African rift system in the light of KRISP 90. Tectonophysics 1994, 236, 465–483. [Google Scholar] [CrossRef]
  24. Bosworth, W. Off-axis volcanism in the Gregory rift, east Africa: Implications for models of continental rifting. Geology 1987, 15, 397–400. [Google Scholar] [CrossRef]
  25. Ebinger, C.J.; Deco, A.L.; Drake, R.E.; Tesha, A.L. Chronology of Volcanism and Rift Basin Propagation: Rungwe Volcanic Province, East Africa. J. Geophys. Res. 1989, 94, 15785–15803. [Google Scholar] [CrossRef]
  26. Omenda, P.A. The geothermal activity of the East African Rift. In Proceedings of the Short Course IV on Exploration for Geothermal Resources, organized by UNU-GTP, KenGen and GDC, Lake Naivasha, Kenya, 1–22 November 2009. [Google Scholar]
  27. Abbate, E.; Passerini, P.; Zan, L. Strike-slip Faults in a Rift Area: A Transect in the Afar Triangle, East Africa. Tectonophysics 1995, 241, 67–97. [Google Scholar] [CrossRef]
  28. Acocella, V.; Abebe, B.; Korme, T.; Barberi, F. Structure of Tendaho Graben and Manda Hararo Rift: Implications for the Evolution of the Southern Red Sea Propagator in Central Afar. Tectonics 2008, 27, TC4016. [Google Scholar] [CrossRef]
  29. Battistelli, A.; Yiheyis, A.; Calore, C.; Ferragina, C.; Abatneh, W. Reservoir engineering assessment of Dubti geothermal field, Northern Tendaho Rift, Ethiopia. Geothermics 2002, 31, 381–406. [Google Scholar] [CrossRef]
  30. Rizzello, D.; Armadillo, E.; Pasqua, C.; Verdoya, M.; Kebede, S.; Mengiste, A.; Giorgis, G.H. Three-dimensional geophysical modelling of the Alalobeda geothermal field. In Proceedings of the 6th African Rift Geothermal Conference, Addis Ababa, Ethiopia, 2–4 November 2016. [Google Scholar]
  31. Maggi, A.; Jackson, J.A.; McKenzie, D.; Priestley, K. Earthquake focal depths, effective elastic thickness, and the strength of the continental lithosphere. Geology 2000, 28, 495–498. [Google Scholar] [CrossRef]
  32. Pasquale, V.; Chiozzi, P.; Verdoya, M. Tectonothermal processes and mechanical strength in a recent orogenic belt: Northern Apennines. J. Geophys. Res. 2010, 115, 1–17. [Google Scholar] [CrossRef]
  33. Didana, Y.L.; Thiel, S.; Heinson, G. Three-dimensional conductivity model of the Tendaho High Enthalpy Geothermal Field, NE Ethiopia. J. Volcanol. Geotherm. Res. 2015, 290, 53–62. [Google Scholar] [CrossRef]
  34. Pasqua, C.; Armadillo, E.; Rizzello, D.; Verdoya, M.; Chiozzi, P.; Kebede, S. Integrated analysis of geochemical and geophysical data from Alalobeda geothermal field Northern Afar region. In Proceedings of the 6th African Rift Geothermal Conference, Addis Ababa, Ethiopia, 2–4 November 2016. [Google Scholar]
  35. Giggenbach, W.F. Geothermal solute equilibria. Derivation of Na-K-Mg-Ca geoindicators. Geochim. Cosmochim. Acta 1988, 52, 2749–2765. [Google Scholar] [CrossRef]
  36. Waichel, B.L.; de Lima, E.F.; Sommer, C.A.; Lubachesky, R. Peperite formed by lava flows over sediments: An example from the central Paraná Continental Flood Basalts, Brazil. J. Volcanol. Geotherm. Res. 2007, 159, 343–354. [Google Scholar] [CrossRef]
  37. Pellerin, L.; Johnston, J.M.; Hohmann, G.W. A numerical evaluation of electromagnetic methods in geothermal exploration. Geophysics 1996, 61, 121–130. [Google Scholar] [CrossRef]
  38. Ussher, G.; Harvey, C.; Johnstone, R.; Anderson, E. Understanding the resistivities observed in geothermal systems. In Proceedings of the World Geothermal Congress 2000, Kyushu-Tohoku, Japan, 28 May–10 June 2000. [Google Scholar]
  39. Anderson, E.; Crosby, D.; Ussher, G. Bull’s eye!—Simple resistivity imaging to reliably locate the geothermal reservoir. In Proceedings of the World Geothermal Congress, Kyushu-Tohoku, Japan, 28 May–10 June 2000; pp. 909–914. [Google Scholar]
  40. Stimac, J.; Armadillo, E.; Kebede, S.; Zemedkun, M.; Kebede, Y.; Teclu, A.; Rizzello, D.; Mandeno, P.E. Integration and Modeling of Geoscience Data from the Tendaho Geothermal Area, Afar Rift, Ethiopia. In Proceedings of the 5th African Rift geothermal Conference, Arusha, Tanzania, 29–31 October 2014. [Google Scholar]
  41. Tessema, A.; Antoine, L.A.G. Processing and interpretation of the gravity field of the East African Rift: Implication for crustal extension. Tectonophysics 2004, 394, 87–110. [Google Scholar] [CrossRef]
  42. Leat, P.T. Geological evolution of the trachytic caldera volcano Menengai, Kenya rift valley. J. Geol. Soc. 1984, 141, 1057–1069. [Google Scholar] [CrossRef]
  43. Mungania, J. Overview of the Geology of Menengai Volcanic Complex; Internal Report; Kenya Electricity Generating Company: Nairobi, Kenya, 1999. [Google Scholar]
  44. Mibei, G.; Lagat, J. Structural controls in Menengai geothermal field. In Proceedings of the Kenya Geothermal Conference, Nairobi, Kenya, 21–23 November 2011. [Google Scholar]
  45. Omondi, C. Borehole Geology and Hydrothermal Mineralization of Wells MW-01 and MW-02, Menengai Geothermal Field, Central Kenya Rift Valley; Report, Number 30; United Nation University, Geothermal Training Program: Reykjavik, Iceland, 2011. [Google Scholar]
  46. Lagat, J. Geothermal surface exploration approach: Case study of Menengai geothermal field, Kenya. In Proceedings of the Kenya Geothermal Conference, Nairobi, Kenya, 21–23 November 2011. [Google Scholar]
  47. Kanda, I.; Fujimitsu, Y.; Nishijima, J. Geological structures controlling the placement and geometry of heat sources within the Menengai geothermal field, Kenya as evidenced by gravity study. Geothermics 2019, 79, 67–81. [Google Scholar] [CrossRef]
  48. Wheildon, J.; Morgan, P.; Williamson, K.H.; Evans, T.R.; Swanberg, C.A. Heat flow in the Kenya rift zone. Tectonophysics 1994, 236, 131–149. [Google Scholar] [CrossRef]
  49. Wamalwa, A.M.; Mickus, K.L.; Serpa, L.F. Geophysical characterization of the Menengai volcano, Central Kenya Rift from the analysis of magnetotelluric and gravity data. Geophysics 2013, 78, B187–B199. [Google Scholar] [CrossRef]
  50. Montegrossi, G.; Pasqua, C.; Battistelli, A.; Mwawongo, G.; Ofwona, C. 3D Natural State Model of the Menengai Geothermal System, Kenya. In Proceedings of the World Geothermal Congress 2015, Melbourne, Australia, 19–25 April 2015. [Google Scholar]
  51. Henry, W.J.; Mechie, J.; Maguire, P.K.H.; Khan, M.A.; Prodehl, C.; Keller, G.R.; Patel, J. A seismic investigation of the Kenya Rift Valley. Geophys. J. Int. 1990, 100, 107–130. [Google Scholar] [CrossRef]
  52. Simiyu, S.M.; Keller, G.R. An integrated geophysical analysis of the upper crust of the southern Kenya rift. Geophys. J. Int. 2001, 147, 543–561. [Google Scholar] [CrossRef]
  53. Simiyu, S.M. Application of micro-seismic method to geothermal exploration from the Kenya Rift. In Proceedings of the Short Course VIII on Exploration for Geothermal Resources, Lake Naivasha, Kenya, 31 October–23 November 2009. [Google Scholar]
  54. Ebinger, C.J.; Deino, A.L.; Tesha, A.L.; Becker, T.; Ring, U. Tectonic Controls on Rift Basin Morphology: Evolution of the Northern Malawi (Nyasa) Rift. J. Geophys. Res. 1993, 98, 17821–17836. [Google Scholar] [CrossRef]
  55. Mnjokava, T.; Kimani, A.; Pasqua, C.; Lelli, M.; Marini, L. Geochemistry of Kilambo-Kajala and Ilwalilo Hot Springs, Kiejo-Mbaka Geothermal Prospect, Tanzania. In Proceedings of the 7th African Rift Geothermal Conference, Kigali, Rwanda, 31 October–2 November 2018. [Google Scholar]
  56. Rizzello, D.; Armadillo, E.; Pasqua, C.; Pisani, P.; Mnjokava, T.; Mwano, J.; Makoye, D.; Tumbu, L. Three-dimensional geophysical modelling of Kiejo-Mbaka geothermal field, Tanzania. In Proceedings of the 7th African Rift Geothermal Conference, Kigali, Rwanda, 31 October–2 November 2018. [Google Scholar]
  57. Ebinger, C.J.; Rosendahl, B.R.; Reynolds, D.J. Tectonic model of the Malawi rift, Africa. Tectonophysics 1987, 141, 215–235. [Google Scholar] [CrossRef]
  58. Von Herzen, R.P.; Vacquier, V. Terrestrial heat flow in Lake Malawi, Africa. J. Geophys. Res. 1967, 72, 4221–4226. [Google Scholar] [CrossRef]
  59. Didas, M.M.; Armadillo, E.; Hersir, G.P.; Cumming, W.; Rizzello, D. Regional thermal anomalies derived from magnetic spectral analysis and 3D gravity inversion: Implications for potential geothermal sites in Tanzania. Geothermics 2022, 103, 102431. [Google Scholar] [CrossRef]
Figure 1. Structural sketch of the East African Rift System (EARS). (1) location of the investigated geothermal plays (Alalobeda, Menengai and Kilambo-Ilwalilo); (2) major active faults; (3) volcanoes. MER-Main Ethiopian Rift; ASZ-Aswa shear zone; RR-Rukwa Rift; UR-Usangu Rift; KR-Karonga Rift; VVP-Virunga volcanic province; RVP-Rungwe volcanic province. Inset: major geological elements around the Kilambo-Ilwalilo geothermal play.
Energies 16 01656 g001
Figure 2. Geological map of the Alalobeda geothermal play. Young sedimentary deposits (1); basaltic rocks of the Afar Stratoid Series (2); main faults inferred from geological (3), gravity (4) and magnetotelluric (5) investigations; poorly defined faults (6); positive Bouguer anomaly area (7); hot spring (8); fumarole/steaming ground (9); resistivity cross-sections (PT-03 and PT-07) of Figure 3 (10).
Energies 16 01656 g002
Figure 3. Conceptual model of the Alalobeda geothermal field along the resistivity cross-sections PT-03 and PT-07 (see Figure 2). The location of the tectonic lineaments inferred from the geological investigation (1), MT (2) and gravity surveys (3) is indicated; the grey area (4) is the geothermal reservoir; the MT stations (5), groundwater flow direction (6), fumaroles (7) and hot springs (8) are also indicated. Isoresistivity lines (9), labels are the logarithm of the resistivity value (in Ω m).
Energies 16 01656 g003
Figure 4. Geological–structural sketch of the Menengai caldera. The trace of the section SS1 is shown.
Energies 16 01656 g004
Figure 5. Conceptual model of the Menengai geothermal play along the cross-section SS1 (Figure 4). (1) Earthquake foci after [53]; (2) geothermal boreholes (see Figure 4 for locations) and (3) measured temperatures; (4) groundwater flow direction; (5) main faults; (6) MT stations; (7) isoresistivity lines (labels are the logarithm of the resistivity value, in Ω m); (8) and (9) are the shallow and the deep geothermal reservoirs, respectively.
Energies 16 01656 g005
Figure 6. Geological map of the Kilambo-Ilwalilo geothermal play. (1) sediment cover; (2) volcanics; (3) metamorphic basement; (4) major fault (dashed when inferred from geophysical data) with the indication of downthrown side; (5) minor fault (dashed when inferred) with unclear evidence of downthrown side; (6) minor fault (dashed when inferred) with no evidence of downthrown side; (7) Maar crater rim; (8) cinder cone crater rim; (9) hot spring; (10) fumarole; (11) contour lines of the residual Bouguer anomaly (in mGal); (12) cross-section.
Energies 16 01656 g006
Figure 7. Conceptual model of the Kilambo-Ilwalilo geothermal play along the cross-section A-A’ (Figure 6). (1) Neogene–Recent volcanics; (2) sedimentary cover; (3) metamorphic basement; (4) main fault; (5) hot spring; (6) hydrothermal flow; (7) low-density layers as inferred from gravity modelling; (8) isoresistivity lines (labels are the logarithm of the resistivity value, in Ω m); (9) geothermal reservoir.
Energies 16 01656 g007
Disclaimer/Publisher’s Note: The statements, opinions and data contained in all publications are solely those of the individual author(s) and contributor(s) and not of MDPI and/or the editor(s). MDPI and/or the editor(s) disclaim responsibility for any injury to people or property resulting from any ideas, methods, instructions or products referred to in the content.

