1. Introduction and Background
Rapid advances in technology and an ever-growing population have led global energy demand to increase rapidly in the last decade. Between 2000 and 2040, global energy consumption is expected to increase by 77% [
1], reaching around 740 million terajoules.
Roughly 84% of the world’s primary energy consumption in 2019 was produced from fossil fuels [
2]. These unsustainable resources cause grave effects on the planet including environmental pollution, greenhouse effects, and CO
2 emissions. To ensure a clean and sustainable environment for future generations, governments have realised the importance of investing in greener energy sources, with the UK setting targets to generate 100% of its power from renewable energy by 2035 [
3]. With rapid improvements in technology, decreasing costs of renewable energy resources, and increased competitiveness of battery storage, renewables have become among the most competitive sources of energy in many countries [
4].
Many sectors have produced great research interest in energy harvesters that convert ambient energy to electrical energy. The energy harvester absorbs and stores ambient energy from external sources such as solar panels, thermal energy, and kinetic energy for use in low-power electronic equipment. Researchers have recently started to extract electrical energy from the surrounding environment using many approaches, including hydroelectric [
5], electromagnetic [
6], piezoelectric [
7], solar [
8], and thermoelectric [
9].
In the UK, 43% of the 312 TWh of domestic power was generated using renewable energy in 2020 [
3]. Solar (photovoltaics) was the dominant provider, accounting for roughly 81%, with wind and hydro only accounting for 11% and 3%, respectively [
10]. The low contribution from hydro considering the large amount of potential and kinetic energy available from excessive rainfall and the accessibility of ocean waves around the UK each year can be justified by the flat surface in the UK. On average, it rains for 156.2 days a year with an annual rainfall of about 1154 mm [
11]. Whilst there is a range of research for energy generation using hydro harvesting of tides and waves, there is little research into energy harvesting from rainwater; therefore, this was the main focus of this study.
The rainwater that flows down the gutters and into the downspouts is seen as a waste of tremendous potential energy. To mitigate this possible energy loss, an alternate recycling process is required. Instead of allowing rainwater to run freely down the drain, it is preferable for the environment to transform it into useable energy such as electrical energy.
Capturing rainwater and passing it through a micro-hydro turbine (MHT) is one method of converting rain energy to electricity. A rooftop rainwater energy-collecting system harnesses falling raindrops to generate power. Utilising rotating devices such as hydro turbines, energy is extracted from raindrops [
12]. Hydro turbines are often used as spinning generators in conventional rainwater harvesters. Hydro turbines are often split into impulse turbines (Pelton and Turgo) and reaction turbines (Kaplan and Francis) [
12]. Various water turbines have been created and deployed to capture rooftop rain energy depending on various water-head conditions (adjustment for building height) and other real-time environmental factors [
13].
When looking at previous methods of harvesting the potential energy from rain, the two main methods have been to attach piezoelectric materials to elastic structures to capture the vibration energy [
14] and to place a turbine in the flow and harness its kinetic energy [
15]. The turbine design was chosen to take forward into the product design stage as it had greater efficiency than the piezoelectric material.
The main barrier to the more general use of hydrokinetic power to produce energy is the relatively low efficiency of the turbines. Albert Betz [
16] concluded that the theoretical maximum efficiency for a turbine is 59.3%, regardless of the type of turbine. The hydro-turbine best suited to the design depends on the head, flow rate, and stream characteristics of the flow.
For this study, an average two-story building was analysed, with an average height of 6 m [
17]; therefore, a low-head turbine is optimal, as the distance is less than 20 m [
18]. An impulse turbine was assumed to be the most suitable category of turbine, as the flow rate in a downpipe is typically quite low [
18]. Consequently, when looking at the turbine application chart in Jian Chen’s turbine application chart [
19], the optimal turbine to use would be the cross-flow turbine, as it is an impulse turbine which operates at low head and flow. The two main types of cross-flow turbines are the Darrius and the Gorlov turbines. The Darrius is the most commonly used vertical axis turbine; however, more recent studies have found that the efficiency can be increased by 49% by making the blades helical as this reduces the pulsations during rotation as the angle of attack along the blade is always optimised [
20]. This type of turbine is called a Gorlov turbine and was the chosen design for this study. Previous studies found that the NACA4415 aerofoil profile provided a relatively large pressure coefficient and made the blades resistant to cavitation, thereby improving the efficiency of the turbine [
21]. Another study found that both the peak turbine output and the peak water efficiencies are reached at higher tip speed ratios as the solidity decreases [
22]. Therefore, an optimum solidity value of 0.179 was concluded with an efficiency of 23.5%. The paper then found that the desired angle of rotation for a three-bladed micro-turbine with optimum solidity was 60° [
22]. To harness the kinetic energy from the rotating turbine, R.B. Malla considered both a mass–spring–damper and a permanent magnet system in their experiments and found that they produced roughly the same amount of power output [
10]. As the system being considered in this study is on the microscale, the mechanical friction from the moving parts in the mass–spring–damper system could potentially outweigh the rotational motion produced; therefore, it was concluded that using an electromagnetic system would be best for this design.
The UK is among the top 95 countries in the world with more than 1000 mm depth of rainwater. These data mean that at least 95 countries in the world can use this technology to reduce energy production costs, most of which are poor and developing countries. In some regions of the Amazon Forest in Brazil, for instance, it is impossible to transfer energy due to environmental and geographical conditions, but it is possible to provide clean energy even in small quantities by employing the concept presented in this study. As can be seen, there are very limited studies in this field. The lack of extensive studies in this research field is one of the limitations in using this technology practically all over the world. Data regarding the design or selection of the best pump, the feasibility of using mechanical equipment in building architecture, and financial studies related to the cost of energy produced by this method will be needed in the future to speed up the commercialisation of this technology. The aim of the project is to create an optimised micro-hydro turbine system to be placed in the downpipes of homes/office buildings to harness the currently untapped potential energy from rainwater to power appliances. Experimental work was conducted to evaluate the prototype and determine the maximum power output available from such a system. The main objectives of this project were to design a CAD model of a Gorlov vertical-axis turbine in SolidWorks and perform experimental analysis to simulate certain rainfall circumstances. Lastly, this project looked at how the turbines and pipes could be arranged to harvest the maximum energy possible from the system. Further research areas discovered while completing this project are discussed and recommended at the end of this study after analysing the results. This research produced a conceptual model of a turbine system capable of capturing massive amounts of potential energy accessible from falling rainfall in a downpipe, thus providing a foundation for future study into the production of renewable energy from micro-hydro systems. A positive correlation was found between the number of turbines in the pipe and the potential power that might be extracted. By doing this, it is feasible to power somewhat bigger appliances, such as satellite TV boxes.
2. Materials and Methods
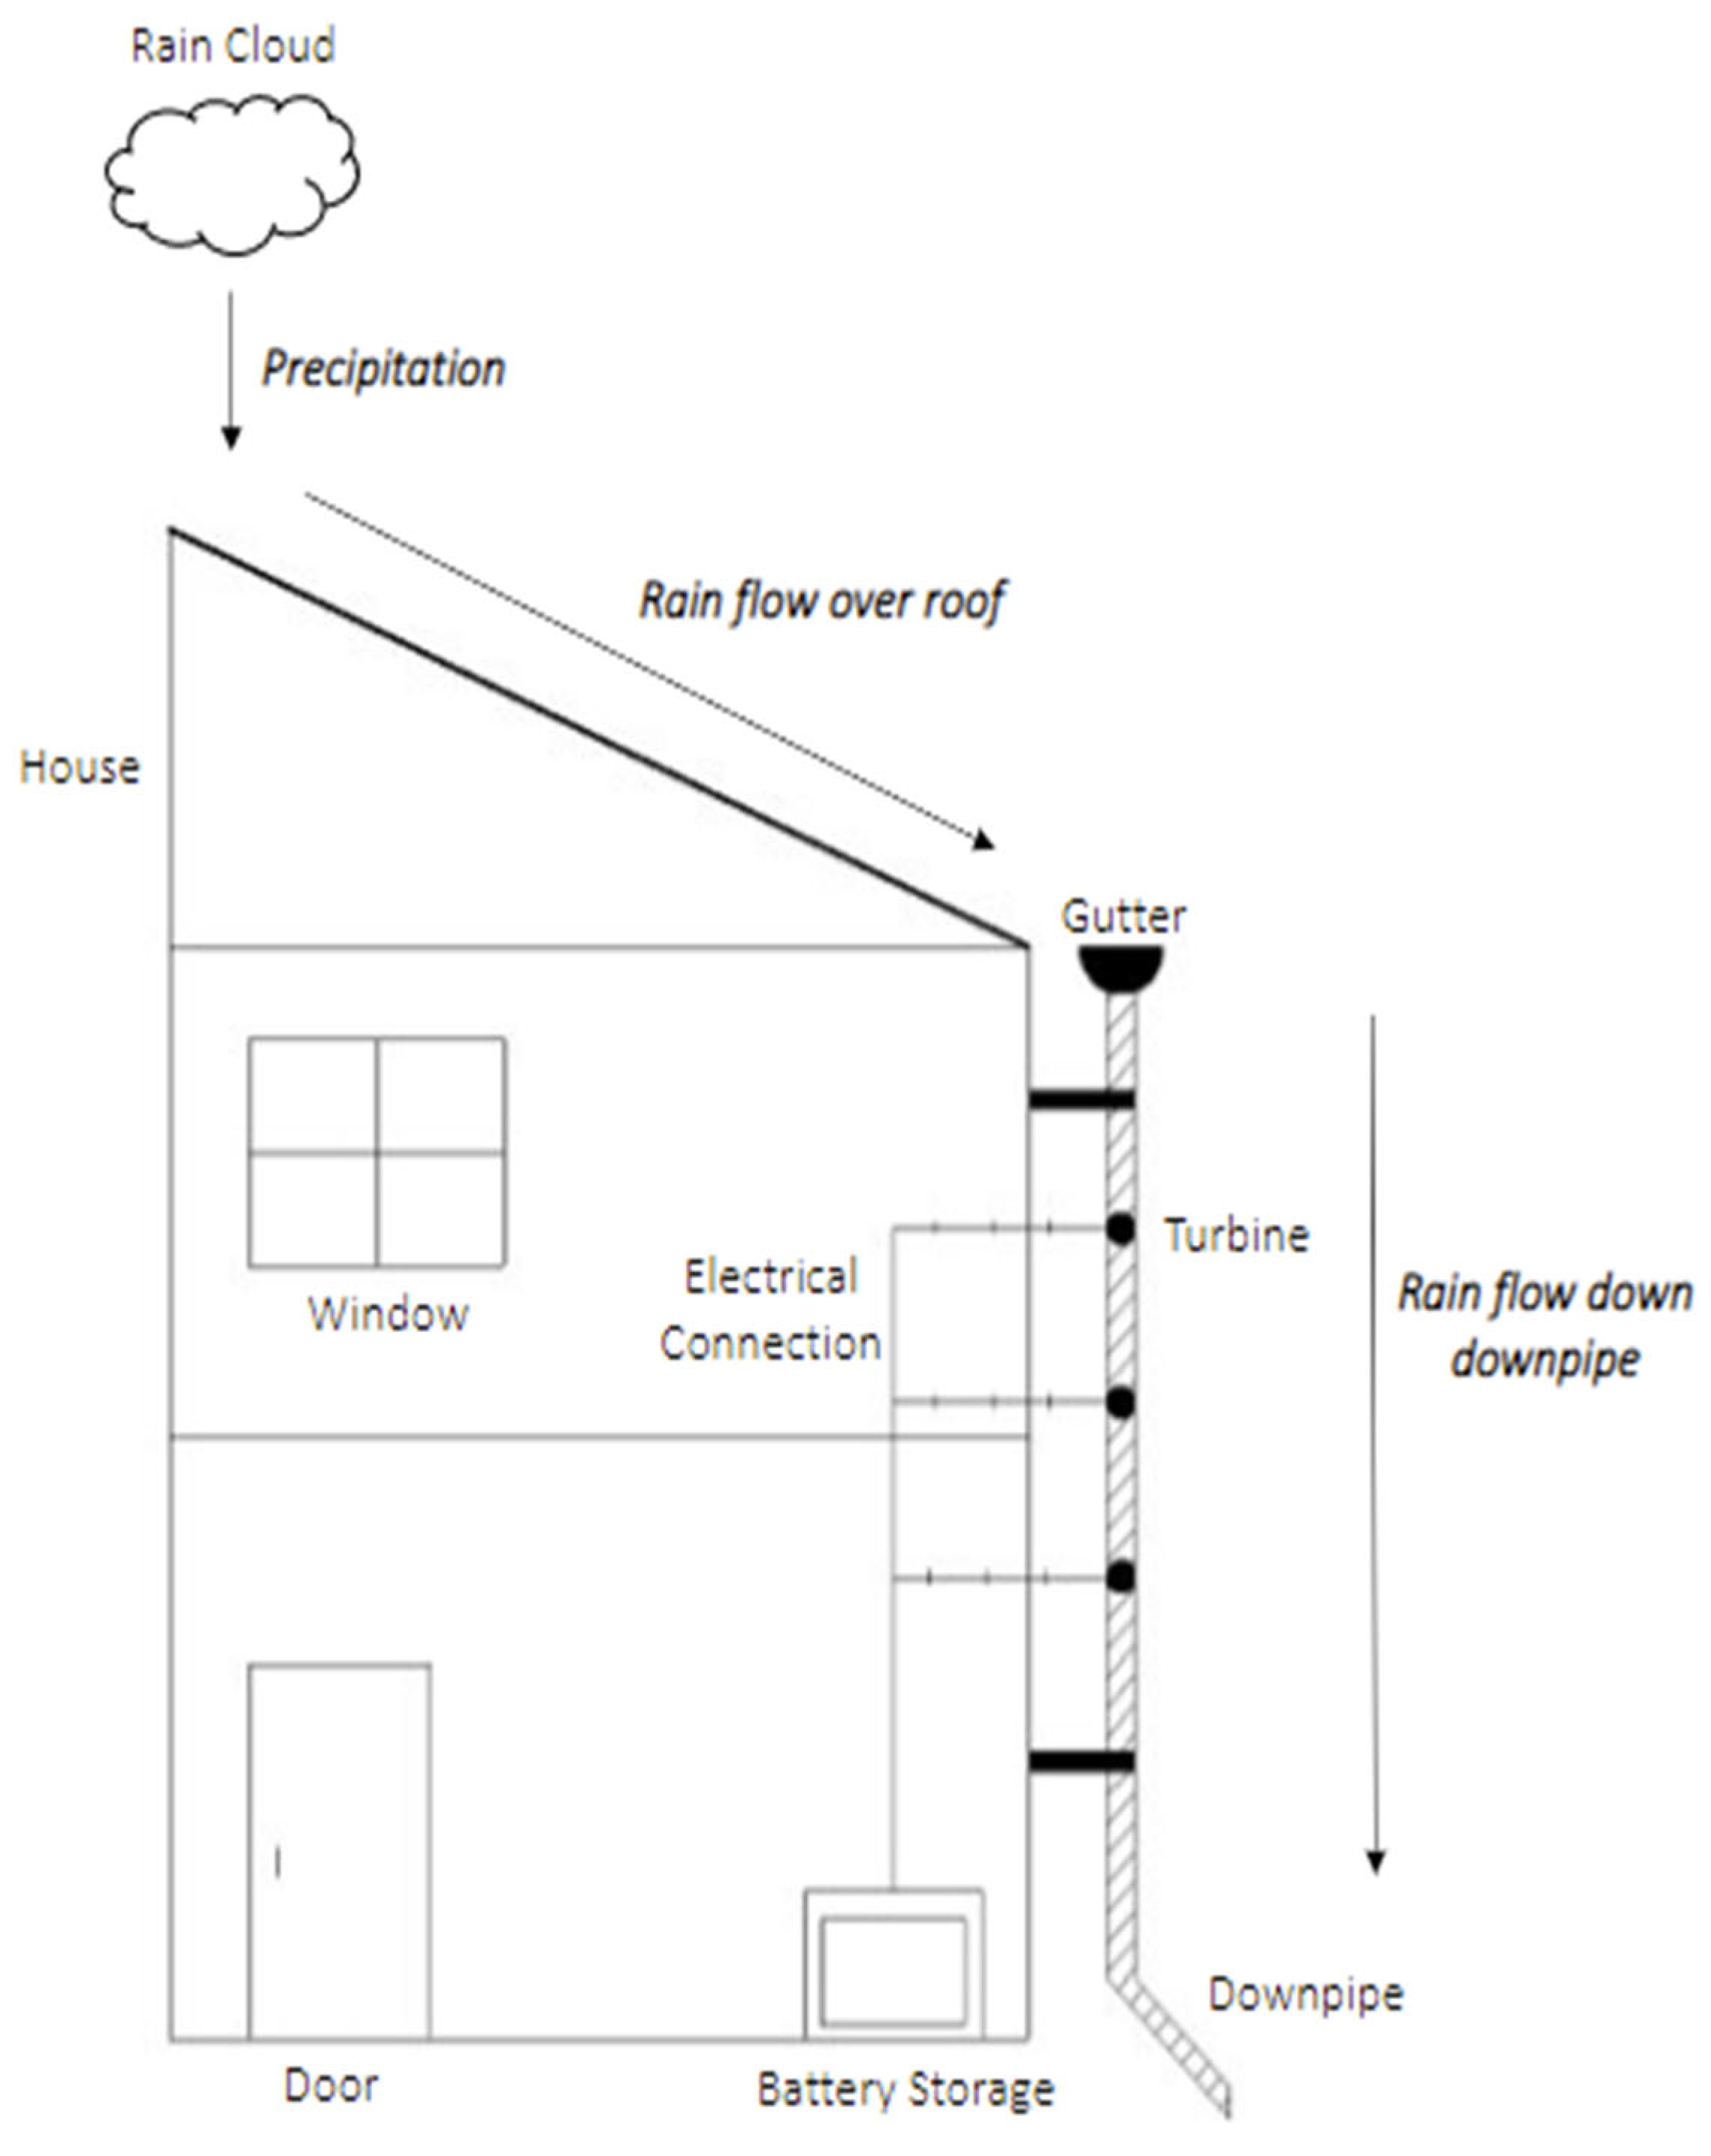
Figure 1 shows how the turbine can be integrated into a housing’s gutter system. Each turbine is connected to a battery storage system which can then be used to power devices within the home. A method to further increase the voltage output produced could be to place the turbines in series along the downpipe and/or placing multiple downpipes around the outside of the building.
Table 1 presents the main subsystems present in a rainwater energy-harvesting system. Common practices of these sub-systems are shown in
Table 2 with a brief description of how and why they are used. These tables help to set out the various sections of the design and their importance to the overall working of the system. Common types of each subsystem are analysed through a literature review to determine the optimum design for the energy-harvesting system.
2.1. Methods
This study utilised a hydraulic bench to simulate 13 different flow rates of water over the micro-turbine to test the power generation of the system. The assumptions of this test study were as follows:
The maximum flow rate of the bench was 0.667 L/s; therefore, a range of flow rates between 10 L/min (0.167 L/s) and 40 L/min (0.667 L/s) with increments of 2.5 L/min (0.0417 L/s) were analysed.
Each test was conducted three times, allowing the turbine to come to rest between each measurement to ensure that the starting characteristics were included each time.
An average of the three results was then calculated, and all recorded data was plotted in a line graph.
Equipment used in the test study was as follows:
The turbine and pipe setup were stabilised on a hydraulic bench using clamps as shown in
Figure 2.
A small inlet pipe, of diameter 11 mm, was used to direct the flow of water from the bench into the pipe and was held in place using clamps.
The magnitude of the flow rate was adjusted using the red handle in
Figure 2b.
To get the wanted flow rate, the handle was adjusted to a general position, and the flow rate was measured by reading the water level in the meter shown in
Figure 2b after 1 min, timed on a stopwatch. The handle was then gently adjusted, and the flow rate was measured again using the same method until the wanted flow rate was found. “Sure Grip” clips were used to connect the coil of wire to the voltmeter so that the voltage generated by the system could be measured. The inlet pipe was then positioned over the turbine using the clamps, and the highest output EMF over a 1 min time period was recorded. For each flow rate, three measurements were taken, removing the flow from the turbine, and allowing it to come to rest between each reading to ensure that the starting characteristics of the aerofoil were accounted for each time. This whole process was repeated for each flow rate, and all data were recorded in a spreadsheet. The average EMF output for each flow rate was calculated, and all data were plotted in line graphs to show the relationship between increasing flow rate and output power.
When conducting the experiment, the fluid was originally allowed to flow over the whole turbine; however, when this approach was taken, the turbine did not rotate. This could be because the forward blades could not overcome the opposing forces of the flow acting on the back of the turbine due to their small thickness. To overcome this, the inlet pipe of the water flow was used as a nozzle to direct the flow over the correct portion of the aerofoil to get the best results.
The inlet pipe was kept in place using clamps so that it was in the same position for each reading. However, when moving the flow off the blades to allow the turbine to come to rest between measurements, the clamps could have moved slightly, thereby changing the area in which the water hit the turbine and affecting the results. This was taken into consideration when analysing the data.
The AC voltage generated by the electromagnetic system could not be converted into DC voltage using a diode because the internal resistance of the diode would use a greater amount of voltage than was generated per second. Therefore, in the experiment, the AC voltage output was recorded instead. For use in practice, multiple turbines would need to be used to generate sufficient AC that could be converted into DC using a rectifier. This DC voltage can then be used to power household devices.
2.2. Theory
2.2.1. Flow Rate of Rainwater
The flow rate of water through a pipe can be determined using Equation (1).
To find the rate of flow of water over the turbine, the flow rate across the roof and in the gutter must first be determined. The average rainfall in the UK is 1154 mm/year per m
2 (3.205 mm/day) [
11], and the average area of a roof in the UK is 73.49
[
23]. Therefore, the flow rate of rainwater over the roof can be calculated as 2.726 × 10
−6 , and the velocity can be calculated as 3.39 × 10
−3 , assuming that the gutter is half full.
When calculating the flow rate in the guttering, the friction due to viscous shear stresses between the fluid and the walls of the guttering must be accounted for using the Darcy–Weisbach friction factor and head loss [
12]. The gravitational constant,
g, is taken as 9.81
.
The flow rate in the guttering after accounting for frictional head loss can then be calculated using Equation (4).
The velocities and flow rates at different heights in the pipe are then calculated by rearranging the energy conservation equation.
2.2.2. Turbine Power
The tip speed ratio (TSR) of a Gorlov turbine is typically between 2 and 2.5; therefore, a value of 2.25 was chosen for this experiment [
24].
For a three-bladed Gorlov turbine with the aerofoils placed at a distance r from the centre of rotation, the relationship between the normal (flow speed, v) and tangential (blade tip speed, U) velocities acting on the blade is shown in
Figure 2 of Shiono et al.’s study “An experimental study of the characteristics of a Darrieus turbine for tidal power generation” [
23]. The relative speed can, therefore, be found using the following equation:
where
λ is the tip speed ratio, and
θ is the angle of rotation of the blades. The angle of attack,
α, is calculated between the centre line of the blade, and the direction of flow and is determined by
The force acting on the blade due to the contact with the fluid is made up of the drag force acting along the line of
W and the lift force acting normal to the relative speed.
where
ρ is the density of the fluid, A is the area of the aerofoil, and C_L and C_D are the lift and drag coefficients, respectively. The total force acting on a three-bladed turbine is, therefore, calculated using Equation (12), as the blades are evenly spaced every 2π/3 radians around the circumference of the side plate.
The power output of the turbine depends on the torque,
τ, and rotational velocity,
ω, of the blades; therefore, the following equations are used:
2.2.3. Magnetic Induction Power Output
Induction generators use the principle of electromagnetic induction to convert the kinetic rotational energy of a magnet into electrical energy in a coil of wire. Electromagnetic induction is when a current is produced in a wire due to a potential difference being created as a result of a changing magnetic field [
13]. The induction formula, founded by Faraday’s law, is shown in Equation (16), which shows that the electromotive force can be enhanced by increasing the number of turns in the coil or increasing the magnetic flux.
For a rotating magnet to induce a potential difference in a coil of wire, it must be rotating at right angles to the axis, with the north and south poles turning over each other. The coil of wire must be as close as possible to the rotating magnet as the field strength reduces exponentially when moving away from the magnet [
25].
As the magnet rotates, the magnetic flux through the coil can be determined in regard to the magnetic field strength
B, area of the coil
A, and number of turns
N.
The maximum electromotive force (EMF) can then be determined as follows:
2.3. The Design
This project utilised SolidWorks to design the turbine, shaft, and casing so that they could easily be converted into files suitable for 3D printing.
For the turbine, the NACA4415 aerofoil coordinates were imported into SolidWorks, and the endpoints were connected to create one solid outline. The chord length was chosen as 90 mm. On the same plane as the aerofoil, one of the side plates, of radius 150 mm and thickness 10 mm, was drawn. The aerofoil was then positioned on the plate, at a distance of 140 mm from the centre of the circle, and at an angle of 60°, as depicted by Mitsuhiro Shiono et al. [
26]. To create the guideline for the extruded sweep of the aerofoil, a helical spiral was drawn from the circumference of the side plate with a start angle of 270° and 0.75 revolutions. This was to ensure that the angle of attack at which the fluid hit the blade was always optimum and did not create structural weakness in the turbine. The depth of the helix was 430 mm. The second plate was then created by mirroring the original through a plane created in the middle of the helix. The circular pattern tool was used to create three blades at equal spacing around the circumference of the side plate, as the turbine had an element of symmetry.
To ensure the part was solid for printing, the “combine” feature was used to blend each individual part together. The “scaling” feature could then be used to reduce the size of the turbine so that it fit snuggly into the downpipe. As mentioned in the literature review, the optimum solidity for a water turbine is 0.179 [
23]. For a turbine being placed in a 68 mm downpipe, the maximum possible diameter is 60 mm, with a radius of 20 mm. Equation (19) can, therefore, be rearranged to show that the optimum chord length is 11.24 mm; however, to ensure the blades were strong enough to withstand the force of the water, a chord length of 16.5 mm was chosen. Consequently, the solidity of the turbine was calculated as 0.263.
where
n is the number of blades,
C is the blade chord length in
m, and
d is the diameter of the turbine in m. Therefore, a scale of 0.13 was applied to the part to reduce it to the required dimensions.
For the experiment, the turbine was 3D-printed on the SLA machine using resin to produce a smooth finish and firm structure. However, if this product is to be used in practice, it would need to be made from fibreglass-reinforced polyester due to its lightweight, strong, and robust properties [
27]. The CAD model of Gorlov turbine is shown in
Figure 3.
The shaft was created by drawing a circle with a diameter of 30 mm in the top plane and extruding it by 60 mm to create the cylindrical shape. To create the sockets for the super-magnets, a plane was created at a 34 mm distance from the original top plane, and a square of 10 mm was drawn. The top line of the square coincided with the top point of the circle to ensure that it enclosed the entire circular circumference of the shaft, shown in
Figure 4.
The square was then extruded by 20 mm so that it would snuggly fit the 20 mm diameter super-magnets. This erased the need for any form of adhesive to hold the magnets in place as their 12.1 kg pull ensured that they attracted each other and stayed secure while the shaft rotated. As there were two super-magnets in the design, the extruded square was mirrored in a plane drawn in the centre of the cylinder.
The shaft was printed on an FDM printer using PLA because it offered a feature to reduce the infill of the structure to 40%. This ensured that the weight of the shaft caused minimal interference with the rotation of the turbine, while maintaining structural stability for the two super-magnets inside. Magnet slots position and CAD model of magnet shaft is shown in
Figure 5.
The casing needed to fit securely against the outside of the downpipe to ensure no water would escape and interfere with the electronics of the electromagnetic induction. Another design specification was that it had to be very thin to allow the super-magnets to be as close as possible to the coil. This is required because the strength of the magnetic field reduces exponentially as the distance away from the magnet increases. To 3D-print the casing, a circle of 38 mm diameter was drawn on the front plane, allowing a gap of 4 mm between the shaft and the casing. The circle was then extruded by 100 mm to ensure it would cut through the entire casing. The outline of the casing was then created on the “right plane”, shown in
Figure 6a, by drawing the shape and extruding it by 21 mm on both sides. To create the pipe indent, the cylinder extrude was converted to a cut extrude. A gap of 2 mm between the shaft and the inner casing was established to accomplish the design specification while allowing sufficient space for rotation.
The casing was 3D-printed using resin on the SLA printer for ease, and it could be made the same way for client use. Caulk was used to secure the casing to the drainpipe and create a waterproof seal. No other support was required for the casing; however, this can easily be adapted.
The kinetic energy of the rotating turbine was harnessed by electromagnetic induction. Two super-magnets were placed into the shaft, and a copper wire was wound around a bobbin 261 times to create a coil. This coil was then placed above the magnets on the outside of the waterproof casing and connected to an output cable using soldering so that the AC voltage produced could be measured using a voltmeter. To increase the strength of the magnetic field, two super-magnets were layered on top of each other, with opposite poles facing inward. This ensured that the magnets were as close to the edge of the shaft and casing as possible and, therefore, the optimum distance from the coil.
Screws were secured to the turbine device but allowed to rotate freely in the holes created in the pipe, thus acting as a rotating shaft while also supporting the structure, as shown in the assembly drawing (
Figure 7) and schematics (
Figure 8a). A 6 mm diameter, 30 mm length steel screw with a washer was used on the turbine side and was secured using a nut. However, on the shaft side, a 6 mm diameter, 30 mm length plastic screw and washers were used to prevent divergence or blockage to the magnetic field from a magnetic metal screw [
28]. The plastic screw was super-glued into the shaft, and 10 plastic washers of 1 mm thickness were placed on the screw between the casing and the shaft to prevent movement backwards and forwards.
To install the device onto the downpipe, a 40 mm hole must first be cut into the pipe where the turbine is to be placed. The turbine can then be screwed into place using the 30 mm length metal screw, and a gutter clip can be used to secure the device to the pipe, as shown in
Figure 8b.
4. Conclusions
4.1. Conclusion of Findings
In this research, it is recommended that an optimised micro-hydro turbine system be installed in the downpipes of residential and commercial buildings in order to capture the latent energy potential of rainwater to power appliances. Experiments were conducted to test the prototype and estimate the system’s maximum available power output. This project’s primary aims were to construct a CAD model of a Gorlov vertical-axis turbine in SolidWorks and conduct experimental analyses to mimic certain rainfall conditions. This study resulted in the creation of a conceptual model of a turbine system that is capable of catching huge quantities of potential energy available from falling rain in a downpipe.
As the flow rate over turbines increases, the potential power output of the system also increases. This represents the fact that a faster flow of the fluid results in a greater magnitude of the potential power available. Moving the pump from the centre of the pipe to the end of the pipe doubles the pump’s output power under conditions of average rainfall intensity. Changing the location of the pump from the top of the pipe to the centre of the pipe boosts output power by up to 90%, even under intense rainfall. This maximises the change in head of the fluid and, therefore, maximises the potential energy that can be harvested. From this study, it was concluded that the single turbine system would only be able to power small household appliances, such as a toothbrush or mobile phone charger. Therefore, further research was conducted into increasing this potential.
A positive correlation was found between the number of turbines in the pipe and the potential power that could be extracted. In doing this, it was possible to power slightly larger appliances, such as satellite TV boxes. However, the results shown in
Table 5 did not consider the effect of each layered turbine on the power generation of the next. Further studies should be conducted on how the initial device influences the turbulence of the water flow, as well as how the increased head affects the flow rate for the lower turbines and the optimum spacing of the turbines.
Placing multiple downpipes around the building further increased the capacity of potential energy that could be harvested. In doing this, it proved possible to power larger appliances or even power multiple devices at the same time. Again, similar questions must be asked about the reliability of the setup; for example, does having multiple pipes in a line affect the volume of water flowing down each pipe? Would placing the gutter at a tilt angle increase the power output?
In conclusion, this study provided a conceptual model of a turbine system that could capture the masses of potential energy available from falling rainwater in a downpipe, thus paving the way for further research into producing renewable energy from micro-hydro systems. Compared to other methods of energy production with non-renewable resources, the installation and operation of this method is much simpler and more economical; in order to commercialise it, more studies should be conducted in the future to overcome its limitations.
4.2. Observations for Further Research
Research into the use of micro-turbines for energy harvesting is still very new; hence, there are a variety of parameters to consider. From this project, it can be seen that further research into the effect of applying a nozzle to direct the flow over the aerofoil, and where to apply it, on the output power generation is a key point of consideration.
The low-efficiency problem of micro-hydro turbines during light rainfall is also still in the early stages of research. Bin Bao and Quan Wang [
5] explored the possibility of rectifying this issue by collecting the water in the gutter to create a greater volume of flow over the turbine, intermittently. This is a great start into the improvement of efficiency for the design; however, further research would result in greater efficiency.
Other parameters affecting the efficiency of the turbine include the angle of attack, the chord length, the twist angle of the blade, and different variations of aerofoils not confined to the NACA series, all of which could be researched further to analyse their effect on the energy-harvesting system and to determine optimal values.
Placing multiple turbines in series was considered in this paper; however, the effect of each turbine on the output generation of the one below should be further researched, and the optimum distance between turbines should be examined. Subsequently, whether changing the angle of attack and aerofoil profile of the turbines placed further down in the downpipe affects efficiency should be analysed.
Alternatively, using a gearing system between the turbine and the shaft containing the super-magnets could increase the rotation of the shaft and, therefore, increase the maximum power output of the system.


