
Quantitative Characterization of Pore Structure Parameters in Coal Based on Image Processing and SEM Technology

Abstract
:
1. Introduction
2. Sample and Methodology
2.1. Sample
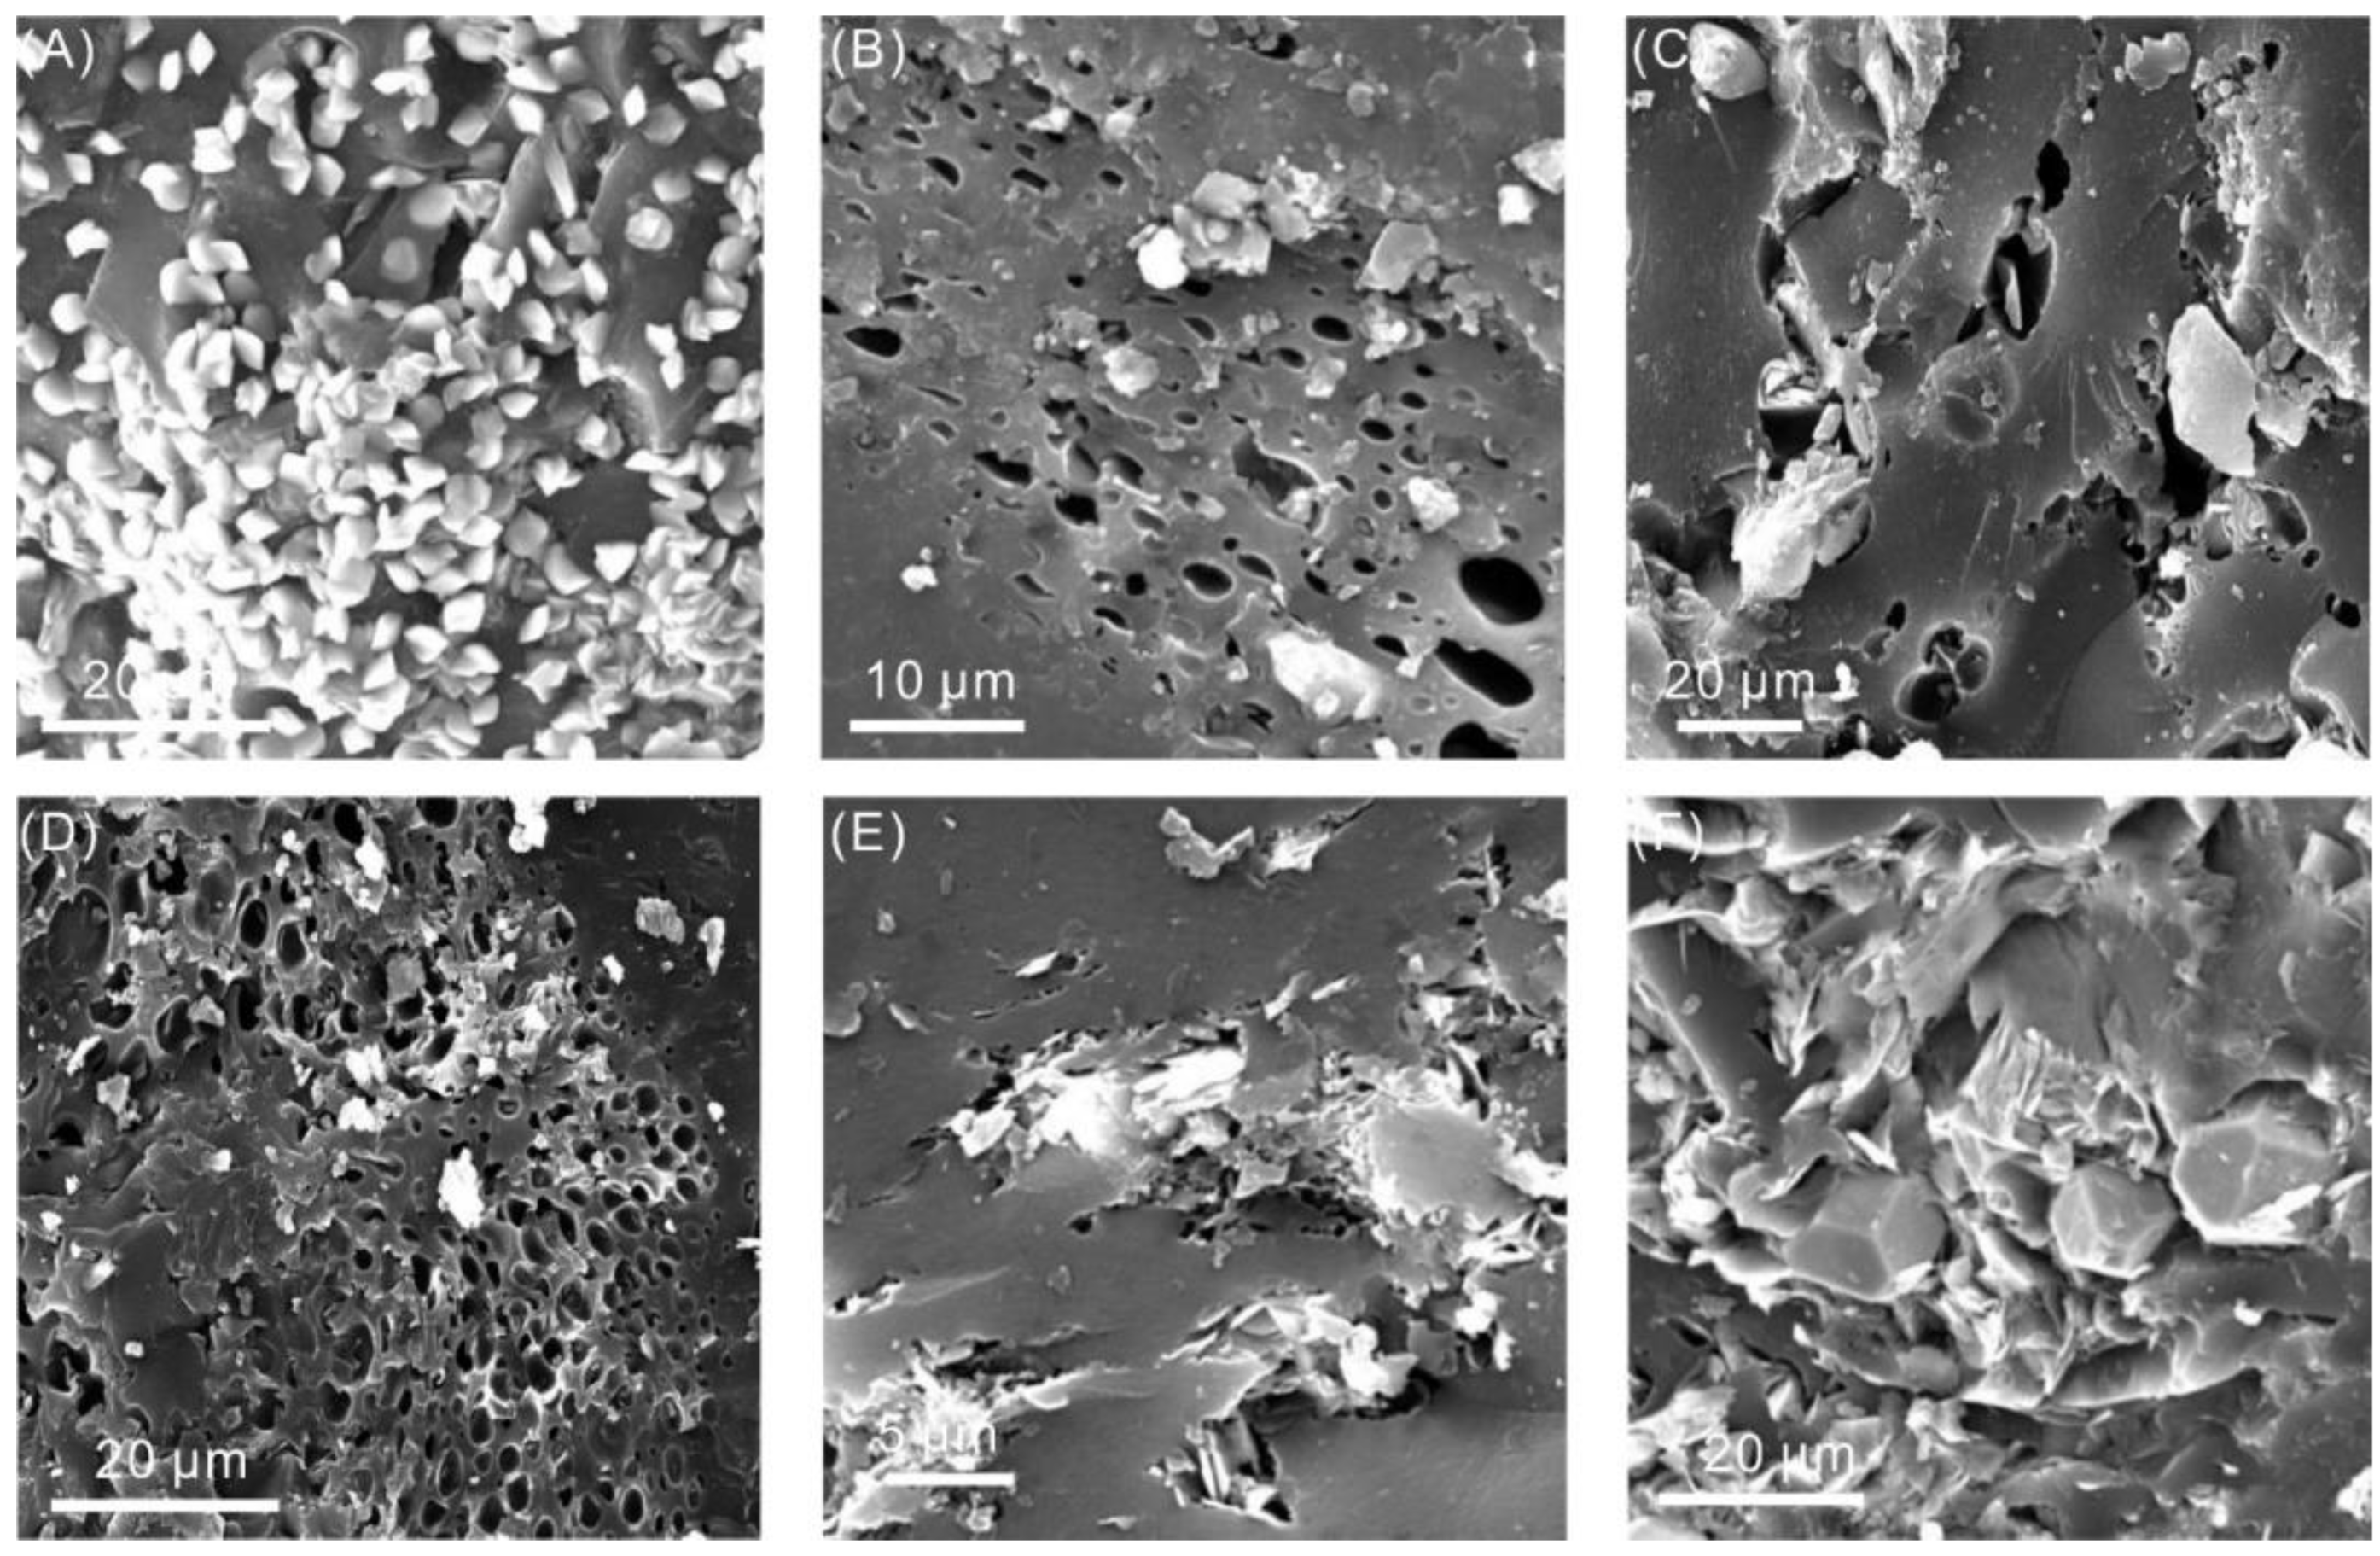
2.2. SEM Image
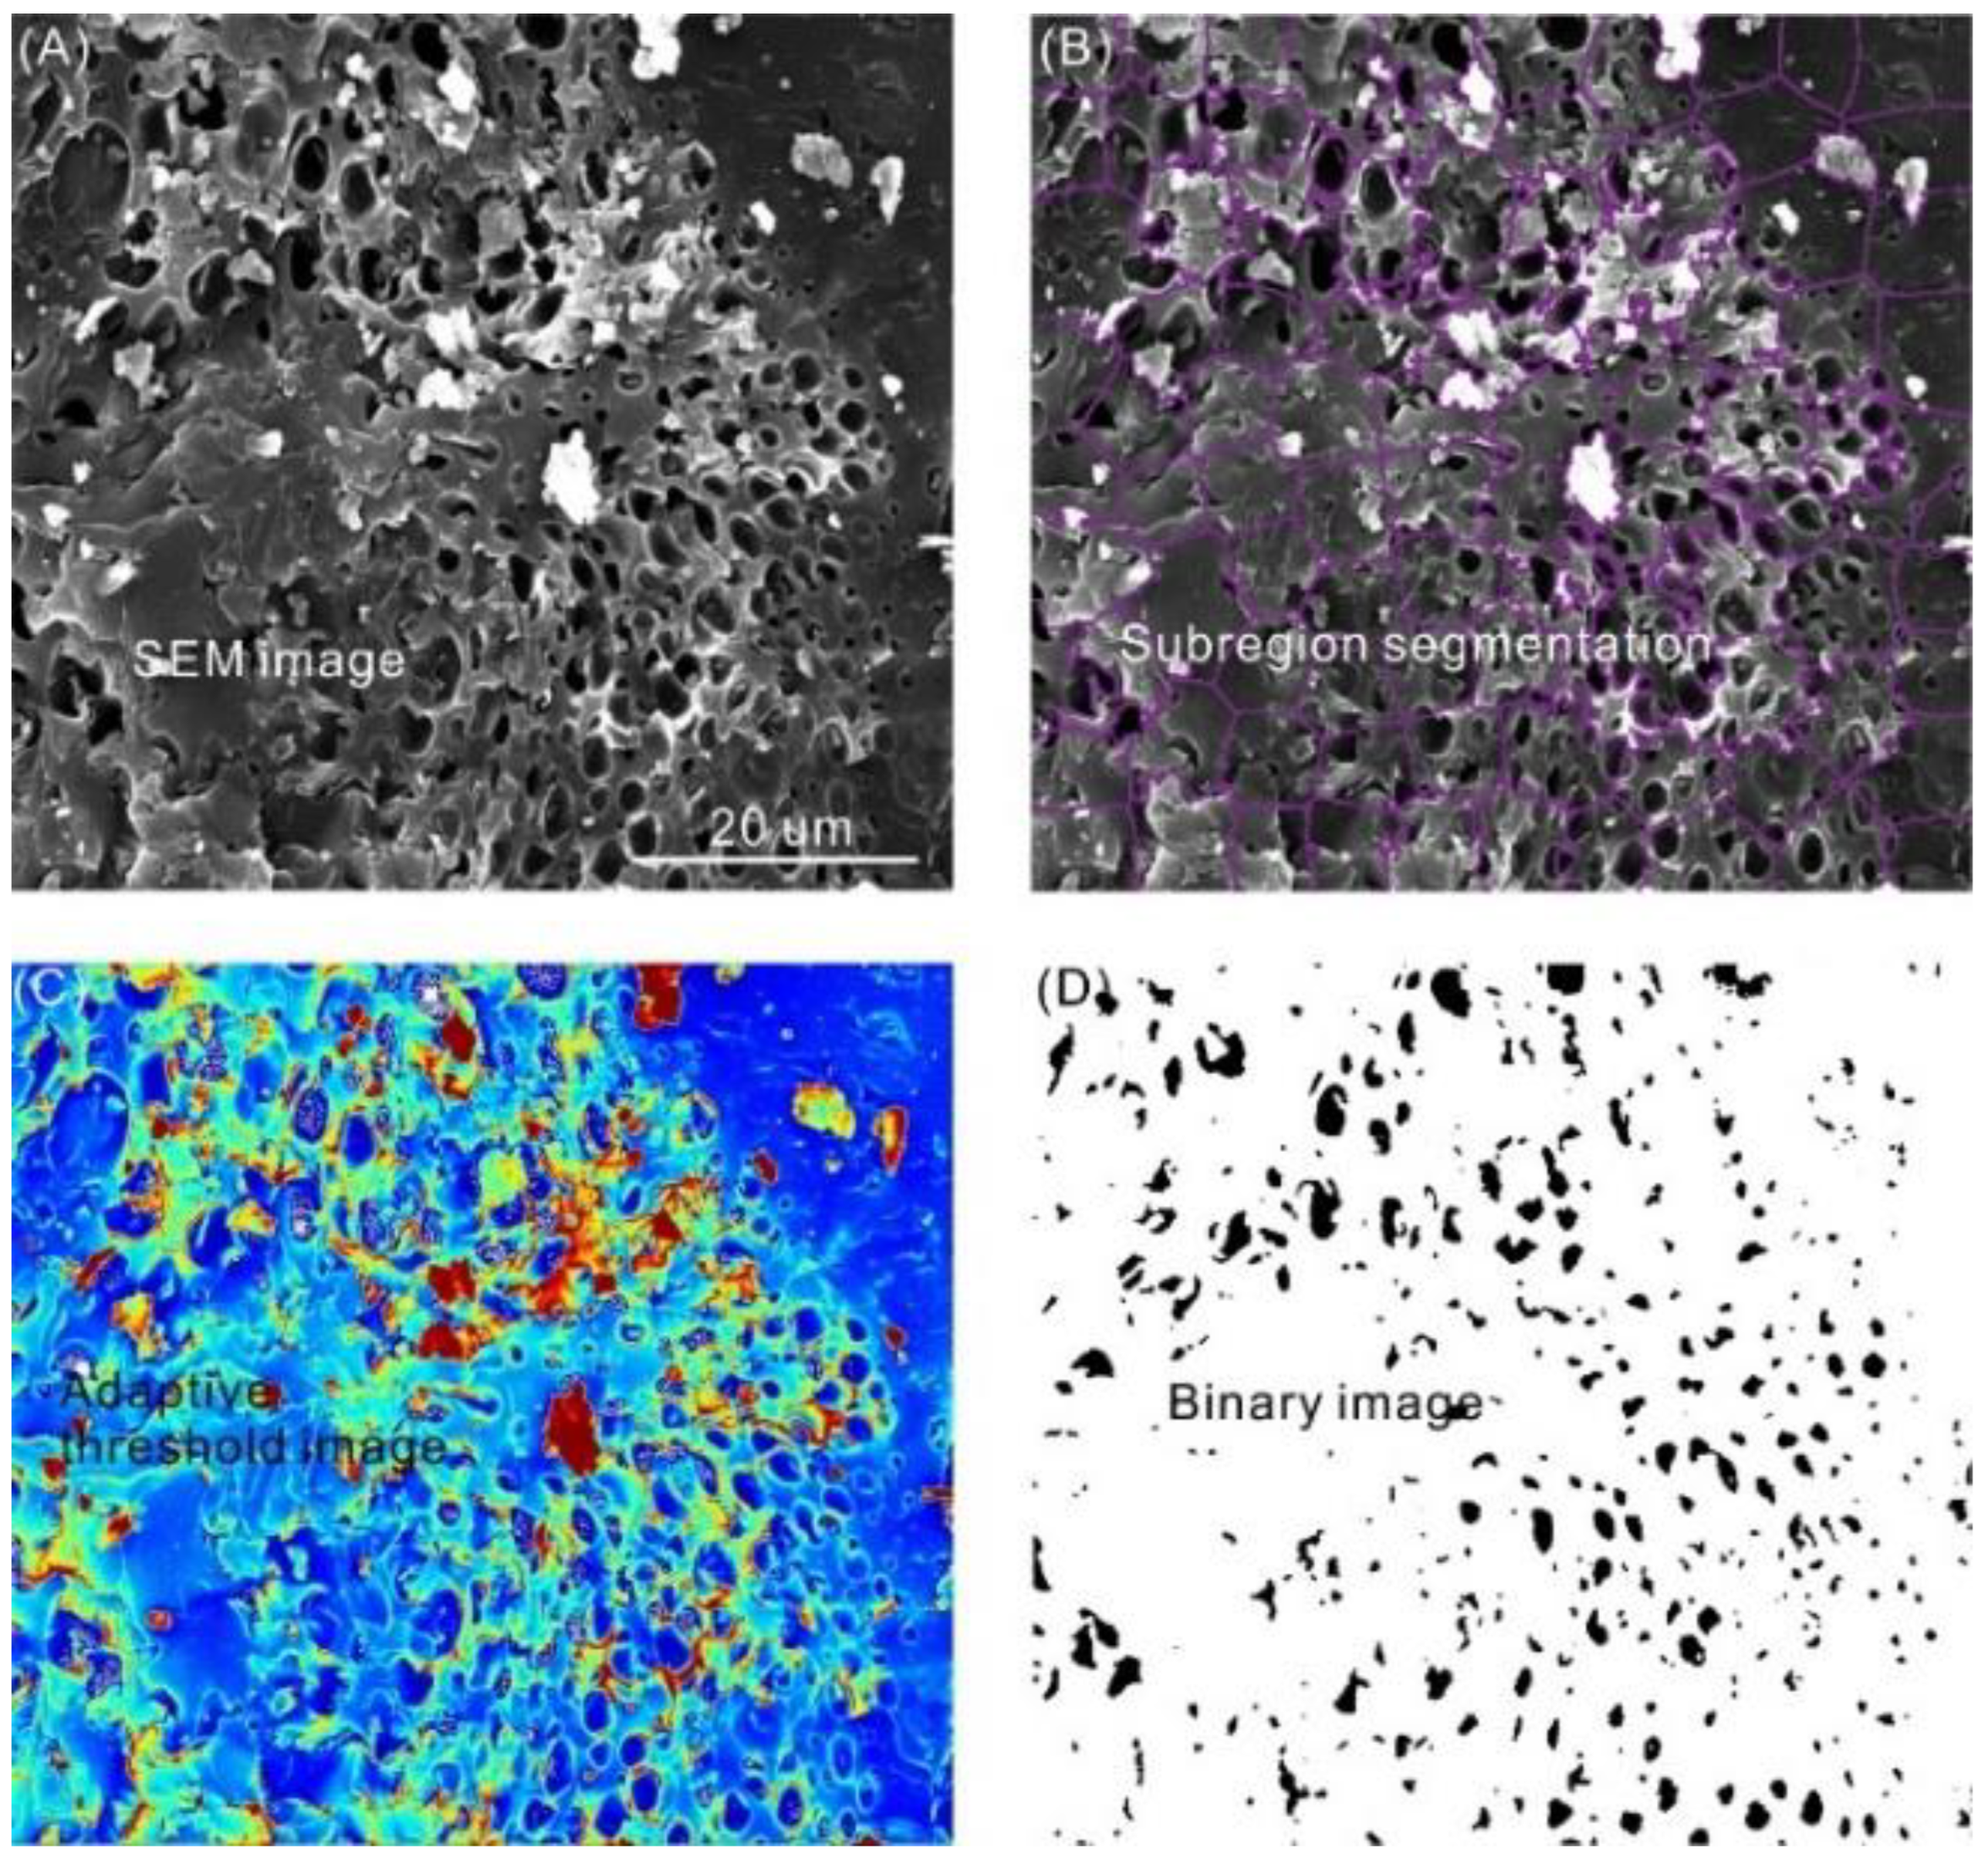
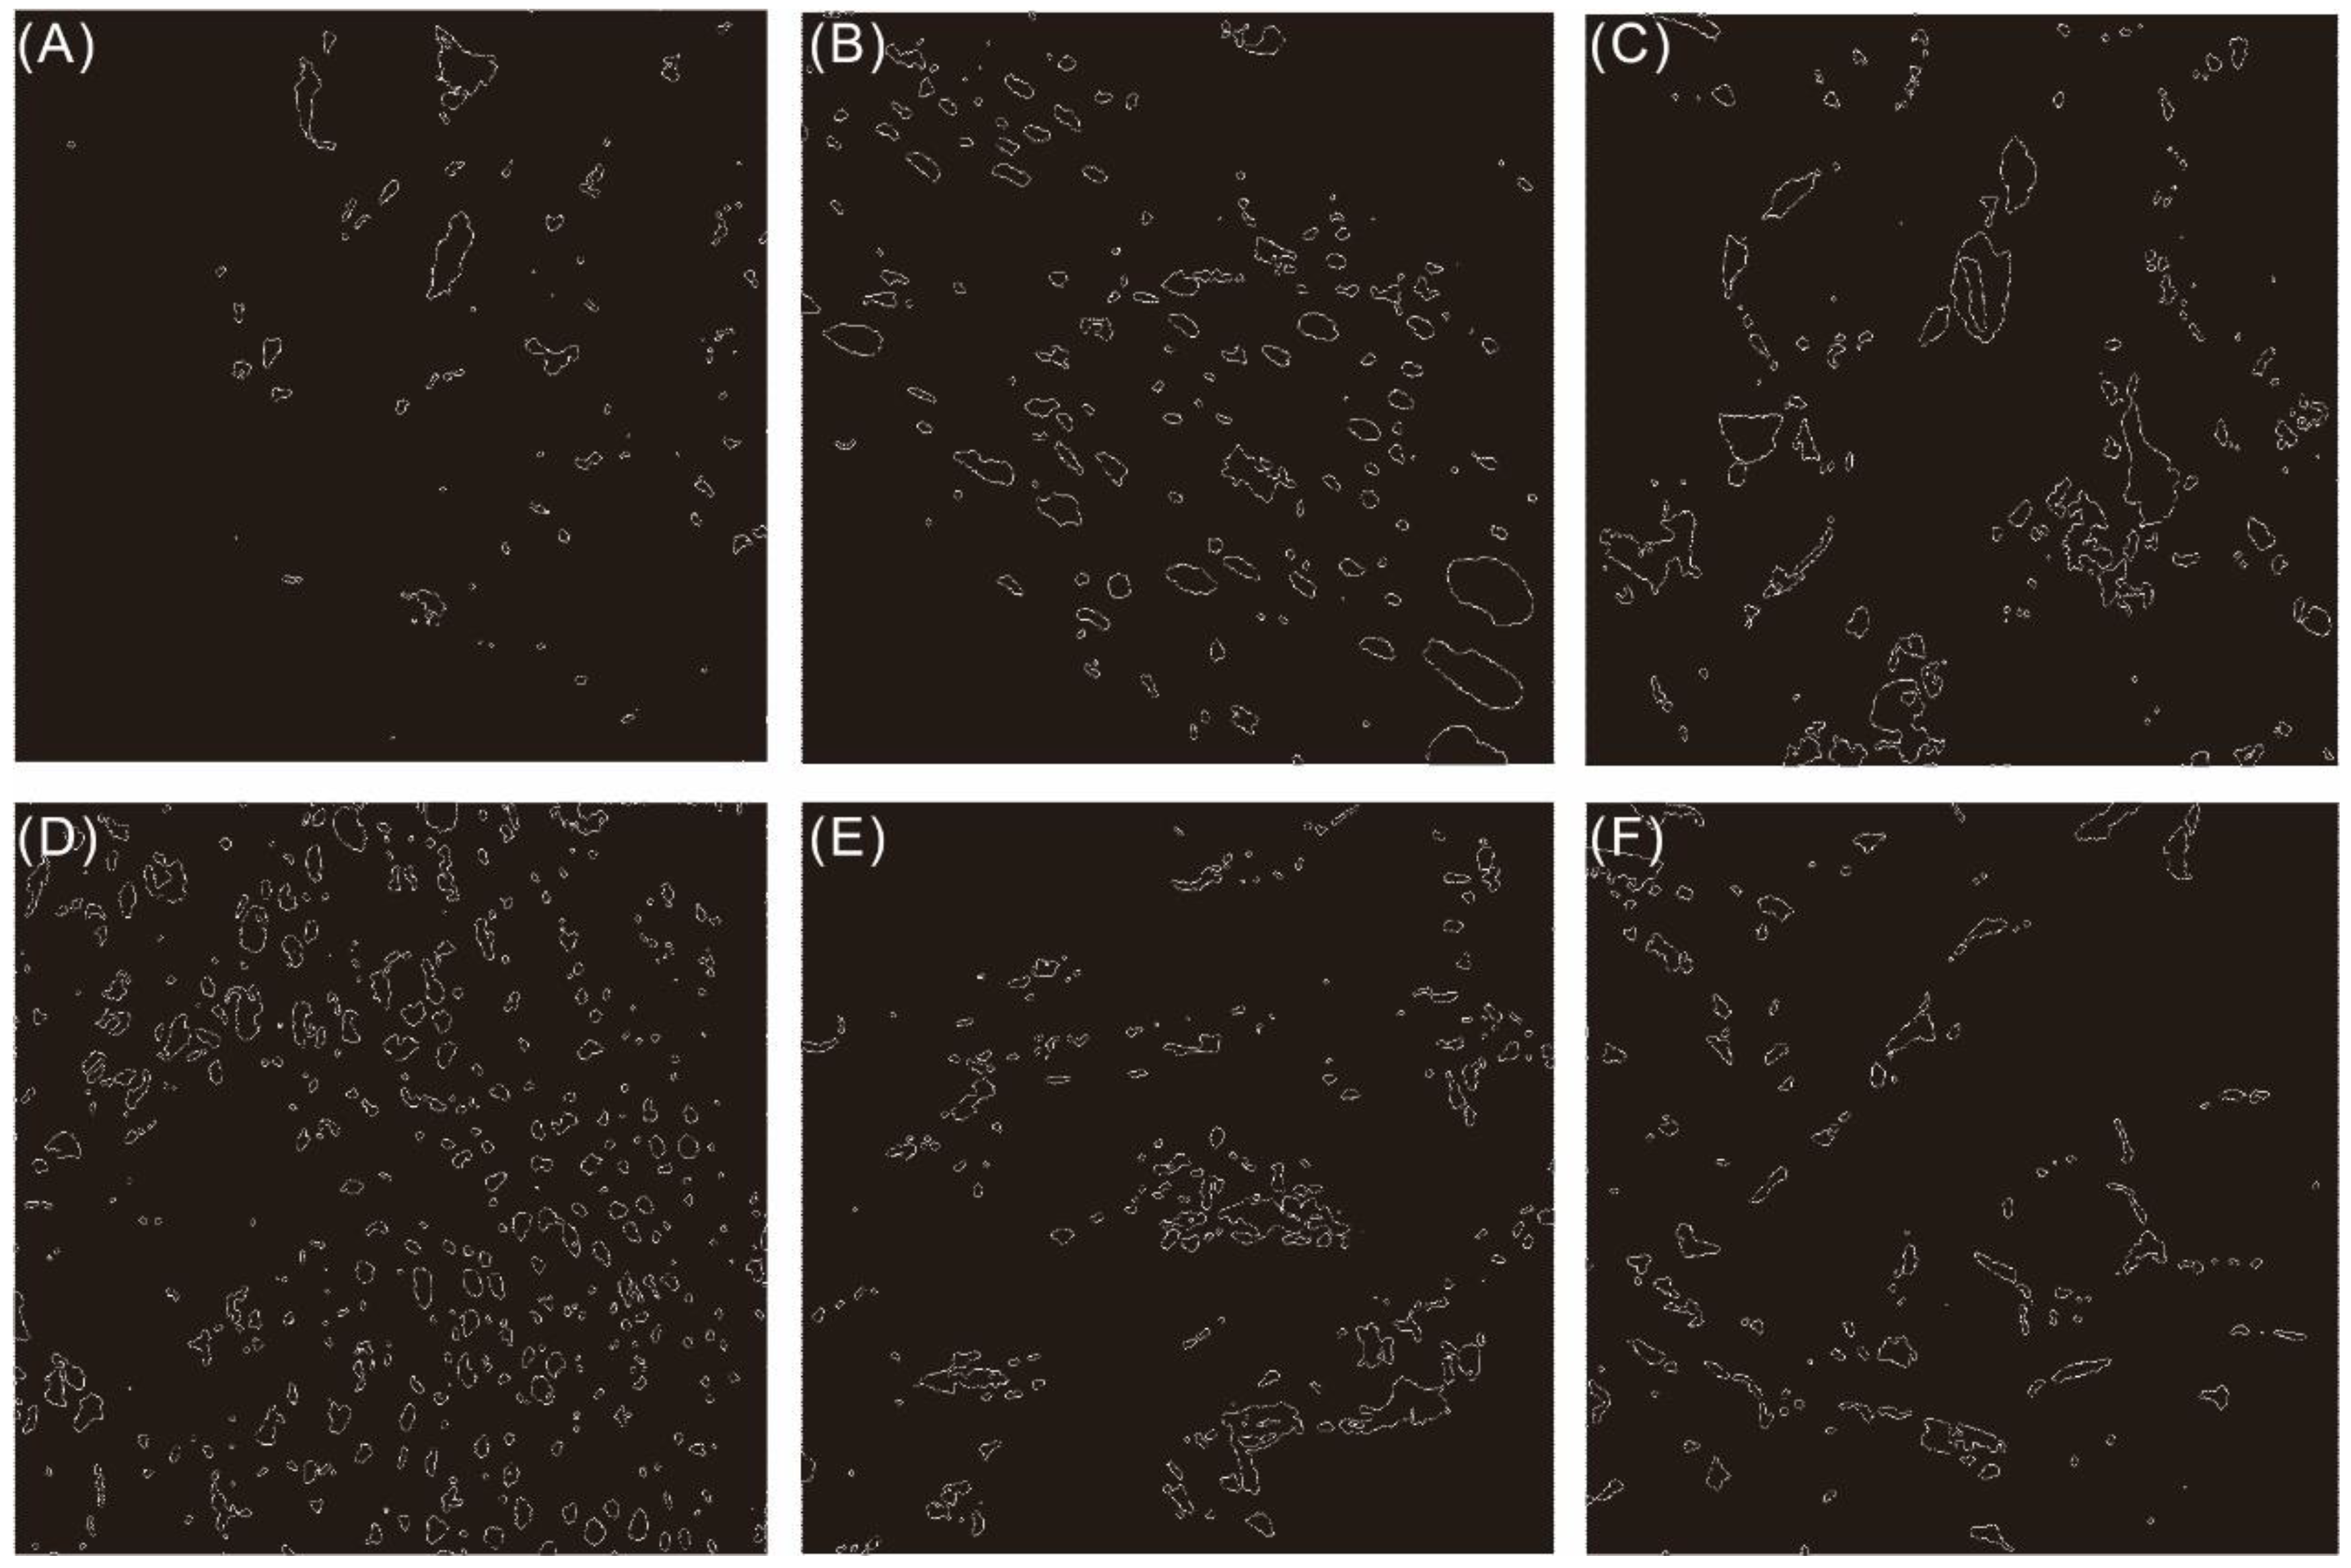
2.3. Image Binarization
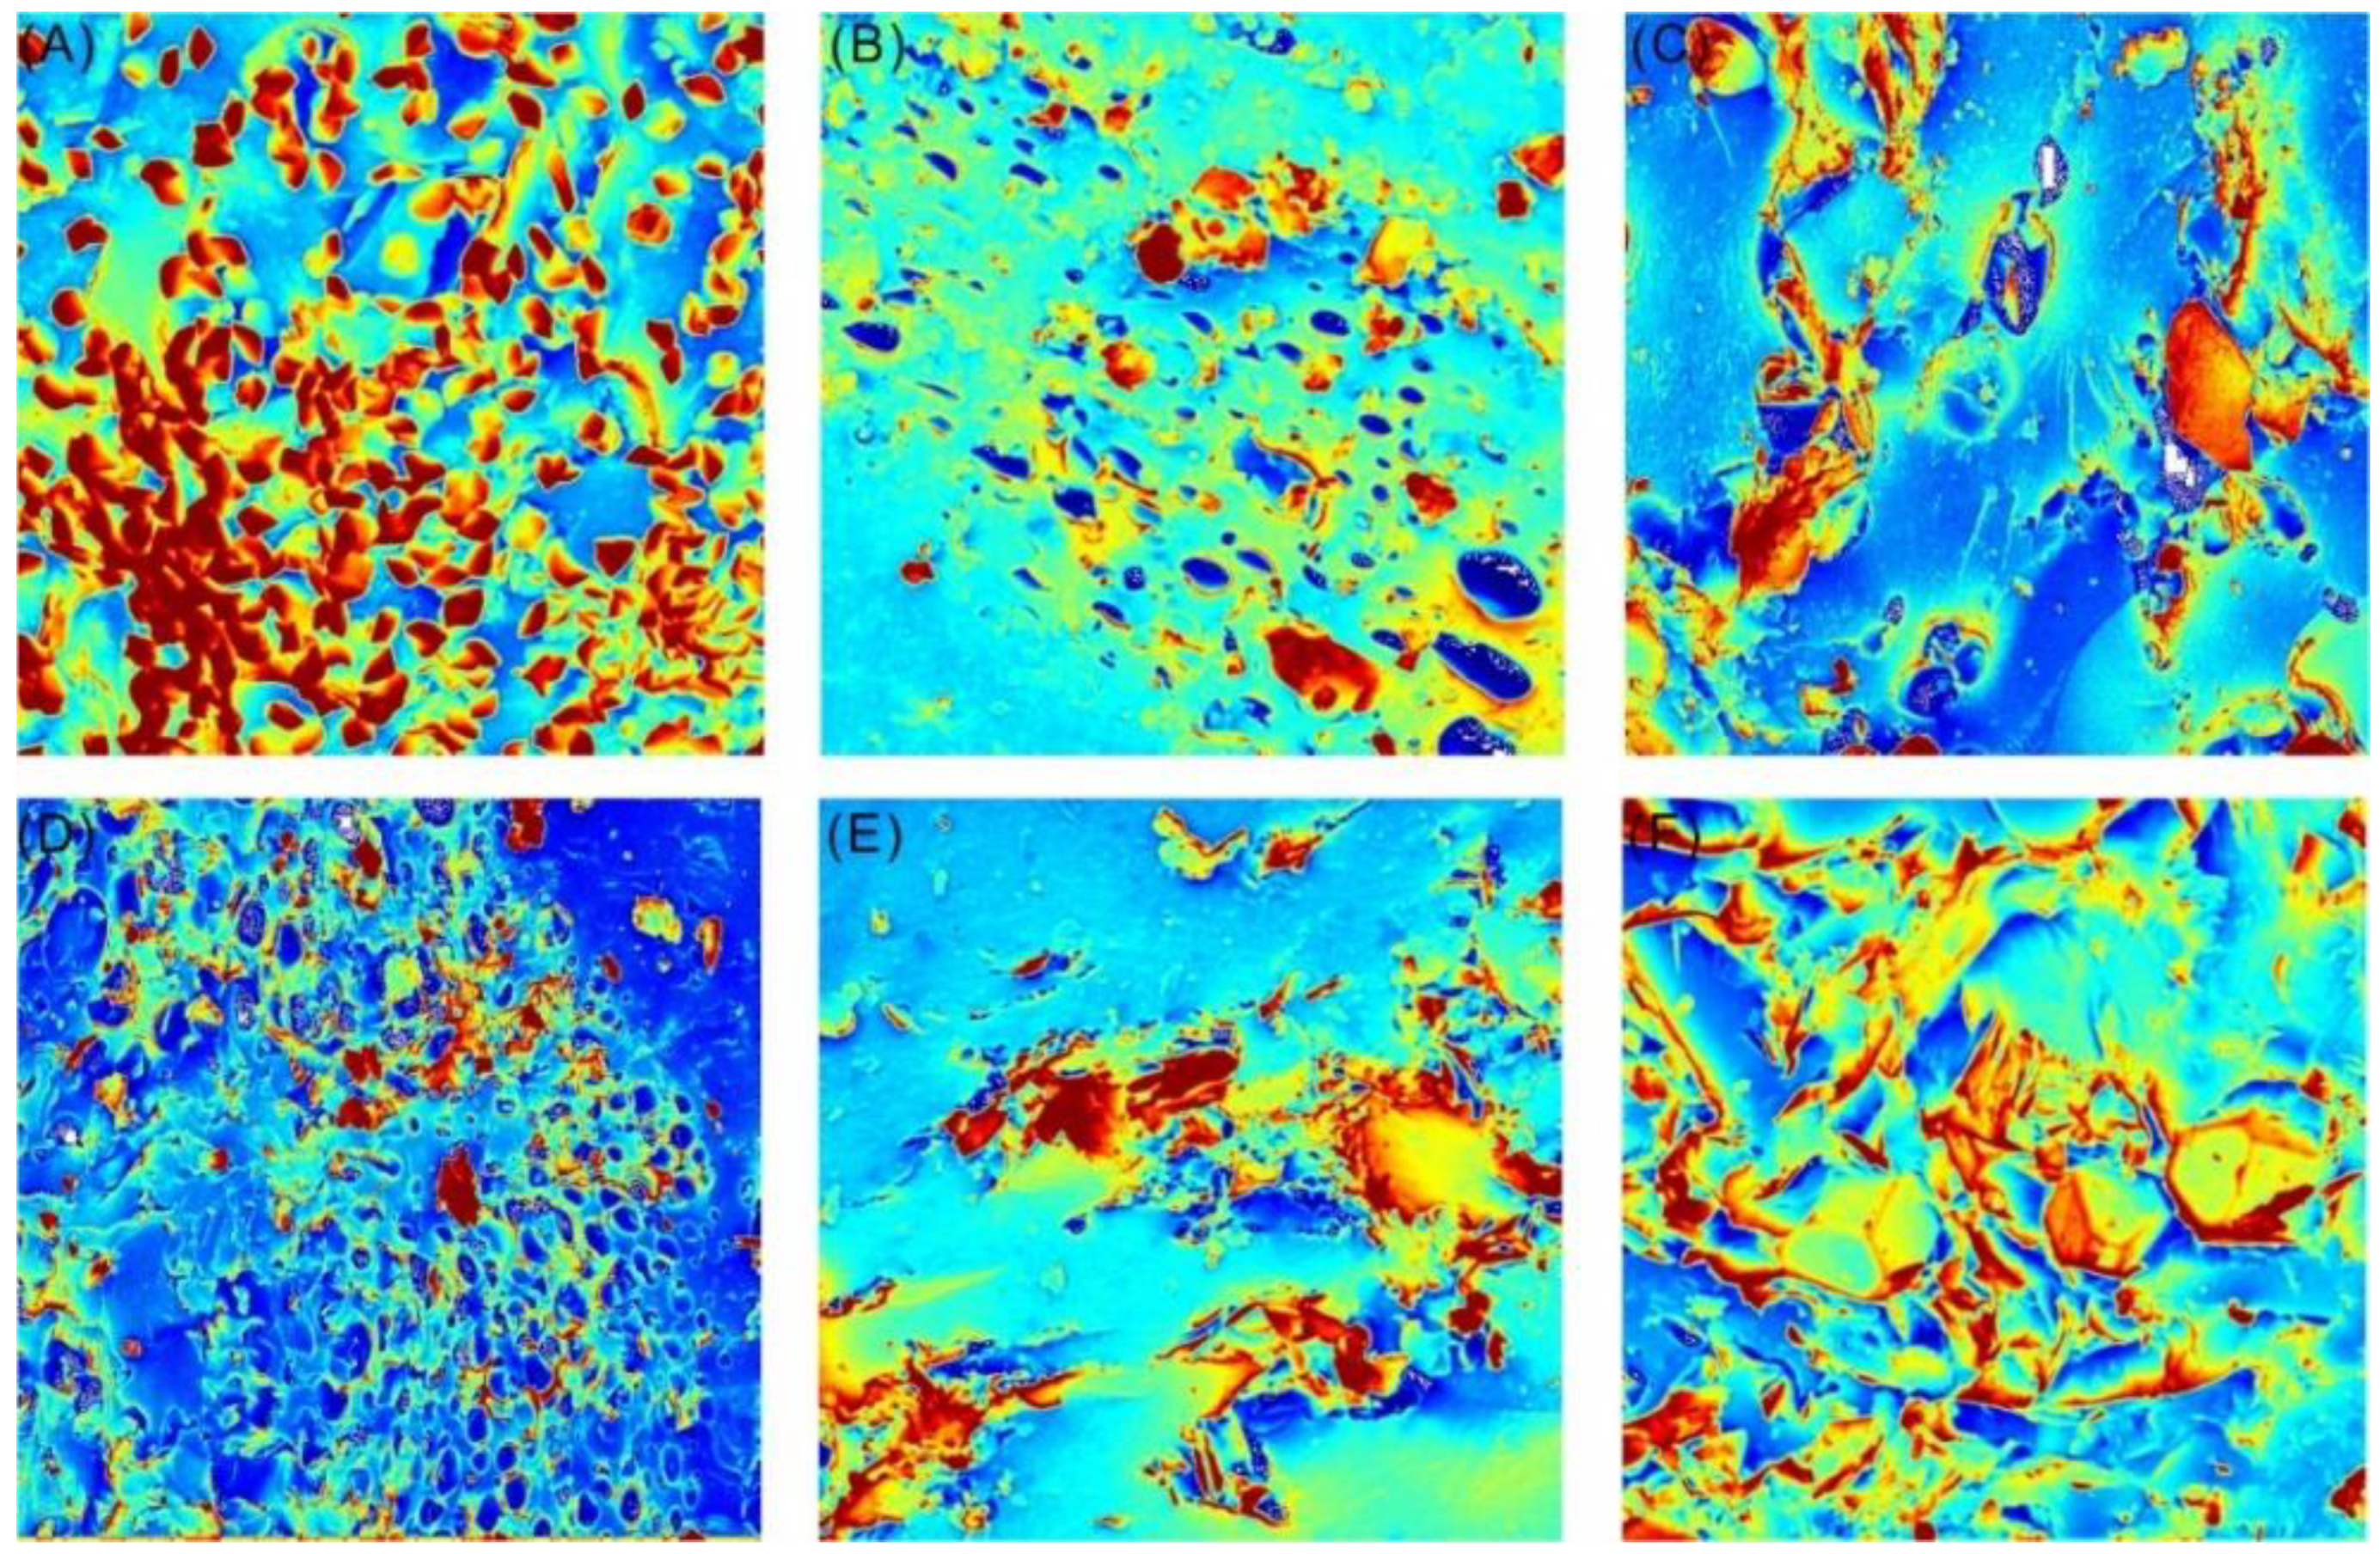
2.4. Segmentation of Pore Space
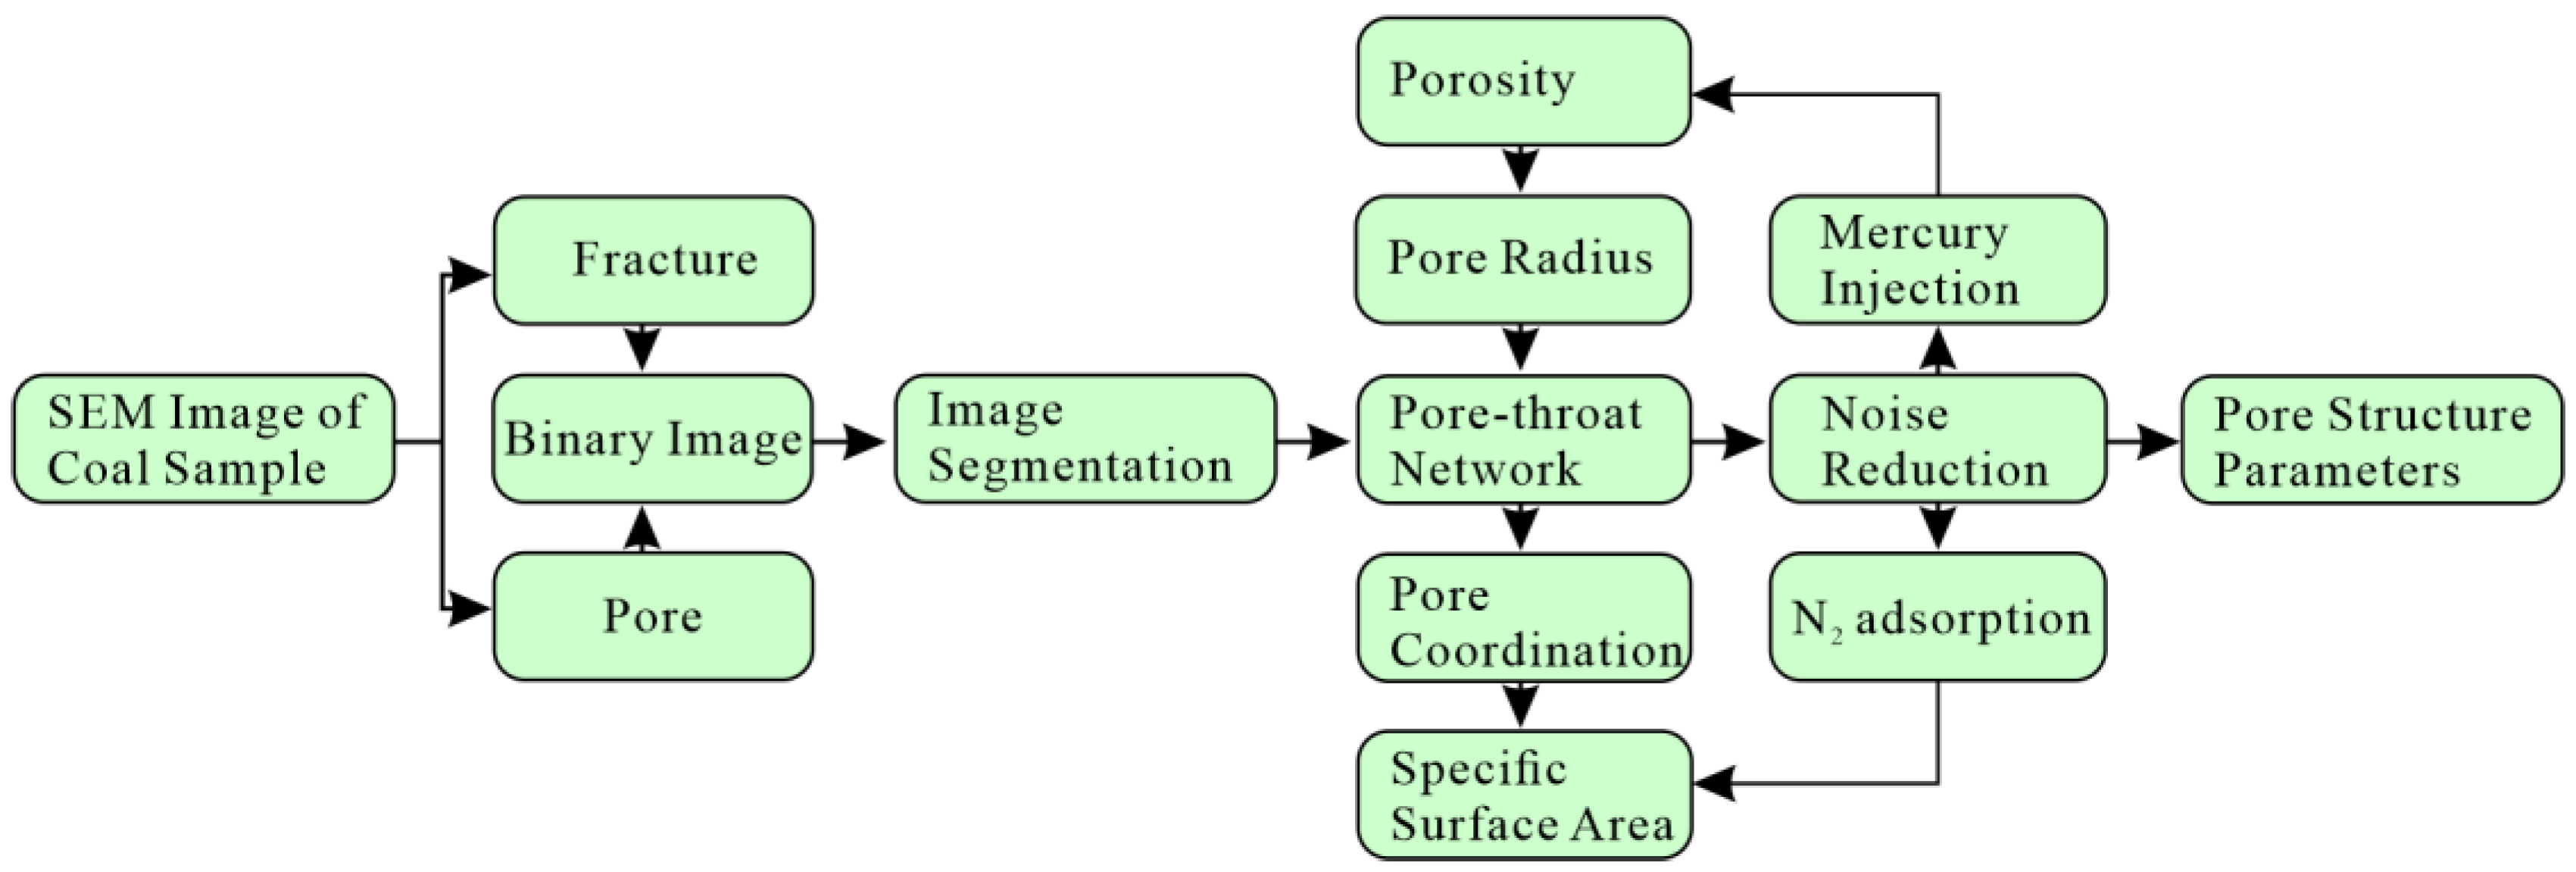
2.5. Quantitative Analysis Process
2.5.1. Porosity of Coal Reservoir
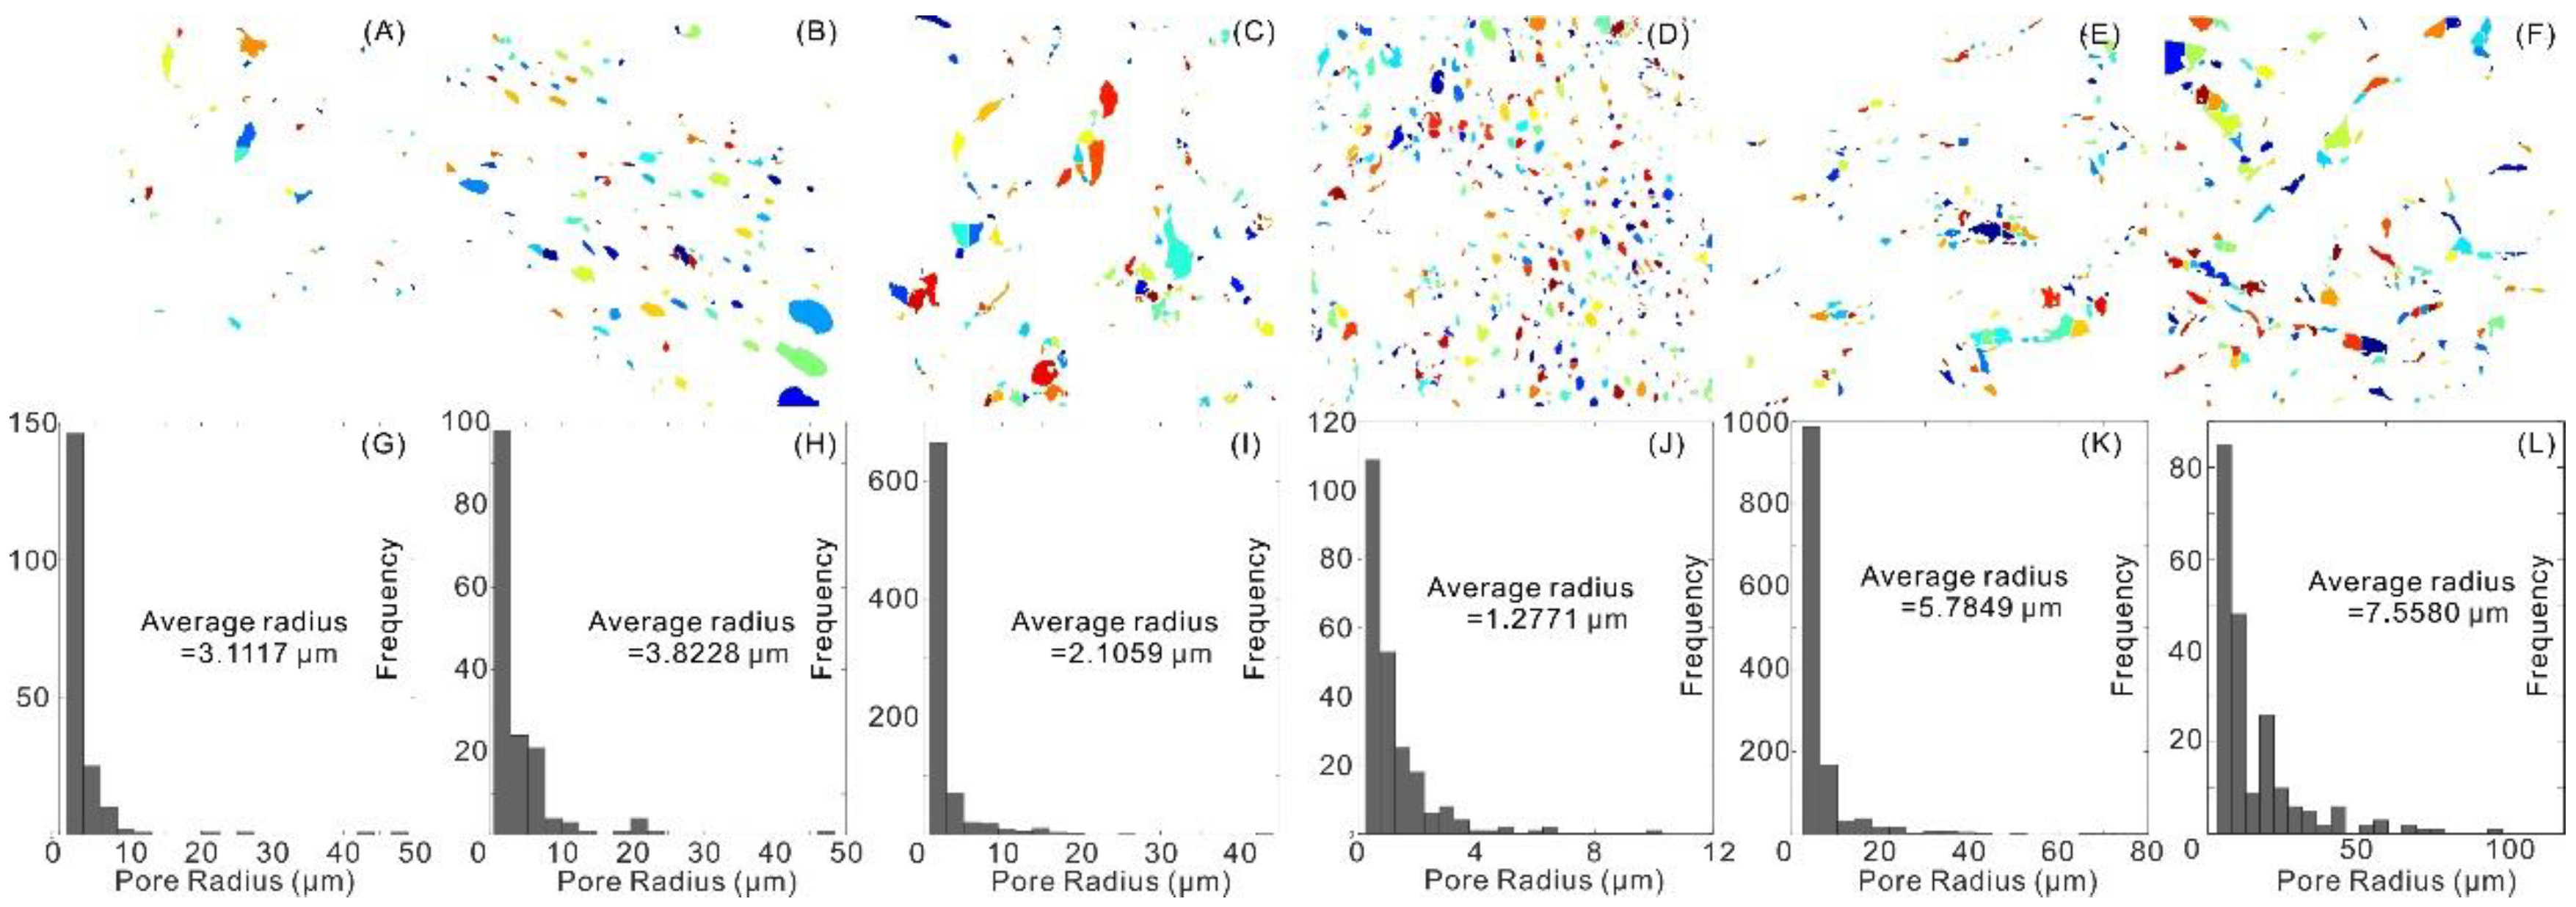
2.5.2. Pore Radius
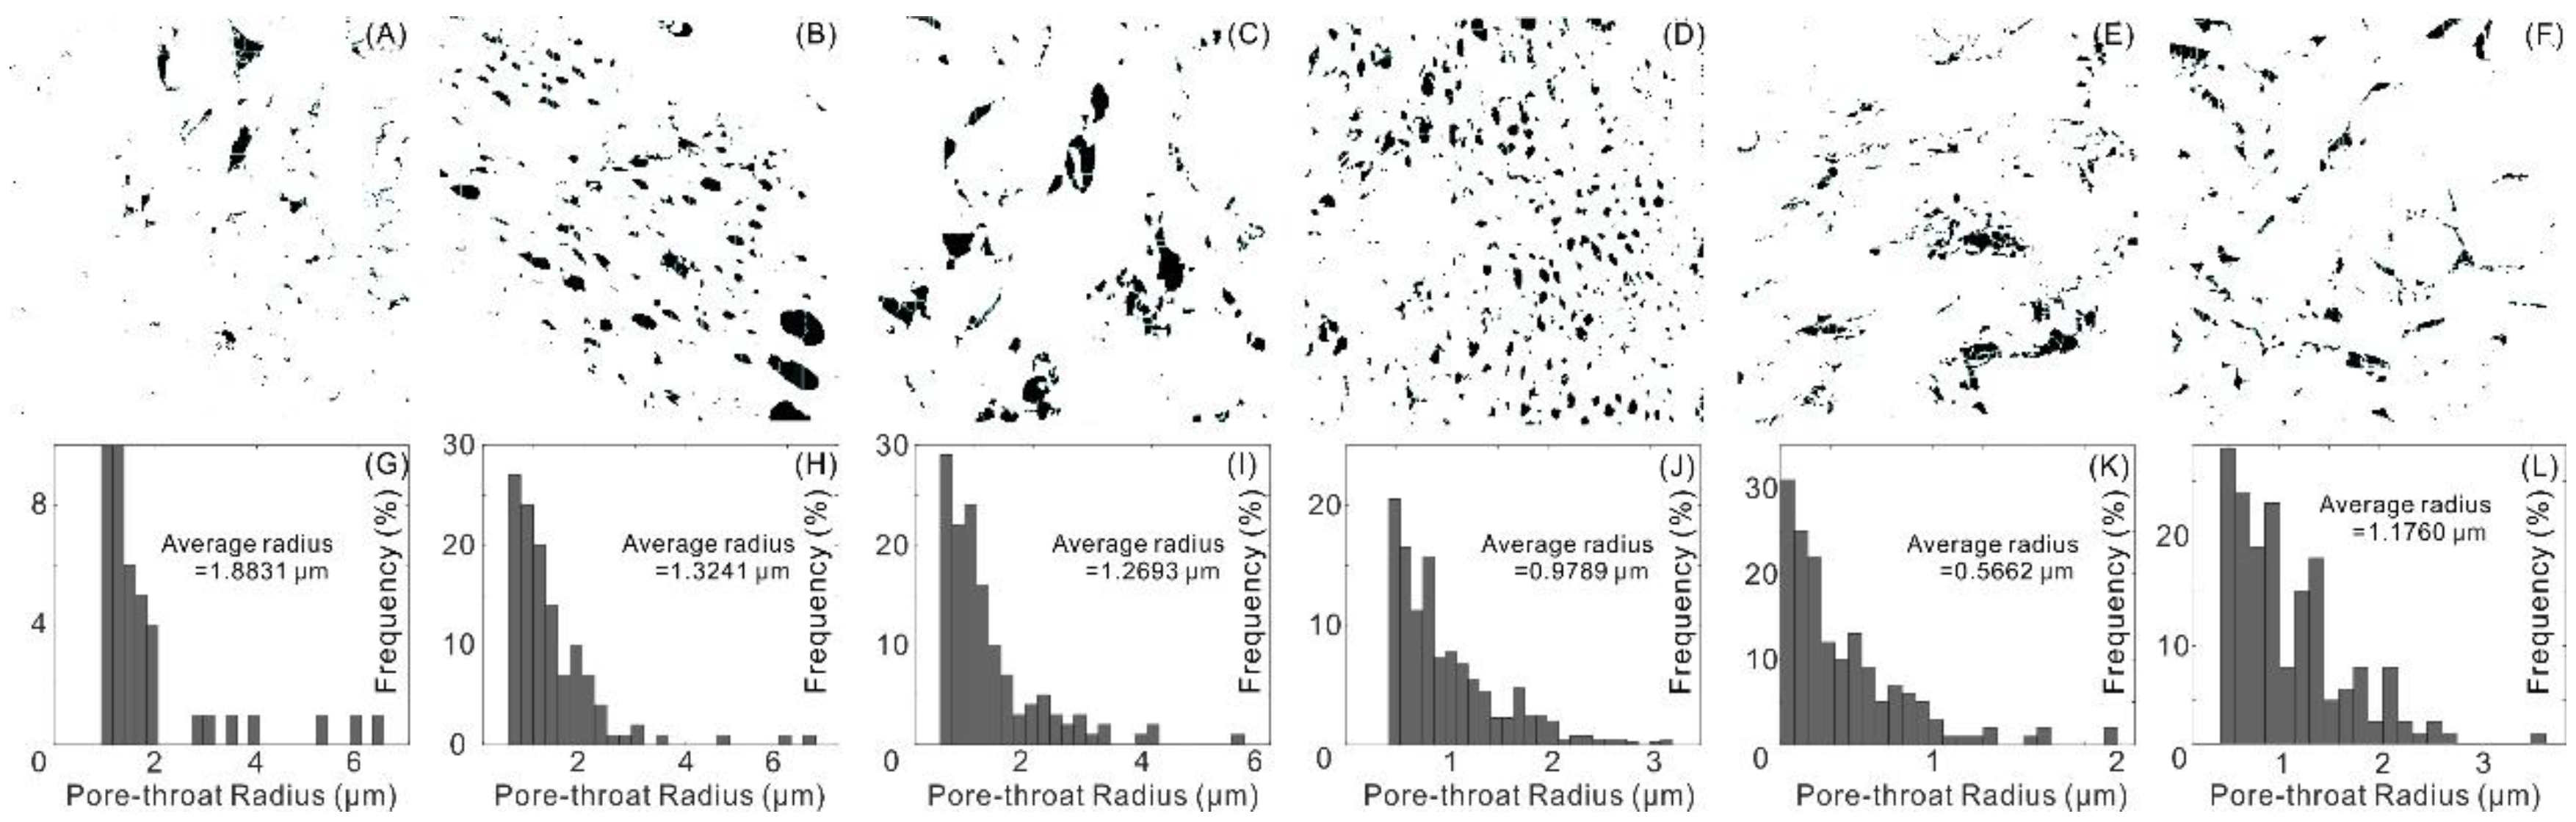
2.5.3. Pore-Throat Radius
Rt = regionprops(bwlabel(B), length);
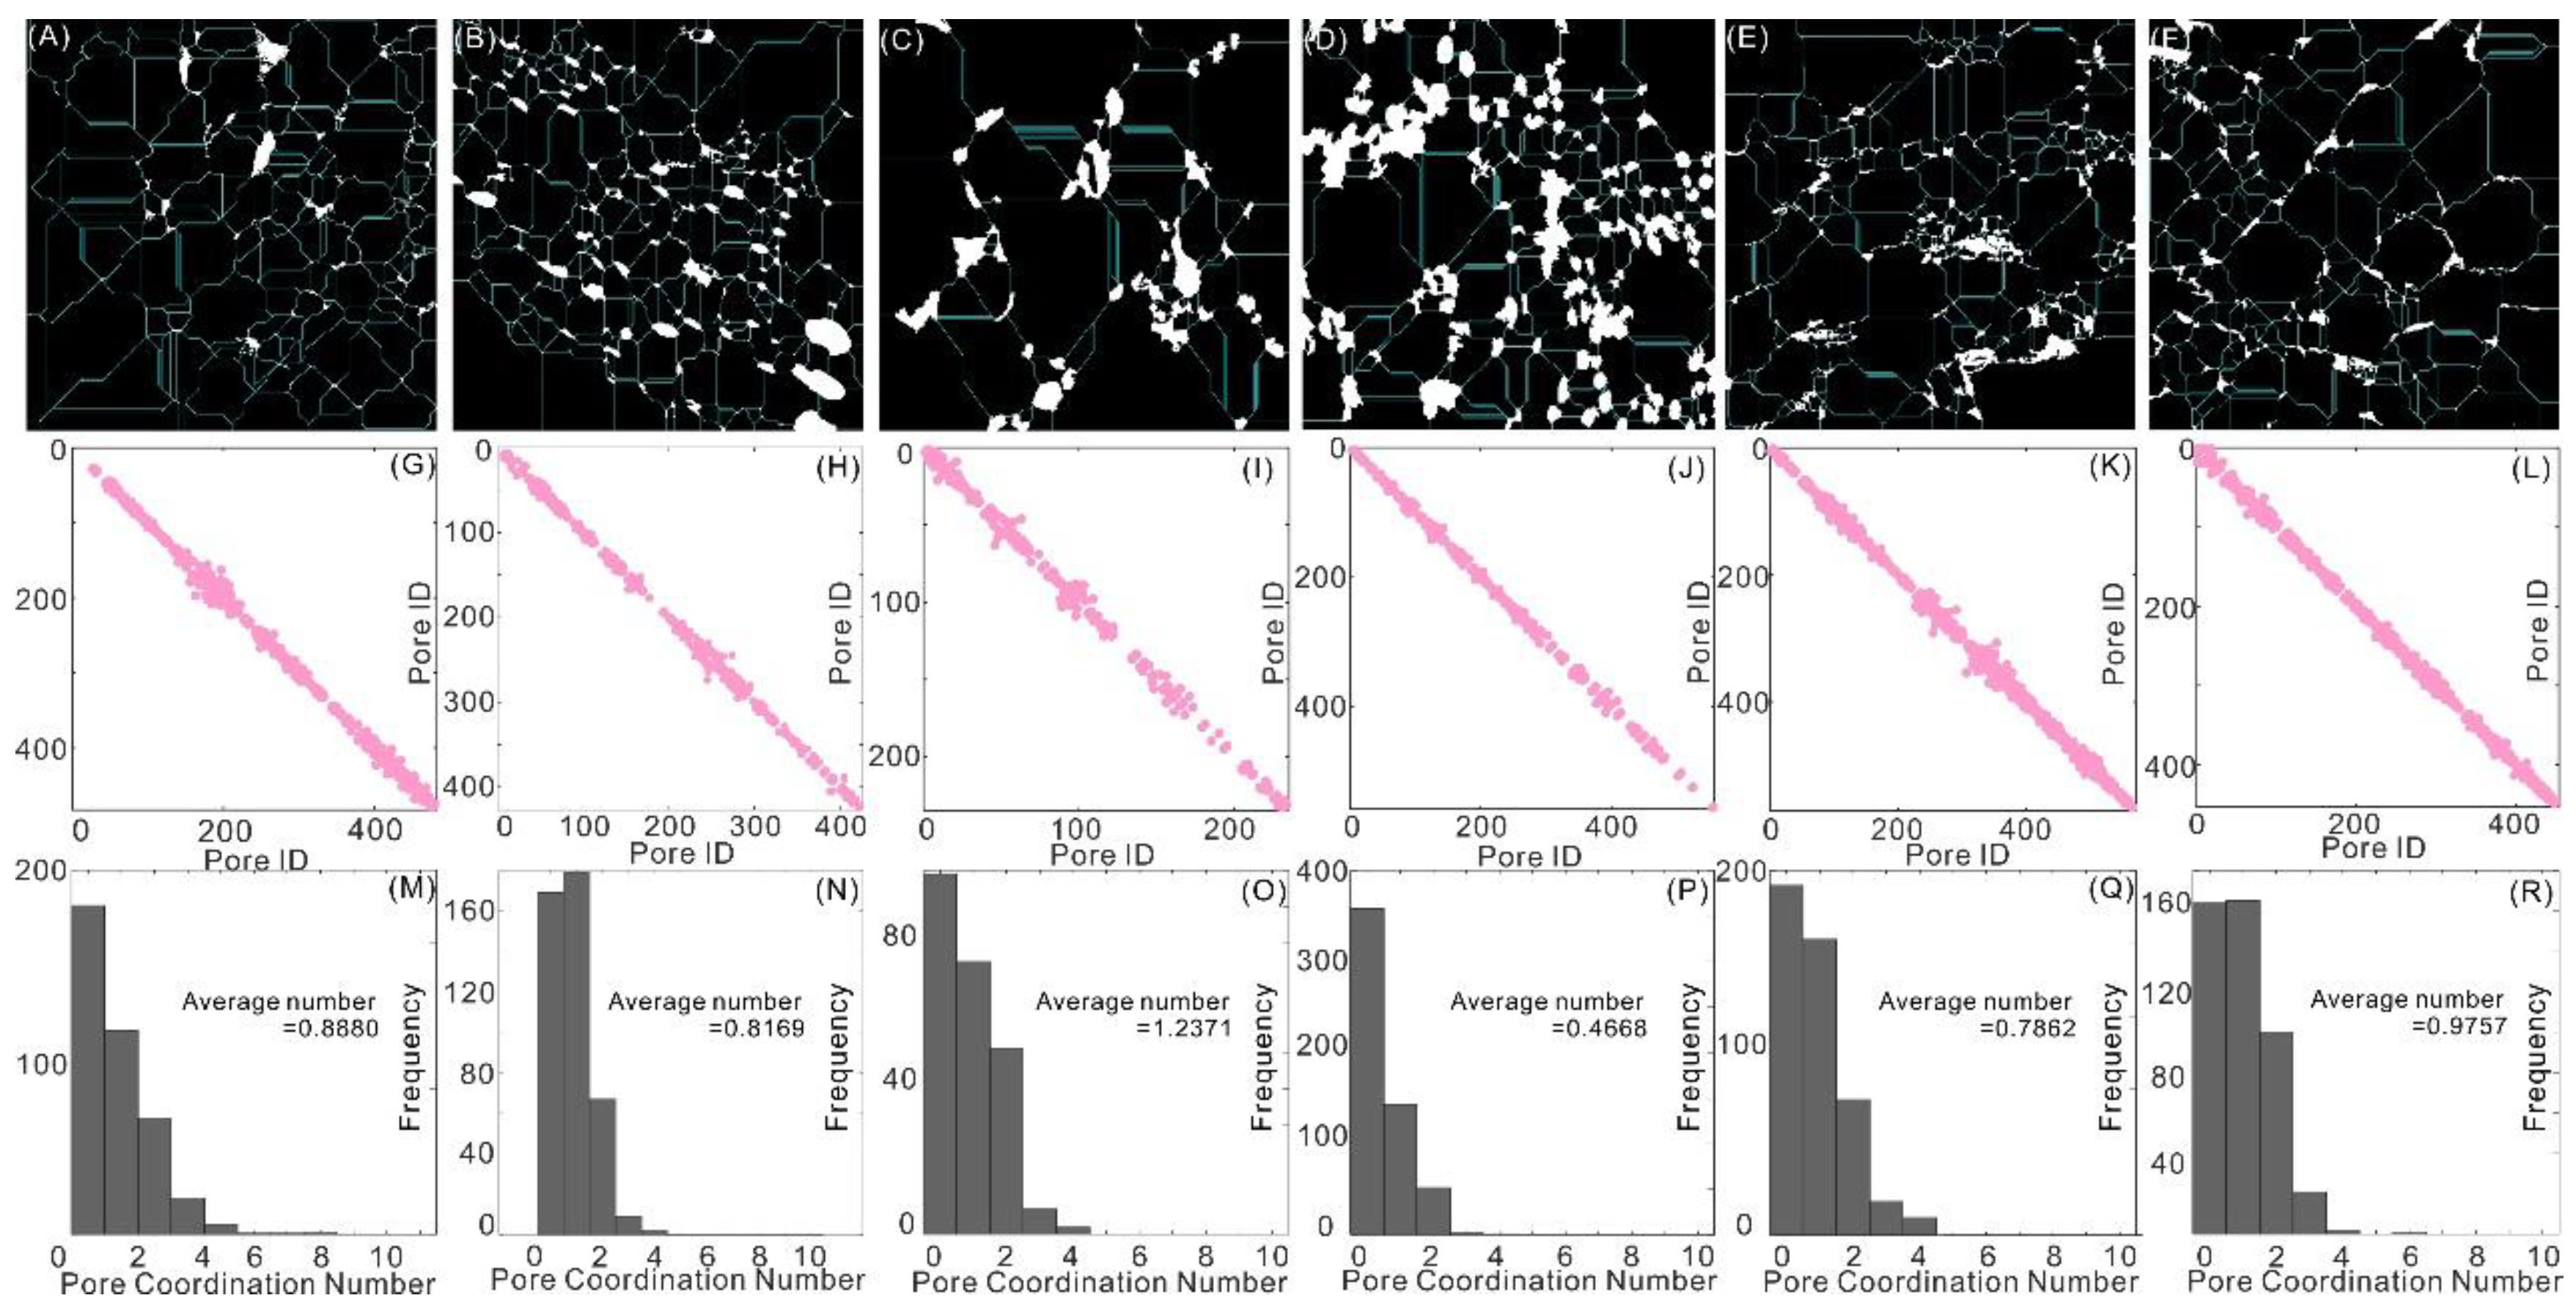
2.5.4. Acquisition of Pore Throat Network and Coordination Number
for I = 1:size(E,1)
Network(E(I,1),E(I,2)) = 1;
Network(E(I,2),E(I,1)) = 1;
2.5.5. Specific Surface Area
Specific surface pores in 2D = Sp/Resolution/Aw;
2.6. Mercury Injection Experiment
2.7. Low-Temperature N2 Adsorption
3. Results and Discussion
3.1. Parameters of Pore Structure
3.1.1. Porosity of Coal Reservoir
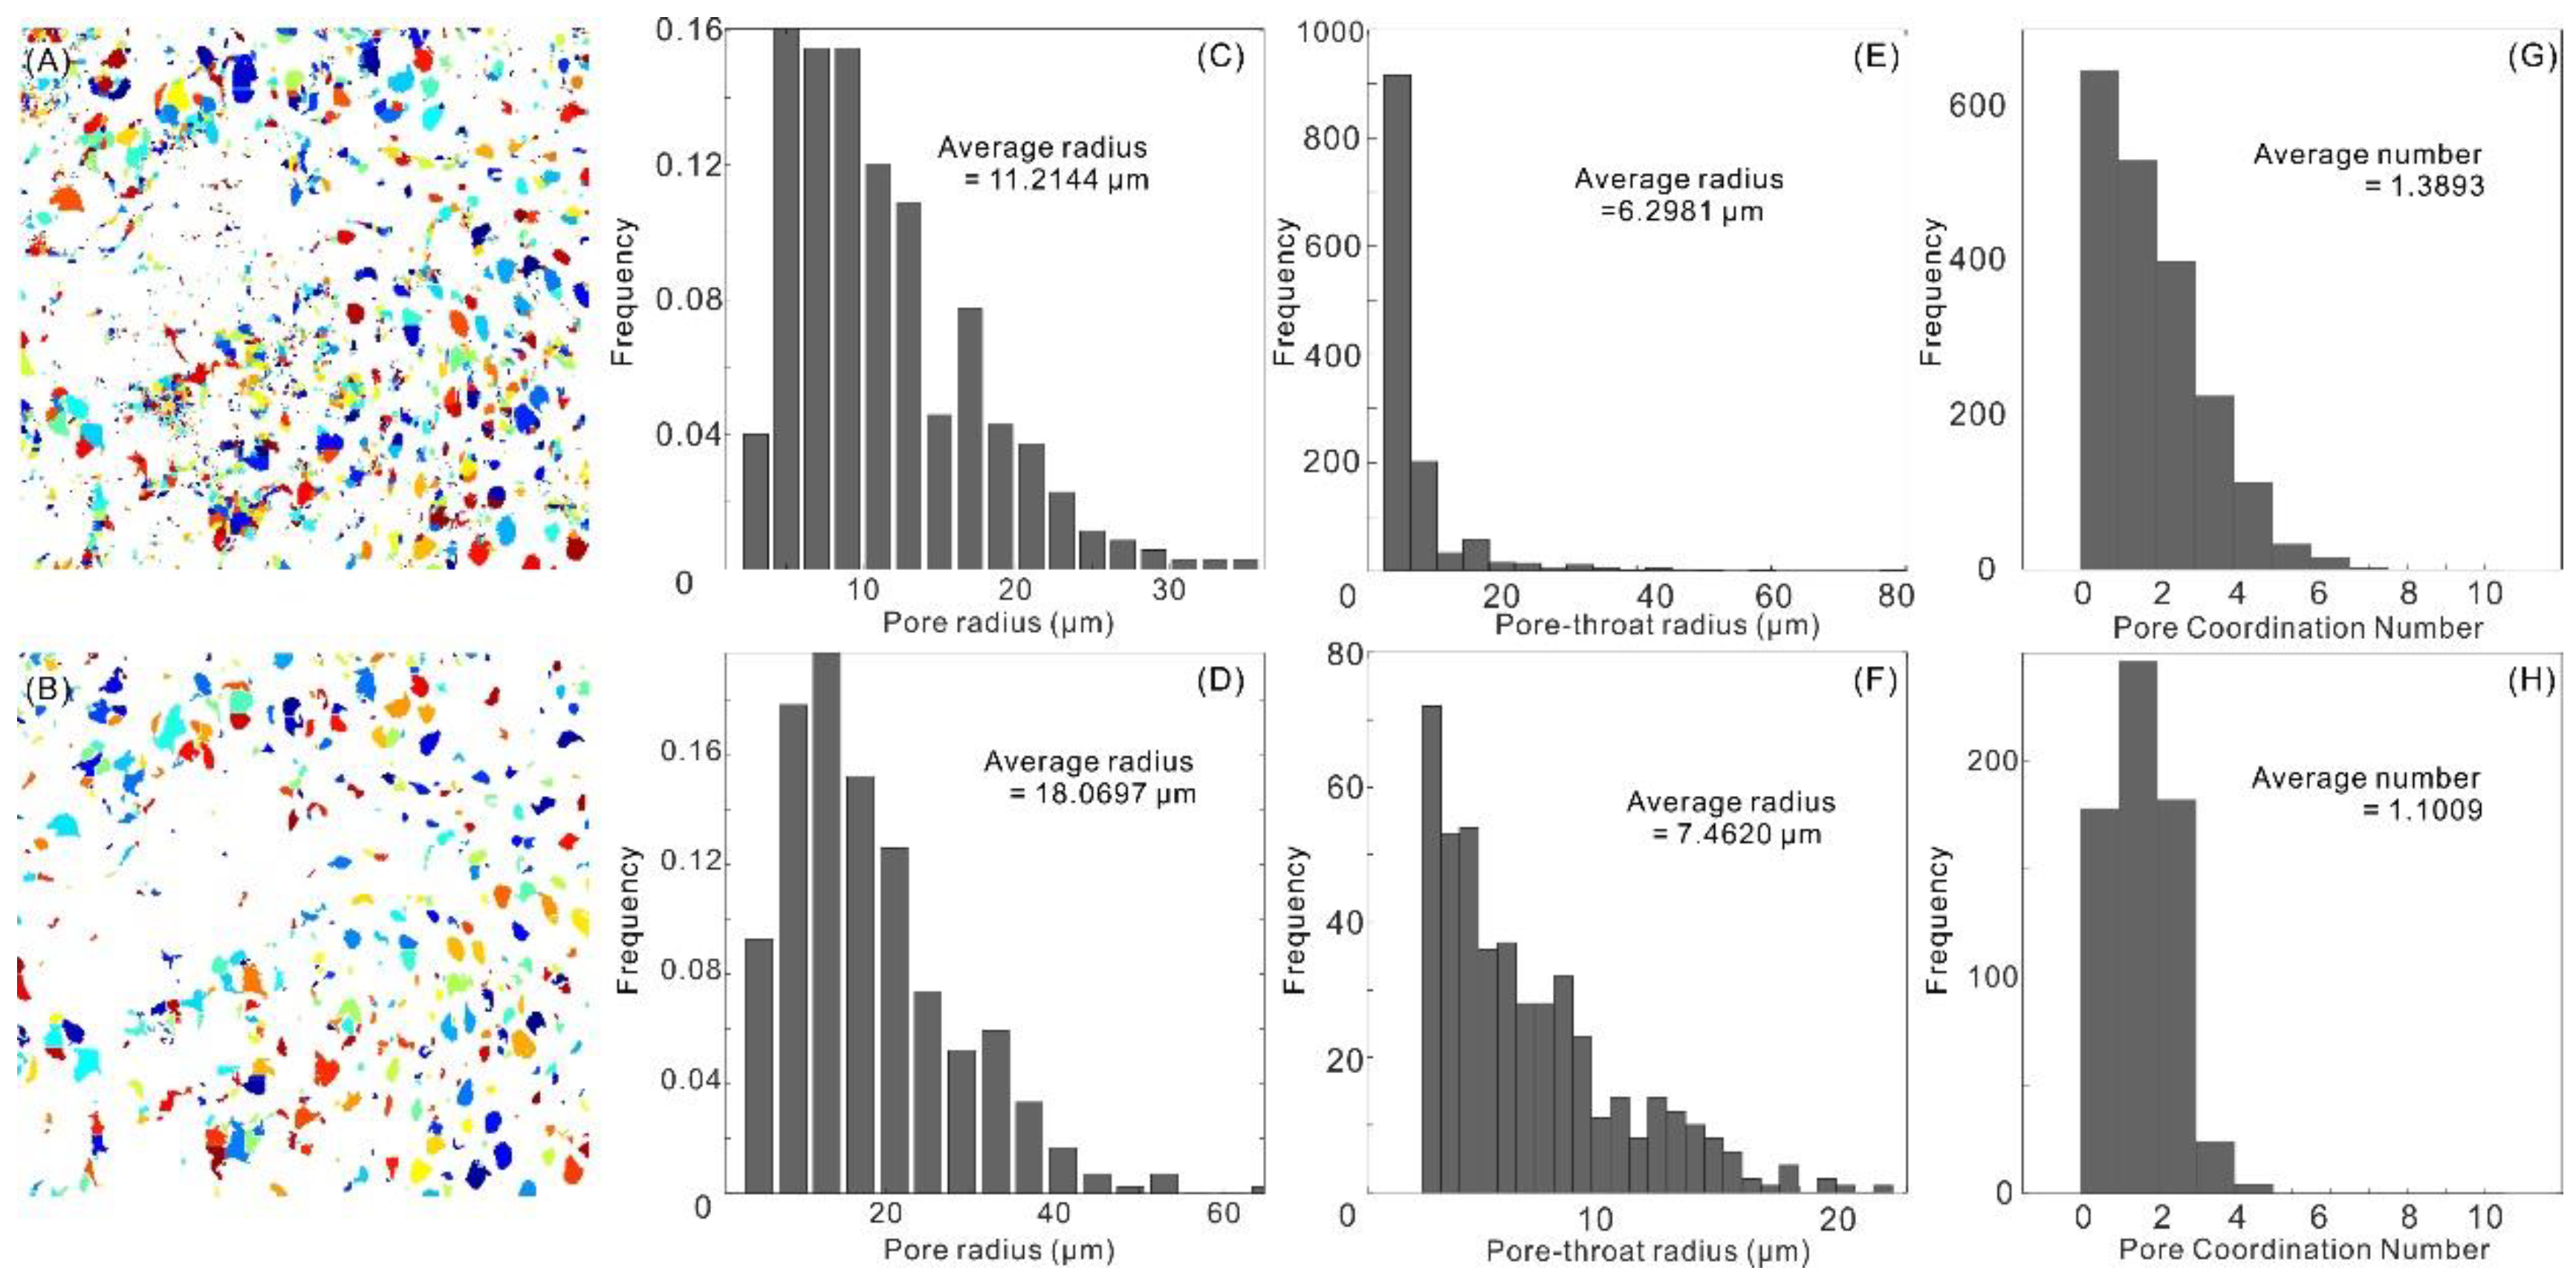
3.1.2. Pore Radius of Coal Reservoir
3.1.3. Pore-Throat Radius
3.1.4. Coordination Number
3.1.5. Specific Surface Area
3.2. Mercury Injection Data
3.3. Low-Temperature N2 Adsorption Data
3.4. The Generation and Reduction of Noise
3.4.1. Noise Reduction
P = bwmorph(P,’bridge’,n);
3.4.2. Difference of Pore Structure Parameters before and after Noise Reduction
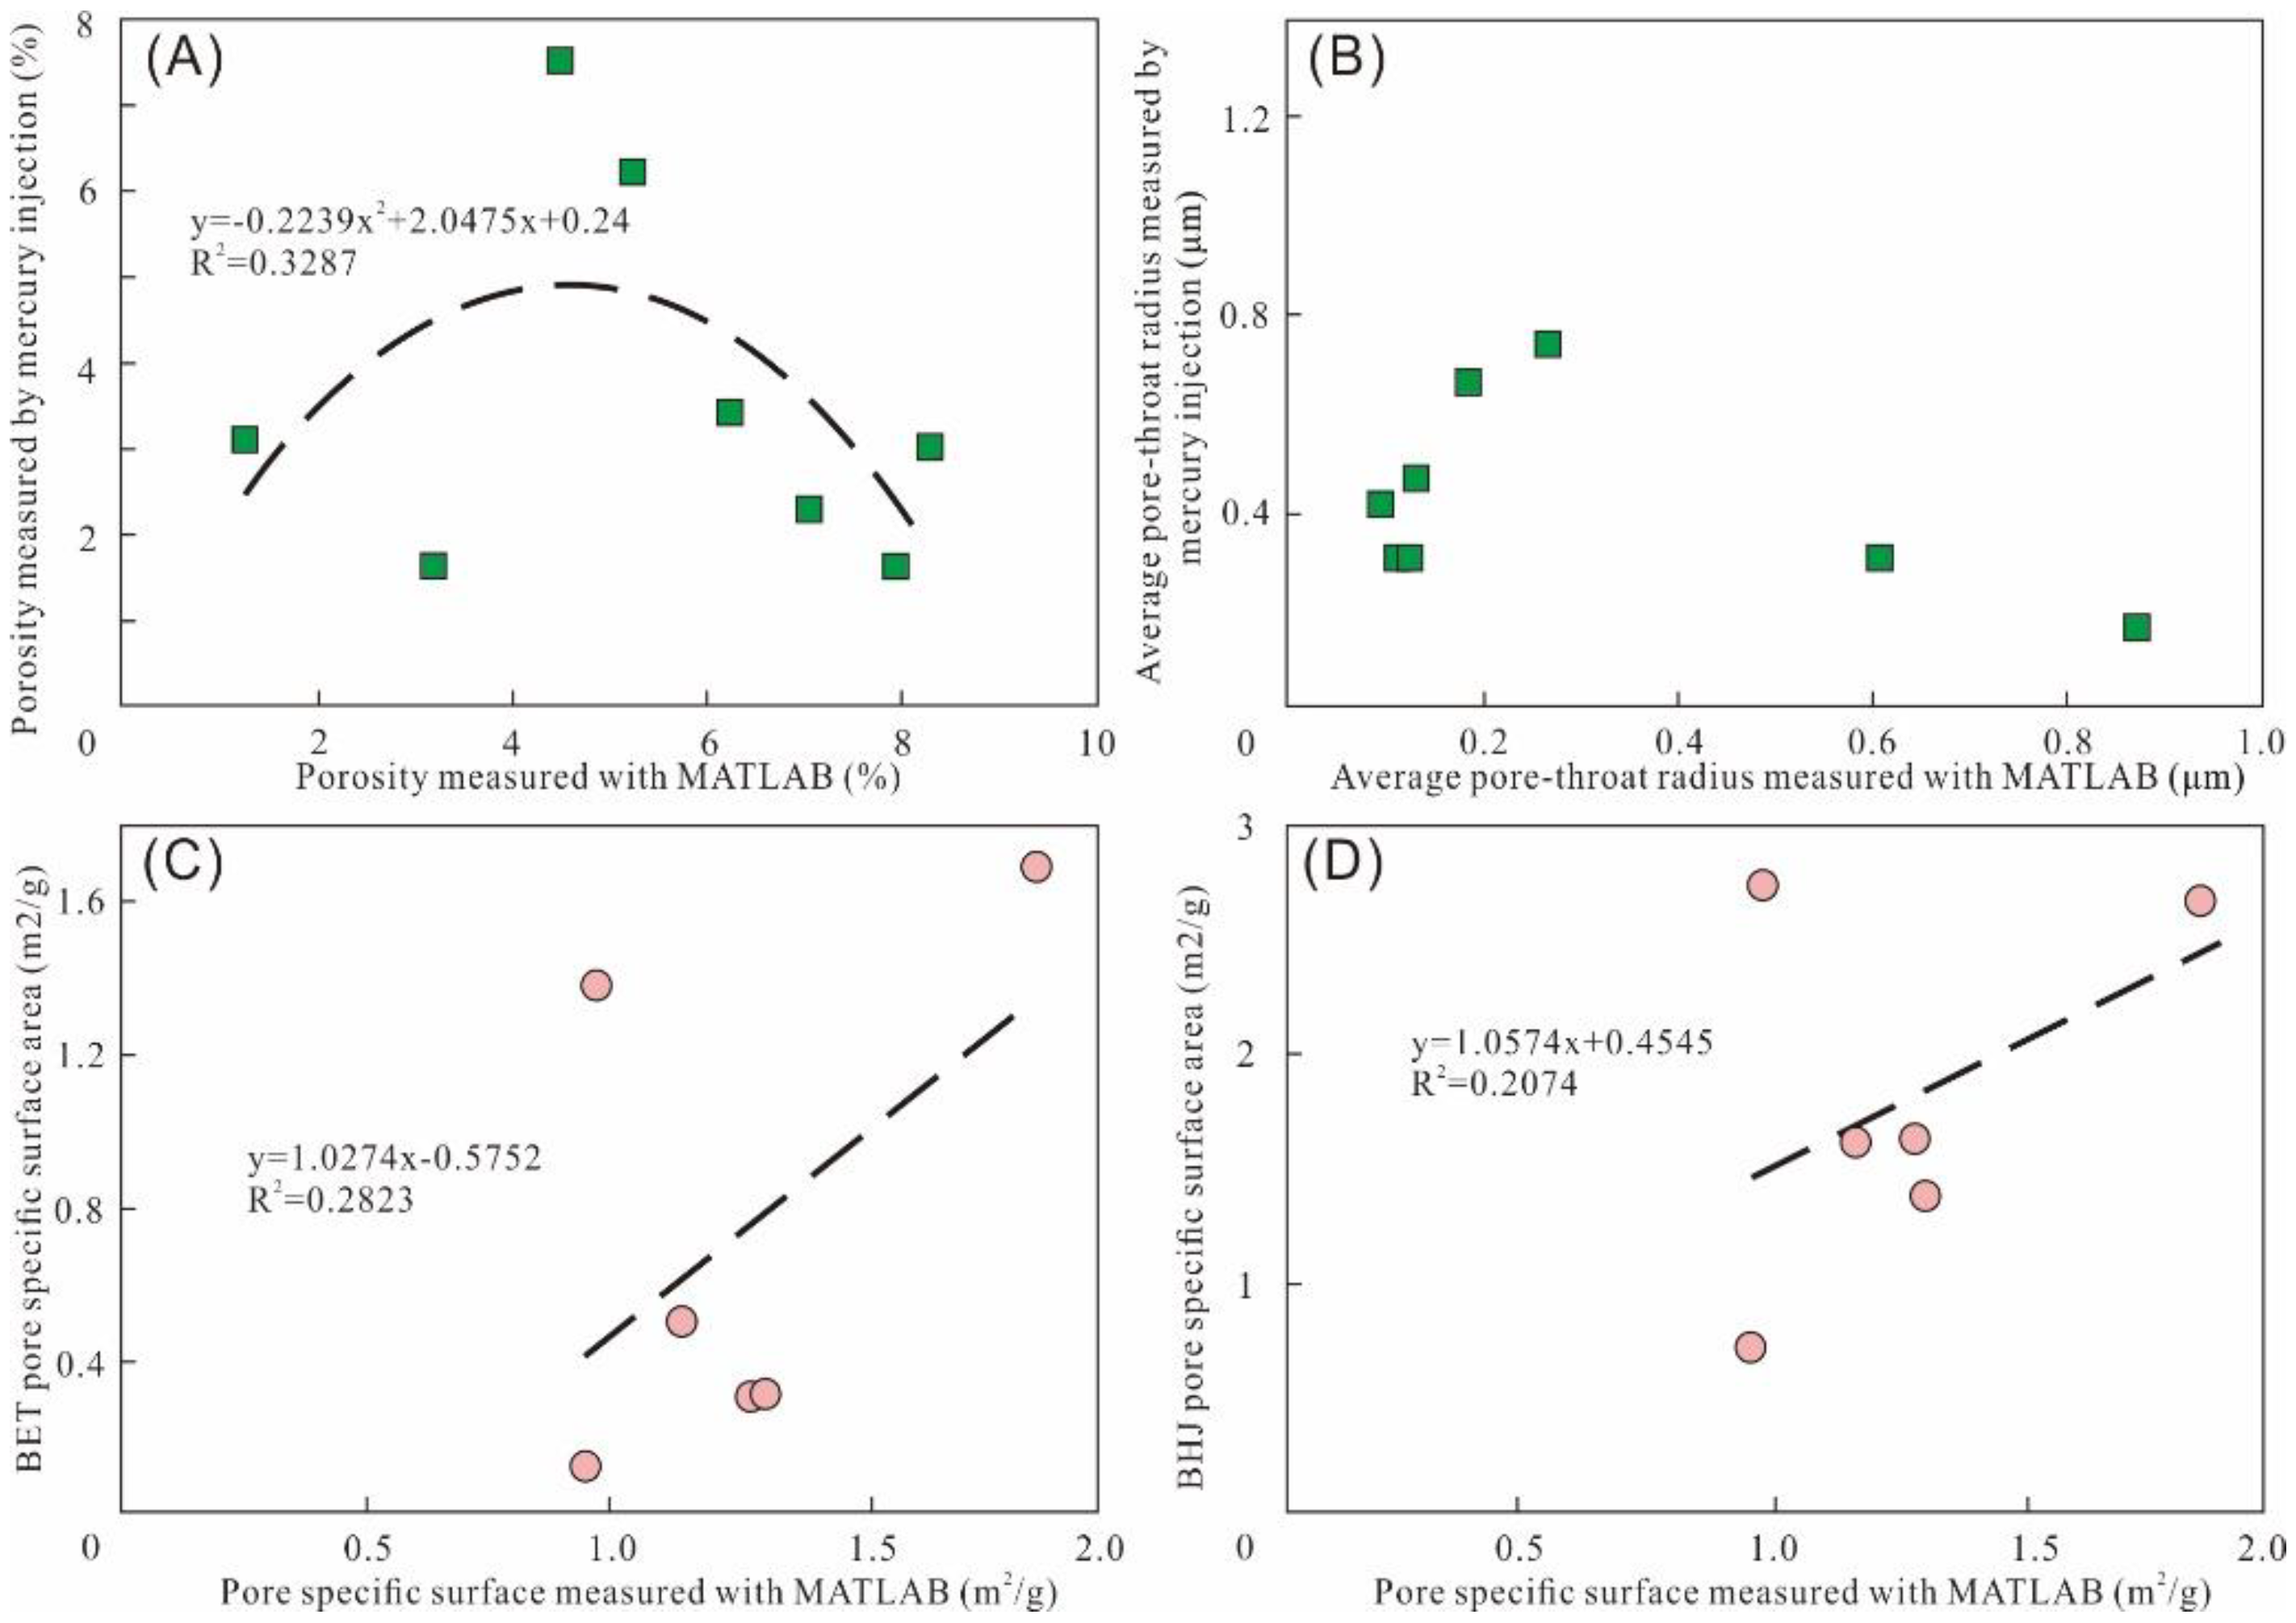
3.5. Fitness
4. Conclusions
Author Contributions
Funding
Data Availability Statement
Conflicts of Interest
References
- Karacan, C.O.; Okandan, E. Adsorption and gas transport in coal microstructure: Investigation and evaluation by quantitative X-ray CT imaging. Fuel 2001, 80, 209–520. [Google Scholar] [CrossRef]
- Longinos, S.N.; Wang, L.; Hazlett, R. Advances in Cryogenic Fracturing of Coalbed Methane Reservoirs with LN2. Energies 2022, 15, 9464. [Google Scholar] [CrossRef]
- Olajossy, A.; Cieślik, J. Why Coal Bed Methane (CBM) Production in Some Basins is Difficult. Energies 2019, 12, 2918. [Google Scholar] [CrossRef]
- Hou, H.; Shao, L.; Tang, Y.; Zhao, S.; Yuan, Y.; Li, Y.; Mu, G.; Zhou, Y.; Liang, G.; Zhang, J. Quantitative characterization of low-rank coal reservoirs in the southern Junggar Basin, NW China: Implications for pore structure evolution around the first coalification jump. Mar. Pet. Geol. 2020, 113, 104165. [Google Scholar] [CrossRef]
- Shan, L.; Liu, C.; Liu, Y.; Kong, W.; Hei, X. Rock CT Image Super-Resolution Using Residual Dual-Channel Attention Generative Adversarial Network. Energies 2022, 15, 5115. [Google Scholar] [CrossRef]
- Zhang, L.; Wei, C.; Nie, Y.; Wang, R. Pressure Measurement of Coal Seam with Active Nitrogen Injection: Model and Experimental Analysis. ACS Omega 2022, 7, 46935–46945. [Google Scholar] [CrossRef] [PubMed]
- Klaver, J.; Desbois, G.; Littke, R.; Urai, J.L. BIB-SEM pore characterization of mature and post mature Posidonia Shale samples from the Hils area, Germany. Int. J. Coal Geol. 2016, 158, 78–89. [Google Scholar] [CrossRef]
- Chen, Y.; Tang, H.; Zheng, M.; Li, C.; Zhao, S.; Zhao, N.; Leng, Y. Fractal Characteristics and Significance of Different Pore Types of the Wufeng–Longmaxi Formation, Southern Sichuan Basin, China, Based on N2 Adsorption and Image Analysis. ACS Omega 2021, 6, 30889–30900. [Google Scholar] [CrossRef]
- Li, Y.; Yang, J.; Pan, Z.; Tong, W. Nanoscale pore structure and mechanical property analysis of coal: An insight combining AFM and SEM images. Fuel 2020, 260, 116352. [Google Scholar] [CrossRef]
- Zhang, L.; Wang, G.; Xue, Q.; Zuo, H.; She, X.; Wang, J. Effect of preheating on coking coal and metallurgical coke properties: A review. Fuel Process. Technol. 2021, 221, 106942. [Google Scholar] [CrossRef]
- Bednarz, M.; McIlroy, D. Organism–sediment interactions in shale-hydrocarbon reservoir facies—Three-dimensional reconstruction of complex ichnofabric geometries and pore-networks. Int. J. Coal Geol. 2015, 150–151, 238–251. [Google Scholar] [CrossRef]
- Pandey, R.; Harpalani, S. An imaging and fractal approach towards understanding reservoir scale changes in coal due to bioconversion. Fuel 2018, 230, 282–297. [Google Scholar] [CrossRef]
- Li, Y.; Cui, H.; Zhang, P.; Wang, D.; Wei, J. Three-dimensional visualization and quantitative characterization of coal fracture dynamic evolution under uniaxial and triaxial compression based on CT scanning. Fuel 2020, 262, 116568. [Google Scholar] [CrossRef]
- Luo, L.; Liu, J.; Zhang, Y.; Zhang, H.; Ma, J.; You, Y.; Jiang, X. Application of small angle X-ray scattering in evaluation of pore structure of superfine pulverized coal/char. Fuel 2016, 185, 190–198. [Google Scholar] [CrossRef]
- Fang, H.; Sang, S.; Liu, S.; Du, Y. Methodology of three-dimensional visualization and quantitative characterization of nanopores in coal by using FIB-SEM and its application with anthracite in Qinshui basin. J. Pet. Sci. Eng. 2019, 182, 106285. [Google Scholar] [CrossRef]
- Jing, Y.; Armstrong, R.T.; Ramandi, H.L.; Mostaghimi, P. Coal cleat reconstruction using micro-computed tomography imaging. Fuel 2016, 181, 286–299. [Google Scholar] [CrossRef]
- Roslin, A.; Pokrajac, D.; Zhou, Y. Cleat structure analysis and permeability simulation of coal samples based on micro-computed tomography (micro-CT) and scan electron microscopy (SEM) technology. Fuel 2019, 254, 115579. [Google Scholar] [CrossRef]
- Wang, G.; Shen, J.; Liu, S.; Jiang, C.; Qin, X. Three-dimensional modeling and analysis of macro-pore structure of coal using combined X-ray CT imaging and fractal theory. Int. J. Rock Mech. Min. Sci. 2019, 123, 104082. [Google Scholar] [CrossRef]
- Steel, K.M.; Dawson, R.E.; Jenkins, D.R.; Pearce, R.; Mahoney, M.R. Use of rheometry and micro-CT analysis to understand pore structure development in coke. Fuel Process. Technol. 2017, 155, 106–113. [Google Scholar] [CrossRef]
- Wang, G.; Qin, X.; Shen, J.; Zhang, Z.; Han, D.; Jiang, C. Quantitative analysis of microscopic structure and gas seepage characteristics of low-rank coal based on CT three-dimensional reconstruction of CT images and fractal theory. Fuel 2019, 256, 115900. [Google Scholar] [CrossRef]
- Hong, Y.-D.; Lin, B.-Q.; Zhu, C.-J.; Wang, Z.; Liu, J.-Q.; Saffari, P.; Nie, W. Image and ultrasonic analysis-based investigation of coal core fracturing by microwave energy. Int. J. Rock Mech. Min. Sci. 2020, 127, 104232. [Google Scholar] [CrossRef]
- Perkins, J.; Williams, O.; Wu, T.; Lester, E. Automated image analysis techniques to characterise pulverised coal particles and predict combustion char morphology. Fuel 2020, 259, 116022. [Google Scholar] [CrossRef]
- Cai, Y.; Li, Q.; Liu, D.; Zhou, Y.; Lv, D. Insights into matrix compressibility of coals by mercury intrusion porosimetry and N2 adsorption. Int. J. Coal Geol. 2018, 200, 199–212. [Google Scholar] [CrossRef]
- Zhang, N.; Wang, S.; Zhao, F.; Sun, X.; He, M. Characterization of the Pore Structure and Fluid Movability of Coal-Measure Sedimentary Rocks by Nuclear Magnetic Resonance (NMR). ACS Omega 2021, 6, 22831–22839. [Google Scholar] [CrossRef] [PubMed]
- Xi, Z.; Tang, S.; Wang, J.; Yang, G.; Li, L. Formation and development of pore structure in marine-continental transitional shale from northern China across a maturation gradient: Insights from gas adsorption and mercury intrusion. Int. J. Coal Geol. 2018, 200, 87–102. [Google Scholar] [CrossRef]
- Gao, F.; Song, Y.; Li, Z.; Xiong, F.; Chen, L.; Zhang, X.; Chen, Z.; Moortgat, J. Quantitative characterization of pore connectivity using NMR and MIP: A case study of the Wangyinpu and Guanyintang shales in the Xiuwu basin, Southern China. Int. J. Coal Geol. 2018, 197, 53–65. [Google Scholar] [CrossRef]
- Bahadori, M.; Bakhshandeh Amnieh, H.; Khajezadeh, A. A new geometrical-statistical algorithm for predicting two-dimensional distribution of rock fragments caused by blasting. Int. J. Rock Mech. Min. Sci. 2016, 86, 55–64. [Google Scholar] [CrossRef]
- Yang, J.; Su, Y.; He, X.; Tan, H.; Jiang, Y.; Zeng, L.; Strnadel, B. Pore structure evaluation of cementing composites blended with coal by-products: Calcined coal gangue and coal fly ash. Fuel Process. Technol. 2018, 181, 75–90. [Google Scholar] [CrossRef]
- Stsepuro, N.; Kovalev, M.; Krasin, G.; Podlesnykh, I.; Gulina, Y.; Kudryashov, S. Surface Depth-Mapping of Material via the Transport-of-Intensity Equation. Photonics 2022, 9, 815. [Google Scholar] [CrossRef]
- Tafesse, S.; Fernlund, J.M.R.; Bergholm, F. Digital sieving-Matlab based 3-D image analysis. Eng. Geol. 2012, 137–138, 74–84. [Google Scholar] [CrossRef]
- Michalak, H.; Okarma, K. Improvement of Image Binarization Methods Using Image Preprocessing with Local Entropy Filtering for Alphanumerical Character Recognition Purposes. Entropy 2019, 21, 562. [Google Scholar] [CrossRef] [PubMed]
- Sarkar, G.; Siddiqua, S. Effect of fluid chemistry on the microstructure of light backfill: An X-ray CT investigation. Eng. Geol. 2016, 202, 153–162. [Google Scholar] [CrossRef]
- Naveen, P.; Asif, M.; Ojha, K. Integrated fractal description of nanopore structure and its effect on CH4 adsorption on Jharia coals, India. Fuel 2018, 232, 190–204. [Google Scholar] [CrossRef]
- Druckrey, A.M.; Alshibli, K.A.; Al-Raoush, R.I. 3D characterization of sand particle-to-particle contact and morphology. Comput. Geotech. 2016, 74, 26–35. [Google Scholar] [CrossRef]
- Xin, F.; Xu, H.; Tang, D.; Cao, L. An improved method to determine accurate porosity of low-rank coals by nuclear magnetic resonance. Fuel Process. Technol. 2020, 205, 106435. [Google Scholar] [CrossRef]
- Fusi, N.; Martinez-Martinez, J. Mercury porosimetry as a tool for improving quality of micro-CT images in low porosity carbonate rocks. Eng. Geol. 2013, 166, 272–282. [Google Scholar] [CrossRef]
- Yoshizawa, N.; Yamada, Y.; Furuta, T.; Shiraishi, M. Coal-Based Activated Carbons Prepared with Organometallics and Their Mesoporous Structure. Energy Fuels 1997, 11, 327–330. [Google Scholar] [CrossRef]
- Zhou, S.; Liu, D.; Cai, Y.; Yao, Y.; Li, Z. 3D characterization and quantitative evaluation of pore-fracture networks of two Chinese coals using FIB-SEM tomography. Int. J. Coal Geol. 2017, 174, 41–54. [Google Scholar] [CrossRef]
- Lu, Y.; Chen, X.; Tang, J.; Li, H.; Zhou, L.; Han, S.; Ge, Z.; Xia, B.; Shen, H.; Zhang, J. Relationship between pore structure and mechanical properties of shale on supercritical carbon dioxide saturation. Energy 2019, 172, 270–285. [Google Scholar] [CrossRef]
- Zhu, H.; Ju, Y.; Huang, C.; Chen, F.; Chen, B.; Yu, K. Microcosmic gas adsorption mechanism on clay-organic nanocomposites in a marine shale. Energy 2020, 197, 117256. [Google Scholar] [CrossRef]

| Analysis Methods | Parameters | Characteristics | |
|---|---|---|---|
| Direct observation methods | SEM (Scanning electron microscope) | Nanoscale pore-throat radius (<1 μm) | Convenient but partial; Quantitative parameters need to be combined with computer software or other methods |
| Indirect experimental methods | Mercury injection | Porosity, pore-throat radius (<2 μm) | Convenient but inaccurate |
| Nuclear magnetic resonance | Porosity, content of mud cement | Content of the whole sample; relatively precise | |
| Radiation X-ray computed tomography | 3D pore-throat distribution and coordination number | 3D pore-throat distribution is perfectly measured; expensive | |
| N2 gas adsorption | Specific surface area, pore-throat radius | Connected pore is well measured | |
| X-ray diffraction | Content of calcite and mud cements | Content of the whole sample; relatively precise | |
| Sample | Type | Porosity (%) | Pore Radius (μm) | Pore-Throat Radius (μm) | Coordination Number | Pore Throat Ratio | Pore Specific Surface Area (m2/g) | |
|---|---|---|---|---|---|---|---|---|
| 1 | SX006-15 | Pore space | 1.266 | 0.311 | 0.188 | 0.888 | 1.65 | 1.871 |
| 2 | SX017-3 | 5.218 | 0.382 | 0.132 | 0.817 | 2.887 | 0.975 | |
| 3 | BF3-1 | 6.256 | 0.211 | 0.127 | 1.237 | 1.659 | 0.950 | |
| 4 | WZ3-3 | 8.313 | 0.128 | 0.098 | 0.467 | 1.304 | 1.164 | |
| 5 | SGJ15-1 | 4.505 | 0.579 | 0.056 | 0.786 | 10.22 | 1.285 | |
| 6 | WTP15-1 | 7.958 | 0.756 | 0.118 | 0.976 | 6.426 | 1.307 | |
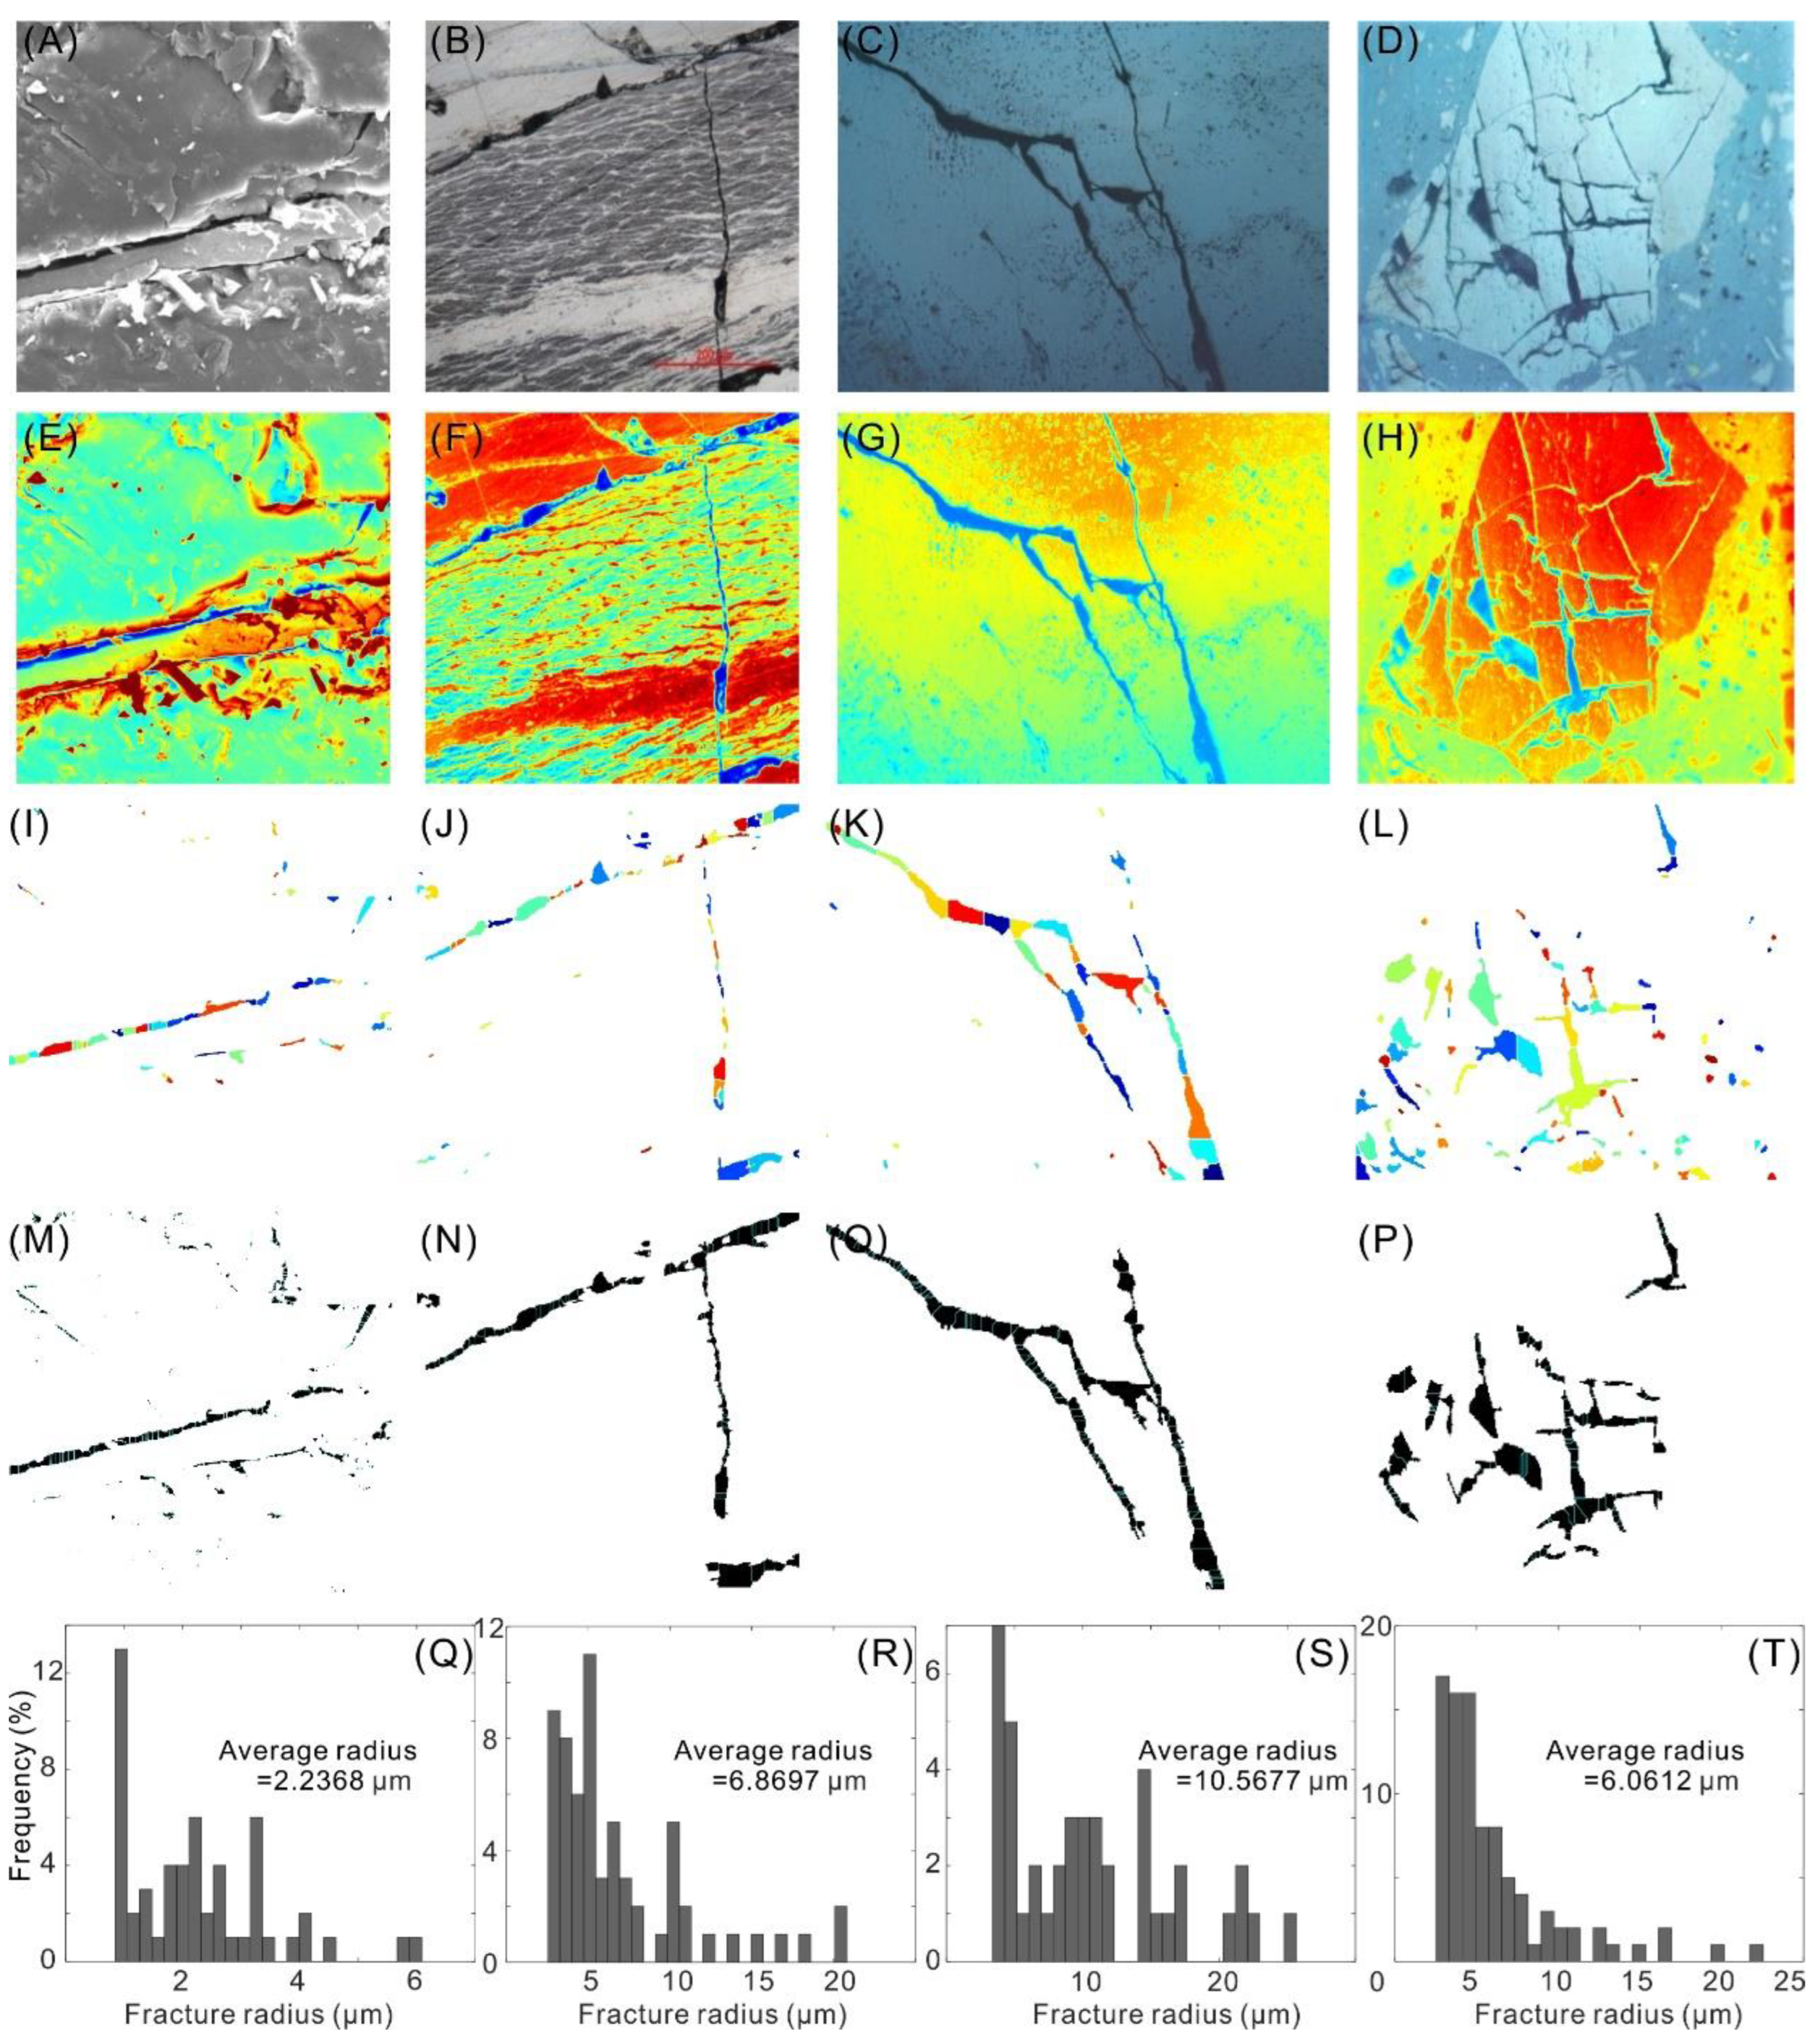
| 7 | LDS-15 | Fracture | 2.059 | 2.237 | ||||
| 8 | WZ3-2 | 3.199 | 6.870 | |||||
| 9 | SX306-23 | 4.201 | 10.568 | |||||
| 10 | SX008-2 | 7.059 | 6.061 |
| Sample | Porosity (%) | Maximum Mercury Saturation (%) | Displacement Pressure (MPa) | Average Pore-Throat Radius (μm) | Mercury Porosimetry Percentage | ||
|---|---|---|---|---|---|---|---|
| 0–100 nm | 100–1000 nm | >1000 nm | |||||
| WZ3-3 | 3.0 | 44.85 | 1.97 | 0.15 | 81.21 | 12.14 | 5.21 |
| WY3-2 | 1.6 | 47.78 | 4.87 | 0.06 | 86.67 | 9 | 2.84 |
| BF3-1 | 3.4 | 36.81 | 2.78 | 0.11 | 84.51 | 9.4 | 4.59 |
| SX005-2 | 1.4 | 26.9 | 1.17 | 0.25 | 86.12 | 8.35 | 4.06 |
| SX013-3 | 6.2 | 26.55 | 1.8 | 0.17 | 86.8 | 8.44 | 2.44 |
| SX008-2 | 2.3 | 39.16 | 3.92 | 0.11 | 85.97 | 9.07 | 3.49 |
| SX011-3 | 3.9 | 35.85 | 5.08 | 0.05 | 84.42 | 8.74 | 5.4 |
| SX025-3 | 0.8 | 32.46 | 5.31 | 0.06 | 87.3 | 7.53 | 3.68 |
| SGJ15-1 | 7.5 | 32.61 | 0.2 | 1.29 | 79.55 | 9.71 | 9.25 |
| WTP15-1 | 1.6 | 60.28 | 2.34 | 0.11 | 81.04 | 14.03 | 3.48 |
| FHS15-1 | 1.4 | 49.45 | 5.08 | 0.06 | 86.4 | 9.04 | 3.09 |
| SX005-5 | 3.1 | 37.58 | 3.45 | 0.11 | 86.46 | 8.79 | 3.28 |
| SX008-8 | 0.3 | 76.23 | 0.94 | 0.24 | 68.8 | 23.03 | 6.7 |
| Sample | BET Specific Surface Area (m2/g) | BJH Cumulative Specific Surface Area (m2/g) | BJH Total Pore Volume (mL/mg) | Average Pore-Throat Radius (nm) |
|---|---|---|---|---|
| WZ3-3 | 0.50 | 1.62 | 1.91 | 11.17 |
| WY3-2 | 0.47 | 1.51 | 1.32 | 7.93 |
| BF3-1 | 0.12 | 0.71 | 0. 90 | 23.18 |
| SX005-2 | 1.25 | 2.21 | 4.47 | 12.88 |
| SX013-1-3 | 1.38 | 2.72 | 6.35 | 16.08 |
| SX008-2 | 1.31 | 2.55 | 5.83 | 16.04 |
| SX011-3 | 0.35 | 1.54 | 2.24 | 21.06 |
| SX025-3 | 0.40 | 1.26 | 1.36 | 10.58 |
| SGJ15-1 | 0.31 | 1.63 | 1.71 | 16.77 |
| WTP15-1 | 0.31 | 1.37 | 1.54 | 13.80 |
| FHS15-1 | 0.32 | 1.11 | 1.37 | 13.04 |
| SX0015-5 | 0.09 | 0.94 | 1.12 | 38.84 |
| SX0015-8 | 1.68 | 2.66 | 8.53 | 19.29 |
Disclaimer/Publisher’s Note: The statements, opinions and data contained in all publications are solely those of the individual author(s) and contributor(s) and not of MDPI and/or the editor(s). MDPI and/or the editor(s) disclaim responsibility for any injury to people or property resulting from any ideas, methods, instructions or products referred to in the content. |
© 2023 by the authors. Licensee MDPI, Basel, Switzerland. This article is an open access article distributed under the terms and conditions of the Creative Commons Attribution (CC BY) license (https://creativecommons.org/licenses/by/4.0/).
Share and Cite
Jia, M.; Huang, W.; Li, Y. Quantitative Characterization of Pore Structure Parameters in Coal Based on Image Processing and SEM Technology. Energies 2023, 16, 1663. https://doi.org/10.3390/en16041663
Jia M, Huang W, Li Y. Quantitative Characterization of Pore Structure Parameters in Coal Based on Image Processing and SEM Technology. Energies. 2023; 16(4):1663. https://doi.org/10.3390/en16041663
Chicago/Turabian StyleJia, Mingyue, Wenhui Huang, and Yuan Li. 2023. "Quantitative Characterization of Pore Structure Parameters in Coal Based on Image Processing and SEM Technology" Energies 16, no. 4: 1663. https://doi.org/10.3390/en16041663
APA StyleJia, M., Huang, W., & Li, Y. (2023). Quantitative Characterization of Pore Structure Parameters in Coal Based on Image Processing and SEM Technology. Energies, 16(4), 1663. https://doi.org/10.3390/en16041663