Article

Control of the Energy Impact of Electric Discharges in a Liquid Phase

1
Institute of Physical and Chemical Technologies and Materials Science, Nizhny Novgorod State Technical University n.a. R.E. Alekseev, Nizhny Novgorod 603950, Russia
2
Institute of Electric Power Engineering, Nizhny Novgorod State Technical University n.a. R.E. Alekseev, Nizhny Novgorod 603950, Russia
*
Author to whom correspondence should be addressed.
Energies 2023, 16(4), 1683; https://doi.org/10.3390/en16041683
Submission received: 9 January 2023 / Revised: 22 January 2023 / Accepted: 3 February 2023 / Published: 8 February 2023
(This article belongs to the Special Issue Smart Solutions and Devices for the Power Industry)

Abstract

:
This paper describes the scheme and algorithm for controlling a laboratory setup that result in low uncertainty and high convergence with respect to the characteristics of electric discharges under the conditions of variable parameters of a reaction medium. The article presents current and voltage oscillograms when processing hydrocarbon raw materials. Methods for calculating the energy impact of electrical discharge are described. A comparison is made between the parameters of electric discharge with current pulse limitations and those without current pulse duration limitations. The proposed approach to controlling the characteristics of electric discharges provides the same parameters of nonthermal nonequilibrium plasma and, as a result, a regular composition of the products of plasma pyrolysis of hydrocarbon raw materials.

1. Introduction

With the increasing demand for energy and accompanying greenhouse gas emissions, all of which reduce readily available fossil fuels, it is necessary to develop technologies for processing heavy hydrocarbon raw materials and renewable energy sources such as biofuels, modernize current technological schemes in the chemical industry, and switch to carbon-free electricity [1,2,3]. About 25% of greenhouse gas emissions worldwide resulted from industrial activities, with CO2 being the most common greenhouse gas. In the chemical industry, significant CO2 emissions are associated with oil refineries and the production of ethylene, which accounts for about 10% of the greenhouse gases of the chemical industry [4]. The development of new technologies in the field of chemical production can lead to a decrease in energy intensity by 25% and the decarbonization of the chemical industry [5,6].
Depending on ethylene production technology, the process of cracking crude oil is carried out at a temperature of 550–1100 °C, which requires the combustion of hydrocarbon fuels to maintain the required temperatures; this, in turn, leads to CO2 emissions [7,8]. The transition from high-temperature pyrolytic furnaces to plasma reactors operating using carbon-free electricity will significantly reduce CO2 emissions.
Plasma processes are already widely used in the chemical industry, that is, in metallurgy, hydrocarbon cracking, biomass gasification, and air purification [2,9,10,11]. Plasma technologies can be used for refining heavy oil to reduce the use of hydrogen and avoid the need for using expensive catalysts in conventional hydroprocessing methods [12,13,14]. Plasma can be divided into thermal and nonthermal types [15]. The amount of power consumption required to create thermal plasma is relatively high (tens of kilowatts). The temperature of thermal plasma is usually above 10,000 °C [16,17]. Part of the input power for generating thermal plasma is lost due to an increase in the system’s temperature. Although high temperatures are required for the reaction, consuming a large amount of electricity to heat a system is not economically feasible. In contrast, the input power required to generate nonthermal plasma is relatively small and does not cause a clear increase in the system’s temperature. Nonthermal plasma generates high-energy electromagnetic fields, energetic electrons, free radicals, an excited state, and many other active particles [18,19].
The use of nonequilibrium plasma for chemical processes allows highly endothermic reactions at moderate temperatures, limiting the effect of Joule heating and thereby minimizing the energy loss observed when heating gases. Typical products of plasma-chemical pyrolysis are hydrogen, shorter-chain hydrocarbons, alkenes, condensation products, and various forms of carbon. Effective control of plasma-chemical pyrolysis is provided by the regulation of three processes: (1) initiation reactions with the formation of radicals, (2) generation of secondary radicals to maintain the process, and (3) termination of chain reactions by the recombination of radicals to form target products. Nonequilibrium low-temperature plasma allows the regulation of the relative rates of thermal, initiating, and radical processes to change the composition of the main products. Together, the synergistic electron thermal effect enhances the chemical activity of the plasma, making it a promising alternative to low-throughput, high-temperature chemical processes. The activation of organic substances occurs due to the impact of pulsed electrical discharges on the substrate [20]. Inside the reactor, a fixed distance is created between the electrodes using plasma in the gas phase, which will provide electrical discharges at a certain voltage. During the process in a liquid medium, products accumulate in the reaction volume, which can cause a change in the electrical strength of the reaction mixture, and this leads to a change in the breakdown voltage. A decrease in the breakdown voltage leads to the ignition of an electric arc. The electric arc is a concentrated source of heat, which increases the temperature inside the reactor, and a further transformation of the substrate is associated with the effect of temperature on it [21].
Although some large-scale applications of plasma processes have been demonstrated, a number of problems still prevent the widespread adoption of plasma in the chemical industry [22]. The use of pulsed discharges, on the one hand, makes it possible to increase the energy efficiency of the process; however, on the other hand, it requires significant costs for the power source, power semiconductors, and control system. In addition, the pulse technology generates a large amount of electromagnetic interference, which requires additional measures to ensure electromagnetic compatibility both with other devices and with the microprocessor control system of the installation. It is not easy to transfer the plasma process from the laboratory to industrial applications. Designing the entire plasma system, which includes both the reactor and the power unit, for increased capacities is the biggest challenge that requires solutions in order to upscale the technology.
During a spark discharge, rapidly disappearing filamentous spark channels filled with plasma appear. The lifetime of the discharge is short; therefore, heating does not occur for the entire reaction volume [23]. This makes it possible to predict and stabilize the effect of plasma on the character of transformations. When conducting research on the direction of substrate transformations, it is necessary to evaluate the effect of voltages and the duration of exposure on the intensity of chemical transformations. Therefore, one of the requirements is the ability to control the parameters of electrical discharges.
This article proposes an algorithm for controlling the characteristics of electrical discharges under conditions of variable parameters of the reaction medium. The main purpose of the study is to create conditions for generating identical electrical discharges to maintain the same parameters of the impact of nonthermal nonequilibrium plasma on hydrocarbon raw materials and, as a result, the same composition of the products obtained. The object of the study is vacuum gas oil, which is used for cracking processes to produce ethylene [24]. The creation of plasma in liquid hydrocarbons can result in the creation of small-sized reactors with high productivity and selectivity, which differ from the plasma formed in gaseous hydrocarbons.

2. Materials and Methods

2.1. Description of the Laboratory Setup

Figure 1 shows the setup of the working reactor (made of Teflon, 40 cm3 volume) used in this study, where graphite electrodes (6 mm diameter) were mounted inside. A DC voltage source with variable voltages ranging from 100 to 300 V was used to generate low-voltage discharges by varying the distance between the electrodes. The temperature in the reactor ranged from 80 to 120 °C. The unit of energy per amount of substance in low-voltage pulsed discharges reaches 700–900 kJ/mol. Consequently, the generated energy is much higher than the energy required to break chemical bonds, which leads to the formation of highly active particles [25,26]. The composition of gas-phase products was determined by utilizing gas chromatography with flame ionization detection using a Kristall 5000.2 gas chromatograph. The resulting gas was cooled and trapped in a gas trap. The reactor was set up such that the pressure was almost constant. As the object of the study, vacuum gas oil (VGO) with the following characteristics was used: density at 20 °C—0.909 g/cm3; kinematic viscosity at 100 °C—6.648 mm2/s; sulfur content—1.806%; initial boiling point—321.1 °C; final boiling point—577.6 °C.
Figure 1 shows the following components: P—reactor vessel; E—electrodes; RDC—regulated DC source; T—trap for gaseous products; V—valve; RC—reflux condenser; CB—capacitor bank; VS—voltage sensor; M—clutch; SM—stepper motor; D—stepper motor driver; CS—current sensor; MCS—microprocessor control system; PS—stepper motor power supply; VT1 and VT2—IGBT transistors.
Two IGBT transistors were used to regulate the discharge time. The first transistor charges the capacitor bank from a voltage source. In this case, the first transistor is open and the second is closed. The second transistor ensures the discharge of the capacitor bank when the electrodes in the reactor are closed. In this case, the first transistor is closed, and the second is open. The generation of low-voltage discharge is carried out by the automatic regulation of the distance between the electrodes.
In addition to knowing the currents and voltages generated by pulsed power systems, it is often desirable to know how much energy they generate. Direct measurement of energy is generally not necessary, since it can be calculated from the measured values of the time-dependent current and voltage. The energy of the electric discharge acting on the substance in the reactor depends on the current voltage, current, and time.
At a constant voltage value and the same composition of the raw materials loaded into the reactor, the amplitude of the current pulse changes insignificantly. However, during plasma pyrolysis, the composition of the raw materials changes due to the formation of gaseous hydrocarbons and solid products in the form of various forms of carbon. By-products of pyrolysis, which are in the liquid phase, change the dielectric strength. In addition, solid carbon particles can enter the interelectrode space and cause secondary discharges, which differ significantly from primary discharges in their characteristics. Secondary discharges lead to the acceleration of condensation processes and the growth of solid particles, which significantly affects the composition of the products. Therefore, it is necessary to limit the discharge energy in order to increase the convergence of experimental work. Since the voltage is constant and is set on an external DC source, and the current is a function of voltage, the way to limit the discharge energy can be to limit the pulse duration.
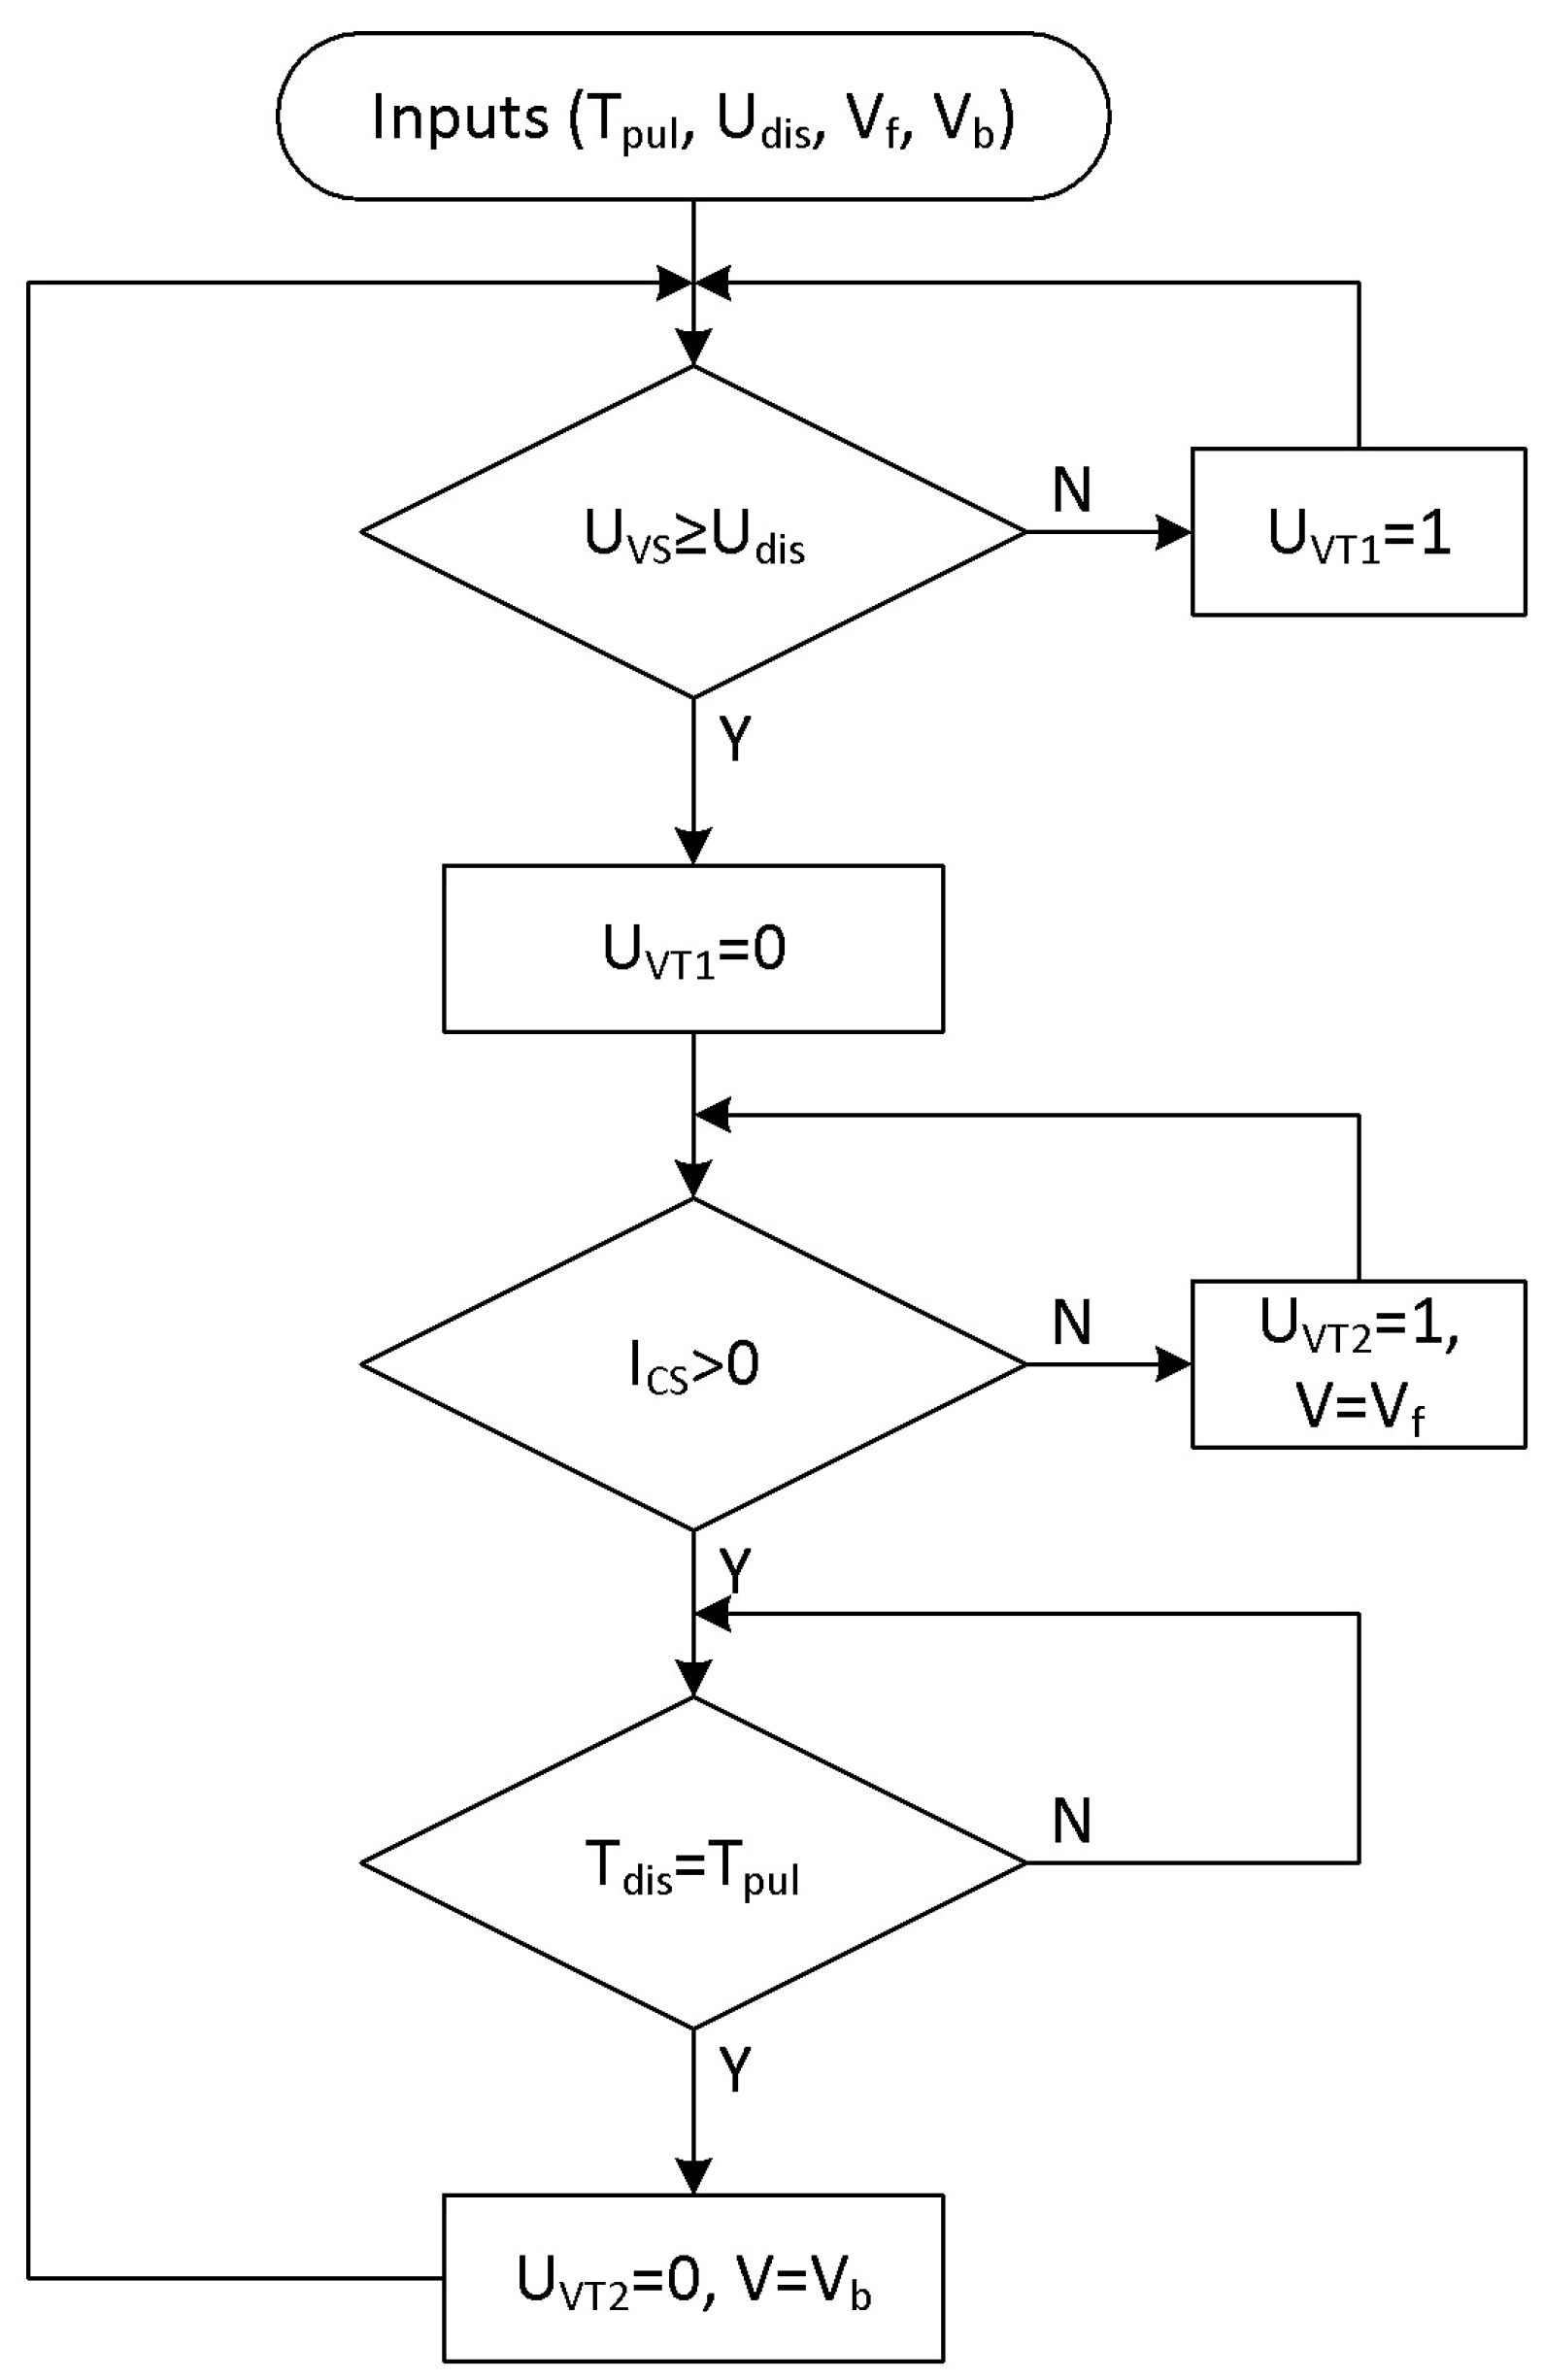
A block diagram of a duration control electric discharges algorithm is shown in Figure 2. The major inputs are Tpul—preassigned duration of the discharge, Udis—preassigned discharge voltage, Vf—linear velocity of the electrodes approaching, and Vb—linear velocity of the electrodes moving away. The measured voltage Uvs is compared with the voltage Udis. If the voltage Uvs is less than the voltage Udis, then the semiconductor switch VT1 opens, which charges CB. As soon as the voltage Uvs exceeds the voltage Udis, the semiconductor switch VT1 closes, and the semiconductor switch VT2 opens. The control system monitors the discharge current Ics from the current sensor. If the current Ics is less than zero, then a signal of the approach of the electrodes with the speed Vf is generated. As soon as the current Ics is greater than zero, the control system compares the discharge time Tdis with the set duration Tpul. The semiconductor switch VT2 closes under the condition Tdis = Tpul, and the electrode in the reactor begins to move away from the stationary electrode at the speed Vb. Then the cycle repeats. The energy of the electric discharge is directly proportional to the discharge time. Thus, by adjusting the pulse duration, it is possible to control the energy released in the reactor. The parameters Vf and Vb affect the pulse frequency.
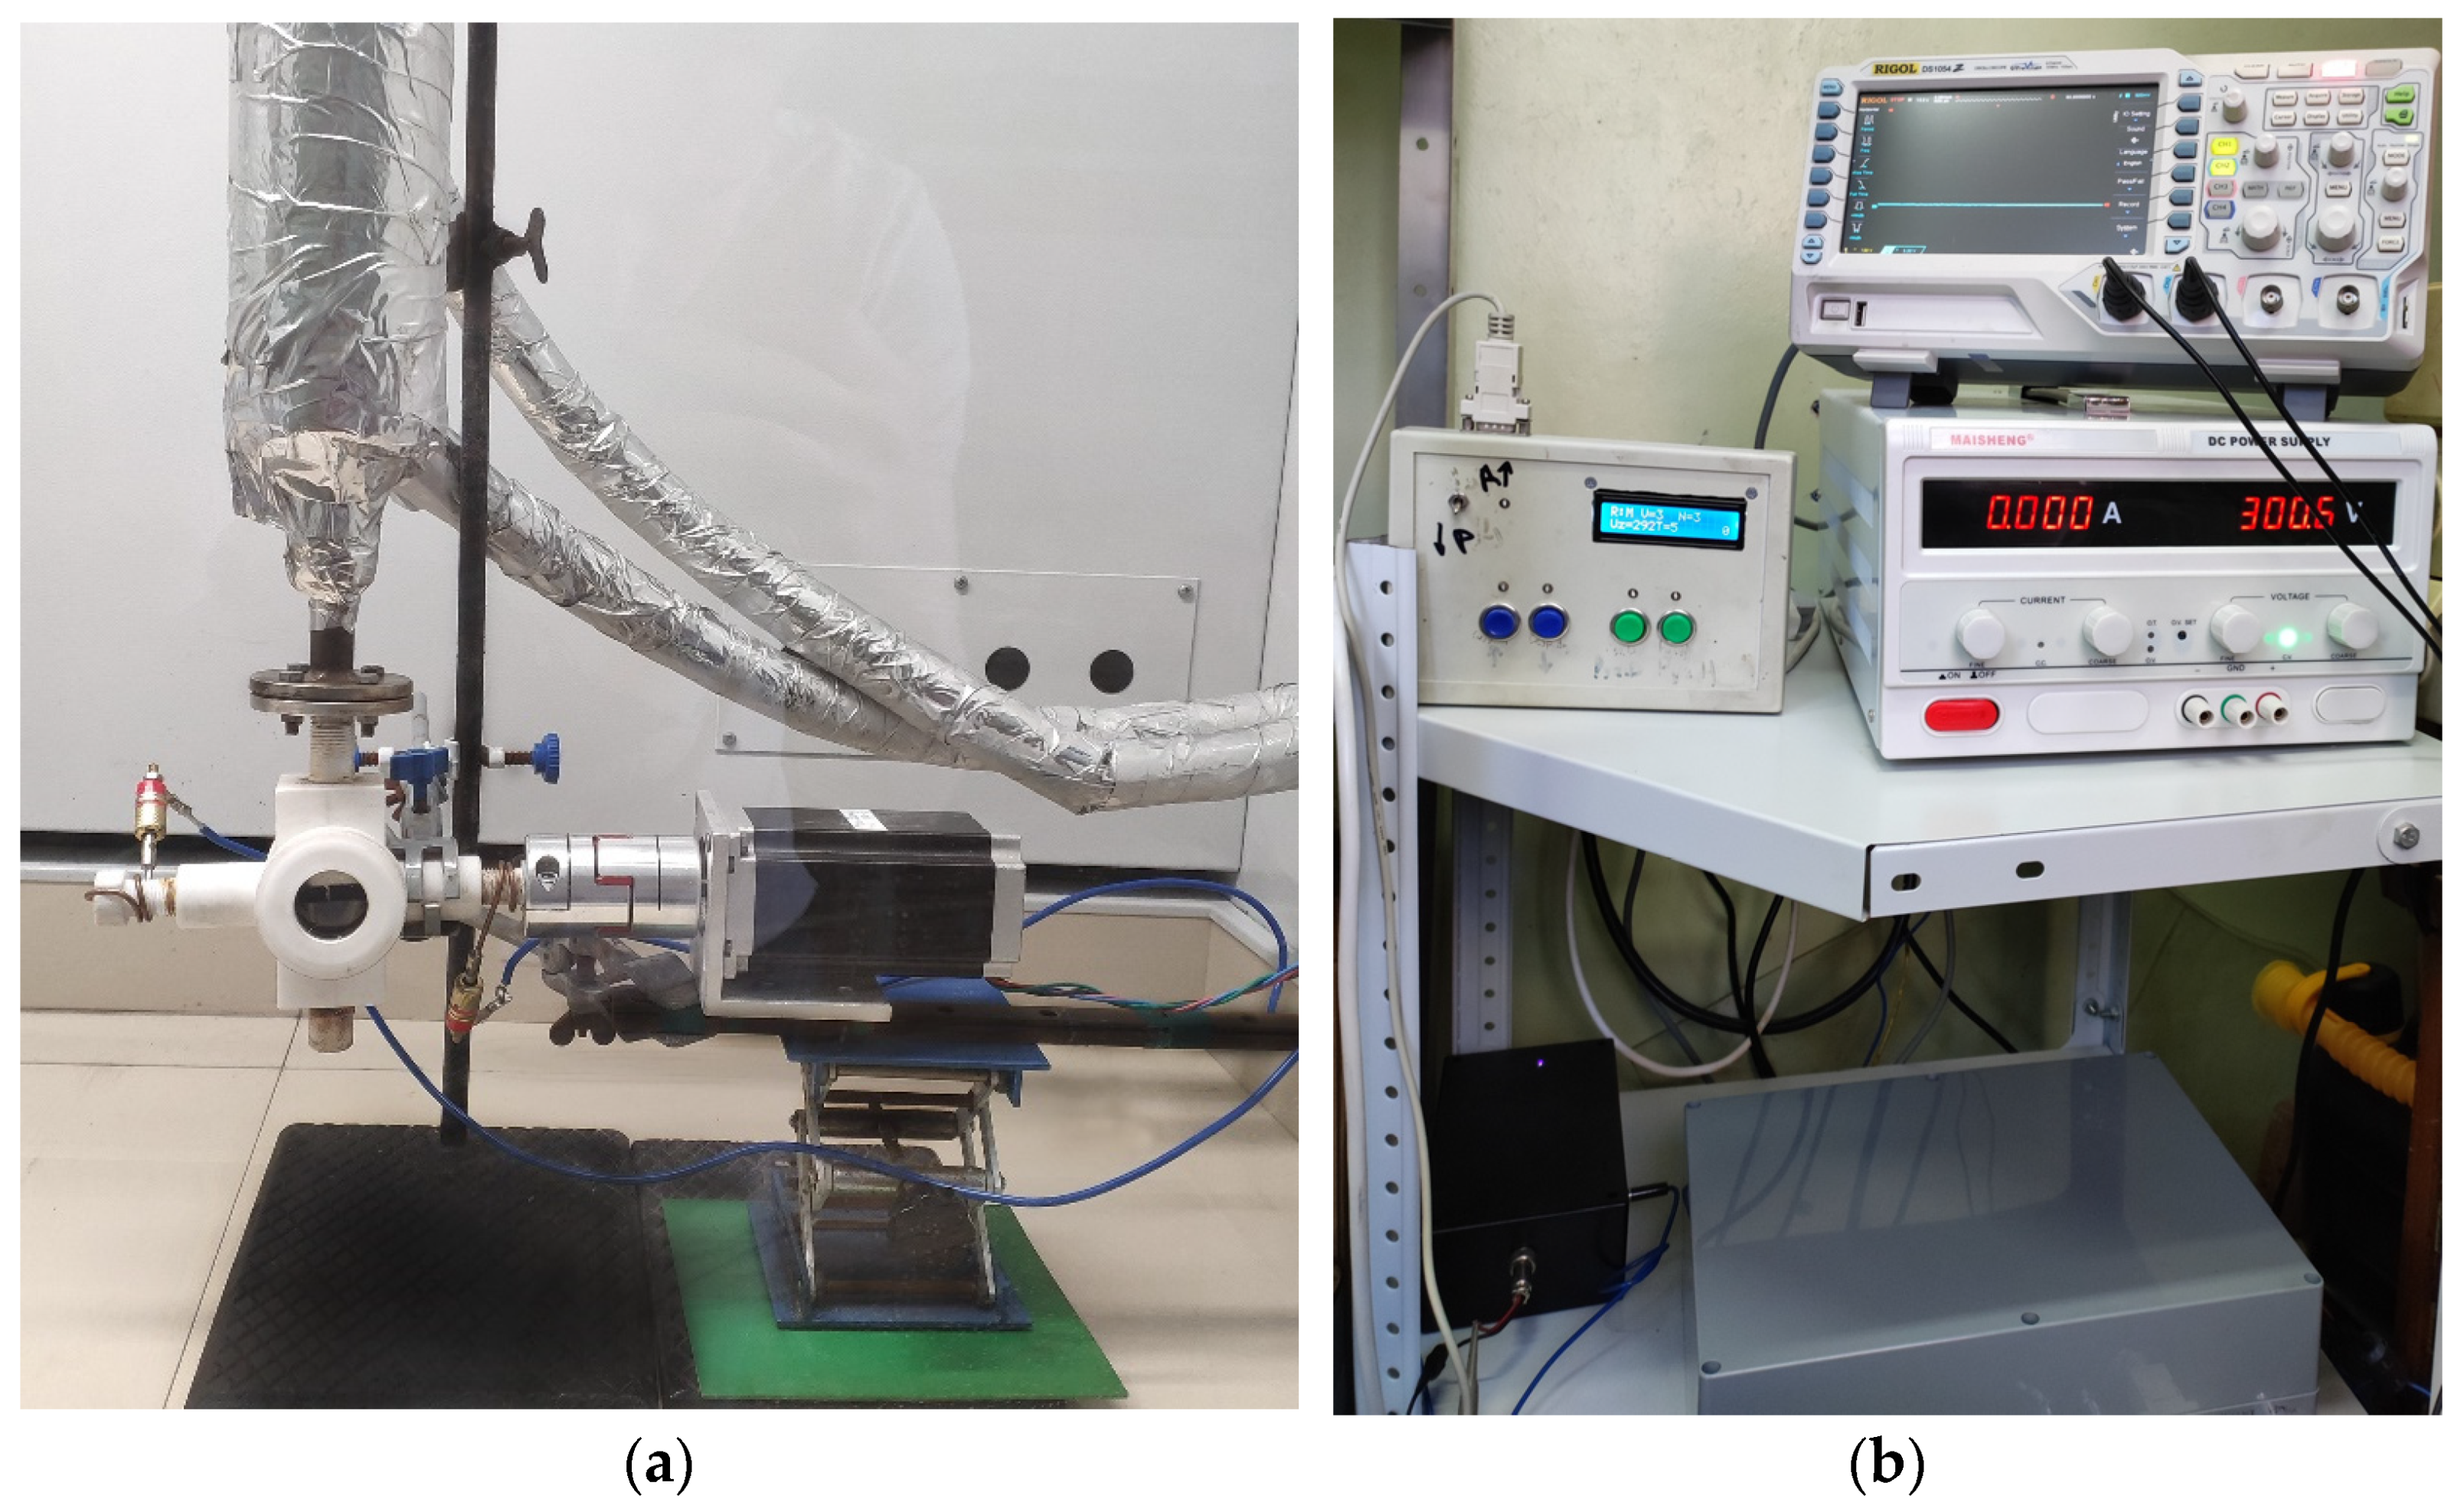
Figure 3 shows a view of the laboratory setup.
The regulated power supply allows setting the voltage at which a discharge occurs between the movable and stationary electrode E. The instantaneous value of the discharge current measured by the current sensor is processed in the microprocessor control system, which sets the direction of rotation and the speed of rotation of the shaft of the stepper motor by means of driver D. The motor shaft is connected by coupling M to the reverse element of the reactor vessel, into which the electrode is inserted.
The installation operating modes are manual or automatic. In the manual mode, one can control the rotation of the shaft and set the values of the speed of rotation of the shaft, voltage, and duration of the discharge, even for the automatic mode.

2.2. Methodology of Experiment

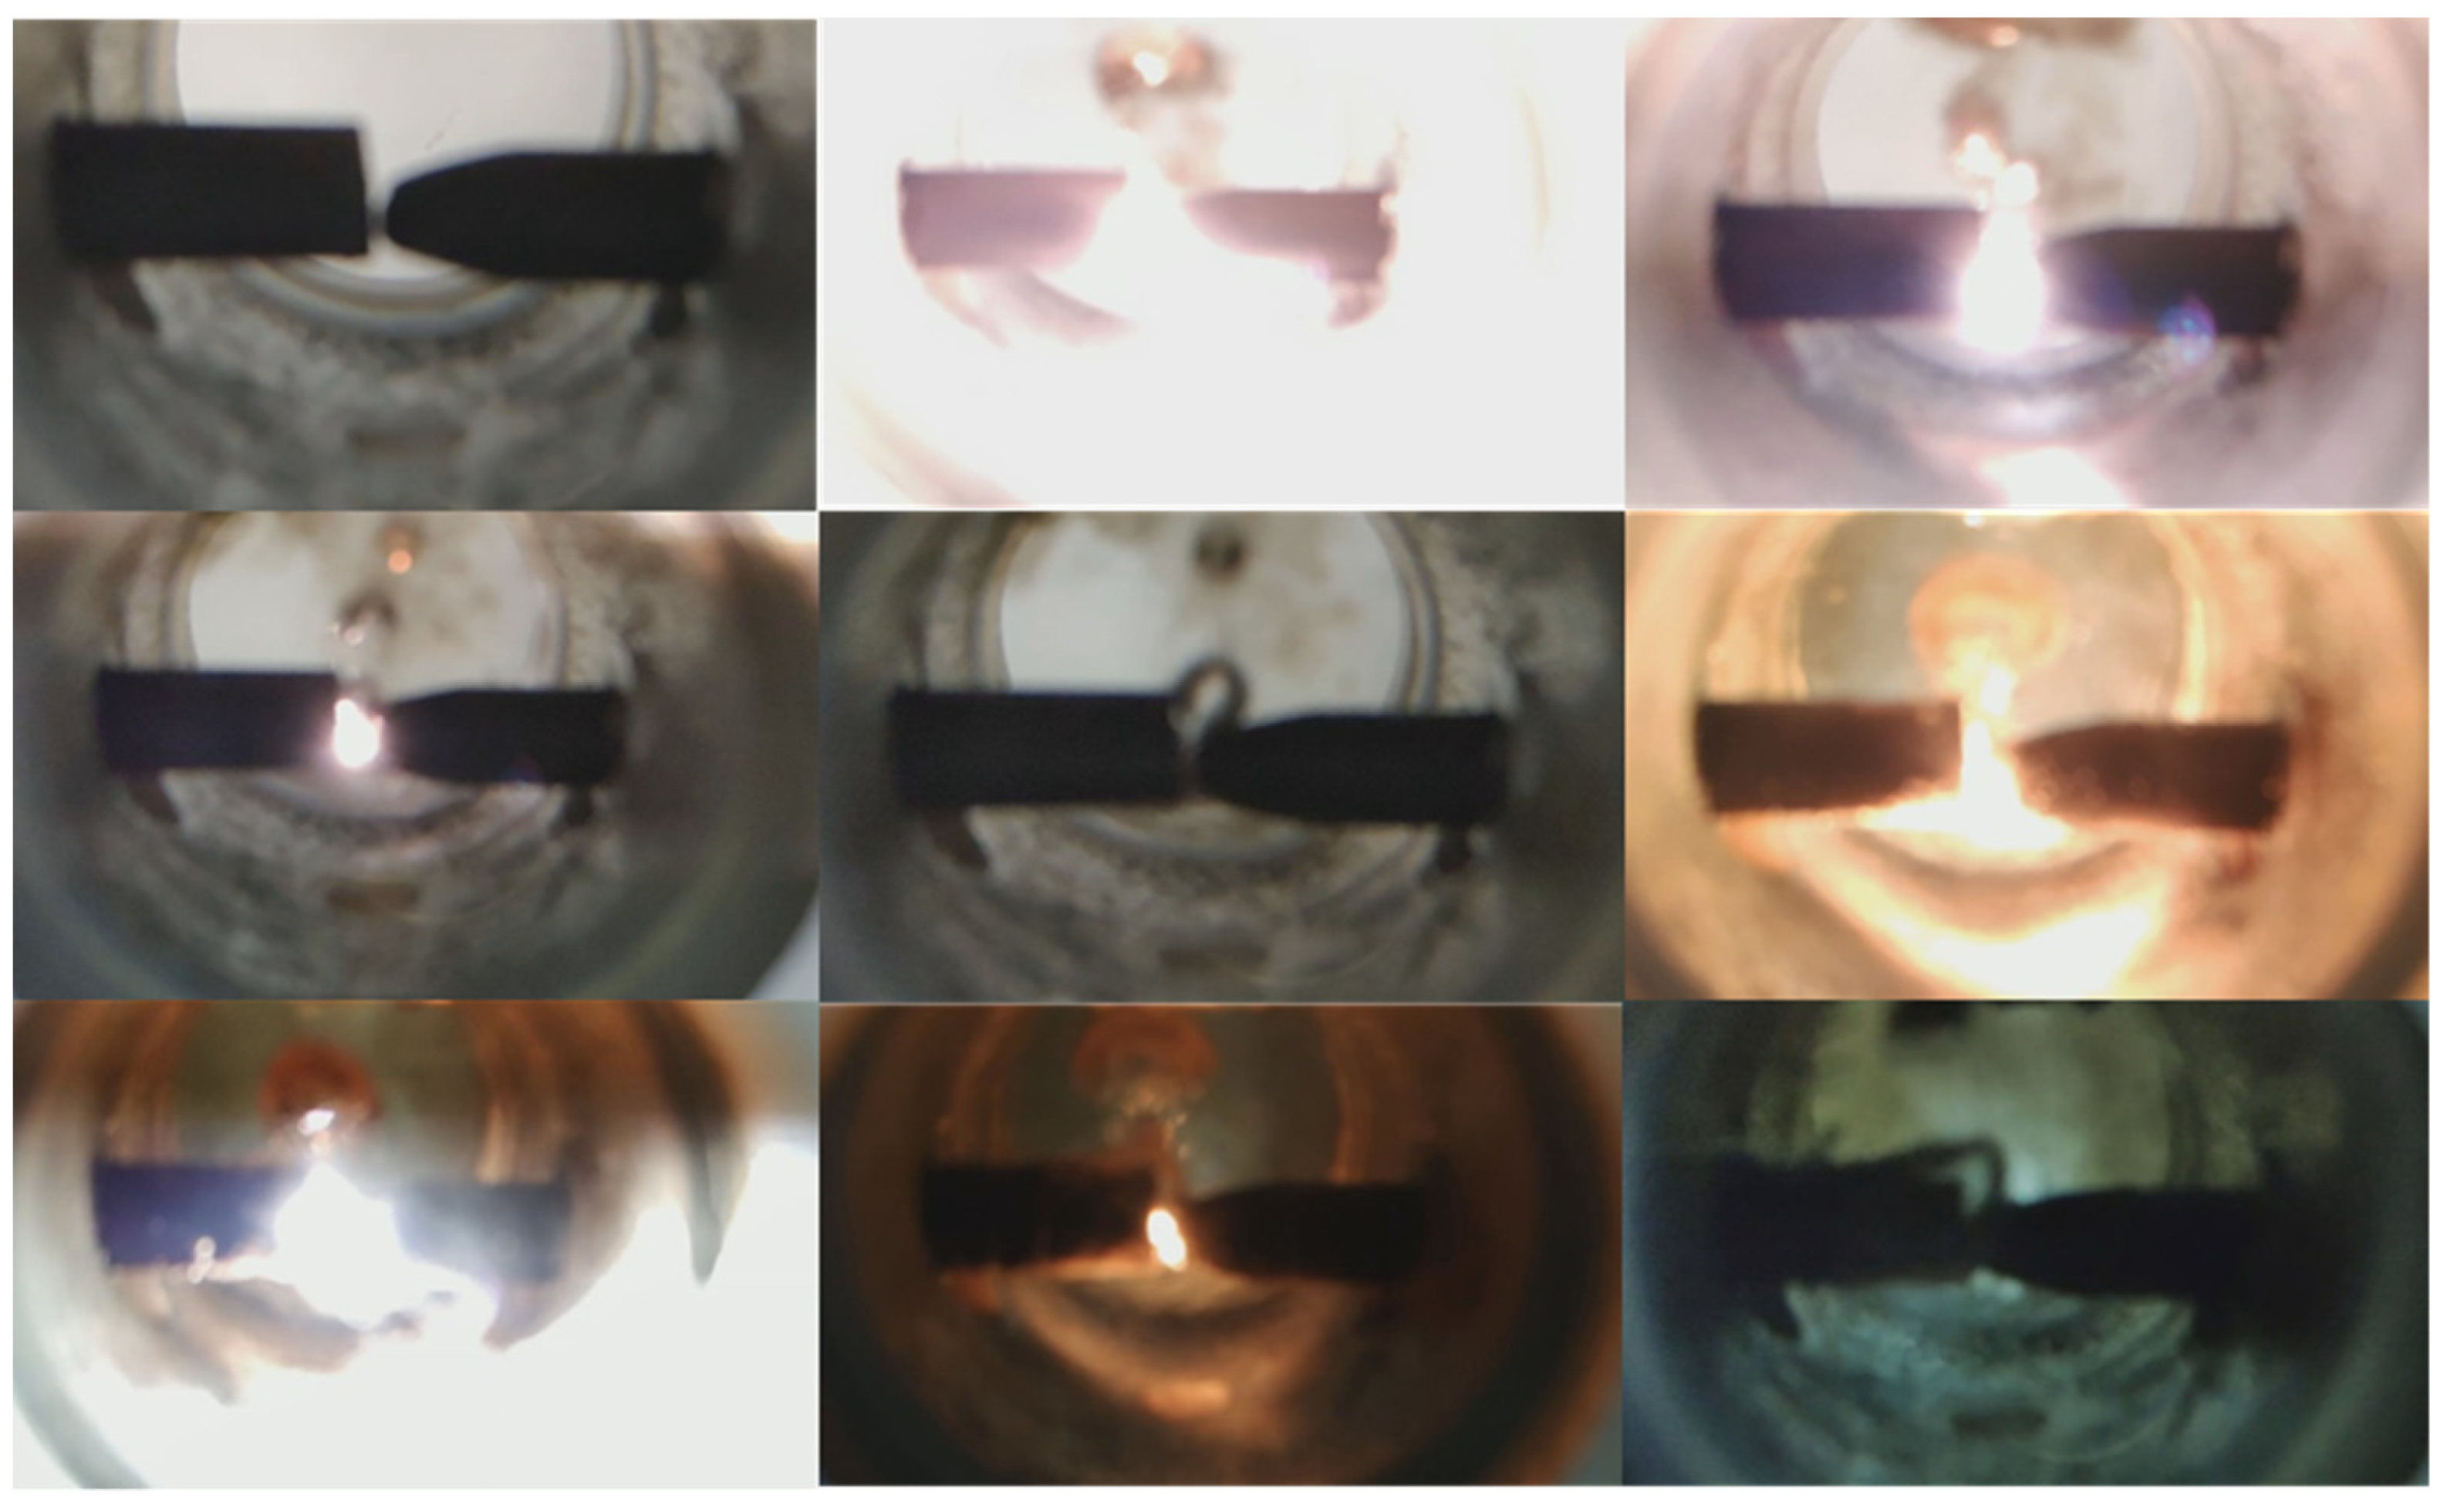
There are four stages [27,28,29,30] during liquid breakdown processes (Figure 4):
Electronic—the generation of charge carriers on metal electrodes by field emission or field ionization; the formation of the coverage area of the charge. The electronic stage begins when the electrodes approach a critical distance. Random primary electrons near the cathode provide a low initial current. Primary electrons drift towards the anode, ionizing the gas and generating electron avalanches.
Electrothermal—an increase in temperature due to the observation of the movement of charge carriers, the formation of dynamics with density at the points of the greatest dissipation of energy, crown photo, potential instability. The electrothermal stage begins with a further approach of the electrodes. In this case, an unstable glow is observed.
Gas discharge—the formation of a gas discharge channel from the cathode to the anode, light radiation, heat, breaking molecular bonds, the formation of radicals and ions. At this stage, a bright glow is observed, and a large number of gas bubbles are formed (Figure 4).
Physicochemical—discharge quenching, decrease in temperature, the recombination of ions and radicals, the formation of molecular products. At this stage, there is no plasma glow, but gas bubbles are still forming.
By controlling each stage, it is possible to influence the rate of chemical transformations and the qualitative and quantitative composition of the resulting products [31,32,33,34]. Changing the speed of the rotation of the reactor electrode leads to a change in the duration of the discharge. With a long duration (low speed), the discharge can turn into an arc, which will affect the composition of reaction products and lead to the growth of carbon particles on the electrode’s surface. It is also necessary to control the frequency of discharges. To improve the performance of the process, discharges should be as frequent as possible. However, the gaseous reaction products (Figure 4) must be removed from the discharge zone; otherwise, they will enter into secondary transformations, and the composition of the resulting products will change.
In the automatic mode, at the beginning of the operation, when the voltage on the capacitor bank is lower than the specified one, the first transistor is open and the capacitor is charged to the specified voltage. After reaching a predetermined voltage level on the capacitor, the first transistor proceeds into the closed state, and the second one progresses into the open state. The convergence of the electrodes begins until the discharge current appears. The discharge current is detected with the current sensor by the control system, and after a predetermined time value, the control system closes the second key, thereby regulating the duration of the discharge. After the discharge, the electrodes in the reactors move away from each other, and a new cycle of work begins when the battery of capacitors is charged.
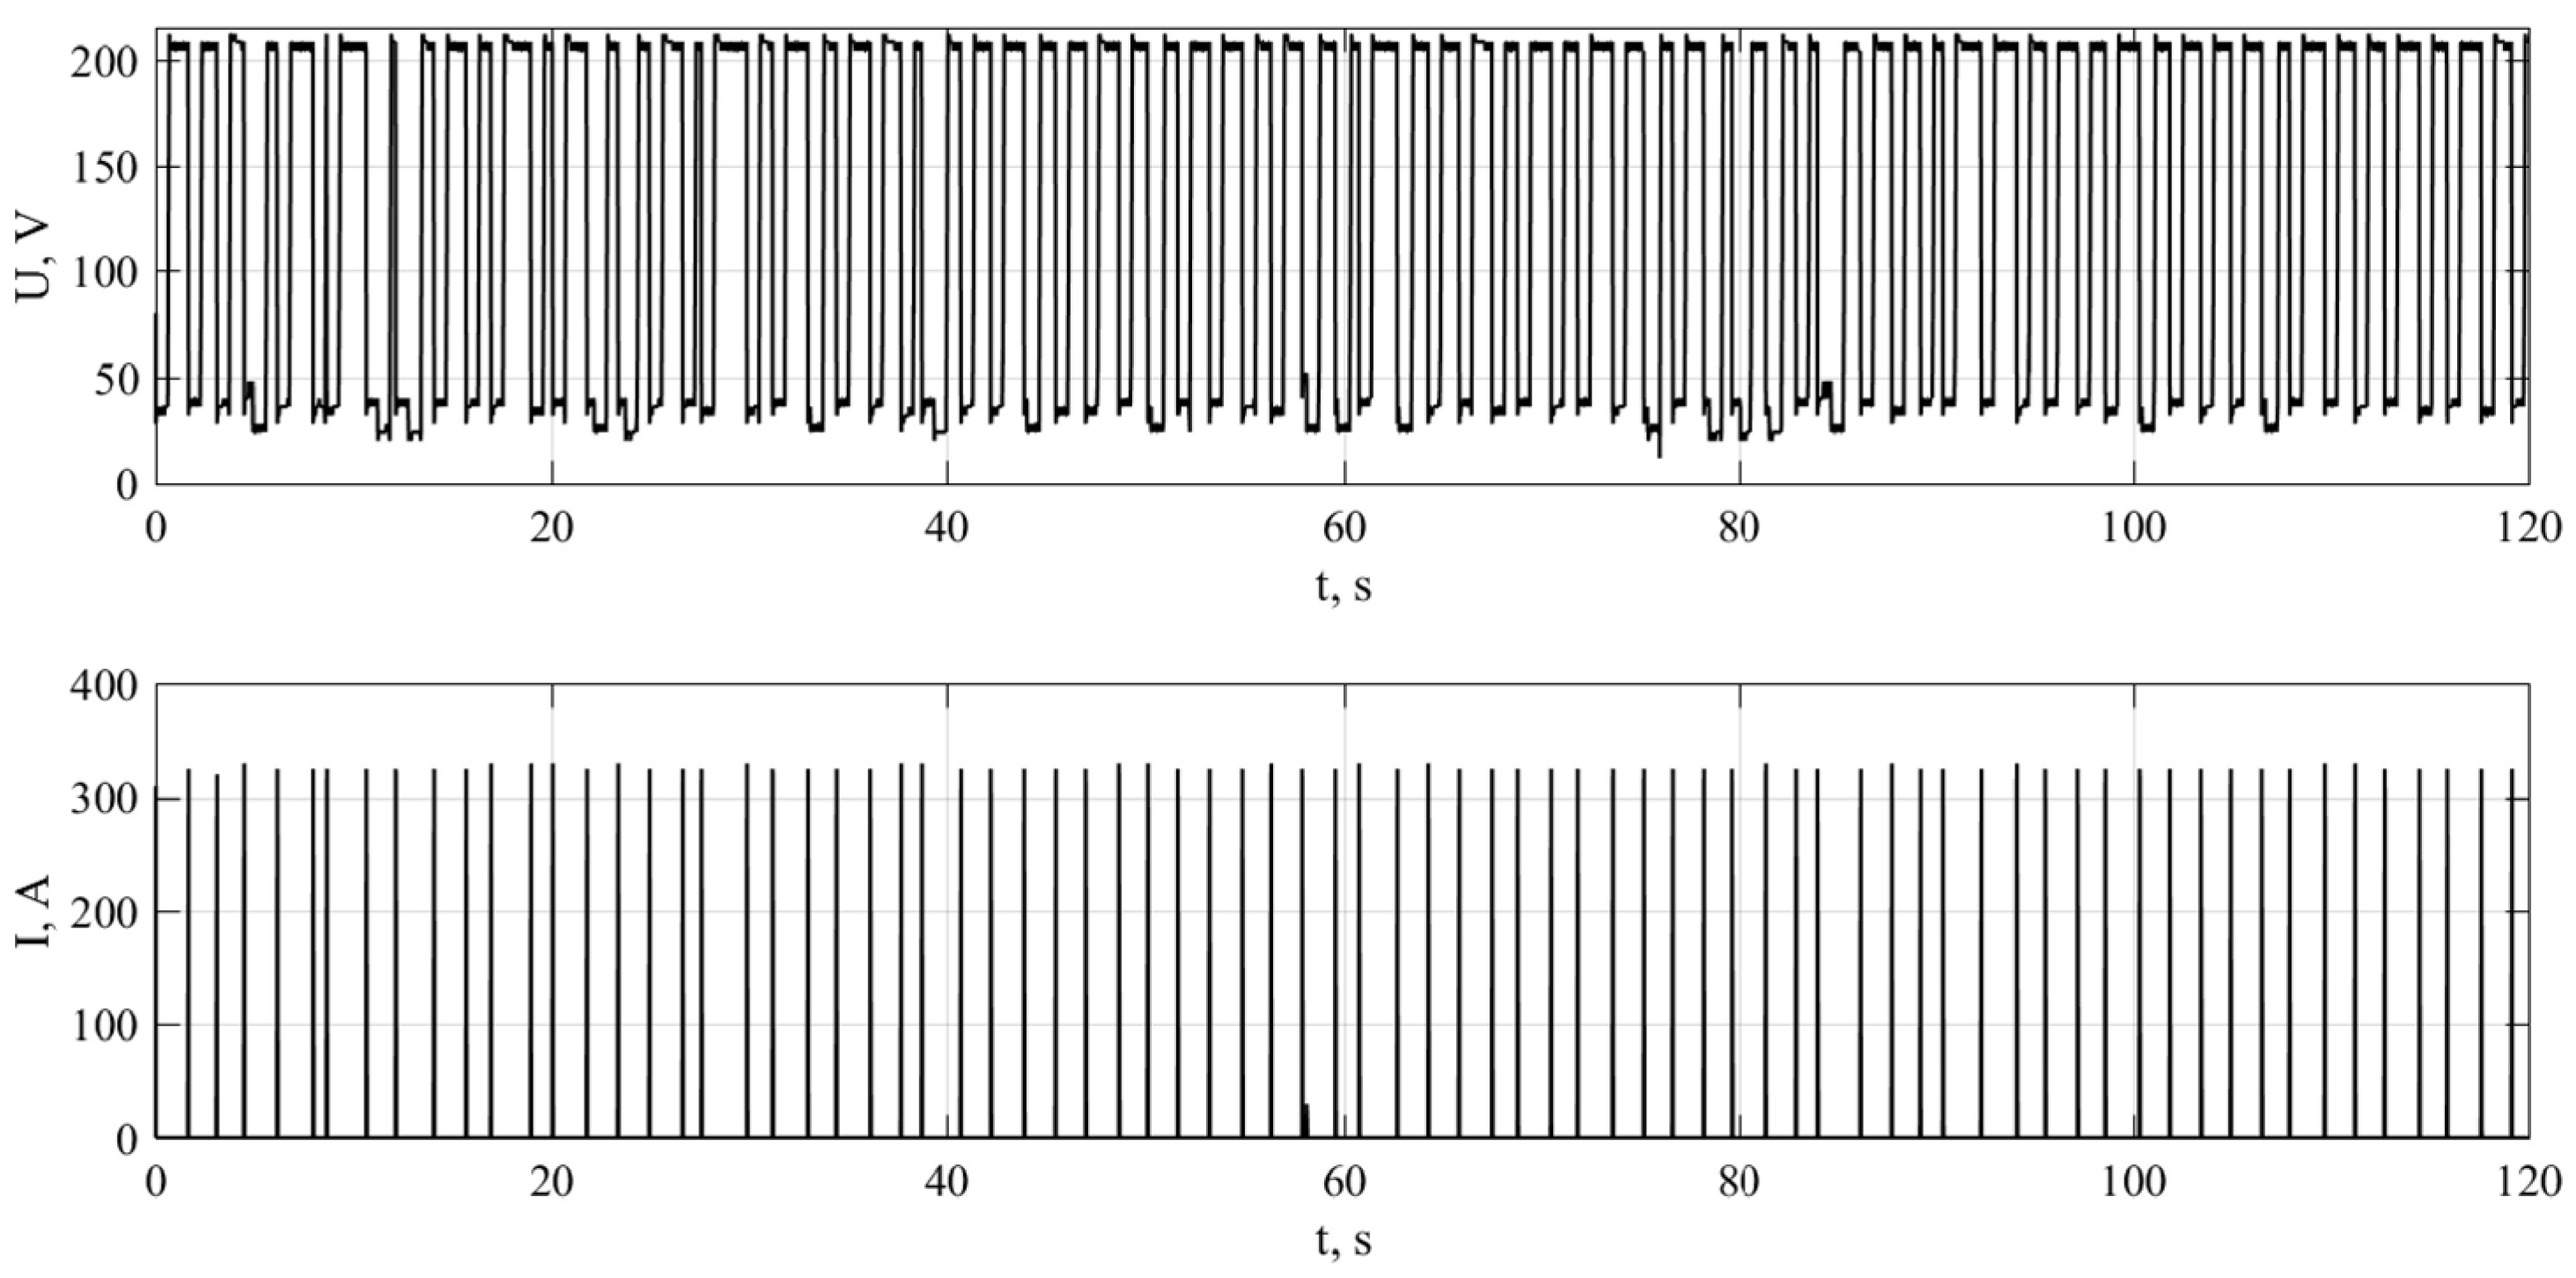
A typical oscillogram of the pulse generation process is shown in Figure 5.
The voltage and current values from voltage and current sensors are also recorded using a Rigol DS1054Z oscilloscope. The resulting oscillograms are used to calculate the characteristics of the discharge during the reaction.
The regulation of the duration of the electric discharge is carried out by a microprocessor control system. The pulse duration is measured from the rising edge of the current. The transistor VT2 closes when the set duration is reached. The typical oscillograms of current and voltage pulses in the process of plasma-chemical cracking of VGO on a laboratory setup are shown in Figure 6, Figure 7 and Figure 8.

3. Results and Discussion

3.1. Method for Determining the Energy Impact of Electric Discharges

During the experiment (120 min), the oscilloscope records instantaneous current and voltage values. The instantaneous current and voltage values are recorded by the oscilloscope at intervals of 2 min (600,000 values of the measured value). The measured current and voltage values are processed in the MATLAB program to obtain graphic images of transients over time and to determine the parameters of current pulses. The program calculates the number of pulses at each measurement interval, the duration of each pulse, and the total time of the impact of discharges on the substance, and then it writes the amplitude of each pulse (the maximum value of the pulse current) to the array. Next, the average values are calculated:
The average pulse duration is calculated as
t a v e r = t n
where t denotes the total duration of the pulses, and n denotes the number of pulses;
The average pulse frequency is calculated as
f a v e r = n t r e c
where t r e c denotes the recording time of the oscillogram;
The average amplitude of the pulses is calculated as
A a v e r = A n
where A denotes the sum of the amplitudes of each pulse;
The pulse energy is calculated as [35]
E = U d · I d · T i m p
where Ud is the root mean square voltage at the time interval of the discharge, Id is the root mean square of the current at the time interval of the discharge, and Tipm is the pulse time. The average pulse energy is defined as the sum of the pulse energies divided by the number of pulses.
The standard error, u, is estimated as [36]
u = ( X i X m e a n ) 2 n ( n 1 )
where n denotes the number of values, Xi denotes the i value in the array, and Xmean denotes the average value in the array.

3.2. Results of Experiment

The control system allows adjusting the pulse time. Table 1 shows the parameters of the electric discharge during the destruction of VGO under the action of electric discharges in the liquid phase without controlling the pulse duration.
Table 2 shows the parameters of the electric discharge during the destruction of VGO under the action of electric discharges in the liquid phase with the control of the pulse duration. The set pulse duration is 1 ms.
On one side, the discharge duration is not limited at low voltage since the discharge of the capacitor during an electric discharge occurs faster than the specified pulse duration. On the other hand, the minimum pulse time is limited by the turn-off time of transistor VT2. An additional battery of capacitors can be used when carrying out the destruction of substances at a low voltage of up to 100 V. This will increase the discharge energy and use the proposed algorithm for its limitation.
Table 3 shows the characteristics of the process and the results of the analysis of the composition of the gas formed during the plasma pyrolysis of VGO at a voltage of 100–300 V and an experiment time of 1 h.
The composition of the gas during the plasma pyrolysis of VGO contains high concentrations (mol %) of hydrogen at 51.8–56.0, acetylene at 28.6–29.4, and ethylene at 6.9–8.4. An increase in the power of electrical discharges from 0.036 to 0.201 J during the pyrolysis of VGO leads to an increase in the productivity of the installation in terms of gas flow by four times from 5.2 to 21.5 mL/h and a decrease in energy consumption by 2.8 times from 235.3 to 83.3 kWh/kg of gas. Such a sharp decrease in energy consumption is due to the fact that at a higher discharge power, a significant amount of radicals are generated, which support chain reactions and the formation of secondary radicals. However, it also leads to a change in the composition of products in the gas phase. The yield of hydrogen is reduced from 56.0 to 51.8 mol%, and the ethylene content increases from 6.9 to 8.4 mol%. with an increase in the energy of electrical discharges. At the same time, it is not necessary to significantly increase the voltage to increase the productivity of the process, that is, increase the discharge energy, since ultrahigh pulsed discharges lead to the destruction of the electrodes due to the electrohydraulic effect. Therefore, further work will be associated with an increase in the frequency of pulses and a decrease in the time of electrical discharges during plasma pyrolysis in the liquid phase. The high concentration of hydrogen and acetylene in the gas makes it possible, if necessary, to carry out the semihydrogenation process to increase the yield of ethylene [37].

4. Conclusions

The article describes a laboratory setup for regulating the impact of electrical discharges in a liquid phase. An algorithm for the operation of the laboratory setup and a technique for processing oscillograms were described. The algorithm provides for limiting the duration of the electric discharge. This is implemented by forcibly turning off the transistor, which leads to a break in the electrical circuit and the cessation of current in the reactor. A comparison was made of the parameters of electric discharges with and without the limitation of the duration of discharges. It is shown that the limitation of the duration ensures the repeatability and convergence of the results. The developed setup and the algorithm for generating discharges can be used to ensure the constancy of the composition of the products obtained during the processing of hydrocarbon raw materials. The authors plan to continue their research in the following areas:
(a)
Search for optimal modes of processing substances to reduce energy costs, increase the productivity of the installation, and increase the yield of the main products;
(b)
Modification of the semiconductor key control circuit to limit the discharge time to nanosecond ranges, which will reduce the thermal effect of the plasma;
(c)
Expanding the scope of the application of plasma-chemical pyrolysis for the processing of renewable bio-raw materials, industrial waste, and carbon dioxide.

Author Contributions

Conceptualization, E.T. and I.B.; methodology, E.T.; software, D.T.; validation, D.T. and I.B.; formal analysis, D.T.; investigation, E.T.; resources, E.T.; data curation, D.T.; writing—original draft preparation, D.T. and E.T.; writing—review and editing, I.B.; visualization, E.T.; supervision, I.B.; project administration, E.T.; funding acquisition, E.T. All authors have read and agreed to the published version of the manuscript.

Funding

This research was funded by the Russian Science Foundation grant number No. 21-73-10119.

Institutional Review Board Statement

Not applicable.

Informed Consent Statement

Not applicable.

Data Availability Statement

Data sharing is not applicable to this article.

Acknowledgments

The study was supported by the Russian Science Foundation, Grant No. 21-73-10119, https://rscf.ru/project/21-73-10119/ (accessed on 5 February 2023).

Conflicts of Interest

The authors declare no conflict of interest. The funders had no role in the design of the study; in the collection, analyses, or interpretation of data; in the writing of the manuscript; or in the decision to publish the results.

References

  1. Bataille, C.; Åhman, M.; Neuhoff, K.; Nilsson, L.J.; Fischedick, M.; Lechtenböhmer, S.; Solano-Rodriquez, B.; Denis-Ryan, A.; Stiebert, S.; Waisman, H.; et al. A review of technology and policy deep decarbonization pathway options for making energy-intensive industry production consistent with the Paris Agreement. J. Clean. Prod. 2018, 187, 960–973. [Google Scholar] [CrossRef]
  2. Rathore, K.; Bhuiyan, S.I.; Slavens, S.M.; Staack, D. Microplasma ball reactor for JP-8 liquid hydrocarbon conversion to lighter fuels. Fuel 2021, 285, 118943. [Google Scholar] [CrossRef]
  3. Riyanto, T.; Istadi, I.; Buchori, L.; Anggoro, D.D.; Dani Nandiyanto, A.B. Plasma-Assisted Catalytic Cracking as an Advanced Process for Vegetable Oils Conversion to Biofuels: A Mini Review. Ind. Eng. Chem. Res. 2020, 59, 17632–17652. [Google Scholar] [CrossRef]
  4. De Pee, A.; Pinner, D.; Roelofsen, O.; Somers, K.; Speelman, E.; Witteveen, M. Decarbonization of Industrial Sectors: The Next Frontier; McKinsey & Company: Amsterdam, The Netherlands, 2018. [Google Scholar]
  5. Eryazici, I.; Ramesh, N.; Villa, C. Electrification of the chemical industry—Materials innovations for a lower carbon future. MRS Bull. 2021, 46, 1197–1204. [Google Scholar] [CrossRef]
  6. Wery, F.; Geerts, M.; Vandewalle, L.A.; Reyniers, P.A.; Heynderickx, G.J.; Marin, G.B.; Van Geem, K.M. Assessing the CO2 emission reduction potential of steam cracking furnace innovations via computational fluid dynamics: From high-emissivity coatings, over coil modifications to firing control. Chem. Eng. Res. Des. 2023, 190, 129–142. [Google Scholar] [CrossRef]
  7. Fairuzov, D.; Gerzeliev, I.; Maximov, A.; Naranov, E. Catalytic Dehydrogenation of Ethane: A Mini Review of Recent Advances and Perspective of Chemical Looping Technology. Catalysts 2021, 11, 833. [Google Scholar] [CrossRef]
  8. Dolganov, I.; Bunaev, A.; Dolganova, I. Unsteady-State Mathematical Modeling of Hydrocarbon Feedstock Pyrolysis. Processes 2020, 8, 1394. [Google Scholar] [CrossRef]
  9. Okubo, M. Recent Development of Technology in Scale-up of Plasma Reactors for Environmental and Energy Applications. Plasma Chem. Plasma Process. 2022, 42, 3–33. [Google Scholar] [CrossRef]
  10. Rabinovich, A.; Nirenberg, G.; Kocagoz, S.; Surace, M.; Sales, C.; Fridman, A. Scaling Up of Non-Thermal Gliding Arc Plasma Systems for Industrial Applications. Plasma Chem. Plasma Process. 2022, 42, 35–50. [Google Scholar] [CrossRef]
  11. Kuwahara, T.; Yoshida, K.; Kuroki, T.; Hanamoto, K.; Sato, K.; Okubo, M. High Reduction Efficiencies of Adsorbed NOx in Pilot-Scale Aftertreatment Using Nonthermal Plasma in Marine Diesel-Engine Exhaust Gas. Energies 2019, 12, 3800. [Google Scholar] [CrossRef] [Green Version]
  12. Khosravi, A.; Khani, M.R.; Goy, E.D.; Shokri, B. The Processing of Pyrolysis Fuel Oil by Dielectric Barrier Discharge Plasma Torch. Plasma Chem. Plasma Process 2018, 38, 365–378. [Google Scholar] [CrossRef]
  13. Titov, E.Y.; Bodrikov, I.V.; Serov, A.I.; Kurskii, Y.A.; Titov, D.Y.; Bodrikova, E.R. Liquid-Phase Non-Thermal Plasma Discharge for Fuel Oil Processing. Energies 2022, 15, 3400. [Google Scholar] [CrossRef]
  14. Wang, K.; Bhuiyan, S.I.; Baky, M.A.H.; Kraus, J.; Campbell, C.; Jemison, H.; Staack, D. Electric fuel conversion with hydrogen production by multiphase plasma at ambient pressure. Chem. Eng. J. 2022, 433, 133660. [Google Scholar] [CrossRef]
  15. Bruggeman, P.J.; Kushner, M.J.; Locke, B.R.; Gardeniers, J.G.E.; Graham, W.G.; Graves, D.B.; Hofman-Caris, R.C.H.M.; Maric, D.; Reid, J.P.; Ceriani, E.; et al. Plasma-liquid interactions: A review and roadmap. Plasma Sources Sci. Technol. 2016, 25, 053002. [Google Scholar] [CrossRef]
  16. Fabry, F.; Rehmet, C.; Rohani, V.; Fulcheri, L. Waste gasification by thermal plasma: A review. Waste Biomass Valorization 2013, 4, 421–439. [Google Scholar] [CrossRef]
  17. Cheng, Y.; Li, T.; Yan, B.; Cheng, Y. Thermodynamic analysis of asphaltene pyrolysis in thermal plasma reactor. Shiyou Huagong/Petrochem. Technol. 2015, 44, 1168–1176. [Google Scholar]
  18. Shao, T.; Wang, R.; Zhang, C.; Yan, P. Atmospheric-pressure pulsed discharges and plasmas: Mechanism, characteristics and applications. High Volt. 2018, 3, 14–20. [Google Scholar] [CrossRef]
  19. Lebedev, Y.A. Microwave discharges in liquid dielectrics. Plasma Phys. Rep. 2017, 43, 685–695. [Google Scholar] [CrossRef]
  20. Diono, W.; Machmudah, S.; Kanda, H.; Zhao, Y.; Goto, M. Pulsed Discharge Plasma in High-Pressure Environment for Water Pollutant Degradation and Nanoparticle Synthesis. Plasma 2021, 4, 21. [Google Scholar] [CrossRef]
  21. Zhang, H.; Du, C.; Wu, A.; Bo, Z.; Yan, J.; Li, X. Rotating gliding arc assisted methane decomposition in nitrogen for hydrogen production. Int. J. Hydrog. Energy 2014, 39, 12620–12635. [Google Scholar] [CrossRef]
  22. Delikonstantis, E.; Scapinello, M.; Stefanidis, G.D. Process Modeling and Evaluation of Plasma-Assisted Ethylene Production from Methane. Processes 2019, 7, 68. [Google Scholar] [CrossRef] [Green Version]
  23. Zin, R.M.; Soon, C.F.; Yusof, N.M.; Rizon, E.R.; Morsin, M.; Tee, K.S.; Ahmad, M.K.; Nayan, N. Dimmer and neon transformer as a power controllable generator for atmospheric pressure plasma jet. Int. J. Power Elec. Drive Syst. 2019, 10, 594–601. [Google Scholar] [CrossRef]
  24. Ren, T.; Patel, M.; Blok, K. Olefins from conventional and heavy feedstocks: Energy use in steam cracking and alternative processes. Energy 2006, 31, 425–451. [Google Scholar] [CrossRef]
  25. Titov, E.Y.; Titov, D.Y.; Bodrikov, I.V.; Kut’in, A.M.; Kurskii, Y.A.; Gazizzulin, R.R. A Device for Generation of Low-Voltage Discharges in Liquid Dielectric Media. High Energy Chem. 2018, 52, 512–513. [Google Scholar] [CrossRef]
  26. Bodrikov, I.V.; Kut’in, A.M.; Titov, E.Y.; Titov, D.Y.; Kurskii, Y.A.; Gazizullin, R.R. Fragmentation of thiophene and 3-methyl-2-thiophenecarboxaldehyde by direct liquid phase low-voltage discharges. Plasma Proc. Pol. 2018, 15, 1800094. [Google Scholar] [CrossRef]
  27. Watson, P.K.; Schneider, J.M.; Till, H.R. Electrohydrodynamic Stability of Space-Charge-Limited Currents in Dielectric Liquids. II. Experimental Study. Phys. Fluids 1970, 13, 1955–1961. [Google Scholar] [CrossRef]
  28. Sunka, P. Pulse electrical discharges in water and their applications. Phys. Plasm. 2001, 8, 2587–2594. [Google Scholar] [CrossRef]
  29. An, W.; Baumung, K.; Bluhm, H. Underwater streamer propagation analyzed from detailed measurements of pressure release. Appl. Phys. 2007, 101, 053302. [Google Scholar] [CrossRef]
  30. Xu, S.; Khalaf, P.I.; Martin, P.A.; Whitehead, J.C. CO2 dissociation in a packed-bed plasma reactor: Effects of operating conditions. Plasma Sources Sci. Technol. 2018, 27, 075009. [Google Scholar] [CrossRef]
  31. Bodrikov, I.V.; Ivanova, A.G.; Vasiliev, A.L.; Titov, E.Y.; Titov, D.Y.; Serov, A.I. Influence of low-voltage discharge energy on the morphology of carbon nanostructures in induced benzene transformation. RSC Adv. 2021, 11, 39428–39437. [Google Scholar] [CrossRef]
  32. Zhang, S.; Gao, Y.; Sun, H.; Fan, Z.; Shao, T. Dry reforming of methane by microsecond pulsed dielectric barrier discharge plasma: Optimizing the reactor structures. High Volt. 2022, 7, 1–12. [Google Scholar] [CrossRef]
  33. Zhao, Z.; Li, J.T. Repetitively pulsed gas discharges: Memory effect and discharge mode transition. High Volt. 2020, 5, 569–582. [Google Scholar] [CrossRef]
  34. Sun, J.; Chen, Q.; Guo, Y.; Zhou, Z.; Song, Y. Quantitative behavior of vibrational excitation in AC plasma assisted dry reforming of methane. J. Energy Chem. 2020, 46, 133–143. [Google Scholar] [CrossRef]
  35. Altgilbers, L.L.; Baird, J.; Freeman, B.L.; Lynch, C.S.; Shkuratov, S.I. Explosive Pulsed Power; Imperial College Press: London, UK, 2011. [Google Scholar]
  36. Sneyd, J.; Fewster, R.M.; McGillivray, D. Mathematics and Statistics for Science; Springer Nature Switzerland AG: Cham, Switzerland, 2022. [Google Scholar]
  37. Hu, S.; Zhang, C.; Wu, M.; Ye, R.; Shi, D.; Li, M.; Zhao, P.; Zhang, R.; Feng, G. Semi-Hydrogenation of Acetylene to Ethylene Catalyzed by Bimetallic CuNi/ZSM-12 Catalysts. Catalysts 2022, 12, 1072. [Google Scholar] [CrossRef]
Figure 1. Block diagram of the laboratory setup.
Energies 16 01683 g001
Figure 2. Block diagram of a duration control electric discharges algorithm.
Energies 16 01683 g002
Figure 3. View of the reactor (a), control system, and DC power source (b).
Energies 16 01683 g003
Figure 4. Photos of pulsed discharges in the liquid phase.
Energies 16 01683 g004
Figure 5. Typical oscillogram of the pulse generation process (a); single pulse (b).
Energies 16 01683 g005
Figure 6. Oscillogram of impulses at a voltage of 100 V.
Energies 16 01683 g006
Figure 7. Oscillogram of impulses at a voltage of 200 V.
Energies 16 01683 g007
Figure 8. Oscillogram of impulses at a voltage of 300 V.
Energies 16 01683 g008
Table 1. Electric discharge parameters without controlling the pulse duration.
Characteristics of Electrical DischargesVoltage, V
100200300
Average pulse duration, ms0.841.1391.146
Average pulse frequency, Hz0.650.680.72
Average pulse amplitude, A133.42308.07323.94
Average pulse energy, J0.0370.2210.227
Table 2. Electric discharge parameters with the control of the pulse duration.
Characteristics of Electrical DischargesVoltage, V
100200300
Average pulse duration, ms0.841.010.99
Average pulse frequency, Hz0.650.670.69
Average pulse amplitude, A131.14312.97326.75
Average pulse energy, J0.0360.1990.201
Table 3. Characteristics of the plasma pyrolysis of VGO and the composition of gaseous products.
Voltage, V100200300
Energy consumption, kWh0.040.060.07
Energy consumption, kWh/kg of gas235.3120.083.3
Gas flow, ml/h5.213.421.5
Gas yield, wt%0.82.23.7
Gas composition, mol%
H256.053.351.8
CH44.65.05.6
C2H46.97.88.4
C2H60.30.40.4
C2H229.029.428.6
C3H81.11.62.0
C3H41.40.80.9
1,3-C4H60.10.40.6
C4H100.10.20.2
C5H120.51.11.5
Disclaimer/Publisher’s Note: The statements, opinions and data contained in all publications are solely those of the individual author(s) and contributor(s) and not of MDPI and/or the editor(s). MDPI and/or the editor(s) disclaim responsibility for any injury to people or property resulting from any ideas, methods, instructions or products referred to in the content.