Article

Economic Analysis of a Pumped Hydroelectric Storage-Integrated Floating PV System in the Day-Ahead Iberian Electricity Market

by
Arsenio Barbón
1,
Ángel Gutiérrez
2,
Luis Bayón
3,*,
Covadonga Bayón-Cueli
4 and
Javier Aparicio-Bermejo
5
1
Department of Electrical Engineering, University of Oviedo, 33003 Oviedo, Spain
2
Polytechnic School of Engineering of Gijón, University of Oviedo, 33003 Oviedo, Spain
3
Department of Mathematics, University of Oviedo, 33003 Oviedo, Spain
4
Det Norske Veritas (DNV) UK Limited, Department of Energy Systems, OPEX, Aberdeen AB10 1UQ, UK
5
Business Development Iberia Northwest Area, Enel Green Power, 28014 Madrid, Spain
*
Author to whom correspondence should be addressed.
Energies 2023, 16(4), 1705; https://doi.org/10.3390/en16041705
Submission received: 7 January 2023 / Revised: 27 January 2023 / Accepted: 31 January 2023 / Published: 8 February 2023
(This article belongs to the Section A2: Solar Energy and Photovoltaic Systems)

Abstract

:
This study identifies the optimal operational strategy for floating photovoltaic power plants and pumped hydroelectric power plants in the day-ahead Iberian electricity market. Different operating scenarios were analysed based on forecast accuracy in addition to any deviations occurring in the day-ahead market, taking into account the rules of the electricity market and the technical operational limitations of both plants. These scenarios show the choice between the independent mode of operation and the joint mode of operation of both plants. Five scenarios have been studied, with upward and downward deviations of 5 % , 10 % , 25 % and 50 % considered. These scenarios can be classified into two groups. If there are deviation penalties, group 1; or without deviation penalties, group 2. Scenarios 3 and 4 belong to the first group and scenarios 1, 2 and 5 to the second group. In the scenarios of the first group, the price deviations are used, and in the scenarios of the second group, the marginal market price is used. The economic benefit of the scenarios with deviation penalties is obtained in the joint operation mode of both plants. Economic benefits of up to 35% are obtained. In contrast, in the scenarios where there are no deviation penalties, the independent mode of operation is the optimum. The reason for this is the low efficiency of the pumping process. In this case, economic benefits of 1.6% are obtained. This study can be used to guide the decision-making process in the operation of both plants in order to maximise the economic benefit.

1. Introduction

Social development, as it has been envisaged since the industrial revolution, is the source of most greenhouse gas (GHG) emissions, as fossil fuels are mainly used to meet energy demand. For decades, the issue of climate change mitigation has been in the social and political focus, leading to the so-called Conference of the Parties (COP). At the last Conference of the Parties (COP27) in Egypt in 2022, attended by 196 countries plus the European Union, decisions were taken to strengthen action by countries to reduce greenhouse gas emissions [1]. The use of the application of renewable energies is one of the best options to achieve the COP27 objectives. In this sense, solar technologies are mature systems that can be applied in a wide variety of energy applications. More specifically, these systems can be used for industrial heat production [2], power generation [3], simultaneous production of thermal and electrical energy [4], water disinfection [5], etc.
One of the biggest problems with the use of renewable energy sources is that they lack a similar level of load-following flexibility. As they depend on weather conditions. Sometimes the joint use of several renewable energy technologies leads to synergies that benefit the joint application, such as the combined use of floating photovoltaic (FPV) power plants and pumped hydro (PH) power plants.
Ensuring a balance between electricity supply and demand is the objective of the electrical system. Buy and sell offers are usually organised in a wholesale energy market overseen by a market operator. This balance is achieved through market mechanisms, such as the day-ahead market (spot or pool)), and the intra-day market. The day-ahead market operation involves the submission of bids where agents can sell or buy energy for each hour of the following day. Once the day-ahead market is settled, bids are placed in the intra-day market.
With regard to electricity supply, power generation technologies must be analysed to determine how easy it is to increase or decrease their power output in order to better adapt to demand. For example, nuclear power plants do not perform well, while thermal power plants or hydroelectric power plants do. Since they depend on solar resources, photovoltaic ( P V ) power plants are difficult to adapt to the demand. This disadvantage is compensated by the low levelised cost of energy ( L C O E ). This parameter shows the trend in the cost reduction of P V power plants. For example, the weighted average L C O E in 2018 was 0.085 (USD/kWh), and is estimated to be between 0.02 and 0.08 (USD/kWh) in 2030 and between 0.014 and 0.05 (USD/kWh) in 2050 [6]. This reduction in L C O E can be explained by the substantial reduction in P V module costs [7].
In this regard, the International Renewable Energy Agency ( I R E N A ) presented a report in 2017 in which it predicted a 60 % drop in the cost of photovoltaic modules over the following 10 years [8]. While the price of P V modules has dropped, the cost of the land required for their installation, which is a substantial portion of the initial cost, has increased. The availability of adequate land in the high quantity required for the installation of a P V power plant is a key issue.
P V power plants are generally installed on the ground using fixed mounting systems or solar tracking systems [9]. Due to the increasingly low availability of suitable land, and awareness of the serious threat of deforestation, the search for available land has shifted towards the installation of P V power plants on canals, lakes, reservoirs and oceans. In these cases, the P V modules are installed on floating supports.
Therefore, two noteworthy problems have been detected in the use of P V power plants: (i) their difficulty in adapting to the demand, and (ii) the availability and price of land. The combined use of P V power plants and pumped hydroelectric power plants solves both problems.
Hydroelectric power plants remain the renewable technology that generates the most electricity, producing more than all other renewable sources combined [10]. Global hydropower capacity is at 1353 GW in 2021, and is expected to increase by 230 GW between 2021 and 2030 [10]. Therefore, the trend is for these types of systems to increase their presence in the electricity system. Europe has the largest capacity of pumped hydroelectric power plants [11]. Moreover, more than 80% of them were commissioned between 1960 and 1990 [11], before photovoltaic technology was in its current expansion. Therefore, synergies between the two technologies are possible without the need to build new pumped hydroelectric power plants.
On the one hand, a pumped hydroelectric power plant has free space for the installation of floating P V modules on the reservoir. On the other hand, the variability of the power generation from a P V power plant can be compensated by the reliability of the power generation from a pumped hydroelectric power plant. In this study, we will focus on this second aspect. Another interesting aspect is the possibility of storing energy from pumped hydroelectric power plants. Previous studies have emphasised the beneficial aspects from an electricity arbitrage perspective. In this study, the trading activity is not carried out simultaneously but rather in a time-lagged manner, thus generating energy in the present in order to make selling it in the future profitable.
The combination of floating P V ( F P V ) power plants and pumped hydroelectric ( P H ) power plants offers the following advantages:
(i)
Both technologies are clean, renewable energy sources with low greenhouse gas emissions;
(ii)
Reduced evaporation of water from reservoirs. The scarcity of clean water is a serious problem that affects all countries. One possible solution is to save water by reducing evaporation from open water surfaces. The assessment of surface water evaporation is complex as it depends on a number of factors such as open water surface, temperature, vapour pressure difference, wind effect, atmospheric pressure and water properties [12]. P V modules protect the water body from high evaporation and thus save water [13]. Agrawal et al. [12] presented a study on water evaporation in a reservoir with a floating solar P V installation at the Rajghat dam in the Bundelkhand region of Uttar Pradesh, India. They concluded that the annual reduction in evaporative water losses can be estimated at 1395 (m 3 ) per MWp or 0.9 (L/kWh). Farrar et al. [14] conducted a study on a large reservoir used to irrigate a farm in the Mafraq Governorate in Northern Jordan. They estimated that the installation of a floating P V system would save 12,700 (m 3 ) of water per year. This is equivalent to savings 42 % compared to the usual scenario without P V coverage. Melvin [15] presented a study on the influence of P V modules on the reduction of water evaporation in reservoirs in Singapore. The study showed that the floating P V module system on the reservoir had an evaporation rate reduction effect of approximately 30 % . Yao et al. [16] presented a technical report on the evaluation of the potential of floating and suspended covers in reducing evaporation from large water reservoirs or dams in South East Queensland (Australia). The report concluded that the annual evaporation reduction efficiency if the dams were fully covered would reach 76 % for suspended covers and 68 % for floating covers;
(iii)
Floating P V systems do not occupy land. The installation of a P V plant on fertile land suitable for agricultural use deprives humans of agricultural products for at least 25 years. If the land is not so fertile, it could be used for forestry development [12]. Floating photovoltaic systems free up land occupation which means the land can be used for other purposes;
(iv)
Increased electricity generation. P V modules increase power generation with better cooling systems. The efficiency of floating photovoltaic systems has been addressed by numerous studies. According to some studies, the efficiency gains with floating P V systems compared to ground-based systems range from 5 % to 15 % , while others estimate it to be below 5 % . According to Liu et al. [17] the performance ratio increases by 10 % with F P V systems. Choi [18] verifies that the generation efficiency of a floating P V system is 11 % higher. For Oliveira-Pinto and Stokkermans [19], this efficiency gain ranges from 0.31 % to 2.59 % , depending on the floating solar technology. According to El Hammoumi et al. [13], efficiency increases up to 2.33 % . On the other hand, water surfaces provide large areas free of shading objects, such as trees, decreasing the likelihood of external shading [20];
(v)
F P V systems improve water quality in reservoirs. The solar irradiance incident on the water in the reservoirs affects the mixture of substances present in the water, such as nitrogen or phosphorus, causing a decrease in the dissolved oxygen in the water and, as a result, an increase in the amount of algae [21]. This leads to a process known as eutrophication, which particularly occurs in summer. This phenomenon causes water pollution, seriously affecting aquatic life and the environment. A lack of sunlight restricts algae growth, thus reducing eutrophication. Considering floating PV systems prevent solar irradiance from hitting the water, they also restrain photosynthesis, thereby limiting pollution;
(vi)
Solar energy storage. The joint use of both technologies means energy can be stored, which addresses the problem of solar energy intermittency [22];
(vii)
The prevention of shore erosion. Floating P V modules hinder the strongest gusts of wind from eroding shorelines.
There are also disadvantages to this type of facility:
(i)
Uncertainty about the materials used in floating P V power plants. The degradation of the materials that comprise a floating P V system is one of the critical factors to consider. It affects the lifetimes of P V systems and L C O E [23]. These materials are always under the effects of water evaporation; therefore, exposure to oxidation and corrosion will always be higher than for terrestrial P V plants. These phenomena are accentuated when the water is salty [24]. Goswami and Sadhu [25] conducted an experimental study to determine the performance of a P V module in an F P V system and a ground P V system. The results showed that the average performance ratio and degradation rate were 71.58 % and 1.18 % , respectively, for the F P V system and 64.05 % and 1.07 % , respectively, for the ground P V system. There is a high degree of uncertainty at present in the behaviour of elements such as modules or anchors in wet environments;
(ii)
Increased initial investment costs. The initial investment costs are currently higher than for ground-based P V systems [26]. Due to the watery installation environment of F P V systems, flotation and mooring elements are needed for their mounting to avoid displacement caused by wind, waves or water currents. These elements increase the initial budget costs for engineering and material [27]. Obviously, the increase in initial costs is strongly dependent on the exact flotation and mooring equipment used. Oliveira-Pinto and Stokkermans [19] presented a comparative study between two different F P V systems irrespective of location. They showed that the mooring and anchoring systems used resulted in a 6 % difference in L C O E ;
(iii)
A limited tilt angle for PV modules. To avoid the detrimental effects of wind loads, the tilt angle of current float models is low. Depending on the location, this design condition can have a significant negative effect on power generation [28];
(iv)
Uncertainty about maintenance costs. Maintenance operations are often more complicated, e.g., require divers. Therefore, maintenance costs may suddenly increase significantly.
Zhao et al. [29] presented a study on the stability and efficiency performance of pumped hydro energy storage system. This work did not analyse the joint operation with a floating photovoltaic plant. Bakhshaei et al. [30] presented the optimisation of purchased power from the grid in a grid-connected pumped hydro/photovoltaic storage system considering a demand response program. This work did not take into account all scenarios of independent and joint operation of both technologies. Al-Masri et al. [31] studied the coordination and sizing of a photovoltaic plant connected to a pumped storage system at the King Talal Dam in Jordan. This work did not consider the scenario of energy sales. Shyam and Kanakasabapathy [32] presented a study on the integration of a small-scale FPV system into a pumped hydroelectric system in India. The functioning of the electricity market in India is very different from the Iberian electricity market, therefore the results of this study cannot be extrapolated.
The advantages of using both technologies together have been demonstrated in the literature. However, there is a lack of studies analysing the mode of operation of both technologies from an electricity market perspective. Therefore, the paper aims to analyse the joint operation of floating P V ( F P V ) power plants and pumped hydroelectric ( P H ) power plants in the day-ahead market. To this end, this document analyses the different operating scenarios for both technologies to help make the best possible choice in the electricity market. These scenarios are influenced by the concept called Net System Balancing Need ( N N B S , by its acronym in Spanish). This parameter studies, at the system level, whether the total production is greater or less than the scheduled production. Figure 1 shows an outline of the problem statement.
The specific contributions of this study can be summarised in the following proposals:
(i)
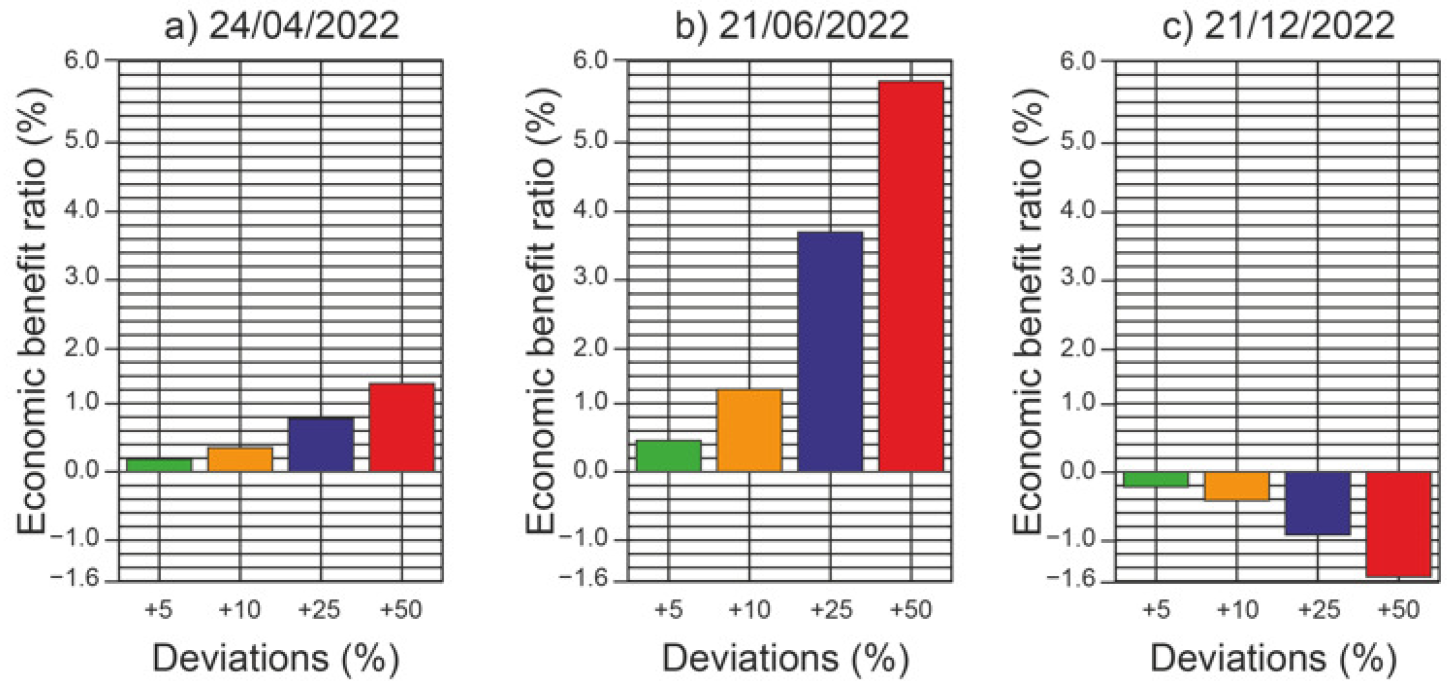
Various operating scenarios were analysed based on forecast accuracy in addition to any deviations occurring in the day-ahead market, taking into account the rules of the electricity market and the technical operational limitations of both plants;
(ii)
The optimal mode of operation has been identified for each of the scenarios analysed;
(iii)
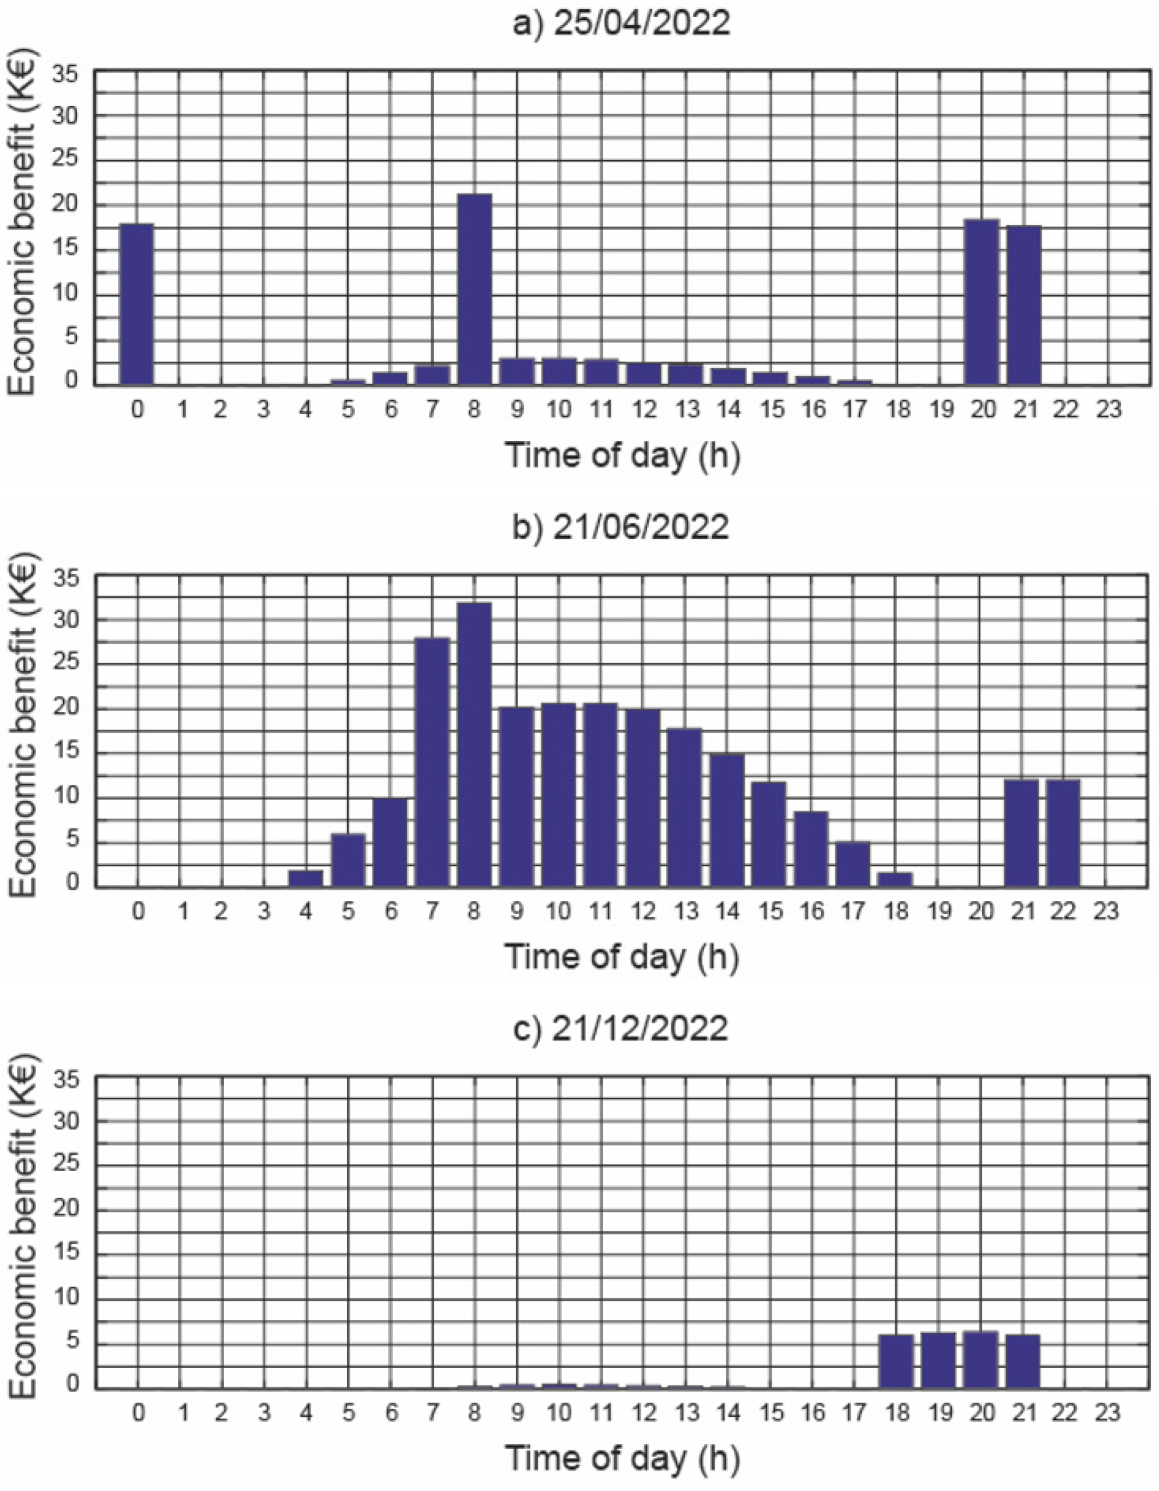
The economic benefit of the optimal mode of operation has been calculated for each of the scenarios analysed.
The remainder of the paper is organised as follows: Section 2 presents the background on the Iberian electricity market, pumped hydroelectric and floating P V power plants. The possible modes of operation of a floating P V power plant integrated with a pumped hydroelectric power plant in the day-ahead market are analysed in Section 3. Section 4 presents the description of the case study. Section 5 presents the findings from the case studied. Finally, Section 6 summarises the main contributions and conclusions of the paper.

2. Background

2.1. Iberian Electricity Market

The Iberian Electricity Market ( M I B E L , by its acronym in Spanish) was created in 2004, with the aim of integrating the electricity systems of Portugal and Spain, thus bringing more benefits to consumers in both countries. M I B E L comprises the following markets: the day-ahead market, the intra-day market, the technical restrictions market, and the complementary services market. In M I B E L there are two major agents referred to as the market operator and the system operator. O M I E , by its acronym in Spanish, is the designated electricity market operator for the management of the day-ahead market and the intra-day market on the Iberian Peninsula. There are two system operators in M I B E L R E N (by its acronym in Portuguese) in Portugal and R E E (by its acronym in Spanish) in Spain. Responsibility for the security and management of the complementary services markets in their respective countries depends on these organisations.
On the Iberian Peninsula, energy is mainly traded on the day-ahead market. The day-ahead market operates as an auction. Selling agents present hourly price–quantity electricity supply curves for the twenty-four hours of the following day based on their demand estimates. Thus, each day, at 12:00, the prices and sources of energy production are stipulated for the following day. Selling agents, which include generating plants and traders operating as importers, submit energy sale bids, and the buying agents, which include traders who resell their energy on the retail market or export it as well as final consumers who use the wholesale market, submit their purchase bids for each hour of the following day. The Iberian Market Operator follows the marginalist model where electricity producers make bids based on the marginal cost of production. The marginal cost of production includes: the cost of fuel, the cost of emissions, the variable cost of operation and maintenance, and taxes. All these offers are then ranked in ascending order. The suppliers’ offers for the purchase of energy are arranged according to the bid prices, in descending order. The energy production price for all producers will be the point of intersection between the supply and demand, i.e., the marginal cost of production of the last producer to satisfy the demand in the bidding period.
Energy bidders must generate their accepted bids in order to avoid paying a penalty resulting from the difference between the accepted bids and the actual power generated. This uncertainty is accentuated with the use of photovoltaic plants. The temporal availability that characterises solar energy makes any certainty as to the generation thereof difficult. Therefore, matching the offers accepted the day before is a challenge that increases the possibility of extra costs. To reduce these penalties, photovoltaic technologies can operate in conjunction with pumped hydroelectric power plants to make them more competitive. Therefore, the combination of these two technologies can reduce the variability and difficulty of prediction. The study presented here reduces the uncertainty that comes with the use of solar energy.

2.2. Pumped Hydroelectric Power Plant

A pumped hydroelectric power plant is comprised of 6 main components: an upper reservoir, a penstock, a hydro turbine—pump, an electric generator—motor, a lower reservoir, and a power transmission. The hydro turbine can be used as a pump, and the electric generator can be used as an electric motor. The configuration generally used for pumped hydroelectric power plants is a single penstock used to turbine water and to pump water. In a pumped hydroelectric power plant, the water stored in the upper reservoir flows through the penstock, which is a system of pipes that transports the water from the upper reservoir to the turbine. The turbine is coupled to an electric generator. The water released from the turbine is stored in the lower reservoir. For the pumping action, the electric generator works as a motor and the hydro turbine as a pump, using the same penstock to pump water from the lower reservoir to the upper reservoir.
The power generated by a hydroelectric power plant depends mainly on two parameters: the distance at which the water falls and the amount of water that falls. The hydroelectric power can be calculated using the following equation [33]:
P g = P t · η g = η t · ρ · g · h a · q t · η g ,
where P g (W) is the power output of the electric generator, P t (W) is the power output of the hydro turbine, η g (%) is the electric generator efficiency, η t (%) is the hydro turbine efficiency, ρ (kg/m 3 ) is the density of water the value of which is 1000 (kg/m 3 ), g (m/s 2 ) is the acceleration due to gravity the value of which is 9.81 (m/s 2 ), h a (m) is available head, and q t (m 3 /s) is the turbined flow rate.
For a large-capacity upper reservoir, several studies have considered the effective head to be constant over the operating range [22,23]. Therefore, the fixed-head hydroelectric power plant model can be represented by the following equation [33,34]:
P g = k t · q t ,
where k t (W.s/m 3 ) is the turbine generating coefficient, which includes the parameters: η g , η t , ρ , g, and h a . The equation defining k t is as follows [33,34]:
k t = η g · η t · ρ · g · h a .
In order to determine the electrical power absorbed in the pumping process, the conversion losses of the pumping process must be taken into account. For this purpose, the following equation shall be used [33]:
P a = ρ · g · h e · q p η m · η p ,
where P a (W) is the power input of the electric motor, η m (%) is the electric motor efficiency, η p (%) is the pump efficiency, ρ (kg/m 3 ) is the density of water the value of which is 1000 (kg/m 3 ), g (m/s 2 ) is the acceleration due to gravity the value of which is 9.81 (m/s 2 ), h e (m) is the elevating head, and q p (m 3 /s) is the pumped flow rate. Equation (4) can be expressed as [34]:
P a = k p · q p ,
where k p (W·s/m 3 ) is the water pumping coefficient of the pumping process, which includes the parameters: η m , η p , ρ , g, and h e . The equation defining k p is as follows [34]:
k p = ρ · g · h e η m · η p = k t μ ,
where μ is the total pumping process efficiency.
It is estimated that a maximum of 70 % to 85 % of the electrical energy used to pump the water to the upper reservoir can be recovered [34].

2.3. Floating PV Power Plant

A floating P V power plant is comprised of six main components [35]: a floating platform, a mooring system, a P V module, connectors and cables, solar inverters, and a power transmission. The floating platform was designed with high-density polyethylene material to replace the P V modules. This material has suitable properties for this application, such as high tensile strength, low maintenance, high corrosion resistance, and good ultraviolet behaviour [35]. The mooring system is a permanent structure to which the flotation platform can be attached. It may consist of quays, wharfs, jetties, piers, anchor buoys, and mooring buoys [35]. Standard crystalline P V modules are used for floating solar systems. However, the aluminium frames of the modules eventually corrode, especially if they are installed in salt water. Cables and connectors must be watertight and appropriately rated, and junction boxes must be watertight (IP67) [35]. Solar inverters are best placed on the land, so they remain ’nice and dry’ [35].
In studies of this type, it is necessary to know the distribution of annual solar irradiation, so the local cloud cover distribution must be taken into account. For this purpose, the procedure presented by [36] is used to determine the hourly horizontal beam and diffuse solar irradiance for the meteorological conditions at the reservoir for each day of the year. The accuracy of this method has been proven as well as the fact that it can be easily applied to different climates [9]. It has been validated with real data obtained at ground level stations [37]. This procedure is based on the Hottel model [38] for estimating transmitted solar irradiance through a clear atmosphere, the Liu and Jordan model [39] for determining diffuse solar irradiance for clear skies, and Fourier series approximation for correcting the clear-sky models and adapting them to the corresponding reservoir weather conditions.
The total solar irradiance I t ( n , T , β ) on inclined surfaces can be determined using the equation proposed by Duffie and Beckman [40]:
I t n , T , β = I b h n , T · cos θ i cos θ z + I d h n , T · 1 + cos β 2 + I b h n , T + I d h n , T · ρ g · 1 cos β 2 ,
where I b h (W/m 2 ) is the adjusted beam irradiance on a horizontal plane calculated using the method proposed by [36], I d h (W/m 2 ) is the adjusted diffuse irradiance on a horizontal plane calculated using the method proposed by [36], θ z ( ° ) is the zenith angle of the Sun, θ i ( ° ) is the incident angle, β ( ° ) is the tilt angle, and ρ g (dimensionless) is the ground reflectance.
Duffie and Beckman also propose an equation to determine the incident angle of the Sun θ i ( ° ) on an inclined surface [40]:
θ i = sin δ · sin λ · cos β sin δ · cos λ · sin β · cos γ + cos δ · cos λ · cos β · cos ω + cos δ · sin λ · sin β · cos γ · cos ω + cos δ · sin β · sin γ · sin ω ,
where δ is the declination, λ the latitude, β the tilt angle, γ the azimuth angle, and ω the hour angle. The optimal orientation for these systems is γ = 0 ( o ) in the Northern Hemisphere.
The total irradiation over an inclined surface can be determined by integrating Equation (7) from sunrise ( T R ) to sunset ( T S ):
H t n , β = T R ( n ) T S ( n ) I t ( n , T , β ) d T
where n ( d a y ) is the day of the year, and T (h) is the solar time.
Another parameter in Equation (7) to be selected is the albedo. Liu et al. [17] presented an experimental study conducted at a testbed it Singapore where they recorded a water body albedo ranging from 0.05 to 0.07 . Agrawal et al. [12] used a typical value of ρ g for a floating P V power plant of 0.1 in their work. Oliveira-Pinto and Stokkermans [19] conservatively used an average albedo value of 0.05 in their work. Ghigo et al. [41] also use this value. For the purpose of this study, an albedo of 0.05 was used.
The electrical power generation from P V modules depends mainly on two parameters: the incident solar irradiance and the operating temperature of the modules [28].
The incident solar irradiance depends on the tilt angle of the modules and their orientation [28]. The optimal orientation for these systems is 0 ( ° ) in the Northern Hemisphere and 180 ( ° ) in the Southern Hemisphere [40]. The tilt angle is a critical parameter and knowing the optimal value thereof is highly beneficial economically. This value depends on the latitude of the installation site [28]. For floating P V plants, the tilt angle is chosen taking into account the stability of the mounting system, and the distance to be left between rows of P V modules. Both parameters can be improved with low tilt angles.
As can be seen from Equations (7) and (8), the incident solar irradiance on an inclined surface and, thus, the power output of a P V system is highly dependent on the tilt angle of the P V module. There are proven procedures for obtaining the optimal tilt angle of a ground-mounted P V system [28,42]. The latitude of the site has a great influence on the optimal tilt angle [9]. Additionally, the optimal tilt angle is strongly dependent on the albedo [43]. However, other parameters such as available surface area, shading, soiling, and wind loads can influence the choice of the optimal tilt angle. Favouring any one of these parameters is detrimental to others. For example, (i) steeper angles will produce less soiling but increase self-shading, (ii) steeper angles require more available surface area, and (iii) steeper angles increase wind loads, etc. In addition, floating platforms have limitations on the tilt angles of P V modules.
Floating platforms allow the P V modules to have a certain degree of inclination. Standard values of these tilt angles are: 5 ( ° ) [44,45], and 12 ( o ) [45]—for example, the floating P V power plant in Tamilnadu (India) at 14.8 (MWp) rated with 37 , 632 P V modules, facing south with a tilt angle of 12 ( ° ). The Xiqian floating P V power plant is located in Chaiyi (Taiwan) and has an output of 21.571 (MWp), with 54,612 P V modules. The modules were installed facing south at a tilt angle of 12 ( ° ). In Wallonia (Belgium), there is a floating photovoltaic power plant called Hesbaye Frost Geer with a power rating of 0.998 (MWp), and 3120 P V south-facing modules with a tilt angle of 12 ( ° ). The Alqueva floating P V power plant is located in Alentejo (Portugal) and has an output of 5 (MWp), with 120,000 P V modules. The modules were installed facing south at a tilt angle of 5 ( ° ). In Benguerir (Morocco) there is a floating photovoltaic system called Benguerir with a power rating of 0.147 (MWp), and 330 P V south-facing modules with a tilt angle of 5 ( ° ). As the tilt angle used in this type of facility is low, the shading effect between modules is practically nil.
The power generated by a P V module can be calculated using the following equation [46]:
P P V = ( τ · α ) · I t · η e ,
where P P V (W/m 2 ) is the power output of the P V module, τ (dimensionless) is the solar transmittance of glazing, α (dimensionless) is the solar absorptance of the P V layer, I t (W/m 2 ) is the total incident solar irradiance on the P V module, and η e (dimensionless) is the efficiency of the module when converting the incident solar irradiance into electrical energy.
The transmittance–absorption product ( τ · α ) usually takes the value of 0.9 [46,47]. Evans [48] presented a linear expression to determine the photovoltaic electrical efficiency:
η e = η r e f · 1 β r e f · T c T r e f ,
where η r e f (dimensionless) is the P V module’s electrical efficiency at the reference temperature of 25 ( ° C) and with a solar irradiance of 1000 (W/m 2 ), β r e f ( 1 / ° C) is the temperature coefficient, T c ( ° C) is the P V cell temperature, and T r e f ( ° C) is the reference temperature. This Equation (11) has been used by studies similar to the one presented here [49,50]. The parameters η r e f and β r e f are normally provided by the P V module manufacturer.
The operating temperature of a P V module is a parameter with a significant effect on energy production. Any increase in the temperature of a P V module reduces its efficiency and thus the power generation. There are several models for determining this temperature [50]. Ambient temperature, incident solar irradiance and wind speed are parameters that influence the temperature of a P V module.
One method used in similar work for determining the cell temperature T c focuses on the Normal Operating Cell Temperature ( N O C T ) [51]. The value of this parameter is part of the information provided by the P V module manufacturer. This method offers satisfactory results [51]. Using this method, the T c can be calculated according to Equation [51]:
T c = T a + N O C T 20 · I t 800 ,
where T a ( ° C) is the ambient temperature. N O C T ( ° C) is calculated for a solar irradiance of 800 (W/m 2 ), an ambient temperature of 20 ( ° C), and a wind speed at a P V module height of 1 (m/s).
The efficiency of floating photovoltaic systems has been addressed by numerous studies. Liu et al. [17] presented a comparative study between an existing F P V facility at the Tengeh Reservoir (Singapore) and a similar P V system installed on a rooftop. The results of the study highlighted that the temperature of the P V modules in the F P V system was generally 5 ( ° C) to 10 ( ° C) lower, which increased the performance ratio by 10 % in the F P V system. Choi [18] presents a study comparing and analysing a floating P V system versus a ground-based PV system. The study has verified that the generation efficiency of the floating P V system is 11 % higher. According to Oliveira-Pinto and Stokkermans [19] the efficiency ranges from 0.31 % to 2.59 % , depending on the floating solar technology. For El Hammoumi et al. [13], efficiency increases up to 2.33 % . In summary, some studies claim efficiency gains of between 5 % and 15 % while others suggest efficiency gains below 5 % .

3. Possible Operating Modes of a Floating PV Power Plant Integrated into a Pumped Hydroelectric Power Plant in the Day-Ahead Market

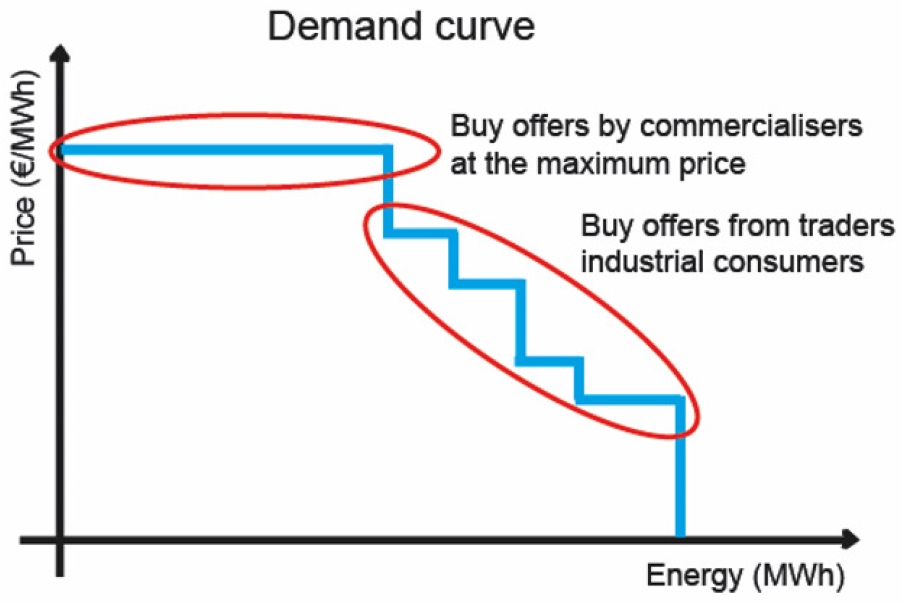
3.1. Supply and Demand Curves of the Day-Ahead Market

Once the electricity buy and sell bids have been submitted by all the agents present in the market for the twenty-four hours of the following day, O M I E constructs the day-ahead market supply and demand curves.
Once the selling agents have submitted their bids to the market for each of the hours of the dispatch day (day D), O M I E aggregates and sorts them in ascending order resulting in the market supply curve for each hour. This curve represents the steps that correspond to generators using the same technology. Figure 2 shows an example of a supply curve.
Energy consumers are usually classified according to their consumption and the ultimate purpose for which they will use the energy, distinguishing between industrial consumers (large industries), medium-sized consumers (industrial and service sectors) and small consumers (small businesses and households). Demand depends mainly on the day (whether it is a working day or holiday) and weather conditions (temperature and brightness). Like the supply curve, the demand curve also has sections that bring together specific consumer groups. The offers on this curve, however, are arranged in decreasing order. Buying agents usually bid at the maximum allowed price of 3000 (€/MWh) in order to ensure the supply of all consumers as this will not be the final price they pay but rather the one resulting from matching. Figure 3 shows an example of a demand curve.
The market price for each hour of day D is the result of the intersection of the supply and demand curves for that hour. This price determines the matched bids and offers, i.e., the amount of energy that will finally move in the market. Finally, all matched sale and purchase bids will be paid/collected at the same price.

3.2. Deviation Management Market

Hourly electricity supply and demand can change for many reasons: (i) transmission outages or failures, (ii) generation outages or failures, and (iii) unforeseen weather conditions.
The deviation is the difference between the forecasted power and the actual delivered power. This deviation results in an imbalance in the system. Thus, the main objective of this market is to immediately cover any deviations that may arise between generation and demand in the programmes resulting from the intraday markets. The system operator, R E E or R E N , identifies the deviations in their analyses of each programme, and if they exceed 300 (MW), it calls this market.
Two types of deviations can be distinguished depending on their direction: upward deviation and downward deviation.
An upward deviation occurs when the production measured by busbars at the plant is higher than that which is offered on the daily market or when the consumption measured by the busbars is lower than the scheduled consumption. In other words, either production has to be reduced or consumption has to be increased because there is an excess of unconsumed energy. When there is an upward deviation due to excess production, a collection right is generated for the new energy produced that had not been paid for in the day-ahead market. Contrary to upward deviations, a downward deviation occurs when the production measured by busbars at the plant is lower than that which is offered in the daily market or when consumption is higher than scheduled. Therefore, production has to be increased or consumption reduced as there is not enough energy to meet demand. When a diversion occurs due to a production deficit, a payment obligation is generated for the energy that had been charged in the day-ahead market but is not being produced.
In the Iberian Electricity System, the cost of deviations is determined by a concept known as Net System Balancing Need ( N N B S , by its acronym in Spanish). This parameter studies whether the total production at the system level is greater or lower than the scheduled production. The purpose of the N N B S is to determine whether the production deviation is in line with the system or not. N N B S can be greater or less than zero:
(i)
If N N B S > 0. It means there is a net need for system balancing, i.e., the net system output is less than scheduled in the market and therefore more energy is needed;
(ii)
If N N B S < 0, it means that the net production of the system is greater than that which is scheduled in the market and, therefore, there is “surplus” energy.
Thus, deviations can be classified according to whether they are for or against the system:
(i)
Deviation in favour. This is in the same direction as the system need. Deviations in favour occur when a power plant produces less energy than scheduled but the N N B S < 0 (less energy is produced on a day when there is energy left over in the system) or when the power plant generates more energy than scheduled but the N N B S > 0 (more energy is produced on a day when the system needs more energy);
(ii)
Deviation against. It goes in the opposite direction to the net system need. Deviations against occur when a power plant generates less energy than scheduled and the N N B S > 0 (less energy is produced on a day when the system needs more) or when more energy is generated than scheduled and the N N B S < 0 (more energy is produced on a day when the system needs less).

3.3. Settlement of Deviations

The balancing energies used by R E E to solve possible imbalances in the system must be remunerated with an economic impact on the producer responsible for the deviations. It is necessary to differentiate between the price and the cost of deviations.
The price of upward deviations ( P U D ) is the price to be applied to upward deviations, i.e., production units generating more or consuming less energy than scheduled, and the price of downward deviations ( P D D ) is the price to be applied to downward deviations, i.e., production units generating less or consuming more energy than scheduled.
The cost of deviations ( C U D / C D D ) is the difference in absolute value between the MMP (marginal market price) and the price of deviations (upward or downward).
Whenever there is a deviation upward, a collection right is generated for the energy that is being produced, and when there is a deviation downward, a payment obligation is generated for the energy that is not being produced.
With this in mind, each of the four situations that a power plant may experience during operation when there is a deviation can be analysed in addition to how such deviation will affect it economically:
(i)
If N N B S > 0 and the deviation is downward. The downward deviation generates a payment obligation and since it is a deviation against the system, the price that will have to be paid is higher than the market price. Therefore, it is the worst situation for a downward deviation as the power plant is losing money. The cost of the downward deviation in this case is the price premium paid for producing less energy;
(ii)
If N N B S < 0 and the deviation is downward. The deviation generates a payment obligation, but this time, the price to be paid is equal to the market price since it is in favour of the system. Thus, the power plant does not lose any money, but rather “returns” the money it has been paid for energy it is not producing. This is the best situation for a power plant that commits a downward deviation;
(iii)
If N N B S > 0 and the deviation is upward. This deviation generates a collection right and in this case it is in favour of the system. This means that the price the power plant will charge for the energy produced will be equal to the market price, which is the best scenario for a power plant in a deviation to upward deviation situation;
(iv)
If N N B S < 0 and the deviation is upward. Again, the deviation upward generates a collection right, but this time, the price received by the plant will be lower than the market price since it is against the system and it will not pay the same price for energy that is not really “needed”. The cost of the deviation in this case is understood as the money that the plant stops receiving in comparison with the sum to be received if it were selling that energy on another day at the market price.
Table 1 shows a summary of the price and cost of deviations.

3.4. Possible Operating Modes

According to this preliminary study, the operating modes for a floating P V power plant integrated into a pumped hydroelectric power plant in the day-ahead market are as follows:
(i)
Due to day-ahead market conditions, pumped hydroelectric power plants do not generate power at full capacity 24 h per day. The hours with the highest energy prices are chosen. Thus, water is conserved for use at a later and potentially more valuable time. Therefore, the turbines and their grid transmission lines are used intermittently. For the remaining the hours, they can operate by pumping water. Furthermore, If operating 24 h per day, there would not be enough annual flow through the upper reservoir basin to maintain the average flow required at full power;
(ii)
One mode of operation for floating P V power plants is to sell electricity as it is generated. The natural variability of electricity flows from such power plants creates uncertainty in energy supply;
(iii)
Another mode of operation for floating P V power plants is to store electricity as it is generated by pumping water from the lower reservoir to the upper reservoir. Thus, water is stored for use at a later and potentially more valuable time;
(iv)
The latest mode of operation for floating P V power plants is to simultaneously sell and store electricity as it is generated. In this case, the motor/pump unit is used to pump water from the lower reservoir and increase the hydraulic potential of the upper reservoir using surplus P V power generation.
Our study aimed to determine the profit-maximising behaviour in the choice of the combined mode of operation of both power plants. Therefore, there are several scenarios in the joint operation mode of a pumped hydroelectric power plant and a floating P V power plant.

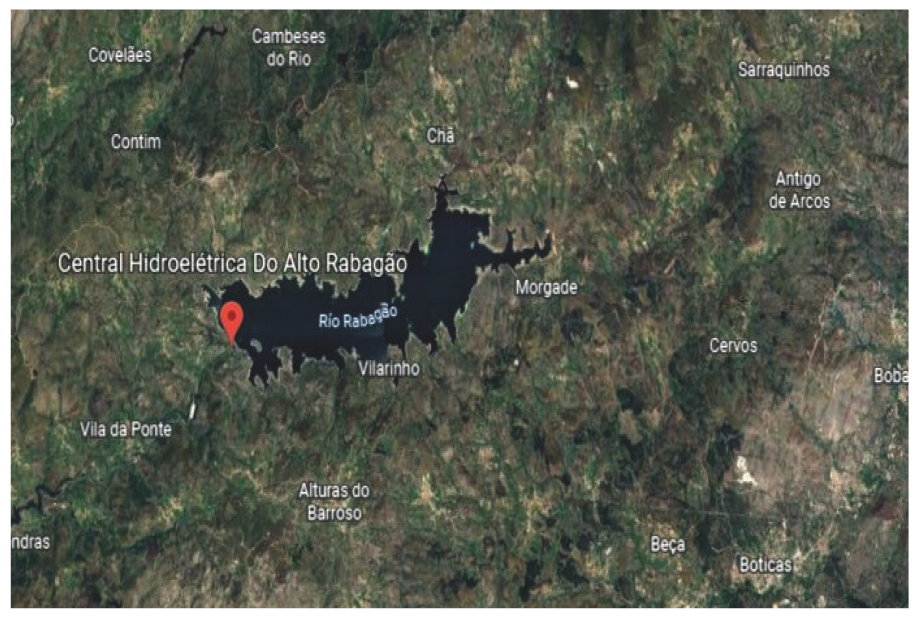
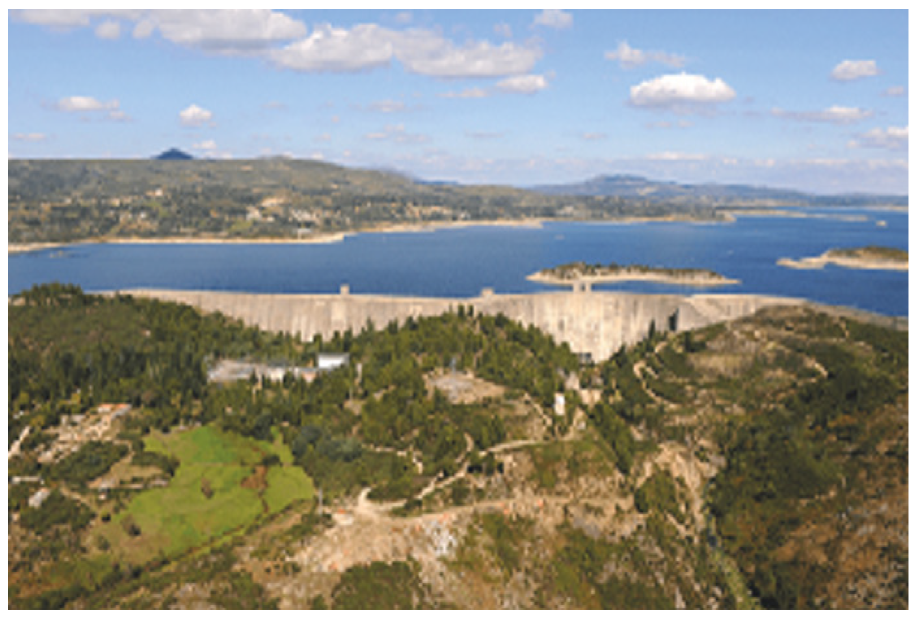
4. Case Study Description

The Alto Rabagão dam was inaugurated in 1964. The reservoir is operated by Energias de Portugal, E D P , and is located in the municipality of Montealegre, district of Vila Real in northern Portugal [52]. It is fed by the Rabagão river. The reservoir has a surface area of 2200 hectares, with a total volume of 569 (hm 3 ), 11 (hm 3 ) of which are unusable, and a maximum water level of 185 (m) [52]. The reservoir is located at the geographical coordinates: latitude 41 ° 44 16 N, longitude 7 ° 51 14 W, and it has an altitude of 880 (m) [52]. Figure 4 shows a Google Earth image of the project location and Figure 5 shows the site view of the upper reservoir.

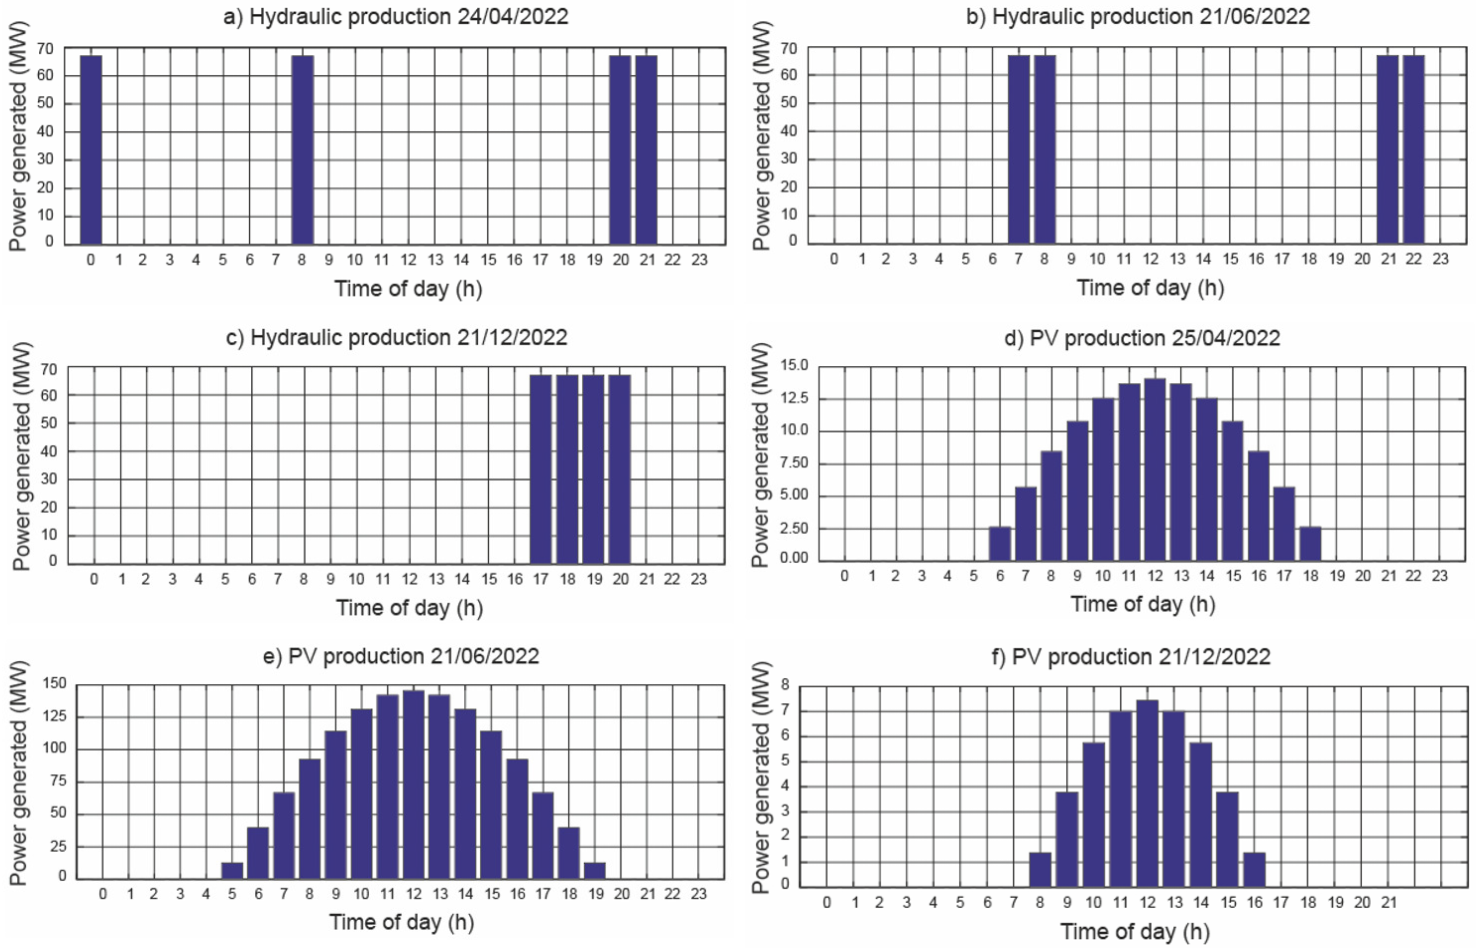
4.1. Hydraulic Production

The pumped hydroelectric power plant has two groups that are of a binary type (hydro turbine–pump) [52]. The turbines are of the Francis type [52]. The total output of the two groups is 67 (MW) in power generation mode and 62 (MW) in pumping mode [52]. The total maximum flow available in the power generation mode is 46.5 (m 3 /s ) and 33 (m 3 /s) in the pumping mode [52]. The turbine generating coefficient ( k t ) has a value of 1.44086 (MWs/m 3 ), and the total pumping process efficiency ( μ ) is 0.77 [52].
It is assumed that the pumped hydroelectric power plant will bid on day D 1 a power of 268 (MW) distributed over the 4 h assumed to be the maximum marginal market price. Therefore, this plant will operate at maximum power for 4 h per day.

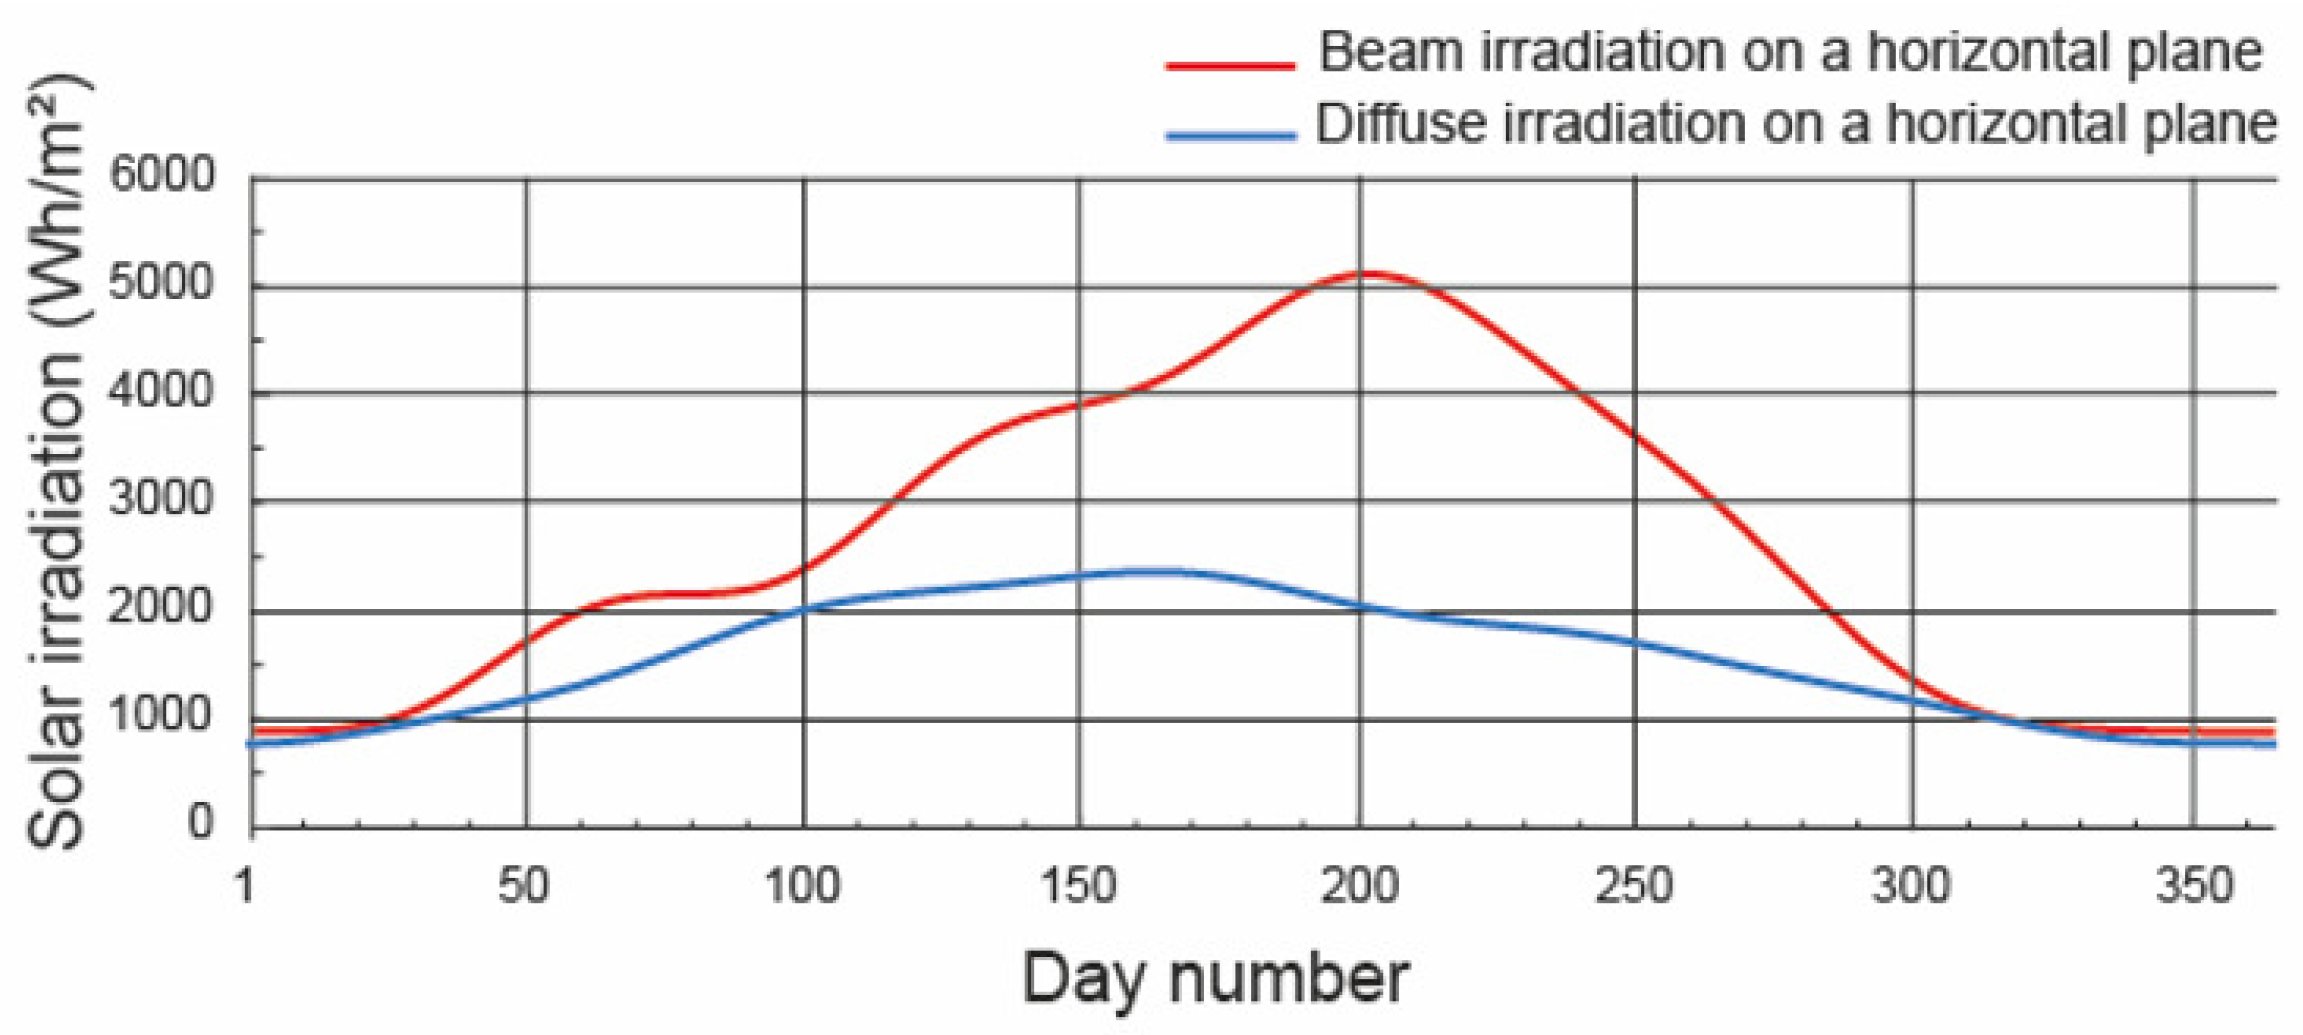
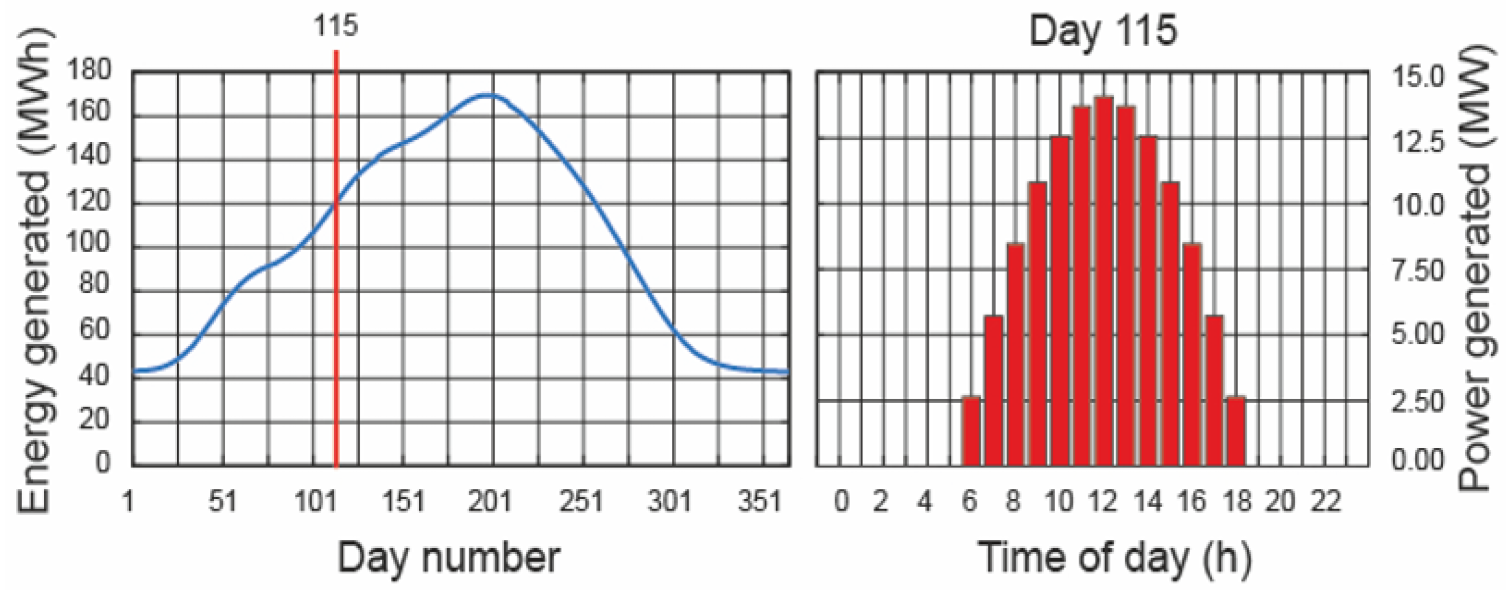
4.2. Photovoltaic Production

The system is modelled using the procedure presented in [53] to evaluate the annual energy production. The type of P V module that has been chosen is the model JAM72S30 525–550/MR, manufactured by JASolar, which has a rated maximum power of 550 (W) and dimensions of 2279 × 1134 (mm). Each module represents about 2.58 (m 2 ) in surface area. The Google Earth tool was used to model the surface estimates, as shown in Figure 4. The total installed photovoltaic capacity is 25 (MWp). The total number of P V modules is 45,455. The total area of the facility represents approximately 13.15 (ha). Thus, it is practically 0.6 % of the total surface of the 2200 (ha) upper reservoir.
The floating platforms used in this study were installed at a tilt angle of 5 ( o ) [44]. They can withstand wind loads of 180 (km/h). The ideal orientation for systems installed in the Northern Hemisphere (Portugal) is geographic south [40]. For the purpose of this study, an albedo of 0.05 was used.
The upper reservoir is located between latitudes 35 ° N and 45 ° N and therefore experiences significant seasonal variations. The available P V G I S database [54] was used for estimates of monthly averaged beam and diffuse solar irradiation received on a horizontal surface. Figure 6. shows the environmental conditions at the Alto Rabagão dam.
The upper reservoir is in the zone of influence of a C s b (Main climates: warm temperate; Precipitation: summer dry; Temperature: warm summer) designated under the Köppen–Geiger climate classification [55], with a maximum monthly mean daytime temperature of 27.7 ( ° C), and with a maximum monthly mean nighttime temperature of 14.9 ( ° C). July is the least rainy month and October is the wettest month.
Figure 7 shows the beam and diffuse solar irradiation on a horizontal surface at the meteorological conditions of the upper reservoir using the procedure presented by [36].
The annual energy generated by the P V system is shown in Figure 8.

5. Results and Discussions

In this study, three days were selected for brevity, representing the largest number of possible combinations. The days chosen were: 25 April 2022, 21 June 2022 (summer solstice) and 21 December 2022 (winter solstice). Table 2, Table 3 and Table 4 represent the hourly daily marginal market price (MMP), the price of upward deviations ( P U D ) and the price of downward deviations ( P D D ) for the days under study [56].
Figure 9 shows the hydraulic and photovoltaic productions for the days under study.
In the day-ahead market, all agents operating on M I B E L submit buy or sell bids covering 24 h of the following day. To this end, agents rely on the daily forecast to schedule bids. If the units (a floating PV power plant and a pumped hydroelectric power plant) are coordinated, the day-ahead strategy is as follows: (i) to store the surplus energy produced by the floating PV power plant that is generated during deviation periods subject to penalties, and (ii) sell the energy when the forecast prices are higher. Due to the low efficiency of the pumping process, there are occasions when it is in the interest of the two units to operate independently. With the independent or joint operation of a floating P V power plant and a pumped hydroelectric power plant, several scenarios are possible. The scenarios can be classified according to whether the supply made by the photovoltaic plant on day D 1 is equal to, higher or lower than the available energy on day D. The strategy of storing energy during low spot market prices and selling it during high spot market prices is possible on days when the price difference is significant. This situation is not taken into account in this study.
The economic benefit ratio ( E B R ) can be used to evaluate these modes of operation, the independent mode of operation of the two plants and the joint mode of operation of the two plants. E B R is then calculated as the difference between the economic benefit due to the independent mode of operation and the economic benefit due to the joint mode of operation:
E B R = E B i E B j E B i · 100 ,
where subscript i represents the independent mode of operation of the two plants, and subscript j represents the joint mode of operation of the two plants.

5.1. Scenario 1

In scenario 1, the power supply from the floating P V power plant on day D 1 is equal to the available energy on day D. Obviously, there is no penalty in this case. The selling price is the marginal market price.
In this scenario, the mode of operation of floating P V plants is to sell electricity as it is generated. It is as if the two plants were operating independently. Figure 10 shows the economic benefit if the two plants operate independently for each of the days under study. Due to the low efficiency of the pumping process, in this scenario it does not pay off to use the power from the P V plant to pump water from the lower reservoir to the upper reservoir.
As the daily marginal market price on 21 December 2022 is low, joint operation of both plants is not profitable. Even on 25 April 2022, with a daily marginal market price five times higher, joint operation is not profitable either. This fact indicates that in scenario 1, the joint operation of both plants is not optimal.

5.2. Scenario 2

In scenario 2, the power supply from the floating P V plant on day D 1 is lower than the power available on day D, and also the market needs power ( N N B S > 0). There is no penalty in this case. The selling price is the marginal market price. Upward deviations of 5 % , 10 % , 25 % and 50 % have been considered.
Figure 11 shows the economic benefit ratio under scenario 2 conditions for each of the days studied. In scenario 2, when the marginal market price is high, the optimal mode of operation is to sell the electricity as it is generated by the floating P V plant (as if the two plants were operating independently). Economic benefits of up to 6 % are earned. If the marginal market price is low and photovoltaic production is low, it is better to use the surplus electricity generated by the P V plant to pump water from the lower reservoir to the upper reservoir (joint operation of the two plants). Economic benefits of up to 1.6 % are e a r n e d .
Therefore, in this scenario, the combination of marginal market price and photovoltaic production determines the mode of operation of both plants. Only if both parameters are low does it compensate for the joint operation mode.

5.3. Scenario 3

In scenario 3, the power supply from the floating P V power plant on day D 1 is lower than the power available on day D, and the market does not need power ( N N B S < 0). There is no penalty in this case. The selling price is the cost of the deviation. Upward deviations of 5 % , 10 % , 25 % and 50 % have been considered.
Figure 12 shows the economic benefit ratio under scenario 3 conditions for each of the days studied. As there are penalties for deviations in this scenario, the optimal mode of operation is the joint operation of the two plants, i.e., it is better to use the surplus electricity generated by the P V plant to pump water from the lower reservoir to the upper reservoir, and turbine this water on day D + i . The marginal market price of energy on day D + i is assumed to be equal to or higher than the marginal market price on day D. An economic benefits ratio of up to 35 % is earned. It should be noted that on 21 June 2022 the prices of the deviations are 0, so it is as if there were no penalties. Therefore, the independent mode of operation is the best on this day.
As there are deviation penalties in this scenario, the joint mode of operation is always the best option, except in the case where the prices of the deviations are 0.

5.4. Scenario 4

In scenario 4, the electricity supply from the floating P V power plant on day D 1 is higher than the available energy on day D, and the market needs energy ( N N B S > 0). There is no penalty in this case. The selling price is the cost of the deviation. Downward deviations of 5 % , 10 % , 25 % and 50 % have been considered.
Figure 13 shows the economic benefit ratio under scenario 4 conditions for each of the days studied. As there are penalties for downward deviations in this scenario, the optimal mode of operation is the joint operation of the two plants, i.e., the pumped hydroelectric power plant helps meet the electricity supply proposed by the floating P V power plant the day before. An economic benefits ratio of up to 11 % is earned with joint operation.
As there are deviation penalties in this scenario, the joint mode of operation is always the best option, even when the prices of the deviations are 0.

5.5. Scenario 5

In scenario 5, the power supply from the floating P V power plant on day D 1 is higher than the power available on day D, and the market does not need power ( N N B S < 0). There is no penalty in this case. The selling price is the marginal market price. Downward deviations of 5 % , 10 % , 25 % and 50 % have been considered.
Neither the day surveyed nor the deviations surveyed influence the final result. The independent operation mode is optimal in this scenario. Due to the low efficiency of the pumping process, it does not pay off in this scenario to use the energy from the floating P V plant to pump water from the lower reservoir to the upper reservoir.

6. Conclusions

This paper studied the role of floating photovoltaic plants and pumped-storage hydroelectric plants acting jointly or independently in the Iberian electricity market from the producer’s point of view. Various strategies were analysed based on forecast accuracy as well as any deviations occurring in the day-ahead market. The day-ahead strategy followed a procedure where energy would be stored through the pumping process in the scenarios subject to penalties. The strategy of storing energy during low spot market prices and selling it during high spot market prices is possible on days when the price difference is significant. This is not taken into account in this study.
Five scenarios have been studied and upward and downward deviations of 5 % , 10 % , 25 % and 50 % have been considered. These scenarios can be classified into two groups. If there are deviation penalties, group 1, or without deviation penalties, group 2. Scenarios 3 and 4 belong to the first group and scenarios 1, 2 and 5 to the second group.
Under the conditions of scenario 1, the optimal mode of operation of a floating P V plant is to sell the electricity as it is generated. In other words, the independent operation of both plants. This is due to the low efficiency of the pumping process. In this scenario it does not pay to use the energy from the P V plant to pump water from the lower reservoir to the upper reservoir.
In scenario 2, the optimal mode of operation depends on the value of the marginal market price. When the marginal market price is high, the optimal mode of operation of the P V plant is to sell the electricity as it is generated, i.e., the independent operation of both plants. In this case, economic benefits of up to 6 % are earned. On the other hand, if the marginal market price is low, the optimal mode of operation for both plants is joint operation. It is better to use the surplus electricity generated by the P V plant to pump water from the lower reservoir to the upper reservoir, store it and turbine it when the market price is high. Economic benefits of up to 1.6 % are earned in this case. Therefore, in this scenario, the combination of marginal market price and photovoltaic production determines the mode of operation of both plants. Only if both parameters are low, does it compensate for the joint operation mode.
In scenario 3, the optimal mode of operation is the joint operation of the two plants since there are penalties for upward deviations. The best option is to use the surplus electricity generated by the P V plant to pump water from the lower reservoir to the upper reservoir, store it and turbine this water on day D + i . Economic benefits of up to 35 % are earned with this strategy. It should be borne in mind that, on 21 June 2022, the prices of deviations are 0, so it is as if there were no penalties. Therefore, the independent mode of operation is the best on that day.
In scenario 4, there are penalties for downward deviations. This is the most critical scenario as far as losing benefits. The optimal mode of operation is the joint operation of the two plants. In this case, the pumped hydro plant helps meet the electricity supply offered by the floating P V plant the day before. Economic benefits of up to 11 % are earned with joint operation.
Under the conditions of scenario 5, neither the day analysed nor the downward deviations studied influence the final result. The optimal operating mode is the independent mode in this scenario. Due to the low efficiency of the pumping process, it does not pay off in this scenario to use the energy from the floating P V plant to pump water from the lower reservoir to the upper reservoir.
It can be concluded that the joint operation mode of both plants is the best in scenarios with deviation penalties.
Possible future work would consist of a comparative analysis of the energy yield of a ground-mounted PV plant and a floating PV plant. A parametric study relating the size of the floating PV plant to the power of the pumped hydroelectric plant would also be interesting.

Author Contributions

Conceptualization, A.B. and L.B.; Methodology, A.B., Á.G., L.B. and C.B.-C.; Software, Á.G. and C.B.-C.; Writing—original draft, C.B.-C. and J.A.-B. All authors have read and agreed to the published version of the manuscript.

Funding

This research received no external funding.

Data Availability Statement

Not applicable.

Acknowledgments

We wish to thank EDP [52] for his contribution in this paper.

Conflicts of Interest

The authors declare no conflict of interest.

Nomenclature

The following abbreviations are used in this manuscript:
E B Economic benefit (€)
E B R Economic benefit ratio (%)
gAcceleration due to gravity (m/s 2 )
H t Adjusted total irradiation on a tilted surface (Wh/m 2 )
h a Available head (m)
h e Elevating head (m)
I b h Adjusted beam irradiance on a horizontal surface (W/m 2 )
I d h Adjusted diffuse irradiance on a horizontal surface (W/m 2 )
I t Adjusted total irradiance on a tilted surface (W/m 2 )
k p Water pumping coefficient (W·s/m 3 )
k t Turbine generating coefficient (W·s/m 3 )
N O C T Normal operating cell temperature ( ° C)
nOrdinal of the day (day)
P a Power input of the electric motor (W)
P g Power output of the electric generator (W)
P P V Power output of the P V module (W/m 2 )
P t Power output of the hydro turbine (W)
q t Turbined flow rate (m 3 /s)
q p Pumped flow rate (m 3 /s)
TSolar time (h)
T a Ambient temperature ( ° C)
T c P V cell temperature ( ° C)
T r e f Reference temperature ( ° C)
T R Sunrise solar time (h)
T S Sunset solar time (h)
α Solar absorptance of P V layer (dimensionless)
β Tilt angle of photovoltaic module ( ° )
β r e f Temperature coefficient (1/ ° C)
γ Azimuth angle of photovoltaic module ( ° )
δ Solar declination ( ° )
η e PV module efficiency (%)
η g Electric generator efficiency (%)
η m Motor generator efficiency (%)
η p Pump efficiency (%)
η r e f P V module efficiency at the reference temperature (%)
η t Hydro turbine efficiency (%)
θ i Incidence angle ( ° )
θ z Zenith angle of the Sun ( ° )
λ Latitude angle ( ° )
μ Total pumping process efficiency (%)
ρ Density of water (kg/m 3 )
ρ g Ground reflectance (dimensionless)
τ Solar transmittance of glazing (dimensionless)
ω Hour angle ( ° )

References

  1. Sharm El-Sheikh Climate Change Conference. 6–20 November 2022. Available online: https://unfccc.int/cop27 (accessed on 23 January 2023).
  2. Bellos, E.; Tzivanidis, C.; Said, Z. A systematic parametric thermal analysis of nanofluid-based parabolic trough solar collectors. Sustain. Energy Technol. Assessments 2020, 39, 100714. [Google Scholar] [CrossRef]
  3. Gopi, A.; Sharma, P.; Sudhakar, K.; Ngui, W.K.; Kirpichnikova, I.; Cuce, E. Weather impact on solar farm performance: A comparative analysis of machine learning techniques. Sustainability 2023, 15, 439. [Google Scholar] [CrossRef]
  4. Tuncer, A.D.; Khanlari, A.; Afshari, F.; Sözen, A.; Çiftçi, E.; Kusun, B.; Şahinkesen, İ. Experimental and numerical analysis of a grooved hybrid photovoltaic-thermal solar drying system. Appl. Therm. Eng. 2023, 218, 119288. [Google Scholar] [CrossRef]
  5. Barbón, A.; Vesperinas, D.; Bayón, L.; García-Mollaghan, D.; Ghodbane, M. Numerical simulation of a solar water disinfection system based on a small-scale linear Fresnel reflector. RSC Adv. 2023, 13, 155–171. [Google Scholar] [CrossRef]
  6. IRENA. Future of Solar Photovoltaic: Deployment, Investment, Technology, Grid Integration and Socio-Economic Aspects; International Renewable Energy Agency: Masdar City, United Arab Emirates, 2019; Available online: https://irena.org/-/media/Files/IRENA/Agency/Publication/2019/Nov/IRENA_Future_of_Solar_PV_2019.pdf (accessed on 27 December 2022).
  7. Barbose, G.; Darghouth, N.; O’Shaughnessy, E.; Forrester, S. Tracking the Sun: Pricing and Design Trends for Distributed Photovoltaic Systems in the United States, Edition 2021 ed; Lawrence Berkeley National Laboratory: Berkeley, CA, USA, 2021. [Google Scholar]
  8. IRENA. Solar Costs to Fall Further, Powering Global Demand; International Renewable Energy Agency: Masdar City, United Arab Emirates, 2017; Available online: https://www.reuters.com/article/singapore-energy-solar/solar-costs-to-fall-further-powering-global-demand-irena-idINKBN1CS13C (accessed on 27 December 2022).
  9. Barbón, A.; Fortuny Ayuso, P.; Bayón, L.; Silva, C.A. A comparative study between racking systems for photovoltaic power systems. Renew. Energy 2021, 180, 424–437. [Google Scholar] [CrossRef]
  10. IEA. Hydroelectricity; International Energy Agency: Paris, France, 2022; Available online: https://www.iea.org/reports/hydroelectricity. (accessed on 23 January 2023).
  11. Barbour, E.; Grant Wilson, I.A.; Radcliffe, J.; Ding, Y.; Li, Y. A review of pumped hydro energy storage development in significant international electricity markets. Renew. Sustain. Energy Rev. 2016, 61, 421–432. [Google Scholar] [CrossRef]
  12. Agrawal, K.K.; Jha, S.K.; Mittal, R.K.; Vashishtha, S. Assessment of floating solar PV (FSPV) potential and water conservation: Case study on Rajghat Dam in Uttar Pradesh, India. Energy Sustain. 2022, 66, 287–295. [Google Scholar] [CrossRef]
  13. El Hammoumi, A.; Chalh, V.; Allouhi, A.; Motahhir, S.; El Ghzizal, A.; Derouich, A. Design and construction of a test bench to investigate the potential of floating PV systems. J. Cleaner Production 2021, 278, 123917. [Google Scholar] [CrossRef]
  14. Farrar, L.W.; Bahaj, A.S.; James, P.; Anwar, A.; Amdar, N. Floating solar PV to reduce water evaporation in water stressed regions and powering water pumping: Case study Jordan. Energy Convers. Manag. 2022, 260, 115598. [Google Scholar] [CrossRef]
  15. Melvin, G.K.X. Experimental Study of the Effect of Floating Solar Panels on Reducing Evaporation in Singapore Reservoirs. 2015. Available online: https://cpb-us-w2.wpmucdn.com/blog.nus.edu.sg/dist/b/4438/files/2015/04/FYP-Final-report-14ijhop.pdf (accessed on 27 December 2022).
  16. Yao, X.; Zhang, H.; Lemckert, C.; Brook, A.; Schouten, P. Evaporation Reduction by Suspended and Floating Covers: Overview, Modelling and Efficiency. Urban Water Security Research Alliance Technical Report No. 28. 2010. Available online: http://www.urbanwateralliance.org.au/publications/uwsra-tr28.pdf (accessed on 27 December 2022).
  17. Liu, H.; Krishna, V.; Lun Leung, J.; Reindl, T.; Zhao, L. Field experience and performance analysis of floating PV technologies in the tropics. Prog. Photovoltaics: Res. Appl. 2018, 26, 957–967. [Google Scholar] [CrossRef]
  18. Choi, Y.-K. A study on power generation analysis of floating PV system considering environmental impact. Int. J. Of Software Eng. Its Appl. 2014, 8, 75–84. [Google Scholar] [CrossRef]
  19. Oliveira-Pinto, S.; Stokkermans, J. Assessment of the potential of different floating solar technologies–Overview and analysis of different case studies. Energy Convers. Manag. 2020, 211, 112747. [Google Scholar] [CrossRef]
  20. Farfan, J.; Breyer, C. Combining floating solar photovoltaic power plants and hydropower reservoirs: A virtual battery of great global potential. Energy Proccedia 2018, 155, 403–411. [Google Scholar] [CrossRef]
  21. Sanseverino, I.; Conduto, D.; Pozzoli, L.; Dobricic, S.; Lettieri, T. Algal bloom and its economic impact, European Commission; Joint Research Centre: Brussels, Belgium, 2016. [Google Scholar]
  22. Aihara, R.; Yokoyama, A.; Nomiyama, F.; Kosugi, N. Optimal operation scheduling of pumped storage hydro power plant in power system with a large penetration of photovoltaic generation using genetic algorithm. In Proceedings of the IEEE Trondheim PowerTech, Trondheim, Norway, 19–23 June 2011. [Google Scholar]
  23. Aghaei, M.; Fairbrother, A.; Gok, A.; Ahmad, S.; Kazim, S.; Lobato, K.; Oreski, G.; Reinders, A.; Schmitz, J.; Theelen, M.; et al. Review of degradation and failure phenomena in photovoltaic modules. Renew. Sustain. Energy Rev. 2022, 159, 112160. [Google Scholar] [CrossRef]
  24. Cazzaniga, R.; Cicu, M.; Rosa-Clot, M.; Rosa-Clot, P.; Tina, G.M.; Ventura, C. Floating photovoltaic plants: Performance analysis and design solutions. Renew. Sustain. Energy Rev. 2018, 81, 1730–1741. [Google Scholar] [CrossRef]
  25. Goswami, A.; Sadhu, P.K. Degradation analysis and the impacts on feasibility study of floating solar photovoltaic systems. Sustain. Energy, Grids Netw. 2021, 26, 100425. [Google Scholar] [CrossRef]
  26. Teixeira, L.E.; Caux, J.; Beluco, A.; Bertoldo, I.; Louzada, J.A.S.; Eifler, R.C. Feasibility study of a hydro PV hybrid system operating at a dam for water supply in southern Brazil. J. Power And Energy Eng. 2015, 3, 70–83. [Google Scholar] [CrossRef]
  27. Claus, R.; López, M. Key issues in the design of floating photovoltaic structures for the marine environment. Renew. And Sustainable Energy Rev. 2022, 164, 112502. [Google Scholar] [CrossRef]
  28. Barbón, A.; Bayón-Cueli, C.; Bayón, L.; Rodríguez-Suanzes, C. Analysis of the tilt and azimuth angles of photovoltaic systems in non-ideal positions for urban applications. Appl. Energy 2022, 305, 117802. [Google Scholar] [CrossRef]
  29. Zhao, Z.; Yuan, Y.; He, M.; Jurasz, J.; Wang, J.; Egusquiza, M.; Egusquiza, E.; Xu, B.; Chen, D. Stability and efficiency performance of pumped hydro energy storage system for higher flexibility. Renew. Energy 2022, 199, 1482–1494. [Google Scholar] [CrossRef]
  30. Bakhshaei, P.; Askarzadeh, A.; Arababadi, R. Operation optimization of a grid-connected photovoltaic/pumped hydro storage considering demand response program by an improved crow search algorithm. J. Energy Storage 2021, 44, 103326. [Google Scholar] [CrossRef]
  31. Al-Masri, H.M.K.; Magableh, S.K.; Abuelrub, A.; Alzaareer, K. Realistic coordination and sizing of a solar array combined with pumped hydro storage system. J. Energy Storage 2021, 41, 102915. [Google Scholar] [CrossRef]
  32. Shyam, B.; Kanakasabapathy, P. Feasibility of floating solar PV integrated pumped storage system for a grid-connected microgrid under static time of day tariff environment: A case study from India. Renewable Energy 2022, 192, 200–215. [Google Scholar] [CrossRef]
  33. Bhattacharjee, S.; Nayak, P.K. PV-pumped energy storage option for convalescing performance of hydroelectric station under declining precipitation trend. Renew. Energy 2019, 135, 288–302. [Google Scholar] [CrossRef]
  34. Bayón, L.; Grau, J.M.; Ruiz, M.M.; Suárez, P.M. Mathematical modelling of the combined optimization of a pumped-storage hydro-plant and a wind park. Math. Comput. Model. 2013, 57, 2024–2028. [Google Scholar] [CrossRef]
  35. Sahu, A.; Yadav, N.; Sudhakar, K. Floating photovoltaic power plant: A review. Renew. Sustain. Energy Rev. 2016, 66, 815–824. [Google Scholar] [CrossRef]
  36. Barbón, A.; Fortuny Ayuso, P.; Bayón, L.; Fernández-Rubiera, J.A. Predicting beam and diffuse horizontal irradiance using Fourier expansions. Renew. Energy 2020, 154, 46–57. [Google Scholar] [CrossRef]
  37. WRDC. World Radiation Data Centre. 2022. Available online: http://wrdc.mgo.rssi.ru/ (accessed on 27 December 2022).
  38. Hottel, H.C. A simple model for estimating the transmittance of direct solar radiation through clear atmosphere. Sol. Energy 1976, 18, 129–134. [Google Scholar] [CrossRef]
  39. Liu, B.Y.H.; Jordan, R.C. The interrelationship and characteristic distribution of direct, diffuse and total solar radiation. Sol. Energy 1960, 4, 1–19. [Google Scholar] [CrossRef]
  40. Duffie, J.A.; Beckman, W.A. Solar Engineering of Thermal Processes, 4th ed.; John Wiley & Sons: New York, NY, USA, 2013. [Google Scholar]
  41. Ghigo, A.; Faraggiana, E.; Sirigu, M.; Mattiazzo, G.; Bracco, G. Design and Analysis of a floating photovoltaic system for offshore installation: The case study of Lampedusa. Energies 2022, 15, 8804. [Google Scholar] [CrossRef]
  42. Barbón, A.; Ghodbane, M.; Bayón, L.; Said, Z. A general algorithm for the optimization of photovoltaic modules layout on irregular rooftop shapes. J. Clean. Prod. 2022, 365, 132774. [Google Scholar] [CrossRef]
  43. Barbón, A.; Bayón, L.; Díaz, G.; Silva, C.A. Investigation of the effect of albedo in photovoltaic systems for urban applications: Case study for Spain. Energies 2022, 15, 7905. [Google Scholar] [CrossRef]
  44. Available online: https://www.isifloating.com/en/solar-flotante-isifloating-by-isigenere-english/ (accessed on 27 December 2022).
  45. Available online: https://ciel-et-terre.net/solutions/products/ (accessed on 27 December 2022).
  46. Skoplaki, E.; Palyvos, J.A. On the temperature dependence of photovoltaic module electrical performance: A review of efficiency/power correlations. Sol. Energy 2009, 83, 614–624. [Google Scholar] [CrossRef]
  47. Kalogirou, S.A.; Agathokleous, R.; Panayiotou, G. On-site PV characterization and effect of soiling on their performance. Energy 2013, 51, 439–446. [Google Scholar] [CrossRef]
  48. Evans, D.L. Simplified method for predicting photovoltaic array output. Sol. Energy 1981, 27, 555–560. [Google Scholar] [CrossRef]
  49. Kichou, S.; Skandalos, N.; Wolf, P. Floating photovoltaics performance simulation approach. Heliyon 2022, 8, 11896. [Google Scholar] [CrossRef]
  50. Lawrence Kamuyu, W.C.; Rok Lim, J.; Sub Won, C.; Keun Ahn, H. Prediction model of photovoltaic module temperature for power performance of floating PVs. Energies 2018, 11, 447. [Google Scholar] [CrossRef]
  51. Mattei, M.; Notton, G.; Cristofari, C.; Muselli, M.; Poggi, P. Calculation of the polycrystalline PV module temperature using a simple method of energy balance. Renew. Energy 2006, 31, 553–567. [Google Scholar] [CrossRef]
  52. Available online: https://portugal.edp.com/en/alto-rabagao-hydro-power-plant (accessed on 27 December 2022).
  53. Barbón, A.; Bayón-Cueli, C.; Bayón, L.; Carreira-Fontao, V. A methodology for an optimal design of ground-mounted photovoltaic power plants. Appl. Energy 2022, 314, 118881. [Google Scholar] [CrossRef]
  54. PVGIS, Joint Research Centre (JRC). 2022. Available online: https://joint-research-centre.ec.europa.eu/pvgis-online-tool_en (accessed on 24 January 2023).
  55. Kottek, M.; Grieser, J.; Beck, C.; Rudolf, B.; Rubel, F. World Map of the Köppen-Geiger climate classification updated. Meteorol. Z. 2006, 15, 259–263. [Google Scholar] [CrossRef]
  56. ESIOS. Iberian Market Operator, Market Results. 2022. Available online: https://www.esios.ree.es/es/mercados-y-precios (accessed on 27 December 2022).
Figure 1. Outline of the problem statement.
Energies 16 01705 g001
Figure 2. Supply curve.
Energies 16 01705 g002
Figure 3. Demand curve.
Energies 16 01705 g003
Figure 4. Alto Rabagão power plant.
Energies 16 01705 g004
Figure 5. Upper reservoir of power plant.
Energies 16 01705 g005
Figure 6. Environmental conditions.
Energies 16 01705 g006
Figure 7. Beam and diffuse solar irradiation on a horizontal surface.
Energies 16 01705 g007
Figure 8. Annual energy generated by PV system.
Energies 16 01705 g008
Figure 9. Hydraulic and P V production.
Energies 16 01705 g009
Figure 10. Economic benefit if the two plants operate independently.
Energies 16 01705 g010
Figure 11. Economic benefit ratio under scenario 2 conditions.
Energies 16 01705 g011
Figure 12. Economic benefit under scenario 3 conditions.
Energies 16 01705 g012
Figure 13. Economic benefit under scenario 4 conditions.
Energies 16 01705 g013
Table 1. Price and cost of deviations.
ParameterDeviations
To DownwardTo Upwards
NNBS > 0PDD > MMPPUD = MMP
CDD > 0CUD = 0
NNBS < 0PDD = MMPPUD < MMD
CDD = 0CUD > 0
Table 2. Hourly price of the day-ahead market and deviations for 25 April 2022.

(h)
MMP
(€)
PUD
(€)
PDD
(€)
00:00267.43225.00267.06
01:00260.61237.00257.88
02:00248.87246.85246.85
03:00238.52190.00238.52
04:00232.61188.07237.14
05:00230.88190.00240.70
06:00237.23188.59246.27
07:00261.87224.00278.72
08:00272.47214.19310.02
09:00238.77141.79260.56
10:00221.75151.95229.13
11:00204.26141.02214.46
12:00181.98148.00254.40
13:00180.1151.96240.5
14:00173.76171.13178.67
15:00170.00156.67197.97
16:00170.56158.98179.62
17:00180.00153.96153.96
18:00207.00143.05143.05
19:00231.76150.08270.52
20:00275.71202.26220.71
21:00264.93223.77264.92
22:00254.00190.74270.53
23:00232.61172.82268.42
Table 3. Hourly price of the day-ahead market and deviations for 21 June 2022.

(h)
MMP
(€)
PUD
(€)
PDD
(€)
00:00170.2800
01:00150.7300
02:00148.0000
03:00145.9200
04:00148.8000
05:00150.0600
06:00149.8400
07:00175.5600
08:00175.5600
09:00153.7000
10:00145.0000
11:00141.22222.22222.22
12:00140.4400
13:00135.7300
14:00130.2500
15:00127.0500
16:00156.3600
17:00127.05185.88185.88
18:00127.0500
19:00130.7500
20:00146.1300
21:00180.0300
22:00180.0300
23:00146.5300
Table 4. Hourly price of the day-ahead market and deviations for 21 December 2022.

(h)
MMP
(€)
PUD
(€)
PDD
(€)
00:0058.7828.3562.26
01:0050.2721.4858.41
02:0040.000.0057.55
03:0036.832.2956.75
04:0036.680.5258.04
05:0050.002.0467.34
06:0058.1718.3168.21
07:0064.1734.1667.32
08:0077.7941.2280.86
09:0079.0029.7679.33
10:0068.0024.8170.46
11:0055.0015.5662.79
12:0054.009.6159.19
13:0053.000.0057.98
14:0051.000.0046.68
15:0055.000.0052.38
16:0070.0013.2768.28
17:0083.9616.6770.09
18:0090.0011.5171.53
19:0093.643.883.88
20:0095.7621.5821.58
21:0090.003.1470.72
22:0068.900.0066.01
23:0058.1719.4852.82
Disclaimer/Publisher’s Note: The statements, opinions and data contained in all publications are solely those of the individual author(s) and contributor(s) and not of MDPI and/or the editor(s). MDPI and/or the editor(s) disclaim responsibility for any injury to people or property resulting from any ideas, methods, instructions or products referred to in the content.

