Article

Influence of Environmental Factors on the Intelligent Management of Photovoltaic and Wind Sections in a Hybrid Power Plant

Department of Photonics, Electronics and Light Engineering, Faculty of Electrical Engineering, Bialystok University of Technology, Wiejska 45D, 15-351 Bialystok, Poland
Energies 2023, 16(4), 1716; https://doi.org/10.3390/en16041716
Submission received: 28 October 2022 / Revised: 24 November 2022 / Accepted: 6 February 2023 / Published: 9 February 2023

Abstract

:
The high-efficiency operation of photovoltaic and wind systems is affected by many factors and parameters that should be continuously monitored. Since most of the variable factors are related to weather conditions, they are difficult to predict. Therefore, in order to optimize the operating point of a photovoltaic or wind power plant, it is necessary to observe changes in the subject area. The operation of photovoltaic and wind power plants can complement each other. The results recorded at the hybrid power plant of the Faculty of Electrical Engineering of Bialystok University of Technology are useful for a comprehensive analysis of the power plant operation and the ways to optimize it. This paper presents the influence of environmental factors on the operation of a hybrid photo-voltaic–wind power plant located in the city of Bialystok, Poland. The aim of the study was to present the variable factors on the optimal adjustment of the location of the power plant elements at the stage of its design and selection of the energy management system. The presented measurement data from 2015–2021 allow conclusions to be drawn on the significant impact on the power plant’s operation, taking into account both the average conditions corresponding to the analysed location and the full range of changes in the listed factors.

1. Introduction

The need to become independent from fossil fuels in the production of electricity is being increasingly realized in Poland [1]. In recent years, new technologies for obtaining energy from renewable sources have been used worldwide in an increasingly large scale. They allow us to significantly reduce the emission of harmful substances into the environment. At the same time, an increase in the costs of fossil fuels has been observed, particularly visible in the years 2021–2022, and the costs of photovoltaic and wind power plants are gradually falling (Figure 1). Rising electricity prices are making renewable energy sources more and more economically viable. Renewable energy sources are, thus, becoming an increasingly important part of the electricity system.
The use of photovoltaic and wind energy sources requires the solution of technical problems. One of the main ones is the dependence of power plant operation on changing weather conditions. Effective use of solar radiation is very difficult due to fluctuations in available energy throughout the day, depending on the season, changes in atmospheric factors (temperature, global horizontal solar irradiance, diffuse horizontal solar irradiance, hours of sunshine, wind speed and direction, humidity, precipitation), geographic location, partial shading, angle of orientation, and cleanliness of panels. Operating conditions are always different and depend on the location of the power plant.
Photovoltaic panels are, therefore, not at a fixed operating point. The photovoltaic system is characterized by non-linear output characteristics due to weather variability, which causes a significant loss of total system power [2,3]. To avoid power mismatch, a power tracking strategy is used between the panel and the load [4]. Power electronic converters are a very important component of photovoltaic and wind power plants [5].
At the moment, micro-installations have the largest share in Poland in terms of installed capacity [6]. In the coming years, the development of larger unit capacities of PV power plants is expected to accelerate. An experimental simulation analysis of a grid-connected photovoltaic system for a large-scale facility requires a different design and energy management strategies [7]. Additional possibilities are related to the operation of hybrid plants sharing the infrastructure for PV and wind (cable pooling). The optimal sizing of a hybrid PV/wind/battery system is very important in this case [8]. Efficient operation of such systems often requires cooperation with energy storage facilities [9]. The use of energy storage creates additional costs for the construction of power plants. Battery storage is the most commonly used. The lifespan of battery storage units depends on the type and size [10,11,12,13].

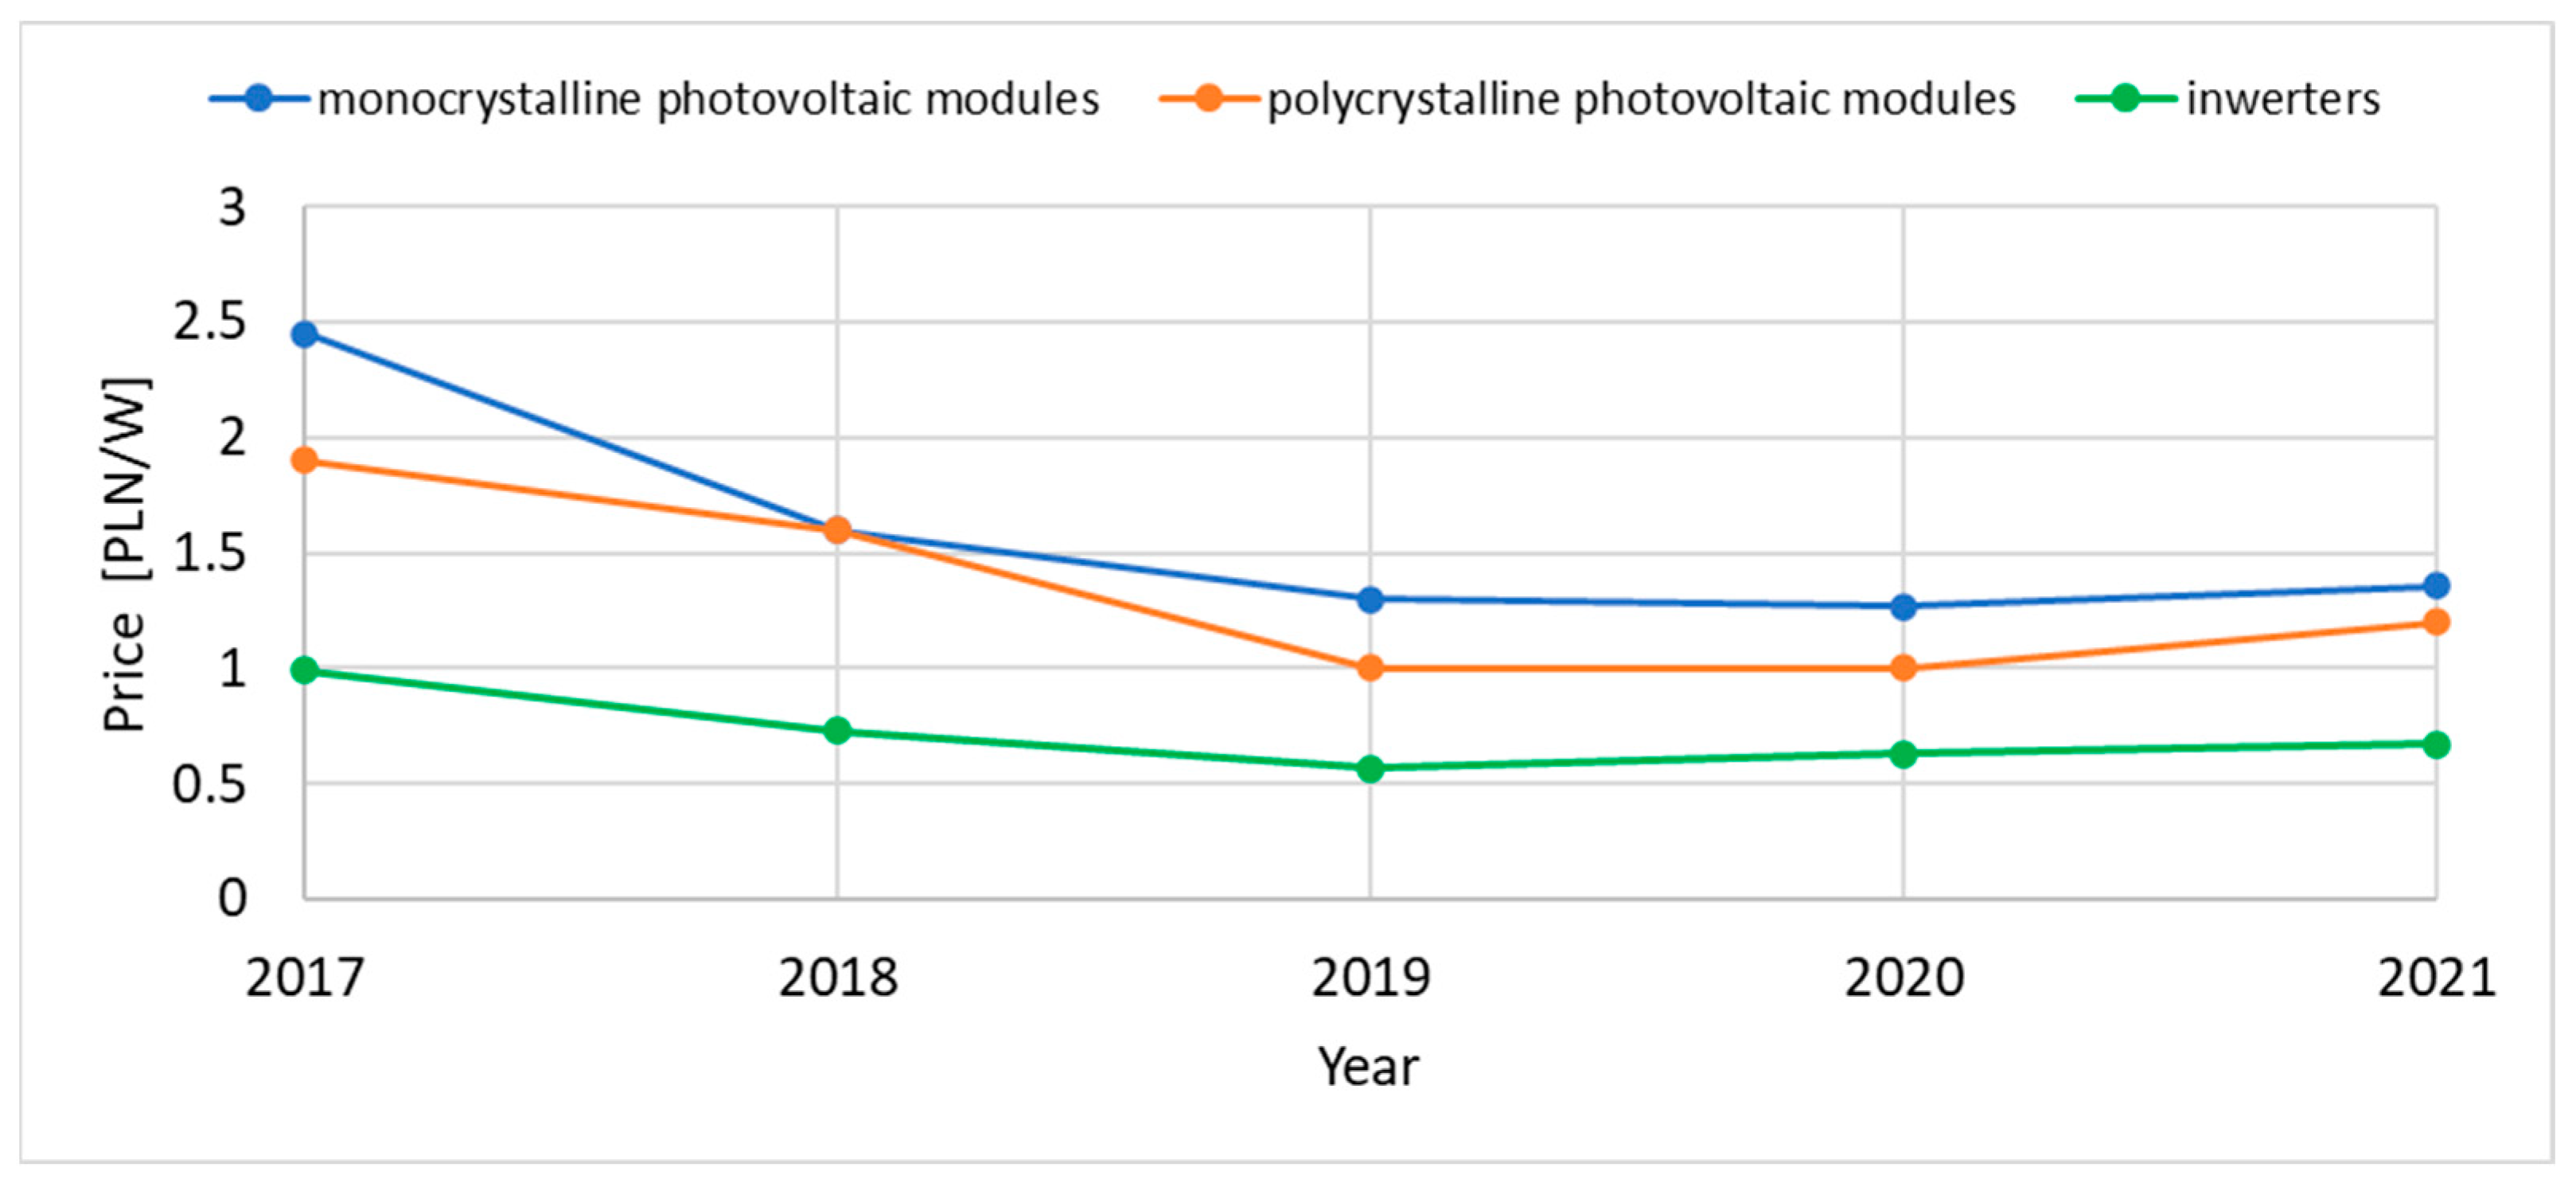
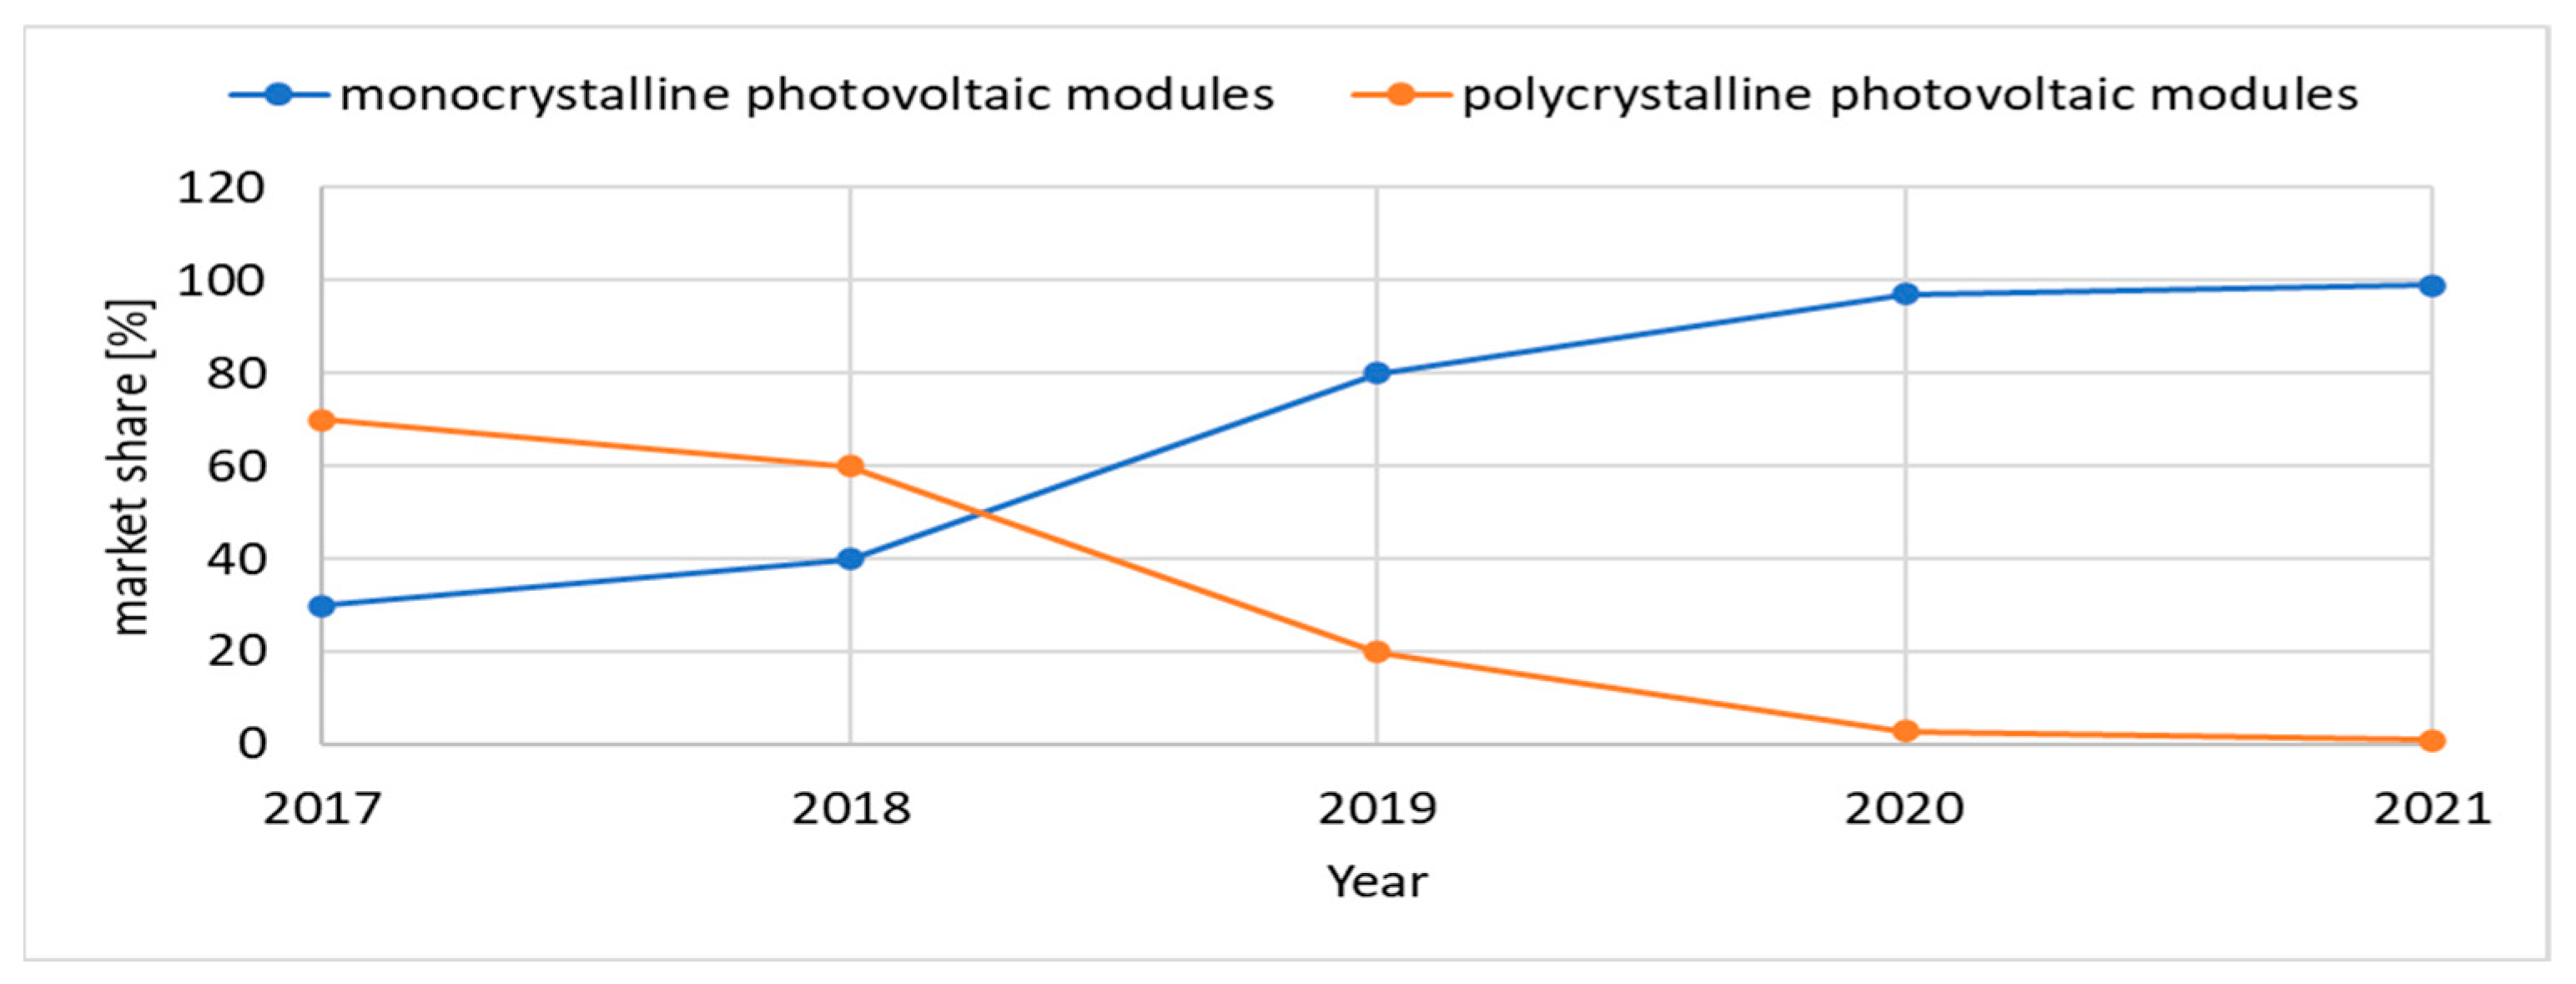
2. Changes in the Market for Renewable Energy Sources in Poland

Due to the rapid development of prosumer installations in recent years, the net prices of modules available on the Polish market were about 10% higher than global prices. The average cost of an installation, depending on its size, currently ranges from 2700 PLN/kW for installations above 1 MW to 4900 PLN/kW for installations up to 5 kW. At present, the cost is about 50% lower than 10 years ago. However, such a situation has been observed only in recent years, when conditions appeared in which outlays on the construction of photovoltaic installations on a fully commercial basis find economic justification. In the period from 2000 to 2021, the cost of producing electricity by photovoltaic installations was reduced by about 30 times. This resulted in an increase in the power installed in photovoltaic power plants [14].
In Poland, from 2018 to the first quarter of 2022, the prosumer micro-installation market (up to 50 kW) developed particularly dynamically (Figure 2). In such installations, a 6 GW capacity was reached in 2021, which is about 80% of the installed capacity in all PV installations in Poland. The increase in installed capacity in 2021 in Poland was 3.7 GW, which is the second largest in Europe after Germany (5.3 GW) [15].
In small installations from 50 kW to 1 MW at the end of 2021, the installed capacity was 1.5 GW and only 0.2 GW in installations above 1 MW. In the coming years, the rapid development of prosumer micro-installations is expected to slow down, and the development of larger unit capacities of PV power plants is expected to accelerate. Due to the ease of scaling up the size of investments, photovoltaic technology remains highly flexible in this regard [14,15]. The rapid development of photovoltaic power plants caused their share in the total installed capacity of renewable energy sources in Poland to exceed 50% in the first quarter of 2022 [16,17].
In terms of capacity installed in wind power plants, due to legal restrictions introduced in recent years, only a slight increase was recorded [18] (Figure 2).
The average efficiency of new installations is increasing. Over the past decade, photovoltaic cells have increased their efficiency by an average of 0.6% per year [19]. This is due to the use of new technologies, e.g., bifacial modules, PERC, and the increasing dominance of monocrystalline modules (Figure 3) [20,21].
The share of energy obtained from renewable sources in Poland reached 16.1% in 2020. The largest share was accounted for by wind power plants, which reached 10.8% in 2020. This share decreased to 9.4% in 2021 due to less favourable wind conditions. The share of energy generated from photovoltaic sources was only 1.5% in 2020 and doubled to about 3% in 2021. Further rapid growth is forecast in the coming years. Bearing in mind that a large share of PV installations was put into service last year, these statistics do not yet fully reflect the potential of PV power plants, which should become apparent after the spring–summer period when about 80% of the annual output is generated [1].
As we can see from the graphs in Figure 4, Figure 5 and Figure 6, the generation from solar PV and wind sources has a very high variability, which is due to the dependence on many variable environmental factors. Weather changes are very difficult to forecast accurately. It is easier to estimate the amount of energy that can be obtained in longer periods (e.g., monthly) (Figure 7, Figure 8 and Figure 9). This kind of operation of PV and wind power plants can greatly affect the stability of the power system and power quality. The effective application of appropriate technical solutions tailored to local needs is only possible by taking into account the factors that affect the operation of power plants. In connection with the increase in installed capacity in 2022, further records of generation from photovoltaic and wind sources were recorded. On 19 May 2022, photovoltaic power plants operated with a total capacity of 6.6 GW. On 4–5 April 2022, on the other hand, wind power plants were operating at a capacity of 7.2 GW, and, together with PV plants, the peak output reached 11 GW. This meant that up to 50% of electricity demand was covered by renewables at times. This is considerably higher than what we saw last year, when the peak reached about 40% (Figure 5).
Already since the first months of this year, as expected, another increasing share of generation from photovoltaic power plants has been registered (Figure 6). Due to limitations in the technical capacity of the Polish power grids to receive such amounts of energy at the time of record generation, power reductions during peak generation of wind and PV sources were already implemented. On 28 March 2022, it was necessary to reduce the output of wind farms by 20% (from 5 to 4 GW). This was the first underestimation of wind generation in Poland due to the balance situation of the national grid. With the dynamically growing installed PV capacity, it should be expected that similar situations will occur more and more frequently. These limitations result mainly from insufficiently developed grid infrastructure. At present, shortages of available connection capacities already exist in many areas.
It has already been observed in the Polish wholesale energy market that increasing the PV installed capacity during the high generation hours of spring and summer lowers the price. As the share of renewable sources increases, their impact on the power system as well as the energy market will grow.
Due to the instability of PV [22,23] and wind generation and their impact on balancing energy supply and demand, smart energy management, increased self-consumption, and storage of excess energy is necessary. This can be achieved by increasing the efficiency of energy management through a Home Energy Management System or by expanding the installations with electrical or thermal storage. In the case of battery storage, the cost of 4 h ahead of peak generation (peak sheaving) is estimated to be 2 to 5 PLN/kWh. Thermal storage allows storing energy for up to 24 h at a cost of 1 PLN/kWh. The variability of generation in daily and yearly cycles can also be reduced by proper placement of PV panels, which will be discussed in more detail in the subsequent sections. Additional possibilities to consider are related to the operation of hybrid plants sharing the infrastructure for PV and wind (cable pooling). Under the climatic conditions of Northeast Poland, the PV and wind power generation can complement and balance each other to some extent (Figure 10). PV power plants generate throughout the daytime with the diurnal cycle and during the annual cycle mainly in spring and summer. However, stronger winds occur mainly at night and during autumn and winter (Figure 4 and Figure 10). In order to implement and effectively use PV and wind power plants, it is necessary to carry out a generation analysis taking into account local geographical and climatic factors over several years.
Connection of new electricity sources to the system is conditioned by the availability and condition of the grid infrastructure. At present, there are increasing limitations on the ability to connect new installations or periodic limitations on the ability to feed surplus energy into the grid. An additional challenge, but an opportunity at the same time in this case, is the progressing development of electromobility. In order to effectively use energy storage batteries of BEVs (Battery Electric Vehicle) and PHEVs (Plug-in Hybrid Electric Vehicle), the ideas of V2G (Vehicle to Grid), V2H (Vehicle to Home) and V2X (Vehicle to Everything) were born.

3. Factors Affecting the Operation of Photovoltaic Power Plants and Wind Power Plants

Many factors influence the operation of photovoltaic and wind power plants. Most of them are related to location, orientation in relation to geographical directions, surrounding objects and weather conditions [24,25]. Weather factors in Polish climatic conditions can change in a wide range and in a way that is difficult to predict precisely [26,27,28,29,30,31]. More extensively mentioned factors corresponding to the location of the Faculty of Electrical Engineering of the Bialystok University of Technology hybrid power plant have been presented in previously published articles [32,33].
The most important factor affecting the operation of PV panels is their temperature. Creating a mathematical model is difficult due to the need to take into account many variables. Therefore, the authors in the literature [34] propose the use of several mathematical models:
Standard Model
T P V = T a + G 0 G 0 , N O C T T P V ,   N O C T T a ,   N O C T
where:
  • T a (°C) is the ambient temperature;
  • G 0 (W/m2) is the in-plane irradiance;
  • G 0 , N O C T = 800   W / m 2 is the irradiance at which the NOCT is defined;
  • T a , N O C T = 20   is the ambient temperature at which the NOCT is defined;
  • T P V ,   N O C T = 44   46   is the technology-dependent nominal operating cell temperature.
King Model
T P V = T a + G 0 e a + b · v w
where:
  • a (−) is the coefficient describing the effect of the radiation on the module temperature in the King model;
  • b (−) is the coefficient describing the effect of cooling by the wind in the King model;
  • v w is the wind speed at a height of 10 m (m/s).
Skoplaki Model
T P V = T a + ω 0.32 G 0 8.91 + 2 v w
where:
  • ω (−) is the mounting coefficient defined as the ratio of the Ross parameter for the mounting situation. It takes on the values of 1, 1.2, 1.8, and 2.4, respectively, for free-standing installations, flat roofs, sloping roofs, and facade-integrated photovoltaics;
  • v w (m/s) is the local wind speed around the module.
Skoplaki Model 2
T P V = T a + G 0 G 0 , N O C T T P V ,   N O C T T a ,   N O C T h w , N O C T h w v 1 η S T C τ · α 1 β S T C T a , S T C
where:
  • h w (W/(m2·°C)) is wind convection coefficient;
  • h w , N O C T (W/(m2·°C)) is the wind convection coefficient for wind speed at NOCT conditions, i.e., v w = 1   m / s ;
  • τ·α is the effective transmittance-absorbance product of the module;
  • η S T C is the efficiency coefficient of maximal power under standard test conditions (STC);
  • β S T C is the temperature coefficient of maximal power.
Faiman Model
T P V = T a + G 0 U 0 + U 1 v w
where:
  • U 0 (W/(m2·°C)) is the coefficient describing the effect of the radiation on the module temperature;
  • U 1 ((W·s)/(m3·°C)) is the coefficient describing the cooling by the wind.
Mattei Model
T P V = U P V v T a + G 0 τ · α η S T C T C , S T C U P V v + β S T C η S T C G 0
where:
  • U P V v (W/(m2·°C)) is the thermal losses coefficient from module to the surroundings.
The analysis of the measurements and the comparison with the results obtained with the mentioned mathematical models was carried out using data from 2019. The number of measurement points per day was 4099. The number of points per month was 122,000. The analysis covered sections PV1, PV2a, and PV2b of the hybrid power plant of the Faculty of Electrical Engineering of Bialystok University of Technology. For section PV1, the Skoplaki model proved to be the best. The normalised mean square error (NRMSE) of section PV1 was below 6% and the normalised mean bias error (NMBE) was below 5%. For the PV2a section, the Skoplaki 1 model was the best (NRMSE was 11%, NMBE was 10%). For the PV2b sections, the standardised model NOCT was the best (NRMSE was 10%, NMBE was 8%). The normalised NRMSE measure is related to the average operating temperature of PV panels. The consistency of the calculation results with the obtained measured data shows the necessity to take into account the effect of wind speed when determining the operating temperature of free-standing PV systems. The mounting issue is essential as well. Temperature estimation errors in degrees ranged from 2 °C to 7 °C. An analysis of this issue and mathematical models are discussed in detail in the article by A. Idzkowski, K. Karasowska, and W. Walendziuk [34].
The most important parameters are: temperature, solar global horizontal irradiation, solar diffuse horizontal irradiation, sunshine hours, speed and wind direction, humidity, pressure, precipitation, day length, geographical location, and setting angle. These should be monitored in order to control the power plant operation and select its optimal operating point [30]. Many authors have also published studies that give a broader overview of the impact of monitoring systems on the performance of PV power plants [35,36,37,38,39].
It is also important to select an appropriate mounting location that limits the possibility of shading of PV panels and the wind turbine environment, which can adversely affect the turbine’s exposure to wind.

4. Hybrid Power Plant of the Faculty of Electrical Engineering of the Bialystok University of Technology

The Faculty of Electrical Engineering of Bialystok University of Technology has been using a hybrid power plant and a weather station since 2015, which is the object of the research presented in this article. The power plant consists of four photovoltaic and two wind sections (Figure 11 and Table 1). Identical PV modules were used in all PV sections (Table 2), which allows us to compare their performance. The geographical coordinates of the power plant locations are 53°07′ N 23°08′ E.
The subject of further analysis will be the three selected photovoltaic sections and one wind section. The photovoltaic part consists of the 12 PV modules of the PV1 section inclined at an angle of 38°, which allows maximum annual generation. The PV2a and PV2b sections comprise 6 PV modules each, making a total of 12 panels also installed on the building façade. The wind section W1 is a turbine with a horizontal axis of rotation. The wind turbine is mounted on a 15.27 m high mast.
IoT solutions for the monitoring and control of the power plant in a broader scope are presented in the article by Jacek Kusznier and Wojciech Wojtkowski [30].

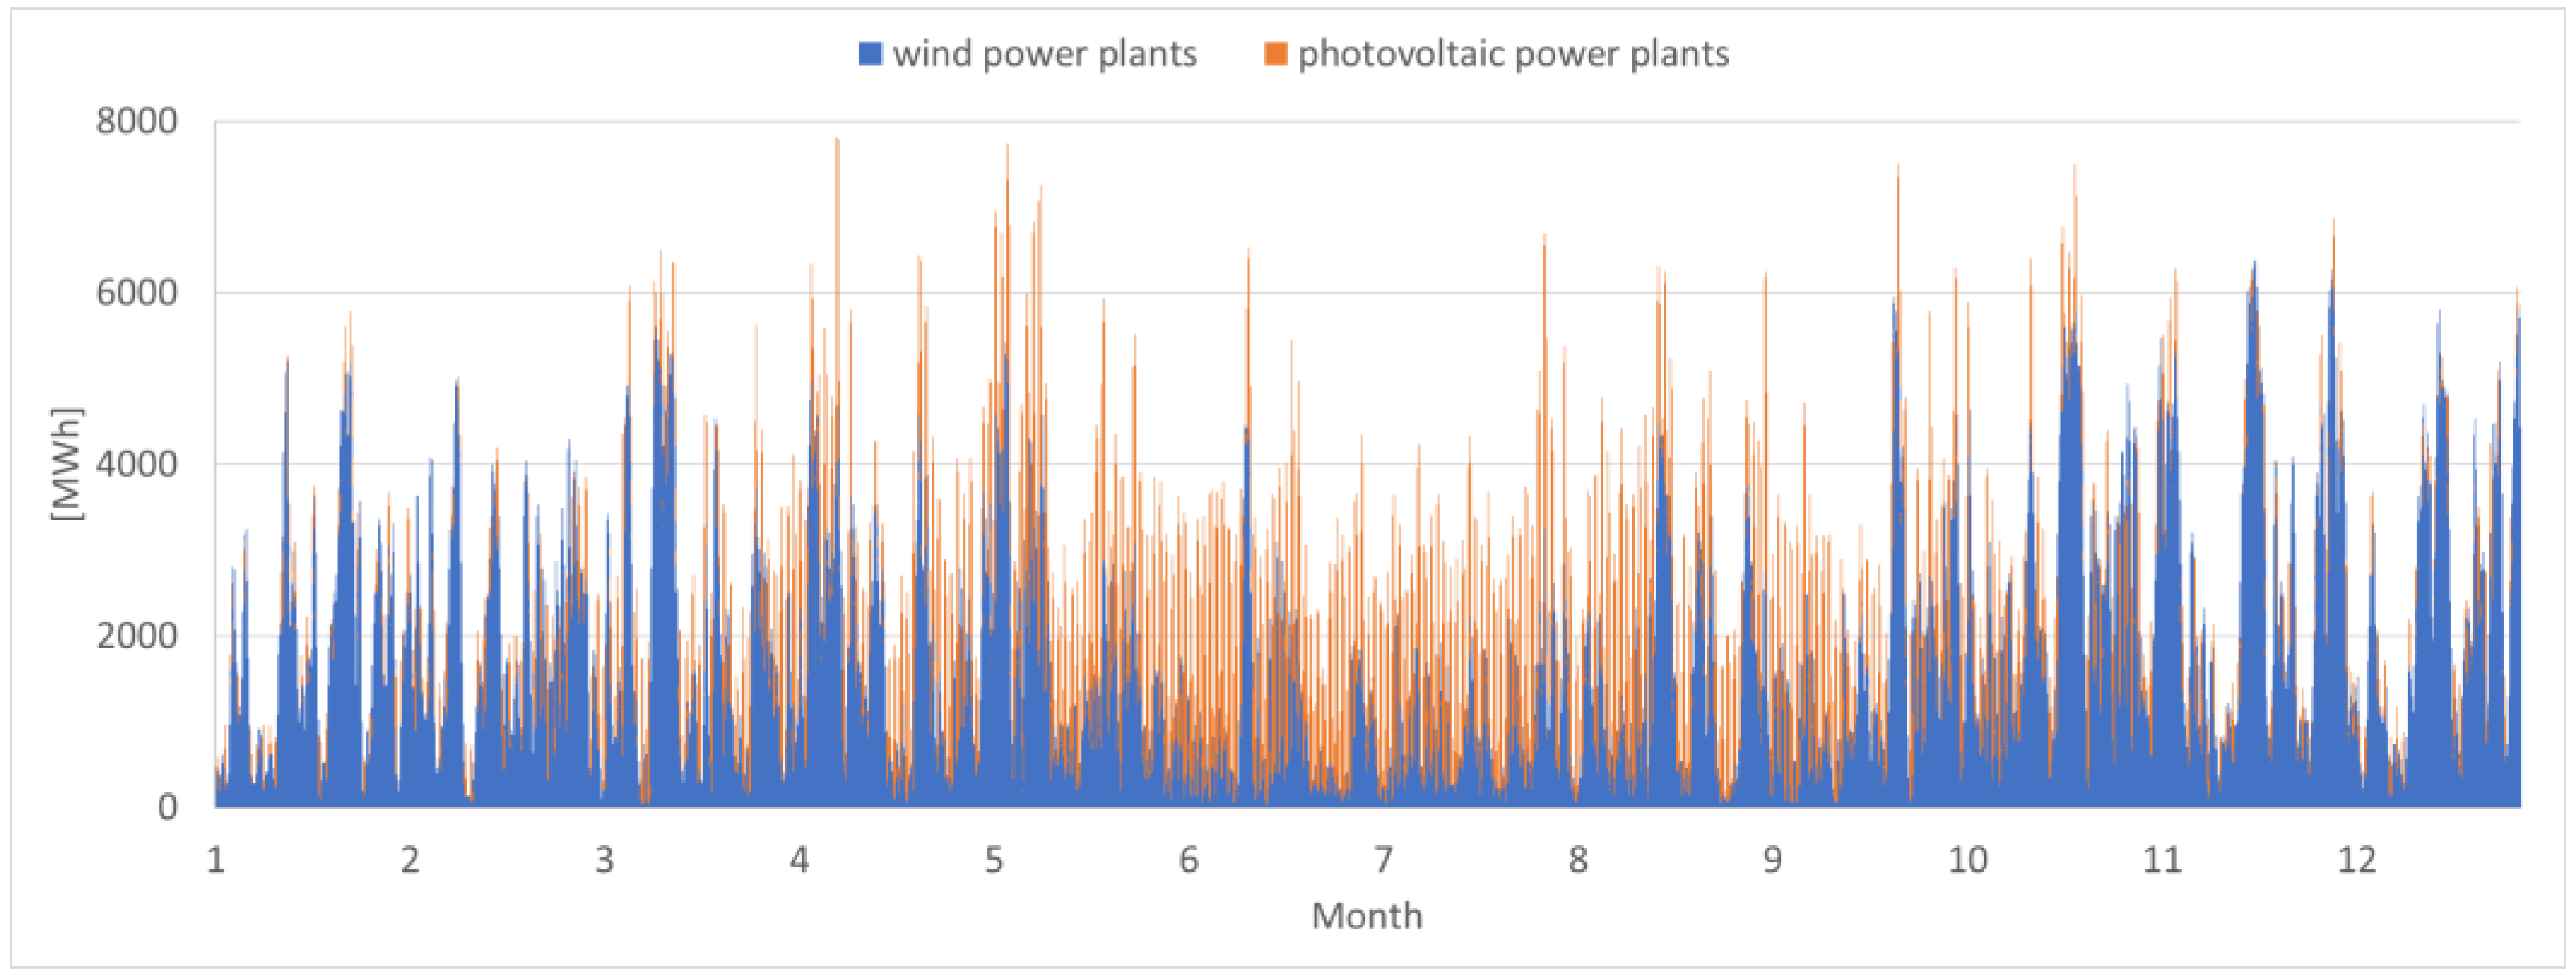
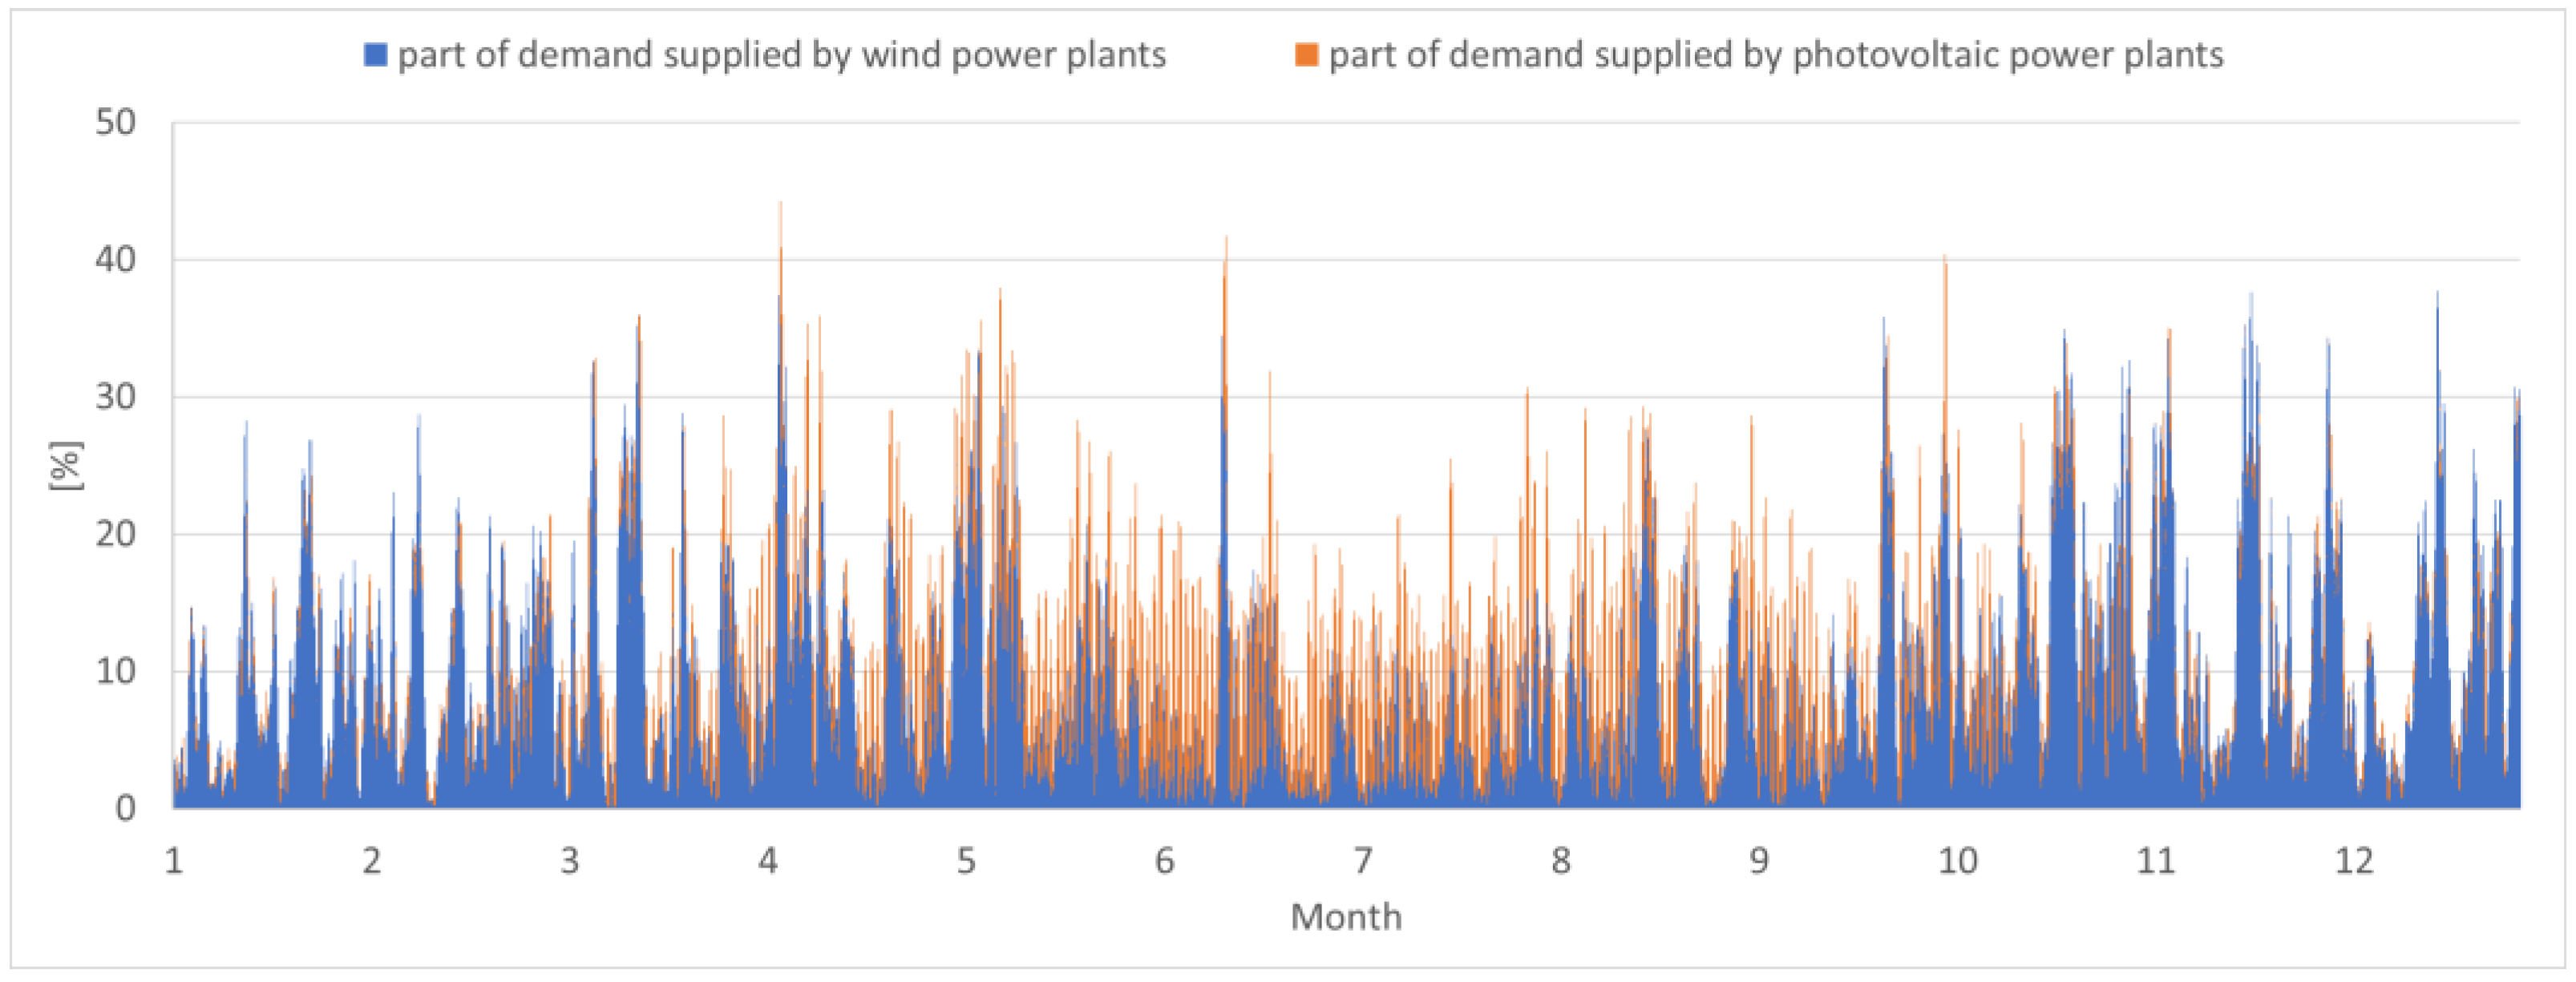
5. Results and Analysis of Hybrid Power Plant Operation

Measurements were realized using a distributed system consisting of: a National Instruments NI PXIe-8108 (2.53 GHz Dual-Core Embedded Controller for PXI Express), NI-9148 external measurement modules (8-Slot, Spartan-3 FPGA and Ethernet Compact RIO Chassis), a NI 9213 high-density thermocouple module, K-type NiCr-NiAl thermocouples, and global solar radiation sensors (NI-9219+ LP PYRA 03). Environmental factors were controlled using a WS501-UMB weather station (Lufft, Fellbach, Germany), which is connected to an NI PXIe-8108 computer via an RS485 interface.
The operation of a PV power plant is closely dependent on insolation. In the climatic conditions of northeastern Poland, we observe a strong dependence related to the change in season. The graphs of insolation and the energy generation of the PV1 power plant presented in Figure 12 and Figure 13 show significant similarities. This indicates the greater importance of insolation than the potential available energy due to the season without taking into account weather conditions (cloud cover and temperature). Recorded generation in April and May was often higher than in June and July. Figure 13 also shows significant differences between the same months in consecutive years. Maximum generation was obtained in other months. The influence of weather conditions on the operation of the PV modules is discussed in more detail in the paper by Jacek Kusznier and Wojciech Wojtkowski [30].
The study clearly showed the cyclic nature of the PV power plant operation in both daily and annual periods. A way to distribute the energy generation in a more uniform diurnal manner is to divide the PV modules into two sets and direct them east and west instead of south. We can analyze this situation within the studied power plant by recording the operation of the PV2a and PV2b sections (Figure 14). Increasing the inclination angle, on the other hand, allows more uniform operation in an annual cycle by means of a higher generation in winter at the expense of lowering the summer generation (Figure 14, Figure 15, Figure 16, Figure 17, Figure 18, Figure 19, Figure 20 and Figure 21).
The split and the discussed location of the PV panels should be taken into account if there are limitations in the location of the installation and the possibility of releasing momentary surplus energy to the power grid. It should be remembered that the reduction in the energy “stored” in the grid is 20% or 30%, depending on the size of the installation, in the net metering system. In such a situation, reducing the generation in section PV2a by about 25% compared to that recorded in section PV1 may be economically justified. Additionally, the PV2b section was oriented to the west, resulting in a generation 38% lower than in the optimal setting, but allowing the afternoon generation time to be extended by 2 h.
The reduction in generation on a year-round basis is comparable to the amount that is given back to the grid operator in exchange for “energy storage”. In addition, the PV plant’s operating time expands to include more of the prosumer’s afternoon peak demand hours. This allows for an increased level of self-consumption of the generated energy.
The results recorded during 7 years of power plant operation allow maximum, minimum, and average values to be determined, as well as their variability and cyclicality in daily as well as annual cycles. This makes it possible to forecast the operation of the power station under the environmental conditions of north-eastern Poland.

6. Discussion and Conclusions

The results of several years of analysis of the operation of the hybrid power plant of the Faculty of Electrical Engineering of the Bialystok University of Technology show that we can increase the level of self-consumption of energy while reducing the load on the power grid during periods of peak generation by appropriately positioning the PV panels (changing the direction and angle of inclination). The operation of photovoltaic and wind power plants is highly dependent on weather conditions. High levels of insolation occur during weather highs. Strong winds, on the other hand, are associated with low-cloud weather. As a result, periods when PV power generation is reduced are often accompanied by increased generation from wind sources (Figure 6, Figure 10 and Figure 21). In the annual cycle for the climate of the location in question, we observe a higher level of wind power generation in the autumn–winter period when it is lowered from PV sources (Figure 7, Figure 9, Figure 20 and Figure 21).
The dependence of the amount of energy produced in photovoltaic power plants on the angle of inclination and orientation of PV panels can be simulated. However, it is difficult to take into account the variable weather conditions in such situations, which are decisive. Therefore, it is necessary to analyze the designed installation, taking into account the long-term average results obtained in reference facilities in a similar location. Such an object for north-eastern Poland can be the hybrid power plant of the Faculty of Electrical Engineering of the Bialystok University of Technology.

Funding

This research was funded by the Bialystok University of Technology as part of the teamwork WZ/WE-IA/3/2023 of the Department of Photonics, Electronics and Lighting Technology.

Institutional Review Board Statement

Not applicable.

Informed Consent Statement

Not applicable.

Data Availability Statement

Not applicable.

Acknowledgments

The article was built on the project that developed a hybrid system of small wind and photovoltaic power for supplying electricity to the facilities of the Faculty of Electrical Engineering of Bialystok University of Technology, “Improvement of energy efficiency of the infrastructure of Bialystok University of Technology with the use of renewable energy sources”, co-financed by the European Regional Development Fund. The operation of the production system in urban (urbanized) conditions was also studied within the scope of the project “Study of the efficiency of active and passive methods of improving the energy efficiency of infrastructure using renewable energy sources”, co-financed by the European Regional Development Fund and the budget of Poland.

Conflicts of Interest

The authors declare no conflict of interest.

References

  1. Ministry of Climate and Environment. Energy Policy of Poland Until 2040; Ministry of Climate and Environment: Warsaw, Poland, 2021.
  2. Ali, A.; Almutairi, K.; Malik, M.Z.; Irshad, K.; Tirth, V.; Algarni, S.; Zahir, M.H.; Islam, S.; Shafiullah, M.; Shukla, N.K. Review of Online and Soft Computing Maximum Power Point Tracking Techniques under Non-Uniform Solar Irradiation Conditions. Energies 2020, 13, 3256. [Google Scholar] [CrossRef]
  3. Abdul Kareem, M.S.; Saravanan, M. A New Method for Accurate Estimation of PV Module Parameters and Extraction of Maximum Power Point under Varying Environmental Conditions. Turk. J. Electr. Eng. Comput. Sci. 2016, 24, 2028–2041. [Google Scholar] [CrossRef]
  4. Arandhakar, S.; Chaudhary, N.; Depuru, S.R.; Dubey, R.K.; Bhukya, M.N. Analysis and Implementation of Robust Metaheuristic Algorithm to Extract Essential Parameters of Solar Cell. IEEE Access. 2022, 10, 40079–40092. [Google Scholar] [CrossRef]
  5. Malik, M.Z.; Tirth, V.; Ali, A.; Farooq, A.; Algahtani, A.; Verma, R.; Islam, S.; Irshad, K.; Abdalla, A.N. Efficient Topology for DC–DC Boost Converter Based on Charge Pump Capacitor for Renewable Energy System. Int. J. Photoenergy 2021, 2021, 6675720. [Google Scholar] [CrossRef]
  6. Stowarzyszenie Branzy Fotowoltaicznej—Polska PV. Development of the Polish PV Market in 2010–2020; Główny Urzad Statystyczny: Cracow, Poland, 2016. (In Polish)
  7. Khan, M.A.; Islam, N.; Khan, M.A.M.; Irshad, K.; Hanzala, M.; Pasha, A.A.; Mursaleen, M. Experimental and simulation analysis of grid-connected rooftop photovoltaic system for a large-scale facility. Sustain. Energy Technol. Assess. 2022, 53, 102773. [Google Scholar] [CrossRef]
  8. Fares, D.; Fathi, M.; Mekhilef, S. Performance evaluation of metaheuristic techniques for optimal sizing of a stand-alone hybrid PV/wind/battery system. Appl. Energy 2022, 305, 117823. [Google Scholar] [CrossRef]
  9. Emrani, A.; Berrada, A.; Bakhouya, M. Optimal sizing and deployment of gravity energy storage system in hybrid PV-Wind power plant. Renew. Energy 2022, 183, 12–27. [Google Scholar] [CrossRef]
  10. Bonkile, M.P.; Ramadesigan, V. Effects of sizing on battery life and generation cost in PV–wind battery hybrid systems. J. Clean. Prod. 2021, 340, 130341. [Google Scholar] [CrossRef]
  11. Komarnicki, P. Energy storage systems: Power grid and energy market use cases. Arch. Electr. Eng. 2016, 65, 495–511. [Google Scholar] [CrossRef]
  12. Hallmann, M.; Wenge, C.; Balischewski, S.; Komarnicki, P. Methods for lithium-based battery energy storage state of charge estimation part I: Overview. Arch. Electr. Eng. 2022, 71, 139–157. [Google Scholar] [CrossRef]
  13. Hallmann, M.; Wenge, C.; Komarnicki, P. Methods for lithium-based battery energy storage state of charge estimation part II: Application and accuracy. Arch. Electr. Eng. 2022, 71, 311–323. [Google Scholar] [CrossRef]
  14. PSE, S.A. Development Plan for Meeting the Current and Future Electricity Demand for 2023–2032; PSE: Konstancin-Jeziorna, Poland, 2022. [Google Scholar]
  15. PSE, S.A. Development Plan for Meeting the Current and Future Electricity Demand for 2021–2030; PSE: Konstancin-Jeziorna, Poland, 2020. [Google Scholar]
  16. Ministerstwo Gospodarki RP. Conclusions from Forecast Analyses for the Purposes of Energy Policy of Poland until 2050; Annex 2; Ministerstwo Gospodarki RP: Warsaw, Poland, 2015. (in Polish)
  17. Assessment of Greenhouse Gas Emissions Abatement Potential in Poland by 2030; Summary of Findings; Publications of McKinsey & Company: Warsaw, Poland, 2009.
  18. Paska, J.; Surma, T. Electricity generation from renewable energy sources in Poland. Renew. Sustain. Energy Rev. 2014, 71, 286–294. [Google Scholar] [CrossRef]
  19. Hafiz, A.M.; Abdelrahman, M.E.; Temraz, H. Economic dispatch in power system networks including renewable energy resources using various optimization techniques. Arch. Electr. Eng. 2021, 70, 643–655. [Google Scholar] [CrossRef]
  20. Khan, J.; Arsalan, M.H. Solar power technologies for sustainable electricity generation—A review. Renew. Sustain. Energy Rev. 2016, 55, 414–425. [Google Scholar] [CrossRef]
  21. Saga, T. Advances in crystalline silicon solar cell technology for industrial mass production. NPG Asia Mater. 2010, 2, 96–102. [Google Scholar] [CrossRef]
  22. Bellia, L.; Blaszczak, U.; Fragliasso, F.; Gryko, L. Matching CIE illuminants to measured spectral power distributions: A method to evaluate non-visual potential of daylight in two European cities. Sol. Energy 2020, 208, 830–858. [Google Scholar] [CrossRef]
  23. Badescu, V. Modeling Solar Radiation at the Earth’s Surface: Recent Advances; Springer: Berlin/Heidelberg, Germany, 2008; pp. 1–517. ISBN 978-354077454-9. [Google Scholar] [CrossRef]
  24. Cholewinski, M.; Fafara, J.M. Numerical assessment of energy generation from photovoltaic cells using the CM-SAF PVGIS database. Arch. Electr. Eng. 2022, 71, 227–243. [Google Scholar] [CrossRef]
  25. Le, T.H. A combined method for wind power generation forecasting. Arch. Electr. Eng. 2021, 70, 991–1009. [Google Scholar] [CrossRef]
  26. Sharma, H.; Pal, N.; Kumar, P.; Yadav, A. A control strategy of hybrid solar-wind energy generation system. Arch. Electr. Eng. 2017, 66, 241–251. [Google Scholar] [CrossRef] [Green Version]
  27. Ostasz, G.; Siwiec, D.; Pacana, A. Universal Model to Predict Expected Direction of Products Quality Improvement. Energies 2022, 15, 1751. [Google Scholar] [CrossRef]
  28. Mengi, O.Ö.; Altaş, I.H. Fuzzy logic control for a wind/battery renewable energy production system. Turk. J. Electr. Eng. Comput. Sci. 2012, 20, 187–206. [Google Scholar] [CrossRef]
  29. Khoa, N.M.; Le, V.D.; Tung, D.D.; Toan, N.A. An advanced IoT system for monitoring and analysing chosen power quality parameters in micro-grid solution. Arch. Electr. Eng. 2021, 70, 173–188. [Google Scholar] [CrossRef]
  30. Kusznier, J.; Wojtkowski, W. IoT Solutions for Maintenance and Evaluation of Photovoltaic Systems. Energies 2021, 14, 8567. [Google Scholar] [CrossRef]
  31. González, I.; Calderón, A.J.; Folgado, F.J. IoT real time system for monitoring lithium-ion battery long-term operation in microgrids. J. Energy Storage 2022, 51, 104596. [Google Scholar] [CrossRef]
  32. Kusznier, J.; Wojtkowski, W. Impact of climatic conditions on PV panels operation in a photovoltaic power plant. In Proceedings of the 2019 15th Selected Issues of Electrical Engineering and Electronics (WZEE), Zakopane, Poland, 8–10 December 2019. [Google Scholar] [CrossRef]
  33. Kusznier, J.; Wojtkowski, W. Impact of climatic conditions and solar exposure on the aging of PV panels. In Proceedings of the 2019 15th Selected Issues of Electrical Engineering and Electronics (WZEE), Zakopane, Poland, 8–10 December 2019. [Google Scholar] [CrossRef]
  34. Idzkowski, A.; Karasowska, K.; Walendziuk, W. Temperature Analysis of the Stand-Alone and Building Integrated Photovoltaic Systems Based on Simulation and Measurement Data. Energies 2020, 13, 4274. [Google Scholar] [CrossRef]
  35. Ansari, S.; Ayob, A.; Lipu, M.S.H.; Saad, M.H.M.; Hussain, A. A Review of Monitoring Technologies for Solar PV Systems Using Data Processing Modules and Transmission Protocols: Progress, Challenges and Prospects. Sustainability 2021, 13, 8120. [Google Scholar] [CrossRef]
  36. González, I.; Portalo, J.M.; Calderón, A.J. Configurable IoT Open-Source Hardware and Software I-V Curve Tracer for Photovoltaic Generators. Sensors 2021, 21, 7650. [Google Scholar] [CrossRef]
  37. Melo, G.C.G.d.; Torres, I.C.; de Araújo, Í.B.Q.; Brito, D.B.; Barboza, E.d.A. A Low-Cost IoT System for Real-Time Monitoring of Climatic Variables and Photovoltaic Generation for Smart Grid Application. Sensors 2021, 21, 3293. [Google Scholar] [CrossRef]
  38. Gomes, L.; Vale, Z.; Corchado, J.M. Microgrid management system based on a multi-agent approach: An office building pilot. Measurement 2020, 154, 107427. [Google Scholar] [CrossRef]
  39. Vargas-Salgado, C.; Aguila-Leon, J.; Chiñas-Palacios, C.; Hurtado-Perez, E. Low-cost web-based Supervisory Control and Data Acquisition system for a microgrid testbed: A case study in design and implementation for academic and research applications. Heliyon 2019, 5, 9. [Google Scholar] [CrossRef] [Green Version]
  40. SMA Solar Technology AG. Sunny Boy 2000HF/2500HF/3000HF—Installation Guide. Available online: https://www.solartradesales.co.uk/Cache/Downloads/SunnyBoy-HF-Installation-guide-3.pdf (accessed on 24 August 2021).
  41. Solahart Goodwe Single Phase Small Domestic Inverter. GW1500-NS & GW3000-NS. Available online: https://www.solahart.com.au/media/5305/ih0113_gw1500-ns-gw3000-ns_single-phase-inverters_june-2019_web.pdf (accessed on 26 August 2021).
  42. Europe Solar Production. ESP 6P 250-265 Wp, Moduły Fotowoltaiczne Polikrystaliczne o Grubości Ramy 40 mm. Available online: https://www.europe-solarproduction.com/media/2963/ESP-Polycrystalline-250-265WP_PL.pdf (accessed on 26 August 2021).
  43. Available online: https://www.weatheronline.pl/weather/ (accessed on 27 May 2022).
  44. Available online: https://dateandtime.info/pl (accessed on 27 May 2022).
Figure 1. Average prices in 2017–2021 in Poland (own compilation of data from IEO).
Energies 16 01716 g001
Figure 2. Installed power in photovoltaic and wind power plants in Poland (own elaboration based on IEO and GUS data).
Energies 16 01716 g002
Figure 3. Market shares of individual types of photovoltaic modules in Poland (own compilation of data from IEO).
Energies 16 01716 g003
Figure 4. Energy generation by photovoltaic and wind power plants in Poland in 2021 (own compilation of data from PSE S.A.).
Energies 16 01716 g004
Figure 5. Coverage of demand for power by photovoltaic and wind power plants in Poland in 2021 (own compilation of data from PSE S.A.).
Energies 16 01716 g005
Figure 6. Share of photovoltaic and wind power plants in generation of renewable energy sources in Poland in 2021 (own compilation of data from PSE S.A.).
Energies 16 01716 g006
Figure 7. Energy generation by photovoltaic and wind power plants in monthly values in Poland in 2021 (own compilation of data from PSE S.A.).
Energies 16 01716 g007
Figure 8. Coverage of power demand by photovoltaic and wind power plants in monthly values in Poland in 2021 (own compilation of data from PSE S.A.).
Energies 16 01716 g008
Figure 9. Share of photovoltaic and wind power plants in monthly generation of renewable energy sources in Poland in 2021 (own compilation of data from PSE S.A.).
Energies 16 01716 g009
Figure 10. Power generation by photovoltaic and wind power plants in Poland on selected days in October 2021 (own elaboration based on data from PSE S.A.).
Energies 16 01716 g010
Figure 11. Hybrid power plant of the Faculty of Electrical Engineering of the Bialystok University of Technology.
Energies 16 01716 g011
Figure 12. Monthly values of insolation and percentage share of sunny hours in relation to the length of day in Białystok (own elaboration based on [43,44]).
Energies 16 01716 g012
Figure 13. Monthly values of generated energy in PV1 section (own measurement data).
Energies 16 01716 g013
Figure 14. Instantaneous power of analyzed sections on a sunny summer day (own measurement data).
Energies 16 01716 g014
Figure 15. Instantaneous power of analyzed sections on a sunny winter day (own measurement data).
Energies 16 01716 g015
Figure 16. Daily energy generation by PV1 section in 2018 (own measurement data).
Energies 16 01716 g016
Figure 17. Daily energy generation by PV2a and PV2b sections in 2018 (own measurement data).
Energies 16 01716 g017
Figure 18. Monthly energy generation by PV1 and PV2a+PV2b sections in 2021 (own measurement data).
Energies 16 01716 g018
Figure 19. Share of PV1 and PV2a+PV2b sections in monthly generation of PV1 and PV2a+PV2b sections in 2021 (own measurement data).
Energies 16 01716 g019
Figure 20. Monthly energy generation by PV1 and W1 sections in 2021 (own measurement data).
Energies 16 01716 g020
Figure 21. Share of PV1 and W1 sections in monthly generation of PV1 and W1 sections in 2021 (own measurement data).
Energies 16 01716 g021
Table 1. Elements of the power plant under study.
The Installation SetupPV1PV2a
LocationOn the roof of the buildingOn the southeastern facade
ArrangementAt 38°At 90°
Azimuth180°160°
DC Power3.0 kWp1.5 kWp
Inverter SMA typ SUNNY BOY 3000 HF,
Max. power 3.15 kWp DC [40]
Goodwe NS-1500, Max.
power 1.8 kWp DC [41]
The number of PV modules126
PV modules typeESP 250 6PESP 250 6P
PV3PV2b
LocationOn the roof of the buildingOn the southwest facade
Arrangement0–80°at 90°
Azimuth45–315°250°
DC Power3.0 kWp1.5 kWp
Inverter SMA typ SUNNY BOY 3000 HF,
Max. power 3.15 kWp DC
Goodwe NS-1500,
Max. power 1.8 kWp DC
The number of PV modules126
PV modules typeESP 250 6PESP 250 6P
W1W2
Location45A, Wiejska Street,
15-351 Bialystok, Poland
On the west side
45A, Wiejska Street,
15-351 Bialystok, Poland
On the west side
Power5.0 kW5.0 kW
Inverter TWERD typ PZGS/5.5kW
400 V AC, 5.50 kW
TWERD typ PZGS/5.5kW
400 V AC, 5.50 kW
TurbineMarkWind 5000P, PHU eChmaPOWERwind 5000, H-Darrieus
Rotor diameter 4.8 mdiameter 3.5 m, blade height 3 m
Table 2. Data sheet parameters of the used PV module [42].
SymbolESP 250 6P
ProducerEurope Solar Production
TypePolycrystalline
Module Efficiency 15.3%
Peak Power STC 250 Wp
Peak Power NOCT182 Wp
Temperature Coefficients of Pmax−0.46 ± 0.02 %/K
Temperature Coefficients of VOC−0.34 ± 0.01 %/K
Temperature Coefficients of ISC+0.07 ± 0.02 %/K
Module Dimension1640 × 990 × 40 mm
12 years guarantee module performanceMin 90%
25 years guarantee module performanceMin 80%
Disclaimer/Publisher’s Note: The statements, opinions and data contained in all publications are solely those of the individual author(s) and contributor(s) and not of MDPI and/or the editor(s). MDPI and/or the editor(s) disclaim responsibility for any injury to people or property resulting from any ideas, methods, instructions or products referred to in the content.

