
Numerical Study on the Evolution of Reservoir Pressure and CBM Concentration Considering Hydraulic Fractures
Abstract
:1. Introduction
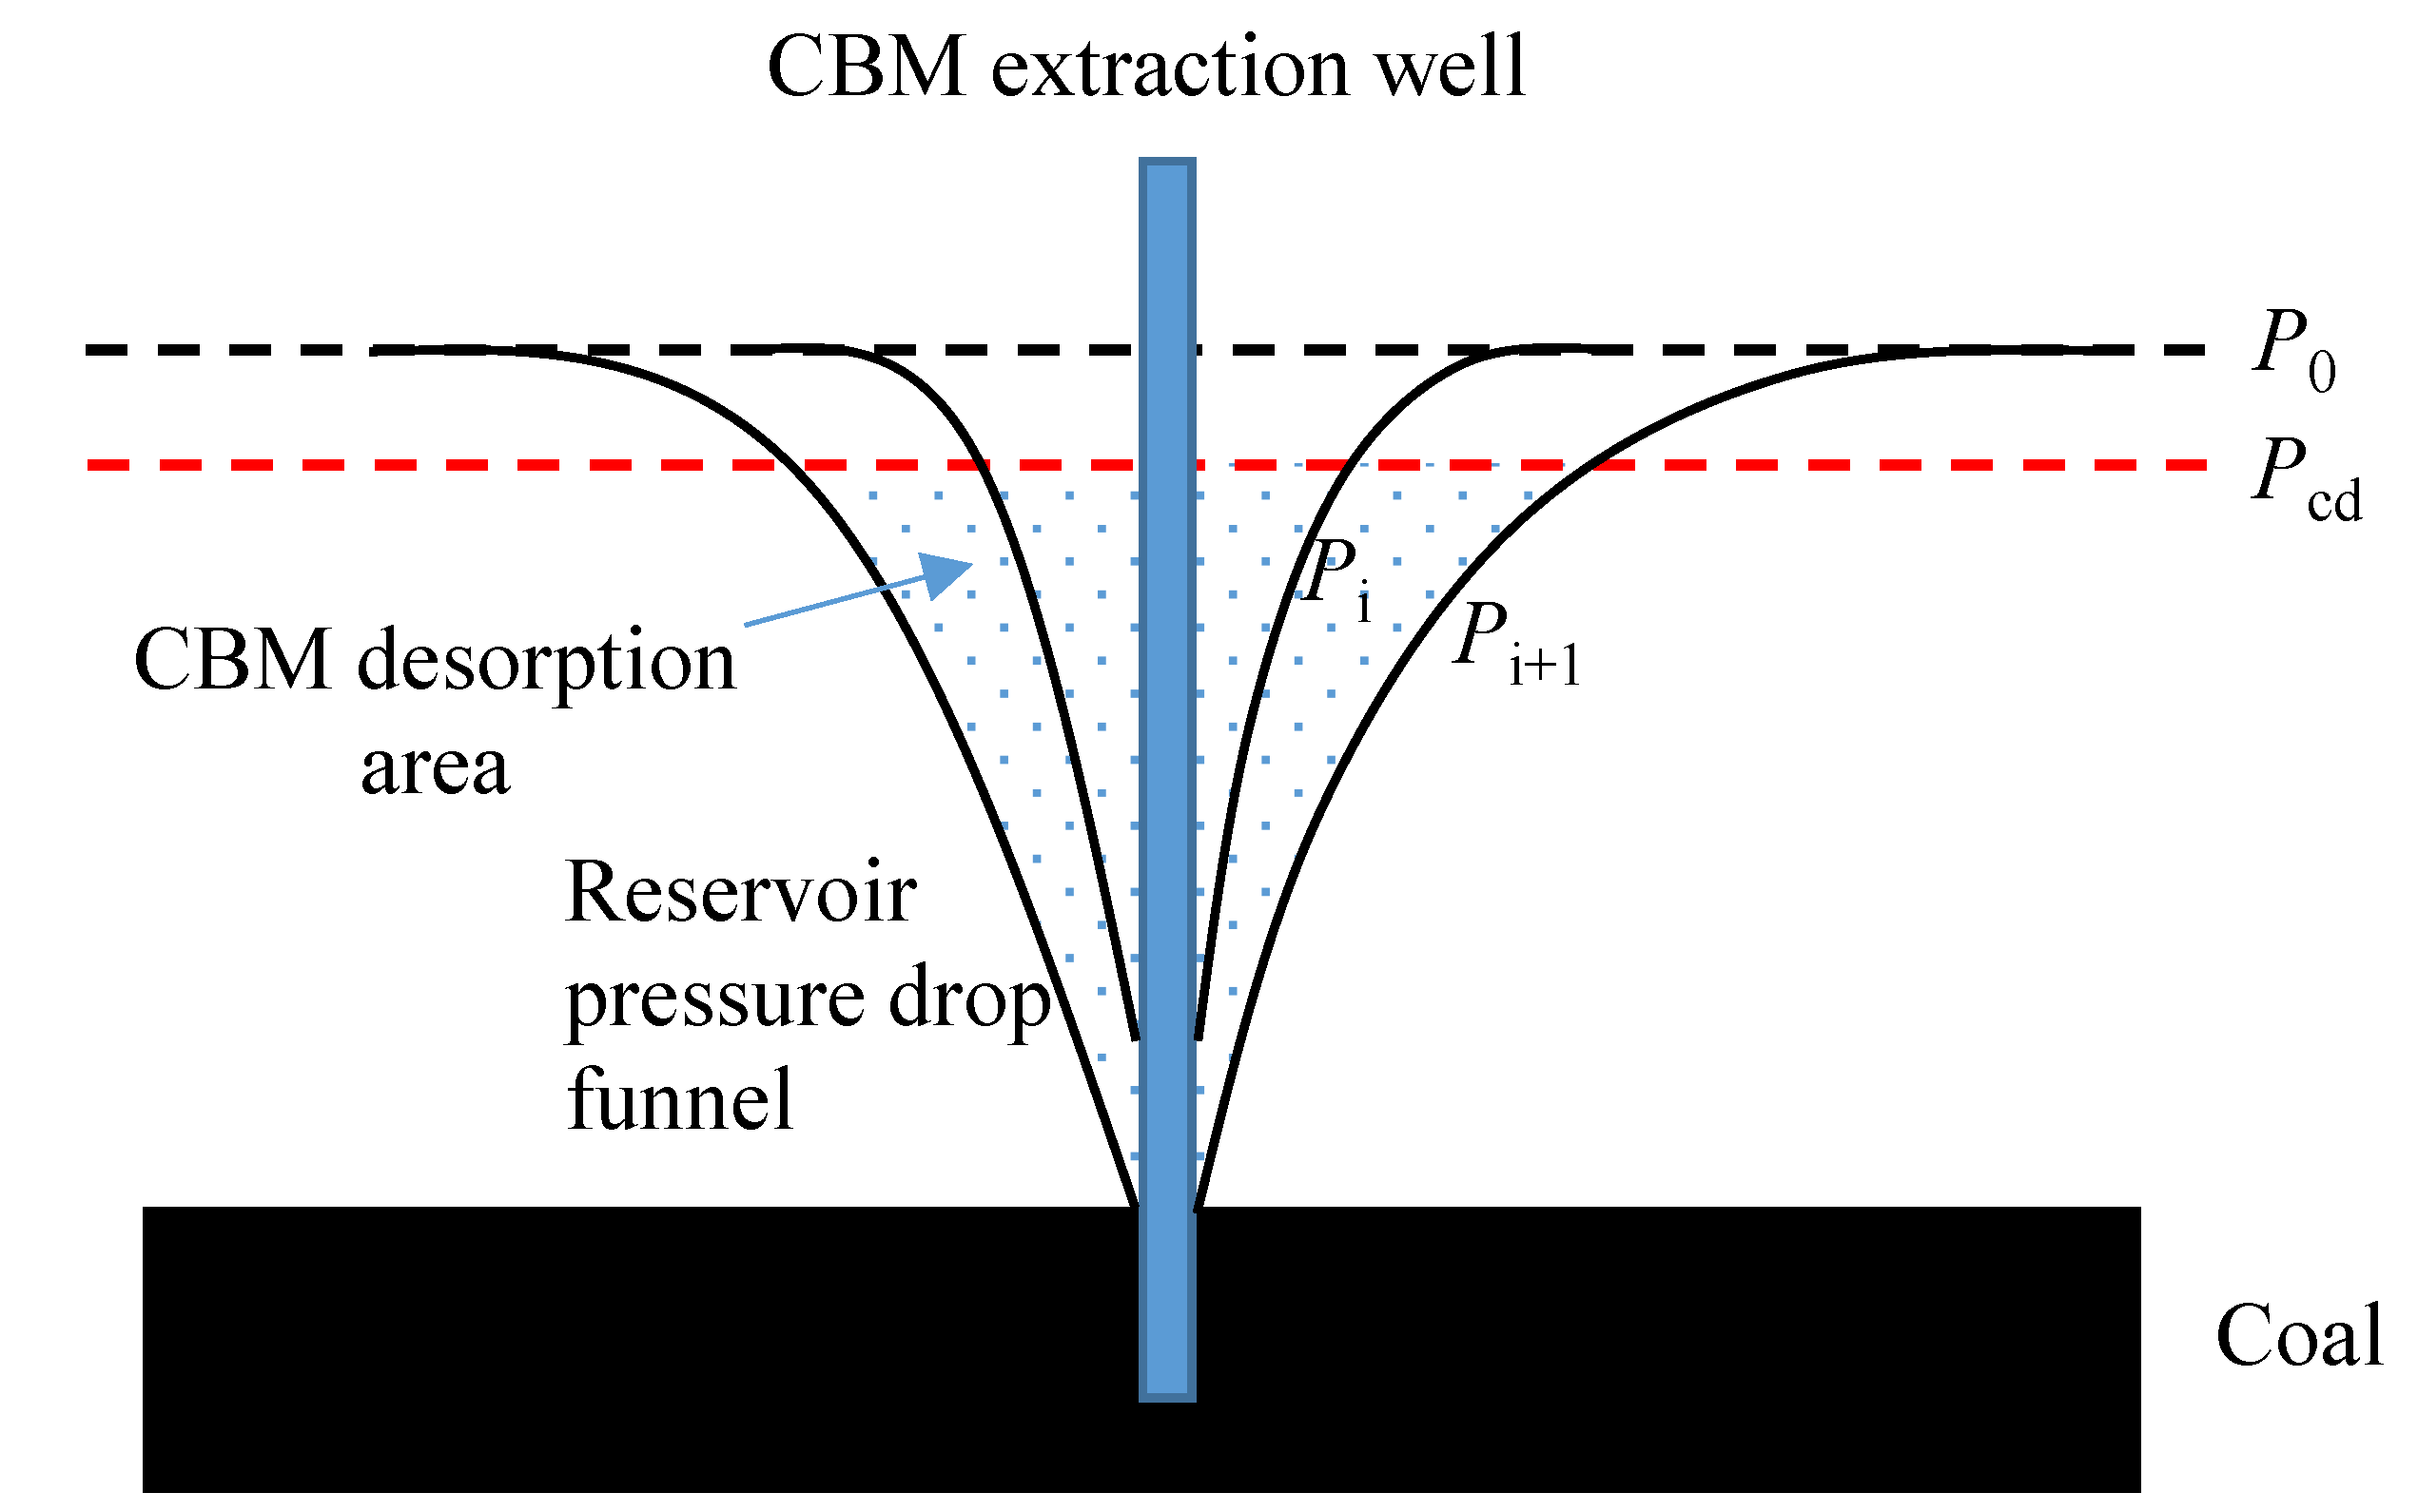
2. Reservoir Pressure Model for CBM Production
3. Numerical Simulation Model
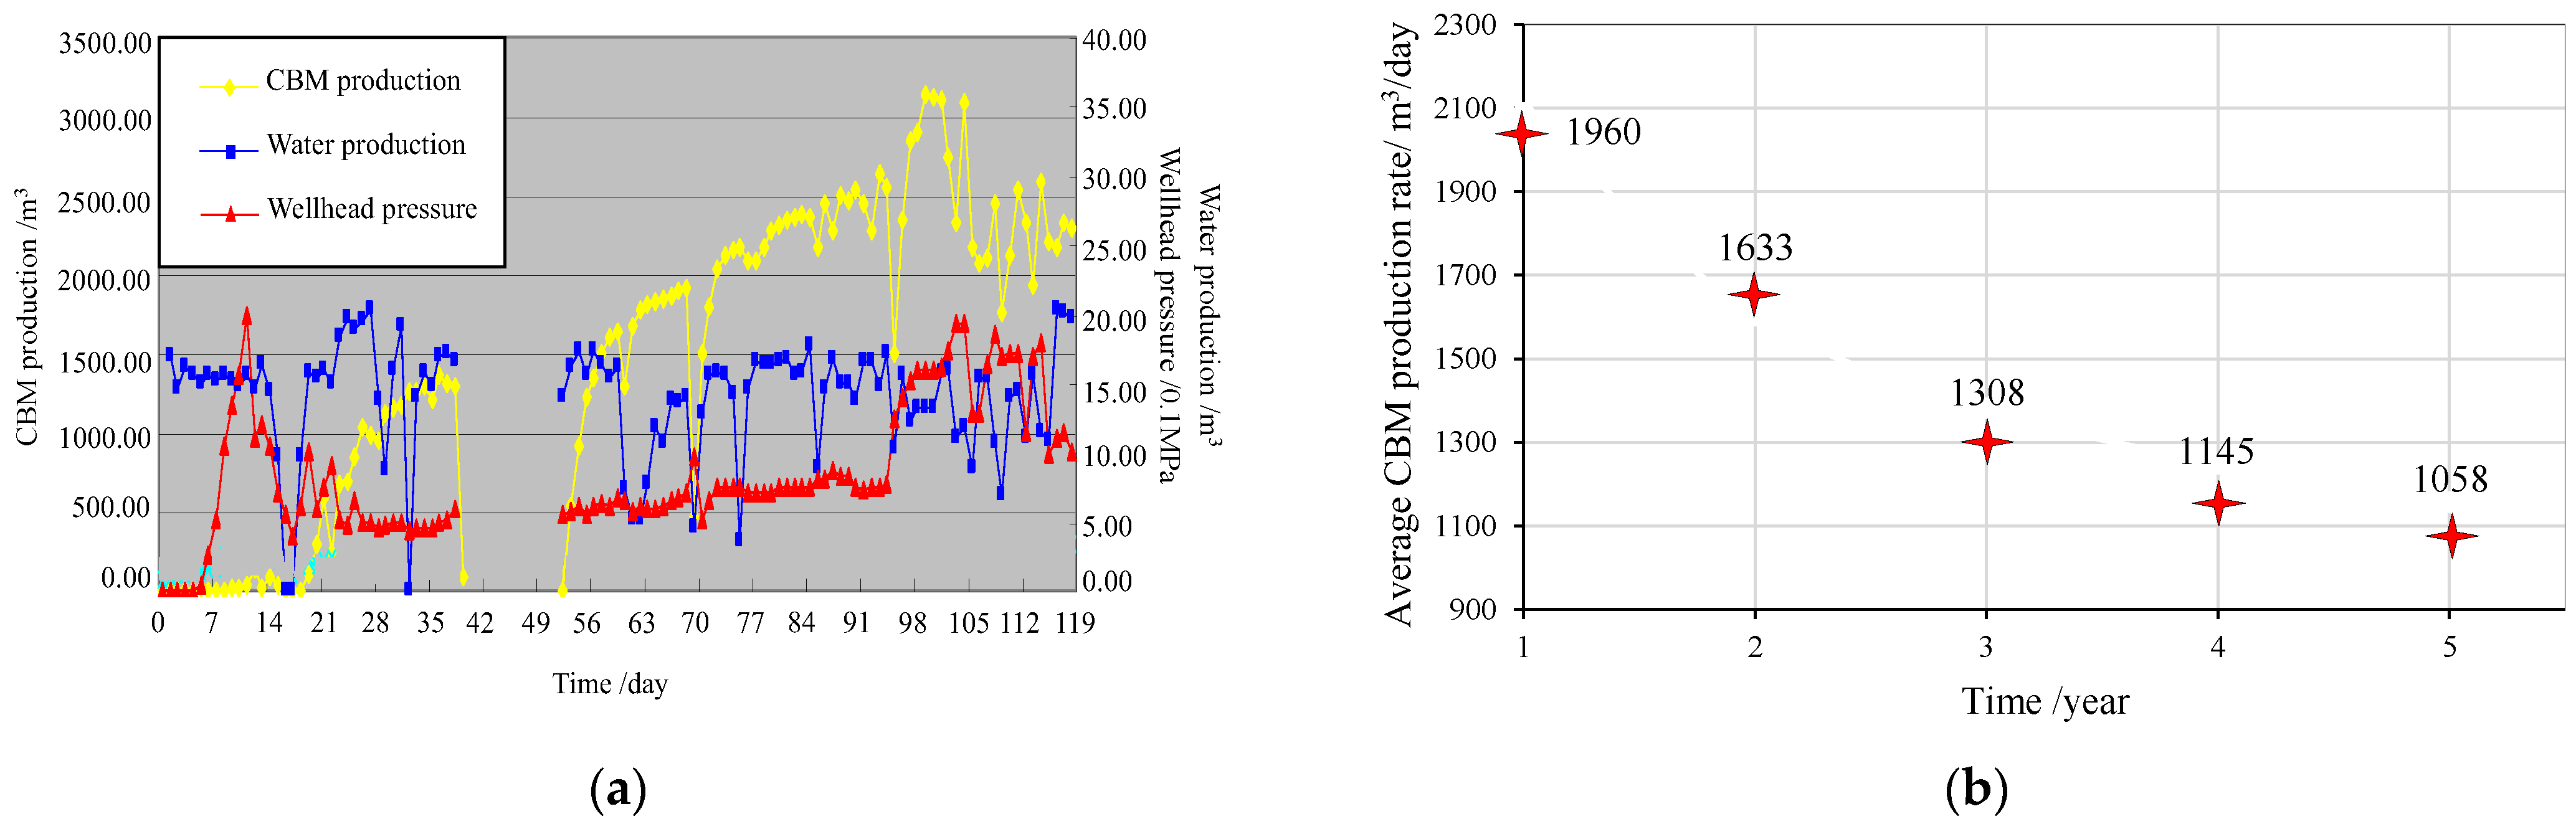
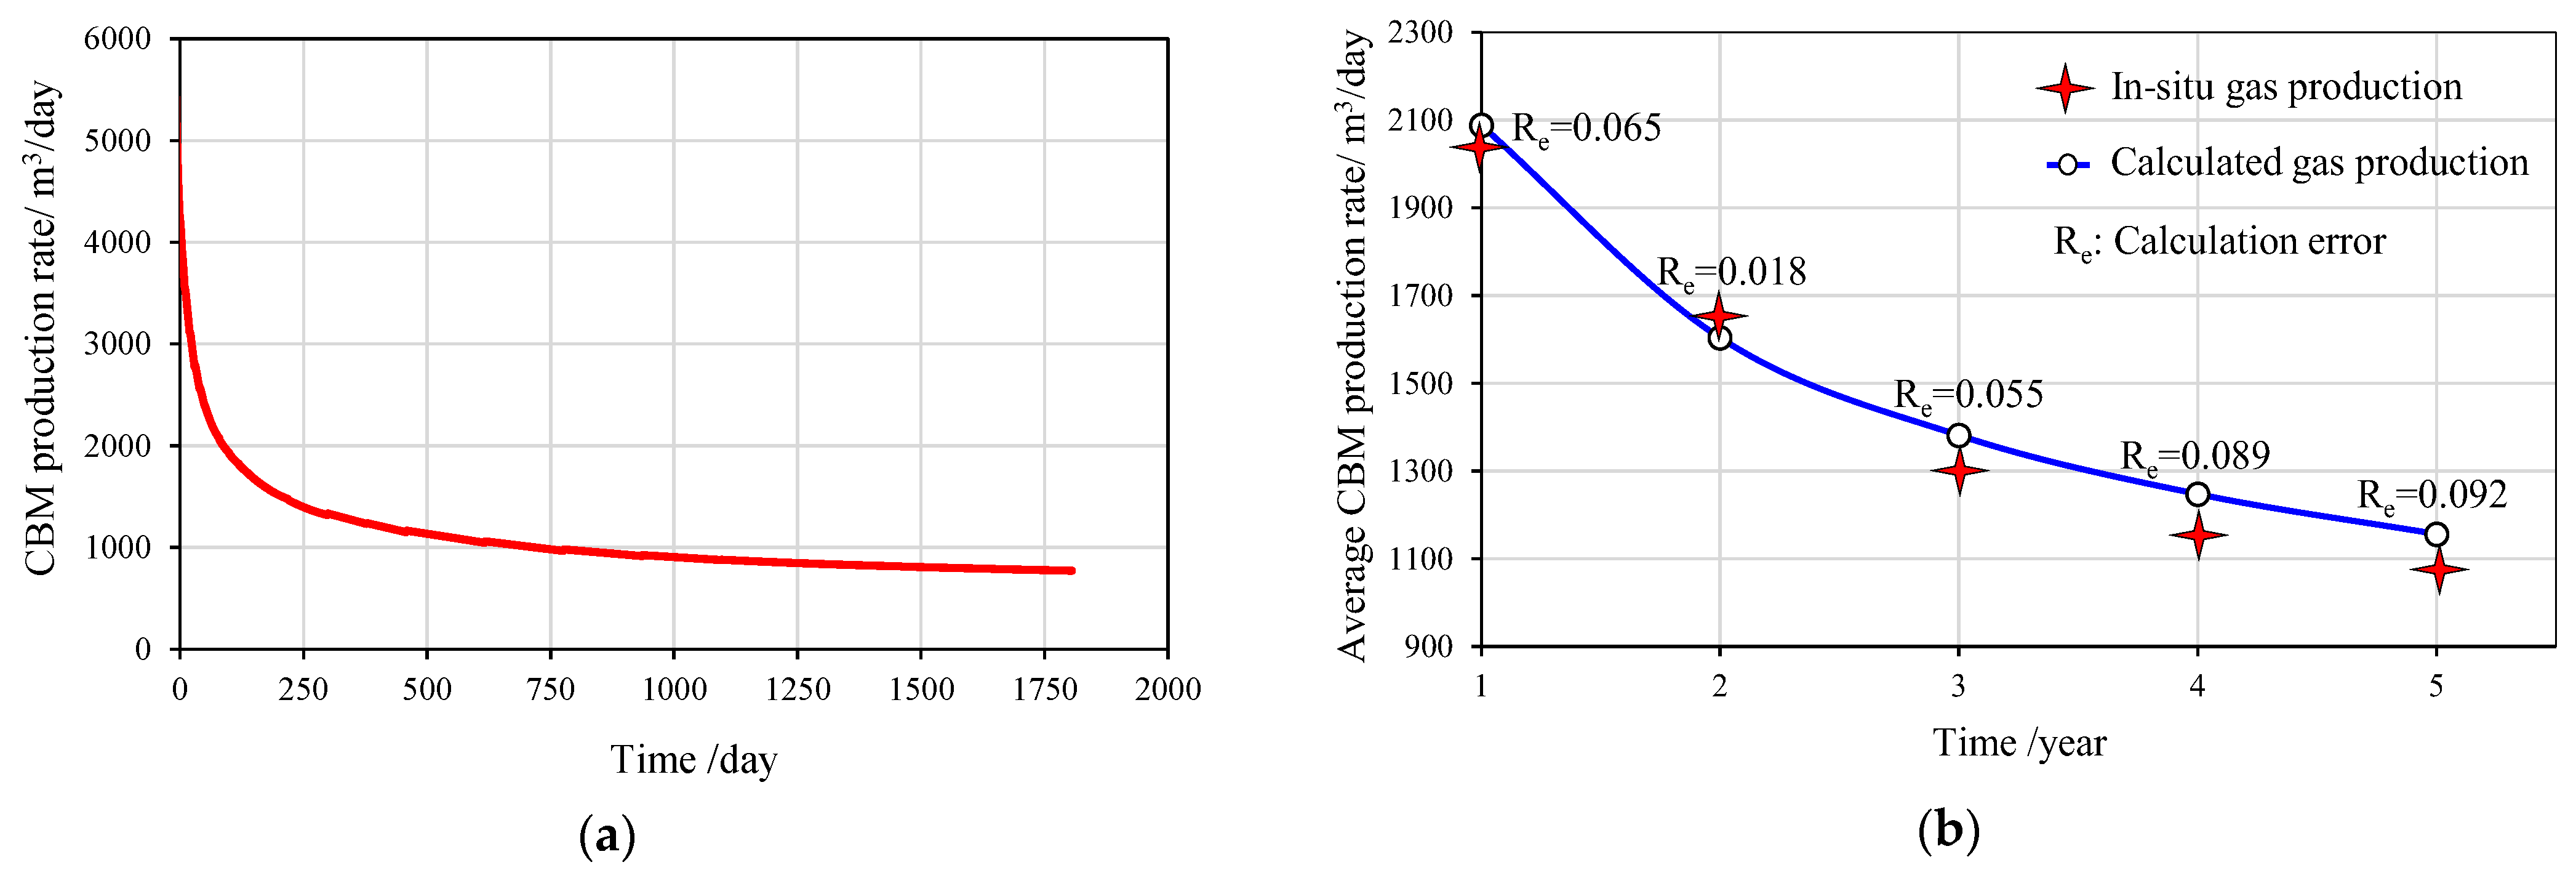
3.1. Engineering Background
3.2. Numerical Model
4. Reservoir Pressure and CBM Production under the Influence of Hydraulic Fractures
4.1. Constant Hydraulic Fracture Length
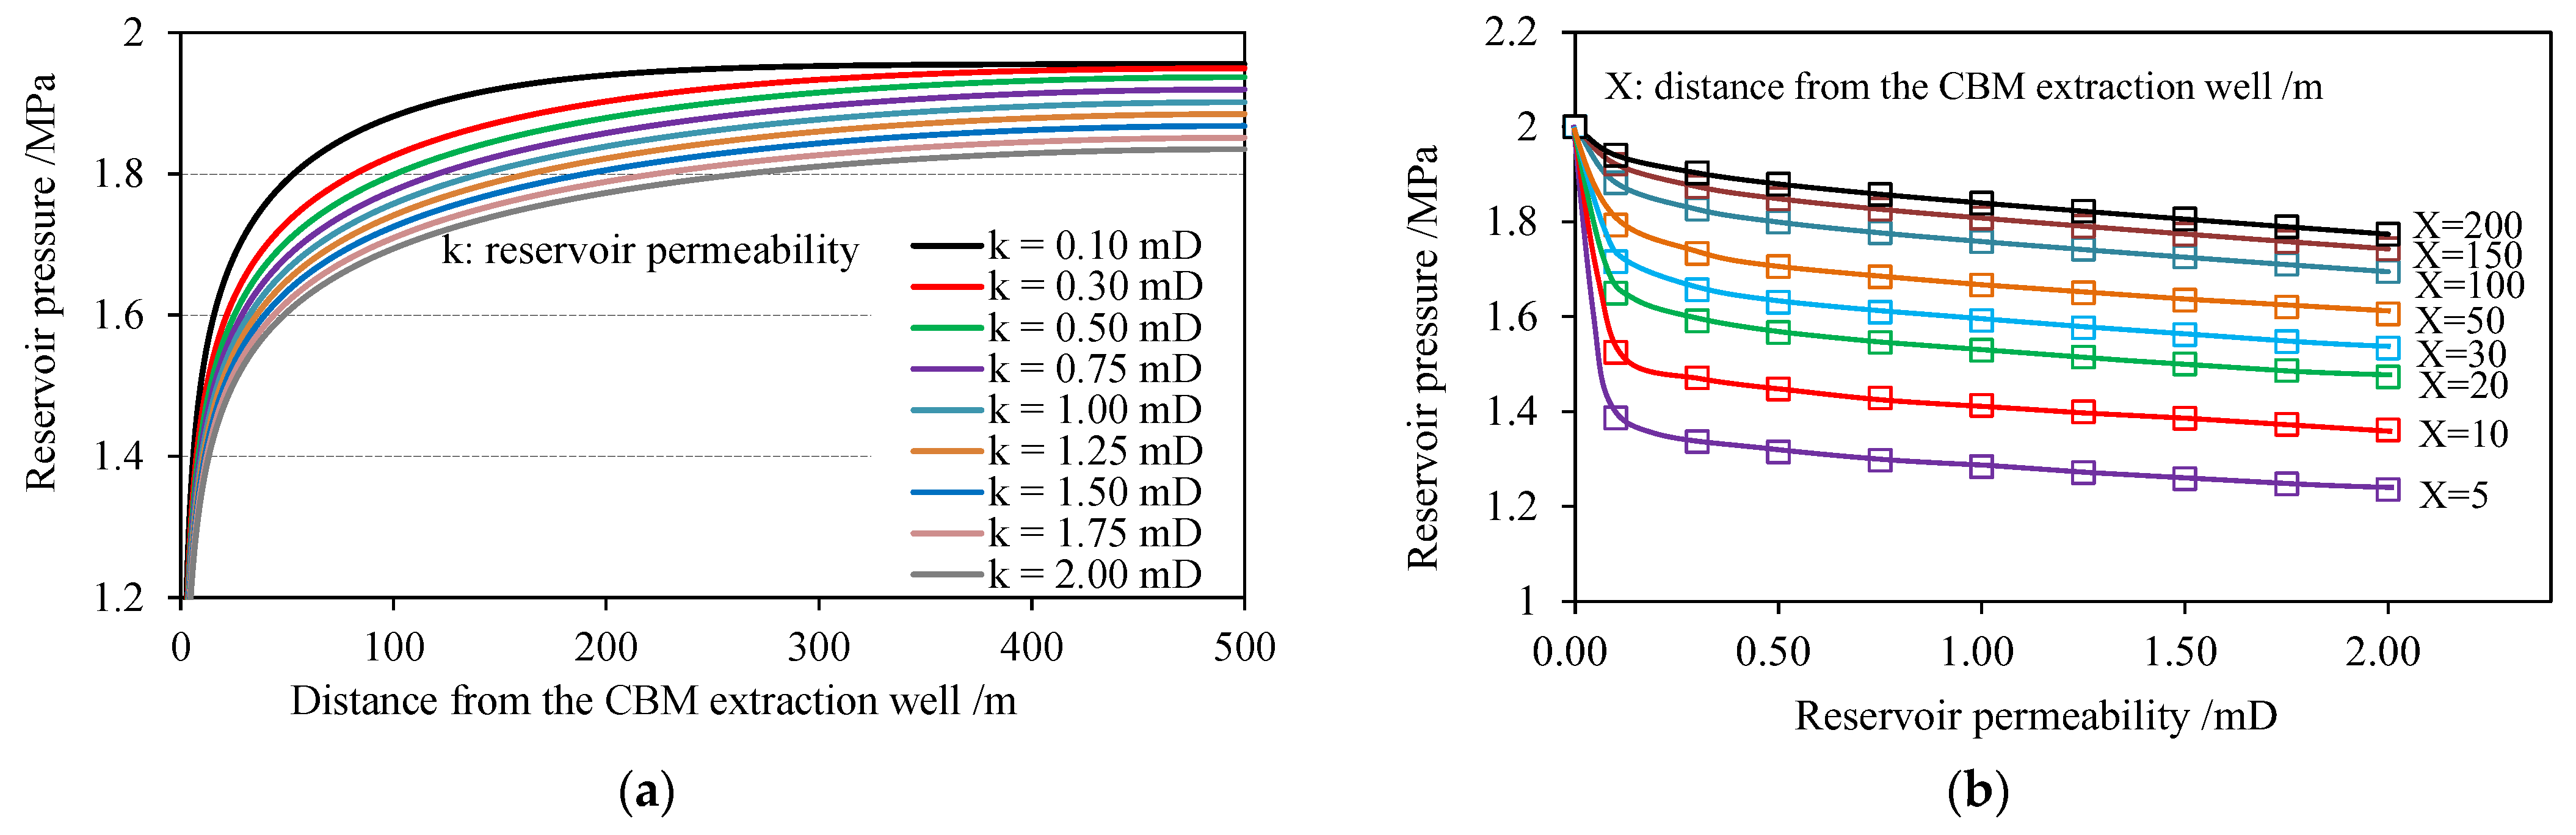
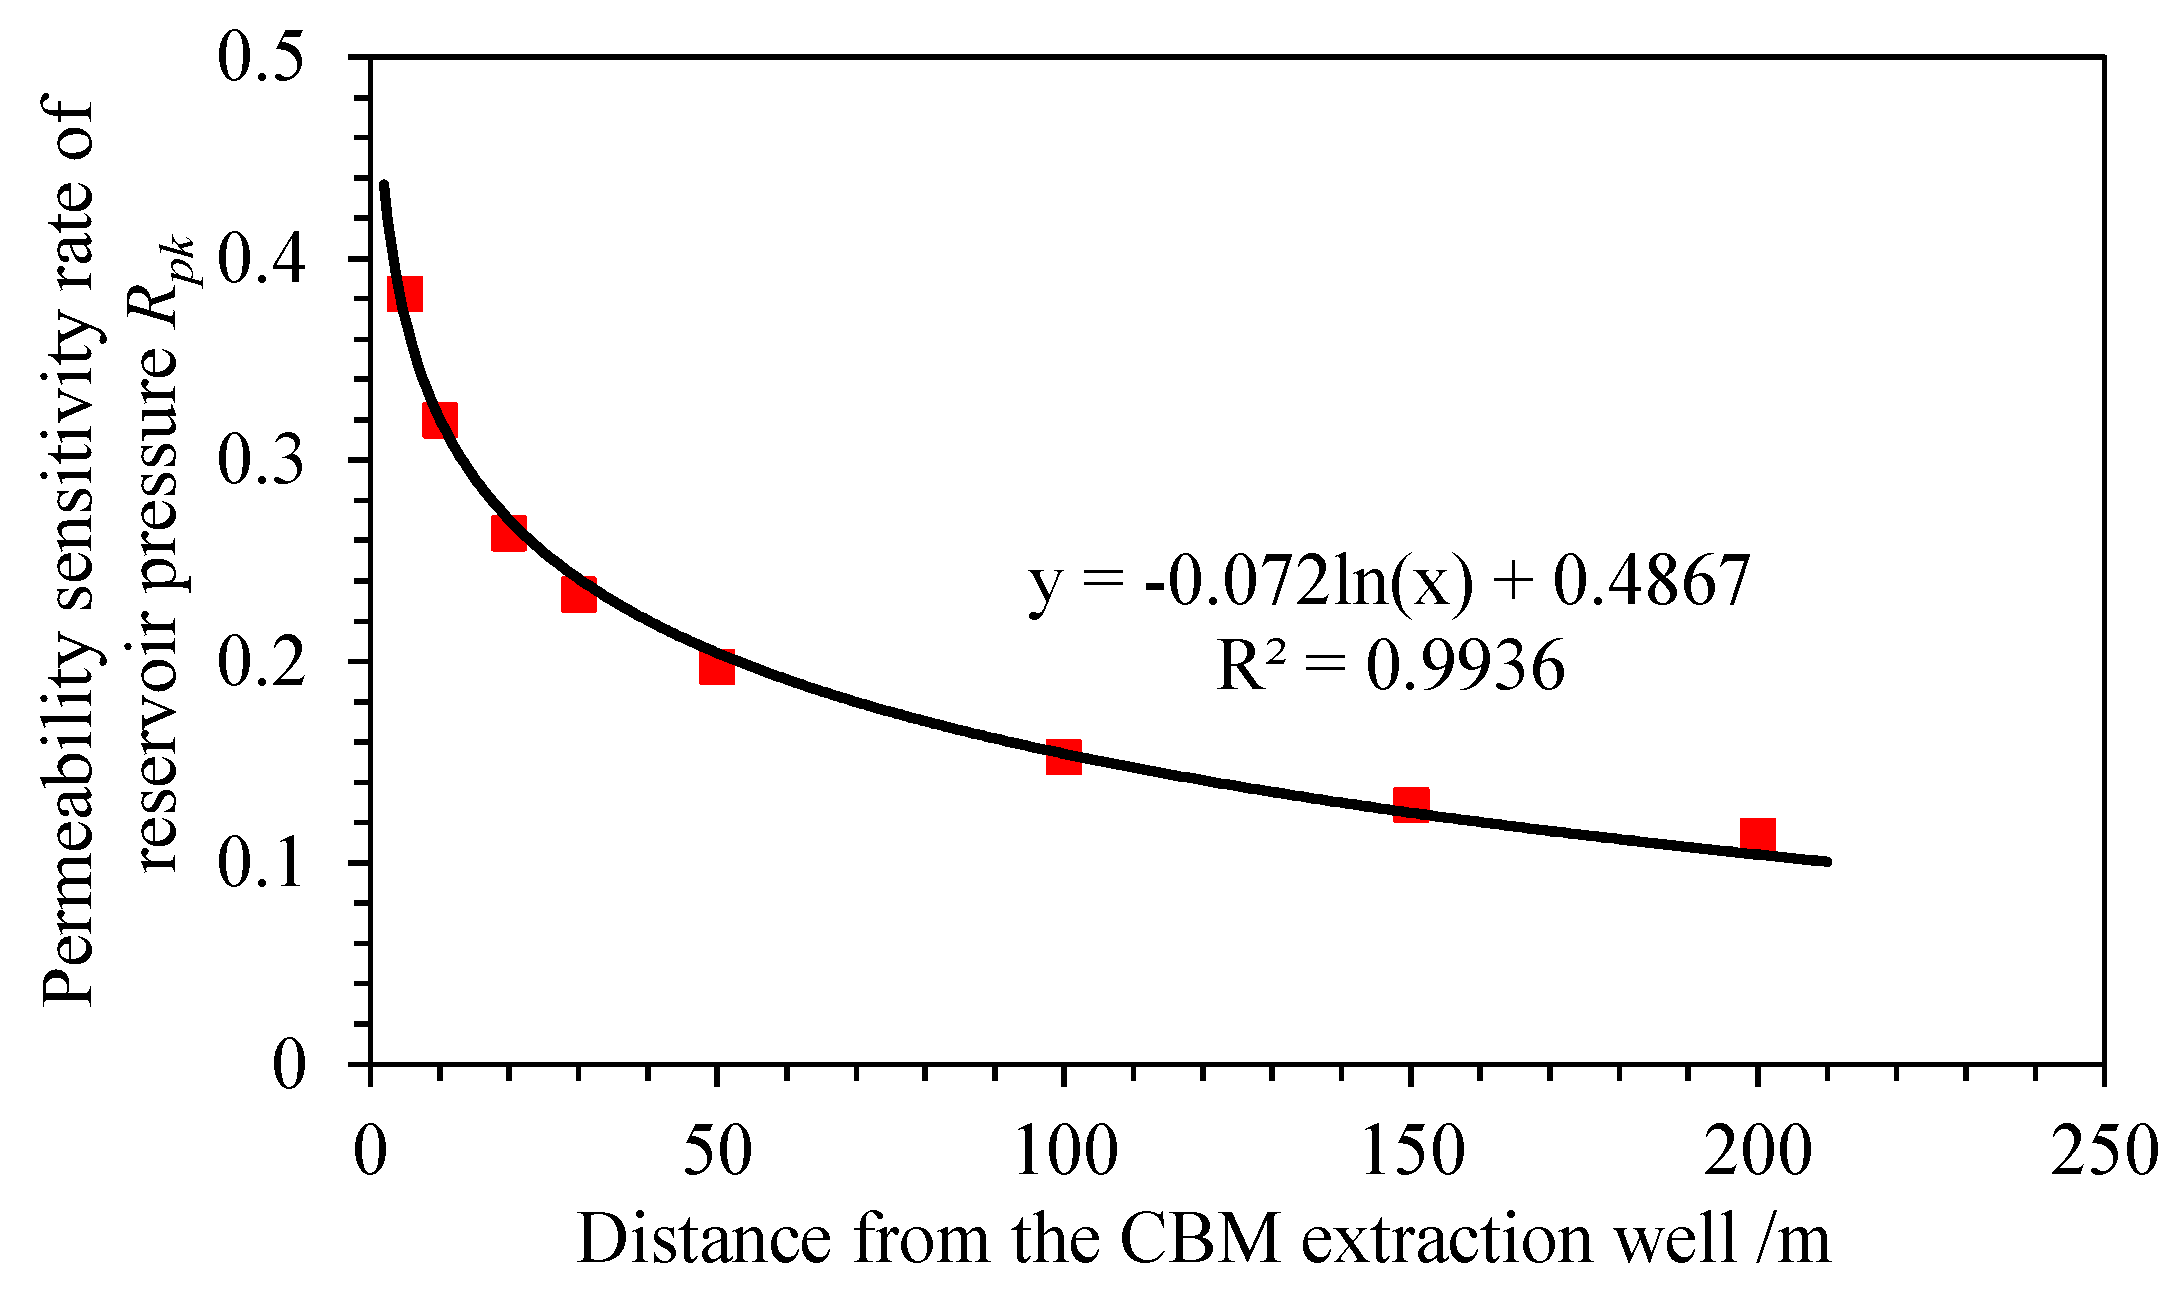
4.2. Permeability Sensitivity Analysis of the Reservoir Pressure
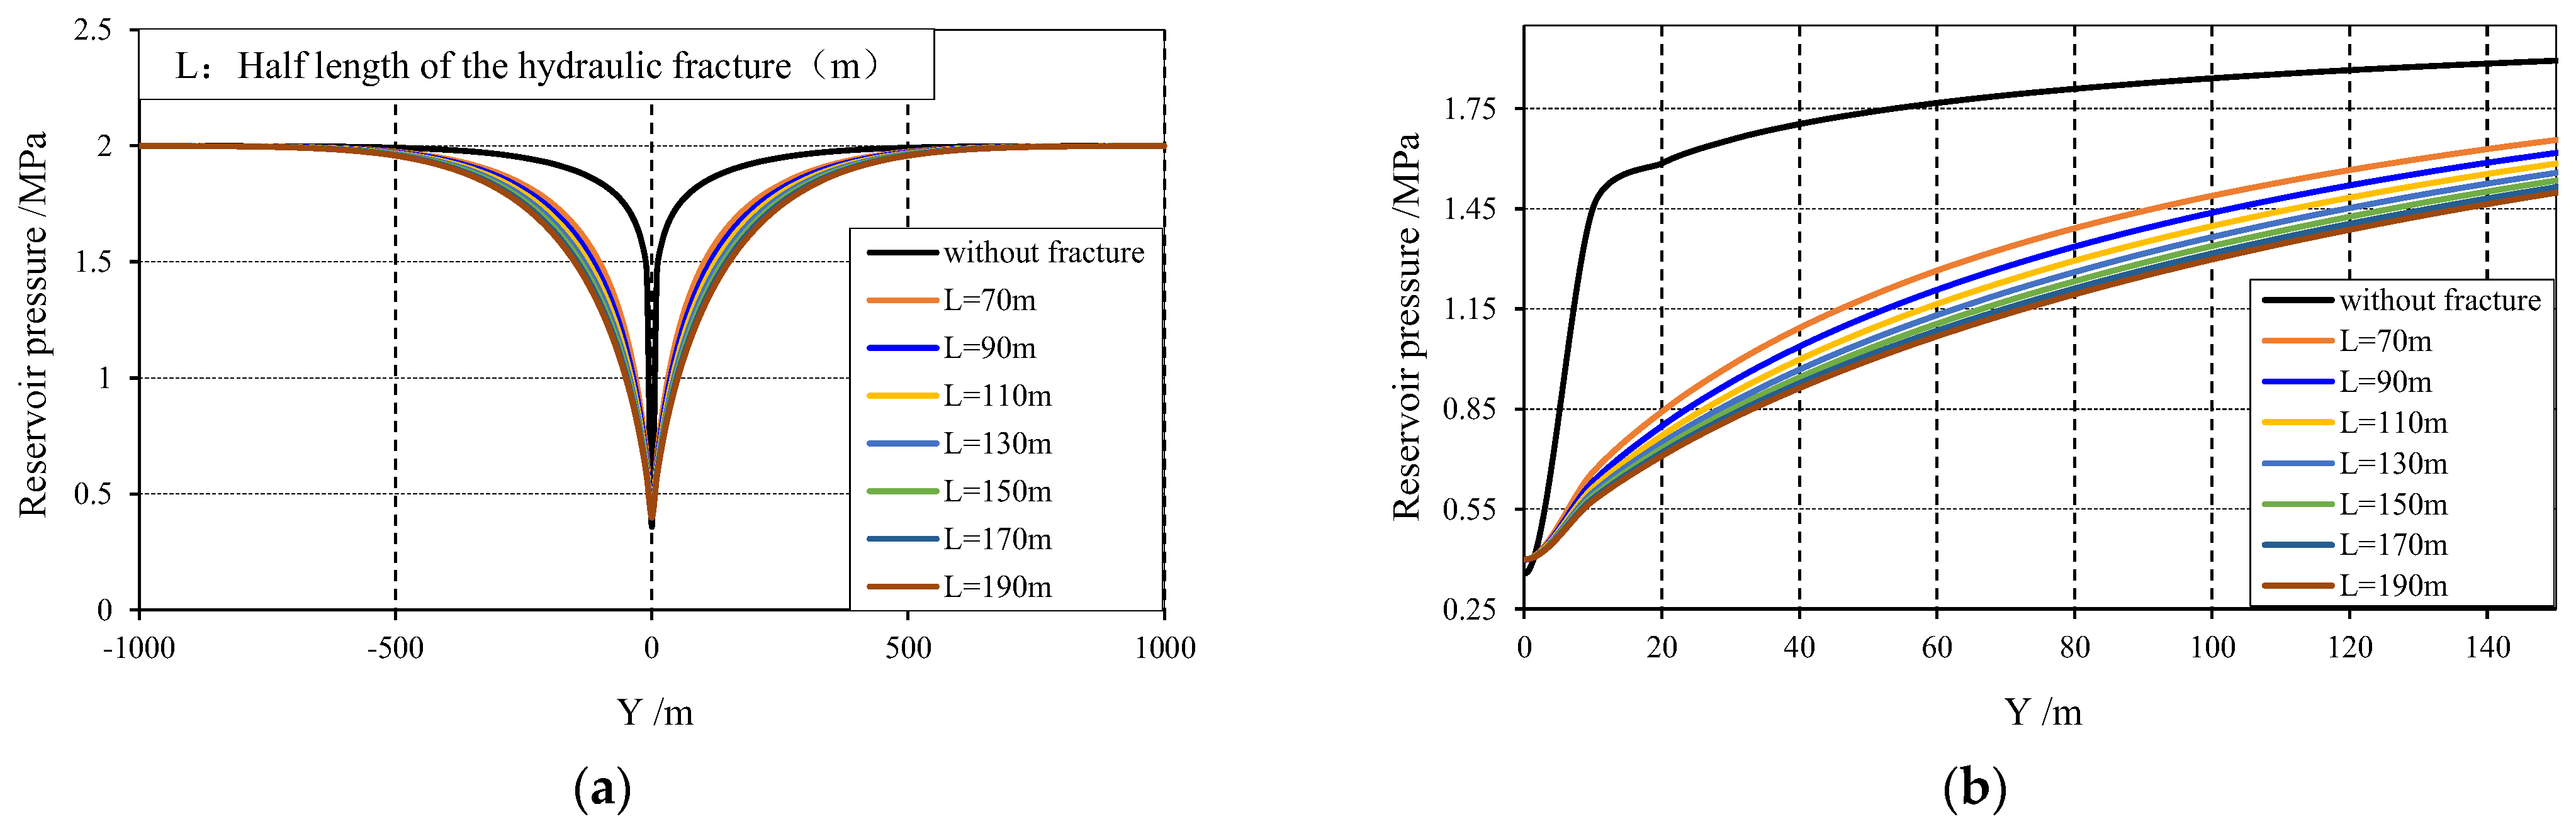
4.3. Influence of a Hydraulic Fracture
4.4. Influence of Multiple Hydraulic Fractures
5. Conclusions
- (1)
- Based on the theories of mass conservation and CBM adsorption/desorption, this paper first established a novel reservoir pressure model for CBM production, following which, the CBM concentration and production models are proposed. Then, these models are programmed and solved by means of multi-field coupling analysis software (COMSOL Multiphysics). Taking the Hunchun CBM field in Jilin province, China, as an example, the reservoir pressure, gas concentration, and production characteristics under different hydraulic fracture forms are simulated and investigated.
- (2)
- The permeability sensitivity coefficient of reservoir pressure, Rpk, is defined. Rpk decreases logarithmically as the distance from the CBM extraction well increases. Permeability has a significant effect on the reservoir pressure at different times during CBM extraction, especially near the well. The farther away from the well, the less the reservoir pressure is affected.
- (3)
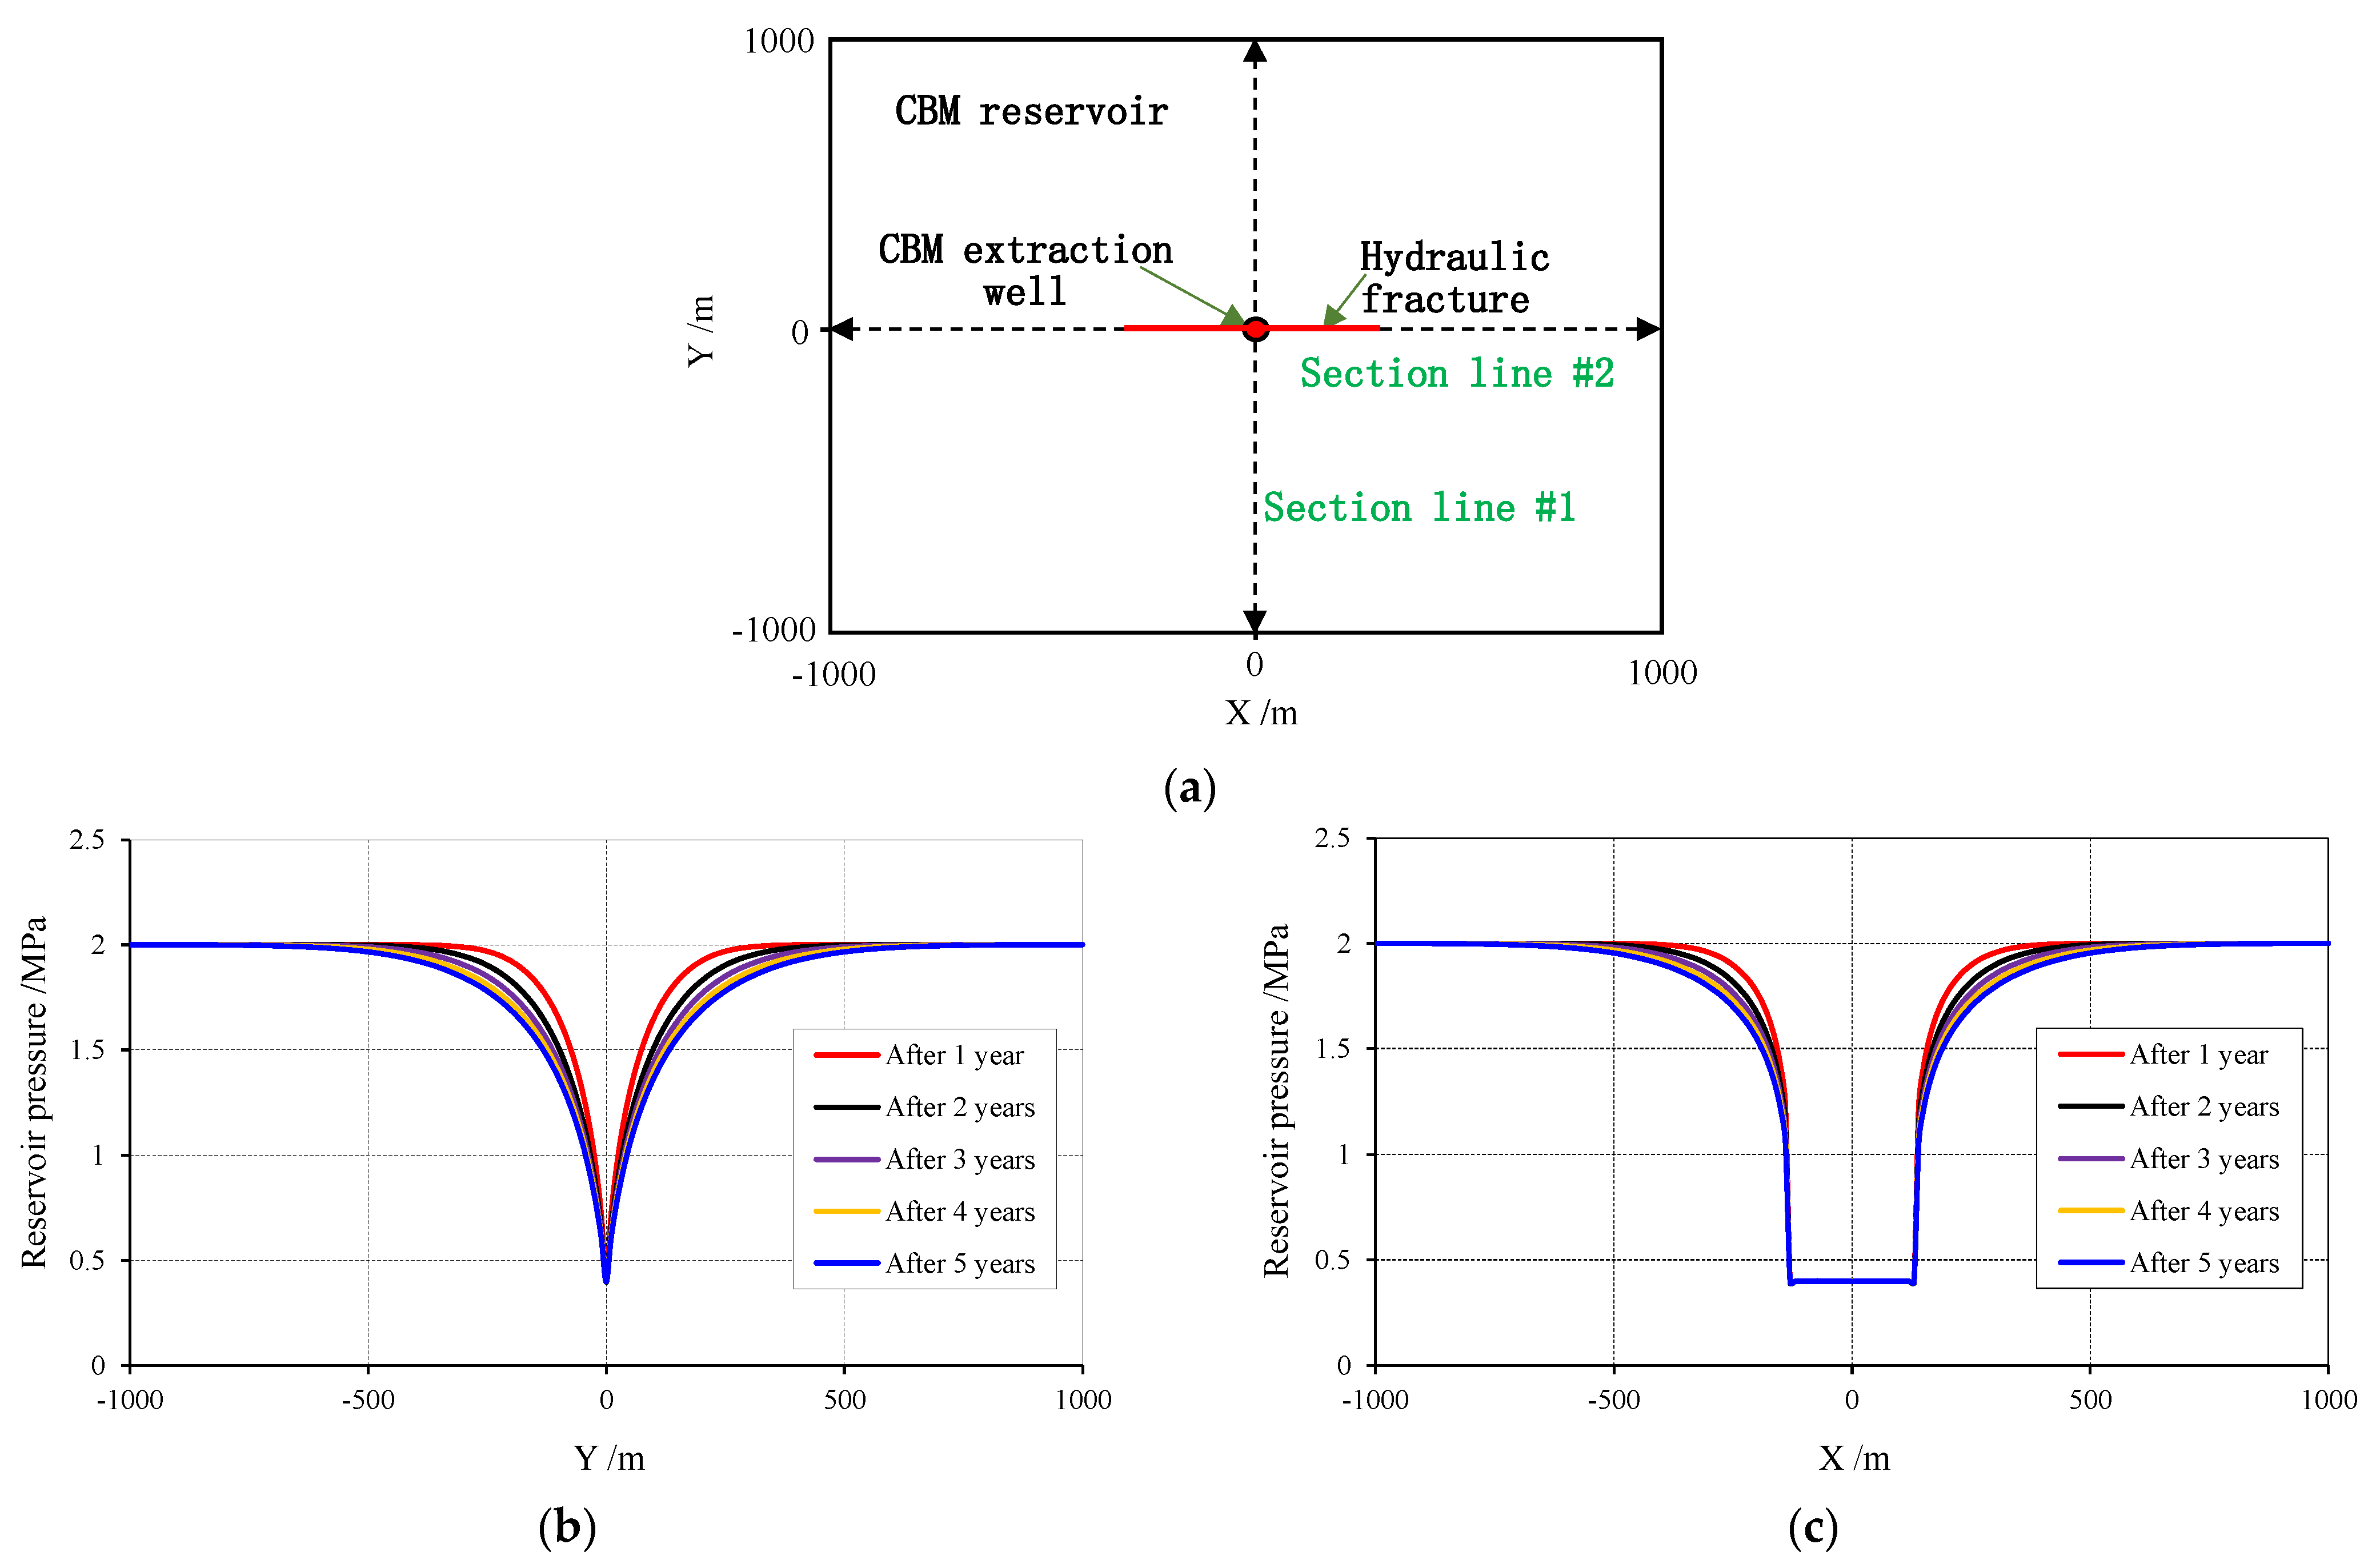
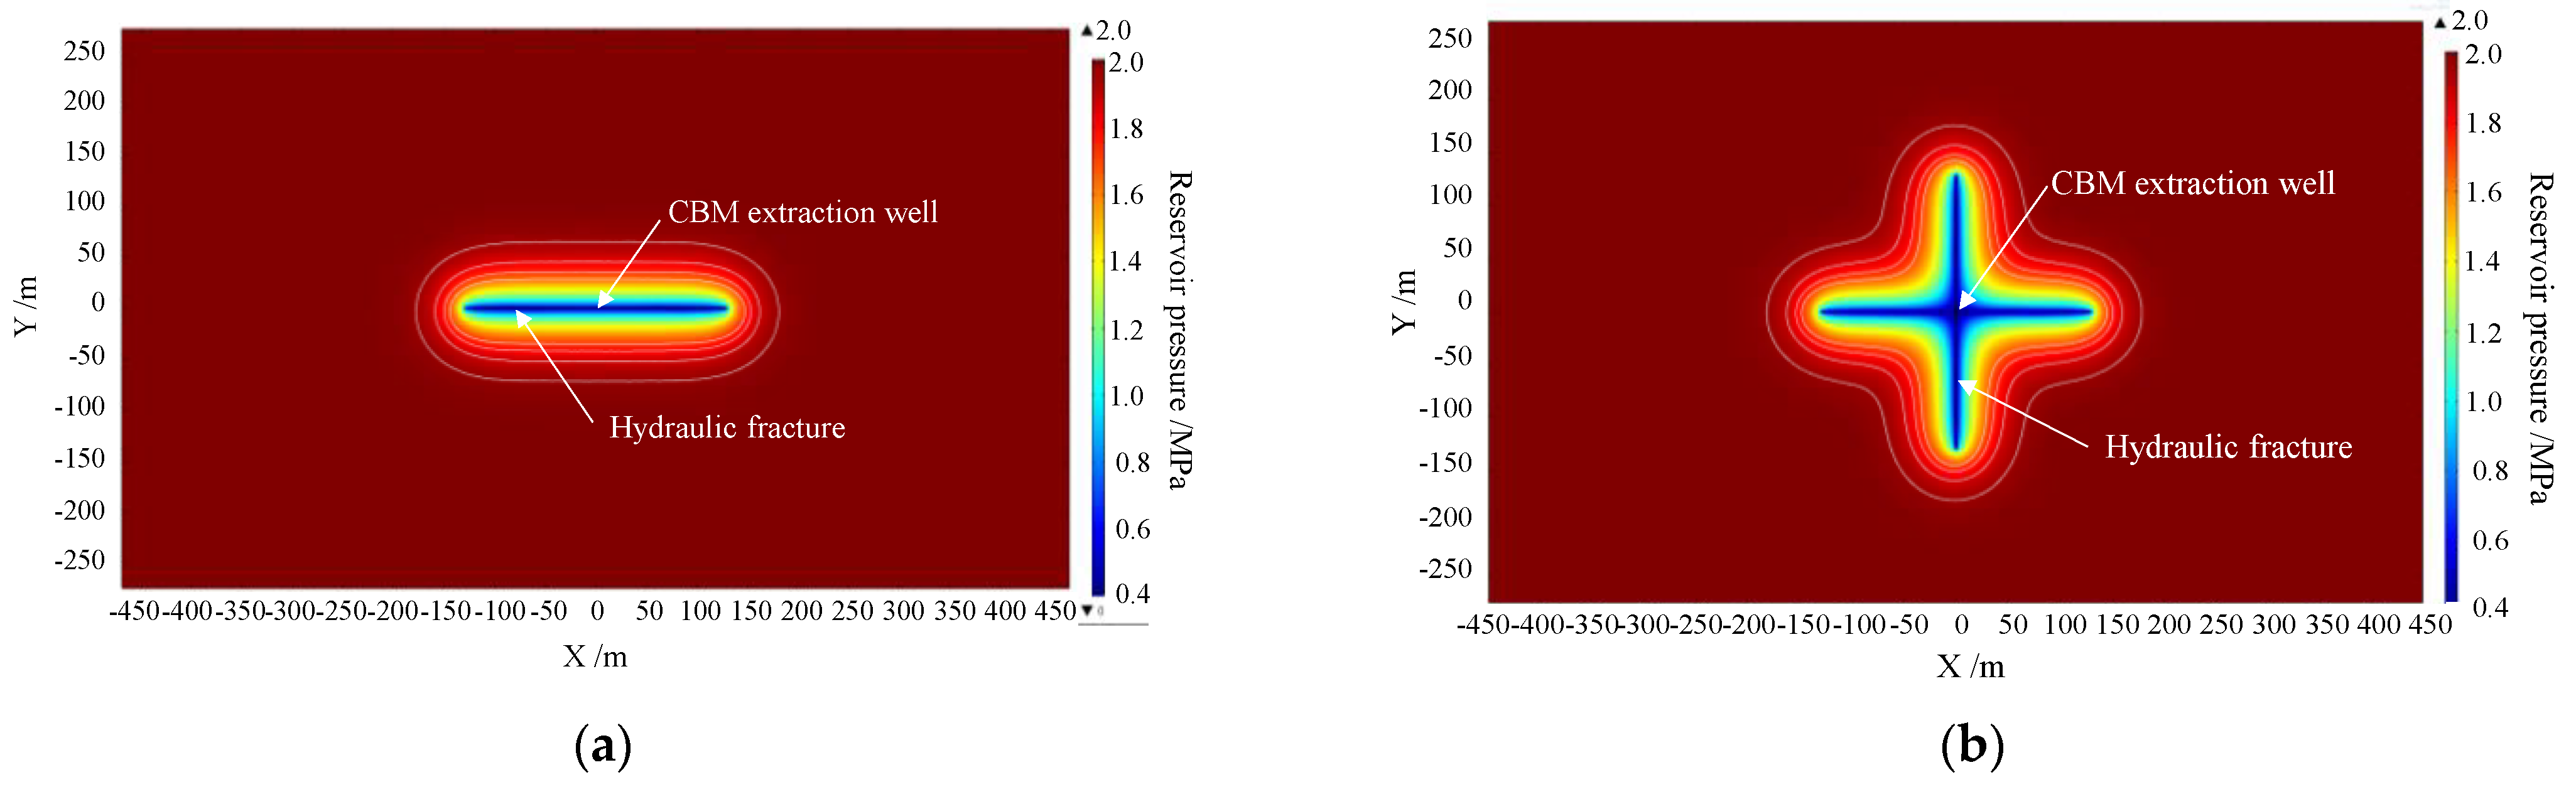
- The reservoir pressure is distributed symmetrically in an elliptical shape, with the hydraulic fracture direction as the long axis. The phenomenon of “reservoir pressure singularity” exists near the fracture tip, which means that the reservoir pressure decreases very rapidly in a small region near the fracture tip. The existence of a hydraulic fracture greatly reduces the reservoir pressure in the process of CBM exploitation, significantly increases the influence range of single-well extraction, and greatly rises the permeability of coal seams.
- (4)
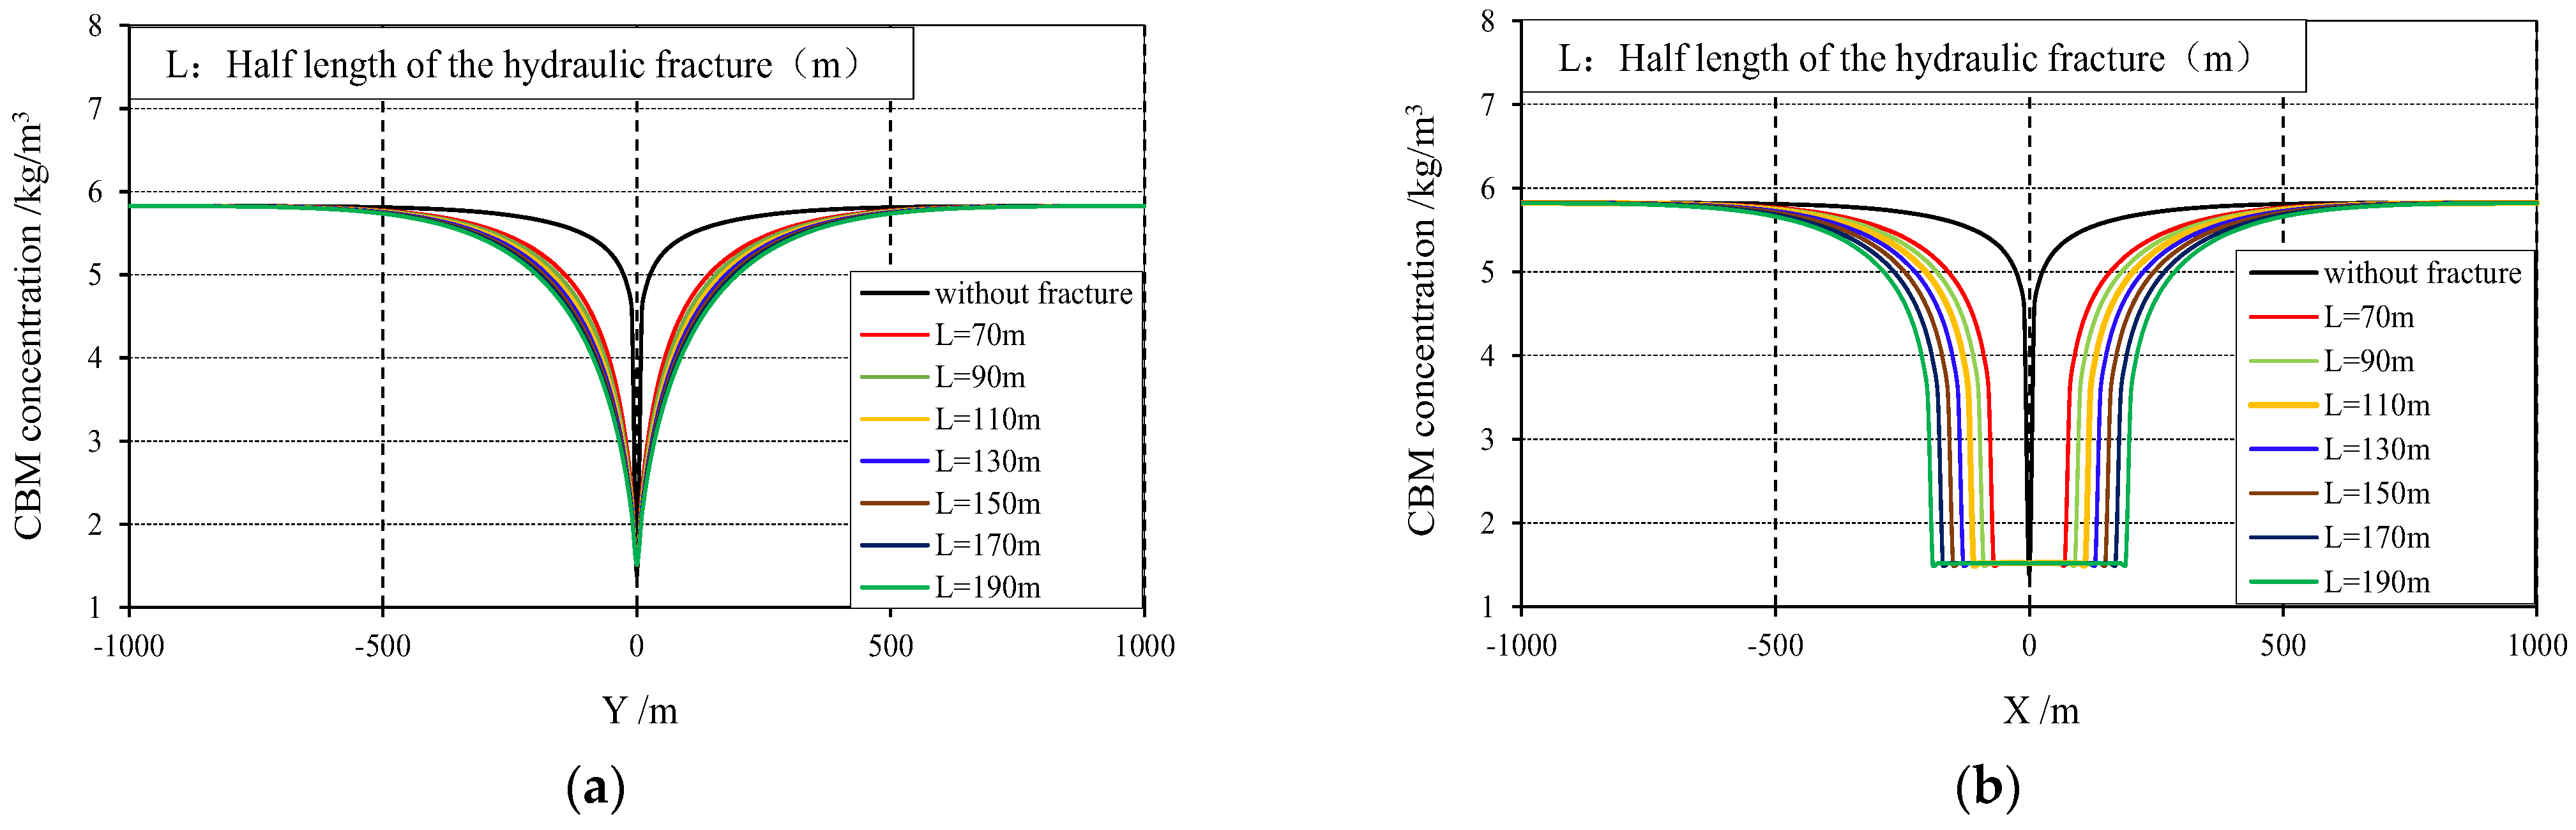
- The reservoir pressure, CBM concentration, and production for different hydraulic fracture morphologies are calculated. With the increase in the hydraulic fracture length, the reservoir pressure drops, and gas production rate after the CBM being extracted for the same time increase. The pressure drop difference along the fracture length is more significant than that perpendicular to the fracture.
- (5)
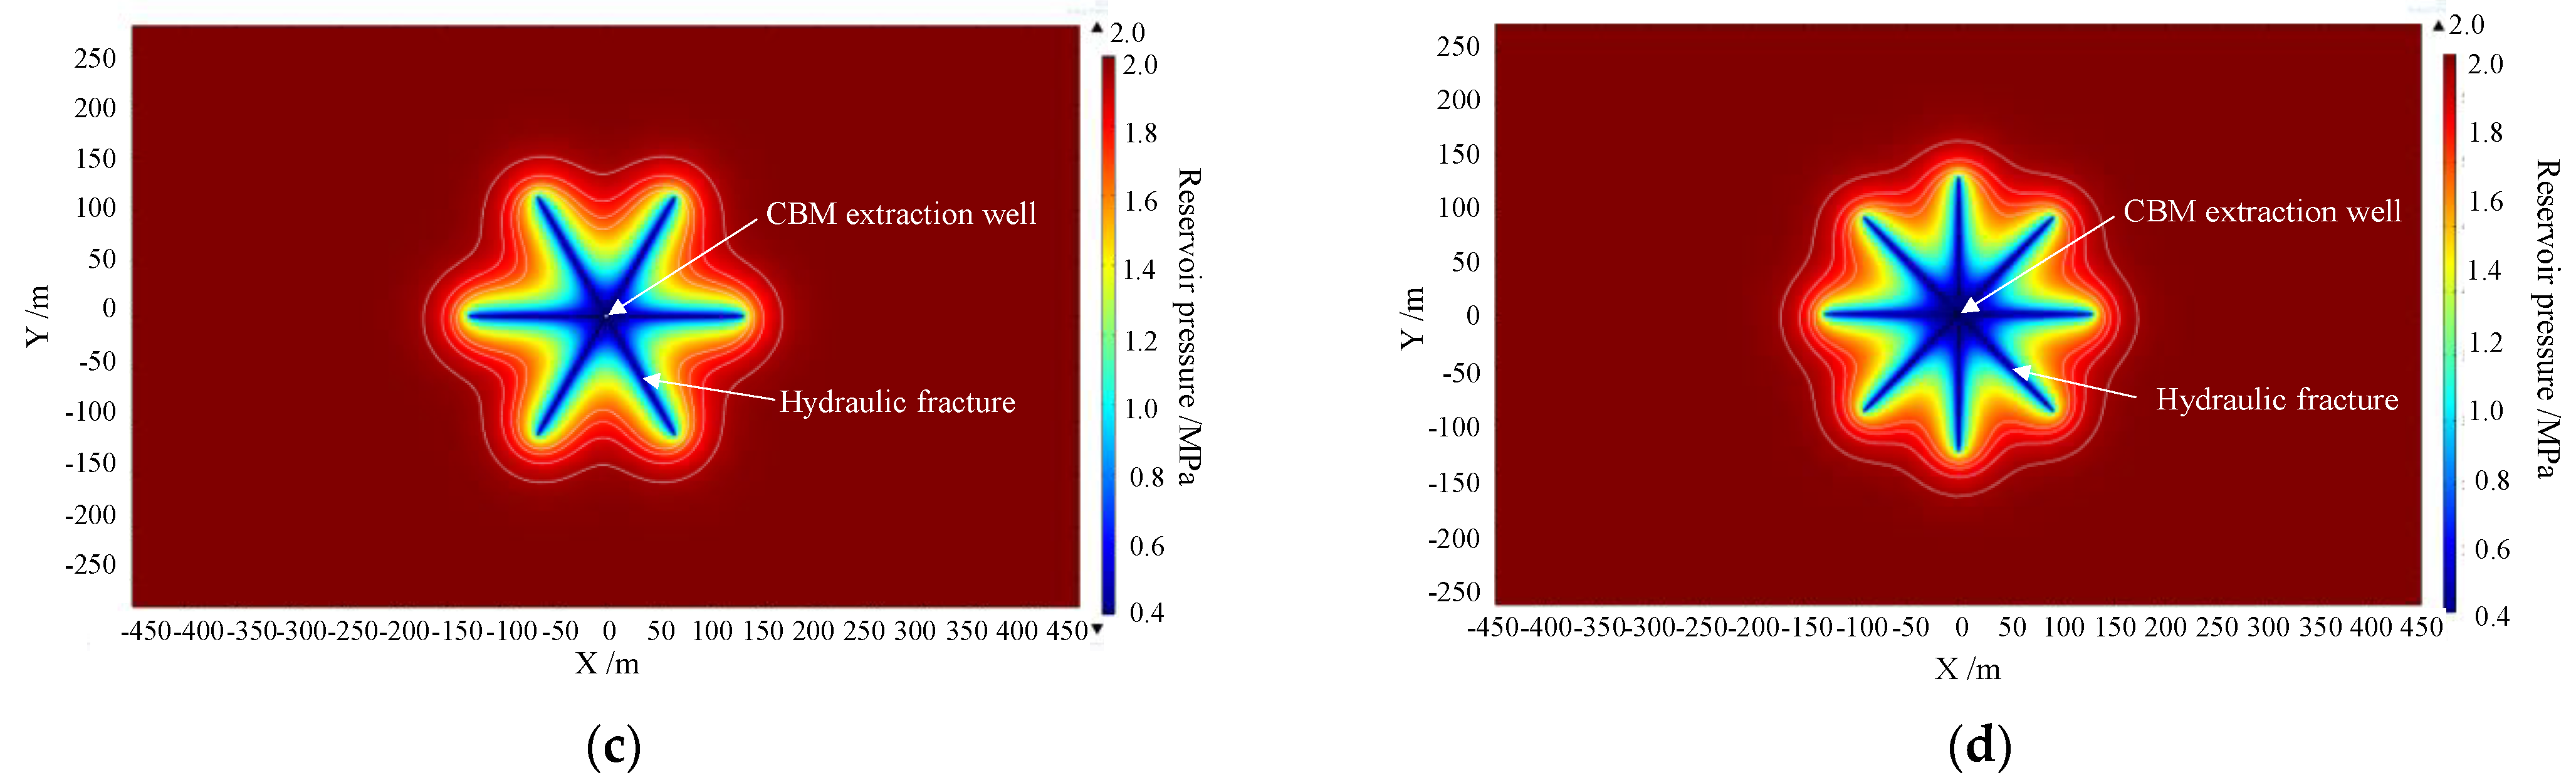
- The evolution of reservoir pressure and CBM recovery rate are investigated in the presence of multiple hydraulic fractures. As the number of hydraulic fractures increases, CBM recovery rate increases in a quadratic function. The superposition effect of reservoir pressure among multiple hydraulic fractures is significant. When multiple hydraulic fractures exist, CBM near fractures’ intersection can be fully desorbed, and the influence range of the pressure drop funnel formed in the CBM extraction process is large.
Author Contributions
Funding
Data Availability Statement
Conflicts of Interest
References
- Shi, J.; Chang, Y.; Wu, S.; Xiong, X.; Liu, C.; Feng, K. Development of material balance equations for coalbed methane reservoirs considering dewatering process, gas solubility, pore compressibility and matrix shrinkage. Int. J. Coal Geol. 2018, 195, 200–216. [Google Scholar] [CrossRef]
- Zou, J.; Chen, W.; Yuan, J.; Yang, D.; Yang, J. 3-D numerical simulation of hydraulic fracturing in a CBM reservoir. J. Nat. Gas Sci. Eng. 2017, 37, 386–396. [Google Scholar]
- Zhi, S.; Elsworth, D.; Wang, J.; Gan, Q.; Liu, S. Hydraulic fracturing for improved nutrient delivery in microbially-enhanced coalbed-methane (MECBM) production. J. Nat. Gas Sci. Eng. 2018, 60, 294–311. [Google Scholar]
- Li, H.; Hou, C.L.; Huang, S. China’s coalbed methane development: A review of the challenges and opportunities in subsurface and surface engineering. J. Pet. Sci. Eng. 2018, 166, 621–635. [Google Scholar] [CrossRef]
- Zhang, Z.; Qin, Y.; Wang, G.X.; Fu, X. Numerical description of coalbed methane desorption stages based on isothermal adsorption experiment. Sci. China Earth Sci. 2013, 56, 1029–1036. [Google Scholar] [CrossRef]
- Li, R.; Wang, S.W.; Lyu, S.F. Dynamic behaviours of reservoir pressure during coalbed methane production in the southern Qinshui Basin, North China. Eng. Geol. 2018, 238, 76–85. [Google Scholar] [CrossRef]
- Radwan, A.E.; Wood, D.A.; Mahmoud, M.; Tariq, Z. Gas Adsorption and Reserve Estimation for Conventional and Unconventional Gas Resources. In Sustainable Geoscience for Natural Gas Subsurface Systems; Gulf Professional Publishing: Houston, TX, USA, 2022; pp. 345–382. [Google Scholar]
- Wan, Y.; Liu, Y.; Ouyang, W.; Liu, W.; Han, G. Desorption area and pressure-drop region of wells in a homogeneous coalbed. J. Nat. Gas Sci. Eng. 2016, 28, 1–14. [Google Scholar] [CrossRef]
- Mahshid, F.; Brian, T.; Thomas, E.R. Developing new mechanistic models for predicting pressure gradient in coal bed methane wells. J. Nat. Gas Sci. Eng. 2016, 33, 961–972. [Google Scholar]
- Chen, Y.; Xu, J.; Chu, T.; Peng, S.; Zhang, C.; Wang, M. The Evolution of Parameters During CBM Drainage in Different Regions. Transp. Porous Media 2017, 120, 83–100. [Google Scholar]
- Salmachi, A.; Yarmohammadtooski, Z. Production data analysis of coalbed methane wells to estimate the time required to reach to peak of gas production. Int. J. Coal Geol. 2015, 141–142, 33–41. [Google Scholar] [CrossRef]
- Clarkson, C.R.; Jordan, C.L.; Gierhart, R.R.; Seidle, J.P. Production Data Analysis of Coalbed-Methane Wells. SPE Reserv. Eval. Eng. 2007, 11, 311–325. [Google Scholar]
- Clarkson, C.R. Case Study: Production Data and Pressure Transient Analysis of Horseshoe Canyon CBM Wells. J. Can. Pet. Technol. 2009, 48, 27–38. [Google Scholar]
- Chen, Y.; Liu, D.; Yao, Y.; Cai, Y.; Chen, L. Dynamic permeability change during coalbed methane production and its controlling factors. J. Nat. Gas Sci. Eng. 2015, 25, 335–346. [Google Scholar]
- Li, R.; Wang, S.; Chao, W.; Wang, J.; Lyu, S. Analysis of the transfer modes and dynamic characteristics of reservoir pressure during coalbed methane production. Int. J. Rock Mech. Min. Sci. 2016, 87, 129–138. [Google Scholar] [CrossRef]
- Ma, T.; Rutqvist, J.; Oldenburg, C.M.; Liu, W.; Chen, J. Fully coupled two-phase flow and poromechanics modeling of coalbed methane recovery: Impact of geomechanics on production rate. J. Nat. Gas Sci. Eng. 2017, 45, 474–486. [Google Scholar] [CrossRef]
- Zhang, J.; Bian, X. Numerical simulation of hydraulic fracturing coalbed methane reservoir with independent fracture grid. Fuel 2015, 143, 543–546. [Google Scholar] [CrossRef]
- Holditch, S.A.; Ely, J.W.; Semmelbeck, M.E. Enhanced recovery of coalbed methane through hydraulic fracturing. In SPE annual Technical Conference and Exhibition; OnePetro: Richardson, TX, USA, 1988. [Google Scholar]
- Johnson, R.L.; Flottman, T.; Campagna, D.J. Improving results of coalbed methane development strategies by integrating geomechanics and hydraulic fracturing technologies. Presented at the SPE Asia Pacific Oil and Gas Conference and Exhibition, Melbourne, Australia, 8–10 October 2002. SPE 77824. [Google Scholar]
- Keshavarz, A.; Badalyan, A.; Johnson, R.; Bedrikovetsky, P. Productivity enhancement by stimulation of natural fractures around a hydraulic fracture using micro-sized proppant placement. J. Nat. Gas Sci. Eng. 2016, 33, 1010–1024. [Google Scholar]
- Zou, J.; Chen, W.; Yang, D.; Yu, H.; Yuan, J. The impact of effective stress and gas slippage on coal permeability under cyclic loading. J. Nat. Gas Sci. Eng. 2016, 31, 236–248. [Google Scholar]
- Nordgren, R.P. Propagation of a Vertical Hydraulic Fracture. Soc. Pet. Eng. J. 1972, 12, 306–314. [Google Scholar] [CrossRef]
- Geertsma, J.; De Klerk, F. A Rapid Method of Predicting Width and Extent of Hydraulically Induced Fractures. J. Pet. Technol. 1969, 21, 1571–1581. [Google Scholar]
- Tomac, I.; Gutierrez, M. Coupled hydro-thermo-mechanical modeling of hydraulic fracturing in quasi-brittle rocks using BPM-DEM. J. Rock Mech. Geotech. Eng. 2017, 9, 92–104. [Google Scholar] [CrossRef]
- Peshcherenko, A.; Chuprakov, D. An ultrafast simulator for 3D propagation of a hydraulic fracture with rectangular shape. Eng. Fract. Mech. 2021, 243, 107512. [Google Scholar] [CrossRef]
- Li, J.; Liu, P.; Kuang, S.; Yu, A. Visual lab tests: Proppant transportation in a 3D printed vertical hydraulic fracture with two-sided rough surfaces. J. Pet. Sci. Eng. 2020, 196, 107738. [Google Scholar]
- Zou, J.; Jiao, Y.-Y.; Tan, F.; Lv, J.; Zhang, Q. Complex hydraulic-fracture-network propagation in a naturally fractured reservoir. Comput. Geotech. 2021, 135, 104165. [Google Scholar]
- Langmuir, I. The constitution and fundamental properties of solids and liquids. Part I. Solids. J. Franklin I. 1917, 184, 102–105. [Google Scholar]
- Moore, T.A. Coalbed methane: A review. Int. J. Coal Geol. 2012, 101, 36–81. [Google Scholar] [CrossRef]
- Durucan, S.; Edwards, J. The effects of stress and fracturing on permeability of coal. Min. Sci. Technol. 1986, 3, 205–216. [Google Scholar] [CrossRef]
- Somerton, W.H.; Söylemezoglu, I.M.; Dudley, R.C. Effect of stress on permeability of coal. Int. J. Rock Mech. Min. Sci. Geomech. Abstr. 1975, 12, 129–145. [Google Scholar] [CrossRef]
- Shi, J.-Q.; Durucan, S.; Shimada, S. How gas adsorption and swelling affects permeability of coal: A new modelling approach for analysing laboratory test data. Int. J. Coal Geol. 2014, 128–129, 134–142. [Google Scholar] [CrossRef]
- Seidle, J.P.; Jeansonne, M.W.; Erickson, D.J. Application of matchstick geometry to stress dependent permeability in coals. In SPE Rocky Mountain Regional Meeting; OnePetro: Richardson, TX, USA, 1992. [Google Scholar]
- Lee, A.L. Viscosity of Light Hydrocarbons; Monograph on API Research Project 65; American Petroleum Institute: New York, NY, USA, 1965. [Google Scholar]
- Diehl, J.; Gondouin, M.; Houpeurt, A. Viscosity and Density of Light Paraffins, Nitrogen and Carbon Dioxide; Editions Technip: Paris, France, 1970. [Google Scholar]
- Stephan, K.; Lucas, K. Viscosity of Dense Fluids; The Purdue Research Foundation: West Lafayette, IN, USA, 1979. [Google Scholar]
- Zou, J.; Jiao, Y.; Rathnaweera, T.D.; Wang, H. Experimental study on the influence of temperature cycle on low-rank coal permeability. Sci. China Technol. Sci. 2020, 63, 1055–1065. [Google Scholar]
- Pan, Z.J.; Connell, L.D. Modelling permeability for coal media: A review of analytical models and testing data. Int. J. Coal Geol. 2012, 92, 1–44. [Google Scholar]


| Elastic Modulus (GPa) | Poisson’s Ratio | Cleat Compressibility (MPa−1) | Initial Permeability (mD) | Porosity/% |
|---|---|---|---|---|
| 4.71 | 0.26 | 0.16 | 0.704 | 11 |
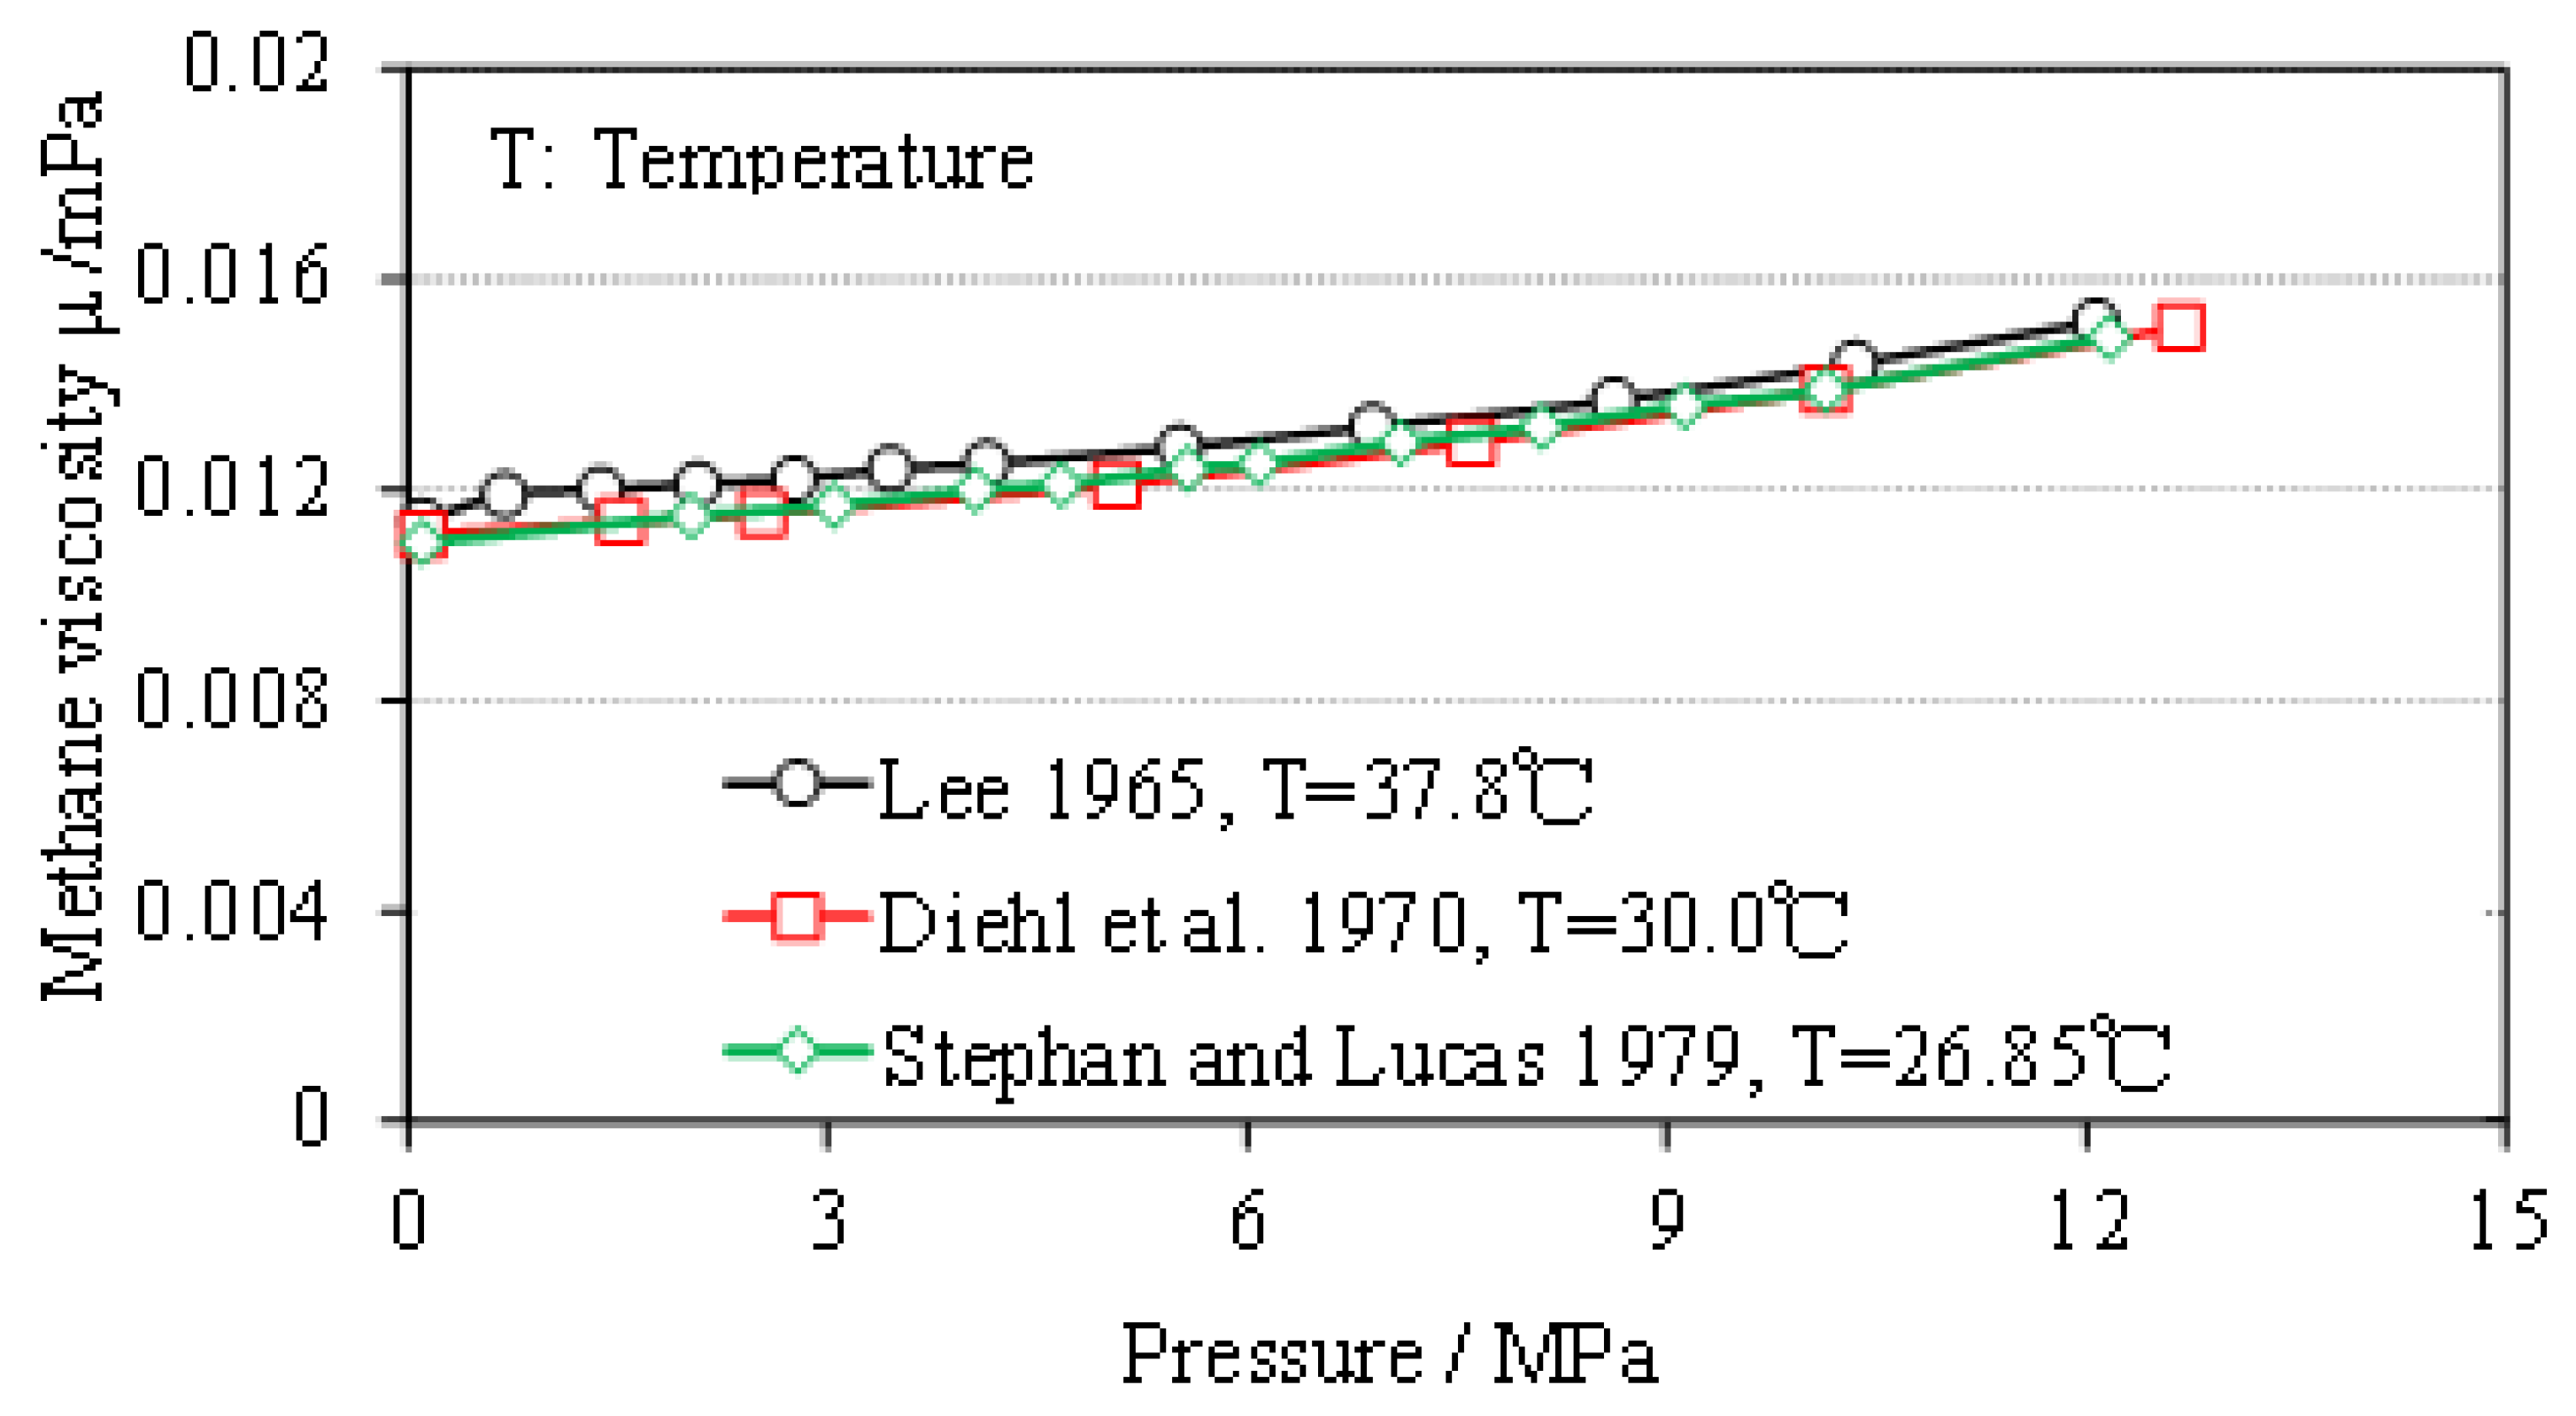
| Coal density (kg/m3) | Methane density (kg/m3) | Gas pressure in standard state Pn (MPa) | Compression factor Z | Methane viscosity (mPa·s) |
| 1340 | 0.716 | 0.10325 | 1 | 0.011 |
Disclaimer/Publisher’s Note: The statements, opinions and data contained in all publications are solely those of the individual author(s) and contributor(s) and not of MDPI and/or the editor(s). MDPI and/or the editor(s) disclaim responsibility for any injury to people or property resulting from any ideas, methods, instructions or products referred to in the content. |
© 2023 by the authors. Licensee MDPI, Basel, Switzerland. This article is an open access article distributed under the terms and conditions of the Creative Commons Attribution (CC BY) license (https://creativecommons.org/licenses/by/4.0/).
Share and Cite
Wang, Y.; Zhong, L.; Zhang, L.; Zou, J. Numerical Study on the Evolution of Reservoir Pressure and CBM Concentration Considering Hydraulic Fractures. Energies 2023, 16, 1718. https://doi.org/10.3390/en16041718
Wang Y, Zhong L, Zhang L, Zou J. Numerical Study on the Evolution of Reservoir Pressure and CBM Concentration Considering Hydraulic Fractures. Energies. 2023; 16(4):1718. https://doi.org/10.3390/en16041718
Chicago/Turabian StyleWang, Yuan, Liguo Zhong, Lei Zhang, and Junpeng Zou. 2023. "Numerical Study on the Evolution of Reservoir Pressure and CBM Concentration Considering Hydraulic Fractures" Energies 16, no. 4: 1718. https://doi.org/10.3390/en16041718