Article

Effect of Ethanol Added to Diesel Fuel on the Range of Fuel Spray

Faculty of Mechanical Engineering and Aeronautics, Rzeszow University of Technology, 35-959 Rzeszów, Poland
*
Authors to whom correspondence should be addressed.
Energies 2023, 16(4), 1768; https://doi.org/10.3390/en16041768
Submission received: 10 January 2023 / Revised: 6 February 2023 / Accepted: 7 February 2023 / Published: 10 February 2023
(This article belongs to the Special Issue CO2 Emissions from Vehicles)

Abstract

:
The constantly growing number of vehicles sold and operated has resulted in greater contribution of automobiles to global pollution. One way to reduce emissions of carbon dioxide (CO2) and toxic compounds, including the particulates and nitrogen oxides (NOx) contained in exhaust gases, is to use alternative fuels. Within this group of fuels, those of plant origin, mainly alcohols, are attracting more and more attention because of their high oxygen content (around 35%), low viscosity, and good atomisation. However, alternative fuels have different physicochemical properties than diesel fuel, and these may affect the formation of the fuel spray, which, in turn, impacts the operation of the internal combustion engine, operating parameters, and the purity of the exhaust gases emitted into the environment. To make sure this type of fuel can be used in compression ignition engines, it is necessary to gain a thorough understanding of the phenomena and relationships occurring during fuel injection. The study investigated the effect of ethanol added to diesel fuel on the range of fuel spray. Firstly, the kinematic viscosity was determined for diesel fuel, and for diesel–ethanol blends with varying proportional contents of ethanol, up to 30% v/v. The viscosity test was carried out at 40 °C in compliance with the normative requirements. At the next stage, the range of the spray tip was measured for the same fuels in which kinematic viscosity was assessed. A visualisation chamber and a high-speed camera were applied for this purpose. The test was carried out under reproducible conditions, in line with the test methodology used to determine the range of fuel spray. The analyses assessed the effect of ethanol addition on kinematic viscosity and the range of fuel spray. The findings show that the increase in ethanol content corresponds to a decrease in kinematic viscosity by about 4% on average. The results were inconclusive for the lowest injection pressure tested (75 MPa), since some of the mixtures investigated were found with a lower spray range, compared to diesel fuel with no ethanol added. The greatest increase in the spray range (by approximately 39%) was found in the fuel with 30% content of ethanol at an injection pressure of 125 MPa.

1. Introduction

The internal combustion engine is still the most common source of power in various means of transport and in working machinery. The globally widespread use of internal combustion engine in various sectors of economy is a consequence of its numerous advantages. These most importantly include the fact that it can easily be started, is quickly ready for work, and can be used to power various types of devices. Despite their many advantages, increasing attention is drawn to the adverse environmental impact of internal combustion engines. Therefore, in recent years, environmental protection has become a fundamental criterion guiding automotive development.
Compression ignition engines generate pollutants, such as nitrogen oxides (NOx), particulate matter (PM), carbon monoxide (CO), and other harmful substances. Fossil fuels are responsible for 85% of CO2 emissions and for 64% of the total emissions of greenhouse gasses [1,2,3].
Currently, the following approaches are used to reduce toxic emissions and emissions of CO2, which is considered a greenhouse gas [4,5,6]:
  • Optimisation of the combustion chamber and appropriate selection of fuel injection parameters;
  • Development of alternative fuels;
  • Use of nanoadditives in fuels;
  • Exhaust gas aftertreatment systems.
Of the above-mentioned, the simplest and most widely applied approach focuses on the development of alternative fuels, as this does not require costly engine modifications, only the selection of appropriate control parameters [7,8].
The main objective of the research and development activities related to alternative fuels is to find fuels that are environmentally friendly and cost-competitive, with respect to petroleum-based fuels. In the short term, this means creating fuel blends based on diesel oil, while increasing the proportional content of bio-components, in order to produce “clean” fuels in the medium- and long-term without the use of petroleum products.
Esters from vegetable oils have been added to diesel fuel for decades, whereas recently, more attention has been paid to alcohols applied as fuel additives [9,10,11]. This may be linked to numerous favourable factors, such as high oxygen content and purity, as well as low viscosity [12,13]. The alcohols commonly used as alternative fuels include ethanol and methanol, which are products of biomass fermentation [14]. Used in mixtures with diesel oil, ethanol presents better properties than methanol [15]. The former more effectively blends into diesel oil and has a higher cetane number and superior lower calorific value [16]. Ethanol is the most commonly used alcohol because it can be obtained from a variety of raw materials [17] and at a low production cost [18], it can be produced from renewable materials, and it has a high oxygen content [19].
However, due to its low cetane number and lubricity, ethanol cannot be used as a stand-alone fuel to power compression ignition engines [20]. For this reason, mixing ethanol with diesel oil is a good solution [21,22]. The resulting blends can be used in compression ignition engines designed to run on conventional diesel fuel [23]. This subject matter has been investigated in numerous studies that have focused on various aspects related to the use of such fuel blends [24,25,26].
Experimental studies show that an increase in the concentration of ethanol in a mixture with diesel oil can lead to the reduction of nitrogen oxides and particulates [27,28,29], but it can also result in higher exhaust gas temperature, increased emissions of carbon monoxide (CO) at low and medium engine load, and increased amounts of unburned hydrocarbons (HC) [30,31,32].
The efficient operation of a compression ignition engine, expressed in terms of economy, exhaust toxicity, and engine noise, depends on efficiency of fuel-air mixture combustion. On the other hand, the course of combustion depends on the process of fuel injection, atomisation, droplet evaporation, mixing with air, initial chemical reactions, and actual burning [33].
Fuel atomisation is one of the key factors determining the efficiency of the combustion process in a compression ignition engine. The rate of fuel diffusion and penetration, the breaking up of liquid jet, the quality of fuel atomisation, and the velocity of fuel injection after the start of the injection and before ignition contribute to the formation of pollutants and particulates and affect the performance of the engine [34]. However, the detailed mechanism of fuel spray formation and the effects of operating parameters on the resulting spray structure are still not clearly understood [35]. The quality and precision of fuel atomisation is affected, among other things, by the type and design of the injector and by the physicochemical parameters of the fuel, such as its viscosity or surface tension [36,37]. The process of fuel atomisation should lead to [38]:
  • Breaking up the fuel dose into a large number of droplets, thereby increasing the surface area of the fuel dose to accelerate evaporation and mixing with the air, i.e., ensuring the proper microstructure of the mixture.
  • The uniform distribution of the fuel in the combustion chamber, as required by its dimensions, i.e., ensuring the proper macrostructure of the mixture.
The fuel injection process may be investigated by taking into account the geometry of the spray. The related indices are most often determined during injection into the ambient air or into a chamber filled with air or nitrogen [39], where the back-pressure conditions correspond to the actual conditions in the combustion chamber [40,41]. Optical testing methods are used to assess fuel atomisation through the direct observation of this process [42,43]. The advantage presented by optical methods is the fact that the testing is carried out in a non-invasive and non-contact manner, so that the measuring system does not interfere with the processes under investigation [44].
A number of studies related to ethanol–diesel fuel blends have focused on their physicochemical properties and the emission of toxic compounds contained in the exhaust gas. However, there are few studies assessing the effect of ethanol on the geometric parameters of the spray, which would make it possible to determine the appropriate control parameters to achieve optimum operating conditions for engines powered with this type of fuel. The course of the combustion process affects the emission of toxic compounds contained in the exhaust gas. Therefore, the aim of this study was to investigate the relationship between the ethanol added to diesel oil and the maximum spray range in a dispenser injection system, so that it is possible to determine appropriate injection parameters.
To achieve the intended objective, the study was designed to incorporate:
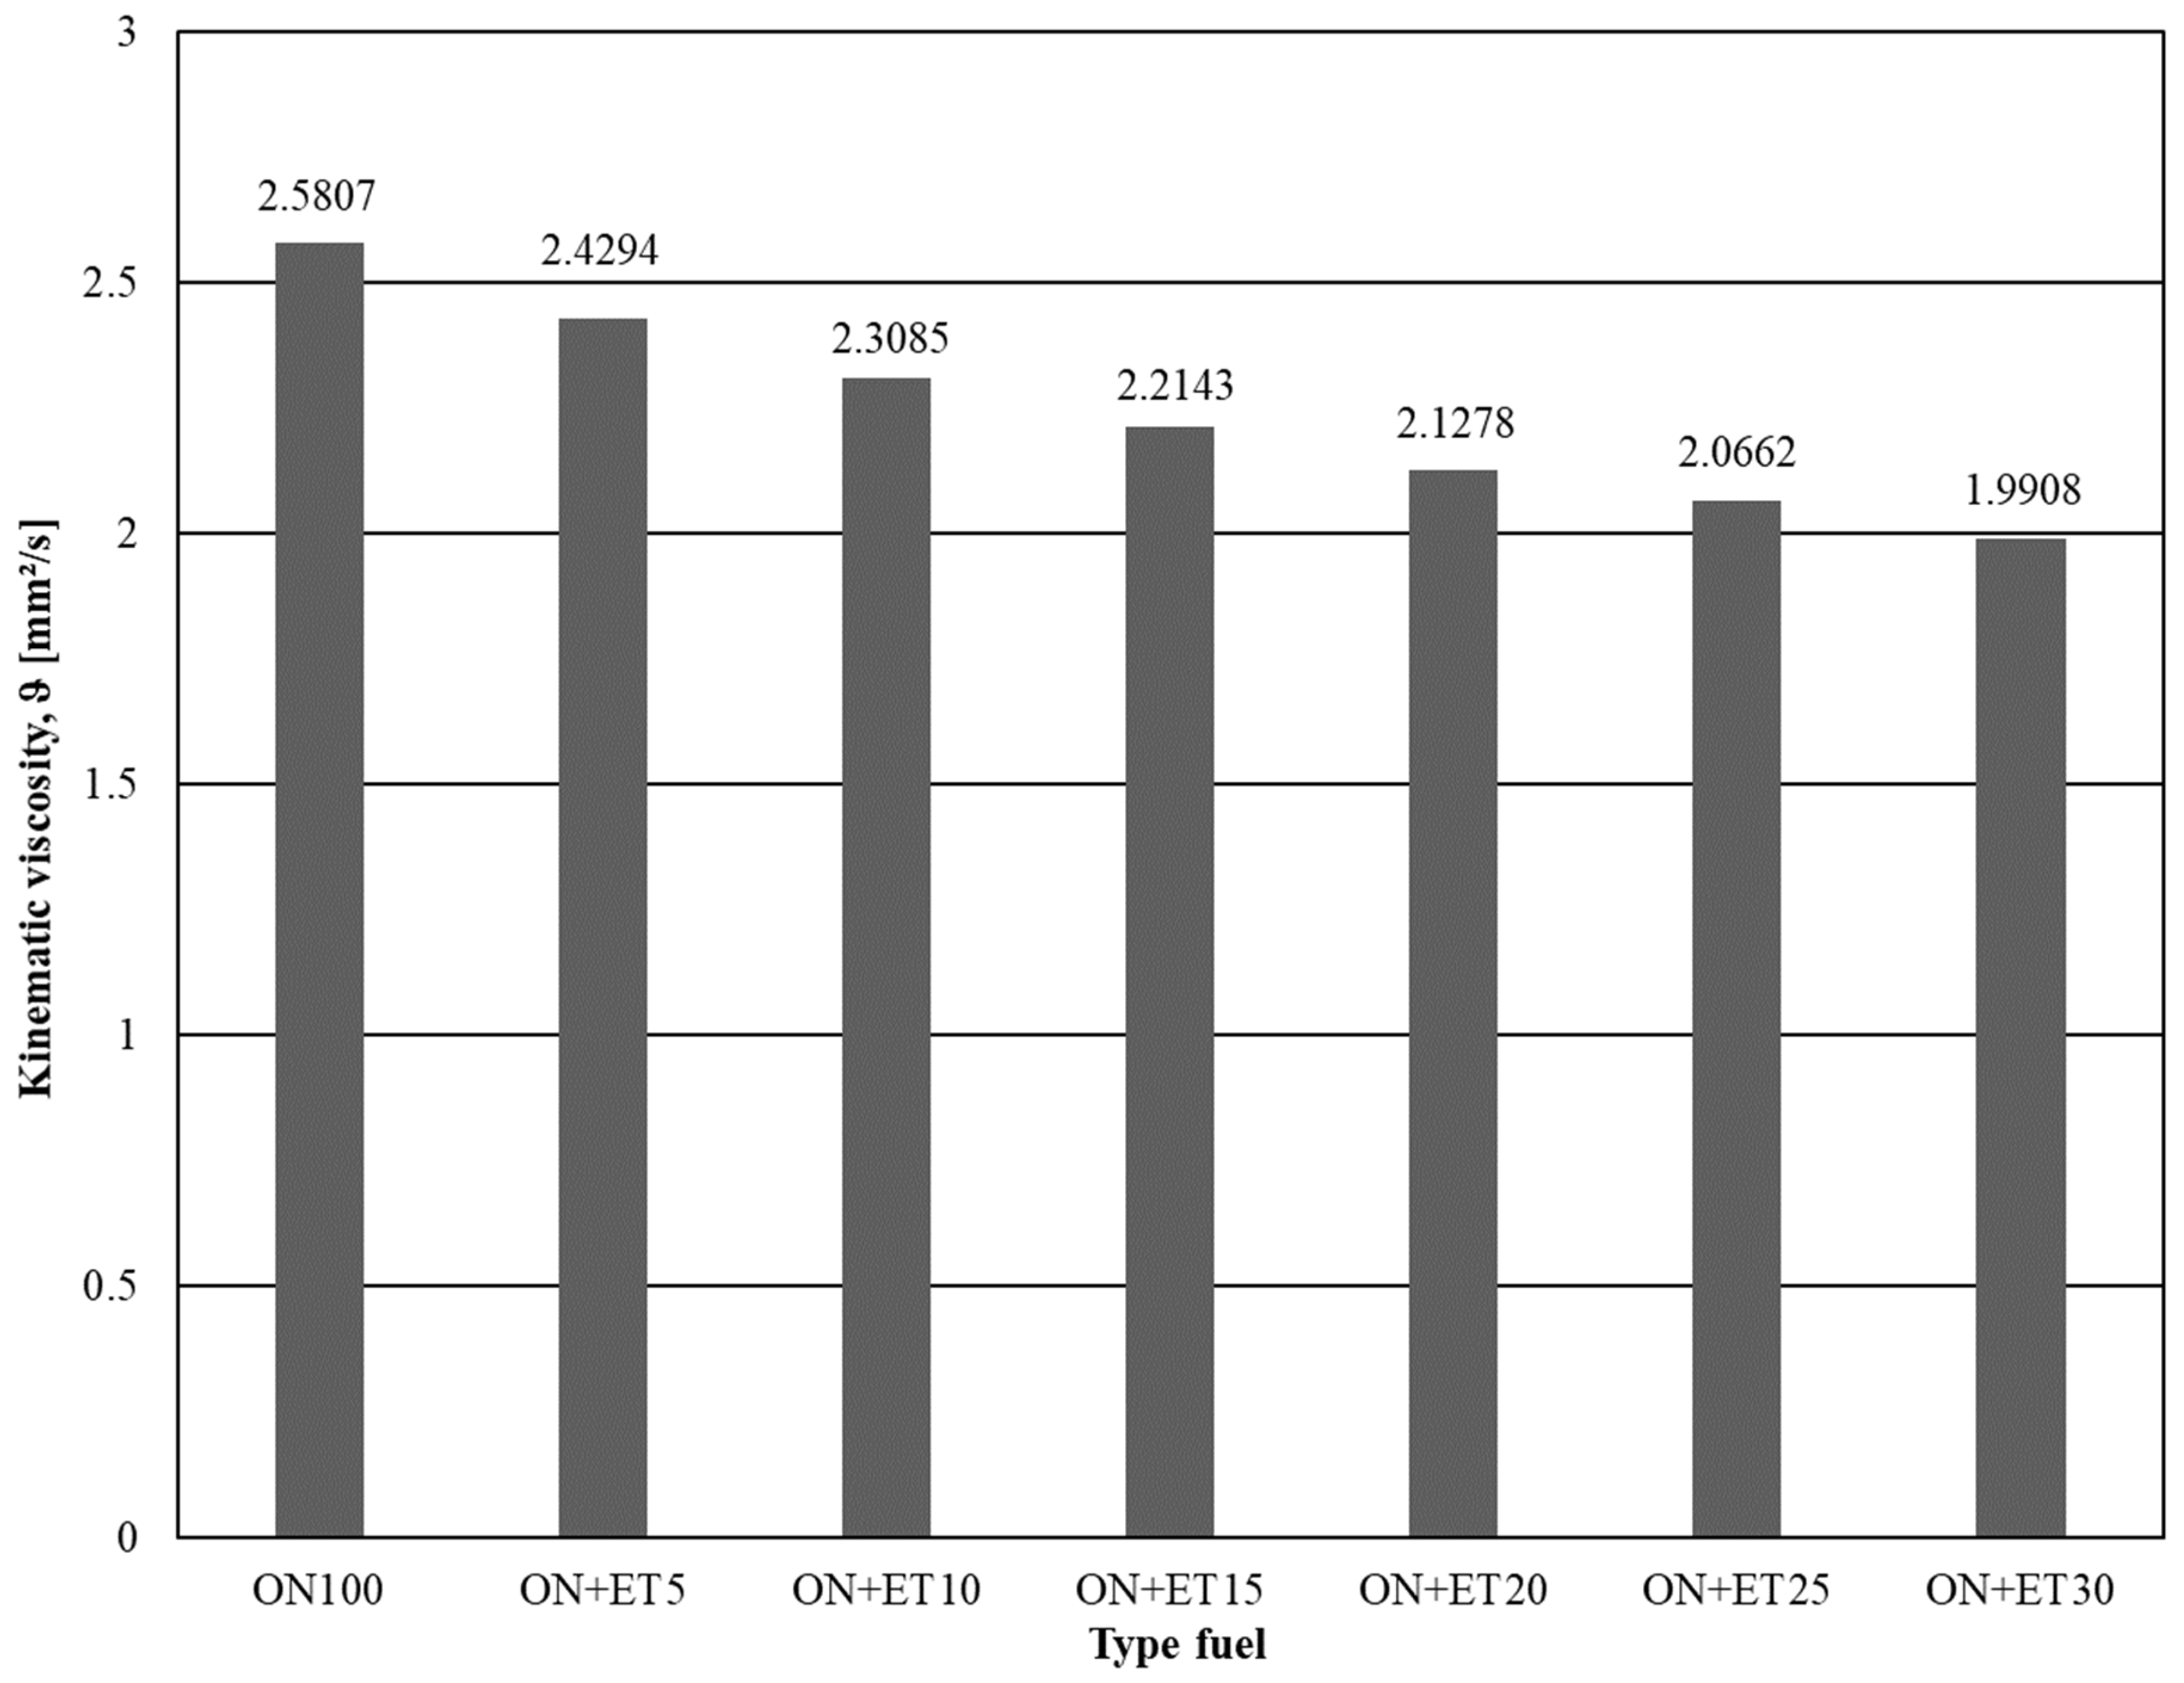
  • An assessment of the kinematic viscosity of conventional diesel fuel and ethanol–diesel fuel blends;
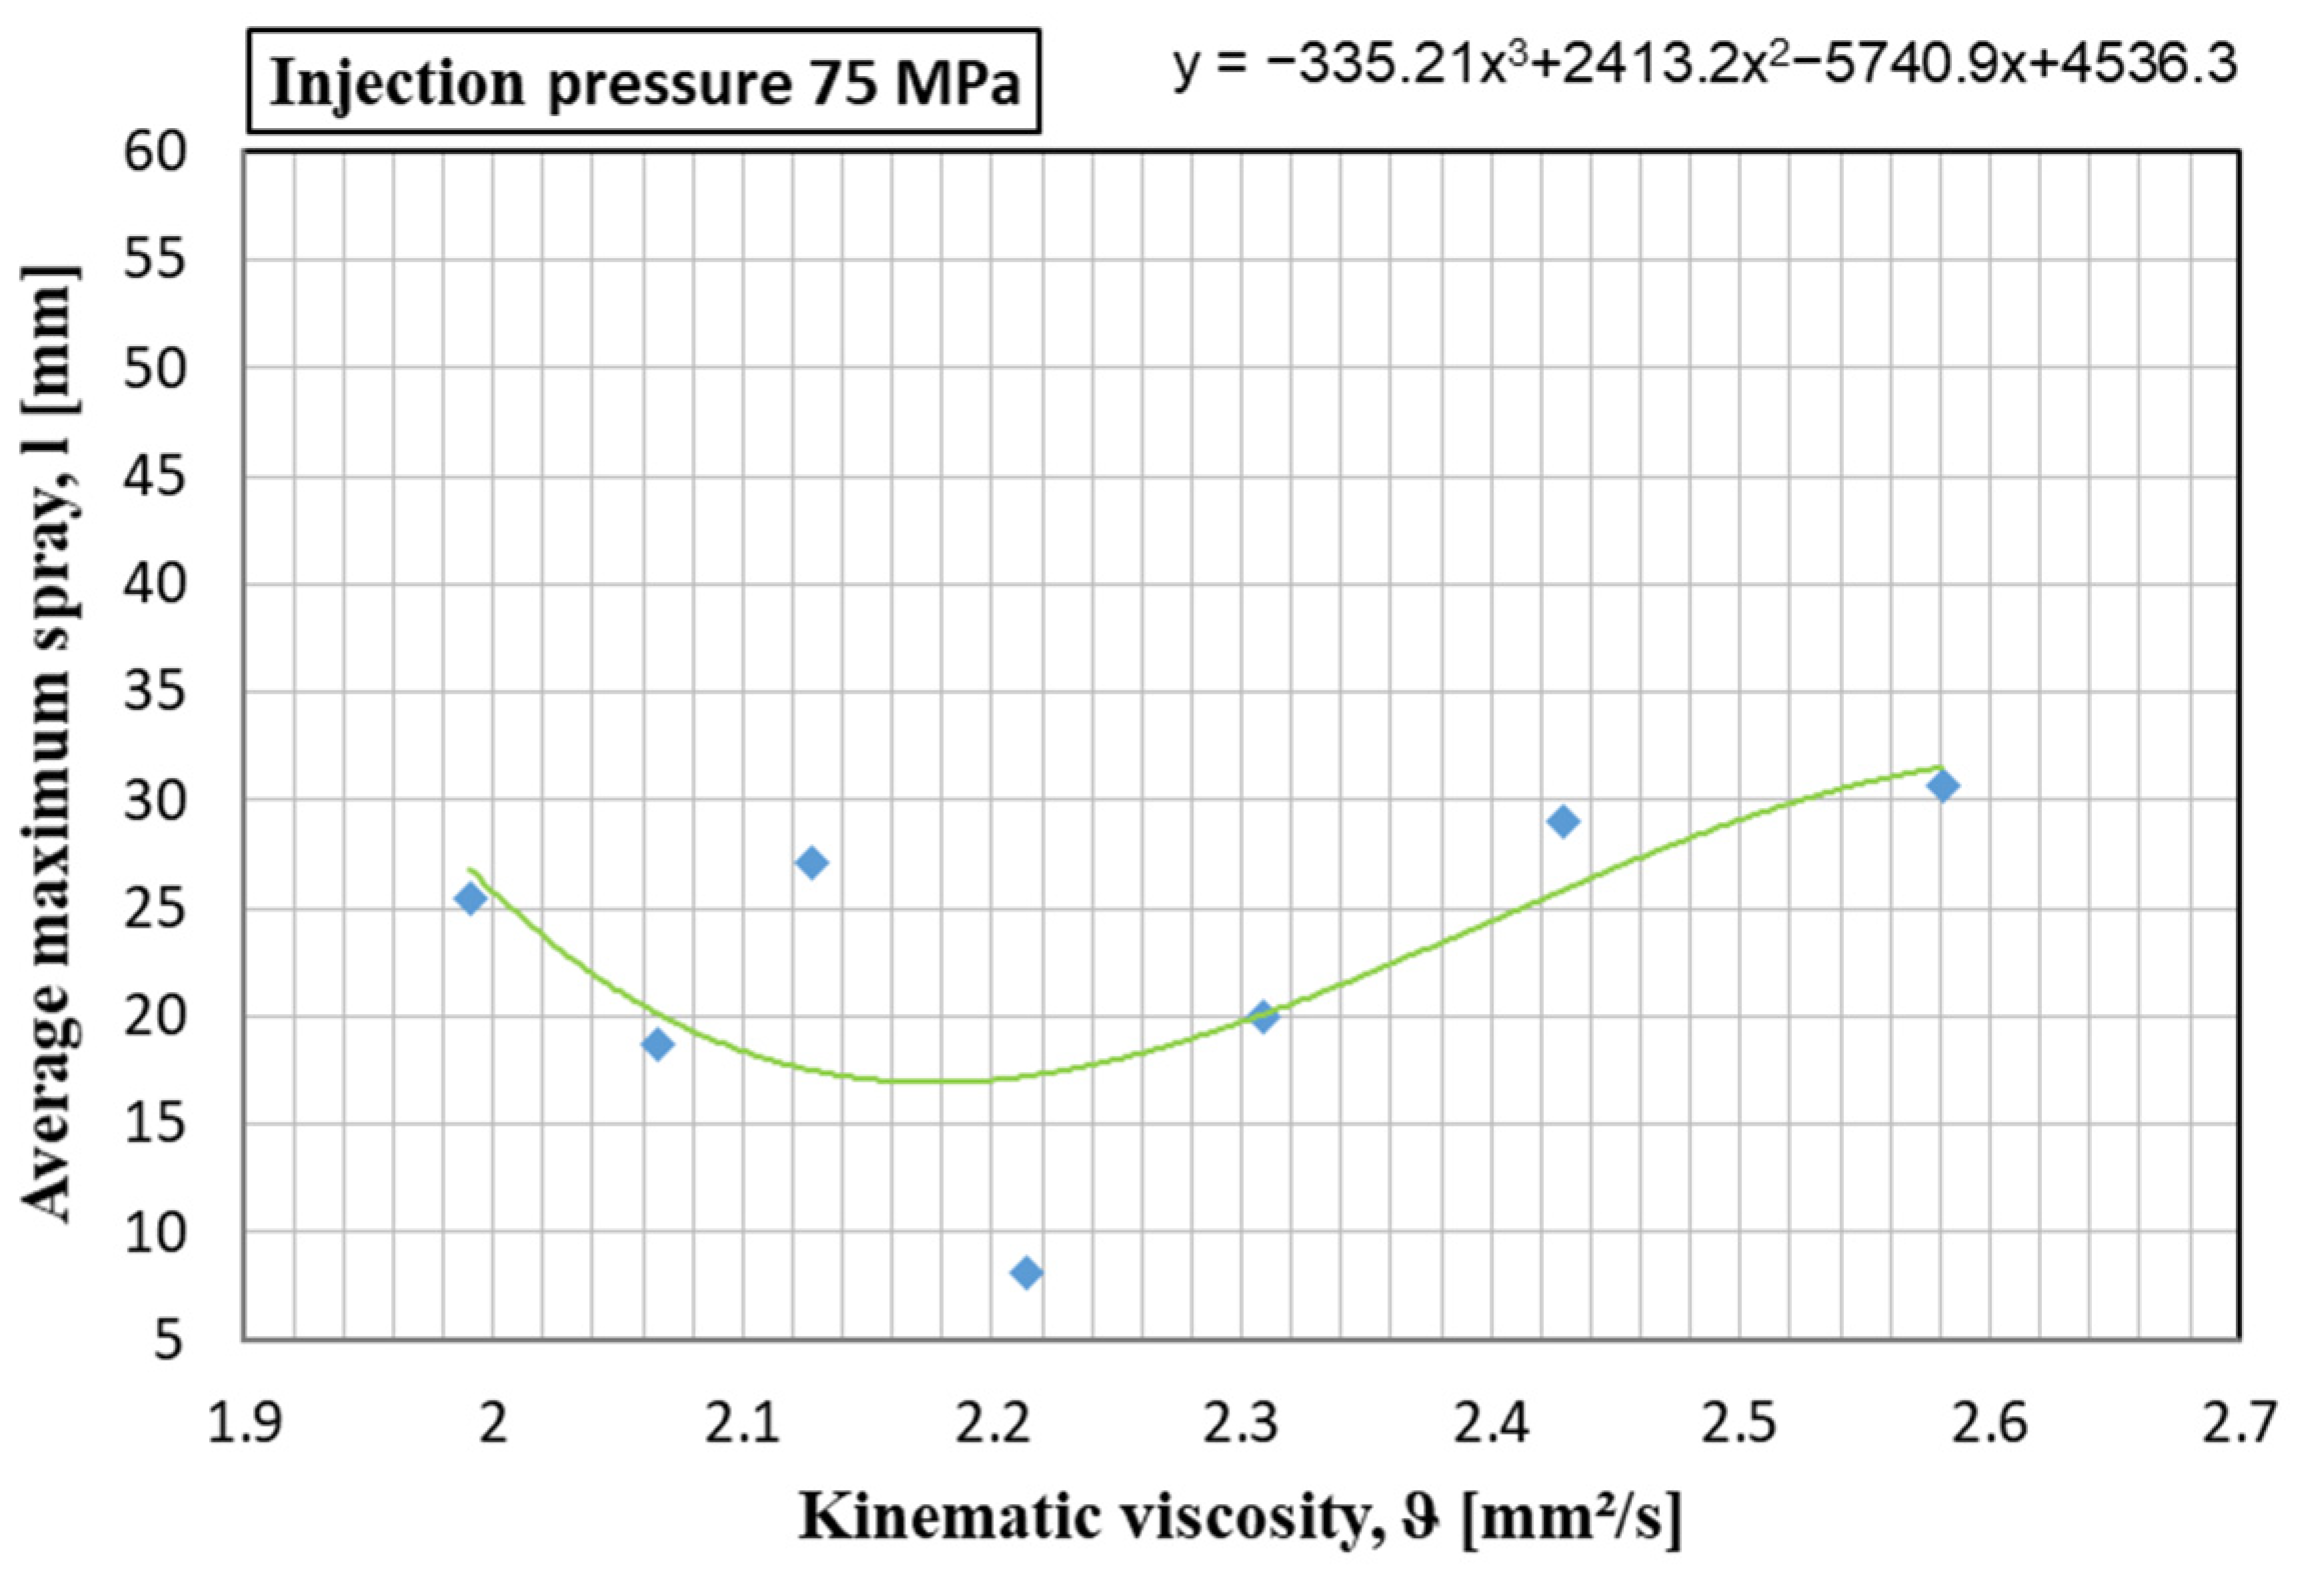
  • Visualisation tests focusing on the injection process for the fuels investigated, carried out at a workstation; these aimed to determine the geometry of the fuel spray (maximum range of spray tip),
  • An assessment of the relationship between the injection parameters and the parameters of the spray macrostructure.

2. Research Method

By selecting adequate injection parameters, it is possible to positively affect the operation of the internal combustion engine, operating parameters, and the purity of the exhaust gases emitted into the environment. In specific conditions of engine operation, the optimum injection parameters are, in turn, determined by the parameters of the injected fuel. As studies have shown, by adding ethanol to diesel oil, it is possible to reduce the kinematic viscosity of the fuel [45,46]. Viscosity determines the resistance of fuel to flow through the injection system components, which can affect the range of the spray tip.
The blends were selected based on information reported in the related literature focusing on the evaluation and suitability of blends for powering compression ignition engines [47,48].
Kinematic viscosity was measured, in accordance with PN-EN ISO 3104:2004, at a temperature of 40 °C. The HVP 482 apparatus used to determine kinematic viscosity was a viscometer with a glass capillary and the following operating parameters [49]:
  • Temperature range: −40 ÷ +100 °C;
  • Testing range, depending on the capillary used: 1 ÷ 50,000 mm2/s;
  • External thermostatic system with temperature control range: from −80 to +20 °C;
  • Accuracy of temperature stability: ±0.01 °C.
The process of determining kinematic viscosity with the use of the HVP 482 apparatus was carried out automatically. The test measured the time taken by a specific quantity of fuel sample to flow, under gravitational forces, through a calibrated glass capillary. The value of kinematic viscosity was calculated based on the measured flow time of the liquid investigated, in accordance with the formula:
ϑ = t ⋯ K
where:
ϑ–kinematic viscosity [mm2/s];
t–flow time of the liquid from the upper to the lower level [s];
K–the capillary constant [mm2/s2].
Visualisation tests aiming to identify the effect of ethanol added to diesel oil on the maximum fuel spray range were carried out for seven samples with different volume proportions of ethanol added to the fuel (Table 1). The mixtures with the content of ethanol ranging from 5% to 30% were supplemented with 5% dodecanol, in order to obtain homogenous blends. This proportional content of dodecanol was defined to ensure miscibility [15,50]. The samples were made from commercial diesel fuel, which, in accordance with the standard, could contain up to 7% FAME and up to 200 mg/kg water, with an addition of dehydrated and denatured ethanol, whose main properties are shown in Table 2. The selected parameters of dodecanol applied to improve mixture stability are shown in Table 3.
Visualisation tests were carried out in a workstation (Figure 1) consisting of the following components:
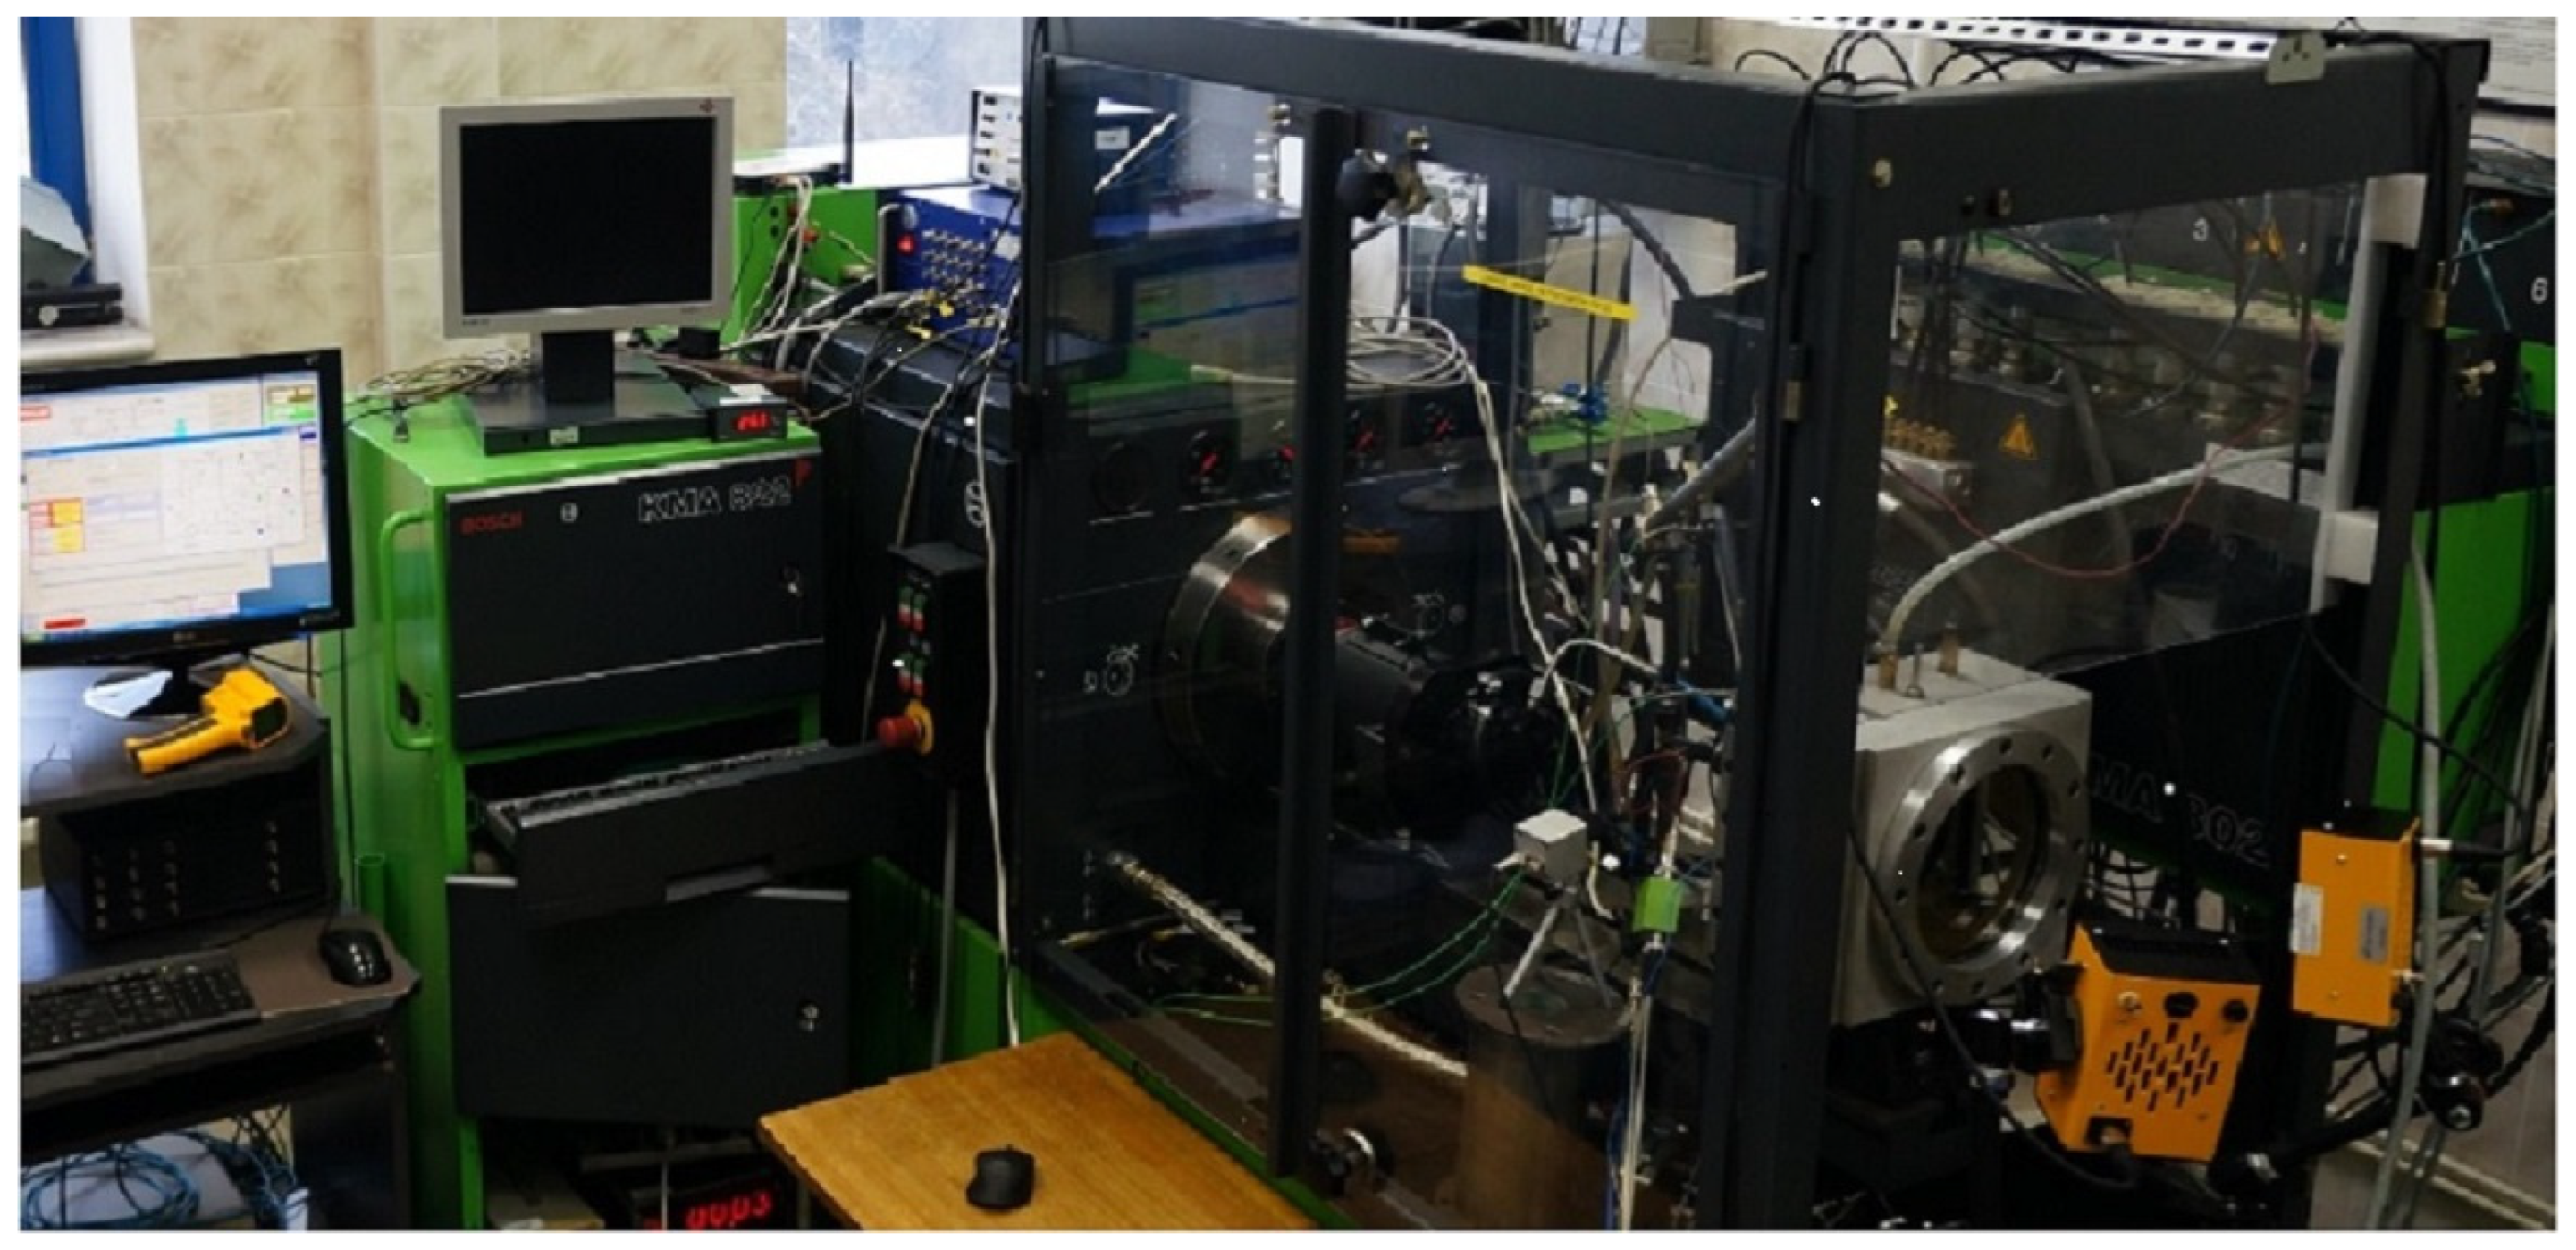
  • Test bench for testing injector systems;
  • A separate hydraulic system feeding the injection system;
  • A visualisation chamber with a constant volume;
  • The injection system (high-pressure pump, fuel tank, and common rail electromagnetic injector with needle lift sensor);
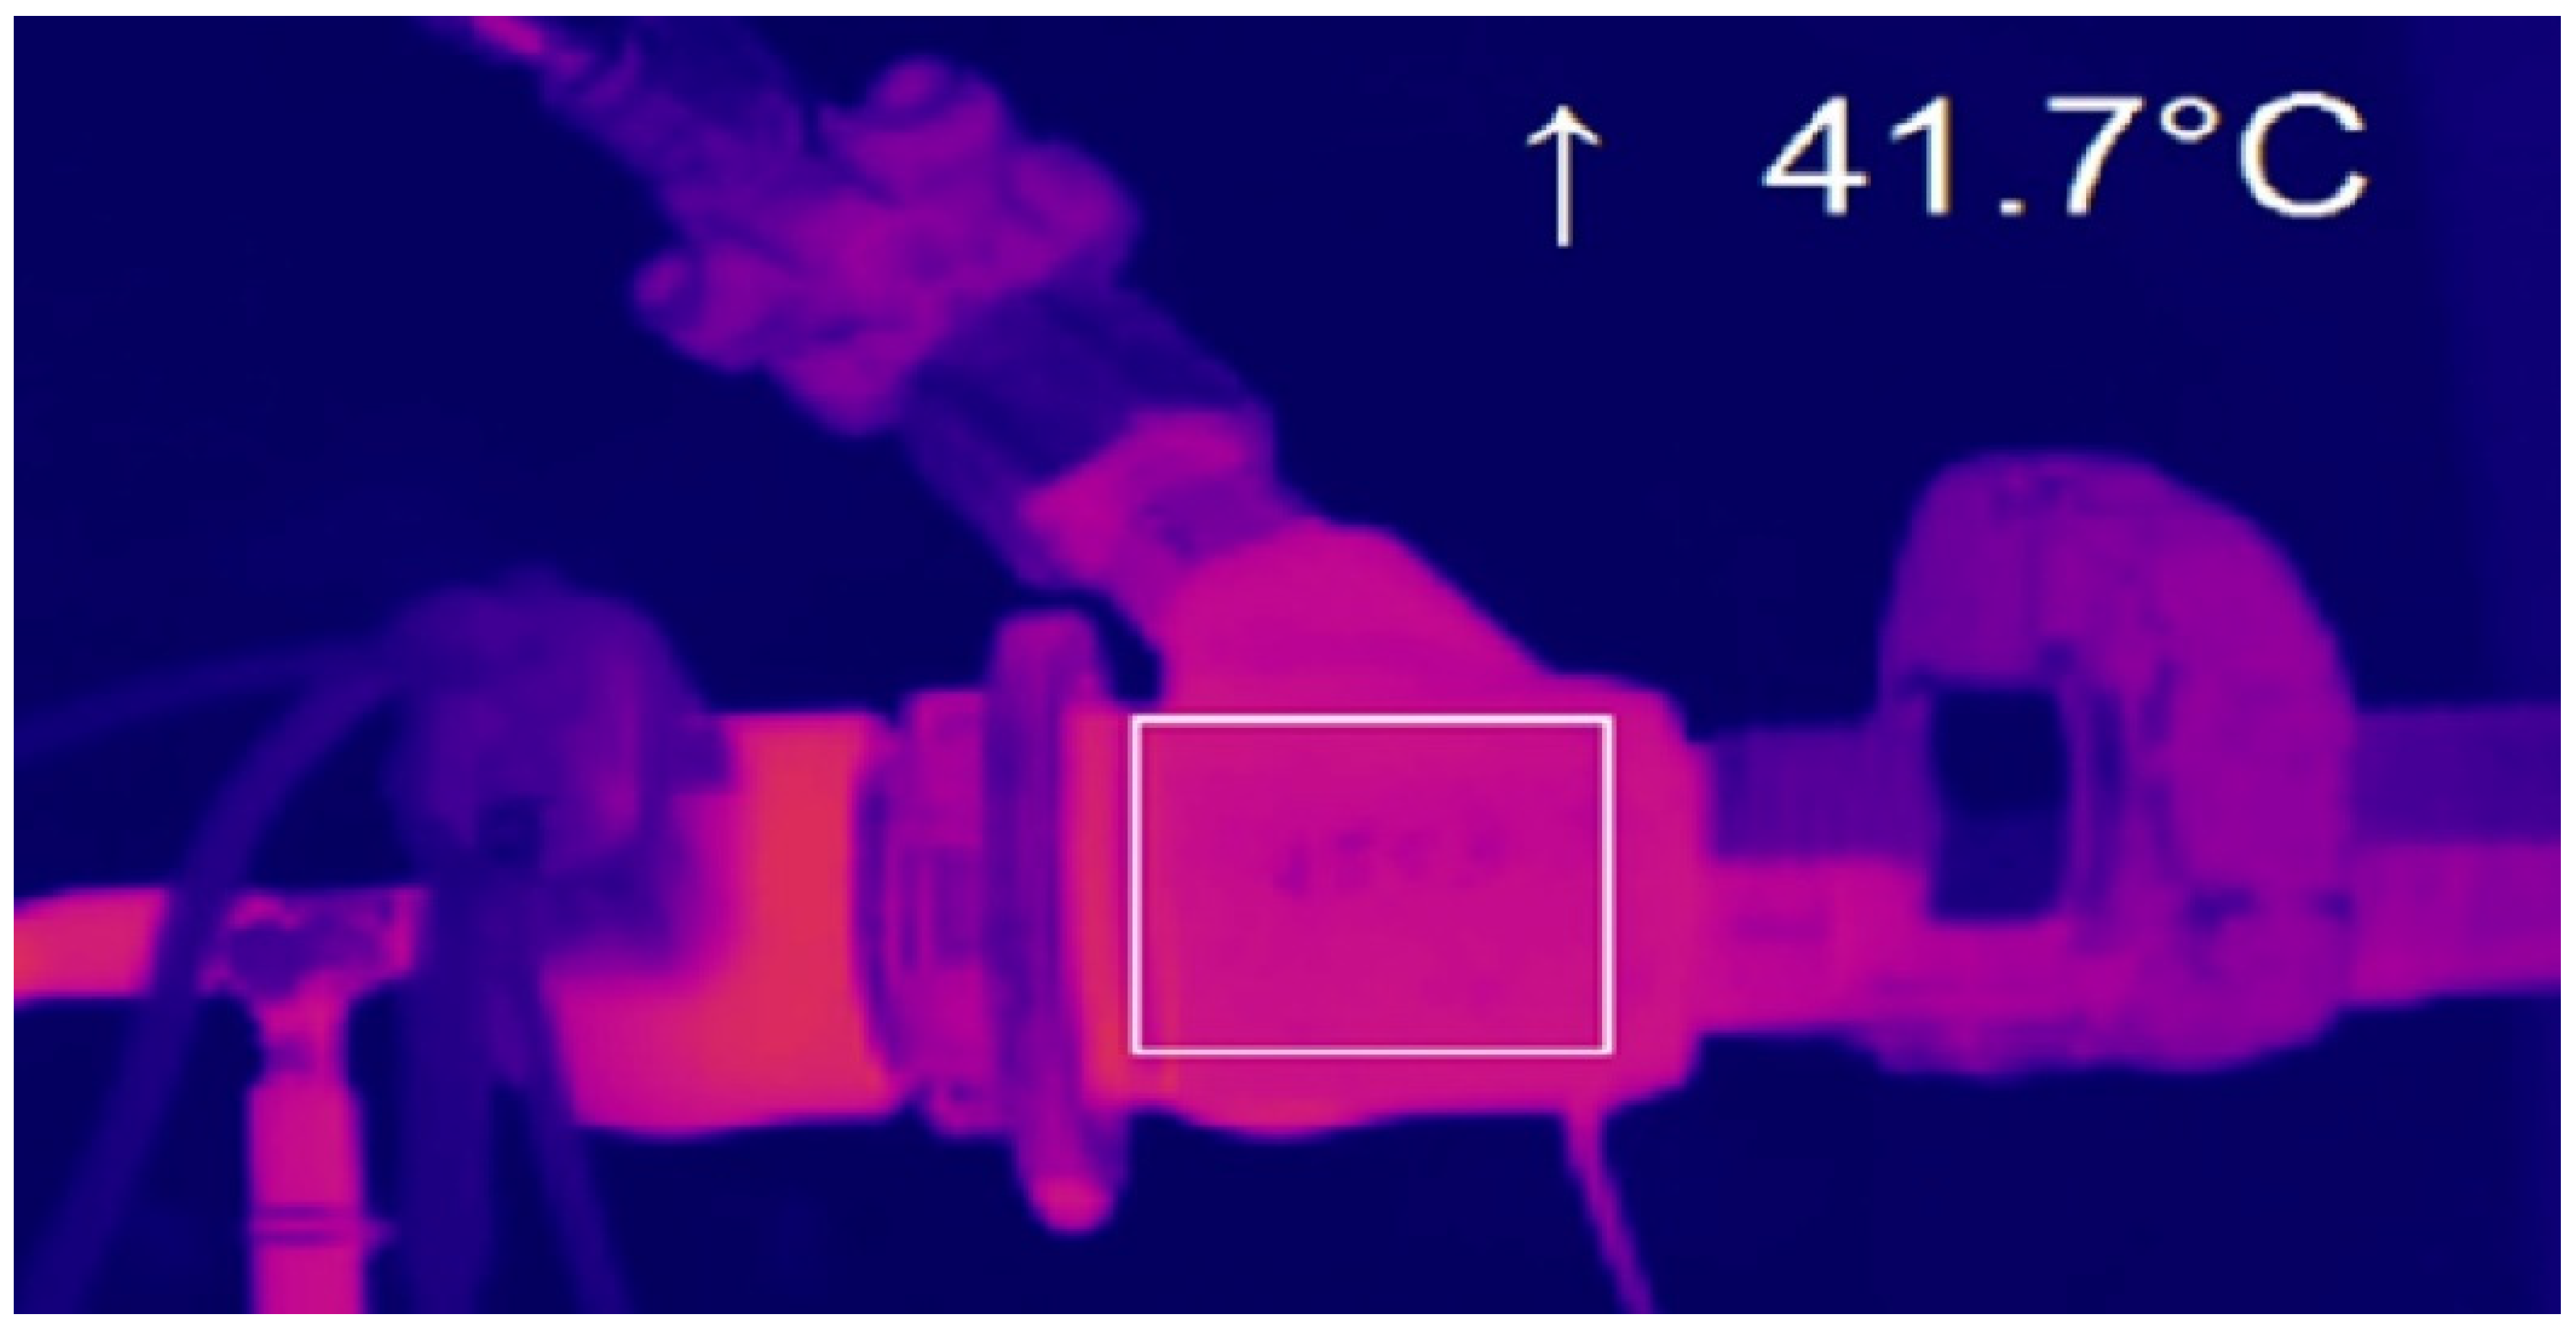
  • A thermographic camera to measure the temperature of the injector (Figure 2);
  • A high-speed camera for filming the evolution of spray in the visualisation chamber.
A separate hydraulic system was used, rather than the test bench system, because the required tests involving diesel oil–ethanol mixtures could not be performed on the test bench. This is due to the fact that the test bench manufacturer does not permit the use of a medium other than the test oil defined in the manual, as it does not guarantee the proper operation of the test bench system. Furthermore, the types of seals used in the hydraulic system do not guarantee leak tightness if the fluids applied differ from the test oil that was tested by the bench manufacturer.
The high-pressure system installed on the test bench consists of a high-pressure pump, a fuel accumulator, an injector located in the visualisation chamber, and high-pressure lines. A layout of the injection system is shown in Figure 3. An electric fuel pump transfers fuel from the tank to the high-pressure pump. The pressure at the feed point to the high-pressure pump is controlled by an adjustable valve and measured with a pressure gauge. The transferred fuel flows through the cooler and into the tank. The water flow through the cooler is regulated by a solenoid valve, based on information about the temperature of the returning fuel.
The high-pressure pump forces the fuel into the accumulator, where the pressure is measured, based on which the pressure regulator in the busbar is controlled. The fuel is pumped from the accumulator to the injector and injected into the visualisation chamber. The injected fuel flow rate and transfer volume are measured using Coriolis flowmeters. To stabilise the temperature, the water flow in the coolers is regulated by means of solenoid valves, which are monitored by the test bench control unit.
The injector is controlled by a microprocessor, which makes it possible to change the following control signal parameters:
  • Duration of the entire signal controlling the opening of the injector;
  • Duration of the sustain signal;
  • Frequency of the sustain signal;
  • Fullness of the sustain signal.
The controller enables up to three fuel doses to be injected during one revolution of the crankshaft, and it also makes it possible to apply continuous and single injections. The input signals of the injection control system, i.e., the position and speed signals of the high-pressure pump, are emitted by an encoder mounted on the shaft of the motor driving the pump. Based on these data and information provided by the user via the computer, the controller produces and sends the appropriate signal driving the solenoid injector.
The basic components enabling optical testing include the visualisation chamber and the recording system. The visualisation chamber (Figure 4) consists of the body and glass panes, making it possible to adequately illuminate the spray. On the inner wall of the chamber, visible through the front glass pane, there is a disc with a graduation in the form of coaxial circles aligned with the injector; the purpose of these is to help quickly estimate the range of the fuel spray.
The image of the fuel spray injected into the chamber containing air with atmospheric pressure was registered with the high-speed camera Phantom V 710. To carry out tests that require high-speed filming, it is necessary to use adequate illumination; for this purpose, two LED illuminators, 100 W each, were applied. It is also important to use a lens that makes it possible to achieve adequate quality recordings of the injected fuel spray. Hence, a full-frame, wide-angle lens with fixed focal length of 20 mm and the maximum diameter of aperture of f/1.4 was used for this purpose [53].
The tests were performed for three different values of injection pressure (75, 100, and 125 MPa). The injection duration was 500 µs, and the speed of the high-pressure pump was 1000 rpm. These parameters were constant during the tests. It was assumed that these values of injection pressure and rotational speed of high-pressure pump correspond to the conditions observed in the combustion chamber of a compression ignition engine.
Observations of the spreading fuel spray were carried out for single doses injected for a duration of 500 µs, and as a result, it was possible to compare the acquired research material.
The program of the tests performed at the workstation, comprising a visualisation chamber and equipped with a high-speed camera for filming the evolution of the injected fuel spray, included the following sequence of activities:
  • Cleaning the hydraulic system with compressed air and filling the system with the investigated fuel;
  • Setting the appropriate injection pressure and time;
  • Performing a procedure of heating the fuel in the system to a temperature of 40 °C ± 2 °C and the injector to a temperature of 55 °C ± 2 °C (the required temperatures are obtained through the operation of the system under the specified test conditions);
  • Performing a single injection into the visualisation chamber and recording it with a high-speed camera;
  • Repeating the measurements a defined number of times to obtain results for statistical processing;
  • Repeating the measurements for all the defined values of pressure in the system;
  • After the tests have been completed, removing the fuel and flushing the system.
The recorded fuel sprays were examined by the observation of individual frames to assess the maximum spray range. The spray range was measured for the frame preceding the end of the injection, defined as the spray breaking away from the atomiser. The spray range was measured from the centre of the injector to the spray tip, and it corresponded to the radius of the circle tangent to the furthest point on the recorded image of the spray. Figure 5 presents in what way the range of the first spray was measured. The same procedure was applied to the other sprays.
The number of trials was determined in accordance with the procedure described in PN-ISO 5725-6:2002, related to the accuracy (trueness and precision) of the measurement methods and results. In line with the above standard, if the absolute value of the difference between two test results does not exceed the repeatability limit, r, for which two measurements amount to r   =   2.8 σ r , the test results are considered acceptable, and it is recommended that the arithmetic mean be given as the final result. After the results from the two trials were calculated, the absolute difference did not exceed the repeatability limit. Therefore, the results from the two trials could be used for further analysis. However, a review of the related literature suggested that at least 5 to 10 measurements should be performed, due to which, ultimately, 7 trials were carried out to reduce uncertainty [54].
A statistical analysis was performed to determine the measurement uncertainty. An expanded uncertainty was calculated [55], for which the expansion coefficients were determined from Student’s t-tables for a confidence interval of α = 0.05.

3. Results and Analysis

To carry out the analyses, the kinematic viscosity was measured, and the evolution of the fuel spray injected into the visualisation chamber was registered in the video materials, from which the maximum range of the spray tip was determined. To ensure the repeatability of the injected dose of fuel, the speed of the high-pressure pump (1000 rpm) and the fuel injection time (500 µs) were kept constant, and the fuel tank temperature (40 °C) and injector temperature (55 °C) were maintained within a defined tolerance of ±2 °C during the recording of the injection process. An example of a registered fuel spray evolution is shown in Figure 6.
The increase in the proportional content of ethanol resulted in a decrease in the kinematic viscosity by approximately 4% on average (Figure 7). The lowest kinematic viscosity was identified in the ON+ET30 fuel sample. Of all the fuels investigated, only the fuel with 30% ethanol did not achieve the required viscosity defined for diesel fuel by Polish regulations.
The addition of ethanol to diesel oil led to a change in the range of the spray tip. The graphs in Figure 8 represent the maximum mean ranges of the spray tips for the fuel samples investigated. In the case of ON+ET15 fuel and an injection pressure of 75 MPa, the findings show the lowest range of the spray tip, amounting to 8.17 mm. At this injection pressure, the highest value of spray range, amounting to 30.61 mm, was identified for standard diesel fuel. Trials with injection pressure of 100 MPa showed that the fuel with 25% ethanol had the lowest range of the spray tip (32.66 mm), whereas the ON+ET5 fuel sample achieved the highest value (43.94 mm). After the injection pressure was increased to 125 MPa, the highest range of 55.79 mm was identified for ON+ET5 sample, and the lowest value of 39.88 mm was found for the ON sample.
The trend lines were determined to show the direction of the changes in the mean values of the maximum spray ranges as a function of kinematic viscosity.
The analysis of the trend lines for the maximum spray range (Figure 9, Figure 10 and Figure 11) shows that, in the case of injection pressure of 75 MPa, the spray range decreases with the value of kinematic viscosity going down to 2.2143 mm2/s, and it increases with the lower values of this parameter. In the case of an injection pressure of 100 MPa, the spray range increases up to kinematic viscosity of 2.4294 mm2/s. Subsequently, it decreases with lower viscosity, until reaching a value of 2.0662 mm2/s, after which, the spray range increases again. In the case of 125 MPa pressure, the spray range increases with kinematic viscosity going down to 2.3085 mm2/s, and then it decreases with the lower values. An increase in the spray range can be observed for viscosity below 2.1275 mm2/s.
As can be seen in Figure 9, Figure 10 and Figure 11, the range of spray in each of the mixtures increases with the increase in pressure; however, these changes are different. A significant decrease in the range of spray for the pressure of 75 MPa at the mixture viscosity of approximately 2.14 mm2/s (Figure 9) may be the result of cavitation in the nozzle holes. Cavitation generates vapor into the flow, which increases the maximum velocity in the liquid core [56]. The cavitation is related not only to the pressure and flow rate or fuel parameters, but also to interactions with turbulence. The fuel flow affects the shape of cavitation, and the collapsed bubble makes the fuel flow more inordinate [57]. With different fuel flow conditions, cavitation can occur with varying intensity, causing various changes in the discharge velocity and also in the range of spray.

4. Conclusions

The study was designed to determine the effect of ethanol addition on the maximum range of spray tip. The analysis was carried out for seven fuels with different proportional contents of ethanol. First, the kinematic viscosity of the fuels investigated was determined, and then the methodology prepared for this purpose was applied to perform a comparative analysis of the spray range observed in the case of commercial diesel fuel and fuels containing ethanol.
The analysis of the results of kinematic viscosity tests carried out at a temperature of 40 °C shows that increased contents of ethanol lead to decrease in kinematic viscosity. Of all the fuels investigated, only the fuel with 30% content of ethanol did not achieve the required viscosity level defined for diesel fuel by Polish law.
Based on the results of the visualisation tests, it can be concluded that, in the case of an injection pressure of 75 MPa, lower values of spray range were achieved by all the mixtures, compared to diesel fuel. The lowest decrease of approximately 5.2% was identified in ON+ET5, and the highest, amounting to approximately 73.3%, was found in the case of ON+ET15. For an injection pressure of 100 MPa, the effect of ethanol was inconclusive; the highest spray range increase of almost 14% was found for ON+ET5 and ON+ET15, whereas the lowest spray range was observed in the case of ON+ET25, with the value lower by approximately 15%. When an injection pressure of 125 MPa was applied, all the mixtures achieved a greater spray range than diesel fuel with no ethanol added. The highest range, with an increase of approximately 39%, was observed in the fuel with 30% ethanol content.
The increased proportional content of ethanol in diesel oil blends results in reduced kinematic viscosity, which should improve the quality of the fuel atomisation. However, the reduced size of the droplets in the spray can result in a decrease in spray range, which was observed at the lowest injection pressures tested. One of the parameters potentially affecting the spray range is also the velocity of flow out of the atomiser apertures, which depends not only on the pressure inside the atomiser, but also on the characteristics of the injected fuel and its droplets, because lower viscosity can lead to reduced resistance to flow through the atomiser apertures. Significant changes in the velocity of the drops affecting the spray range may also be the result of cavitation during the flow of fuel through the nozzle holes.
Furthermore, the temperature of the injector also increased with higher injection pressure, and this could lead to a further decrease in viscosity, as well as a greater ethanol evaporation and a local increase in droplet density. These phenomena may have been responsible for the increase in spray range that was observed for diesel oil–ethanol blends, relation to diesel oil, in the conditions of higher pressures occurring in the injection system.
The inconclusive findings related to the effect of ethanol addition on the spray tip range suggest it is necessary to conduct further research focusing on this subject matter. In order to more precisely determine the effect of kinematic viscosity, resulting from addition of ethanol to diesel oil, on the range of fuel spray, tests are planned to be further carried out for temperatures from 50 to 60 °C. This is implied by the temperature of the fuel in the injector during the visualisation tests.
Based on the test results, the effect of ethanol added to diesel fuel on the range of fuel spray was identified, which will make it possible to determine the appropriate control parameters to achieve optimum engine operating conditions. However, the related research should be expanded to include engine tests, in order to determine the optimum injection parameters to enable most efficient engine operating conditions, as well as a reduction in toxic exhaust gas emissions. As a result, it will be possible to use this type of fuel to power compression ignition engines, without costly changes to the structure of the fuel supply system, while decreasing the emission of toxic compounds contained in the the exhaust gases.

Author Contributions

Conceptualization, A.K. and A.U.; methodology, A.K. and A.U.; software, A.K. and A.U.; validation, A.U.; formal analysis, A.K. and A.U. investigation, A.U.; resources, A.K. and A.U.; data curation, A.K. and A.U.; writing—original draft preparation, A.K.; writing—review and editing, A.K. and A.U.; visualization, A.K.; supervision, A.U. All authors have read and agreed to the published version of the manuscript.

Funding

This research received no external funding. The APC was funded by Rzeszow University of Technology.

Institutional Review Board Statement

Not applicable.

Informed Consent Statement

Not applicable.

Data Availability Statement

Data are contained within the article.

Acknowledgments

The authors wish to acknowledge the Polish Ministry of Education and Science and the Rzeszow University of Technology for supporting this research.

Conflicts of Interest

The authors declare no conflict of interest.

Abbreviations

COCarbon monoxide
CO2Carbon dioxide
HCHydrocarbons
NOxNitrogen oxides
PMParticulate matter

References

  1. Cardone, M.; Marialto, R.; Ianniello, R.; Lazzaro, M.; Di Blasio, G. Spray Analysis and Combustion Assessment of Diesel-LPG Fuel Blends in Compression Ignition Engine. Fuels 2021, 2, 1–15. [Google Scholar] [CrossRef]
  2. Glensor, K.; Muñoz, B.M.R. Life-Cycle Assessment of Brazilian Transport Biofuel and Electrification Pathways. Sustainability 2019, 11, 6332. [Google Scholar] [CrossRef]
  3. Imran, S.; Emberson, D.; Hussain, A.; Ali, H.; Ihracska, B.; Korakianitis, T. Performance and specific emissions contours throughout the operating range of hydrogen-fueled compression ignition engine with diesel and RME pilot fuels. Alex. Eng. J. 2015, 54, 303–314. [Google Scholar] [CrossRef]
  4. Channappagoudra, M.; Ramesh, K.; Manavendra, G. Comparative study of standard engine and modified engine with different piston bowl geometries operated with B20 fuel blend. Renew. Energy 2019, 133, 216–232. [Google Scholar] [CrossRef]
  5. Loganathan, S.; Martin, M.L.J.; Nagalingam, B.; Prabhu, L. Heat release rate and performance simulation of DME fuelled diesel engine using oxygenate correction factor and load correction factor in double Wiebe function. Energy 2018, 150, 77–91. [Google Scholar] [CrossRef]
  6. Yesilyurt, M.K. The effects of the fuel injection pressure on the performance and emission characteristics of a diesel engine fuelled with waste cooking oil biodiesel-diesel blends. Renew. Energy 2019, 132, 649–666. [Google Scholar] [CrossRef]
  7. Karwade, A.; Thombre, S.; Bhiogade, G. Investigations on premixed charge compression ignition type combustion using butanol-diesel blends. J. Therm. Sci. Technol. 2020, 15, JTST0026. [Google Scholar] [CrossRef]
  8. Sitnik, L.J.; Sroka, Z.J.; Andrych-Zalewska, M. The Impact on Emissions When an Engine Is Run on Fuel with a High Heavy Alcohol Content. Energies 2021, 14, 41. [Google Scholar] [CrossRef]
  9. Brandão, L.F.P.; Suarez, P.A.Z. Study of Kinematic Viscosity, Volatility and Ignition Quality Properties of Butanol/Diesel Blends. Braz. J. Chem. Eng. 2018, 35, 1405–1414. [Google Scholar] [CrossRef]
  10. Nithyanandan, K.; Zhang, J.; Li, Y.; Wu, H.; Lee, T.H.; Lin, Y.; Lee, C.-F.F. Improved SI engine efficiency using Acetone–Butanol–Ethanol (ABE). Fuel 2019, 174, 333–343. [Google Scholar] [CrossRef] [Green Version]
  11. Prasad, K.S.; Rao, S.S.; Raju, V. Effect of compression ratio and fuel injection pressure on the characteristics of a CI engine operating with butanol/diesel blends. Alex. Eng. J. 2021, 60, 1183–1197. [Google Scholar] [CrossRef]
  12. Kuszewski, H. ‘Experimental investigation of the effect of ambient gas temperature on the autoignition properties of ethanol–diesel fuel blends’. Fuel 2018, 214, 26–38. [Google Scholar] [CrossRef]
  13. Lapuerta, M.; Ramos, Á.; Barba, J.; Fernández-Rodríguez, D. Cold- and warm-temperature emissions assessment of n-butanol blends in a Euro 6 vehicle. Appl. Energy 2018, 218, 173–183. [Google Scholar] [CrossRef]
  14. Taghizadeh-Alisaraei, A.; Rezaei-Asl, A. The effect of added ethanol to diesel fuel on performance, vibration, combustion and knocking of a CI engine. Fuel 2016, 185, 718–733. [Google Scholar] [CrossRef]
  15. Kuszewski, H.; Krzemiński, A.; Ustrzycki, A. Wpływ zawodnienia alkoholu na pochodną liczbę cetanową mieszaniny oleju napędowego z etanolem oraz dodatkiem dodekanolu. In Monografia Systemy i Środki Transportu Samochodowego; Oficyna wydawnicza Politechniki Rzeszowskiej: Rzeszów, Poland, 2017. [Google Scholar]
  16. Baczewski, K.; Kałdoński, T. Paliwa do Silników o Zapłonie Samoczynnym; WKŁ: Warszawa, Poland, 2008; ISBN 978-83-206-1705-4. [Google Scholar]
  17. Laza, T.; Bereczky, A. Basic fuel properties of rapeseed oil-higher alcohols blends. Fuel 2011, 90, 803–810. [Google Scholar] [CrossRef]
  18. Hansen, A.C.; Zhang, Q.; Lyne, P.W. Ethanol–diesel fuel blends—A review. Bioresour. Technol. 2005, 96, 277–285. [Google Scholar] [CrossRef] [PubMed]
  19. Lapuerta, M.; Armas, O.; Herreros, J.M. Emissions from a diesel–bioethanol blend in an automotive diesel engine. Fuel 2008, 87, 25–31. [Google Scholar] [CrossRef]
  20. Kuszewski, H.; Jaworski, A.; Ustrzycki, A. Lubricity of ethanol–diesel blends—Study with the HFRR method. Fuel 2017, 208, 491–498. [Google Scholar] [CrossRef]
  21. Li, D.-G.; Zhen, H.; Xingcai, L.; Wu-Gao, Z.; Jian-Guang, Y. Physico-chemical properties of ethanol–diesel blend fuel and its effect on performance and emissions of diesel engines. Renew. Energy 2005, 30, 967–976. [Google Scholar] [CrossRef]
  22. Tutak, W.; Lukács, K.; Szwaja, S.; Bereczky, A. Alcohol–diesel fuel combustion in the compression ignition engine. Fuel 2015, 154, 196–206. [Google Scholar] [CrossRef]
  23. Torres-Jimenez, E.; Jerman, M.S.; Gregorc, A.; Lisec, I.; Dorado, M.P.; Kegl, B. Physical and chemical properties of ethanol–diesel fuel blends. Fuel 2011, 90, 795–802. [Google Scholar] [CrossRef]
  24. Gnanamoorthi, V.; Devaradjane, G. Effect of compression ratio on the performance, combustion and emission of DI diesel engine fueled with ethanol–Diesel blend. J. Energy Inst. 2015, 88, 19–26. [Google Scholar] [CrossRef]
  25. Kuszewski, H.; Jaworski, A.; Ustrzycki, A.; Lejda, K.; Balawender, K.; Woś, P. Use of the constant volume combustion chamber to examine the properties of autoignition and derived cetane number of mixtures of diesel fuel and ethanol. Fuel 2017, 200, 564–575. [Google Scholar] [CrossRef]
  26. Murcak, A.; Haşimoğlu, C.; Çevik, I.; Kahraman, H. Effect of injection timing to performance of a diesel engine fuelled with different diesel–ethanol mixtures. Fuel 2015, 153, 569–577. [Google Scholar] [CrossRef]
  27. Yilmaz, N.; Ileri, E.; Atmanlı, A.; Karaoglan, A.D.; Okkan, U.; Kocak, M.S. Predicting the Engine Performance and Exhaust Emissions of a Diesel Engine Fueled with Hazelnut Oil Methyl Ester: The Performance Comparison of Response Surface Methodology and LSSVM. J. Energy Resour. Technol. 2016, 138, 052206. [Google Scholar] [CrossRef]
  28. Zabaniotou, A.; Ioannidou, O.; Skoulou, V. Rapeseed residues utilization for energy and 2nd generation biofuels. Fuel 2008, 87, 1492–1502. [Google Scholar] [CrossRef]
  29. Zhu, L.; Cheung, C.; Zhang, W.; Huang, Z. Emissions characteristics of a diesel engine operating on biodiesel and biodiesel blended with ethanol and methanol. Sci. Total. Environ. 2010, 408, 914–921. [Google Scholar] [CrossRef]
  30. Gao, Z.; Lin, S.; Ji, J.; Li, M. An experimental study on combustion performance and flame spread characteristics over liquid diesel and ethanol-diesel blended fuel. Energy 2019, 170, 349–355. [Google Scholar] [CrossRef]
  31. Hulwan, D.B.; Joshi, S.V. Performance, emission and combustion characteristic of a multicylinder DI diesel engine running on diesel–ethanol–biodiesel blends of high ethanol content. Appl. Energy 2011, 88, 5042–5055. [Google Scholar] [CrossRef]
  32. Park, S.H.; Youn, I.M.; Lee, C.S. Influence of ethanol blends on the combustion performance and exhaust emission characteristics of a four-cylinder diesel engine at various engine loads and injection timings. Fuel 2011, 90, 748–755. [Google Scholar] [CrossRef]
  33. Lotko, W. Self-Ignition Delay and Control Parameters of Diesel Engines for Different Vehicle Feeding Systems and Different Fuels. Adv. Sci. Technol. Res. J. 2021, 15, 245–254. [Google Scholar] [CrossRef]
  34. Kostas, J.; Honnery, D.; Soria, J. Time resolved measurements of the initial stages of fuel spray penetration. Fuel 2009, 88, 2225–2237. [Google Scholar] [CrossRef]
  35. Shao, J.; Yan, Y. Digital Imaging Based Measurement of Diesel Spray Characteristics. IEEE Trans. Instrum. Meas. Technol. Conf. Proc. 2008, 57, 9. [Google Scholar]
  36. Kuszewski, H.; Lejda, K.; Szlachta, Z. The analysis of spray parameters of fuels of different viscosity sprayed by a typical and rotary-swinging needle injectors. Combust. Engines 2004, 119, 23–31. [Google Scholar] [CrossRef]
  37. Ochęduszko, S. Termodynamika Stosowana; WNT: Warsaw, Poland, 1974. [Google Scholar]
  38. Atmanli, A.; Ileri, E.; Yuksel, B.; Yilmaz, N. Extensive analyses of diesel–vegetable oil– n -butanol ternary blends in a diesel engine. Appl. Energy 2015, 145, 155–162. [Google Scholar] [CrossRef]
  39. Desantes, J.; Payri, R.; Salvador, F.; Gil, A. Development and validation of a theoretical model for diesel spray penetration. Fuel 2006, 85, 910–917. [Google Scholar] [CrossRef]
  40. Brzeżański, M. Carbon dioxide emissions in the aspect of applied engine fuels. Combust. Engines 2007, 131, 62–67. [Google Scholar] [CrossRef]
  41. Pielecha, I.; Czajka, J.; BOROWSKI, P.; Wisłocki, K. Research-based assessment of the influence of hydrocarbon fuel atomization on the formation of self-ignition spots and the course of pre-flame processes. Combust. Engines 2014, 157, 22–35. [Google Scholar] [CrossRef]
  42. Pischinger, R.; Klell, M.; Sams, T. Thermodynamik der Verbrennungskraftmaschine; Springer: Berlin/Heidelberg, Germany, 2009. [Google Scholar] [CrossRef]
  43. Wisłocki, K. Studium Wykorzystania Badań Optycznych do Analizy Procesów Wtrysku i Spalania w Silnikach o Zapłonie Samoczynnym. Ph.D. Thesis, Wydawnictwo Politechniki Poznańskiej, Poznań, Poland, 2004. Rozprawa nr 387. [Google Scholar]
  44. Yanowitz, J.; Ratcliff, M.A.; McCormick, R.L.; Taylor, J.D.; Murphy, M.J. Compendium of Experimental Cetane Numbers; Tech-nical Report NREL/TP-5400-61693; National Renewable Energy Laboratory: Denver, CO, USA, 2014. [Google Scholar]
  45. Al-Esawi, N.; Al Qubeissi, M.; Kolodnytska, R. The Impact of Biodiesel Fuel and Ethanol/Diesel Blends. Energies 2019, 12, 1804. [Google Scholar] [CrossRef]
  46. Razzaq, L.; Farooq, M.; Mujtaba, M.; Sher, F.; Farhan, M.; Hassan, M.; Soudagar, M.; Atabani, A.; Kalam, M.; Imran, M. Modeling Viscosity and Density of Ethanol-Diesel-Biodiesel Ternary Blends for Sustainable Environment. Sustainability 2020, 12, 5186. [Google Scholar] [CrossRef]
  47. Kumar, B.R.; Saravanan, S. Use of higher alcohol biofuels in diesel engines: A review. Renew. Sustain. Energy Rev. 2016, 60, 84–115. [Google Scholar] [CrossRef]
  48. Kwanchareon, P.; Luengnaruemitchai, A.; Jai-In, S. Solubility of a diesel–biodiesel–ethanol blend, its fuel properties, and its emission characteristics from diesel engine. Fuel 2007, 86, 1053–1061. [Google Scholar] [CrossRef]
  49. Instrukcja Obsługi Aparatu HVU 482; Inkom Instruments: Warszawa, Poland, 2011.
  50. Krzemiński, A.; Lejda, K.; Ustrzycki, A. Influence of dodecanol addition on the energy value of diesel oil mixture with ethanol. Висник Нацioнальнoгo Транспoртнoгo Унiверситетую 2019, 3, 67–73. [Google Scholar]
  51. Karta Charakterystyki: Alkohol Etylowy Całkowicie Skażony; Alpinus: Miszewko, Poland, 2016.
  52. Karta Charakterystyki: 1-Dodekanol ≥98% do Syntezy; Carl Roth GmbH + Co KG: Karlsruhe, Germany, 2016.
  53. Kuszewski, H.; Krzemiński, A.; Ustrzycki, A. Metodyka Badań Wizyjnych Rozwoju Strugi Paliwa Generowanej Przez Wysokociśnieniowy Układ Wtryskowy; Oficyna wydawnicza Politechniki Rzeszowskiej: Rzeszów, Poland, 2020. [Google Scholar]
  54. Zięba, A. Pracownia Fizyczna Wydziału Fizyki i Techniki Jądrowej; AGH: Kraków, Poland, 2002. [Google Scholar]
  55. Przewodnik Głównego Urzędu Miar: Wyrażanie Niepewności Pomiaru; Główny Urząd Miar: Warszawa, Poland, 1999.
  56. Payri, F.; Payri, R.; Salvador, F.J.; Martínez-López, J. A contribution to the understanding of cavitation effects in Diesel injector nozzles through a combined experimental and computational investigation. Comput. Fluids 2012, 58, 88–101. [Google Scholar] [CrossRef]
  57. Wang, C.; Li, G.-X.; Sun, Z.-Y.; Wang, L.; Sun, S.-P.; Gu, J.-J.; Wu, X.-J. Effects of structure parameters on flow and cavitation characteristics within control valve of fuel injector for modern diesel engine. Energy Convers. Manag. 2016, 124, 104–115. [Google Scholar] [CrossRef]
Figure 1. Workstation for visualisation of fuel injection process [53].
Energies 16 01768 g001
Figure 2. Image of injector frame taken with thermographic camera during a heating process—the rectangle indicates the area of temperature monitoring. The temperature given in the figure refers to its maximum value in area marked with a white rectangle [53].
Energies 16 01768 g002
Figure 3. Schematic representation of the visualisation test station: 1—fuel tank with level sensor, 2—thermocouples, 3—feed pump, 4—fuel filter, 5—feed pump pressure regulator, 6—pressure indicator, 7—fuel coolers, 8—high pressure pump, 9—pressure accumulator, 10—pressure regulator, 11—flow meter, 12—water pressure regulator, 13—water pressure indicator, 14—electronic valves for controlling the water flow in the coolers, 15—injector, 16—visualisation chamber, 17—thermographic camera, 18—high-speed camera.
Energies 16 01768 g003
Figure 4. Visualisation chamber with installed LED lamps and high-speed camera.
Energies 16 01768 g004
Figure 5. The method applied to measure the range of the first spray: L1—measured the range of the first spray.
Energies 16 01768 g005
Figure 6. An example of spray evolution registered for ON + ET5 mixture, at a pressure of 125 MPa. The photo numbers indicate successive frames of the recorded film of the injection process.
Energies 16 01768 g006
Figure 7. The compared kinematic viscosity values in the fuels investigated.
Energies 16 01768 g007
Figure 8. The compared mean values of the maximum spray range of the fuels investigated.
Energies 16 01768 g008
Figure 9. Maximum range of spray tip with the trend line determined for injection pressure of 75 MPa.
Energies 16 01768 g009
Figure 10. Maximum range of spray tip with the trend line determined for injection pressure of 100 MPa.
Energies 16 01768 g010
Figure 11. Maximum range of spray tip with the trend line determined for injection pressure of 125 MPa.
Energies 16 01768 g011
Table 1. List of fuels subjected to tests.
NoType of FuelPercentage [% v/v]
Diesel OilEthanolDodecanol
1ON10000
2ON + ET59555
3ON + ET1090105
4ON + ET1585155
5ON + ET2080205
6ON + ET2575255
7ON + ET3065305
Table 2. Basic properties of ethyl alcohol [51].
Name of ParameterUnitValue
Alcohol content at 20 °C%99.9
Densityg/cm30.7897
Autoignition point°C425
Water content%(m/m)≤0.1
Ester contentmg/100 cm3<0.2
Methanolmg/100 cm3<0.6
Table 3. Basic properties of dodecanol [52].
Name of ParameterUnitValue
Density at 16 °Cg/cm30.9
Autoignition point°C275
Solubility in water at 25 °Cg/L0.037
Melting/solidification point at 101.3 kPa°C24
Flash point at 101.3 kPa°C134.8
Disclaimer/Publisher’s Note: The statements, opinions and data contained in all publications are solely those of the individual author(s) and contributor(s) and not of MDPI and/or the editor(s). MDPI and/or the editor(s) disclaim responsibility for any injury to people or property resulting from any ideas, methods, instructions or products referred to in the content.

