Abstract
Growing environmental and climate problems in the contemporary world necessitate the search for efficient solutions, including changes in agriculture, which has been reflected in the new package of reforms of the EU climate policy, called the European Green Deal (the EGD). Agriculture and rural areas play an essential role in the attainment of the EGD goals, and one of the prerequisites for an effective implementation of the EGD assumptions is to recognize the mechanism underlying the activity of agricultural farms in the scope of pro-environmental measures implemented under the Common Agricultural Policy (CAP). This article presents an endeavour to make a multidimensional evaluation of the spatial diversification in such activities, using Polish farms as an example. Compared to other EU member states, Poland is a country where agriculture remains a substantial sector in the national economy. This research is based on data from several institutions, including the Central Statistical Office (CSO) and the Agency for Restructuring and Modernisation of Agriculture (ARMA), responsible for the allocation of funds from the EU budget and for providing support to the development of agriculture and rural areas. The level and structure of the absorption of funds from the CAP underwent analysis, including three pro-environmental measures of the Rural Development Programme: organic farming (OF), agri-environment climate measure (AECM), and afforestation and creation of forest areas (ACFA). In order to achieve a holistic approach to these measures, an innovative analytical model was developed. It can be applied to analyses on a regional, national, and European level, and it is based on several novel indicators, as well as advanced statistical and spatial analyses. The research demonstrates that the pro-environment activities of farmers are characterized by a significant geographical diversity. The most active in soliciting payments from the CAP were agricultural farms with a high level of pro-environment internal characteristics of agriculture (IPEAF = 30.1%, with national average = 11.6%). With regard to anthropogenic determinants, relatively higher values of the IPEAF indicator were found in the municipalities with a lower level of socio-economic development (12.1%) and those located in northern and western Poland, within the borders of the former Prussian Partition (18.6%), characterised by higher farming culture. The research results imply that the effectiveness of the up-to-date solutions needs to be improved, also by taking into consideration the endogenous conditions and potential of individual territorial units. The research results also prove the expediency of implementing the European Green Deal. Conducting an analysis of the pro-environmental activity of farms, taking into account both the applications of the current CAP financial perspective and those resulting from follow-up activities regarding the previous perspective, is an innovative approach to the issue.
1. Introduction
Running a policy that will take into account both demands of the natural environment and human society goals calls for a compromise between agricultural producers—whose aim is to maximise the effects of their work—and the best interest of the whole society, where taking good care of the environment is a prominent objective. Under the Common Agricultural Policy (CAP), the concept of agriculture is being redefined, from a typical production approach towards the holistic, sustainable, and rational management of natural resources, considered to be specially protected public assets [1,2]. The CAP goal associated with the promotion of eco-friendly agricultural practices in all European Union member states is pursued through the implementation of the measures contained in the Rural Development Programme for the years 2014–2020 (RDP 2014–2020), such as the Agri-Environment Climate Measure (AECM), Organic Farming (OF), as well as the Afforestation and Creation of Forest Areas (ACFA). They are partly a continuation of the measures from the previous RDP, i.e., for the years 2007–2013. Moreover, they are foreseen to be continued in the years 2021–2027 as one of the components for the implementation of the EU and national environmental objectives that take into account the economic and social importance of agriculture, including its role in the bioeconomy [3]. The three measures mentioned above are the key financial instruments to encourage farmers to continue or launch pro-environmental agricultural practices that lead to the greening of agricultural production and sustainable development of rural areas. Thus, the evaluation of their role in the context of sustainable development of rural areas and attainment of the goals set in the European Green Deal (EGD) remains essential. Hence, the main purpose of this article is to present a multifaceted assessment of spatial differences in the engagement of farms with regards the implementation of pro-environmental CAP measures, alongside the identification of conditions that determine the above spatial distribution. The research took into account several groups of conditions (natural, ecological, agricultural, urban development, socio-economic, and historic), which enable an in-depth analysis of the process of implementing particular measures. In order to arrive at a holistic approach to the implemented measures, a model was developed that allowed us to accomplish a multifactorial analysis on the basis of several diagnostic features and indicators. Moreover, attention was drawn to the key issues concerning the greening of agriculture, that is to what extent it is possible to achieve the set objectives, and whether the current incentives are sufficient and promote the pro-environmental attitude of agricultural farms, or if the activity of farms is affected by specific conditions and endogenous potential of particular territorial units, and if there is a need to create further incentives for farmers in order to stimulate more intensive implementation of environmental measures.
The analysis designed, as described above, is part of wider research conducted by the authors in order to identify the mechanism of shaping the spatial distribution of farmland entitled to pro-environmental CAP subsidies, and to study the potential for a further growth in the share of such farmland in the total area of agricultural land, which agrees with the EGD recommendations. The implementation of the EGD concept can provide a significant stimulus for the growth of the Polish agriculture, which is distinguished by the predominance of small family farms (the average surface area of farmland is around 10 ha), and the agricultural production is often extensive in character, preserving biodiversity [4,5]. The authors believe that it is necessary to search for new tools that will facilitate a reliable assessment of initiatives undertaken for the sake of rational management of natural resources in the agricultural sector [6]. Thus, the analysis presented in this paper contributes to the search and development of a set of instruments required for the implementation of the CAP pro-environmental measures.
The authors concluded that there is a research gap and, thus, a need for research that will address the spatial correlation between the implementation of pro-environmental measures and environmental indicators on a large spatial scale in order to explain the impact of payments for the analyzed activities on achieving environmental goals, especially in the context of current EU policies targeted at EGD. In connection with the above, the authors proposed a new approach and extension of the traditional spatial analysis of farmland covered by CAP payments (concerning individual measures, packages, and variants) with a synthetic approach covering support for all pro-environmental measures implemented under the RDP. In addition, a proprietary model was developed that enables multi-factor analysis based on a number of diagnostic features and indicators, distinguishing the study from previous approaches in the literature. A wide range of determinants was used for the assessment, both determined by the internal characteristics of agriculture (results of the latest National Census in Agriculture) and external conditions, natural and non-natural (taking into account the historical factor is particularly innovative). Reference was also made to the assumptions of the EGD, presenting an innovative proposal to analyze not only the support for organic farming, but also agri-environmental measures and measures aimed at afforestation of agricultural land.
The paper presents an overview of existing approaches to the issues of green economy and green agriculture. Reference was also made to the EU’s previous approaches to the CAP, especially in respect of payments for green practices. Research results and determinants of spatial differentiation in the indicator of pro-environmental activity of farms were presented and interpreted.
2. Green Agriculture and Sustainable Development in the Light of the CAP Policy
The issues related to the concept of the green economy and sustainable use of resources are increasingly discussed by researchers [7,8,9,10,11]. In recent decades, new terms like “green economy”, “green agriculture”, “green growth”, or “green order” have become part of the scientific discourse, underlying the relation of the economy to the biosphere [12]. The so-called “greening” of strategies and policies of development involves various levels of territorial structures and various industries; it is also a subject of discussions about the policies shaping the concept of sustainable development on all levels: global, European, domestic, and regional [10,13].
Activities following from pro-environment practices are undertaken in the context of promoting agricultural production based on methods conforming to the requirements of environmental protection and ecology [14,15], as well as sustainable development and bioeconomy [16,17,18,19,20]. It is also important to raise ecological awareness among rural communities [21,22].
Although the CAP has been allocated nearly 25% of the EU budget [23], it has not provided sufficient protection to farmers or the environment, which agricultural production relies on. Despite the fact that since 2013 climate measures have been among the main objectives of the CAP, the EUR 100 bn designated towards that aim in the years 2014–2020 has not adequately affected the emissions from agriculture and has had little impact on the mitigation of climate change. The CAP does not strive to limit the population of farm animals, but, for instance, supports the farmers who cultivate drained wetlands. Poland, along with Germany and Romania, is the largest EU CO2 emitter from drained organic soils [24]. The objective of short- and medium-term measures undertaken as part of the EGD is to ensure all of the member states manage climate neutral economies of zero gas emissions [25,26]. More than 80% of the direct payments is allocated to 20% largest farms, thereby promoting intensive farming. As a result, many farms have terminated activity, which has particularly struck the Polish agriculture, where one in three farms has ceased to exist (a drop from 2 million to 1.3 million) since the onset of the economic transformation. In the last 40 years, due to the growth of industrial agriculture, Europe has lost 60% of birds living on farmlands, which has significantly decreased biodiversity. The necessity for a change, signalled by many professionals, has led to the CAP taking greater care of the environmental and climate issues. There are calls for the reorientation of the policy and funds so that they are directed to a larger extent to these farms which base their production on methods protecting the environment: soil, water, insects, and whole ecosystems, as well as the wellbeing of the animals.
In light of the growing ecological problems and challenges, pro-environment measures should be intensified in the economy, particularly in agriculture. This is why the European Commission has presented a far-reaching vision of a sustainable economy under the umbrella of the European Green Deal (EGD) [27,28]. It is a packet of political initiatives and strategies which assume deep transformation in all sectors of the economy. Its implementation will demand a holistic, cross-sector approach in tightly related areas, like climate policy, environment, energy, transport, industry, agriculture, or sustainable financing. It spans many initiatives, including further development of green energy sources, ecological transformation, reduction of greenhouse gas emissions, decarbonisation, climate neutrality, rebuilding of biodiversity, provision of food security, moving to circular economy, promotion of sustainable forestry, or measures towards the development of organic farming [29]. Furthermore, Ref. [30] recognised the EGD as ‘a social vaccine’ to overcome the COVID-19 health and economic crisis, since the commitment towards zero emissions is to involve all sectors. Meeting the objectives set in the EGD requires giving priority to the protection and restoration of natural ecosystems, as well as an effective and sustainable use of resources and improvement in public health. These are the areas where—according to the European Commission—the deepest transformation is necessary, and where such transformation can bring the greatest benefits to the society, economy, and the natural environment [24]. Among the essential elements of the EGD policy, aiming for climate neutrality by year 2050, is the creation of a healthy, fair, and eco-friendly system of food provision (the “Farm to Fork” Strategy), and the protection and restoration of ecosystems and biodiversity [31,32]. These strategies are firmly oriented towards sustainable development [33] and, at the same time, pose a series of challenges that the community will have to handle in the nearest 10 years: a reduction in the use of chemical pesticides in crops and antibiotics in animal rearing by half; a reduction of fertilizers by 20%; the allocation of at least 25% of the arable land for organic farming, and setting out 10% of the agricultural land to leave it to nature in the form of areas of high biodiversity, like inter-field tree planting or buffer zones. The key issue is to translate these general aspirations into specific measures. Through an adequate allocation of funds, the CAP should furnish the member states with specific instruments to achieve these aims. Funds within the CAP should be allocated to incentivise the farmers financially to manage their farms in a manner protecting, or even restoring the natural environment. The challenges set for the member states of the community related to this new “green policy” in terms of objectives for agriculture are of particular importance to Poland, where agriculture, compared to most other EU states, is still a significant sector of the economy. In terms of the proportion of arable land in the total area of the country (56%), Poland is third in Europe, after France and Spain. In 2018, the global worth of production by Polish agricultural farms made Poland the seventh largest in the EU, after France, Germany, Italy, Spain, the UK, and the Netherlands [34,35].
This approach gives priority to counteracting climate change, which makes maintaining extensive and bio-diverse agricultural systems more important than the productive (market oriented) efficiency of agriculture [13,36,37]. It justifies directing EU funds to support pro-environment measures in agriculture [18,38,39]. However, many measures taken hitherto indicate that the present mechanism of EU payments in this regard does not always guarantee the achievement of the assumed pro-environment effects [21,40,41]. A question arises then whether the new CAP will make it possible to realise the ecological and social assumptions, like the “From Farm to Fork” strategy, and meet the proposals made within the EGD. Given that agri-environment-climate measures (AECM), organic farming (OF), and the creation of forest areas (ACFA) are not accomplished everywhere—particularly in the scope raised in the present article—there is a need for further research to answer pressing questions. This involves both a search for optimal solutions based on the catalogue of good practices in agriculture, and the acquisition of scientific evidence. According to [42], as a future research direction concerning agricultural competitiveness, it would be worth studying the paradox of conflicting objectives. It occurs when, on the one hand, each country strives to improve its economic performance in terms of exporting agri-food products more efficiently by relying on price or volume strategies, and, on the other hand, the 2030 Agenda for Sustainable Development calls for achieving high food security levels through Goal 2—end hunger, achieve food security and improved nutrition, and promote sustainable agriculture.
3. Materials and Methods
As this article aims at a multi-faceted evaluation of the spatial diversity in the pro-environment activities of agricultural farms in Poland, we relied on a number of advanced methods of quantitative and qualitative analysis. The problem of the evaluation of the level and structure of absorption of pro-environment measures within the CAP has been undertaken by many authors, who indicate the effects of various factors, both urban, economic, and natural [43,44,45,46], as well as socio-economic and behavioural ones [47,48,49,50].
3.1. Research Design and Data Sources
The research procedure involved several stages: the design of the research, a review and analysis of the literature, the empirical part together with the statistical and mathematical analysis, as well as the collection and aggregation of data from the Agency for Restructuring and Modernisation of Agriculture (ARMA). This is a certified payment agency whose objective is to implement measures financed from the EU budget connected with the development of agriculture and rural areas. The analysis takes into account three pro-environment measures as part of the Rural Development Programme (RDP) directed at the development of the green farming and sustainable growth:
- Organic farming (OF), whose aim is to support voluntary obligations by farmers, who endeavour to maintain or begin organic practices and farming methods set out in Council Regulation (EC) No 834/2007 of 28 June 2007, on organic production and labelling of organic products and repealing Regulation (EEC) No 2092/91 [51];
- Agri-environment-climate measure (AECM)—the aim of this measure is to support practices contributing to the sustainable land management (to protect the soil, waters, and climate), protection of valuable habitats and endangered species of birds, protection of endangered genetic resources of crop plants and farm animals, as well as protection of the landscape diversity;
- Afforestation and creation of forest areas (ACFA), including the sub-measure “Afforestation and creation of forest areas in farmlands and other lands”—the aim of this form of support is to expand forest areas through the afforestation of the arable land of low utility to agriculture, which is usually unprofitable for agricultural production; this measure will contribute to the improvement of the natural environment, in particular through the positive impact on the climate, water retention, limiting water and wind erosion, as well as the improvement of leisure conditions and health of the society.
The main territorial unit assumed in the research were municipalities. These are the geographically smallest units of statistical records, as well as the basic units of the local government in Poland. There are urban, rural, and urban-rural municipalities. This approach allowed precise examination of local scale structures. In the duration of the research, of the general number of 2477 municipalities only 47 (1.9%), mainly urban municipalities (40), did not report pro-environment activities of agricultural farms.
3.2. Evaluation of the Level and Structure of Pro-Environment Activities of Agricultural Farms
The number of applications for the implementation of the measures in OF, AECM, and ACFA was assumed as an indicator of the pro-environment activities of agricultural farms. To construct a synthetic measurement of the activity level, an indicator of pro-environmental activity of farms (IPEAF) was designed. It was construed as the mean annual number of realised applications expressed as a percentage of the general number of agricultural farms. It was assumed that obligations regarding agricultural and environmental conduct are taken for the period of 5 years, and the research investigated the total number of 763,400 applications realised in years 2015–2019. The period covers applications financed from the financial perspective of 2014–2020 (56.4% of all applications) and those that followed from obligations made in the previous financial perspective 2007–2013 (the so-called continuation applications making up 43.6% of all the applications investigated for analysis) (Table 1). The continuation applications dominated in the years 2015 and 2016, and in the case of afforestation of farmland, they still dominated in the year 2019. As such discrepancies varied in particular years of the studied 5 year period, the basis for the objective measurement of the activities of agricultural farms was taken to be the annual mean number of realised applications (152,700). It must be noted that a particular farm may participate in several pro-environment measures, so the number of applications does not equal the number of farms.

Table 1.
Percentage of realised pro-environment applications in the years 2015–2019 (100% = 763.4 thousand applications).
Apart from the level of activity, the research also investigated the structure of applications covering the specific RDP instruments, i.e., organic farming (OF—25.7% of the total number of pro-environment applications), the agricultural-socio-climate measure (AECM—66.4%) and farmland afforestation (ACFA—7.9%). For this investigation, we relied on the d’Hondt method of subsequent divisors, which is often used in geographical and agricultural studies, as it allows the investigation of any structures. The method consists in dividing the percentages of particular elements making up the studied structure (100%) by subsequent numbers from 1 to n. This way the six largest divisors were calculated, to relatively reflect the share of a given element: 1—very low, 2—low, 3—significant, 4—high, 5—very high, and 6—dominant share in the structure. Combinations of the divisors enabled us to separate the main structural types. To simplify the generated spatial system, we grouped the divisors into high (divisors 5 and 6 together) and considerable share (divisors 3 and 4).
3.3. Delimitation of Conditions in Pro-Environment Activities of Agricultural Farms
The aim of the second stage of the empirical research was to achieve the spatial delimitation of the selected determinants impacting the scale and directions in which the RDP funds are used. They constitute an important instrument for the neo-endogenous development of rural areas, facilitating rational use of endogenous resources [52,53]. The selection of the determinants was based on the theoretical studies of agriculture geography, assuming an analysis of internal characteristics of agriculture (taking place in the agricultural farm and following from the farmer’s decision) compared to the external conditions of agriculture, both natural and anthropogenic (phenomena and processes independent of the farmer’s decisions, with an indirect impact on agriculture) [54].
To enable a multifaceted analysis of the RDP measures supporting the sustainable development of rural areas and rational use of natural resources, five groups of factors were selected. They composed the background for the interpretation of the results and explanation of the spatial diversity of the level and structure of the IPEAF indicator. They also enabled us to try and clarify any causal relations between the degree of absorption of the pro-environment RDP measures and the local conditions (endogenous resources) in particular administrative units. The following groups of factors (indicators) were singled out:
- (a)
- Natural conditions, including:
- a natural-agricultural indicator, based on the indicator of the agricultural production environment value (WjRpp) elaborated by the Institute of Plant Science and Cultivation in Puławy, which, upon a standardization procedure, allowed us to classify the municipalities into ones with the low (less than −0.50δ − 1 pt.), medium (+/−0.50δ − 2 pt.), and high level of these parameters (over 0.50δ − 3 pt.; see Table 2). This indicator underlays the evaluation of the natural environment in terms of the production potential for agriculture. It was assumed that the pro-environment RDP measures are pre-disposed for the areas with adverse natural conditions for agriculture, usually unprofitable for field agricultural production;
Table 2. Elements of evaluation of the spatial diversity in pro-environment activities of agricultural farms.
- a natural-ecological indicator, determined on the basis of the share of legally protected areas in the total area of municipalities. It was assumed that the pro-environment measures in agriculture should be realised first and foremost in the municipalities with a high percentage of naturally valuable areas covered by legal protection. Using the standardised values, municipalities were classified into those of low (1 pt.), medium (2 pts) and high (3 pts) share of protected areas.
- (b)
- Anthropogenic conditions:
- urbanisation indicator—based on the type of an administrative unit, classified into rural (1 pt.), urban-rural (2 pts), and urban municipalities (3 pts), which led to the evaluation of the impact of urbanisation on the pro-environment activity of agricultural farms;
- historical indicator—taking into account the historical and economic diversity of administrative units and the diversity of the Polish environment. We adopted this determinant because Poland, in the particularly important period of transition from the feudal to capitalist system (19th century), was partitioned between Austria, Prussia, and Russia, and each of the three countries differed significantly in the level and rate of economic progress. We assumed that that diversity still influences the contemporary farming culture in Poland. To evaluate this impact, we referred to the border delineation set up by the Congress of Vienna (1815), which lasted for over a hundred years, until the Versailles Treaty of 1919 after the First World War; the basis for the valuation was construed to be the year of the enfranchisement of peasants in the partitions, i.e., the year 1861 in the Russian Partition (1 pt.), 1848 in the Austrian Partition (2 pts), and 1811 in the Prussian Partition (the so-called Prussian regulatory reform) (3 pts);
- indicator of socio-economic development—based on the diversity among the administrative units in terms of the general level of socio-economic development. In line with the assumed research methodology, this indicator was construed as a standardised means of the diagnostic characteristics illustrating selected economic, social, infrastructural, economic, and income issues (see description for Table 2). By assigning each municipality to represent the low (1 pt.), medium (2 pts), or high level of development (3 pts), we could demonstrate whether the level of socio-economic development affects the pro-environment activities of agricultural farms.
Relying on the data of the National Census in Agriculture 2020 (PSR 2020), the research also investigated the internal characteristics of agriculture, based on six diagnostic features of agriculture (see description for Table 2), facilitating the pro-environment activities of agricultural farms. These features underwent a standardisation procedure (the Perkal indicator) and were expressed as a synthetic indicator. Bearing in mind the main objective of this research, the following assumptions were made: large farms were preferred (significant financial effect of pro-environment payments), with a high percentage of “green” forms of land use (woodlands, permanent grasslands), run by younger farmers, who are usually better educated and give priority to extensive forms of agricultural production (crops and animals) and a limited use of pesticides. In accordance with the assumed research methodology (standardised mean), we identified municipalities with low (1 pt.), medium (2 pts), and high (3 pts) preferences for pro-environment measures in agriculture.
3.4. Evaluation of the Impact of Conditions on the Level and Structure of Pro-Environment Activities in Agricultural Farms
The evaluation of the assumed conditions was carried out through a three-stage process. The first step was to analyse the mean value of the IPEAF indicator and the structural type with reference to the separate classes of conditions, expressed in the 3 point scale (low, medium, and high level). The calculated indicators and types led to the considerations on the impact of particular determinants, expressed in the framework of natural and anthropogenic conditions. The second step consisted of an analysis of the Pearson linear correlation coefficients, which enabled us to detect linear relationships between the level of pro-environment activities and the assumed conditions. The third element of the impact analysis of the assumed determinants on the pro-environment activities in agricultural farms was the structure and interpretation of a regressive model. A number of algorithms were tested, including Extra Trees, SupportVector Machine (SVM), XGBoost, and MultiLayer Perceptron (MLP). The model was based on the extremely randomised trees algorithm (Extra Trees) [55]. All of the descriptive characteristics were standardised (z-score). The hyper-parameters of the model (Table 3) were optimised with Bayesian optimisation against the RMSA metric, by way of cross-validation, 30 folds. All of the evaluated parameters of the model quality were based on the same cross-validation division.
Table 3.
Basic hyper-parameters of the construed Extra Trees model.
The impact of explanatory variables (predictors) on the target feature was investigated through testing the feature importance directly following from the model and best clearing the nodes in the trees. Additionally, a diagnostic examination was carried out to investigate the influence of the predictors on the IPEAF variable with the use of the Shapley’s values (SHAP), which enabled precise explanation of the impact of particular determinants on the target feature.
All calculations were made in the Python code (version 3.10.5) with libraries:
- Pandas (1.4.3)—entering and processing data;
- Matplotlib (3.5.2)—visualisation of data;
- Seaborn (0.11.2)—visualisation of data;
- Scikit-learn (1.1.2)—model building, model validation;
- Scikit-optimize (0.9.0)—searching for hyper-parameters with Bayesian optimisation;
- Shap (0.40.0)—explanation of the model operation and visualisation.
4. Results
A number of the analysed applications were characterised by a wide spatial diversity, both regionally and, even more importantly, locally, i.e., among municipalities. When it comes to the regions, the lowest score was earned by the most urbanised Śląskie Province (województwo śląskie) (1400 applications). The highest number of realised applications was noted in the Lubelskie Province (województwo lubelskie) (20,500 applications, Table 4).
Table 4.
Pro-environment RDP applications—regional diversity, level, and structure.
At the level of municipalities, most realised applications were in northern and eastern Poland, with the record number in 4 municipalities; Drawsko Pomorskie in Zachodniopomorskie Province (568 applications), Gołdap in Warmińsko-Mazurskie Province (692), Lubaczów (503), and Ustrzyki Dolne (723) in Podkarpackie Province (Figure 1).
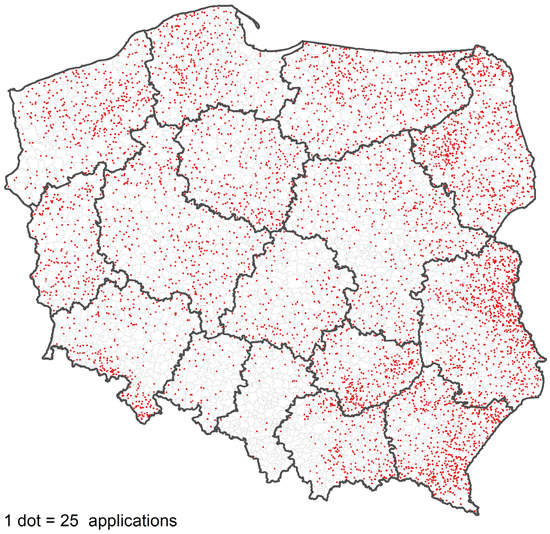
Figure 1.
Annual average number of pro-environment applications realised in agricultural farms. Source: developed by the authors, based on ARMA data.
In accordance with the d’Hondt method adopted here, the average combination of the share of pro-environment measures was E1 R5 (very low contribution of ecological agriculture against very high contribution of agricultural and environmental measures). A relationship showing the same combination as the average type for the country was also found in three provinces. In other regions, the relationships were characterised by a low percentage of ecological agriculture and high percentage of agri-environment activities (E2 R4—4 provinces); a very low share of both ecological agriculture and afforestation of land in the context of a high share of agri-environment activities (E1 R4 Z1—4 provinces); a significant share of ecological agriculture and pro-environment activity (E3 R3—1 province); and a dominant share of agri-environment activity (R6—4 provinces; Table 5).
Table 5.
Pro-environment measures in Polish agriculture—structural types.
More diverse relationships between the E/R/Z shares were noted at the level of municipalities (the total of 28 combinations were identified). Assuming the criterion of the dominant number of divisors, three primary types were classified:
- ecological agriculture (342 municipalities—14.1%);
- agri-environment-climate measures (1661 municipalities—68.2%);
- afforestation of land (206 municipalities—8.5%).
After a division into the dominant and very high share (5 or 6 divisors) and the greatest share (3 or 4 divisors), we identified a further 6 sub-types. We also separated a BW, characterised by the lack of any dominant share in any of the selected measures (224 municipalities—9.2% of the total, of which the most (157) had regard to the E3 R3 relation; Table 5).
Besides the evaluation of the spatial diversity in the number and structure of the realised applications, another element of the evaluation is the delimitation of the IPEAF indicator. The average value of this indicator in Poland stood at 11.6%. In the regional aggregate, it varied between 3.1% in Śląskie Province (Poland’s most urbanised region) to over 30% in three provinces: Lubuskie (30.4%), Warmińsko-Mazurskie (33.6%), and Zachodniopomorskie (36.7%). At the level of municipalities, the indicator took values from 0 (no applications found in 47 municipalities) to over 100% in 6 units: 2 in the urban municipalities of Górowo Iławeckie in Warmińsko-Mazurskie Province (258.6%) and Sejny in Podlaskie Province (133.0%), 2 in rural municipalities—Komańcza in Podkarpackie Province (110.0%) and Przybiernów in Zachodniopomorskie Province (109.9%), and 2 in the mixed urban-rural municipalities of Drawsko Pomorskie (109.9%) and Przybiernów (104.9%) in Zachodniopomorskie Province. The variability of this indicator is well illustrated by the number of municipalities classified into 5 percent bands, including a class below 5% (881 municipalities) and over 35% (260 municipalities, Figure 2).
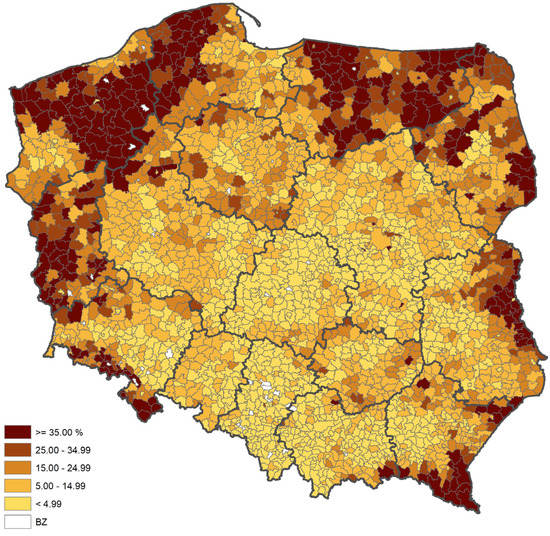
Figure 2.
Structural types of pro-environment activity of agricultural farms. Source: developed by the authors, based on ARMA data (description as in Table 5).
Determinants of Spatial Diversity in the Indicator of Pro-Environment Activity of Agricultural Farms
Another stage of the research involved a comparative analysis of the level and structure of pro-environment activity of agricultural farms (IPEAF) with reference to the assumed determinants within the framework of natural and anthropogenic conditions (external characteristics of agriculture) and internal characteristics of agriculture. Mutual relationships between the IPEAF indicator and the structural types versus the selected determinants led to an evaluation of their impact on the level of interest among farmers in the participation in pro-environment measures (Table 6, Figure 3).
Table 6.
Pro-environment RDP applications—conditions of spatial diversity.

Figure 3.
Indicator of pro-environment activity in agricultural farms (annual average number of applications E-R-Z as % of the number of agricultural farms). Source: developed by the authors, based on CSO and ARMA data.
Two indicators were accounted for in the group of natural determinants: indicators of natural-agricultural conditions and natural-ecological conditions. It was observed that the IPEAF indicator grows, together with a decrease in the indicator of natural-agricultural indicator (WjRpp from 14.3% in municipalities with the low level to 8.3% in municipalities with the high level of said indicator). The analysis of the structural types indicated a difference between the municipalities with the low (type E2 R4—very low proportion of ecological agriculture in the context of a very high proportion of the agri-environment programme) and the high level of conditions (type E1 R5—low proportion of ecological agriculture in the context of a high proportion of the agri-environment programme). The indicated elevation of the status of ecological agriculture was confirmed by the difference in its proportions in the total number of pro-environment applications, from 20.4% in municipalities with favourable natural conditions to agriculture (low level of conditions, 20.4%) to those where such conditions were classified as average or favourable (26.9% and 27.2%, respectively).
In the case of natural-ecological conditions, defined as a proportion of legally protected areas, there was a slight tendency of the IPEAF indicator to grow from 9.5% (low proportion) to 13–14% (medium and high proportion). A relatively low level of the indicator in municipalities with the high level of natural-ecological conditions, usually characterised by over 50% of the legally protected areas (reserves, national and landscape parks, etc.), was interpreted as unfavourable. In such municipalities, the significance and development of pro-environment measures should be an important feature of agriculture. Another drawback is the inadequate diversification of the structural types. In every class of conditions, the same type E1 R5 was identified, i.e., a very low share of ecological agriculture in the context of a very high share of the agri-environment-climate measures. It is particularly alarming that the highest proportion of organic farming was found in municipalities with a medium proportion of legally protected areas (28.0% versus 25.9% in municipalities with a high indicator of natural-ecological conditions).
Another objective of the analysis was to assess the impact of anthropogenic conditions on the level and structure of pro-environment activities of agricultural farms. To this end, we used both elements of quantitative (i.e., general level of socio-economic development determined with the Perkal indicator) and qualitative analysis (with reference to historical conditions and administrative types of municipalities). The analysis of the administrative types of municipalities did not suggest an impact of urbanisation on the level of the IPEAF indicator. Its highest level (12.5%) was noted in urban-rural municipalities representing a medium level of urbanisation. With reference to the structural types, a system different from the national average was found in urban municipalities. They are characterised by the afforestation level within their descriptive type E2 R3 Z1, i.e., a low proportion of organic farming, a high percentage of agri-environmental-climate measures, and a very low percentage of afforestation of farmland. We found that the elevated status of organic farming and afforestation of farmland in urban municipalities is a positive characteristic, attesting to the increasingly sustainable development of towns in Poland.
The analysis of the IPEAF indicator from the historical perspective indicated twice as high pro-environment activity of agricultural farms in northern and western Poland, i.e., in the former Prussian Partition (18.6%). This area was characterised by a positive evaluation of internal characteristics of agriculture, which is accompanied by a higher level of farming culture. In the municipalities in the former Russian and Austrian Partitions, this level was significantly lower (9.3% and 9.1%, respectively).
Another relationship investigated in the study was the level of the IPEAF with reference to the level of socio-economic development of municipalities. We noted a slight tendency of the IPEAF indicator to fall against the increasing level of socio-economic development. The lowest level of this indicator (8.8%) was found in municipalities with the high level of development, which included most cities and their suburban areas. We found this to be undesirable. Such municipalities should reinforce the pro-ecology functions and stand out for their high pro-environment activity, particularly in combination with the production of healthy food for the nearest agglomerations. The dominant structural type in the municipalities with the high level of development was E1 R4 Z1, characterised by a large proportion of agri-environmental activities in the presence of a very low share of organic farming and afforestation (this is the only type with the recorded share of forests).
The last analysed pair of relationships was the IPEAF indicator relative to the internal characteristics of agriculture. This relationship indicated a special position of the municipalities where the level of the IPEAF reached a high value (30.1%), more than three-fold higher than in municipalities where these characteristics are low or medium. This disproportion suggests that increasing the pro-environment activity of agricultural farms significantly depends on the changes in the spatial structure of agriculture. This is true mostly about the increase of the area of farms and strengthening the social capital in agriculture alongside the progressive extensification of agricultural production, especially in ecologically valuable areas, which are usually characterised by adverse conditions for agriculture. We also found positive relationships in the system of structural types from the dominance of agri-environment-climate activities in municipalities with the low level of the analysed characteristics (type R6) to a successively more pronounced role of organic farming in municipalities with the medium (type E1 R5) and high level (E2 R4).
The relationships between the IPEAF indicator and the assumed determinants were also analysed with the Pearson linear correlation coefficient (“r”). This analysis showed that the realisation of pro-environment RDP activities was more dependent on the internal characteristics of agriculture (r = 0.436—first place). Among the internal conditions of agriculture, the historical factor scored the highest (r = 0.259, second place). This corroborates the conclusion that the partitions of Poland between the three empires (Austria, Prussia, and Russia) still affects the geographical differences in the level of farming culture in Poland. This significantly translates into the pro-environment attitudes among farmers, particularly in the areas with unfavourable natural conditions (natural conditions for agriculture r = −0.195—third place). In the ranking of the determinants, the fourth place is held by natural-ecological conditions (r = 0.129). This relatively weak relationship of the IPEAF indicator with the areas of valuable nature (legally protected) should be interpreted as a weakness of the CAP, indicating that the implementation of pro-environment activities should be given preference.
No correlation was found with regard to the level of socio-economic development in municipalities or urbanisation conditions. This indicates a weak influence of the socio-economic environment on the pro-environment attitudes of farmers. Despite this weak impact on the level of the IPEAF indicators, the described determinants did affect the structure of the realised applications. This applies especially to the relatively higher proportion of afforestation of farmland in the more urbanised units.
The last stage of the evaluation of the impact of particular conditions was to interpret the results with the use of a regressive model (Appendix A contains selected parameters of the model). The chart of significance (Figure 4) shows that the characteristics which have the greatest effect on the pro-environment activities are: the level of agriculture development, the location of a farm in the former Prussian Partition, and the quality of the agricultural production environment. The correlations derived from the regressive model generally corroborate the findings achieved in the previous stages of the research. The other determinants are characterised by low significance (<0.1) of the impact on the target variable (Figure 4).

Figure 4.
Significance of determinants received from the correction of the node clarity. Source: developed by the authors, based on ARMA and CSO data.
The direction of the impact of particular determinants is shown by the Shapley values [56]. High values of SHAP indicate a positive impact on the increased values of the IPEAF. The analysis confirmed the most important significance of the level of agriculture, followed by historical and political legacy, and finally by the natural-agricultural conditions. The impact of subsequent determinants is significantly lower, but it can be concluded that: the lower indicator of the agricultural quality impacts the increased value of the IPEAF variable; higher proportions of legally protected areas and the urban-rural character of the municipality (compared to urban municipalities) have a positive impact on the IPEAF variable (Figure 5).
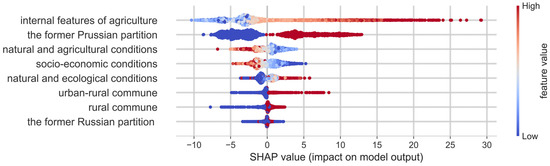
Figure 5.
Values of SHAP parameter for particular determinants. Source: developed by the authors, based on ARMA and CSO data.
The variability of the most important continuous characteristics, presenting the conditions (level of agriculture development, quality of production environment in agriculture, and level of socio-economic development) were also taken into account in order to investigate the degree of their impact on the IPEAF variable. In this evaluation, a nominal variable corresponding to the former historical and political divisions was entered, distinguishing the municipalities that used to belong to the Prussian Partition. The analysis indicated that the low values of agriculture development—below average—have a negative impact on the pro-environment activity in agricultural farms. When the level of agriculture development increases, it coincides with a rapid increase in the impact of this determinant on the IPEAF indicator. Moreover, it can be observed that among the municipalities which used to be located in the Prussian Partition, low values in agriculture development have a further negative impact on the number of applications; likewise, the higher the level of agriculture development, the larger the number of applications (Figure 6).

Figure 6.
Shapley values for the agriculture development variable. Source: developed by the authors, based on ARMA and CSO data.
The quality of the production environment in agriculture has a polynomial impact on the IPEAF variable. A low value of the natural conditions for agriculture has a neutral impact on the pro-environment activity of farmers. The analysis demonstrated that together with the increase in the WjRpp, the impact on the IPEAF variable becomes increasingly negative. In addition, the municipalities which were not in the Prussian Partition show a neutral impact on the activity of farmers running farms where the quality of the agricultural environment is the highest. The high correlations are still much weaker than obtained for the agricultural development level, as the SHAP values are in a narrower range (Figure 7).
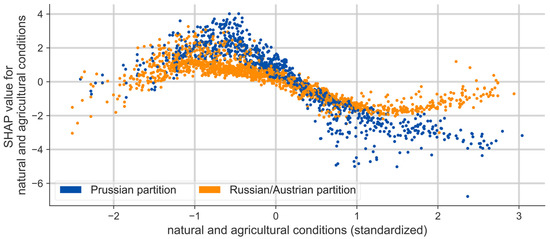
Figure 7.
Shapley values for the variable presenting the quality of production environment in agriculture. Source: developed by the authors, based on ARMA and CSO data.
A low level of socio-economic development of municipalities has a positive impact on the pro-environmental activity of agricultural farms. Along with the growth of the level of development, the impact on the IPEAF variable drops; the level of development of municipalities has a negative impact when this level is high (Figure 8).
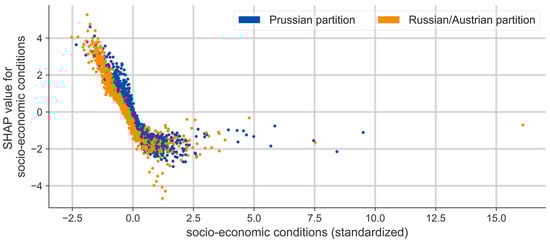
Figure 8.
Shapley values for the variable presenting the level of socio-economic development. Source: developed by the authors, based on ARMA and CSO data.
5. Discussion
The analysis presented in this article identifies the areas with the highest activity by farmers in the implementation of pro-environment measures, which significantly contributes to sustainable development and green farming. An attempt has been made to recognise the mechanism affecting the level of activity, which is of utmost importance because the pro-environment measures implemented within the CAP support the transition towards green farming and sustainable development. The analysis was based on a number of conditions which could influence the farmer’s motivation to adjust to ecological methods of land use. Many authors have endeavoured to assess the level and structure of the absorption of pro-environment CAP measures, by analysing the impact of various factors, such as urbanisation, economy, and nature [29,43,45], or socio-cultural and behavioural ones [47,48,49,50]. During the selection of the conditions determining the scale and direction of the RDP funds, we strove to include the widest possible spectrum of factors, but also felt the need to limit the number of indicators to a manageable set. This resulted in the selection of the applied methods and the aggregation of determinants in five groups of conditions, which—owing to their specificity—reflect the situation of Poland relatively well and create a comprehensive background to the analysis. The applied procedure and the elaborated model are highly universal and can be used in analyses concerning different geographical scales (local, regional, national, or international).
The spatial analysis demonstrates that pro-environment activities are more willingly implemented in the municipalities of northern and western Poland. These are attractive areas in terms of nature and ecology, characterised by high biodiversity, which are important to environmental management and the mitigation of climate change [57]. They also have a higher level of agriculture development, as they used to belong to the Prussian state, where agricultural reforms began the earliest. We have found that it is the widely understood level of agriculture that is of key importance. When this level rises, the number of submitted applications sees a rapid increase too. At the same time, these areas feature a lower level of urbanisation than central or southern Poland. It should be noted that unlike in other countries [58], the natural conditions often play a decisive role in Poland. A high level of transfers from pro-environment funding is observed in the areas characterised by high natural value and pro-ecological forms of land use, where the socio-economic progress has a limited potential [59]. This geographical allocation of activities by beneficiaries helps maintain the balance between resources of the environment and the demands of economy [60]. This trend is therefore an important element of the concept of sustainable development [61] and brings benefits to the natural environment and the society.
The analysis of the geographical allocation of pro-environment measures demonstrates that the exploitation of biodiversity in agriculture is pragmatic [62], which increases opportunity for sustainable use and good management of natural resources [14]. On the other hand, it also contributes to strengthening the natural ecosystem, which supports maintaining biodiversity on the farm and beyond [63]. In accordance with environmental, ecological, and agricultural preferences, as well as the economic potential, the territorial allocation of the AECM, OF, and ACFA measures should significantly reinforce the desired economic model of particular administrative units. It should be noticed, however, that the realization of pro-ecological activities by farmers is not only motivated by the care of the environment. Their attitudes and motivations do not only—or perhaps not mainly—follow from the economic factor, such as payments from the CAP. The evidence supporting this observation is the fact that large farms located in northern and western part of the country (Zachodniopomorskie, Warmińsk-Mazurskie, and Lubuskie Provinces) are more engaged in pro-ecology activities.
Despite the observed positive trends in the development of green farming, there is still a long way to meet the objectives set in the EGD. For example, organic farming, although it is one of the fastest developing sectors of the global agriculture [64], is still far from reaching the assumed level of 25%. In 2018, the proportion of organically grown crops to the total arable land in the EU was only 7.7% [65,66]. According to Eurostat data [67], the share of organic area in total utilised agricultural area in the EU in 2021 was 8.5% (the highest in Austria—25.3%). In Poland, this indicator is 3.5%, of which 0.8% is under conversion to organic farming. Among the EU Member States, the share of organic area in total utilised agricultural area is lower than in Poland only in Romania (2.9%), Bulgaria (2.3%), Ireland (1.6%), and Malta (0.5%). For comparison, in the Czech Republic this rate is 15.2%. To meet the desired effects, the list of incentives to farmers must be much longer than just payments from the CAP. It should include conscious consumers, care of the environment [68,69,70], effective market structures, know-how, and transfer of knowledge, etc. [71], as well as a rational pricing policy or promotion of the local consumption of food and seasonal produce. On the other hand, a question arises whether such a wide scale is necessary. There are suggestions how to produce a certain total amount of food, in terms of protein and calories, with organic agriculture but without increasing the cropped area, and how to make organic agriculture more environmentally friendly. For example, Ref. [72] suggested (a) the reduction of livestock feed from arable land with corresponding reduction in animal production and in the related natural resource use and environmental impacts; and (b) the reduction of food wastage, with correspondingly reduced production levels and impacts.
In the context of the issues raised in this article, one should not overlook the signals coming from the European Parliament, suggesting that the ambitious targets may be reduced. This concerns, among others, guaranteeing a minimum 60% of the budget for direct payments, limiting the funds for eco-schemes to just 30%, which repeats the analogous provisions regarding the greening of agriculture in the previous CAP, a serious weakening of the conditionality, e.g., through allowing further drainage of swamp areas and lifting the ban on transforming and ploughing permanent grasslands in Nature 2000 areas, or a complete absence of provisions on decreasing the stocking density in animal breeding. Another provision which may bring adverse effects is the regulation which determines the maximum amounts which member states may allocate to the environmental targets from the 2nd pillar. It should also be noted that there are no precise rules as to the distribution of funds, which may challenge the proper operation of the EU’s CAP [73].
6. Conclusions
The research results shown in this article present a novel approach to geographical analyses of pro-environment activities of agricultural farms as part of the Common Agricultural Policy in the EU. Analyses conducted in high geographical definition enabled us to identify the areas where the system of pro-environment management is widely accepted by farmers and applied to most arable land, which has a significant impact on the farm’s income. The research demonstrates that the pro-environmental activities of farmers are characterized by a significant geographical diversity. This follows from both internal characteristics of agriculture and the impact of many external conditions, both natural (like the quality of the production environment, proportion of legally protected areas) and anthropogenic ones (type of administrative units and their socio-economic character and historical legacy).
Compared to the average level in Poland (IPEAF = 11.6%), the most active in soliciting payments from the CAP were agricultural farms with a high level of pro-environment internal characteristics of agriculture (30.1%). In our evaluation of the impact of natural determinants, elevated values of the indicator were found in municipalities with natural conditions unfavourable for agriculture (14.3%) and with a higher proportion of nature valuable areas submitted to legal protection (14.0%). In turn, with regard to anthropogenic determinants, relatively higher values of the IPEAF indicator were found in the municipalities with a lower level of socio-economic development (12.1%) and those located in northern and western Poland—within the borders of the former Prussian Partition (18.6%)—characterised by higher farming culture.
The conducted analysis showed that pro-environmental activities are more willingly implemented in areas characterized by high natural values and pro-ecological forms of land use with a high level of biodiversity, which is important from the point of view of environmental management and climate change mitigation. These areas are also characterized by a higher level of agricultural development and historically belong to the former Prussian partition, where agricultural reforms began the fastest. In contrast to many other countries, natural conditions in Poland often play a decisive role.
The Polish agriculture has a great potential for the development of ‘white’ and ‘green’ functions, in line with the division proposed by [74]. This is particularly valid in relation to the development of wholesome, eco-friendly foods and the preservation of high natural values of the environment, but also to the high level of agrarian culture and possible afforestation (a large amount of land where afforestation is preferred). Measures towards the development of the food chain should therefore be strengthened, including production, processing, distribution, storage, and the management of subsequent stages, etc., to ensure food security and production of healthy food. The resources at our disposal clearly prefer the development of agriculture towards green farming and sustainable development, and, in a wider context, towards bio-economy.
The research results prove the expediency of Implementing the European Green Deal aimed at providing balanced nature management amidst decentralisation processes, i.e., implementation of activities locally, in accordance with the potential and resources of single territorial units. The complexity of the absorption process of the RDP funds and implementation of pro-environment measures is so high that further research is needed to explain the mechanisms of green farming and sustainable development. The results discussed in this paper are part of a series of publications and research conducted by the authors into the geographical diversity in the absorption of the EU funds in Poland. Accurate recognition of the mechanism of the pro-environment payments is particularly important for the implementation of the European Green Deal in agriculture. Currently, work is underway to prepare further publications on the implementation of pro-environmental measures, and some of the research results have already been published in several studies, e.g., [10,13,29].
Author Contributions
Conceptualization, R.R., M.B., Ł.W. and P.W.; methodology, R.R., M.B., Ł.W. and P.W.; software, R.R., M.B., Ł.W., P.W., S.B. and R.M.-B.; validation, R.R., M.B., Ł.W. and P.W; formal analysis, R.R., M.B., Ł.W. and P.W.; investigation, R.R., M.B., Ł.W. and P.W.; resources, R.R., M.B., Ł.W. and P.W.; data curation, R.R., M.B., Ł.W. and P.W.; writing—original draft preparation, R.R., M.B., Ł.W., P.W., S.B. and R.M.-B.; writing—review and editing, R.R., M.B., Ł.W., P.W., S.B. and R.M.-B.; visualization, R.R., M.B., Ł.W. and P.W.; supervision, R.R., M.B., Ł.W. and P.W.; project administration, R.R., P.W. and S.B.; funding acquisition, S.B. All authors have read and agreed to the published version of the manuscript.
Funding
The Article Processing Charge and article translation was funded by grant no. 30.610.013.-110 University of Warmia and Mazury in Olsztyn.
Institutional Review Board Statement
Not applicable.
Informed Consent Statement
Not applicable.
Data Availability Statement
Not applicable.
Acknowledgments
The authors would like to thank Krzysztof Leki from the Statistical Analysis Center of the Nicolaus Copernicus University in Torun for his support in the field of statistics and data mining.
Conflicts of Interest
The authors declare no conflict of interest.
Appendix A
Table A1.
Parameters of the model explaining pro-environment activities of agricultural farms.
Table A1.
Parameters of the model explaining pro-environment activities of agricultural farms.
| Specification | MAE | RMSE |
|---|---|---|
| Mean | 8.164406 | 12.221459 |
| Std | 0.950371 | 2.016887 |
| Min | 6.958756 | 9.064852 |
| Q1 | 7.449955 | 10.869699 |
| Median | 7.971004 | 11.758256 |
| Q3 | 8.885924 | 13.406241 |
| Max | 10.261021 | 17.757508 |
MAE—mean absolute error, RMSE—root mean square error. Source: own study based on ARMA and CSO data.
References
- Bateman, I.; Balmford, B. Public funding for public goods: A post-Brexit perspective on principles for agricultural policy. Land Use Policy 2018, 79, 293–300. [Google Scholar] [CrossRef]
- Treasury, H.M. The Green Book: Central Government Guidance on Appraisal and Evaluation; Government Finance Function: London, UK, 2018.
- Früh-Müller, A.; Bach, M.; Breuer, L.; Hotes, S.; Koellner, T.; Krippes, C.; Wolters, V. The use of agri-environmental measures to address environmental pressures in Germany: Spatial mismatches and options for improvement. Land Use Policy 2019, 84, 347–362. [Google Scholar] [CrossRef]
- Rudnicki, R. The Spatial Structure of Polish Agriculture Conditioned by Common Agricultural Policy Instruments; Wydawnictwo Naukowe Uniwersytetu Mikołaja Kopernika: Toruń, Poland, 2016; p. 487. [Google Scholar]
- Rudnicki, R.; Dubownik, A.; Biczkowski, M. Diversification of sources of income in agricultural holdings in the context of multifunctional development of rural areas in Poland. Belg. Belg. J. Geogr. Sustain. Rural. Syst. Balanc. Herit. Innov. 2016, 4. [Google Scholar] [CrossRef]
- Matin, S.; Sullivan, C.A.; Óh Uallacháin, D.; Meredith, D.; Moran, J.; Finn, J.A.; Green, S. Predicted distribution of High Nature Value farmland in the Republic of Ireland. J. Maps 2016, 12, 373–376. [Google Scholar] [CrossRef]
- Aldieri, L.; Concetto, P.V. Green Economy and Sustainable Development: The Economic Impact of Innovation on Employment. Sustainability 2018, 10, 3541. [Google Scholar] [CrossRef]
- Arbolino, R.; Carlucci, F.; Cirà, A.; Ioppolo, G.; Yigitcanlar, T. Efficiency of the EU regulation on greenhouse gas emissions in Italy: The hierarchical cluster analysis approach. Ecol. Indic. 2017, 81, 115–123. [Google Scholar] [CrossRef]
- Arbolino, R.; De Simone, L.; Carlucci, F.; Yigitcanlar, T.; Ioppolo, G. Towards a sustainable industrial ecology: Implementation of a novel approach in the performance evaluation of Italian regions. J. Clean. Prod. 2018, 178, 220–236. [Google Scholar] [CrossRef]
- Jezierska-Thöle, A.; Rudnicki, R.; Wiśniewski, Ł.; Gwiaździńska-Goraj, M.; Biczkowski, M. The Agri-Environment-Climate Measure as an Element of the Bioeconomy in Poland A Spatial Study. Agriculture 2021, 11, 110. [Google Scholar] [CrossRef]
- Kowalska, A.; Bieniek, M. Meeting the European green deal objective of expanding organic farming. Equilibrium. Q. J. Econ. Econ. Policy 2022, 17, 607–633. [Google Scholar] [CrossRef]
- Adamowicz, M. Green Deal, Green Growth and Green Economy as a Means of Support for Attaining the Sustainable Development Goals. Sustainability 2022, 14, 5901. [Google Scholar] [CrossRef]
- Rudnicki, R.; Wiśniewski, Ł.; Biczkowski, M. A Spatial Typography of Environmentally Friendly Common Agricultural Policy Support Relevant to European Green Deal Objectives. Land 2021, 10, 1092. [Google Scholar] [CrossRef]
- Mijatovic, D.; Van Oudenhoven, F.; Eyzaguirre, P.; Hodgkins, T. The role of agricultural biodiversity in streng the ningre silience to climate change: Towards an analytical framework. Int. J. Agric. Sustain. 2013, 11, 95–107. [Google Scholar] [CrossRef]
- Niggli, U.; Slabe, A.; Schmid, O.; Halberg, N.; Schlüter, M. Vision for an Organic Food and Farming Research Agenda to 2025. In Organic Knowledge for the Future; Technology Platform Organics: Brussels, Belgium, 2008; Available online: http://www.tporganics.eu/upload/TPOrganics_VisionResearchAgenda.pdf (accessed on 1 October 2020).
- Anderson, L.G.; Seijo, J.C. Bioeconomics of Fisheries Management; John Wiley & Sons: Hoboken, NJ, USA, 2010; p. 320. [Google Scholar]
- Birch, K.; Levidow, L.; Papaioannou, T. Sustainable capital? The neo-liberalization of nature and knowledge in the European “knowledge-based bio-economy”. Sustainability 2010, 2, 2898–2918. [Google Scholar] [CrossRef]
- Hanley, N.; Banerjee, S.; Lennox, G.D.; Armsworth, P.R. How should weincentivize private landowners to ‘produce’ more biodiversity? Oxf. Rev. Econ. Policy 2012, 28, 93–113. [Google Scholar] [CrossRef]
- Wood, S.A.; Karp, D.S.; De Clerck, F.; Kremen, C.; Naeem, S.; Palm, C.A. Functional traits in agriculture: Agri-biodiversity and ecosystem services. Trends Ecol. Evol. 2015, 30, 531–539. [Google Scholar] [CrossRef]
- Jezierska-Thöle, A.; Biczkowski, M. Impact of EU Funds on Current Status and Prospects of Organic Farming in Poland. In Proceedings of the International Conference Economic Science for Rural Development, Jelgava, Latvia, 9–11 May 2018; Volume 47, pp. 123–131. [Google Scholar] [CrossRef]
- European Court of Auditors. Common Agricultural Policy and Climate. In Half of EU Climate; European Commission: Brussels, Belgium, 2021. [Google Scholar]
- Wiśniewski, P.; Kistowski, M. Importance of issues regarding rural areas and agricultural activities in the objectives and directions of low carbon economy development at communal level. Rural. Stud. 2018, 50, 49–64. [Google Scholar] [CrossRef]
- European Commission (EC). CAP Expenditure in the Total EU Expenditure. 2022. Available online: https://agriculture.ec.europa.eu/system/files/2022-11/cap-expenditure-graph1_en.pdf (accessed on 1 December 2022).
- Wiśniewski, P.; Marks-Bielska, R. Znaczenie realizacji Europejskiego Zielonego Ładu dla polskiej wsi i rolnictwa. In Polska Wieś 2022: Raport o Stanie Wsi; Wilkin, J., Hałasiewicz, A., Eds.; Fundacja na rzecz Rozwoju Polskiego Rolnictwa: Warszawa, Poland, 2022; pp. 119–132. [Google Scholar]
- Musiał, W.; Zioło, M.; Luty, L.; Musiał, K. Energy policy of European Union member states in the context of renewable energy sources development. Energies 2021, 14, 2864. [Google Scholar] [CrossRef]
- Institute for European Environmental Policy. Europe Sustainable Development Report (ESDR). In Sustainable Development Solutions Network and Institute for European Environmental Policy; Institute for European Environmental Policy: Brussels, Belgium, 2019. [Google Scholar]
- European Commission (EC). Communication from the Commission to the European Parliament, the European Council, the Council, the European Economic and Social Committee and the Committee of the Regions, The European Green Deal, COM (2019) 640 Final; European Commission: Brussels, Belgium, 2019. [Google Scholar]
- Siddi, M. The European Green Deal: Assess Ingits Current State and Future Implementation; The Finnish Institute of International Affairs: Helsinki, Finland, 2020; Volume 114, p. 14. Available online: https://www.fiia.fi/en/publication/the-european-green-deal (accessed on 22 November 2020).
- Wiśniewski, Ł.; Biczkowski, M.; Rudnicki, R. Natural potential versus rationality of allocation of Common Agriculture Policy funds dedicated for supporting organic farming development—Assessment of spatial suitability: The case of Poland. Ecol. Indic. 2021, 130, 1–12. [Google Scholar] [CrossRef]
- Becchetti, L.; Piscitelli, P.; Distante, A.; Miani, A.; Uricchio, A.F. European Green Deal as social vaccine to overcome COVID-19 health & economic crisis. Lancet Reg. Health Eur. 2021, 2, 100032. [Google Scholar] [CrossRef]
- European Commission (EC). Communication from the Commission to the European Parliament, the Council, the European Economic and Social Committee and the Committee of the Regions. A Farm to Fork Strategy for a fair, Healthy and Environmentally-Friendly Food System; COM/2020/381 Final; European Commission: Brussels, Belgium, 2020. [Google Scholar]
- European Commission (EC). Communication from the Commission to the European Parliament, the Council, the European Economic and Social Committee and the Committee of the Regions EU Biodiversity Strategy for 2030; COM/2020/380 Final; European Commission: Brussels, Belgium, 2020. [Google Scholar]
- Schebesta, H.; Bernaz, N.; Macchi, C. The European Union Farm to Fork Strategy: Sustainability and Responsible Business in the Food Supply Chain. Eur. Food Feed. Law Rev. 2020, 15/5, 420–427. [Google Scholar] [CrossRef]
- Ratajczak, E. Rolnictwo i Leśnictwo w Świetle Koncepcji Biogospodarki. In Roczniki Naukowe SERiA, Proceedings of the IX Kongres Ekonomistów Polskich, Warszawa, Poland, 28–29 September 2013; Tyniec Wydawnictwo Benedyktynów: Krakow, Poland, 2020. [Google Scholar]
- European Commission (EC). Europejska Strategia i Plan Działania w Kierunku Zrównoważonej Biogospodarki do 2020 Roku; European Commission: Brussels, Belgium, 2020; Available online: https://Europa.eu/rapid/press-release_IP-12–124_pl.htm (accessed on 25 November 2020).
- Ecorys. Mapping and Analysis of the Implementation of the CAP. 2017. Available online: https://op.europa.eu/pl/publicationdetail/-/publication/65c49958-e138-11e6-ad7c-01aa75ed71a1 (accessed on 1 October 2022).
- Wiśniewski, P.; Rudnicki, R.; Kistowski, M.; Wiśniewski, Ł.; Chodkowska-Miszczuk, J.; Niecikowski, K. Mapping of EU Support for High Nature Value Farmlands, from the Perspective of Natural and Landscape Regions. Agriculture 2021, 11, 864. [Google Scholar] [CrossRef]
- Marsden, T.; Sonnino, R. Rural development and the regional state: Denying multifunctional agriculture in the UK. J. Rural Stud. 2008, 24, 422–431. [Google Scholar] [CrossRef]
- Home, R.; Balmer, O.; Jahrl, I.; Stolze, M.; Pfiffner, L. Motivations for implementation of ecological compensation areas on Swiss low land farms. J. Rural Stud. 2014, 34, 26–36. [Google Scholar] [CrossRef]
- Kleijn, D.; Sutherland, W.J. How effective are European agri-environment schemes in conserving and promoting biodiversity? J. Appl. Ecol. 2003, 40, 947–969. [Google Scholar] [CrossRef]
- Pe’er, G.; Zinngrebe, Y.; Moreira, F.; Sirami, C.; Schindler, S.; Müller, R.; Bontzorlos, V.; Clough, D.; Bezák, P.; Bonn, A.; et al. A greener path for the EU common agricultural policy. Science 2019, 365, 449–451. [Google Scholar] [CrossRef] [PubMed]
- Constantin, M.; Sapena, J.; Apetrei, A.; Pătărlăgeanu, S.R. Deliver Smart, Not More! Building Economically Sustainable Competitiveness on the Ground of High Agri-Food Trade Specialization in the EU. Foods 2023, 12, 232. [Google Scholar] [CrossRef]
- Barreiro-Hurle, J.; Espinosa-Goded, M.; Dupraz, P. Does intensity of change matter? Factors affecting adoption of agri-environmental schemes in Spain. J. Environ. Plan. Manag. 2010, 53, 891–905. [Google Scholar] [CrossRef]
- Biczkowski, M. Instrumenty Wspólnej Polityki Rolnej Jako Czynnik Wspierający Rozwój Obszarów Wiejskich. In Studium Statystyczno-Przestrzenne na Przykładzie Region Kujawsko-Pomorskiego; Wydawnictwa Naukowe Uniwersytetu Mikołaja Kopernika: Toruń, Poland, 2018. [Google Scholar]
- Biczkowski, M.; Jezierska-Thöle, A.; Rudnicki, R. The Impact of RDP Measures on the Diversification of Agriculture and Rural Development—Seeking Additional Livelihoods: The Case of Poland. Agriculture 2021, 11, 253. [Google Scholar] [CrossRef]
- Hynes, S.; Garvey, E. Modelling Farmers’ Participation in an Agri-environmental Scheme using Panel Data: An Application to the Rural Environment Protection Scheme in Ireland. J. Agric. Econ. 2009, 60, 546–562. [Google Scholar] [CrossRef]
- Dedeurwaerdere, T.; Polard, A.; Melindi-Ghidi, P. The role of network brid ging organisations in compensation payments for agri-environmental services under the EU Common Agricultural Policy. Ecol. Econ. 2015, 119, 24–38. [Google Scholar] [CrossRef]
- Lastra-Bravo, X.B.; Hubbard, C.; Garrod, G.; Tolóon-Becerra, A. What drives farmers’ participation in EU agri-environmental schemes? Results from a qualitative meta-analysis. Environ. Sci. Pol. 2015, 54, 1–9. [Google Scholar] [CrossRef]
- Dessart, F.J.; Barreiro-Hurlé, J.; Van Bavel, R. Behavioural factors affecting the adoption of sustainable farming practices: A policy oriented review. Eur. Rev. Agric. Econ. 2019, 46, 417–471. [Google Scholar] [CrossRef]
- McGurk, E.; Hynes, S.; Thorne, F. Participation in agri-environmental schemes: A contingent valuation study of farmers in Ireland. J. Environ. Manag. 2020, 262, 110243. [Google Scholar] [CrossRef] [PubMed]
- Official Journal of the European Union. Council Regulation (EC) No 834/2007 of 28 June 2007 on Organic Production and Labelling of Organic Products and Repealing Regulation (EEC) No 2092/91; European Union: Luxembourg, 2007. [Google Scholar]
- Biczkowski, M. European funds as a factor of regional development with regard to the concept of neo-endogenous development. Rural Stud. 2013, 34, 71–85. [Google Scholar]
- Biczkowski, M. EU funds implemented by the Regional Operational Programmes as neo-endogenous factor for rural areas. Rural Stud. 2016, 41, 63–81. [Google Scholar] [CrossRef]
- Falkowski, J.; Kostrowicki, J. Geografia Rolnictwa Świata; PWN: Warszawa, Poland, 2001. [Google Scholar]
- Geurts, P.; Ernst, D.; Wehenkel, L. Extremely randomized trees. Mach. Learn. 2006, 63, 3–42. [Google Scholar] [CrossRef]
- Lundberg, S.M.; Lee, S.I. A Unified Approach to Interpreting Model Predictions. In Proceedings of the 31st Conference on Neural Information Processing Systems (NIPS 2017), Long Beach, CA, USA, 30 November 2017; Available online: https://proceedings.neurips.cc/paper/2017/file/8a20a8621978632d76c43dfd28b67767-Paper.pdf (accessed on 5 November 2022).
- Szymańska, J. Rents for agricultural land leased in private trade in the opinion of respondents from the dolnośląskie province. Rocz. Nauk. SERiA 2015, XVII/5, 283–288. [Google Scholar] [CrossRef]
- Defrancesco, E.; Gatto, P.; Runge, F.; Trestini, S. Factors affecting farmers’ participation in agri-environmental measures: A northern Italian perspective. J. Agric. Econ. 2008, 59, 114–131. [Google Scholar] [CrossRef]
- Biczkowski, M.; Rudnicki, R.; Chodkowska-Miszczuk, J.; Wiśniewski, Ł.; Kistowski, M.; Wiśniewski, P. Neo-colonialism in the Polish rural world: CAP approach and the phenomenon of suitcase farmers. Agric. Hum. Values 2022. [Google Scholar] [CrossRef]
- Goldberger, J.R. Conventionalization, Civic Engagement, and the Sustainability of Organic Agriculture. J. Rural. Stud. 2011, 27, 288–296. [Google Scholar] [CrossRef]
- Rudnicki, R.; Wiśniewski, Ł. Cechy produkcyjne rolnictwa a poziom absorpcji środków Wspólnej Polityki Rolnej w Polsce. Stud. Obsz. Wiej. 2016, 42, 89–104. [Google Scholar] [CrossRef]
- Stawicka, J.; Szymczak-Piątek, M.; Wieczorek, J. Wybrane Zagadnienia Ekologiczne [Selected Ecological Issues]; Publ. SGGW: Warszawa, Poland, 2004. [Google Scholar]
- Moonen, A.C.; Bàrberi, P. Functional biodiversity: An agriecosystem approach. Agric. Ecosyst. Environ. 2008, 127, 7–21. [Google Scholar] [CrossRef]
- Seufert, V.; Ramankutty, N.; Foley, J.A. Comparing the fields of organic and conventional agriculture. Nature 2017, 868, 229–232. [Google Scholar] [CrossRef]
- European Commission (EC). A European Green Deal—Striving to be the First Climate-Neutral Continent; European Commission: Brussels, Belgium, 2020; Available online: https://ec.europa.eu/info/strategy/priorities-2019-2024/european-green-deal_en#policy-areas (accessed on 25 November 2020).
- FiBL Statistics. Organic Retail Sales. 2020. Available online: https://statistics.fibl.org/world/retail-sales-world.html (accessed on 9 February 2021).
- Eurostat Statistics Explained. Organic Farming Statistics. 2022. Available online: https://ec.europa.eu/eurostat/statistics-explained/index.php?title=Organic_farming_statistics (accessed on 10 January 2023).
- Barr, S. Factors influencing environmental attitudes and behaviours; a UK case study of household waste management. Environ. Behav. 2007, 39, 435–473. [Google Scholar] [CrossRef]
- Melbye, E.L.; Onozaka, Y.; Hansen, H. Throwing it all away: Exploring affluent consumers’ attitudes toward wasting edible food. J. Food Prod. Mark. 2016, 23, 416–429. [Google Scholar] [CrossRef]
- Parfitt, J.; Barthel, M.; Macnaughton, S. Food waste within food supply chains: Quantification and potential for change to 2050. Philos. Trans. R. Soc. B 2010, 365, 3065–3081. [Google Scholar] [CrossRef]
- FAO. Organic Agriculture FAQ. 2022. Available online: https://www.fao.org/organicag/oa-faq/oa-faq1/en/ (accessed on 15 March 2022).
- Muller, D.S.; Schader, C.; El-Hage Scialabba, N.; Brüggemann, J.; Isensee, A.; Erb, K.-H.; Smith, P.; Klocke, P.; Leiber, F.; Stolze, M.; et al. Strategies for feeding the world more sustainably with organic agriculture. Nat. Commun. 2017, 8, 1–13. [Google Scholar] [CrossRef]
- Pe’er, G.; Bonn, A.; Bruelheide, H.; Dieker, P.; Eisenhauer, N.; Feindt, P.H.; Hagedorn, G.; Hansjurgens, B.; Herzon, I.; Lomba, A.; et al. Action needed for the EU Common Agricultural Policy to address sustainability challenges. People Nat. 2020, 2, 305–316. [Google Scholar] [CrossRef]
- Van Huylenbroeck, G.; Vandermeulen, V.; Mettepemningen, E.; Verspecht, A. Multifunctionality of Agriculture: A Review of Definitions, Evidence and Instruments. Living Rev. Landsc. Res. 2007, 1, 1–38. [Google Scholar] [CrossRef]
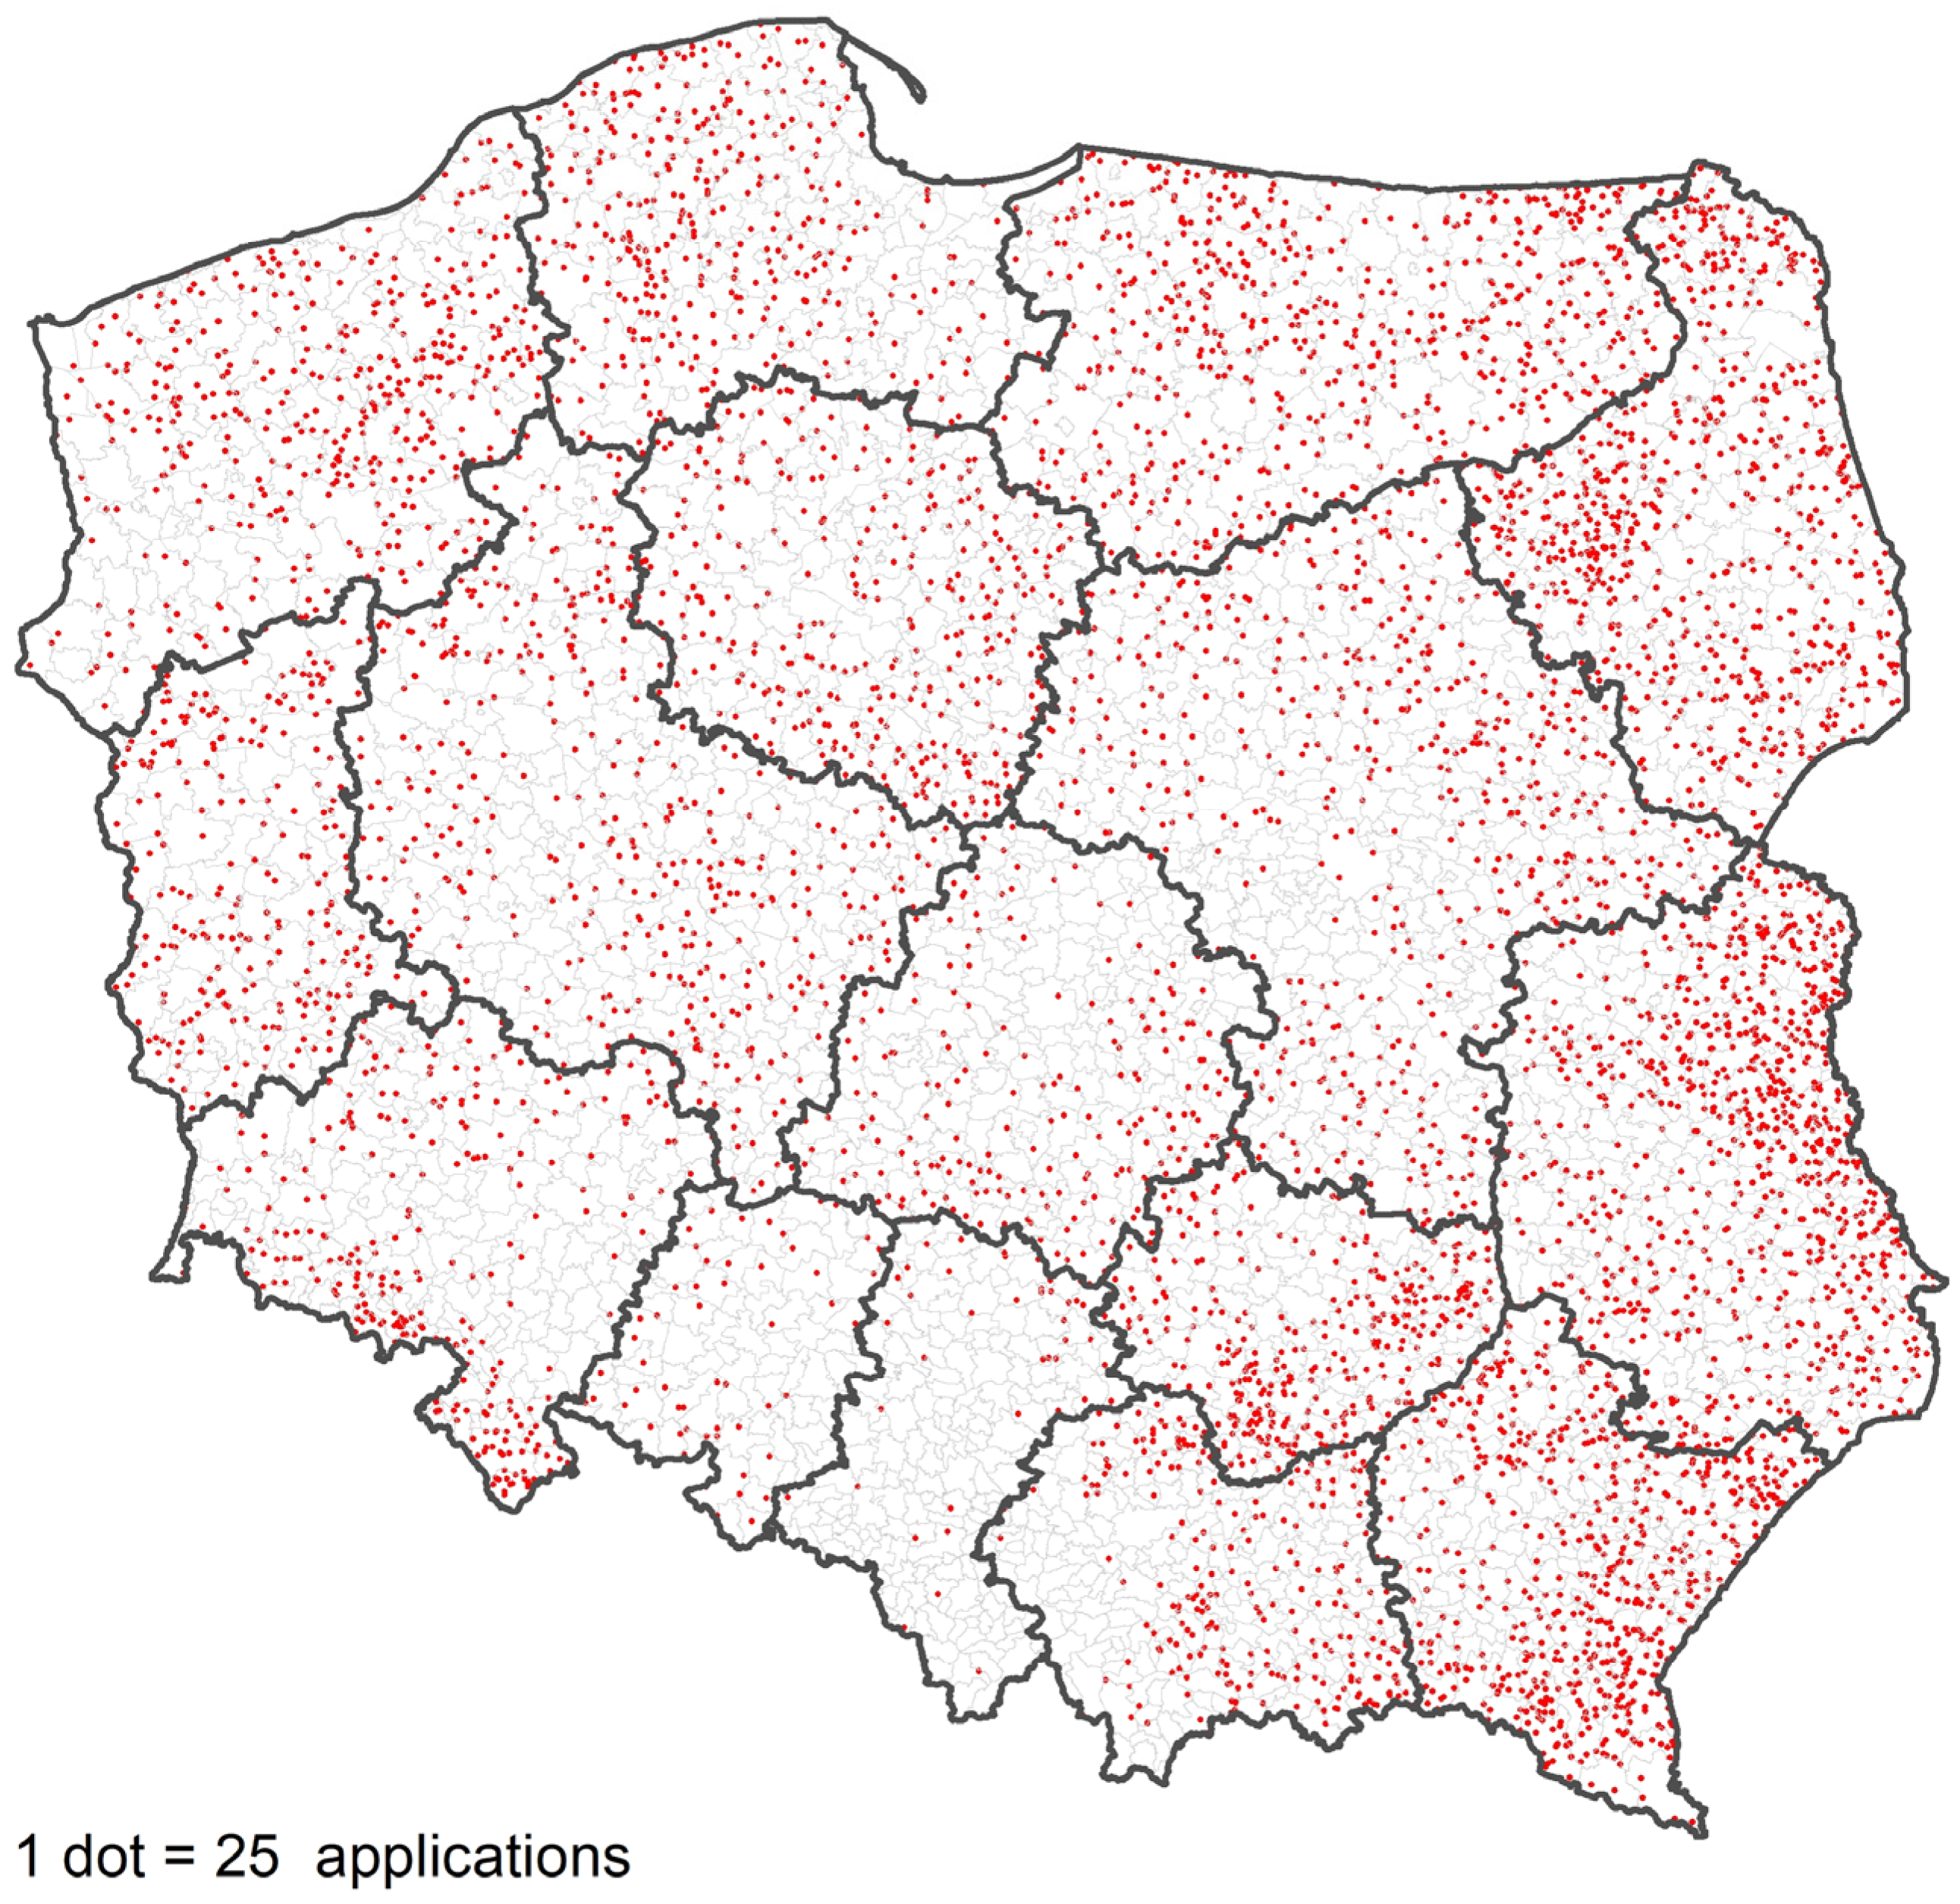
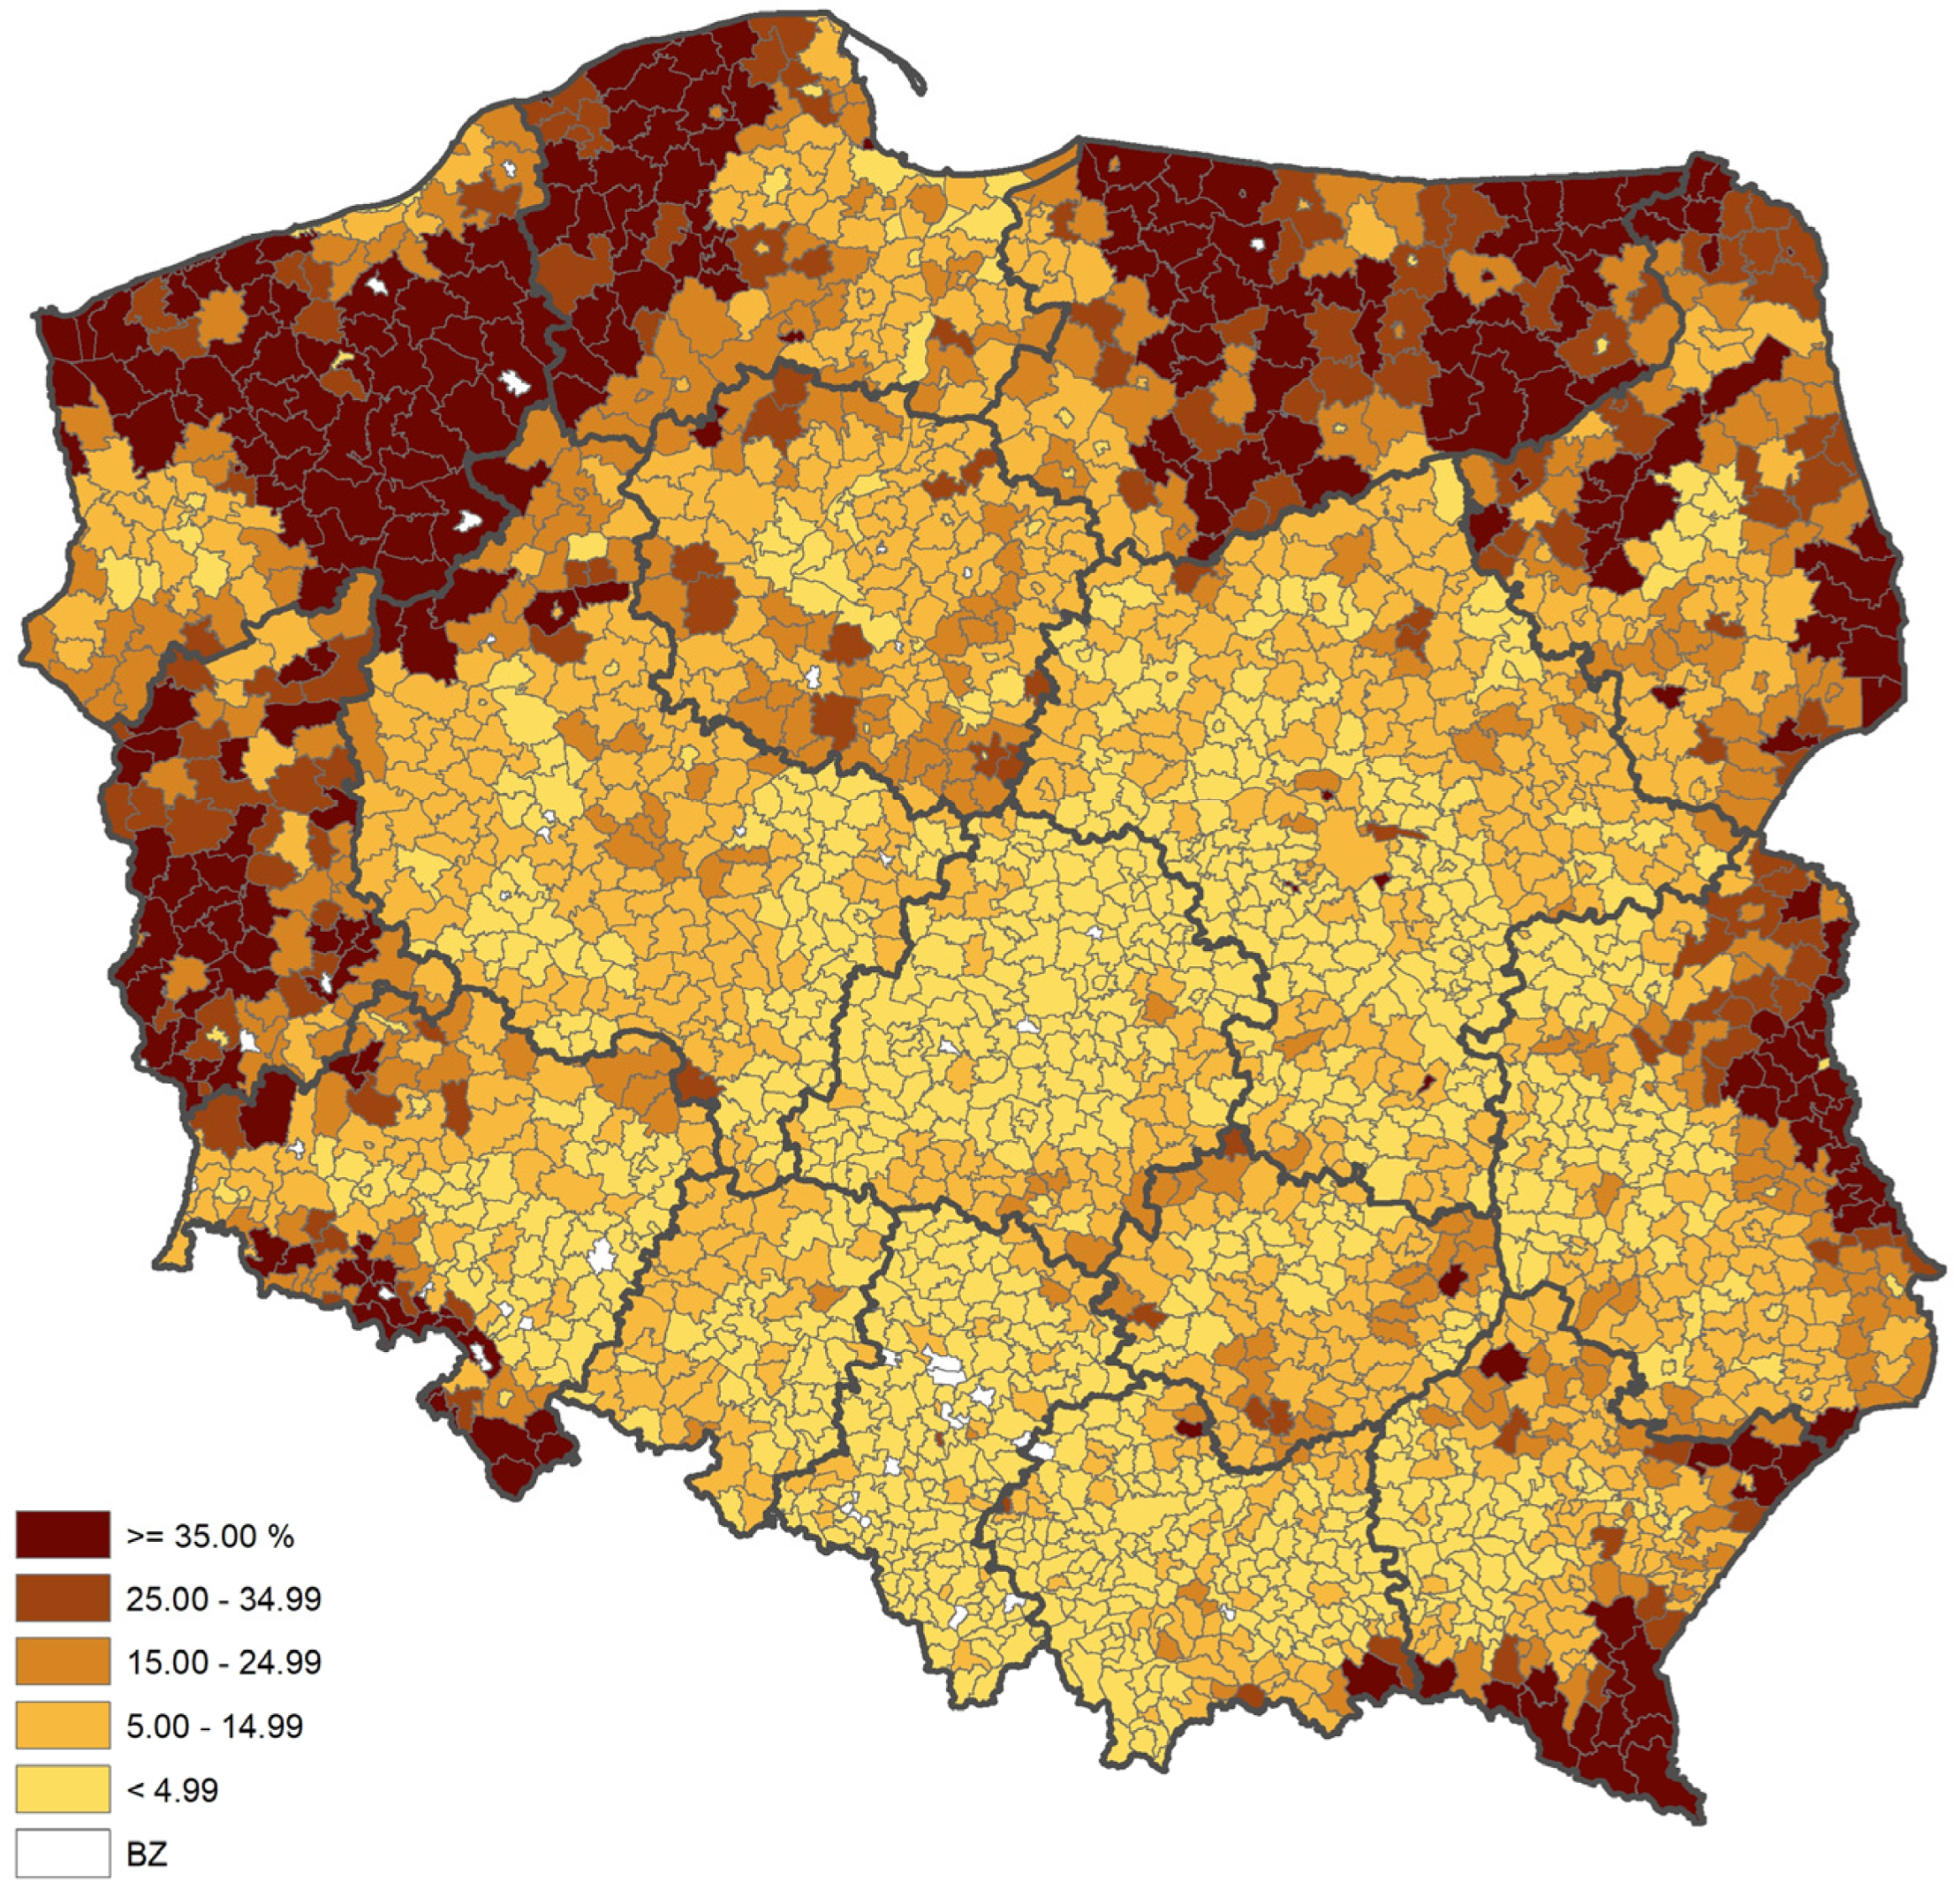
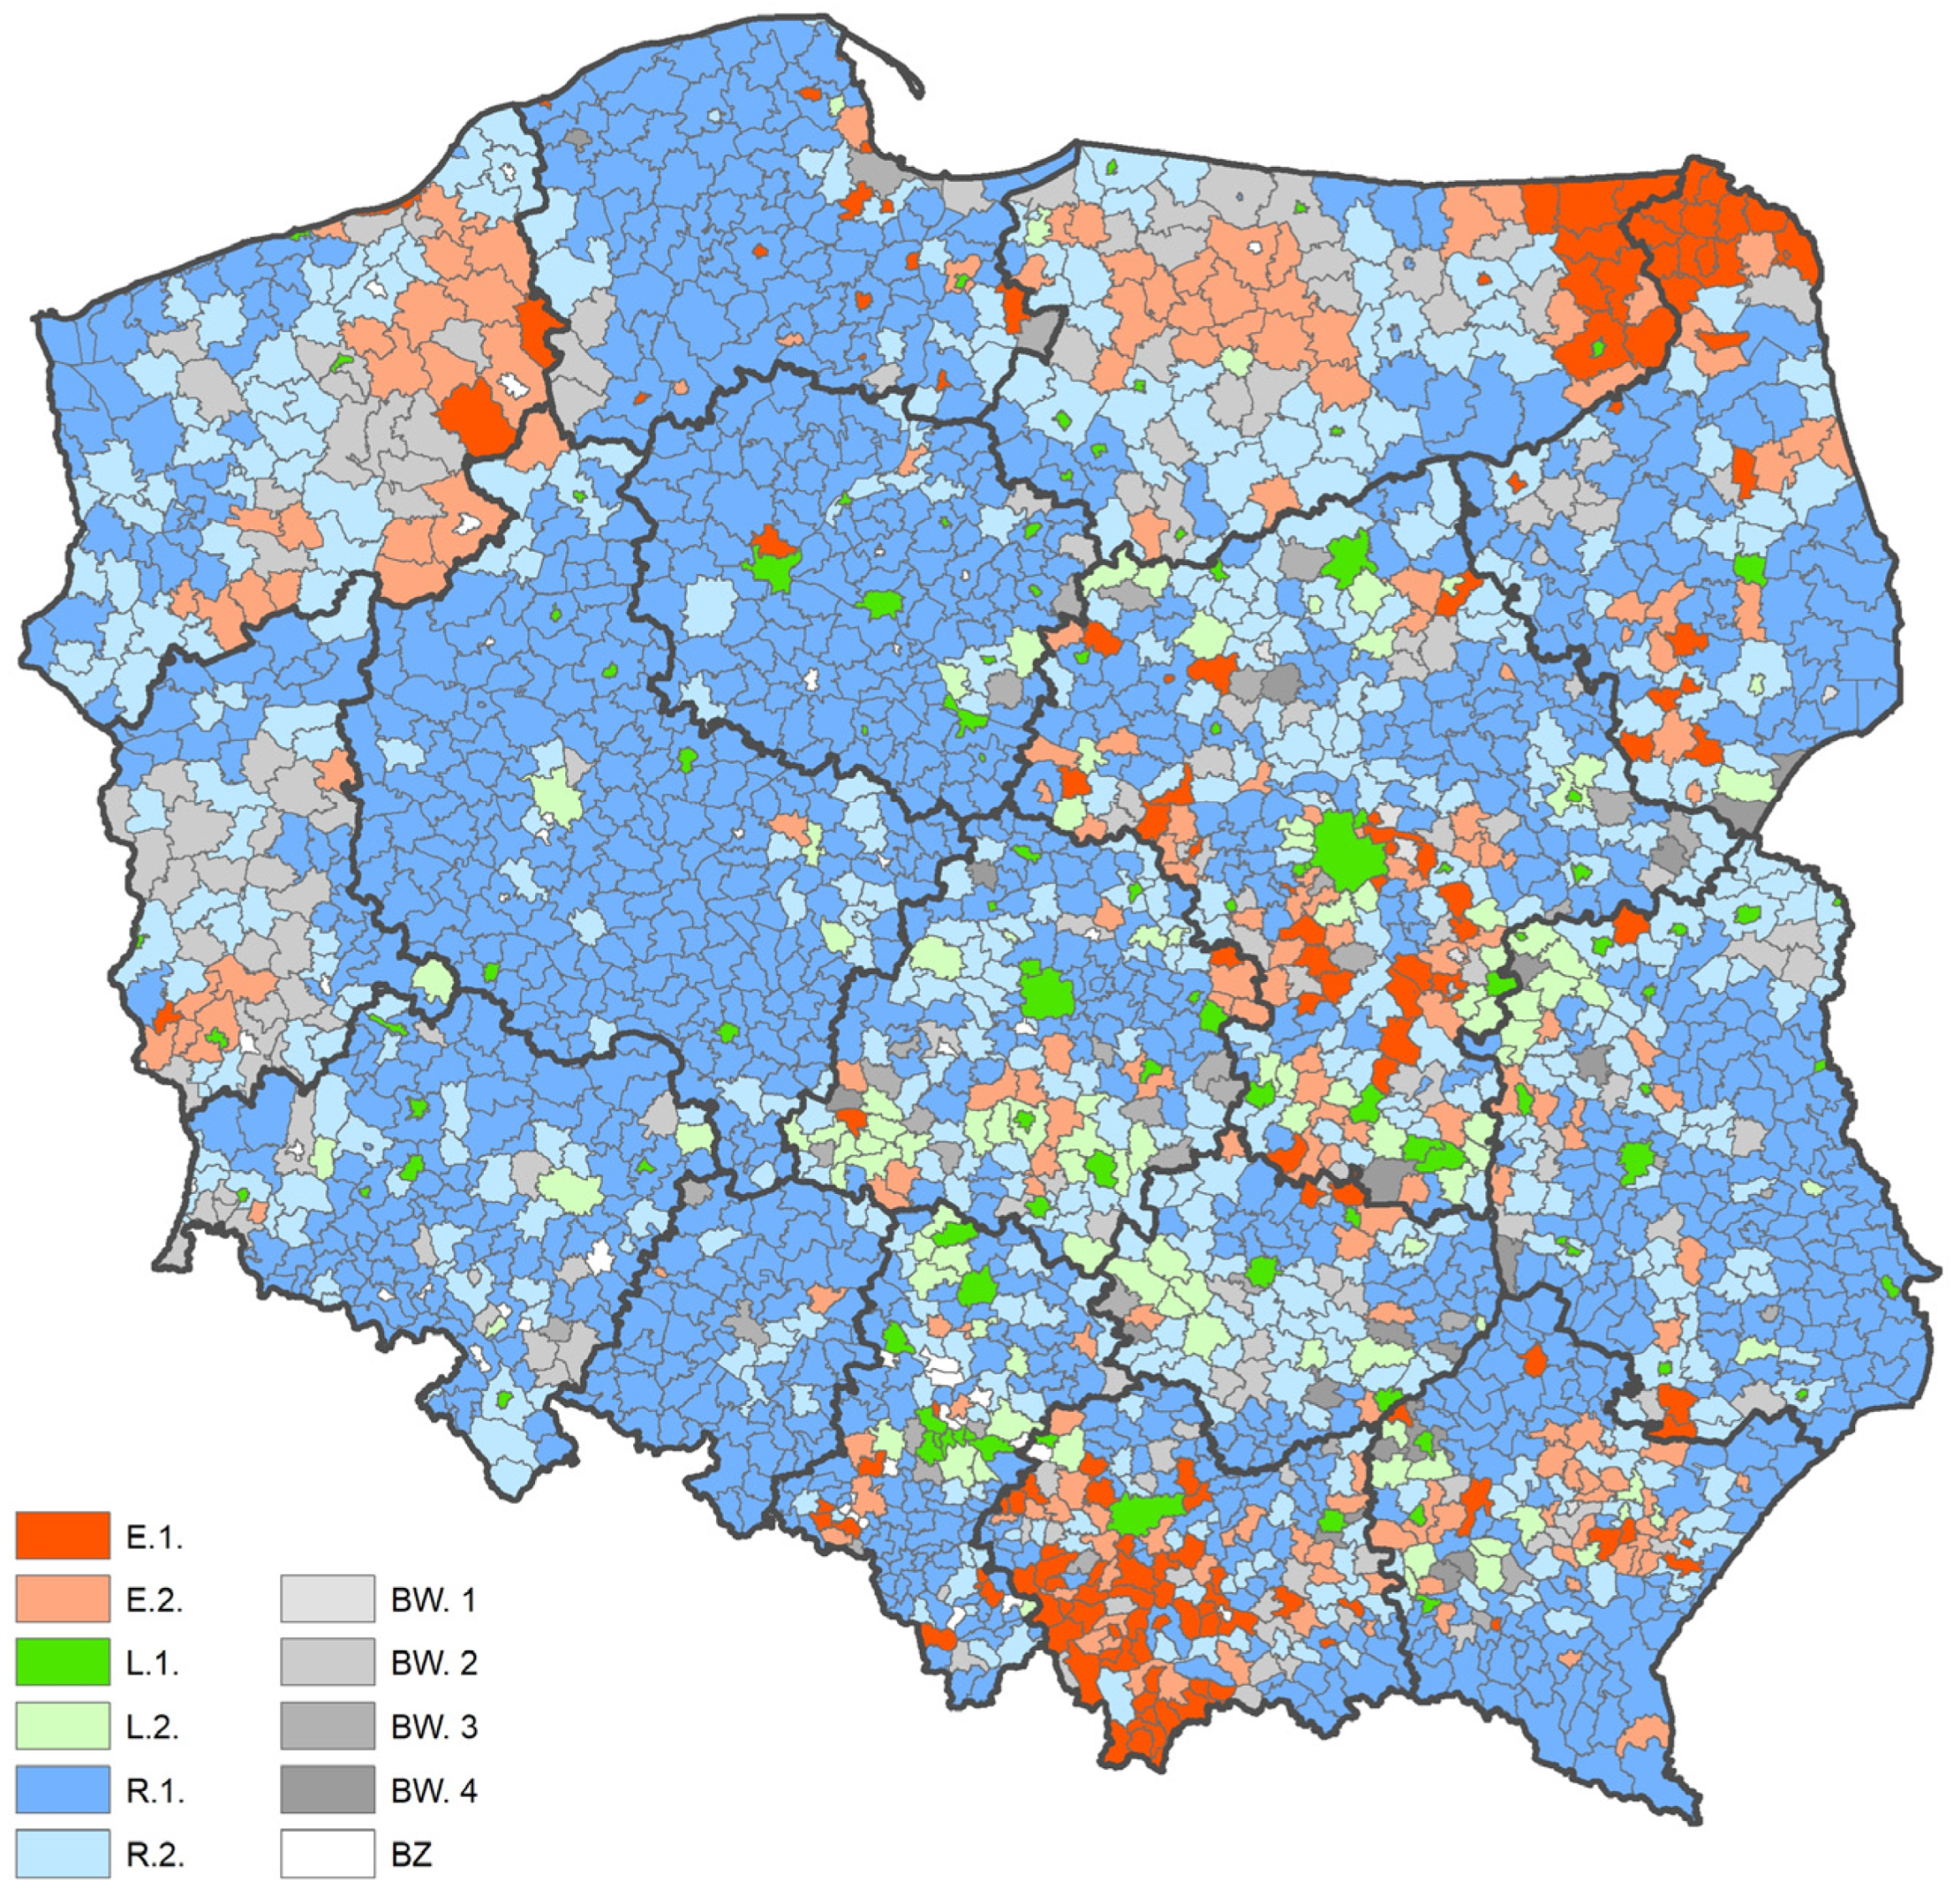
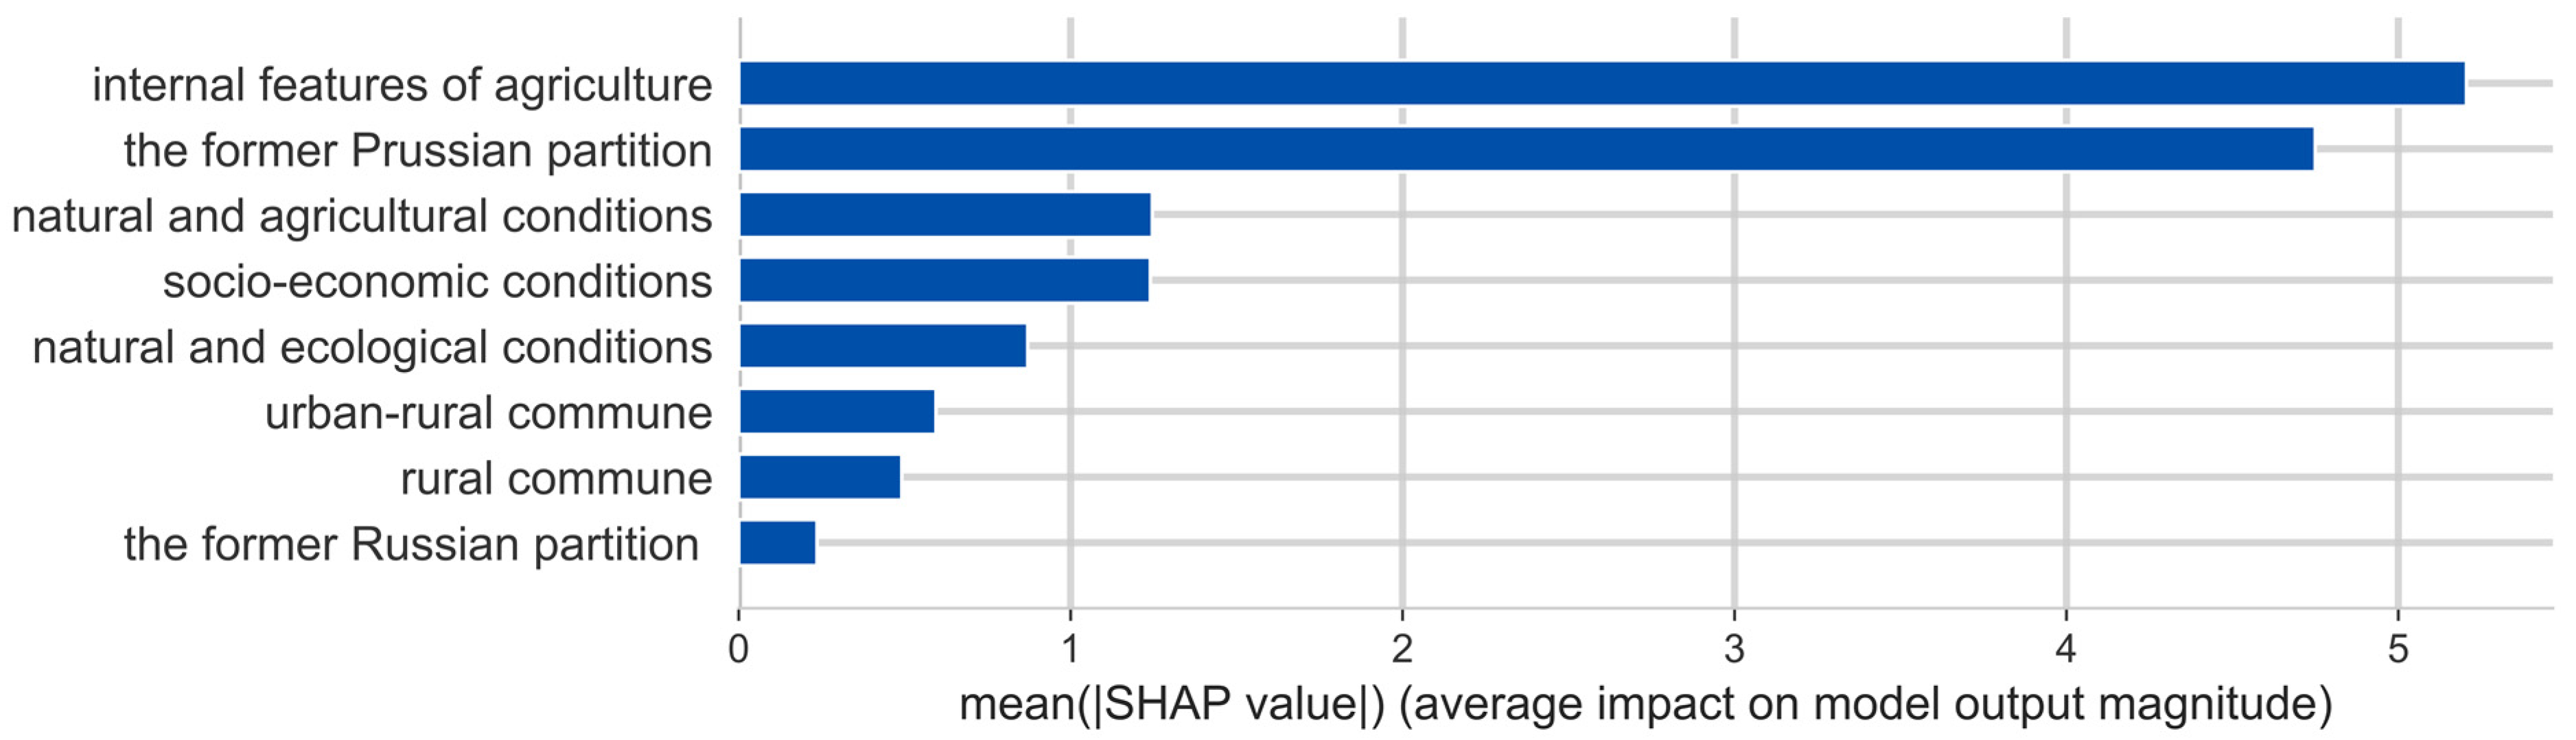
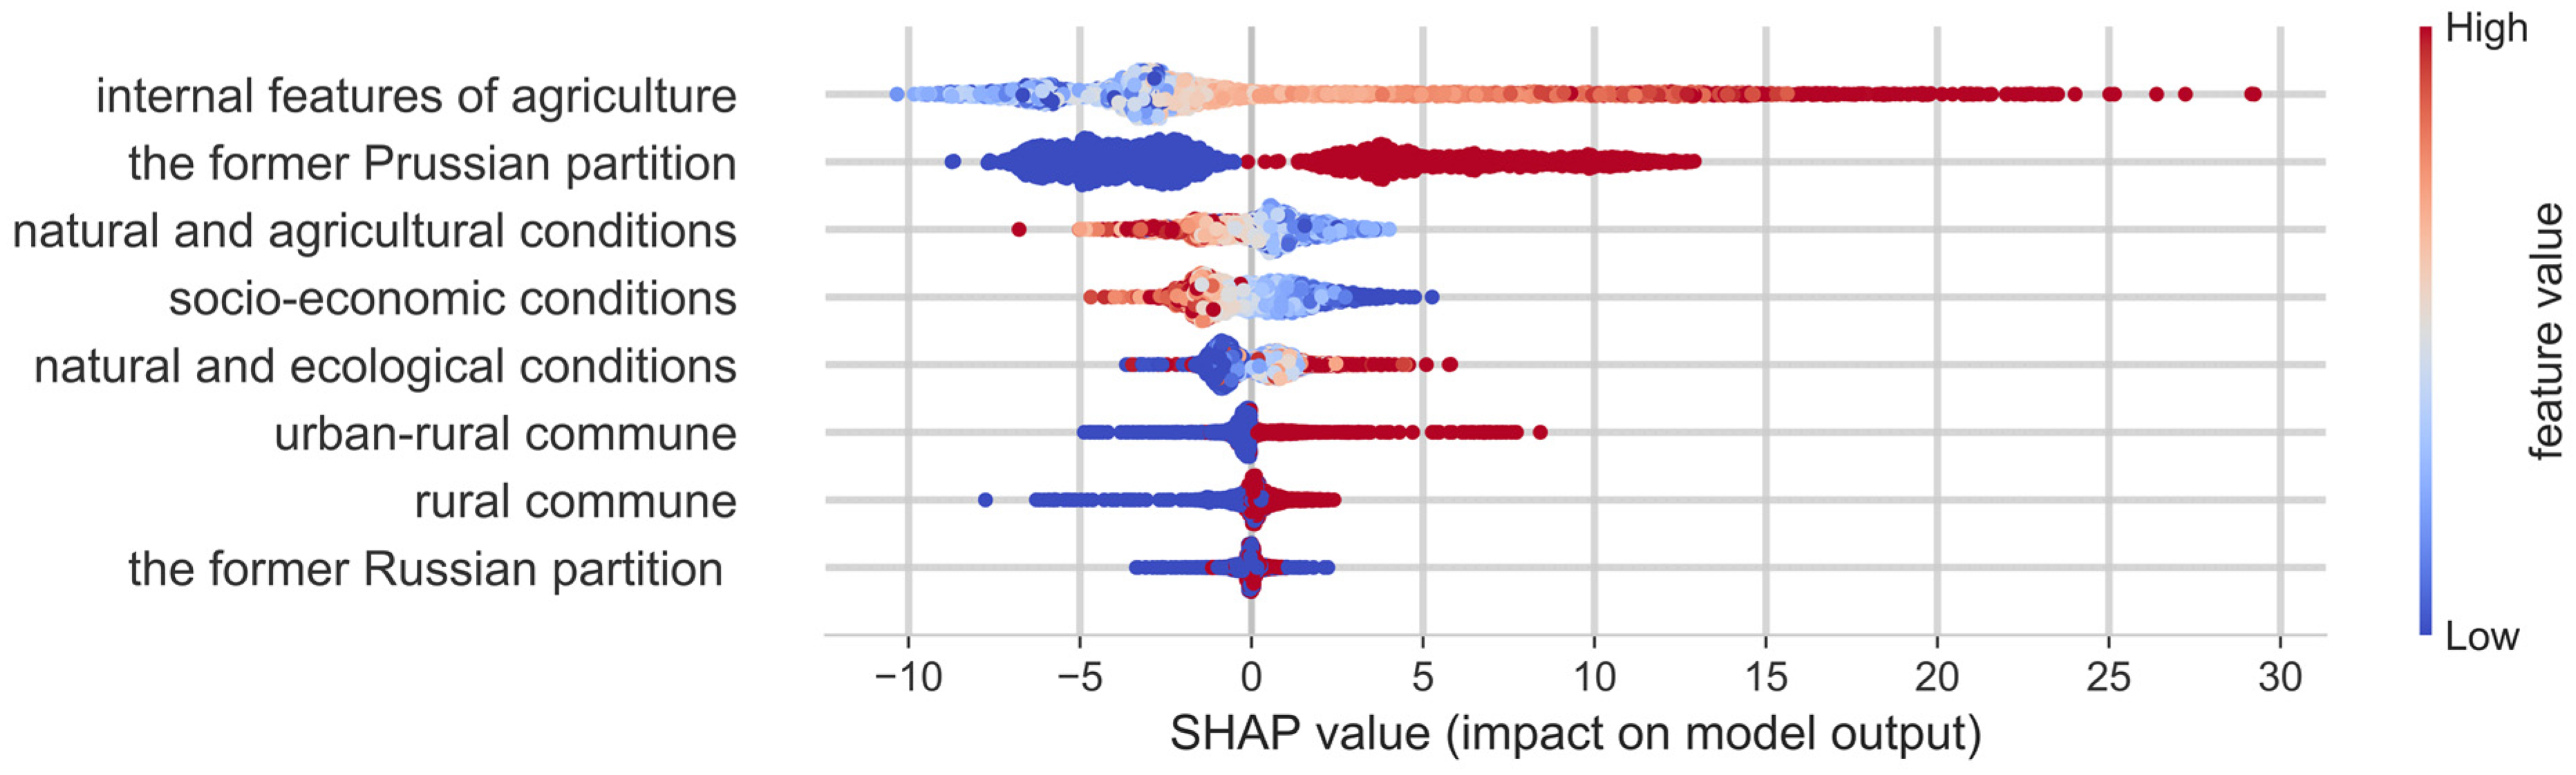
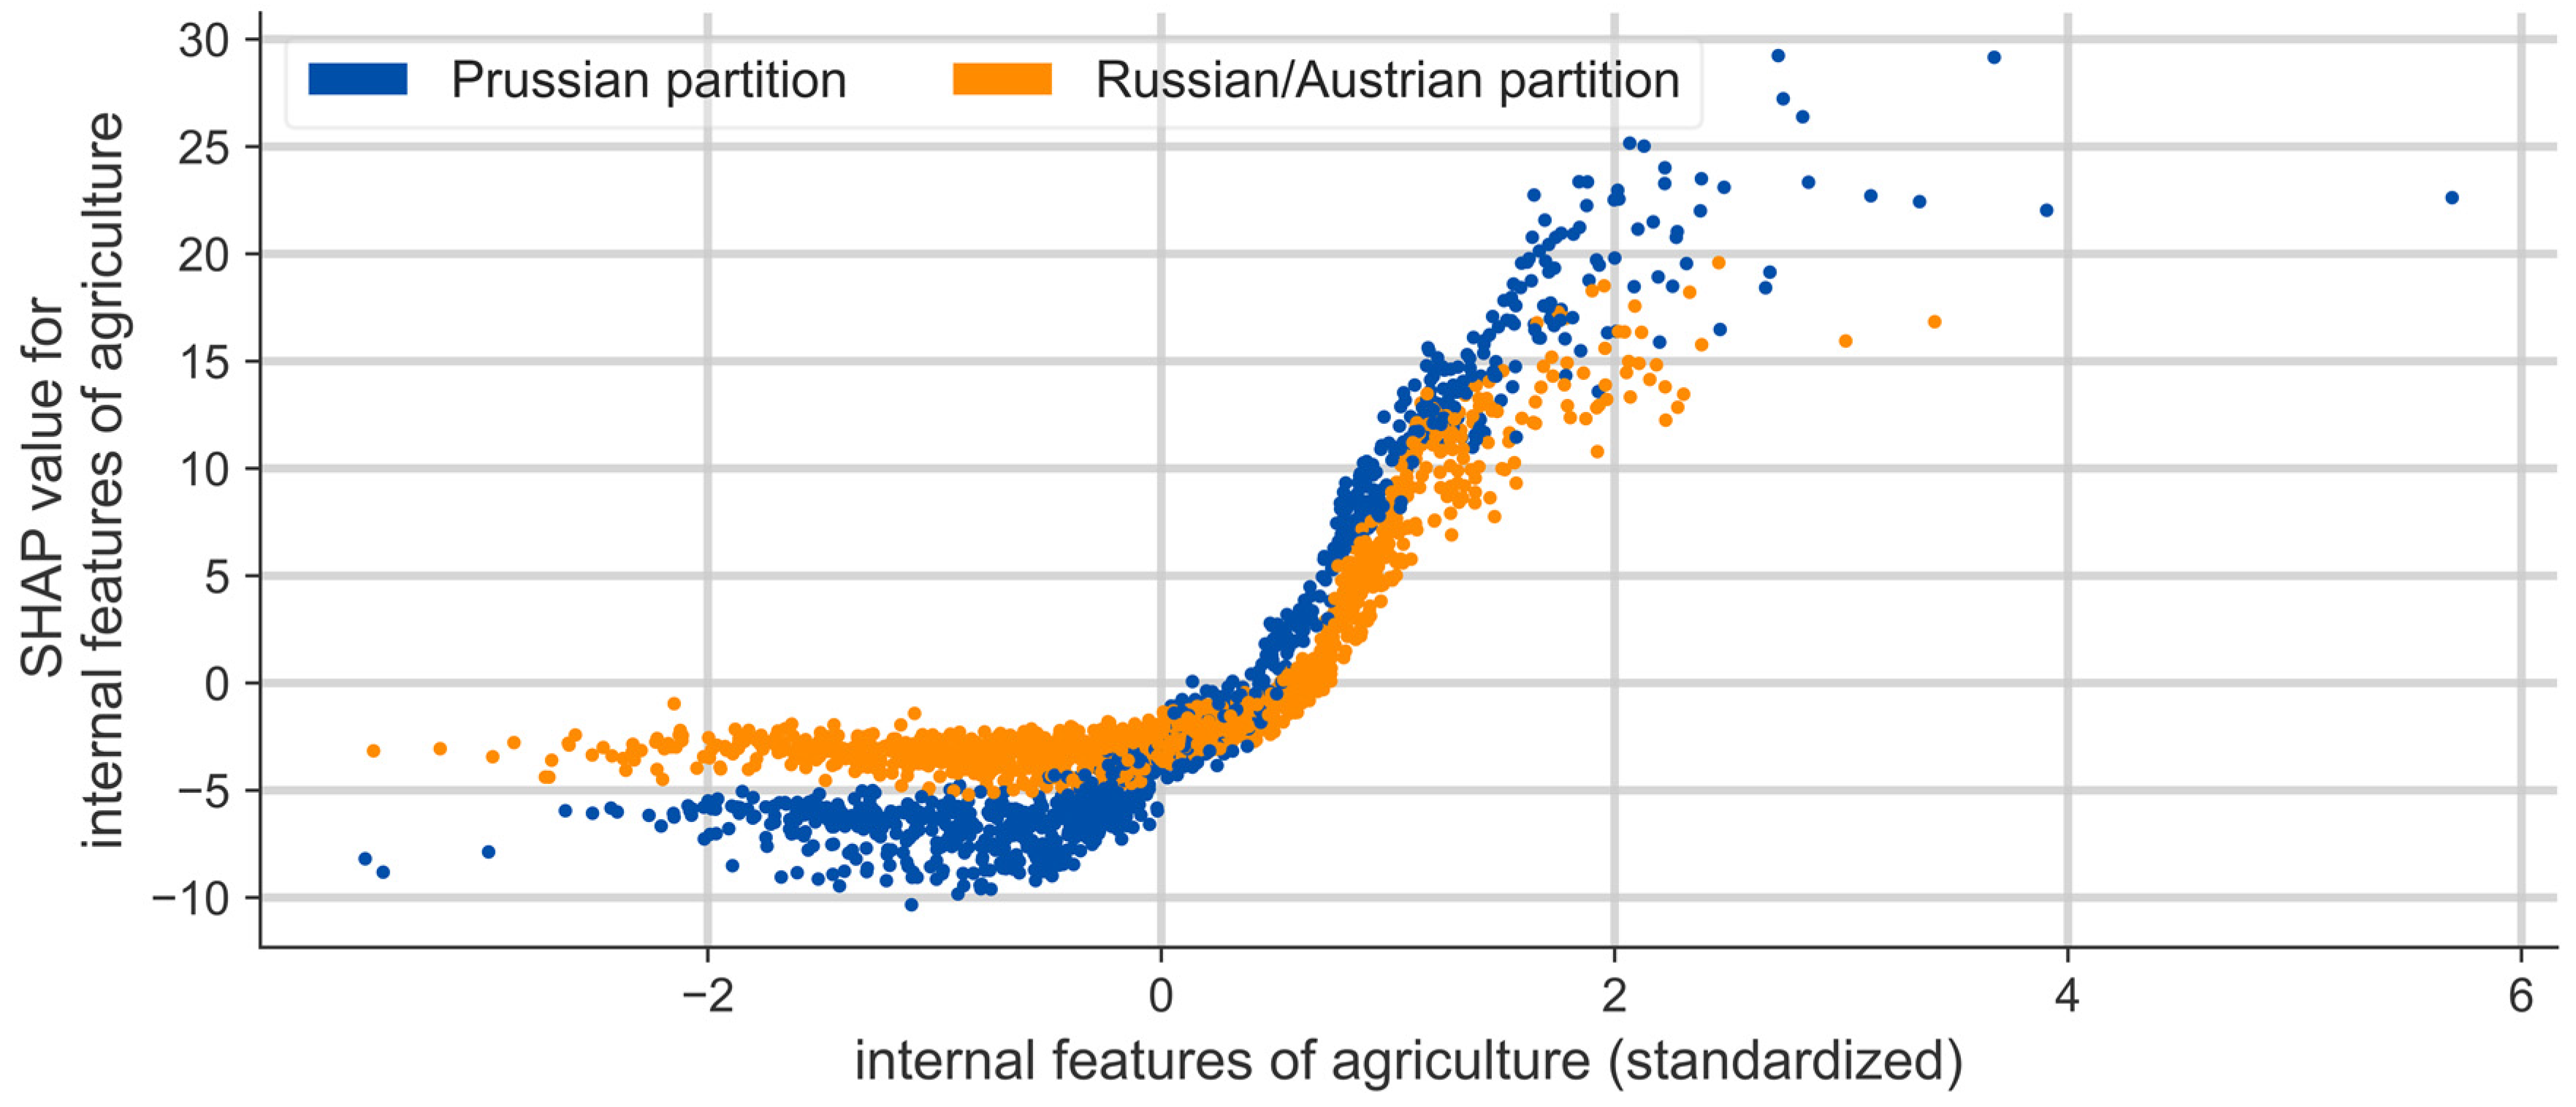
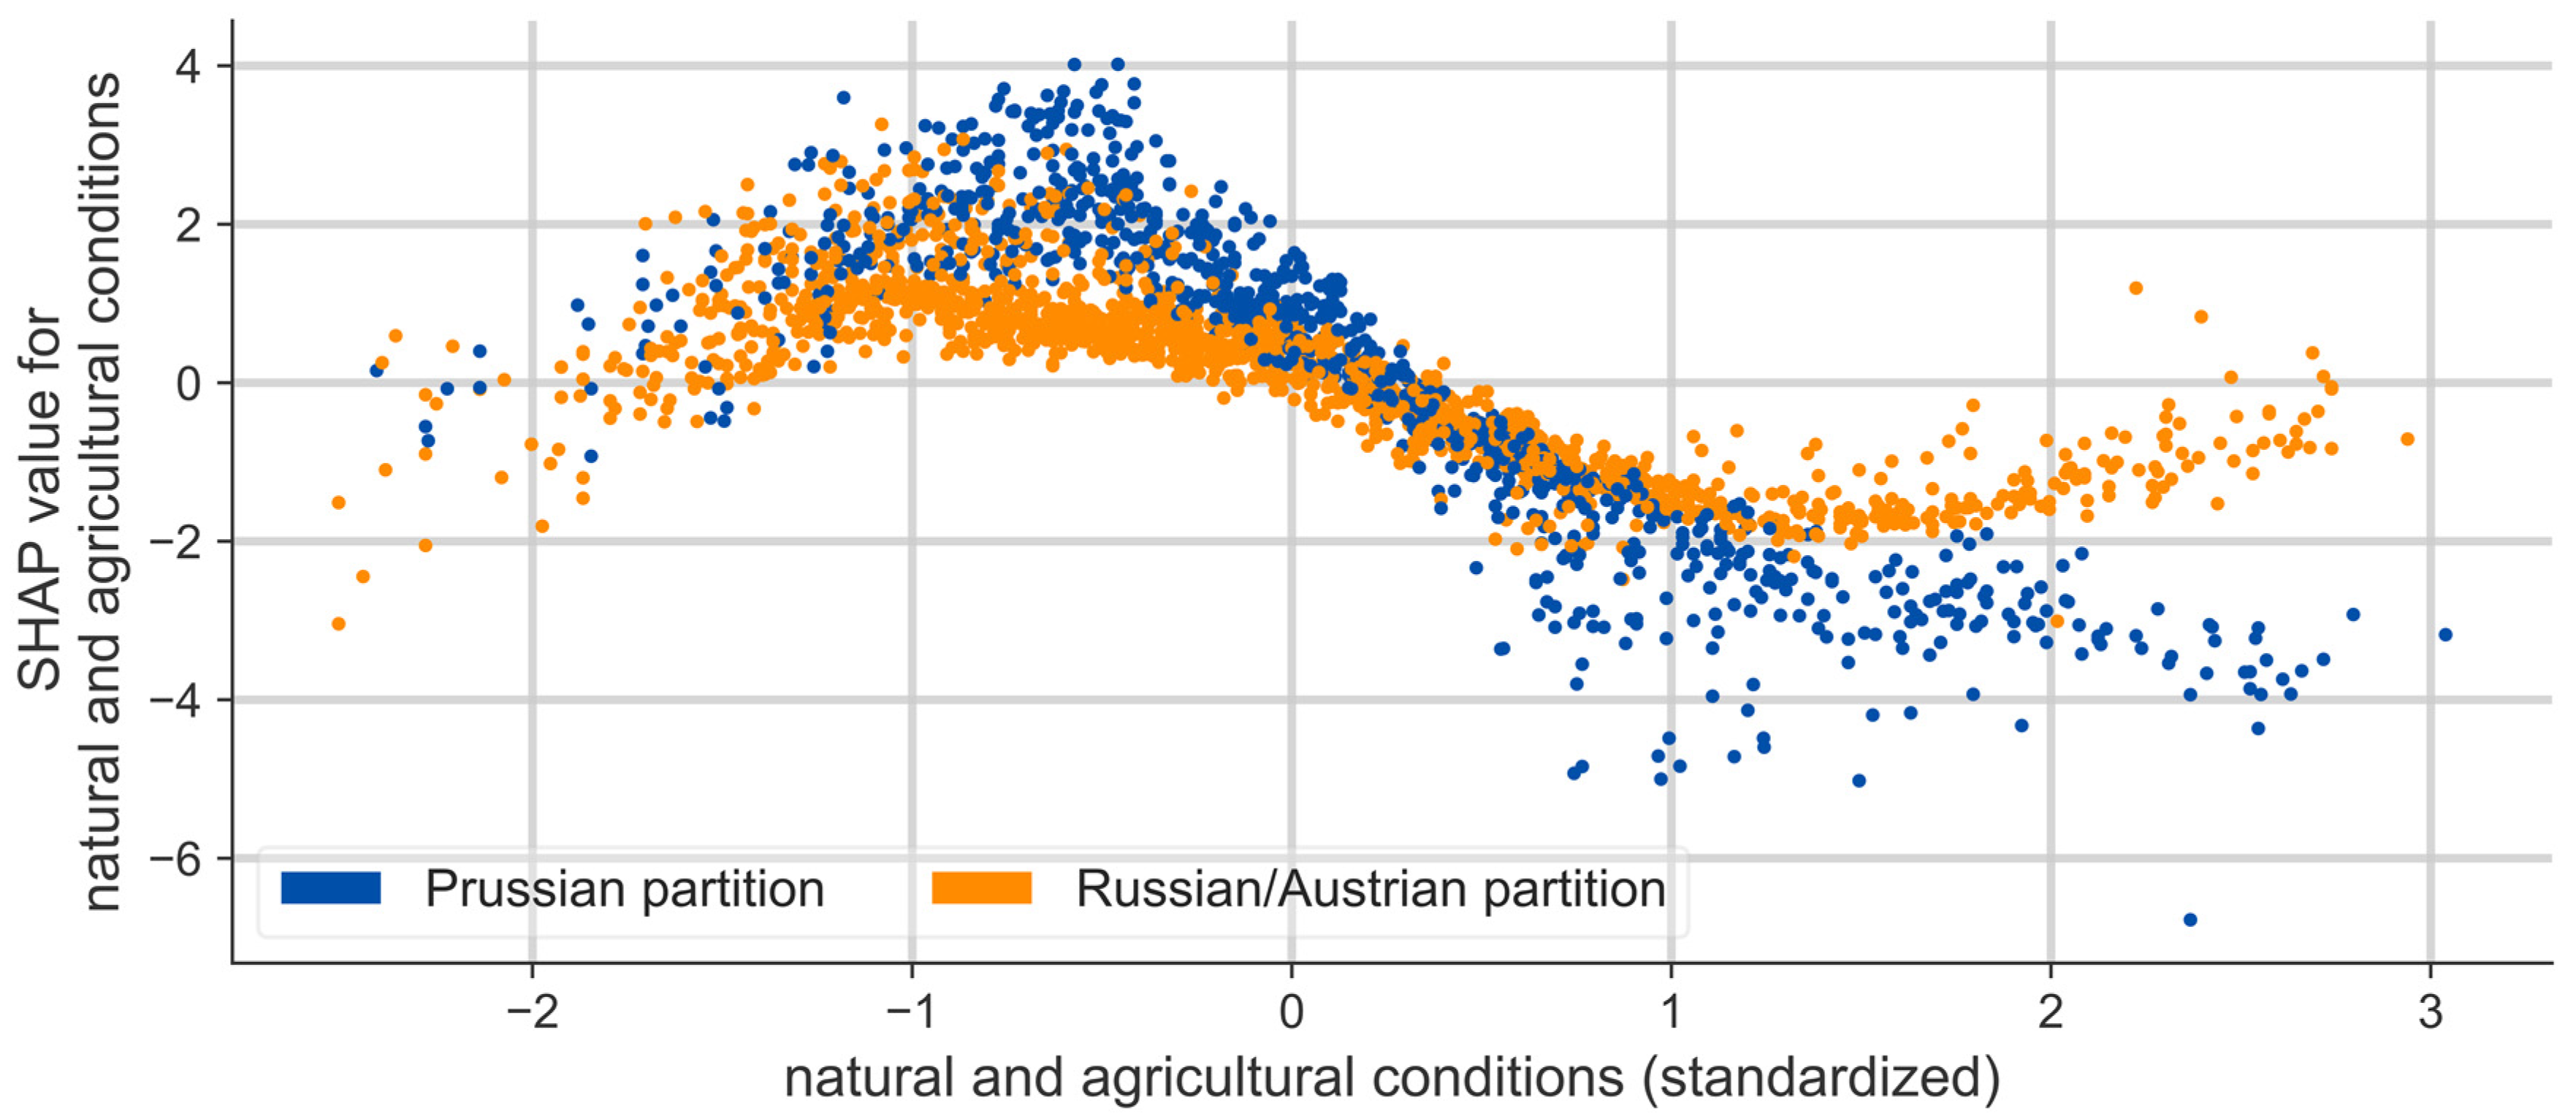
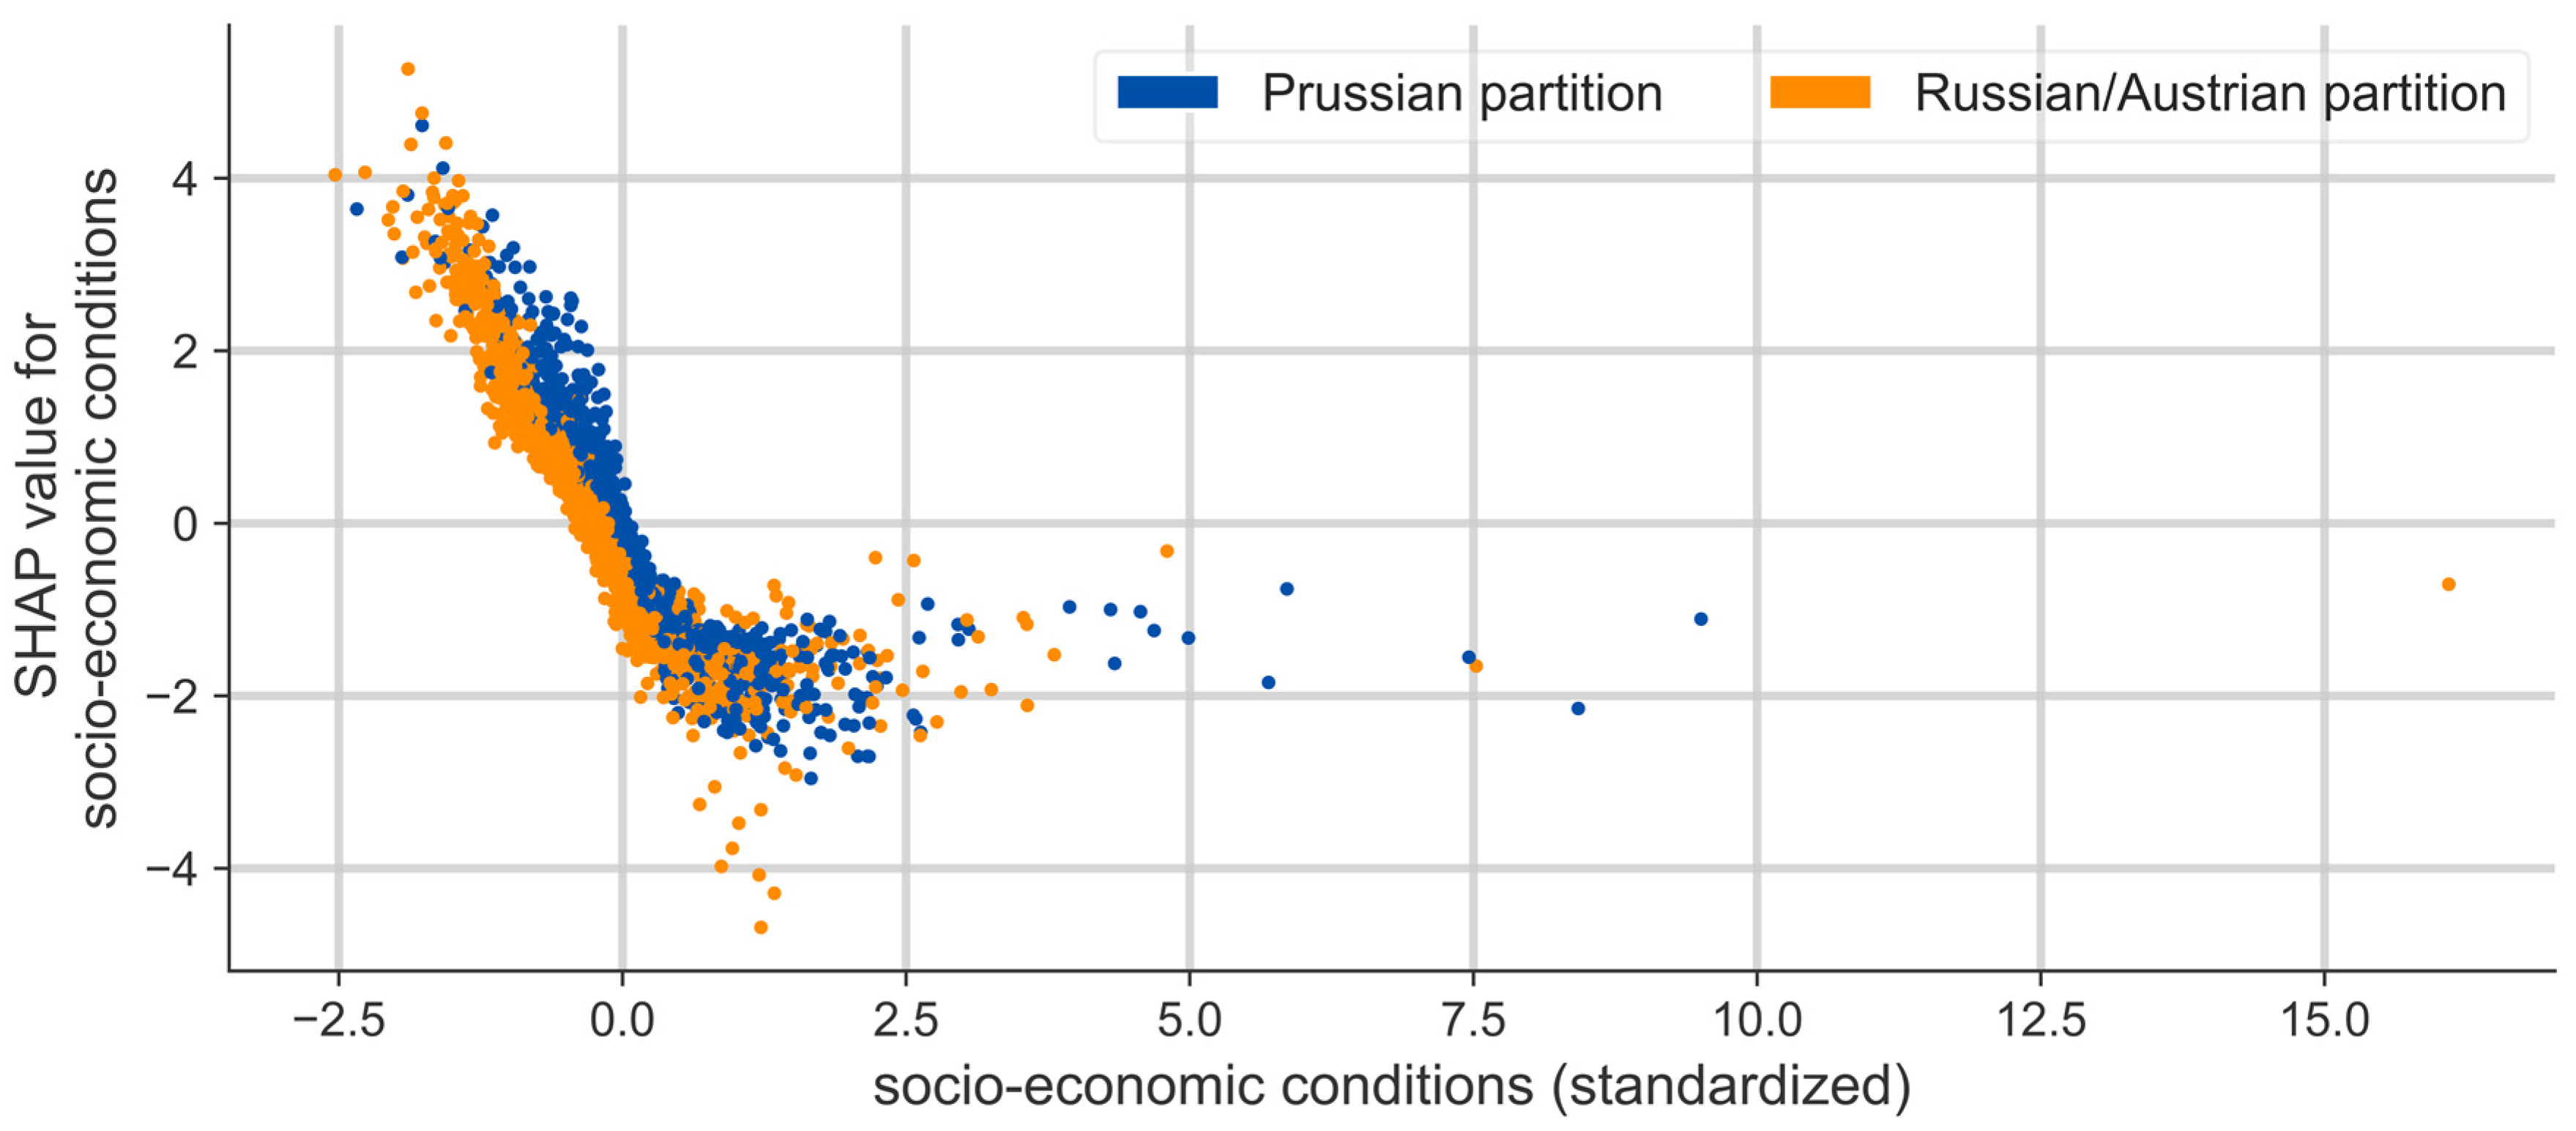
Disclaimer/Publisher’s Note: The statements, opinions and data contained in all publications are solely those of the individual author(s) and contributor(s) and not of MDPI and/or the editor(s). MDPI and/or the editor(s) disclaim responsibility for any injury to people or property resulting from any ideas, methods, instructions or products referred to in the content. |
© 2023 by the authors. Licensee MDPI, Basel, Switzerland. This article is an open access article distributed under the terms and conditions of the Creative Commons Attribution (CC BY) license (https://creativecommons.org/licenses/by/4.0/).