Abstract
To understand hydrocarbon migration in terms of the mechanisms, accumulations and exploration targets, it is essential to correctly identify and characterize the carrier systems that control fluid-migration history and oil/gas reservoir formation. The Yinggehai Basin in China is an important area for natural gas exploration and production. However, due to the argillaceous sand sedimentary environment and the absence of faults from the Neogene thermal subsidence period, traditional migration pathways are absent in the Yinggehai Basin, posing significant challenges to target evaluation in this area. Exploration shows that most of the existing gas reservoirs are associated with vertical migration. In this work, coherence cube and curvature seismic techniques are used in the central diapir zone of the Yinggehai Basin to identify diapir-associated fractures and regional stress. Together with geological analysis, two categories of carrier system are discussed in detail to explain the complex migration and accumulation patterns that have puzzled the area. Diapirs have five evolutionary phases, i.e., pressurization, piercing, equilibrium, release and collapse, which have different fracture development patterns, leading to different mechanisms of hydrocarbon migration and accumulation. The carbon isotopes of gaseous hydrocarbons in DF shallow layers and mid-deep layers have an inverted order distribution, indicating mixed accumulation with different maturity, whereas in the mid-deep layers of the diapir-affected areas, there is a single accumulation with low maturity. Early diapiric activity allowed the natural gas produced from deep source rocks to migrate upward along the diapiric carrier system and accumulate in suitable traps to form gas reservoirs. For regional-stress related fractures, the gradual loss of overpressure and fluids from deep to shallow in high-pressure fractures results in the gas accumulation time of deep traps in the regional stress-related carrier system being relatively late and the gas accumulation time of shallow traps being relatively early.
1. Introduction
When oil and gas are released from source rocks, they migrate through geological bodies to suitable traps to form the oil/gas reservoirs. The complex of geological bodies in a basin or region is called the carrier system. It can include sedimentary sand-bodies, faults, fractures and their combinations. The understanding of the carrier systems is essential for research into the hydrocarbon accumulation mechanism and oil/gas exploration [1]. During a basin evolution, the carrier system is in a process of continuous development and change. Therefore, studies of the carrier system need to be carried out in a specific time and space domain. Meanwhile, the migration and accumulation of oil and gas often occur many times during basin evolution, which can cause important changes in the physical properties and connectivity structure of the carrier system in a hydrocarbon system, even fundamental changes in the dynamic system of oil and gas accumulation, such as the opening and closing of faults and fractures [2]. For hydrocarbon migration, the carrier systems can be divided into two categories: lateral migration systems and vertical migration systems. For horizontal migration, the carrier systems mainly include sand-bodies and the hydrocarbons migrate through the pressure gradients [3]. For vertical migration, hydrocarbons migrate by gravity-driven buoyancy. Vertical carrier systems include faults, diapirs and fractures, which have relatively higher porosity and permeability. They are more easily penetrated by hydrocarbons due to the lower capillary pressure [4].
The Yinggehai Basin is located at the intersection of the Eurasian Plate, the Pacific Plate and the Indo-Australian Plate. It is a Cenozoic high-pressure, conversion-extension type gas-bearing basin developed on the northwestern continental shelf of the northern South China Sea [5]. Diapirs are commonly developed in the Yinggehai Basin, and the relationship between diapirs and hydrocarbon migration and accumulation has been studied in detail for decades [6,7,8]. It was generally believed that the diapir structure in the central depression of the Yinggehai Basin played an important role in natural gas migration and controlled the formation, accumulation and distribution of natural gas hydrates. However, early drilling results (2000–2010) from 11 wells by the China National Offshore Oil Corporation showed that there were no commercial gas reservoirs in the eight diapir cores and the exploration results were unsatisfactory for explaining the existence of diapirs. Instead, some gas fields or gas-bearing structures have been discovered near the diapir area [9]. It has been realized that the carrier system of the central diapir zone in the Yinggehai Basin is not as explicit as it seems. A more complex and proper characterization of the vertical migration requires further studies combining geological analysis and geophysical techniques.
During diapir evolution, the fracture pattern hosted in the overburden can register the interaction between diapir-related and remote regional-stress fields [10]. Vertical fluid migration along the fracture surface has episodic intervals. In the active phase of faults and fractures, fluids migrate episodically, driven by the “seismic pump” [11]. In the inactive phase, the fluids migrate via the induced micro-fracture network, driven by buoyancy. For the exiting gas fields explored in Yinggehai Basin, most of them are related to the hydrocarbon migration and accumulation through faults and/or fractures. The changes in paleo-heat flow, vitrinite reflectance, oxygen isotope and trace elements of wells drilled around the faults can also be used as direct evidence of fluid flow, while geophysical responses such as gas chimneys and pockmarks, as well as formation water salinity, nitrogen compounds, etc., can be used as indirect evidence of fracture conduction [12]. In order to understand fracture evolution and its impact on hydrocarbon accumulations, the seismic methods should be used to identify the diapirs and the regional deformation processes. The gas composition, the isotope data and fluid inclusion data must be combined to infer the process and characteristics of gas reservoir formation.
Jenkins et al. made a breakthrough in the formation and evolution of fractures from the perspective of rock-fracture theory and structural curvature [13]. With the rapid development of computer technology and the wide application of 3D seismic exploration technology, seismic attribute technologies have developed in leaps and bounds, and have gradually become a part of modern 3D seismic data interpretation. Three-dimensional coherence technology is an important technology for 3D seismic attribute analysis [14]. It uses the similarity of seismic signals between adjacent traces in a 3D seismic data volume to describe the lateral heterogeneity of strata and lithology. A set of technologies for 3D seismic data interpretation consists of related technologies such as 3D coherence technology, dip angle, azimuth attribute technology, wave field attribute technology, space difference technology, fractal dimension technology, wavelet transform, etc. [15]. These technologies can avoid the disadvantages of only interpreting from breakpoints, sections, horizons, etc. in conventional 3D seismic data. They can also improve the speed of interpretation and shorten the exploration cycle. In addition, the degree of fragmentation and its detail near faults, paleogeomorphology, paleostructure, sedimentation, etc. can be understood by the new technologies [16].
The official introduction of the technology of seismic coherence analysis took place at the 65th SEG Annual Meeting in 1995. M. Bahorich and S. Farmer of Amoco Corporation proposed the concept of coherence and the method of applying seismic coherence data [17]. Due to the excellent application effects of this technology in fault interpretation, especially the automatic interpretation of small faults, it caused a sensation at the 65th SEG Annual Meeting. At present, seismic coherence analysis technology has become an indispensable technical method in the interpretation of 3D seismic data. The technology not only effectively improves the interpretation efficiency and accuracy of seismic data, but can also highlight the discontinuity of seismic data volume, quickly and accurately identify faults and stratigraphic sedimentary features and directly describe reservoirs intuitively with detail. In recent years, many scholars have proposed many improved methods for seismic coherence analysis techniques, developed coherence analysis techniques based on geometric structure tensors and extended them to the application of pre-stack seismic data [18,19,20]. Song and Liu (2003) [21] proposed a calculation method for multi-vector attribute-coherent seismic data volumes based on the eigenvalue structure, which overcomes the imperfection of incomplete information of a single attribute coherence algorithm. Wang et al. (2002) [22] introduced wavelet analysis into the coherence calculation and used the wavelet domain frequency division method to reconstruct the seismic coherent data volume by frequency division, effectively highlighting the previously neglected small fault information. Sun and Du (2000) [23] used the power method to replace the traditional Jacobian method to find the eigenvalues of the matrix, which greatly improved the computational efficiency of the third-generation coherence algorithm.
In this work, the coherence method and curvature method are applied on to the central diapir zone in the Yinggehai Basin (red boundaries in Figure 1) to identify the developments of the diapirs and regional stress. Based on the diapir phase and regional-stress state, the conditions of factures and faults can be analyzed, which will help to characterize the gas accumulation process. The paper is organized as follows. In Section 2, the geological background of the Yinggehai Basin is reviewed. In Section 3, the coherence cube and curvature methods are introduced and applied in the central diapir zone to identify the fractures induced by diapirs and regional stress. In Section 4, the carrier systems and hydrocarbon accumulation processes are analyzed and matched, combining the identification of the carrier systems with test results such as gas compositions and carbon isotope experiments. The main conclusions of the work are discussed in Section 5.
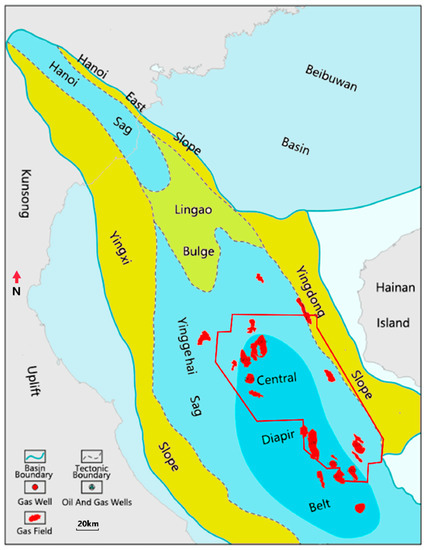
Figure 1.
Tectonic map of the Yinggehai Basin, China, showing the location of the study area within the red lines.
2. Geological Background of Fracture Development
The Yinggehai Basin is located in the Yinggehai Sea between the southwestern continental margin of Hainan Island, China, and the central southern continental shelf of Vietnam. The basin is a Cenozoic strike-slip extensional basin developed in the passive continental margin in the northern part of South China Sea [24]. The area is approximately 11.3 × 10⁴ km2. The basin strike is NW–SE. There are four primary structural units, including the Yingdong slope, Lingao uplift, central sag and Yingxi slope. There are two secondary negative tectonic units, namely Hanoi sag and Yinggehai sag (Figure 1). The thickness of the Cenozoic interval is up to 17 km. The thermal gradient is high, which is 4.25 °C/100 m. The deposition rate is 500–1400 m/Ma. Due to the internal thick, fine deposits, high temperature and pressure, and the dextral strike-slip stress field, there are many north-south oriented, and en echelon distributed diapirs have developed.
After more than 30 years of exploration, commercial natural gas reservoirs and hydrocarbon-bearing structures have been found in the Yinggehai Basin. Exploration research has mainly focused on the Yinggehai, Huangliu and Meishan formations. In the Yinggehai formation, there are mainly normal temperature and pressure gas reservoirs. The Huangliu and Meishan formations are mainly high-temperature and high-pressure gas reservoirs. Most of the gas reservoirs are associated with the diapir activities [25]. Further details are shown in Figure 2.
In the eastern part of the Yinggehai Basin, the Honghe fault zone extends to the South China Sea, and the Yingdong fault zone and the No.1 fault zone develop. In the west, there are Zoumajiang fault, Changshan fault and Yingxi fault. In the north, there is the Moshuihe strike-slip fault. In the south, there is the Zhongjian strike-slip fault. In its geological history, the basin experienced a rifting stage in Paleogene and thermal subsidence stage in the Neogene and Quaternary [26].
In the Eocene, the collision of Indian and Eurasian Plates led to the sinistral movement of the Honghe fault. The Yinggehai Basin started to develop and the tensile stress orientation was NNE–SSW [27]. From the late Oligocene, there was large-scale sinistral movement of the Honghe fault and the strike-slip stress in the Yinggehai Basin was greatly enhanced. The tensile stress orientation changed to NE–SW. From early Miocene to late Miocene, the sinistral movement of the Honghe fault slowed down and the stress field in the basin changed significantly. The tensile stress orientation changed to E–W. After that, the Indian Plate penetrated the Eurasian Plate and the extrusion of the Indonesian Plate stopped. The Honghe fault changed to dextral strike slip. The basin began to experience large-scale deposition and the deposition center shifted from the DF region to the LD region [28].
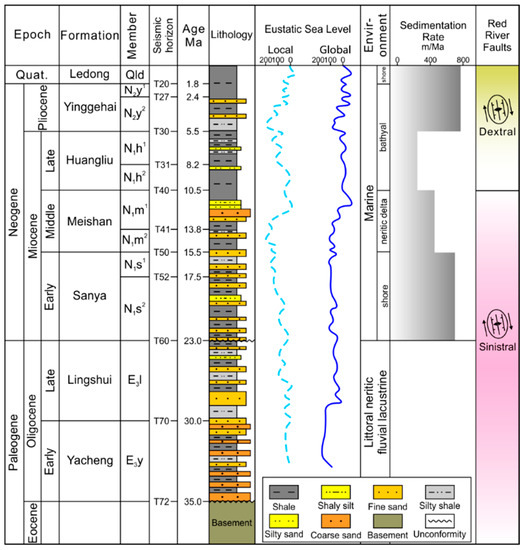
Figure 2.
The stratigraphic profile of the Yinggehai Basin (from [29] Li et al., 2022).
Figure 2.
The stratigraphic profile of the Yinggehai Basin (from [29] Li et al., 2022).

Combining the tectonics and deposition, the Yinggehai Basin has experienced four episodes.
- (1)
- Faulted episode (Eocene to early Oligocene)
This episode was the initial period of basin development. The Indian Plate converged with the Eurasian Plate. A relatively rapid extrusion movement occurred in the Indonesian Plate. The Honghe fault zone extended into the northern part of the Yinggehai Basin. The basin was stretched in a sinistral oblique direction along the basin-controlling faults. In the background of the stress field, many normal faults developed in the basin, which controlled the initial deposition.
- (2)
- Faulted-depression episode (late Oligocene)
This episode was a development period. The collision of the Indian Plate and Eurasian Plate continued. The stress field of the region was changed by the expansion of the South China Sea. The fault activity was intense and the deposition rate was high. The new depositional center was controlled by the horizontal extension of the faults. The connectivity of the faults is improved.
- (3)
- Thermal subsidence (Early to middle Miocene)
The basin matured during this episode. The extensions of the Honghe fault and the South China Sea became weaker, and regional tectonics entered a quiet period. From 15.5 Ma to 5.5 Ma, the Honghe fault was still sinistral, and the sedimentary layers underwent folding controlled by the sinistral shear stress field in the S–N direction in the Yinggehai Basin. A series of tectonic inversions occurred in the northwestern part of the basin and the intensity decreased from northeast to southwest. Meanwhile, the depositional center shifted to the southeast.
- (4)
- Accelerated deposition (Late Miocene to Quaternary)
The basin was still in general thermal subsidence and the subsidence rate increased. At about 5.5 Ma, the Honghe fault became dextral strike slip and changed the stress state. In the deeper part, the stress was released and this increased the magmatic activity in the surrounding areas. Inside the basin, the faults in the S–N orientation triggered the diapiric activities of the hot fluids and led to the formation of the central sag diapiric structure.
The diapirs are commonly developed in the Yinggehai Basin. The formation of diapirs in the central depression belt was caused by the overpressure of the formation. They were stimulated by the tectonic activities. The fluids in the uncompacted environment accumulated and created overpressure. When the deep layer was sufficiently pressurized and influenced by the dextral strike-slip extension of the faults, the fluid and plastic substances migrated upwards through the weak part of the formation. This created the diapir bodies. The evolution of diapirs is usually divided into five phases.
(1) Pressurization. Due to tectonic influences, the pressure of the formations continues to increase. The deep formation begins to deform. Small faults and fractures develop and become the migration channels for fluids.
(2) Piercing. The core part of the diapir is clearly arched upwards. The overlying formations are fractured. A large number of faults develop. The faults are the main channels for the migration of high-temperature fluids. The overpressure interface in the formation develops gradually from a deep to shallow formation. The deep high-pressure or high-temperature fluids in the diapir migrate to the shallow formation, but the high-pressure energy in the deep formation maintains the pressurization and thermal fluid charging of the shallow formation.
(3) Equilibrium. When the deep high pressure has decreased, the formation pressure decreases and the fluid flow decreases. A large number of formation fractures and faults are closed and deep thermal fluid flow decreases.
(4) Release. After a long period of high-pressure fluid loss, the evolution of the diapirs has entered the release phase, which is generally in the form of anticlines. However, the core layers collapsed on a large scale, showing the characteristics of an “M” type double peak structure. During the release period, the core part of the diapir collapses, the degree of fracturing of the formation increases, and the loss rate of high-pressure and high-temperature fluid increases.
(5) Collapse. As the extent of layer collapse gradually increases from the core of the diapir to the entire diapir and even the periphery, the rate of formation high-pressure, high-temperature fluid loss within the diapir’s subsidence zone increases geometrically, and the layer becomes a giant syncline or depression subsidence, which is the characteristic of diapirs during the collapse phase.
3. The Seismic Attribute-Analysis Methodologies
The characterization of vertical fluid-migration systems involves the identification and classification of pathways, in particular fractures. In hydrocarbon exploration, the seismic data used for fracture prediction are typically pre-stack azimuthal anisotropy data and post-stack seismic attributes. The pre-stack azimuthal anisotropy data are used to predict the fracture intensity and directions [30,31,32]. The post-stack seismic attribute data are used to characterize the fault and fracture development zones using the coherence cube, variance cube and curvature analysis techniques [33,34]. In this section, the coherence cube and curvature attribute technologies are presented and used to characterize the fractures developed in the central diapir zone of the Yinggehai Basin.
3.1. Coherence Cube
Bahorich and Farmer (1995) [17] proposed a three-point coherence algorithm. The general idea is to calculate the coherence coefficients of the points on the seismic trace to evaluate the continuity of the body. The method has been continuously modified and updated. This type of method is called coherence cube. Gersztenkorn and Marfurt (1999) [35] proposed an updated coherence cube method based on eigenstructure. In this method, the eigenvalues of the coherent matrix are used to calculate the coherence values. For seismic data, the trace sampling data form a matrix, D.
where denotes the amplitude value of the nth data in the trace (). Let N = 2K + 1, and construct a covariance matrix , where p and q represent the time shift of the neighboring traces in the x and y directions.
where . If the original data values are not all zero, then will have M non-negative values. Since the matrix is a symmetric positive semidefinite matrix, the trace of the covariance matrix can be represented as follows.
where is the sum of the eigenvalues of the matrix C. The coherence values are defined as the ratio of the principal eigenvalue to the trace.
where is the mth eigenvalue of the covariance matrix , and is the largest eigenvalue. When p = 0 and q = 0, the coherence value can be obtained.
3.2. Curvature
For a differentiable curve, the curvature at a point is the curvature of its oscillating circle, i.e., the reciprocal of the radius of the oscillating circle. For surfaces, the curvature of a point depends on the choice of a direction on the surface, including maximum curvature, minimum curvature, average curvature and Gaussian curvature. The curvature attribute is used to reveal the physical meaning of geological tectonics. Roberts (2001) [34] provided a comprehensive review and classification of the application of curvature attribute techniques. Other authors [36,37,38] have extended its applications to layer curvature interpretations.
To calculate the curvature of a point in a layer, the surface function is usually constructed with using the surrounding eight points in the seismic data. The following regression function is used.
The parameters a–f can be easily calculated from the location data of the correct points. Different types of curvature attributes can be calculated. Table 1 shows the equations for different curvatures.

Table 1.
Equations for different curvature attributes.
3.3. Results
The coherence cube is applied to the central diapir zone. This area is located in the central part of the Yinggehai Basin. Figure 1 shows the area with red boundaries, depending on the seismic data acquisition. The area includes the main existing gas fields. In a vertical direction and from bottom to top, it includes the Sanya formation (seismic boundary from T60–T50), the Meishan formation (T50–T40), the Hunagliu formation (T40–T30) and the Yinggehai formation (T30–T20).
As discussed in the previous sections, diapir regions are important hydrocarbon migration channels as fractures become more developed. They are also now stress concentrated and the seismic surfaces are more discontinuous. Using the coherence-cube method, the coherence attribute can be calculated using Equation (4) in Section 3.1. The plots of the coherence values for each seismic layer are shown in Figure 3. The diapirs can be clearly seen from the results. In the stress-concentrated areas, the coherence values are clearly low (dark blue lines or blocks in Figure 3), indicating a high probability of fracture development. Apart from a few obvious banded geometries indicating the presence of submarine mid-fan channel sediments, the coherence gives a good insight into the distribution of fractures in different seismic reflection interfaces.
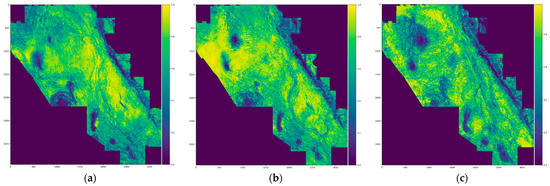
Figure 3.
The coherence attribute of the seismic reflection interfaces T30–T50. (a) T30, (b) T40, (c) T50.
The coherence values in the interfaces of T40 and T50 are generally low, indicating that fractures are more widely distributed in deep layers such as the Meishan and Sanya Formation. However, for each diapir structure at different stages, the degree of development of diapir-related fractures in each seismic reflection interface shows no obvious regularity with increasing depth. For the diapir in the collapse stage at the center of the study area, the large scale of fractures, even faults, occur in the shallow layers such as the Huangliu and Yinggehai formations. For diapirs in the equilibrium and piercing stages, associated fractures tend to develop more widely in deeper strata. Regional stress plays an important role in inducing fractures in the southern part of the eastern slope, which are more widespread in the mid-deep strata.
The maximum curvature and minimum curvature are considered to be the most valuable in revealing surface continuity compared to other attributes. In this paper, the maximum curvatures of different seismic interfaces are calculated (Figure 4). The results show that the high curvature values in T30–T40 are not widely distributed. This is because the structures in the Yinggehai and Huangliu formations are simple and the deformations are not so complex. However, the high curvature values in T50–T60 are widely distributed. This implies that the deformations in the deep formations (Sanya and Meishan) are more complex. Compared with the coherence-cube results, the curvature results cannot clearly show the diapir. However, it is more sensitive to the tectonic stress field. The No.1 fault in the eastern boundary of the Yinggehai Basin is clearly shown in each panel of Figure 4.

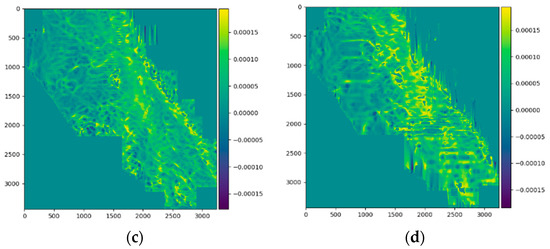
Figure 4.
The maximal curvature of the seismic reflection interface from T30–T60. (a) T30, (b) T40, (c) T50, (d) T60.
In the central diapir zone, there are three main types of fracture development associated with different controlling factors: (1) diapir associated, (2) overpressure associated, and (3) regional stress associated.
- (1)
- Diapir-associated fractures
The diapir-associated fractures developed as the diapirs pierced the overlying strata. The overlying strata could be fractured by the fluids and plastic materials under high pressure and stress disturbance [39,40]. The diapir-associated faults and fractures are the main cause of roof destruction. The destruction of roof strata in 3D seismic attributes has both commonalities and individualities. The central areas of destruction are usually shown as high amplitude fuzzy bodies. Micro-fractures usually develop and gas accumulates within the regions. From the central region to the surroundings, radial fractures, cyclic fractures and compound fractures are commonly found. In the Yinggehai Basin, different diapirs are in different stages of life cycle and stress state and the fractures can be classified into different types, which are trans-tensional fractures and collapse fractures.
- Trans-tensional fractures
The trans-tensional fractures are usually formed under the control of vertical and horizontal stresses. The fractures extend vertically at a high angle. The deformation of the layer is small. The natural gas accumulates and a high amplitude can be found in the seismic data. In the DF and LD areas, a single fracture/fault has a thickness ranging from 500 m to 2000 m. The fault displacement is about 50 m. The width of the fracture zone is about 4 km. The diapir in the DF1-1 area is in the equilibrium phase. The diapir at LD15-1 is in the piercing phase and both have a similar fracture pattern. However, the directions of the stress are different, resulting in different fracture directions. In DF1-1, the fracture direction is mainly NNW–SSE. In LD15-1, it is mainly NWW–SEE. From the coherence values, the fractures can be extracted and the orientations are clearly identified. Figure 5 shows the images of the coherence values of the diapir areas DF1-1 (Figure 5a) and LD15-1 (Figure 5b).
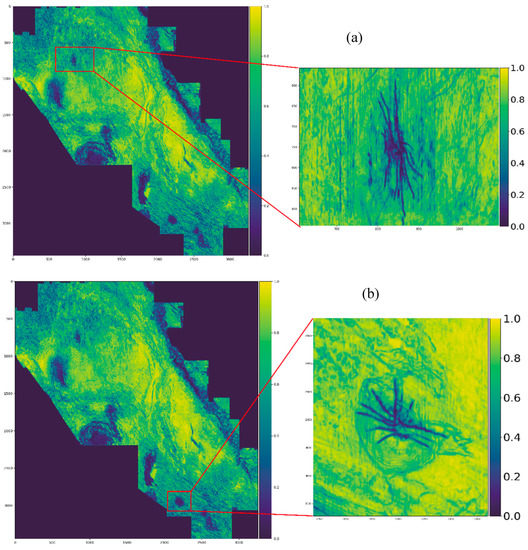
Figure 5.
The coherence values and fracture interpretations in the diapir areas of DF1-1 (a) and LD15-1 (b).
- Collapse fractures
The collapse fractures are formed after the roof layer is destroyed. The width of the fracture zones is usually large. From the collapse center to the surrounding areas, the faults and fractures form radial to cyclic patterns. The collapse fractures are complex after different stages of evolution. The collapse diapir in the central diapir zone is shown in Figure 6.
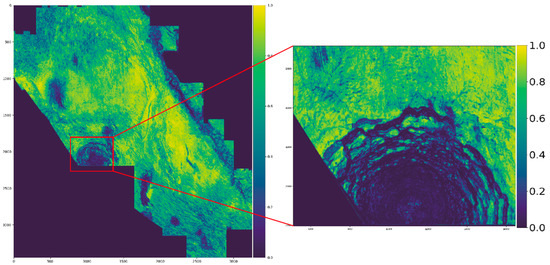
Figure 6.
The coherence values of the collapse diapir in the study area.
- (2)
- Overpressure-associated fractures
Fluid fracturing is a common phenomenon during diapir piercing [41]. The high temperature and high pressure of fluids within a vertical migration channel is an important geological feature. In the process of high-pressure fluid evolution, once the fluid pressure is greater than the fracturing pressure of the rock, the rock is fractured and is an important space for hydrocarbon migration and accumulation. In the overpressured zone of the Yinggehai Basin, fractures have clearly developed [42,43]. The fractures are usually vertical and have an en echelon distribution.
The cast sheet images of the study area show the distribution of fractures and micro-fractures. Figure 7 shows that some of the fractures were filled with calcite veins and some have pitches left over from hydrocarbon migration. The fractures propagate along the mineral grain boundary, but high hardness minerals such as quartz were not fractured. This phenomenon suggests that the fractures were caused by high-pressure fluids rather than tectonic stress.
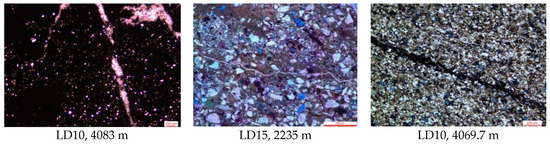
Figure 7.
The micro-fractures in the LD overpressure regions shown in cast-sheet images.
- (3)
- Regional-stress associated fractures
The regional-stress associated fractures are also found in the central diapir zone. In the Neogene period, the Yinggehai Basin was in a shear-stress environment. Under NW–SE sinistral strike-slip stress, a high density of near E–W trending fractures and small faults developed in the Meishan formation and lower formations. The local tensile failures are triggered by the left strike-slip fault, which induces the north-south trending stress field (Figure 8).
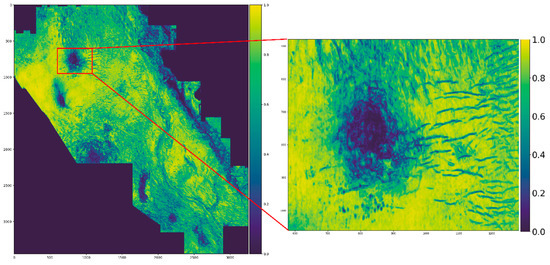
Figure 8.
The coherence values at T40 and the near E–W trending fractures identified.
4. The Carrier Systems and Hydrocarbon Accumulations
As discussed in Section 3, fractures are the main migration channels for hydrocarbons. Fractures are generally induced by the diapir structures, the overpressure and the regional stress. The first two factors are correlated. In this section, the carrier systems and their relationship with the hydrocarbon accumulations are discussed in two categories, i.e., diapir-related and regional-stress related carrier systems. The former are the carrier systems with fracture migration channels induced by the diapir structures and the overpressure developed in diapir regions. The latter are the carrier systems with fractures induced by the regional stress.
4.1. Diapirs
Exploration programs have shown that diapirs in phases of piercing, equilibrium and release were associated with hydrocarbon accumulations. In particular, the diapir structure in the equilibrium phase usually shows large-scale gas reservoirs. This type of gas reservoir has gas-bearing layers from deep to shallow vertically and shows the characteristics that the multiphase gas accumulations are highly related to the diapir evolution periods.
- Gas compositions vary at different tectonic locations
In diapirs and the areas affected by them, there are characteristics of multiphase gas accumulations that correspond to the multiphase diapir activity. In the DF gas field, the maturity threshold depth of the hydrocarbon source rock is about 2800 m. The gas depth of the shallow layers is less than 1300 m. In the shallow layers of the core part of the diapir, a considerable amount of natural gas is accumulated, with ranging from −43.35‰ to −30.3‰, ranging from −28.8‰ to −21.8‰ and ranging from −20.7‰ to −0.7‰ (Table 2). The carbon isotopes of gaseous hydrocarbons have an inverted order distribution. The results show that natural gases at different stages of maturity are charged and mixed. On the other hand, gas with ranging from −35.3‰ to −30.3‰, ranging from −26.6‰ to −24.9‰ and ranging from −10.5‰ to −3.2‰ accumulates in the middle-deep layers. The carbon isotopes of the gaseous hydrocarbons also have a locally inverted order distribution. Natural gas is more mature and has the characteristics of mixed accumulations of different maturity.
Table 2.
Sample statistics of the gas-charging sequence in the DF area, Yinggehai Basin.
In the mid-depth layers of the diapir-affected areas, ranges from −39.3‰ to −33.1‰. ranges from −28.6‰ to −25.5‰. ranges from −15.9‰ to −7.2‰. There is rarely an inverted order in the carbon isotope distribution. This shows the characteristics of a single accumulation. The gas maturity is low and the CO2 is mainly of organic origin.
- Matching of diapir and gas accumulation
As discussed in the previous sections, there are five phases of diapir evolution. During the pressurization phase, the rate of gas dissipation is low and the scale of accumulation is usually small. In the piercing phase, the core of the diapir arches upwards and the caprock is intensely fractured. Once the pore pressure was above the threshold pressure, gas bearing fluids migrated upwards through the fractures. The hot-fluid migration reduced the pressure in the deep formation, allowing the natural gas to separate and accumulate in gas reservoirs. Zhu et al. (2015) [26] compared the composition of gas and carbon isotope characteristics in the mid-deep layers with high temperature and pressure, and those in the shallow layers with normal pressure and transition zone, and concluded that in the diapir active phase, it was the early mature gas charge and the main accumulation period in diapir areas. As the pressure decreased with fluid migration, diapir activity became quiescent and entered the equilibrium phase. As the pressure increased again, the diapirs became active and late-period mature gas recharged the reservoirs. Meanwhile, the early gas reservoirs changed. With periodic pressure accumulation, caprock fracturing and pressure release, the diapirs acquired the multiphase episodic characteristics in the shallow and deep gas reservoirs. Due to the different intensity of diapir activities in different geological histories, the affected scope and intensity were different. In the diapir and its affected areas, the gas reservoirs usually show the characteristics of multiphase charging and alteration. In the non-diapir area, the gas reservoirs show single phase charging and exsolution of water.
4.2. Regional Stress
The migration and accumulation of hydrocarbons in fractures controlled by regional stress is different from that in diapir-associated structures. In deep-trap structures, the hydrocarbon accumulation time is usually late, and shallow traps usually show early accumulation. From the carbon isotope analysis of natural gas samples in the LD area in the Yinggehai Basin, in the deep Huangliu formation, of gas ranges from −34.0‰ to −34.0‰. ranges from −22.6‰ to −22.2‰. The molar fraction of methane ranges from 89.4% to 90.6%, and the molar fraction of ethane and heavier hydrocarbons ranges from 2.7% to 2.8%. The ratio is about 0.97, indicating high maturity. In the shallow layers, the of gas ranges from −39.7‰ to −36.1‰. The ranges from −25.8‰ to −24.1‰. The molar fraction of methane ranges from 85.2% to 87.9% and the molar fraction of ethane and heavier hydrocarbons ranges from 7.1% to 7.8%. The ratio is about 0.92, indicating lower maturity and earlier accumulation.
The characteristics that early hydrocarbon accumulation occurred in shallow reservoirs and late hydrocarbon accumulation occurred in deep reservoirs suggest that overpressure and the fluids episodically migrated from deep to shallow reservoirs through fractures. When the pore pressure is greater than the fracturing pressure, the overlying layer is fractured and fluid can migrate into the overlying layer. The overpressure in the lower strata decreases and the fractures close until the pressure increases. This process results in the accumulation of early hydrocarbons in shallow reservoirs and late hydrocarbons in deeper reservoirs.
5. Conclusions
The central diapir zone in the Yinggehai Basin is an important area for natural gas accumulation. Vertical migration from the deep source rocks through fractures is the main pathway for gas accumulation. The fractures are mainly induced by two factors, i.e., diapir development and regional-stress induced fractures. In this study, the coherence cube and curvature calculation methods were applied to the seismic data to identify the diapir development and the controlling factors on the formation discontinuity evolution. The calculation results are used to characterize the diapirs at different stages, and three types of fractures associated with the diapirs are identified and discussed in the central diapir zone. (1) Trans-tensional fractures develop in diapirs in the piercing and equilibrium phases. The diapir is active with sufficient energy and a large number of fractures with wide apertures have developed. This provides an efficient migration channel for fluids. (2) The collapse fractures in diapirs in the collapse phase usually widely develop radially and cyclically around the collapse zone. Due to the lack of sufficient trapping and the loss of hydrocarbons, commercial gas reservoirs are rarely formed in such regions. (3) Overpressure-associated fractures usually develop in deep formations and are induced by overpressure. They are mainly micro-fractures and some are refilled by secondary minerals such as calcite. The fractures are an important space for hydrocarbon migration and accumulation in deep formations.
Based on geological analysis, two carrier systems of the central diapir zone in the Yinggehai Basin was clearly identified, and their migration and accumulation patterns were detailed, hopefully providing some insights for future natural gas reservoir development.
In general, the carrier systems in the central diapir zone can be divided into two categories: (1) diapir-related carrier systems and (2) regional-stress related carrier systems. For the diapir-related carrier systems, the isotopic and gas composition results show that the multiphase activities of diapirs are the main controlling factors of natural gas accumulation. The periodic process of pressure build-up, caprock fracture and pressure release caused shallow and deep gas migration into the deeper core to form gas reservoirs.
The migration and accumulation pattern in the regional-stress related carrier systems is different. The gradual loss of overpressure and fluid from deep to shallow in high-pressure fractures results in the gas accumulation time of the deep trap in the regional-stress related carrier system being relatively late, while the gas accumulation time of the shallow traps is relatively early.
Author Contributions
C.F. conducted the modeling work, and wrote and revised the manuscript; K.W. worked on computations and reviewed the manuscript; J.L. reviewed and revised the manuscript. All authors have read and agreed to the published version of the manuscript.
Funding
The project was supported by the Fundamental Research Funds for the Central Universities, China University of Geosciences (Wuhan) (No. CUG2106203).
Data Availability Statement
Not applicable.
Conflicts of Interest
The authors declare no conflict of interest.
References
- Luo, X. Simulation and characterization of pathway heterogeneity of secondary hydrocarbon migration. AAPG Bull. 2011, 95, 881–898. [Google Scholar] [CrossRef]
- Uliasz-Misiak, B.; Misiak, J.; Lewandowska-Smierzchalska, J.; Matula, R. Environmental Risk Related to the Exploration and Exploitation of Coalbed Methane. Energies 2020, 13, 6537. [Google Scholar] [CrossRef]
- Li, J.; Zhang, X.; Lu, B.; Ahmed, R.; Zhang, Q. Static Geological Modelling with Knowledge Driven Methodology. Energies 2019, 12, 3802. [Google Scholar] [CrossRef]
- Carruthers, D.J. Modeling of secondary petroleum migration using invasion percolation techniques. In Multidimensional Basin Modeling; AAPG/Datapages Discovery Series; Düppenbecker, S., Marzi, R., Eds.; AMER ASSOC PETROLEUM GEOLOGIST: Tulsa, OK, USA, 2003; No. 7; pp. 21–37. [Google Scholar]
- Yao, Y.; Guo, S. Source-to-sink characteristics of the channelized submarine fan system of the Huangliu formation in the Dongfang block, Yinggehai south China sea. J. Pet. Sci. Eng. 2021, 206, 109009. [Google Scholar] [CrossRef]
- Dimitrov, L. Mud volcanoes—The most important pathway for degassing deeply buried sediments. Earth Sci. Rev. 2002, 59, 49–76. [Google Scholar] [CrossRef]
- Sassen, R.; Milkov, A.; Roberts, H.; Sweet, S.; Defreitas, D.A. Geochemical evidence of rapid hydrocarbon venting from a seafloor-piercing mud diapir, Gulf of Mexico continental shelf. Mar. Geol. 2003, 198, 319–329. [Google Scholar] [CrossRef]
- Tong, C.; Xie, Y.; Huang, Z.; Ma, J. Geochemical behaviors of HPHT gas reservoirs in the Yinggehai Basin and the efficient gas accumulation mode in its diapir flanks. Nat. Gas Ind. 2015, 2, 144–154. [Google Scholar] [CrossRef]
- Huang, H.; Li, J.; Yang, H.; Zhang, G.; Gao, R.; An, J.; Luo, M.; Li, W. Influence of diapir structure on formation and distribution of overpressure in the Yinggehai Basin, South China Sea. Energy Sci. Eng. 2022, 10, 1972–1985. [Google Scholar] [CrossRef]
- Quintà, A.; Tavani, S.; Roca, E. Fracture pattern analysis as a tool for constraining the interaction between regional and diaper-related stress field: Poza de las Sal Diapir (Basque Pyrenees, Spain). Geol. Soc. Lond. Spec. Publ. 2012, 363, 521–532. [Google Scholar] [CrossRef]
- Sun, Y.; Wan, J.; Fu, X.; Yang, K.; Zhou, L.; Wang, J. Evolutionary of faults and their control on fractures in buried hill in Beier Depression. Pet. Explor. Dev. 2007, 34, 316–322. [Google Scholar]
- Ligtenberg, J.H. Detection of fluid migration pathways in seismic data: Implications for fault seal analysis. Basin Res. 2005, 17, 141–153. [Google Scholar] [CrossRef]
- Jenkins, C.; Quenes, A.; Zellou, A.; Ahmed, R.; Zhang, Q. Quantifying and predicting naturally fractured reservoir behavior with continuous fracture. AAPG Bull. 2009, 93, 1597–1608. [Google Scholar] [CrossRef]
- Han, X.; Deng, S.; Tang, L.; Cao, Z. Geometry, kinematics and displacement characteristics of strike-slip faults in the northern slope of Tazhong uplift in Tarim Basin: A study based on 3D seismic data. Mar. Pet. Geol. 2017, 88, 410–427. [Google Scholar] [CrossRef]
- Botter, C.; Marfurt, K.J.; Al-Dossary, S. Seismic characterisation of fault damage in 3D using mechanical and seismic modelling. Mar. Pet. Geol. 2016, 77, 973–990. [Google Scholar] [CrossRef]
- Li, M.; Zhao, Y. Chapter 4—Visualization and Spectral Decomposition. In Geophysical Exploration Technology; Li, M., Zhao, Y., Eds.; Elsevier: Oxford, UK, 2014; pp. 75–102. [Google Scholar]
- Bahorich, M.; Farmer, S. 3-D seismic discontinuity for faults and stratigraphic features: The coherence cube. Lead. Edge 1995, 14, 1053–1058. [Google Scholar] [CrossRef]
- Cohen, I.; Coult, N.; Vassiliou, A.A. Detection and extraction of fault surfaces in 3D seismic data. Geophysics 2006, 71, P21–P27. [Google Scholar] [CrossRef]
- Jeong, W.-K.; Whitaker, R.; Dobin, M. Interactive 3D Seismic Fault Detection on the Graphics Hardware; Graphics; The Eurographics Association: Zürich, Switzerland, 2006. [Google Scholar]
- Noori, M.; Hassani, H.; Javaherian, A.; Amindavar, H.; Torabi, S. Automatic fault detection in seismic data using Gaussian process regression. J. Appl. Geophys. 2019, 163, 117–131. [Google Scholar] [CrossRef]
- Song, W.; Liu, J. The calculation and application of coherence data body of seismic multi-vector attributes. Geophys. Geochem. Explor. 2003, 27, 128–130. (In Chinese) [Google Scholar]
- Wang, Y.; Zhao, Y.; Ding, W.; Ahmed, R.; Zhang, Q. Cenozoic Propagated Rifting in the Dangerous Grounds in Response to the Episodic Seafloor Spreading of the South China Sea. J. Earth Sci. 2022, 33, 1031–1046. [Google Scholar] [CrossRef]
- Sun, X.; Du, S. An application for power algorithm in the seismic attribute analysis. Comput. Tech. Geophys. Geochem. Explor. 2000, 22, 316–321. (In Chinese) [Google Scholar]
- Wang, X.; Yang, K.; Zhou, L.; Wang, J.; Liu, H.; Li, Y. Methods of calculating coherence cube on the basis of wavelet transform. Chin. J. Geophys. 2002, 45, 847–852. (In Chinese) [Google Scholar] [CrossRef]
- Jiang, P.; He, S.; Yang, Z.; Yang, K.; Wang, M.; Lan, Z.; Ren, S.; Zhang, R.; Zhao, X.; Yao, G. High CO2 Natural Gas Charging Events, Timing and Accumulation Pattern in LD10 Area of Yinggehai Basin. Earth Sci. 2022, 47, 1569–1585. [Google Scholar] [CrossRef]
- Zhu, J.; Wu, H.; Ma, J.; Liu, H.; Li, Y. Nature gas accumulation process and distribution differences in D1-1 diapir district, Yinggehai Basin. Geoscience 2015, 29, 54–62. (In Chinese) [Google Scholar]
- Cristescu, N.; Craciun, E.; Soós, E. Mechanics of Elastic Composites, 1st ed.; Chapman and Hall/CRC: Boca Raton, FL, USA, 2003. [Google Scholar] [CrossRef]
- Allen, C.R.; Pollard, D.D.; Ziony, J.I. Red River and associated faults, Yunnan Province, China: Quaternary geology, slip rates, and seismic hazard. GSA Bull. 1984, 95, 686–700. [Google Scholar] [CrossRef]
- Li, H.; Fan, C.; Jiang, Z.; Li, J.; Li, C.; Xu, X.; Li, F.; Hu, G. Natural Fractures in Low-Permeability Sandstone Reservoirs in the LD-A HPHT Gas Field, Yinggehai Basin: Implications for Hydrocarbon Exploration and Development. Front. Earth Sci. 2022, 10, 934097. [Google Scholar] [CrossRef]
- Ma, Z.; Yin, X.; Zong, Z. Fracture parameters estimation from azimuthal seismic data in orthorhombic medium. J. Nat. Gas Sci. Eng. 2022, 100, 104470. [Google Scholar] [CrossRef]
- Guo, Z.; Nie, N.; Liu, C. Fracture characterization based on improved seismic amplitude variation with azimuth inversion in tight gas sandstones, Ordos Basin, China. Mar. Pet. Geol. 2022, 146, 105941. [Google Scholar] [CrossRef]
- Durrani, M.Z.A.; Rahman, S.A.; Talib, M.; Subhani, G.; Sarosh, B. Characterization of seismic anisotropy using azimuthal AVO analysis (AVAz)—An application case study in the deep and tight carbonate reservoirs from Potwar Basin onshore Pakistan. J. Appl. Geophys. 2022, 205, 104767. [Google Scholar] [CrossRef]
- Marfurt, K.J.; Sudhaker, V.; Gersztenkorn, A.; Crawford, K.D.; Nissen, S.E.J.G. Coherency calculations in the presence of structural dip. Geophysics 1999, 64, 104–111. [Google Scholar] [CrossRef]
- Roberts, A. Curvature attributes and their application to 3D interpreted horizons. First Break. 2001, 19, 85–100. [Google Scholar] [CrossRef]
- Gersztenkorn, A.; Marfurt, K.J. Eigenstructure-based coherence computations as an aid to 3-D structural and stratigraphic mapping. Geophysics 1999, 64, 1468–1479. [Google Scholar] [CrossRef]
- Hakami, A.M.; Marfurt, K.J.; Al-Dossary, S. Curvature Attribute and Seismic Interpretation: Case Study from Fort Worth Basin; SEG Technical Program Expanded Abstracts; Society of Exploration Geophysicists: Houston, TX, USA, 2004; pp. 544–547. [Google Scholar]
- Al-Dossary, S.; Marfurt, K.J. 3D volumetric multispectral estimates of reflector curvature and rotation. Geophysics 2006, 71, P41–P51. [Google Scholar] [CrossRef]
- Chopra, S.; Marfurt, K.J. Multi-Spectral Volumetric Curvature Adding Value to 3D Seismic Data Interpretation; SEG Technical Program Expanded Abstracts; Society of Exploration Geophysicists: Houston, TX, USA, 2008; pp. 1585–1589. [Google Scholar]
- Jackson, M.P.A.; Roberts, D.G.; Snelson, S. Salt Tectonics: A Global Perspective; American Association of Petroleum Geologists: Tulsa, OK, USA, 1995. [Google Scholar]
- Rensbergen, P.V.; Morley, C.K.; Ang, D.W.; Hoan, T.Q.; Lam, N.T. Structural evolution of shale diapirs from reactive rise to mud volcanism: 3D seismic data from the Baram delta, offshore Brunei Darussalam. J. Geol. Soc. 1999, 156, 633–650. [Google Scholar] [CrossRef]
- Delaney, P.T.; Pollard, D.D.; Ziony, J.I.; McKee, E.H. Field relations between dikes and joints: Emplacement processes and paleostress analysis. J. Geophys. Res. Atmos. 1986, 91, 4920–4938. [Google Scholar] [CrossRef]
- Fan, C.; Li, M.; Zhao, Y. Identification and Prediction of Allo-Source Overpressure Caused by Vertical Transfer: Example from an HTHP Gas Reservoir in the Ledong Slope in the Yinggehai Basin. Geofluids 2021, 2021, 6657539. [Google Scholar] [CrossRef]
- Li, C.; Sun, X.; Du, S. New understanding of overpressure responses and pore pressure prediction: Insights from the effect of clay mineral transformations on mudstone compaction. Eng. Geol. 2022, 297, 106493. [Google Scholar] [CrossRef]


Disclaimer/Publisher’s Note: The statements, opinions and data contained in all publications are solely those of the individual author(s) and contributor(s) and not of MDPI and/or the editor(s). MDPI and/or the editor(s) disclaim responsibility for any injury to people or property resulting from any ideas, methods, instructions or products referred to in the content. |
© 2023 by the authors. Licensee MDPI, Basel, Switzerland. This article is an open access article distributed under the terms and conditions of the Creative Commons Attribution (CC BY) license (https://creativecommons.org/licenses/by/4.0/).