

The Impacts of Energy Efficiency Modelling in Policy Making
Centre for Energy Policy, School of Government and Public Policy, University of Strathclyde, McCance Building, 16 Richmond Street, Glasgow G1 1XQ, UK
Energies 2023, 16(4), 1811; https://doi.org/10.3390/en16041811
Submission received: 9 December 2022
/
Revised: 18 January 2023
/
Accepted: 1 February 2023
/
Published: 11 February 2023
(This article belongs to the Special Issue Opportunities and Challenges in Creating a Sustainable and Resilient Net-Zero Carbon Emissions Future)
Abstract
:Bottom-up energy system models have been used extensively to analyse future energy scenarios, addressing a wide variety of policy questions. This paper focuses on energy efficiency, a key energy, climate, and economic policy area where several examples of energy system model applications can be found in the literature. This paper analyses how different studies implement energy efficiency scenarios in energy system models and explains how the approach taken can affect the results significantly, potentially affecting policy decisions. This analysis contributes to understanding how this type of modelling framework considers energy efficiency policy issues and the extent of insight provided, or not, on different dimensions. With the aim of identifying ‘best practice’ in using energy system models to inform effective analysis of energy efficiency policy, the UK TIMES energy system model is used to implement five different energy efficiency scenarios for residential heating following different modelling approaches and replicating scenarios available in the literature. The study concludes that energy efficiency scenarios, implementing the same target, produce significantly different results in terms of technology mix, energy use, emissions and costs. Additionally, the outcomes show that there is no overall best energy efficiency scenario, as each impacts on different policy targets, which could come into conflict with each other.
1. Introduction
Many countries around the world use whole energy system models to analyse future energy scenarios and decarbonisation pathways, helping them to inform climate change and energy policies. For instance, the Scottish Government’s Climate Change Plan [1] and its related policies draw significantly on the results obtained from the Scottish TIMES energy system model. Scottish TIMES is used to find least-cost ways of achieving the emission reductions set in Scotland’s climate change targets, and also to assess how effort is best shared across different sectors of the Scottish economy [1].
TIMES (The Integrated MARKAL-EFOM System) is a whole energy system model that is a widely used tool for informing climate change and energy policies, with applications all around the world [2]. However, it is certainly not the only one. Examples of other similar models used to inform this type of policy include OSeMOSYS [3], Mesap/PlaNet [4,5], FORECAST [6] and LEAP [7], among others (see [8] for a review on these and other energy system models).
Whole energy system models can be used to analyse a great variety of scenarios, addressing different types of policy questions. Energy efficiency has been identified as one key area in tackling climate change [9]. There are several potential approaches to analysing energy efficiency scenarios in this type of model. For instance, some studies model energy efficiency measures by implementing technological changes, other studies constrain energy use, others implement emission reduction constraints as a proxy for energy efficiency, and others adjust exogenous energy demand to represent the energy efficiency improvements. These modelling approaches are likely to have significantly different implications for policy.
The work developed in this paper intends to shed light on the energy efficiency modelling issue, analysing the implications of different energy efficiency modelling approaches in TIMES, and discussing best practice for informing energy efficiency policy. Therefore, the main objectives and contributions of this paper are: (i) to identify different approaches for energy efficiency scenario modelling in whole energy system models and provide an assessment of the strengths and limitations of such modelling approaches, and (ii) to provide recommendations on how to use whole energy system models effectively for energy efficiency policy analysis. To the best of the author’s knowledge, this type of analysis has not been developed yet, either with a focus on energy efficiency or other energy policy areas.
To achieve this, a literature review is developed, analysing research works using bottom-up whole energy system models, including (explicitly or implicitly) energy efficiency scenarios. Then, the UK TIMES model is used as a typical example of a whole energy system model to implement five different energy efficiency scenarios for residential heating, following different modelling approaches and replicating scenarios apparent from the literature. The results of these scenarios are analysed and compared against a ‘business-as-usual’ base scenario. The differences and potential limitations of the scenarios are further analysed, and their implications for informing energy efficiency policy are discussed.
Note that other typical motivations for technology change such as consumer perception and preferences are not normally directly modelled in whole energy system models. Furthermore, other economic effects due to energy efficiency improvements, such as changes in households’ disposable incomes, are not considered as these fall outside the scope of this study.
Additionally, as end-user demands in TIMES are mainly static and exogenous to the model, energy efficiency is considered in this study as reducing the amount of energy input to produce the same energy service (as reflected in fixed end user demand). This aligns with the definition proposed by the International Energy Agency [10].
2. Literature Review
Bottom-up whole energy system models have been used to inform energy and climate change policies in several countries and regions around the world. The type and scope of the studies vary, but many studies consider (at least briefly) energy efficiency in their findings. However, very few include explicit energy efficiency scenarios and/or direct analysis of energy efficiency improvements. Additionally, the way energy efficiency is considered (explicitly or implicitly) in these scenarios can vary widely.
This section reviews studies using whole energy system models that consider energy efficiency, classifying them according to the type of energy efficiency intervention used:
- Changes in technology
- Energy use constraints
- Emissions constraints
- Adjusting exogenous energy service demand
2.1. Technology Changes as an Energy Efficiency Intervention
In addition to decarbonisation pathways, energy system models have been widely used to investigate the impact of disruptive technologies and technological progress. Changes to more efficient technologies could deliver energy efficiency improvements to the energy system.
Ref. [11] present their analysis of how specific assumptions influence the outcomes of climate policy scenarios using the TIMES_PT (Portugal) version. Energy efficiency was considered in the study scenarios as changes in the potential penetration of technologies, by removing the limits on the degree of penetration of more efficient and renewable technologies. The authors concluded that assumptions relating to socioeconomic development (macro-economic and population growth) had the greatest impact, with up to 9% changes in the Baseline scenario emissions in 2020. Assumptions on end-use technology deployment presented a 2.5% change from the Baseline scenario.
Ref. [12] analysed energy efficiency improvements using two models. The authors implemented the same energy efficiency scenario in the TIMES-Norway and the economic CGE (computable general equilibrium) model SNoW (Statistics Norway World model), where residential heating service demand was reduced by 27% by 2030 (relative to 2010 values). Then, the results of both models were analysed and compared. The energy efficiency scenario in TIMES was modelled by imposing the adoption of energy conservation technologies (such as thermal insulation and building retrofitting). The authors remark that, as expected, the target reduction was achieved by the models in very different ways: by reducing demand in SNoW and by technology substitution in TIMES.
Ref. [13] explores the impacts of increased electrification of residential heating on the power system and associated emissions from the residential sector. In particular, the study assesses how many houses can be served with 1000 MW of heat pumps (HP), and how the power system will be affected by this. The soft-linking (interconnecting more than one model) setting used the Irish-TIMES model. Then, PLEXOS (a power system model) was used to examine the impact and technical appropriateness (of the technology mix produced with TIMES) for the electrification of heating requirement for the year 2020. Finally, the ArDEM (housing stock) model was used to assess how many households can be served by the new technologies. The authors remark on the important difference in estimates between the models, concluding that relying solely on energy systems models may lead to an overestimation of the extent of electrification of residential heating.
Ref. [6] describe the methodology of the FORECAST whole energy system model and analysed different transition scenarios for the decarbonisation of the industry sector in Germany. The authors state that the model’s main strengths relate to its detailed and comprehensive consideration of energy efficiency and fuel switching and a broad range of mitigation options for industrial decarbonisation, including CCS, material efficiency and recycling. The authors conclude that many industry sector assessments neglect some of these options and this may result in overestimating the cost of reducing emissions.
2.2. Constraining Energy Use as an Energy Efficiency Intervention
Some studies implement energy use constraints as an alternative to technology adoption to drive energy efficiency improvements. This is a relatively straightforward way to increase efficiency, reducing the energy used in the model to produce the same service.
In [14], TIMES was used to analyse the impacts of efficiency improvement measures on the German energy system. Six energy efficiency scenarios were considered, five of them were modelled by limiting the fuel consumption of the technologies in a particular sector, and the sixth scenario combined the measures for all sectors. An additional scenario was also considered, which assumed the CO2 emissions in the combined efficiency measures scenario as the target. The authors conclude that the same amount of CO2 reduction is possible at a lower cost, when there is greater flexibility in the sectoral efficiency targets.
A UK TIMES model extension was developed by [15] to incorporate a process-oriented modelling approach for the industrial sector. The scope of this analysis was to assess the potential contribution of UK industry to system-wide targets on energy efficiency, renewable energy and emission reduction. The energy efficiency scenarios implement a linear reduction in final energy use of 0.9% per year. The authors conclude that with this new process-oriented modelling approach, the contribution of industry to decarbonisation of the energy system has clearly increased in comparison with previous reported outcomes.
Ref. [16] present an analysis of the long-term macroeconomic effects of German energy efficiency policy. The study uses FORECAST for projecting the energy demand of industry, the service sector and residential appliances, and Invert/EE-Lab was used for projecting the energy demand for buildings. This was then input into the dynamic input-output based macroeconomic model ASTRA-D. The energy efficiency scenarios considered in the energy system model were implemented as energy use constraints and technology assumption constraints. The authors conclude that there are significant positive macroeconomic effects resulting from energy efficiency initiatives, with growth effects for both GDP and employment ranging between 0.88% and 3.38%.
2.3. Constraining Emissions as an Energy Efficiency Intervention
The analysis of decarbonisation pathways is one of the most common type of use of whole energy system models, and they normally include CO2 or GHG emissions constraints. This type of constraint could be used as a proxy for energy efficiency, as a more stringent limit on emissions might result in lower energy consumption and changes in technology.
An example of this can be found in [17], presenting a global climate change analysis using the TIAM global energy system model. The focus of this study is to test if it is possible to reach a global 100% renewable energy system with the existing model database. Final energy use was assessed, implicitly including energy efficiency in the results. The main conclusion is that the climate change target of 2 °C is feasible, but expensive.
Ref. [18] used the China TIMES model to analyse the role of Carbon Capture and Storage (CCS) in China’s power sector. In this study, the authors implemented decarbonisation scenarios based on emission constraints. Energy efficiency was not actively measured. The authors conclude that, under a rigorous carbon mitigation scenario, there should be a widespread deployment of CCS technologies, nuclear and renewable energy in China’s power sector.
In ref. [19], the authors present a soft-linking methodology for TIAM-WORLD model and GEMINI-E3 (global multi-regional CGE model). The study analyses two decarbonisation scenarios based on sectoral and regional emission constraints. Sectoral energy efficiency improvements are included in the reported results. The authors conclude that the inter-sectoral effects of climate policies have little effect on overall aggregated sectoral emissions, as the sectoral emissions difference between TIAM-WORLD used in a standalone manner and the coupled models was smaller than 5%.
Ref. [20] studied the dynamic role of CHP technologies in the context of the U.S. energy system evolution under various carbon reduction scenarios. The authors used the engineering–economic mixed integer programming model MARKAL (MARKet ALlocation) representing the entire U.S. energy system in nine regions. Two emissions reduction scenarios were considered in this study. Energy efficiency is implicit in the scenarios and outcomes, as a result of changes to more efficient technologies. The authors conclude that CHP could play a role in a future low-carbon energy system, but that that role diminishes as carbon reduction targets increase.
2.4. Adjusting Exogenous Energy Demand as an Energy Efficiency Intervention
Unlike the studies described above, the scenarios in this section include the energy efficiency measures implicitly in their demand projections, reducing directly the demand for heating and other energy services in energy system models, instead of using constraints or other modelling changes. However, it is not always clear if the costs and implications of these energy efficiency measures and delivery mechanisms are considered as a part of the whole energy system cost.
Using TIMES China, Ref. [21] analysed the impact of technical progress (improving energy efficiency) and the use of renewable energy in the Chinese building sector. The study considers four scenarios with different levels of insulation improvement and domestic renewable technology penetration (such as solar heaters) in the building stock. Energy efficiency is implicit in these scenarios as adjustments in their energy demand projections. The authors conclude that renewable energy sources, such as PV, and ambitious energy efficiency standards will be necessary to maintain a low level of direct carbon emissions in China’s building sector up to 2050.
Ref. [22] analysed long-term transition pathways for two metropolitan regions in eastern China. The authors used the energy system model Mesap/PlaNet platform [4,5] and analysed three pathway scenarios differing in their assumptions on efficiency measures, policies for nuclear, natural gas, and coal development, and regional exploitation of renewable resources. Energy efficiency is implemented in these scenarios as adjustments in energy demand projections. The results show that regional CO2 emissions could be significantly reduced in all sectors with the adjustment of economic structures (e.g., reducing the capacity in heavy industry), adopted efficiency measures, and multi-sector electrification.
Ref. [23] studied different sustainable development roadmaps of South Korea’s energy system. These pathways were modelled using the Long-range Energy Alternatives Planning system (LEAP) [7]. The analysed scenarios were defined according to the differences in the level of final energy consumption and renewable energy share by 2050. The authors conclude that, for the South Korean case, an increase in the percentage of renewable energy and a decrease in energy demand led to improved energy security, more jobs in the electricity generation sector, and a decrease in greenhouse gas emissions.
Ref. [24] analysed the long-term role of data centres (DCs) within the Danish energy system, characterising them as large electricity consumers and as providers of excess heat for district heating. The authors used a thermodynamic model that relates the power consumption of data centres to their production of excess heat. Then, they used this information within TIMES-DK [25] to quantify the impact of data centres on the Danish energy system until 2050. Therefore, energy efficiency was implemented in this study by adjusting exogenous demand in TIMES to include data centres, and using the excess heat to improve the overall efficiency of heating systems. The authors conclude that data centres’ energy use impact could be as high as 3–6 GW of additional offshore wind capacity. On the other hand, the produced excess heat from data centres can supply 4–27% of district heating after 2040.
Ref. [26] used the Open Source Energy Modelling System (OSeMOSYS) [3], which is a bottom-up, least-cost energy system optimization framework, and the CitySim building energy model, to analyse different decarbonisation pathways in the residential buildings sector of Austin, Texas. The authors assessed the impact of four levels of building thermal efficiency and two emission reduction scenarios. The authors conclude that upgrading building thermal efficiency significantly reduces the cost of climate policy, revealing an important policy complementarity between carbon reduction measures and building energy codes. However, the capital cost premiums associated with more thermally efficient buildings have not been considered in this analysis, so it is not possible to assess the cost–benefit of these energy efficiency measures.
2.5. Summary and Discussion of Findings
Table 1 summarises the studies presented in this literature review. There is a large quantity of energy related research using different whole energy system models. From the studies reviewed, most cases report energy efficiency improvements as a by-product of other type of scenarios, such as emission reduction, renewable energy penetration or technology adoption cases. Only a few studies explicitly consider energy efficiency scenarios, in most cases in combination with other types of scenarios such as emission reduction targets. This is an important consideration, showing a gap in the literature where energy efficiency policies and interventions have potentially been overlooked or not modelled explicitly, not allowing their impacts to be understood.
Moreover, the studies that explicitly implement energy efficiency scenarios have taken significantly different approaches, potentially leading to different results even if they represent a similar policy intervention or target. Figure 1 shows a simplified diagram of how energy service demand is met in energy system models, and how different energy efficiency interventions have been applied in the reviewed scenarios. Commonly, in bottom-up energy system models, energy service demands can be met with energy conversion technologies and with energy conservation technologies (see Figure 1). For instance, residential space heating demand could be met by using a gas boiler (energy conversion technology) and/or by improving wall insulation (energy conservation technology). Note that this a simple generic description, and not all demand can be met by energy conservation technologies.
Figure 1 also shows how the scenarios have been applied in the articles reviewed above. The range of approaches presented shows that energy efficiency scenarios can be modelled and analysed in different ways, producing potentially different results.
Refs. [14,15,16] approach energy efficiency through adjustments to total energy use constraints (reducing the energy input to produce the same demand). The approaches that implement input fuel constraints could be effective in achieving overall energy efficiency improvements. Alternatively, if the final goal is to decarbonise the energy system, an emission reduction constraint could achieve more cost-effective solutions, indirectly driving energy efficiency as in [17,18,19,20], among others.
Refs. [21,22,23,26] implement their energy efficiency scenarios by adjusting their demand projections. However, it is not clear if the cost of achieving this demand reduction is considered, and how this affects the results produced with the energy system models, which could produce unrealistic technology adoption scenarios (in terms of dramatic sector-wide ‘overnight’ changes).
Refs. [6,11,13,20,24] take a different approach in their energy efficiency scenarios, implementing minimum technology adoption constraints. Additionally, ref. [12] impose energy conservation technologies to reduce the need of heat production. Certainly, this approach produces energy efficiency improvements as less energy will be required to produce the same service. However, it is not clear what happens with the other technologies and the impact on emissions as the model might decide to change to a less efficient and/or more polluting system that uses cheaper input fuels.
From this literature review, it can be seen that energy efficiency analysis with energy system models has been approached in many different ways, and the approach taken could significantly impact the outcomes, potentially influencing policy decisions. It is, therefore, of key importance to understand the implications and trade-offs of the different modelling approaches. Additionally, the reviewed articles tend to lack depth or fail to follow through to the full range of implications of energy efficiency policies. Moreover, best practice for energy efficiency policy analysis with whole energy system models has not been directly assessed in the literature. The work developed in this paper intends to fill in this gap in the literature, analysing the implications of different energy efficiency modelling approaches and discussing best practices for informing energy efficiency policy.
3. Methodology
This study analyses different energy efficiency modelling approaches by replicating scenarios apparent from the literature, assessing their differences, potential limitations, and implications for informing energy efficiency policy. The UK version of TIMES was used, as a representative example of a whole energy system model, implementing five different energy efficiency scenarios for residential heating. The study analyses and compares the results of these scenarios against a ‘business-as-usual’ base scenario. Note that the TIMES model was selected in this analysis, as it is a well-known model widely used across the world. However, other energy system models could have been used, obtaining similar conclusions.
3.1. Model Description
TIMES (The Integrated MARKAL-EFOM System) is an energy system-wide, bottom-up model, which uses linear-programming to find a least-cost provision of energy to meet specified energy service demands, according to a number of user constraints. TIMES considers all the processes of the energy system. From the extraction of primary resources to the end use of energy services, the model considers all the processes that transform, transport, distribute and convert energy to supply energy services. A more detailed description of the model can be found in [8], and official documentation can be found in [27,28].
The UK TIMES model (UKTM) was used in this study to test the energy efficiency scenarios (see [29] for more information on the UK TIMES model). UKTM differs from other bottom-up energy system models versions, especially in the input data used, which should reflect the characteristics of the country or region modelled. However, the general structure of the models is similar, so the insights obtained here are very likely to be useful and applicable to other energy system models.
Residential Heating Modelling in TIMES
This section briefly explains how residential heating is modelled in TIMES. This explanation is relevant to better understand how the energy efficiency scenarios are implemented.
Figure 2 shows the residential heating modelling approach used in TIMES. Residential heating is an energy service demand modelled as two demand commodities: domestic hot water and space heat (right-hand side of Figure 2). The domestic hot water demand in TIMES can be met with energy conversion technologies, such as water boilers, that transform energy carriers (e.g., electricity, gas, oil, etc.) into the required service. The space heat demand in TIMES uses the same energy conversion technologies as the hot water demand, but it can also be met with energy conservation technologies, which are passive elements that reduce the need for space heating demand (e.g., insulation materials, smart thermostats, etc.). As demands are mainly exogenous in TIMES (i.e., they are user-defined parameters that cannot be modified endogenously by the model), these energy conservation measures are modelled as a technology that also produces that service, indirectly reducing that demand, but without an input fuel (see the lower middle block of technologies in Figure 2).
3.2. Base Scenario
The base scenario was selected as a benchmark to compare against the different energy efficiency scenarios and is intended to be a ‘business-as-usual’ case. This section describes this base line. Note that neither this nor any of the other scenarios implement long-term decarbonisation targets. This is to be able to analyse energy efficiency intervention in isolation, and to avoid over constraining the model.
Moreover, UKTM is a very large model with thousands of variables, parameters and constraints. For the sake of brevity, only data and variables related to the residential modelling and heating demand in the base scenario are presented here.
Figure 3 shows the fuel mix to meet the residential heating demand in the base scenario at different years. Looking at the figure it is clear that the main input fuel for heating is gas, starting with around 85% of total energy consumption in 2010 and increasing up to around 90% in 2030 and 2050. Other important fuels in 2010 (see left-hand column in Figure 3) are oil (OIL 7.4%), electricity (ELC 5.3%) and small shares of coal (COA 1.7%) and biomass (BIO 0.4%). For 2030 (see central column in Figure 3) oil and coal disappear and are mainly replaced by electricity (ELC 9.9%) and gas (GAS 89.5%). Lastly, 2050 maintains a similar image to the 2030 fuel mix with very minor differences (see right-hand column in Figure 3).
Figure 4 shows the residential heating technology mix. In 2010 (Figure 4 left-hand column), the technology with the largest penetration is the gas boiler (83.6%), with the oil boiler in second place (5.9%). Other technologies are also present but with considerably smaller penetration levels. In 2030 (Figure 4 central column) an important change appears, as the oil and coal boilers, HP and partly gas boilers are replaced with gas-fired combined heat and power systems in a district heating setup (CHP, 14.8%). However, gas boilers remain the main technology with 73.1%. By 2050 (Figure 4 right-hand column) the CHP increasing trend continues and it now fully replaces gas boilers, reaching 85.1% of technology penetration. The technology mix is complemented with electric boilers (2.1%) and district heating (gas boilers) (1.5%). This transition from gas boilers to district heating CHP is driven by the relatively high efficiency and joint production of electricity and heat, which makes it the most cost-effective option to replace conventional gas boilers even if the initial investment costs are larger.
Note that these TIMES results show the potential least cost energy system according to the data and modelling constraints set in UKTM and this base scenario, which does not consider other decarbonisation targets. This simple scenario is used as a benchmark to analyse the impacts of different energy efficiency modelling approaches in isolation. However, it does not necessarily reflect the most probable or practical scenario for the UK in 2050.
Note that the baseline energy prices are not explicitly discussed here. One of the main reasons for this is that prices in TIMES are considered endogenously as marginal costs, which may not reflect market or retail prices, and are also affected by other changes in the energy system (for example, if there is higher demand for a particular fuel in other sectors). However, the model currently considers lower gas prices, relative to electricity and other residential fuels, so the energy efficiency gains are driven by the different constraints modelled in the scenarios (discussed in detail in the following sections).
In a case where gas prices are higher, and comparable to electricity or other fuel prices, it is likely that changes in technology and energy use will be partly driven by potential cost reduction (e.g., using heat pumps for heat rather than gas boilers), and less so by the implemented constraints. In such cases, the energy efficiency gains may be higher than what is currently reported in this analysis. Nevertheless, specific analysis on energy prices and price shocks go beyond the scope of this study.
3.3. Energy Efficiency Scenarios
The energy efficiency target to be applied in this study is expressed in terms of the total energy used for heat in the residential sector. The resulting energy use value of this target is computed as 30% less the total energy consumption value in 2010 (from the base scenario). Note that this target has been arbitrarily selected for this study and does not necessarily represent any particular policy target in the UK.
Energy efficiency measures in energy system models are mainly implemented by technology substitution, changing a process or technology for a more efficient one. Moreover, energy system models typically include energy conservation technologies that would simulate energy efficiency measures. For example, building envelope technologies, such as loft or wall insulation.
This study proposes five different energy efficiency scenarios for residential heating. All scenarios were modelled with the objective of increasing energy efficiency in residential heating by 30%, relative to 2010 levels, from 2030 and up to 2050. The TIMES model was run for the time horizon covering from 2010 to 2050, but the residential energy constraints only applied from the year 2030 onwards.
Note that as the end-service demand is static in TIMES, simulating energy efficiency required reducing the use of energy input in the model to produce the same service (commodities on the left-hand side of Figure 5).
The energy efficiency scenarios (for residential heating) are:
- Scenario 1—The imposition of a constraint on all input fuels.
- Scenario 2—The imposition of an input fuel constraint on gas alone.
- Scenario 3—The imposition of a minimum energy conservation technology adoption level.
- Scenario 4—Exogenous demand reduction in space heat energy services.
- Scenario 5—The imposition of a constraint on CO2 emissions.
Figure 5 illustrates where the specific modelling constraints embodied in each scenario were bound. These scenarios were selected since they represent similar approaches to those found in the literature (see Section 2) or are modelling approaches that could relate to energy efficiency policy (e.g., reducing the consumption of one particular fuel, such as gas).
3.3.1. Scenario 1: Input Fuels Constraint
The input fuels constraint scenario is similar to the one presented by [14,15,16]. In this scenario, the total amount of input energy for residential heating processes (in Peta Joules ‘Pj’) is reduced by 10% from 2030, relative to the energy input in the base case in 2010. Equation (1) shows this constraint, where the sum of energy input for heat technologies (energyInputHeat) for all energy carriers ‘e’ and technologies ‘t’ in scenario ‘S1′, is lower or equal to the sum of the energy input for heat technologies in the base scenario ‘SB’ in 2010. Note that this applies to all years between 2030 and 2050, and that the constraint set in this scenario will apply to all residential heating technologies (heat pipe and standalone), but does not directly affect energy conservation technologies.
By reducing the use of fuels for heating technologies, the effects of this constraint are likely to be a higher implementation of energy conservation measures, which do not use any input fuels. Additionally, as this constraint limits the sum of all energy types, changes to more efficient technologies are likely to happen. That is, changes to technologies that produce more units of heating service per unit of input energy (e.g., heat pumps), independently of the type.
3.3.2. Scenario 2: Gas Input Constraint
Scenario 2 is similar to scenario 1, with the difference that the constraint only applies to gas energy input for heating, instead of applying to all energy carriers (see S2 in Figure 5). The gas input constraint is implemented as shown in Equation (2). This scenario is motivated by the heavy reliance on gas for heating in the UK (around 85% in the considered base scenario at 2010, see Figure 3). Additionally, thinking in practical terms, a policy that tries to reduce gas consumption is likely to be easier to implement than a policy that affects all energy fuels.
Note that the target in (2) is adjusted to reflect the share of total heating energy use for gas. In other words, gas use constraint has to be lower than the value set in the right-hand side of Equation (1) to achieve the same overall energy efficiency target. This adjusted value is computed by multiplying the original target by the coefficient 0.85, which represents the share of gas from the total heating energy use.
Similar to S1, this scenario is likely to produce higher levels of energy conservation technology implementation, and as this constraint applies only to gas, a switch to electricity-based technologies is also likely to occur.
3.3.3. Scenario 3: Minimum Level of Conservation Technologies
This scenario is similar to the one presented in [12]. In this case, the implementation of energy conservation technologies is set to increase (see S3 in Figure 5), so heating production technologies are not directly affected, but their contribution to meeting energy service demands is reduced. Equation (3) shows this, where the sum of the energy output (energyOutputHeat) of all energy conservation technologies ‘tcs’ has to be greater than or equal to the energy savings of the energy efficiency target (10% of total energy use in base scenario at 2010) plus the energy conservation production in the base scenario in 2010 (the original implementation level).
This constraint takes a complementary approach to previous scenarios as it forces the model to implement energy conservation measures (i.e., the need to use fuels for heating is reduced), instead of limiting the use of fuels. Therefore, the outcomes of this scenario are likely to be similar to those of previous scenarios, with a potentially larger share of energy conservation technologies.
3.3.4. Scenario 4: Demand Reduction
A demand reduction scenario is implemented, similar to the one used in [21,22,23,26]. In this case, the residential heating (RHEA and RHNA, for existing and new houses, respectively) and domestic hot water (RWEA and RWNA) demand projections are modified and no extra constraints are needed. Figure 6 shows the change in demand for this scenario, where all four types of heating service demands modelled in UKTM are reduced by 30% from 2030 (see the dotted lines in the Figure 6). This demand change is implemented in TIMES by directly modifying the demand projection values of these commodities.
This scenario does not implement any constraint so the model has the flexibility to modify the use and investments of heating technologies. Considering the reduction in demand, an overall reduction in technology use is expected, and the most expensive technologies are likely to show the largest reductions.
Note that this scenario implies a change in consumer behaviour or adoption of technologies which occurs outside of the model (in some cases informed by other models), and this demand reduction does not represent an explicit improvement in energy efficiency in TIMES.
3.3.5. Scenario 5: CO2 Emission Constraint
As discussed in the literature review, many authors analyse energy efficiency improvements by imposing emissions constraints (see Section 2). This scenario implements a CO2 emissions constraint, replicating the approach presented in [14], where the reduction in CO2 emissions obtained from an energy efficiency scenario constraining energy input (similar to S1) is set as the target for this new scenario. The authors in [14] claim that the same CO2 emission reduction as the energy efficiency scenario could be achieved but at a reduced cost.
Equation (4) shows the constraint implemented for this scenario, where the sum of CO2 output for heat technologies (CO2outputResHeat) for all technologies ‘t’ in scenario ‘S5′ is lower than or equal to the sum of CO2 output from residential heating technologies in ‘S1′. This constraint applies for every year from 2030 to 2050.
The constraint set in this scenario does not target any type of technology or fuel directly, but those technologies that use fossil fuels are likely to be more affected. In other words, the use of oil, carbon and gas-based technologies should fall in this scenario, and the contribution of ‘cleaner’ options should increase.
4. Results
This section presents the results of the five energy efficiency scenarios, compared against the base scenario with no imposed energy efficiency improvements. Note that, for the scenario S3, the residential energy conservation technology adoption constraints in UKTM had to be relaxed significantly to allow for the energy efficiency target used. The original target set for this scenario was a minimum of 475.1 Pj of annual energy conservation technology production (this replaces the heating produced from other technologies such as gas boilers or HP), from 2030 to 2050 (see Section 3.3.3). However, it was found that the original constraint in S3 was infeasible, as the energy conservation technology embodies a technology cap (set by the UKTM modellers), and the total possible production of these technologies is 154.3 Pj (considerably below the desired target). To fix this issue, the technology adoption constraints in this scenario (labelled S3*) were relaxed, allowing the model to implement up to three times more capacity for the energy conservation technologies.
The problem encountered in this scenario is an example of potential issues caused by constraints and considerations set by energy system modellers, which if they are not set based on adequate projections or assumptions, could unnecessarily limit or bias the solutions. Note that the constraint relaxation was only applied for S3* which does not allow for a fair comparison with other scenarios. However, this scenario gives valuable insight on potential benefits of more ambitious energy conservation policies (e.g., building retrofitting programmes).
4.1. Scenario Results
Figure 7 shows the residential heating technology mix for 2050 for all scenarios. In S1, the main technology in the mix is gas boilers (71.6%), complemented evenly by combined heat and power (CHP), standalone technologies and heat pumps. This technology mix is significantly different from the base scenario where CHP dominates the mix and gas boilers disappear. These differences are somehow counter-intuitive as CHP is potentially more efficient than the gas boilers, producing more total output in two energy vectors (heat and electricity) from a single energy carrier (gas in this case). However, the constraint implemented in S1 applies to heating production only, so the results show that the CHP requires more input to produce heat than the gas boiler (given that CHP electricity production for other demands is ignored).
S2 presents a more diverse technology mix, with CHP (66.2%) as the main technology, and complemented by standalone technologies, oil and electric boilers, heat pumps (HP) and district heating (DH). These changes show the effect of the constraint on gas use implemented in this scenario, limiting the use of gas boilers and CHP to some extent, inducing the model to replace these systems with oil and electricity-based technologies.
The residential heating technology mix in 2050 for S3* did not change significantly relative to those in the base scenario, but did include slightly less CHP and more standalone systems. These results suggest that the implementation of energy conservation technologies is less ‘intrusive’ to the overall heating technology adoption paths, as they produce a reduction in energy use for all type of fuel, instead of a shift from one type of fuel/technology to another.
The technology mix in S4 is almost identical to the one in the base scenario. With the reduction in demand in S4, most technologies decreased their production accordingly, which is similar to S3*. However, the heating production reductions in S4 are larger than those in S3*.
In S5, the main heating technology is CHP (76.9%) and the mix is completed by standalone technologies, electric boilers and DH. Considering that this scenario achieves the same residential CO2 emissions performance as S1, the technology mix is quite different. On the other hand, the technology mix of S2 is closer to that of S5, suggesting that the CO2 emissions reduction has been achieved by using less gas as a heating fuel (the constraint implemented in S2).
Figure 8 shows the energy conservation technology implementation across scenarios (accumulated production up to 2050). These technologies include different types of cavity wall insulation (CAV01 and CAV02), loft insulation (LOF02), solid wall insulation (SOL01, SOL02 and SOL03) and floor insulation (FLR01).
In S1, the energy conservation technology “production” (energy conservation technologies in TIMES are modelled as a source of energy that requires no input fuel) is 38.5% larger than the base scenario, where the CAV, LOF and SOL01 technologies remain unchanged, SOL02 exhibits a significant increment in accumulated production, complemented by the SOL03 technology. The results show that the cheaper energy conservation technologies have reached their maximum capacity set in TIMES, so SOL03 is implemented to increase energy conservation capacity, despite being more expensive.
In S2 the energy conservation technology mix is very similar to S1. However, in S2 the production from SOL03 is reduced. The total energy conservation technology production in S2 is 28.6% more than the base scenario.
In S3* the relaxation of energy conservation constraints makes the system use all available energy conservation technologies at a much larger level, while keeping similar shares. Total energy conservation technology production in S3* is 359.7% more than in the base scenario.
In S4, the energy conservation technology production is 26.6% lower than in the base scenario. The reduction in total energy conservation production is linked to a reduction in demand. This reduction suggests that conservation measures were a relatively expensive way of meeting demand (relative to other heating technologies). In particular, solid wall insulation SOL02 has reduced total production by 68% relative to the base case.
Lastly, in S5, the energy conservation technology mix is very similar to S2. The total energy conservation technology production is 28.1% more than the base scenario.
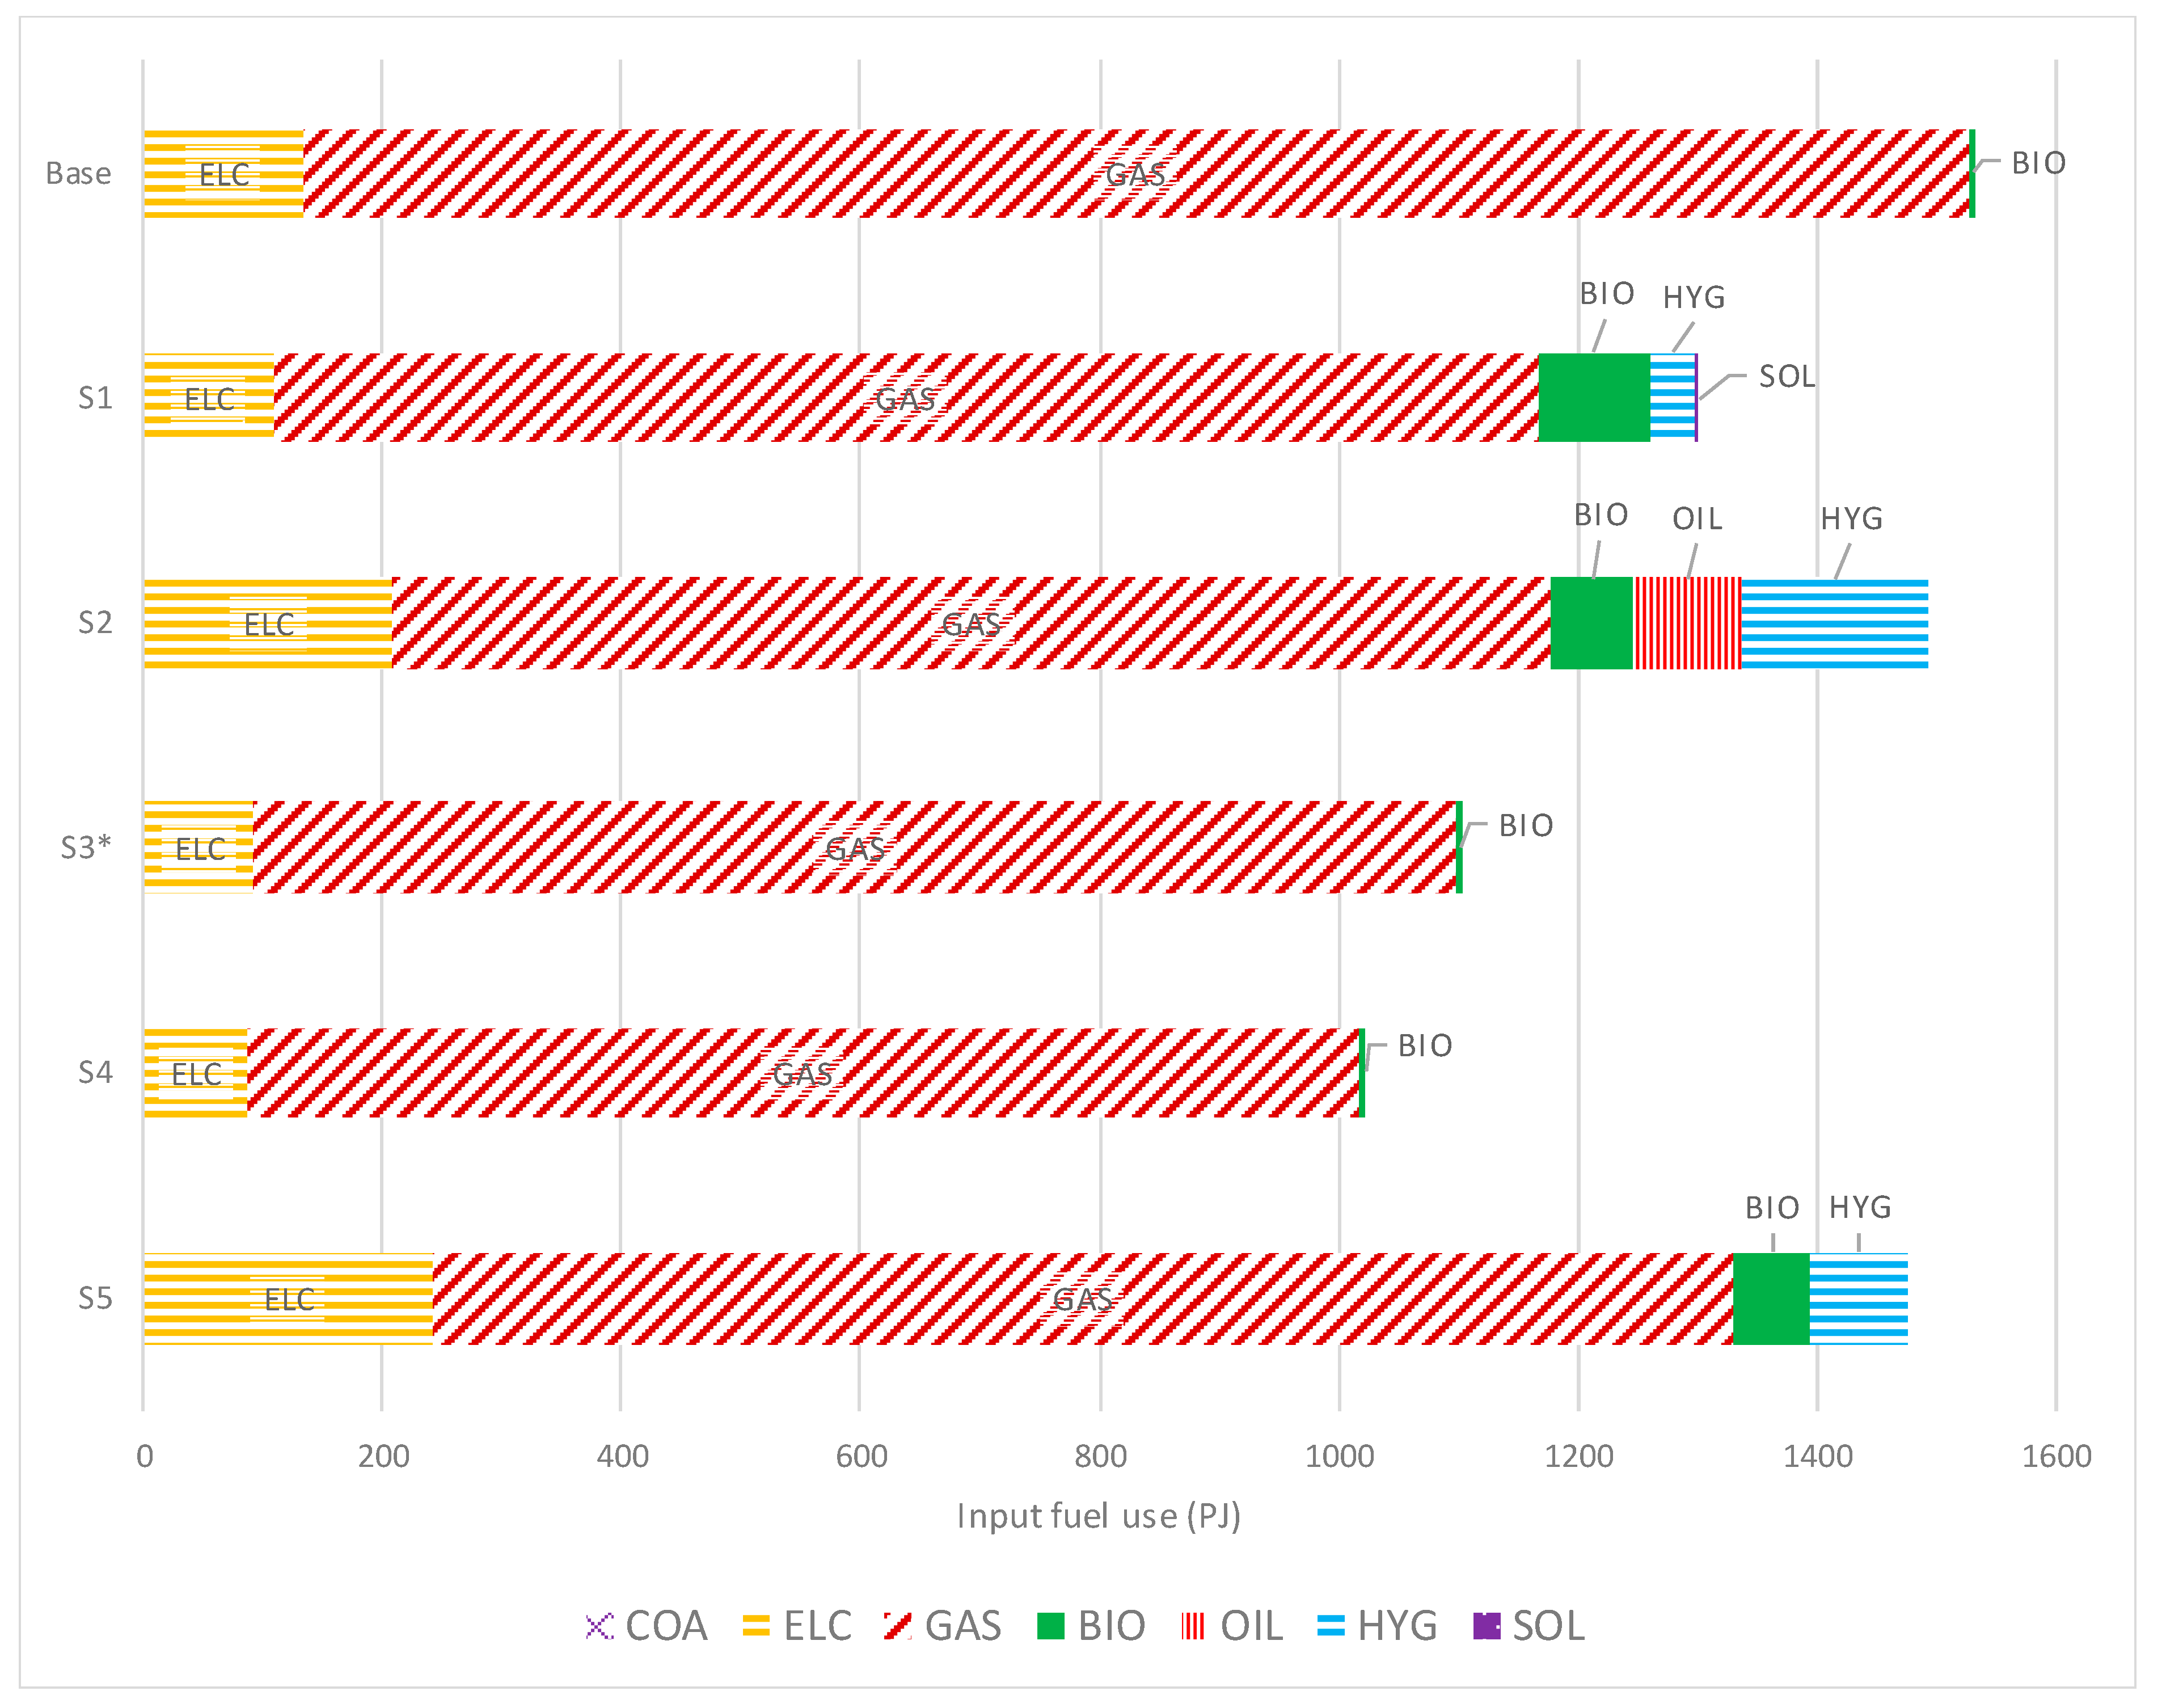
Figure 9 shows the residential heating fuel use in 2050 for all scenarios. In S1, gas use exhibits the largest reduction in absolute values relative to the base case. Other fuels such as biomass (BIO), hydrogen (HYG) and solar power (SOL) increase their presence. The total fuel use change in S1 is −15%, most of which reflects the reduction in gas use.
In S2, the residential gas consumption is reduced, but electricity use increases (relative to the base scenario). Moreover, there is an important increase in hydrogen, which is also used as an alternative to gas in CHP. The total change in fuel use for this scenario is −2.6% relative to the base case, which shows more of a change in fuel mix (using less gas) than a significant reduction in energy use.
For S3* in 2050, gas and electricity use is reduced, but biofuels remain mainly unaffected. The total fuel use change for this scenario is −28%. This reduction is driven by the high implementation of energy conservation technologies.
In S4, the residential heat fuel use is similar to S3*, but with even larger reductions in gas and electricity use. The total fuel use change in this scenario is −33.2%, caused by the reduction in energy service demand.
The residential heat fuel use in S5 is shown in the bottom bar in Figure 9. The change in total gas use in this scenario is similar to that in S1. However, electricity and hydrogen use are larger than in that scenario. The total fuel use change in S5 is −3.7%, contrasting with the value of S1 (−15%), which achieves greater energy use reduction, producing the same amount of CO2 emissions.
Table 2 shows the total sectoral CO2 emission changes for all scenarios. In S1, the residential sector presents the largest reduction (−9.11%) caused by the decrease in gas consumption. However, the power sector (ELC) increases its emissions by 4.05%. This increment is caused by the “extra” electricity coming from the distribution network for residential use, making up for the lower electricity production from the CHP technology (see Figure 7). The total system-wide CO2 emissions increases slightly (0.23%).
In S2, the residential sector generates a smaller reduction in emissions (−7.08%) than in S1 (−9.11%), and the same is true for the electricity sector (3.15% in S2 compared to 4.05% in S1). The overall total CO2 emissions have increased by 1.04%. This shows that for this UK case, simply reducing the use of gas in the residential sector might not help in achieving overall CO2 emissions targets, as emissions are transferred to other sectors.
In S3*, the residential sector has a change of −18.81% in total CO2 emissions, which is a larger reduction than previous scenarios. Additionally, the electricity sector generates a reduction in emissions (−1.26%). Other sectors also show small reductions. The overall CO2 emissions change in this scenario is −3.35%, which is better than in S1 or S2, showing the potential for energy conservation technologies. However, it is not possible to make a fair comparison between these scenarios due to the relaxation of constraints in S3*.
The sectoral CO2 emissions in S4 show a reduction in most sectors, with the residential sector showing the largest falls (−15.87%). The power sector is also associated with a small reduction (−0.97%), and total CO2 emissions fall by −2.66%, which is greater than in S1, S2 or S3*. This result suggest that a simple reduction in end-user demands might not generate the largest CO2 emissions reductions.
Lastly, the residential CO2 emissions in S5, by construction, match the reduction in S1. However, other sectors present different changes. For instance, the electricity sector exhibits a slightly larger increase in S5. Additionally, the overall total CO2 emissions increase slightly (0.78%). Note that this increase in total CO2 emissions contrasts with the reduction associated with S1 (0.23%), which highlights the fact that the imposed sectoral constraint could shift emissions to other sectors, offsetting any potential benefits in terms of tackling climate change.
4.2. Results Discussion and Policy Implications
The results of the different scenarios illustrate the wide range of solutions that can be obtained with energy system models when simulating notionally equivalent energy efficiency scenarios (i.e., using the same energy efficiency target, but implemented in different ways).
Driving technology adoption through policy (for example, by subsidising or giving credits to purchase certain technologies) could be an effective way of achieving different goals, such as energy efficiency improvements. Models such as TIMES could provide valuable insight into which technologies could be supported and which should be analysed further. However, as shown in Figure 7 (the heating technology mix for all scenarios), the implications of decisions could be very different depending on the energy efficiency modelling approach taken. For example, S1 presents a radically different technology mix than the other scenarios. The technology mixes presented in the other scenarios are similar to one another, with some very similar to the base case (see, for example, S4 in Figure 7), but they still exhibit important differences in fuel use.
Table 3 summarises the main results of the scenarios, including the associated changes in CO2 emissions, total fuel use for residential heating (the energy efficiency improvement), and changes in total system costs. Table 3 shows that the reduction in the residential sector’s emissions does not necessarily manifest itself in equivalent reductions in total system emissions. For example, scenarios S1, S2 and S5 exhibit own-sector reduction in emissions, but they are associated with an increase in overall CO2 emissions. This shows that sectoral targets alone might be misleading and could be counterproductive: they could be met at the expense of substituting more emission-intensive technologies in other sectors, potentially frustrating the overall objective of the policy. This illustrates the importance of adopting a system-wide perspective when assessing emissions.
The total energy efficiency improvements (accumulated reductions in fuel use for residential heating, see third column in Table 3) vary across scenarios. It should be noted that the constraint in S3* was initially generating an infeasible solution due to the modelling constraints in UKTM, so the energy conservation technology adoption constraints were ‘relaxed’ (see Section 4.1 for a more detailed discussion). This relaxation was considerable, and so a large difference in energy efficiency performance with the other scenarios was expected and a direct comparison is not possible. This reinforces the point that the presence of modelling considerations and user constraints in energy system models can influence the outcomes of scenarios, potentially limiting and/or biasing the results.
The total system costs (see fourth column in Table 3) increase for all scenarios with the exception of S3* and S4. S3* implements a relaxation of constraints not available in the other scenarios, and S4 implements a demand reduction in residential heating services, which is similar to the scenario developed in [21,22,23,26]. Considering the change to total costs alone, modelling scenario S4 seems to perform best in achieving the energy efficiency targets. However, this result should be treated with caution as it does not really represent an improvement in energy efficiency, rather it implements a ‘costless’ demand reduction. The benefits obtained in S4 should be contrasted with the potential costs of producing this change in consumer behaviour. TIMES and other similar energy system models cannot readily model the costs of any policies required to achieve this (if indeed it is achievable), so it is difficult to conduct a fair comparison of this scenario with the others.
After S3* and S4, the scenario that exhibits the lowest costs is S5, which achieves the same residential emission reduction as S1 (by construction) but at a lower cost. Certainly, S5 does not perform as well as other scenarios in fuel use reduction, but if the objective is solely to reduce residential emissions, S5 would be the preferred scenario as it achieves this target at the lowest possible costs. However, it does this at the cost of an increase in total system emissions.
Research Limitations and Future Work
This study and the selected approaches provide a wide spectrum of modelling possibilities and valuable insight. However, there are some limitations and possible extensions to this study that should be taken into account. For instance, the list of scenarios considered is not exhaustive, as other variations could also be considered for energy efficiency analysis.
Moreover, some of the performances and specific issues presented in these scenarios, in particular S3*, derive (at least partly) from the way the UKTM is modelled and the technology assumptions considered in the base scenario. Other energy system models with different modelling assumptions may show different behaviour across scenarios. For instance, more constrained base models are likely to show less variation in results across the different approaches (less flexibility to achieve the targets) and vice versa. Additionally, less constrained models might not exhibit the infeasibility issues presented here.
Lastly, this study analysed energy efficiency scenarios in isolation, in order to identify those effects that are solely attributable to changes in efficiency. However, many ‘real’ energy system model applications (referring to analyses commissioned for or used directly by decision makers to inform their policies) consider scenarios including constraints that are imposed simultaneously. An example of this could be an analysis including a sectorial energy efficiency scenario, plus a minimum level of renewable energy generation, and an overall CO2 emission constraint. Therefore, the endogenous dynamics of the model, considering several types of constraints, are likely to change, and the difference between the energy efficiency modelling approaches might be reduced.
5. Conclusions
Bottom-up whole energy system models have been widely used to analyse and inform policy, by creating and contrasting future energy system scenarios. Energy system model applications vary not only in terms of geographical scale but also by type of scenario objectives as well. Energy efficiency is one example of such applications, with several studies available. However, the modelling approach taken on the energy efficiency scenarios varies considerably among studies.
This paper analyses five energy efficiency scenarios for residential heating using UK TIMES as a representative energy system model. The results obtained show important differences across scenarios and performance metrics, so the decision on which modelling approach to use to inform policy development is not straightforward. Therefore, it is important to analyse different energy efficiency modelling approaches and perform sensitivity analysis whenever possible, and to assess the appropriateness of the energy efficiency modelling scenarios to emulate the notion of energy efficiency improvements in reality.
Another important point of consideration is the secondary outcomes of the policies. When the technology mix does not differ much between scenarios, looking into other results could assist policy makers in choosing the best roadmap. For instance, the preferred scenario could be that which, in addition to achieving the energy efficiency target, also has the best CO2 emissions performance, or the lowest costs.
The results also showed the importance of pre-existing modelling constraints and considerations. The modelled technologies and processes use parameters and constraints that limit (or set) the capacity, production, and/or the adoption rate, with the objective of replicating (to some extent) consumer adoption profiles, and avoiding dramatic ‘overnight’ changes in technology. In this study, these types of modelling constraints limited the implementation of energy conservation technologies. While this is not necessarily an erroneous outcome, it is important to analyse the reasons behind these modelling constraints, and to check if they are based on reliable/sensible considerations and projections.
Note that the wider impacts of energy policies are not always captured in this type of model. In the case of energy efficiency, many benefits go beyond the energy system, including benefits to the economy, health and well-being [10]. Therefore, it is highly recommended to use other tools alongside energy system models to test the feasibility or plausibility of the outcomes and to understand better the implications of energy efficiency.
The analysis developed in this paper provides insight into some of the modelling challenges for energy efficiency analysis. This insight could be relevant for policy makers and wider stakeholders, increasing knowledge about potential conflicting targets, such as decarbonisation of heat versus system costs, while also assisting them to assess best practice in energy efficiency modelling.
Funding
This research was funded through a ClimateXChange Fellowship.
Data Availability Statement
Results data can be shared upon request.
Acknowledgments
The author is grateful to the ClimateXChange team and the Scottish Government for their comments and support. The author also wishes to thank his colleagues at the University of Strathclyde for their support, comments and feedback.
Conflicts of Interest
The author declare no conflict of interest.
References
- Scottish Government. The Scottish Government’s Climate Change Plan, Third Report on Proposals and Policies 2018–2032 (RPP3). Available online: http://www.gov.scot/Publications/2018/02/8867 (accessed on 8 March 2018).
- Connolly, D.; Lund, H.; Mathiesen, B.V.; Leahy, M. A review of computer tools for analysing the integration of renewable energy into various energy systems. Appl. Energy 2010, 87, 1059–1082. [Google Scholar] [CrossRef]
- Howells, M.; Rogner, H.; Strachan, N.; Heaps, C.; Huntington, H.; Kypreos, S.; Hughes, A.; Silveira, S.; DeCarolis, J.; Bazillian, M.; et al. OSeMOSYS: The Open Source Energy Modeling System: An introduction to its ethos, structure and development. Energy Policy Sustain. Biofuels 2011, 39, 5850–5870. [Google Scholar] [CrossRef]
- Mesap PlaNet. EnergyPLAN. Available online: https://www.energyplan.eu/othertools/national/mesap-planet/ (accessed on 24 January 2020).
- Schlenzig, C. PlaNet: Ein Entscheidungsunterstuetzendes System fuer die Energie und Umweltplanung. 1998. Available online: https://core.ac.uk/display/40556049 (accessed on 24 January 2020).
- Fleiter, T.; Rehfeldt, M.; Herbst, A.; Elsland, R.; Klingler, A.-L.; Manz, P.; Eidelloth, S. A methodology for bottom-up modelling of energy transitions in the industry sector: The FORECAST model. Energy Strategy Rev. 2018, 22, 237–254. [Google Scholar] [CrossRef]
- Heaps, C.G. LEAP. Long-Range Energy Alternatives Planning (LEAP) System. 2016. Available online: https://www.energycommunity.org/default.asp?action=introduction (accessed on 3 February 2020).
- Calvillo, C.; Turner, K.; Bell, K.; McGregor, P.; Hawker, G. Using the TIMES model in developing energy policy. Available online: http://www.climatexchange.org.uk/reducing-emissions/using-times-model-developing-energy-policy/ (accessed on 2 October 2017).
- Committee on Climate Change. Net Zero—The UK’s Contribution to Stopping Global Warming. 2019. Available online: https://www.theccc.org.uk/publication/net-zero-the-uks-contribution-to-stopping-global-warming/ (accessed on 18 March 2020).
- IEA. Publication: Capturing the Multiple Benefits of Energy Efficiency. 2014. Available online: https://www.iea.org/publications/freepublications/publication/capturing-the-multiple-benefits-of-energy-efficiency.html (accessed on 3 April 2017).
- Simoes, S.; Fortes, P.; Seixas, J.; Huppes, G. Assessing effects of exogenous assumptions in GHG emissions forecasts—A 2020 scenario study for Portugal using the Times energy technology model. Technol. Forecast. Soc. Chang. 2015, 94, 221–235. [Google Scholar] [CrossRef]
- Rosnes, O.; Bye, B.; Espegren, K.; Fæhn, T.; Rosenberg, E. Energy technology and energy economics: Energy policy analysis in two different model traditions, in: Heading Towards Sustainable Energy Systems: Evolution or Revolution? In Proceedings of the 15th IAEE European Conference 2017, Vienna, Austria, 3–6 September 2017. [Google Scholar]
- Deane, J.P.; Gracceva, F.; Chiodi, A.; Gargiulo, M.; Gallachóir, B.Ó. Soft-Linking Exercises Between TIMES, Power System Models and Housing Stock Models. In Informing Energy and Climate Policies Using Energy Systems Models; Lecture Notes in Energy; Giannakidis, G., Labriet, M., Gallachóir, B.Ó., Tosato, G., Eds.; Springer International Publishing: Berlin/Heidelberg, Germany, 2015; pp. 315–331. [Google Scholar] [CrossRef]
- Blesl, M.; Das, A.; Fahl, U.; Remme, U. Role of energy efficiency standards in reducing CO2 emissions in Germany: An assessment with TIMES. Energy Policy 2007, 35, 772–785. [Google Scholar] [CrossRef]
- Fais, B.; Sabio, N.; Strachan, N. The critical role of the industrial sector in reaching long-term emission reduction, energy efficiency and renewable targets. Appl. Energy 2016, 162, 699–712. [Google Scholar] [CrossRef]
- Hartwig, J.; Kockat, J.; Schade, W.; Braungardt, S. The macroeconomic effects of ambitious energy efficiency policy in Germany—Combining bottom-up energy modelling with a non-equilibrium macroeconomic model. Energy 2017, 124, 510–520. [Google Scholar] [CrossRef]
- Føyn, T.H.Y.; Karlsson, K.; Balyk, O.; Grohnheit, P.E. A global renewable energy system: A modelling exercise in ETSAP/TIAM. Appl. Energy 2011, 88, 526–534. [Google Scholar] [CrossRef]
- Huang, W.; Yin, X.; Chen, W. Prospective Scenarios of CCS Implementation in China’s Power Sector: An Analysis with China TIMES. Energy Procedia 2014, 61, 937–940. [Google Scholar] [CrossRef] [Green Version]
- Labriet, M.; Drouet, L.; Vielle, M.; Loulou, R.; Kanudia, A.; Haurie, A. Assessment of the Effectiveness of Global Climate Policies Using Coupled Bottom-Up and Top-Down Models; SSRN Scholarly Paper No. ID 2580216; Social Science Research Network: Rochester, NY, USA, 2015. [Google Scholar]
- Kaplan, P.O.; Witt, J.W. What is the role of distributed energy resources under scenarios of greenhouse gas reductions? A specific focus on combined heat and power systems in the industrial and commercial sectors. Appl. Energy 2019, 235, 83–94. [Google Scholar] [CrossRef] [PubMed]
- Shi, J.; Chen, W.; Yin, X. Modelling building’s decarbonization with application of China TIMES model. Appl. Energy 2016, 162, 1303–1312. [Google Scholar] [CrossRef]
- Xiao, M.; Simon, S.; Pregger, T. Scenario analysis of energy system transition—A case study of two coastal metropolitan regions, eastern China. Energy Strategy Rev. 2019, 26, 100423. [Google Scholar] [CrossRef]
- Hong, J.H.; Kim, J.; Son, W.; Shin, H.; Kim, N.; Lee, W.K.; Kim, J. Long-term energy strategy scenarios for South Korea: Transition to a sustainable energy system. Energy Policy 2019, 127, 425–437. [Google Scholar] [CrossRef]
- Petrović, S.; Colangelo, A.; Balyk, O.; Delmastro, C.; Gargiulo, M.; Simonsen, M.B.; Karlsson, K. The role of data centres in the future Danish energy system. Energy 2020, 194, 116928. [Google Scholar] [CrossRef]
- Balyk, O.; Andersen, K.S.; Dockweiler, S.; Gargiulo, M.; Karlsson, K.; Næraa, R.; Petrović, S.; Tattini, J.; Termansen, L.B.; Venturini, G. TIMES-DK: Technology-rich multi-sectoral optimisation model of the Danish energy system. Energy Strategy Rev. 2019, 23, 13–22. [Google Scholar] [CrossRef]
- Leibowicz, B.D.; Lanham, C.M.; Brozynski, M.T.; Vázquez-Canteli, J.R.; Castejón, N.C.; Nagy, Z. Optimal decarbonization pathways for urban residential building energy services. Appl. Energy 2018, 230, 1311–1325. [Google Scholar] [CrossRef]
- Loulou, R.; Goldstein, G.; Noble, K. Documentation for the MARKAL Family of Models. Energy Technol. Syst. Anal. Programme 2004, 65–73. [Google Scholar]
- Loulou, R.; Remne, U.; Elbaset, A.A.; Lehtila, A.; Goldstein, G. Documentation for the TIMES Model PART I’. 2005. Available online: http://docplayer.net/254952-Documentation-for-the-times-model-part-i.html (accessed on 2 November 2016).
- UCL. UKTM-UCL. 2014. Available online: http://www.ucl.ac.uk/energy-models/models/uktm-ucl (accessed on 12 March 2018).
Figure 1.
Energy efficiency scenarios (examples found in the literature: [6,11,12,13,14,15,16,17,18,19,20,21,22,23,24,26]).
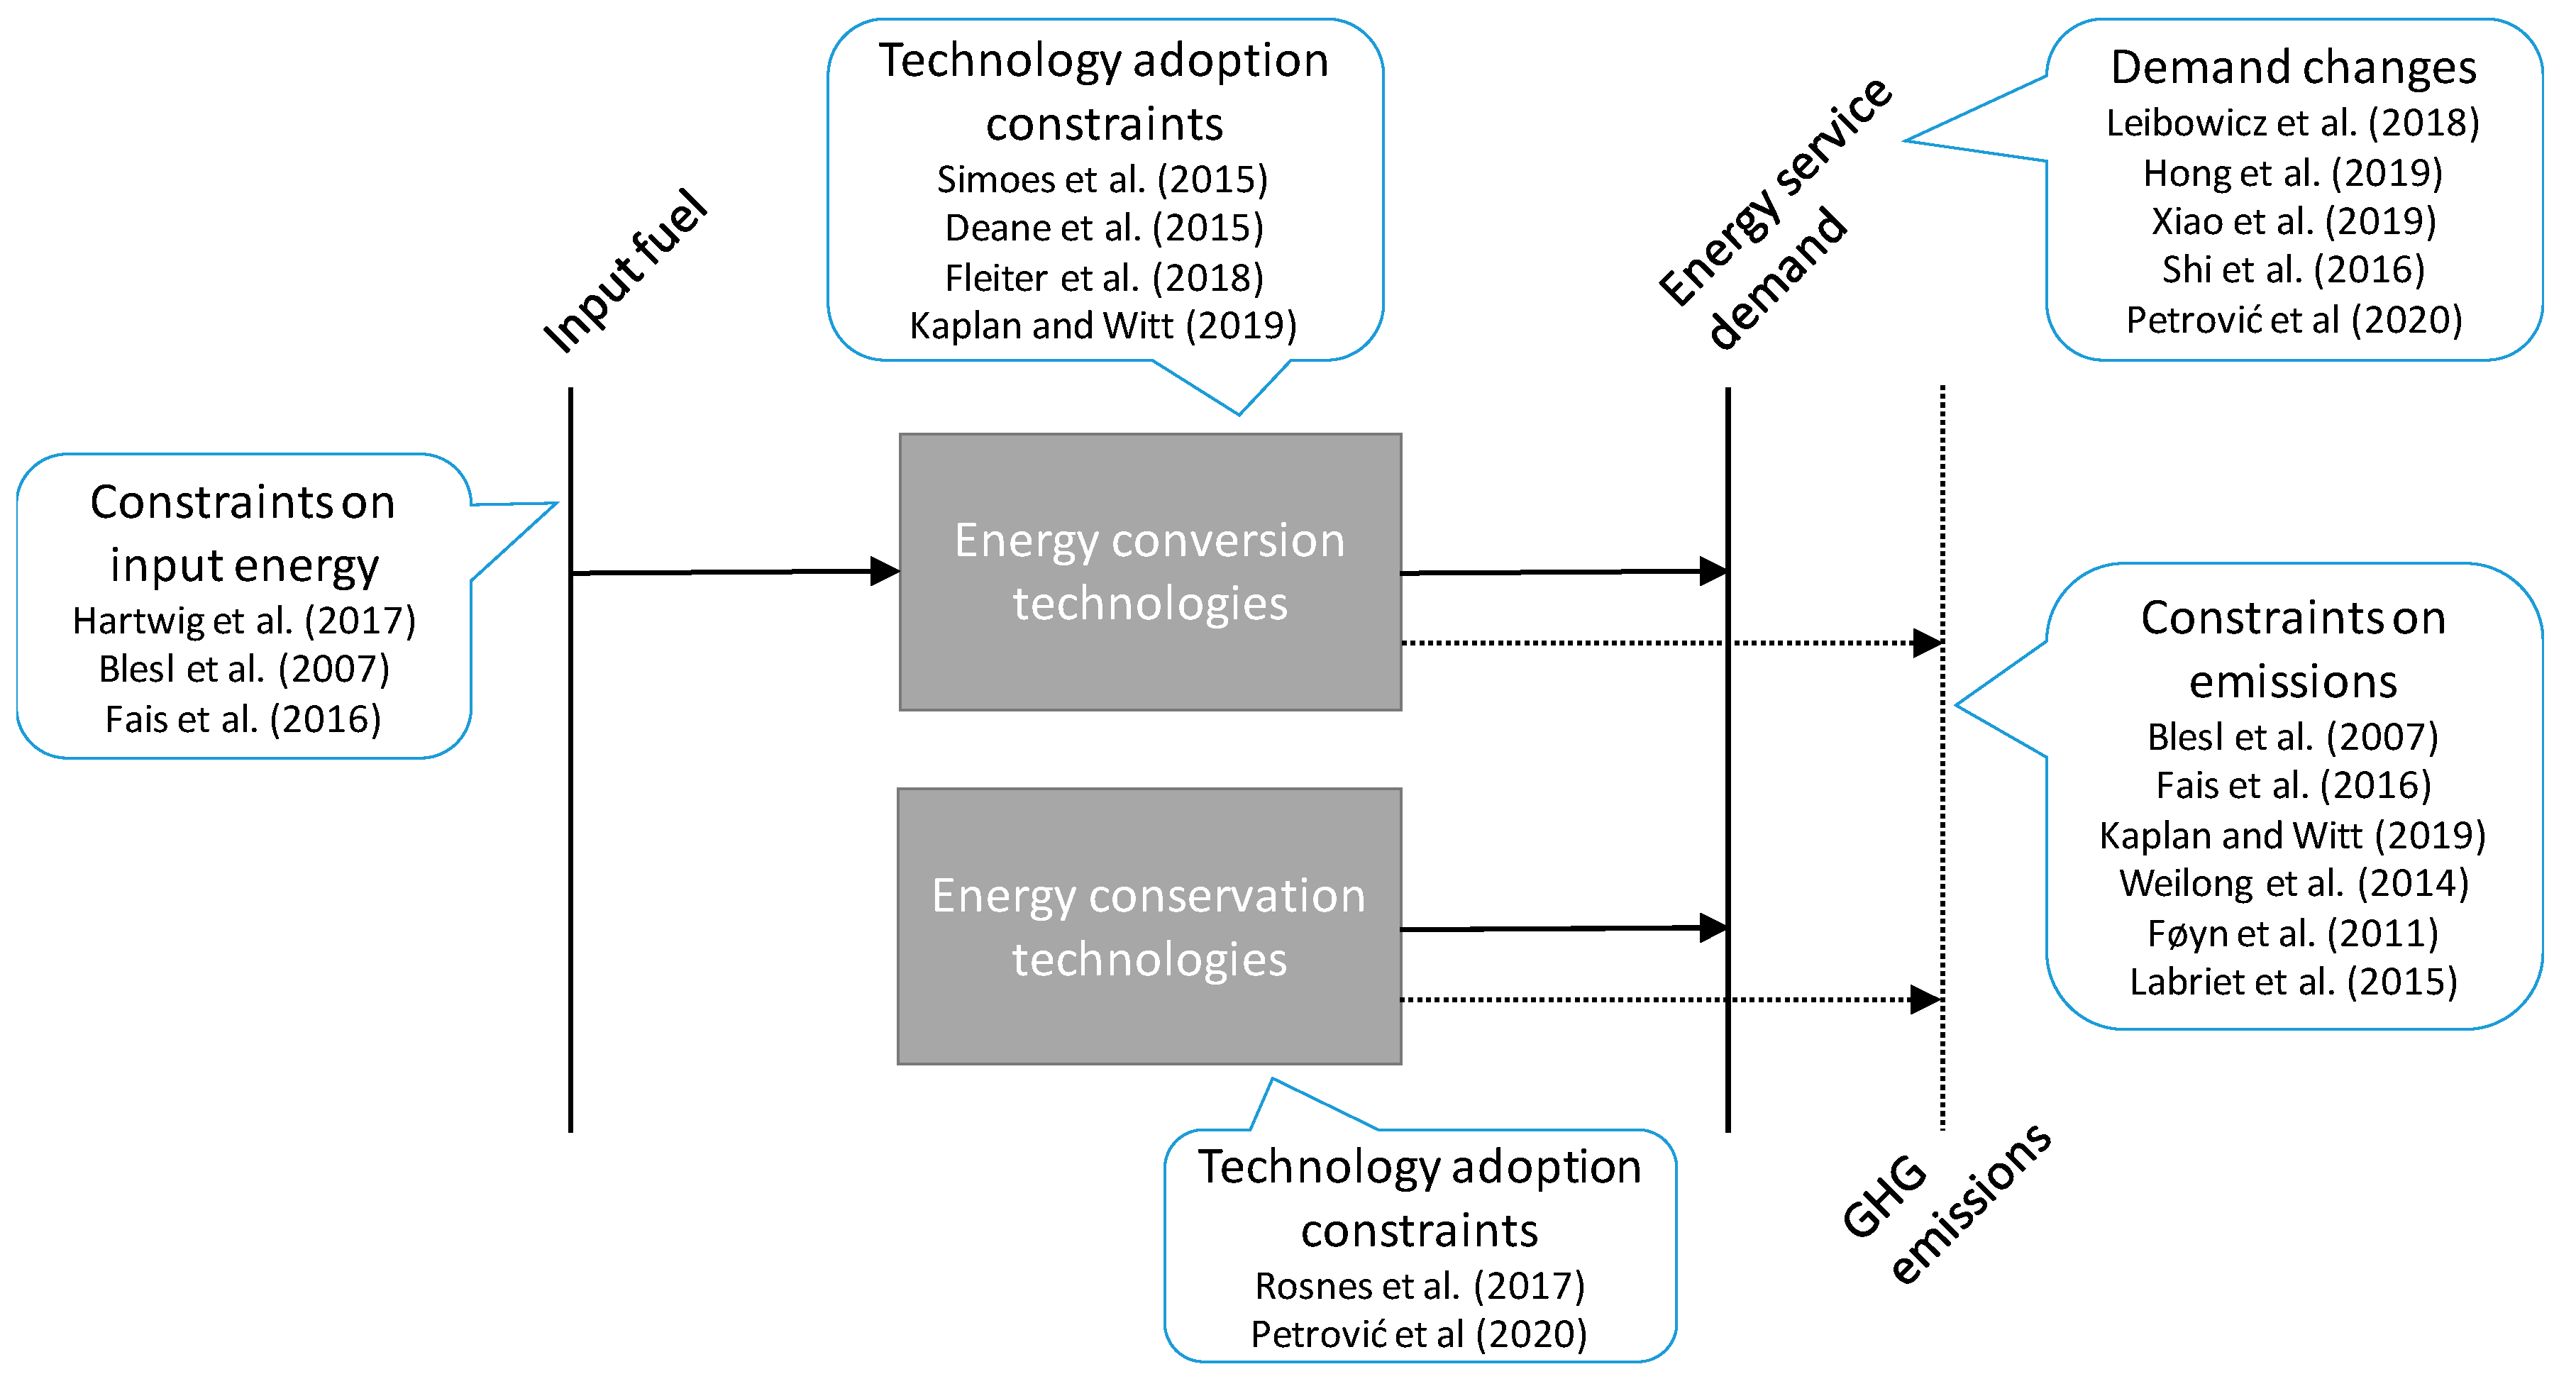
Figure 2.
Residential heating modelling in TIMES.
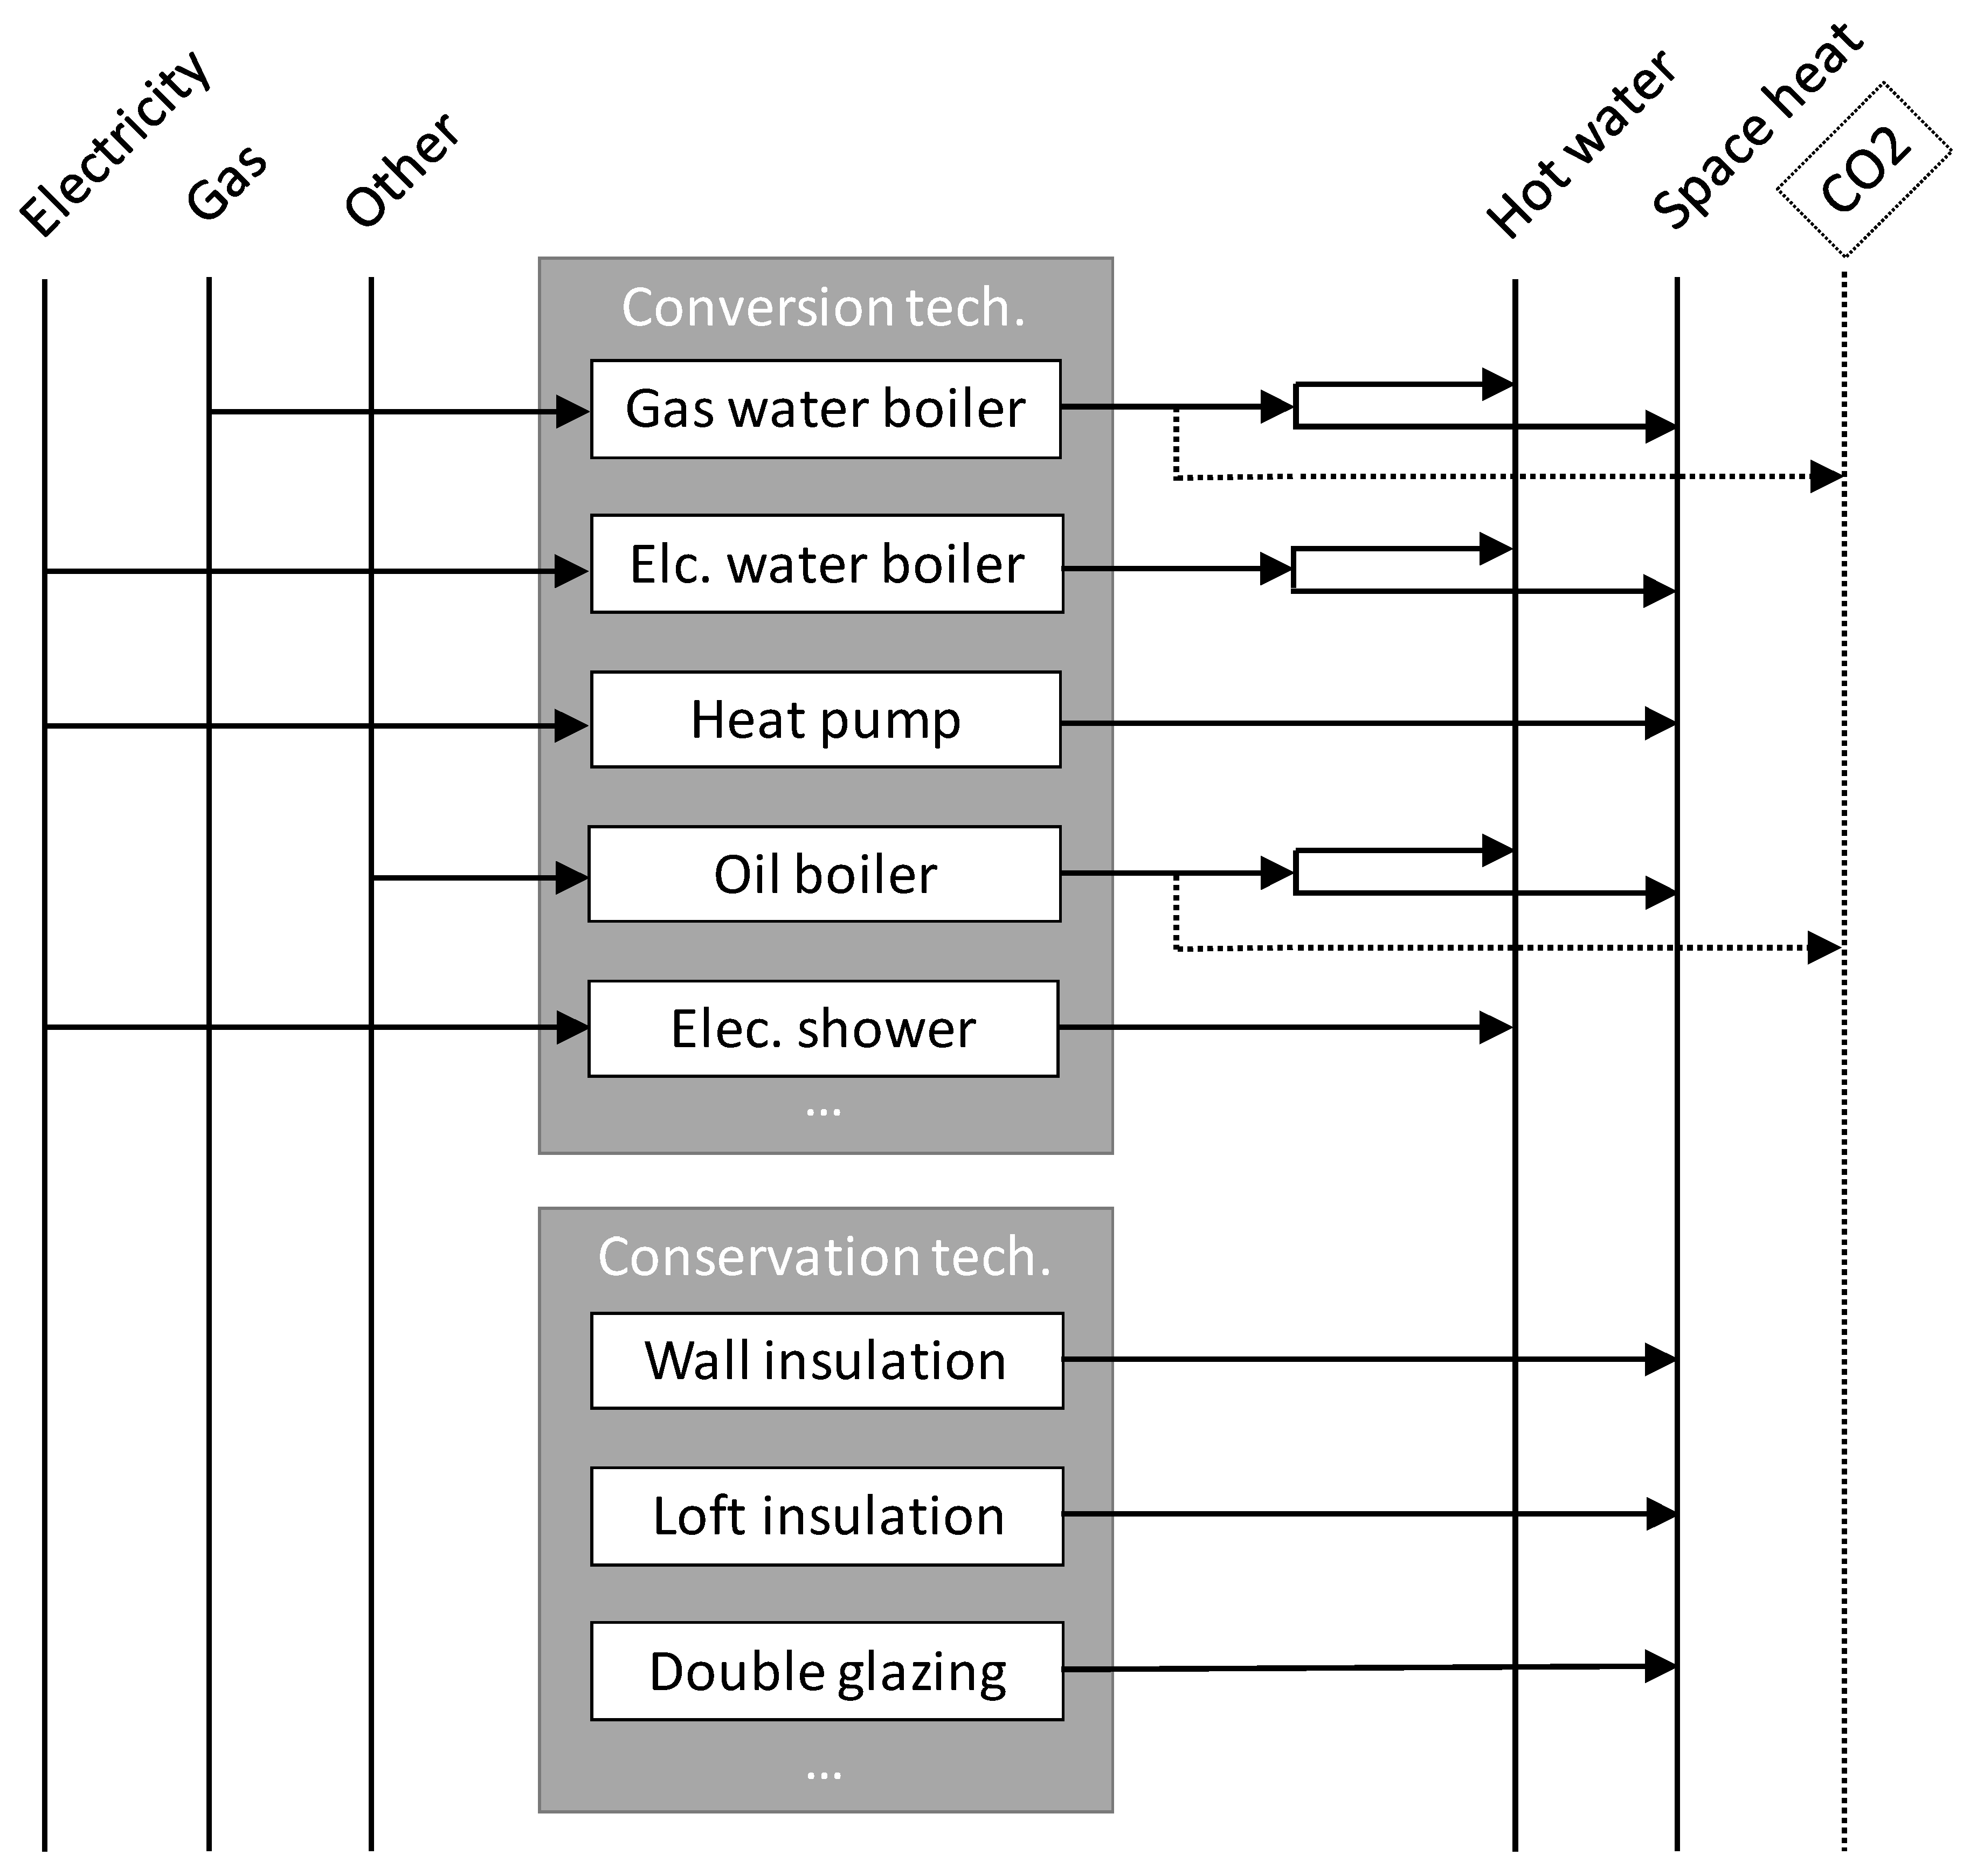
Figure 3.
Residential heating energy consumption by fuel in 2010, 2030 and 2050—Base scenario.
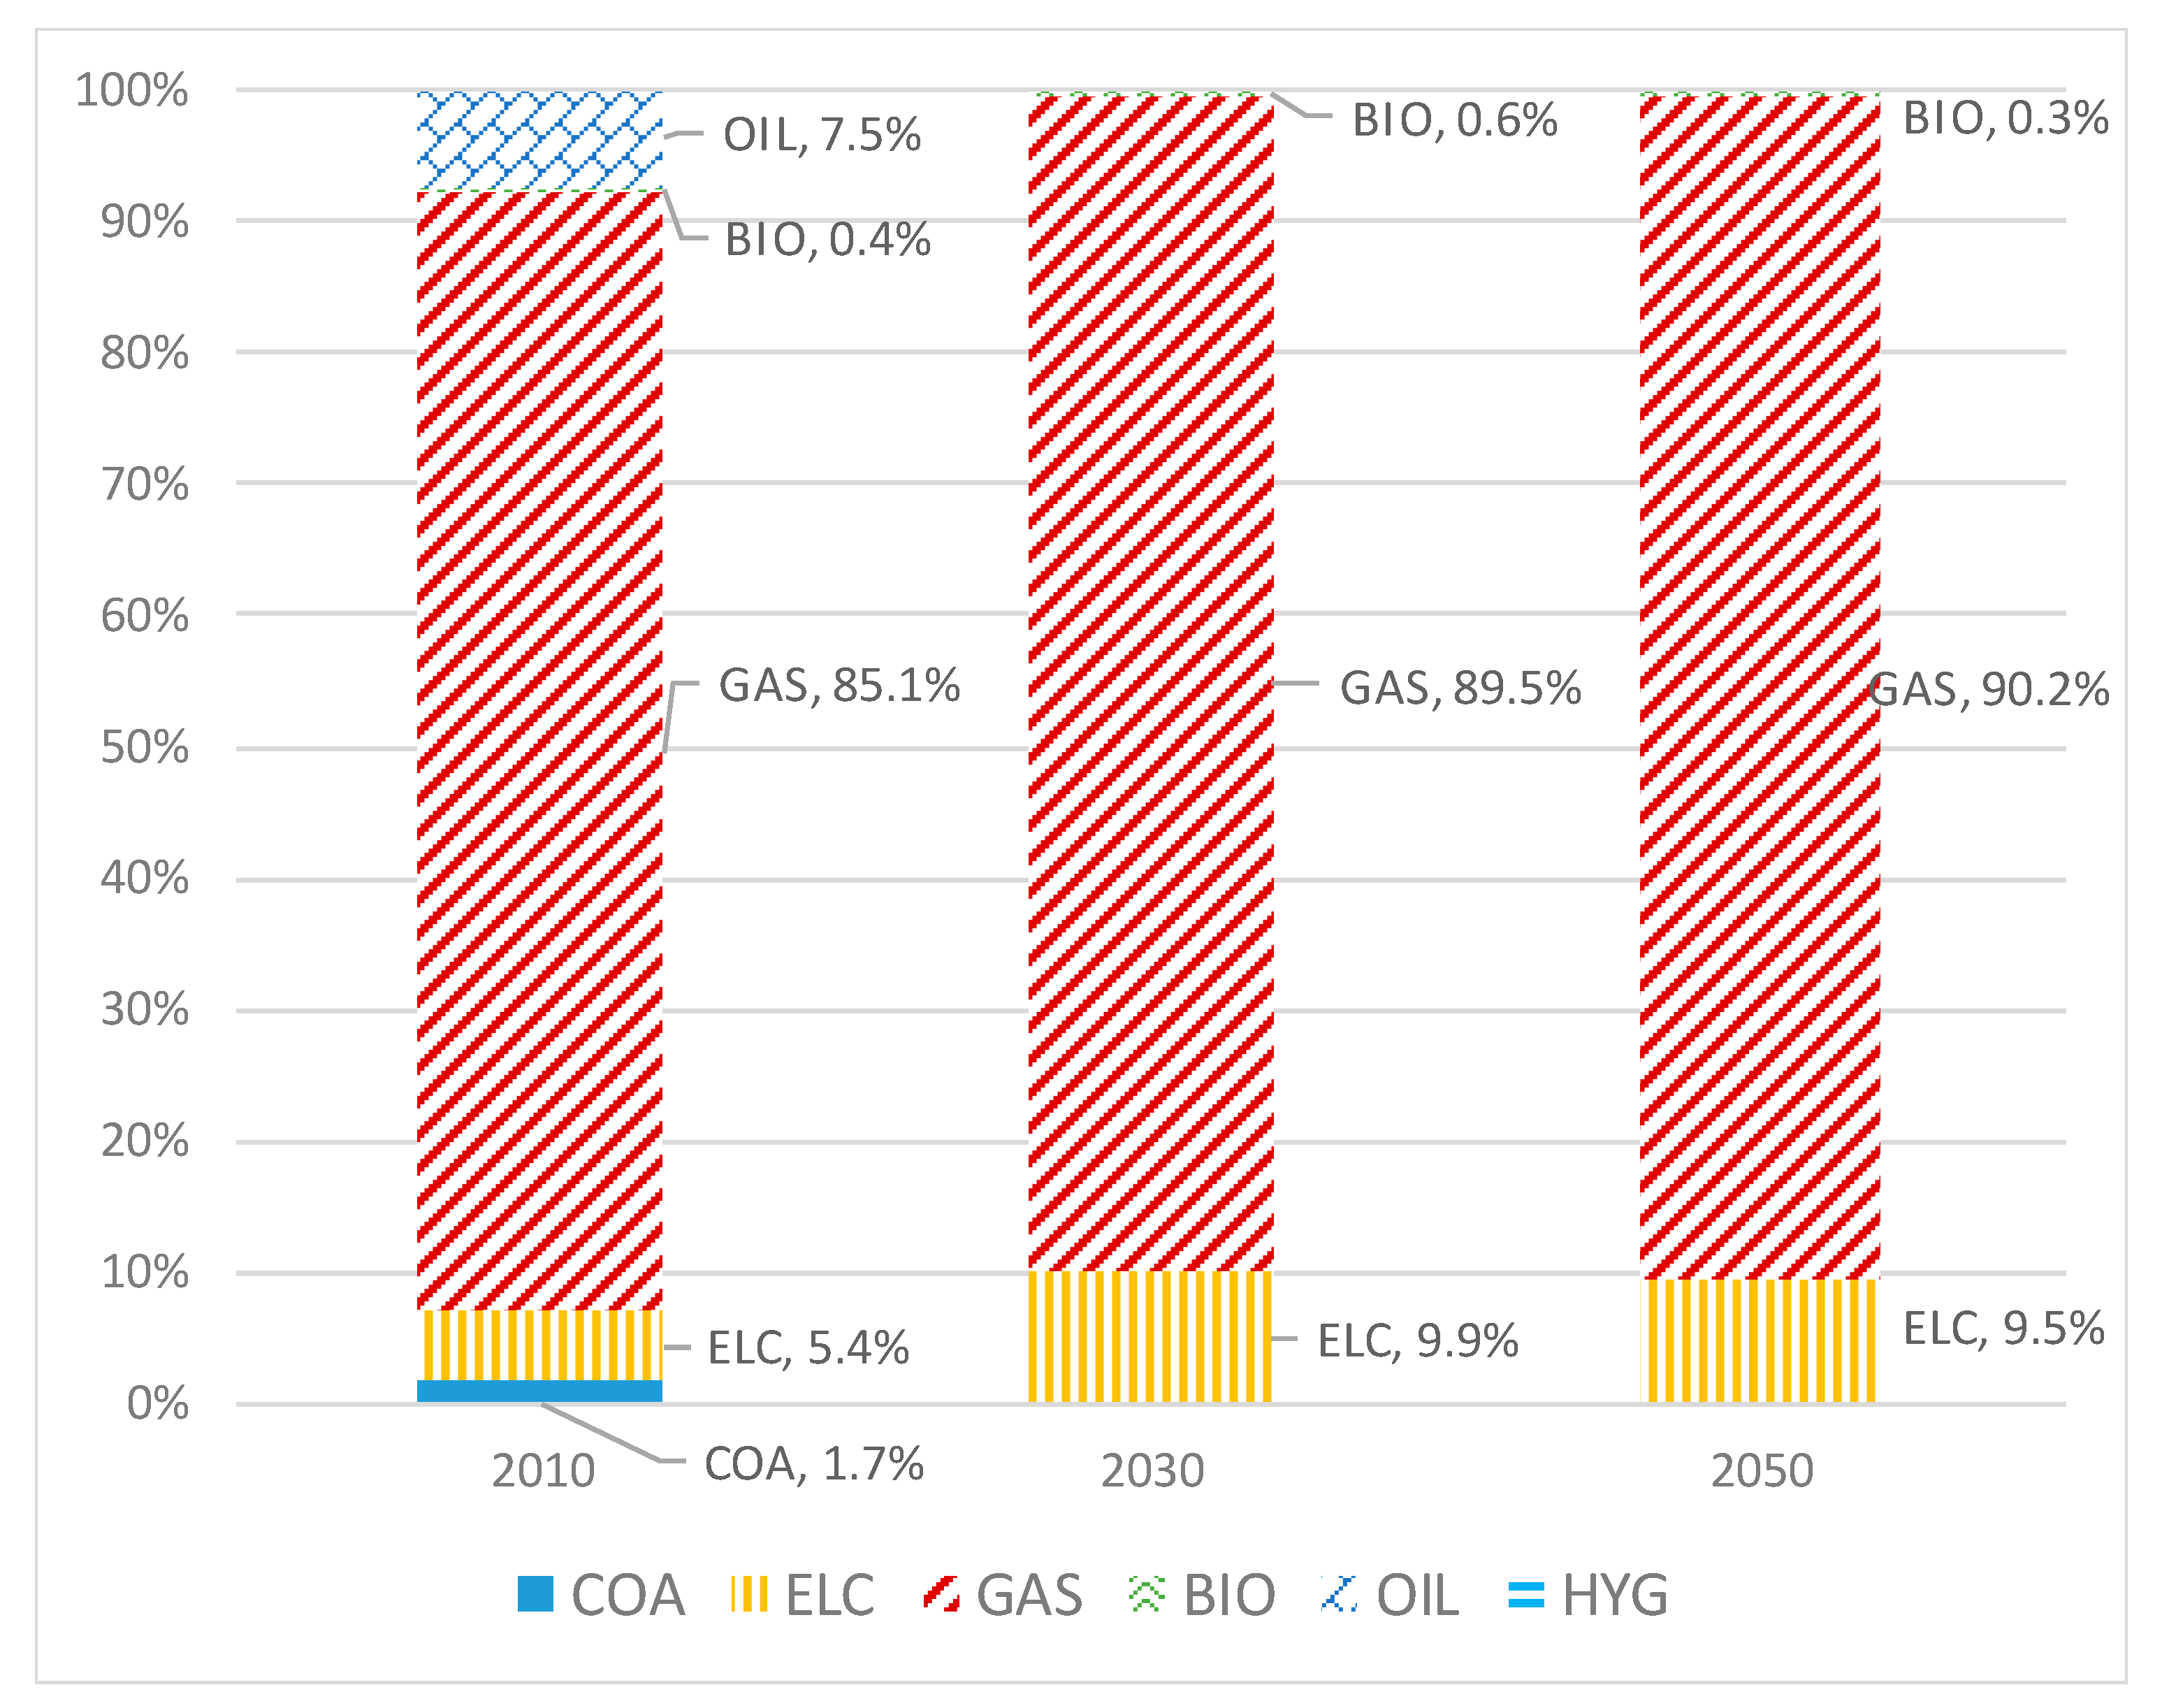
Figure 4.
Residential heating production by technology in 2010, 2030 and 2050—Base scenario.

Figure 5.
Summary of energy efficiency scenarios for this study.
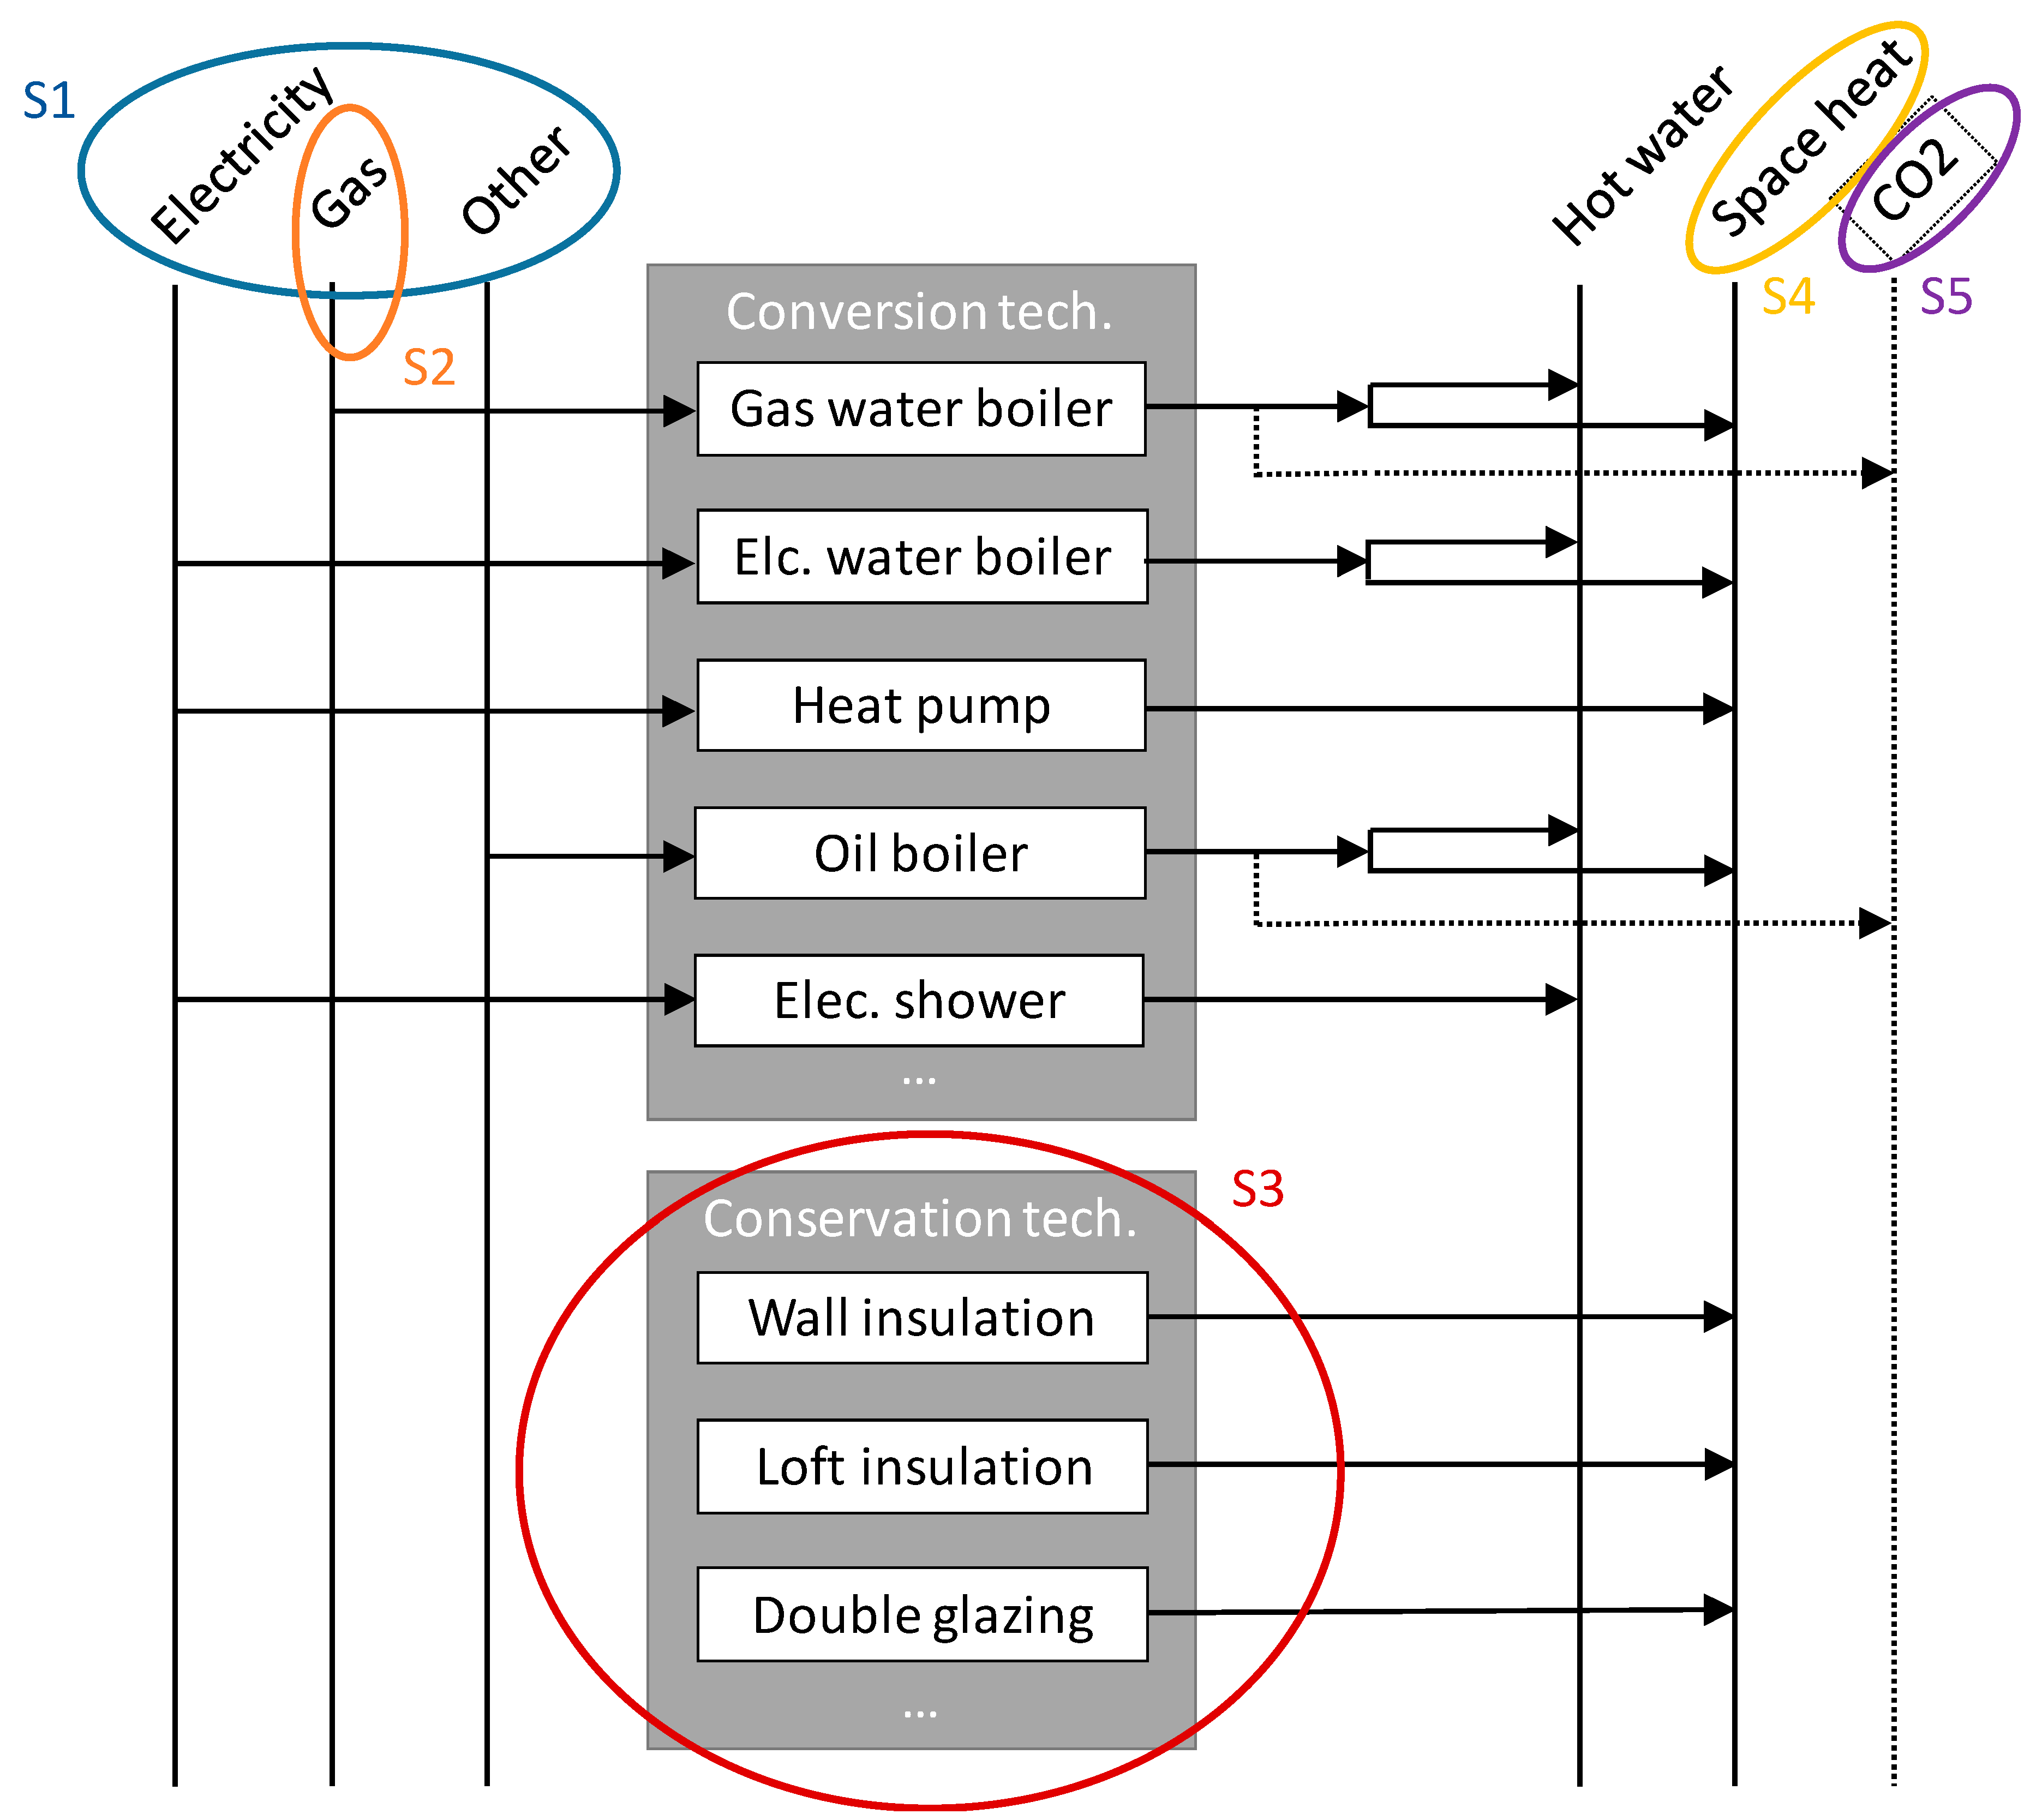
Figure 6.
Residential heating—Demand reduction scenario (*reduced demand).
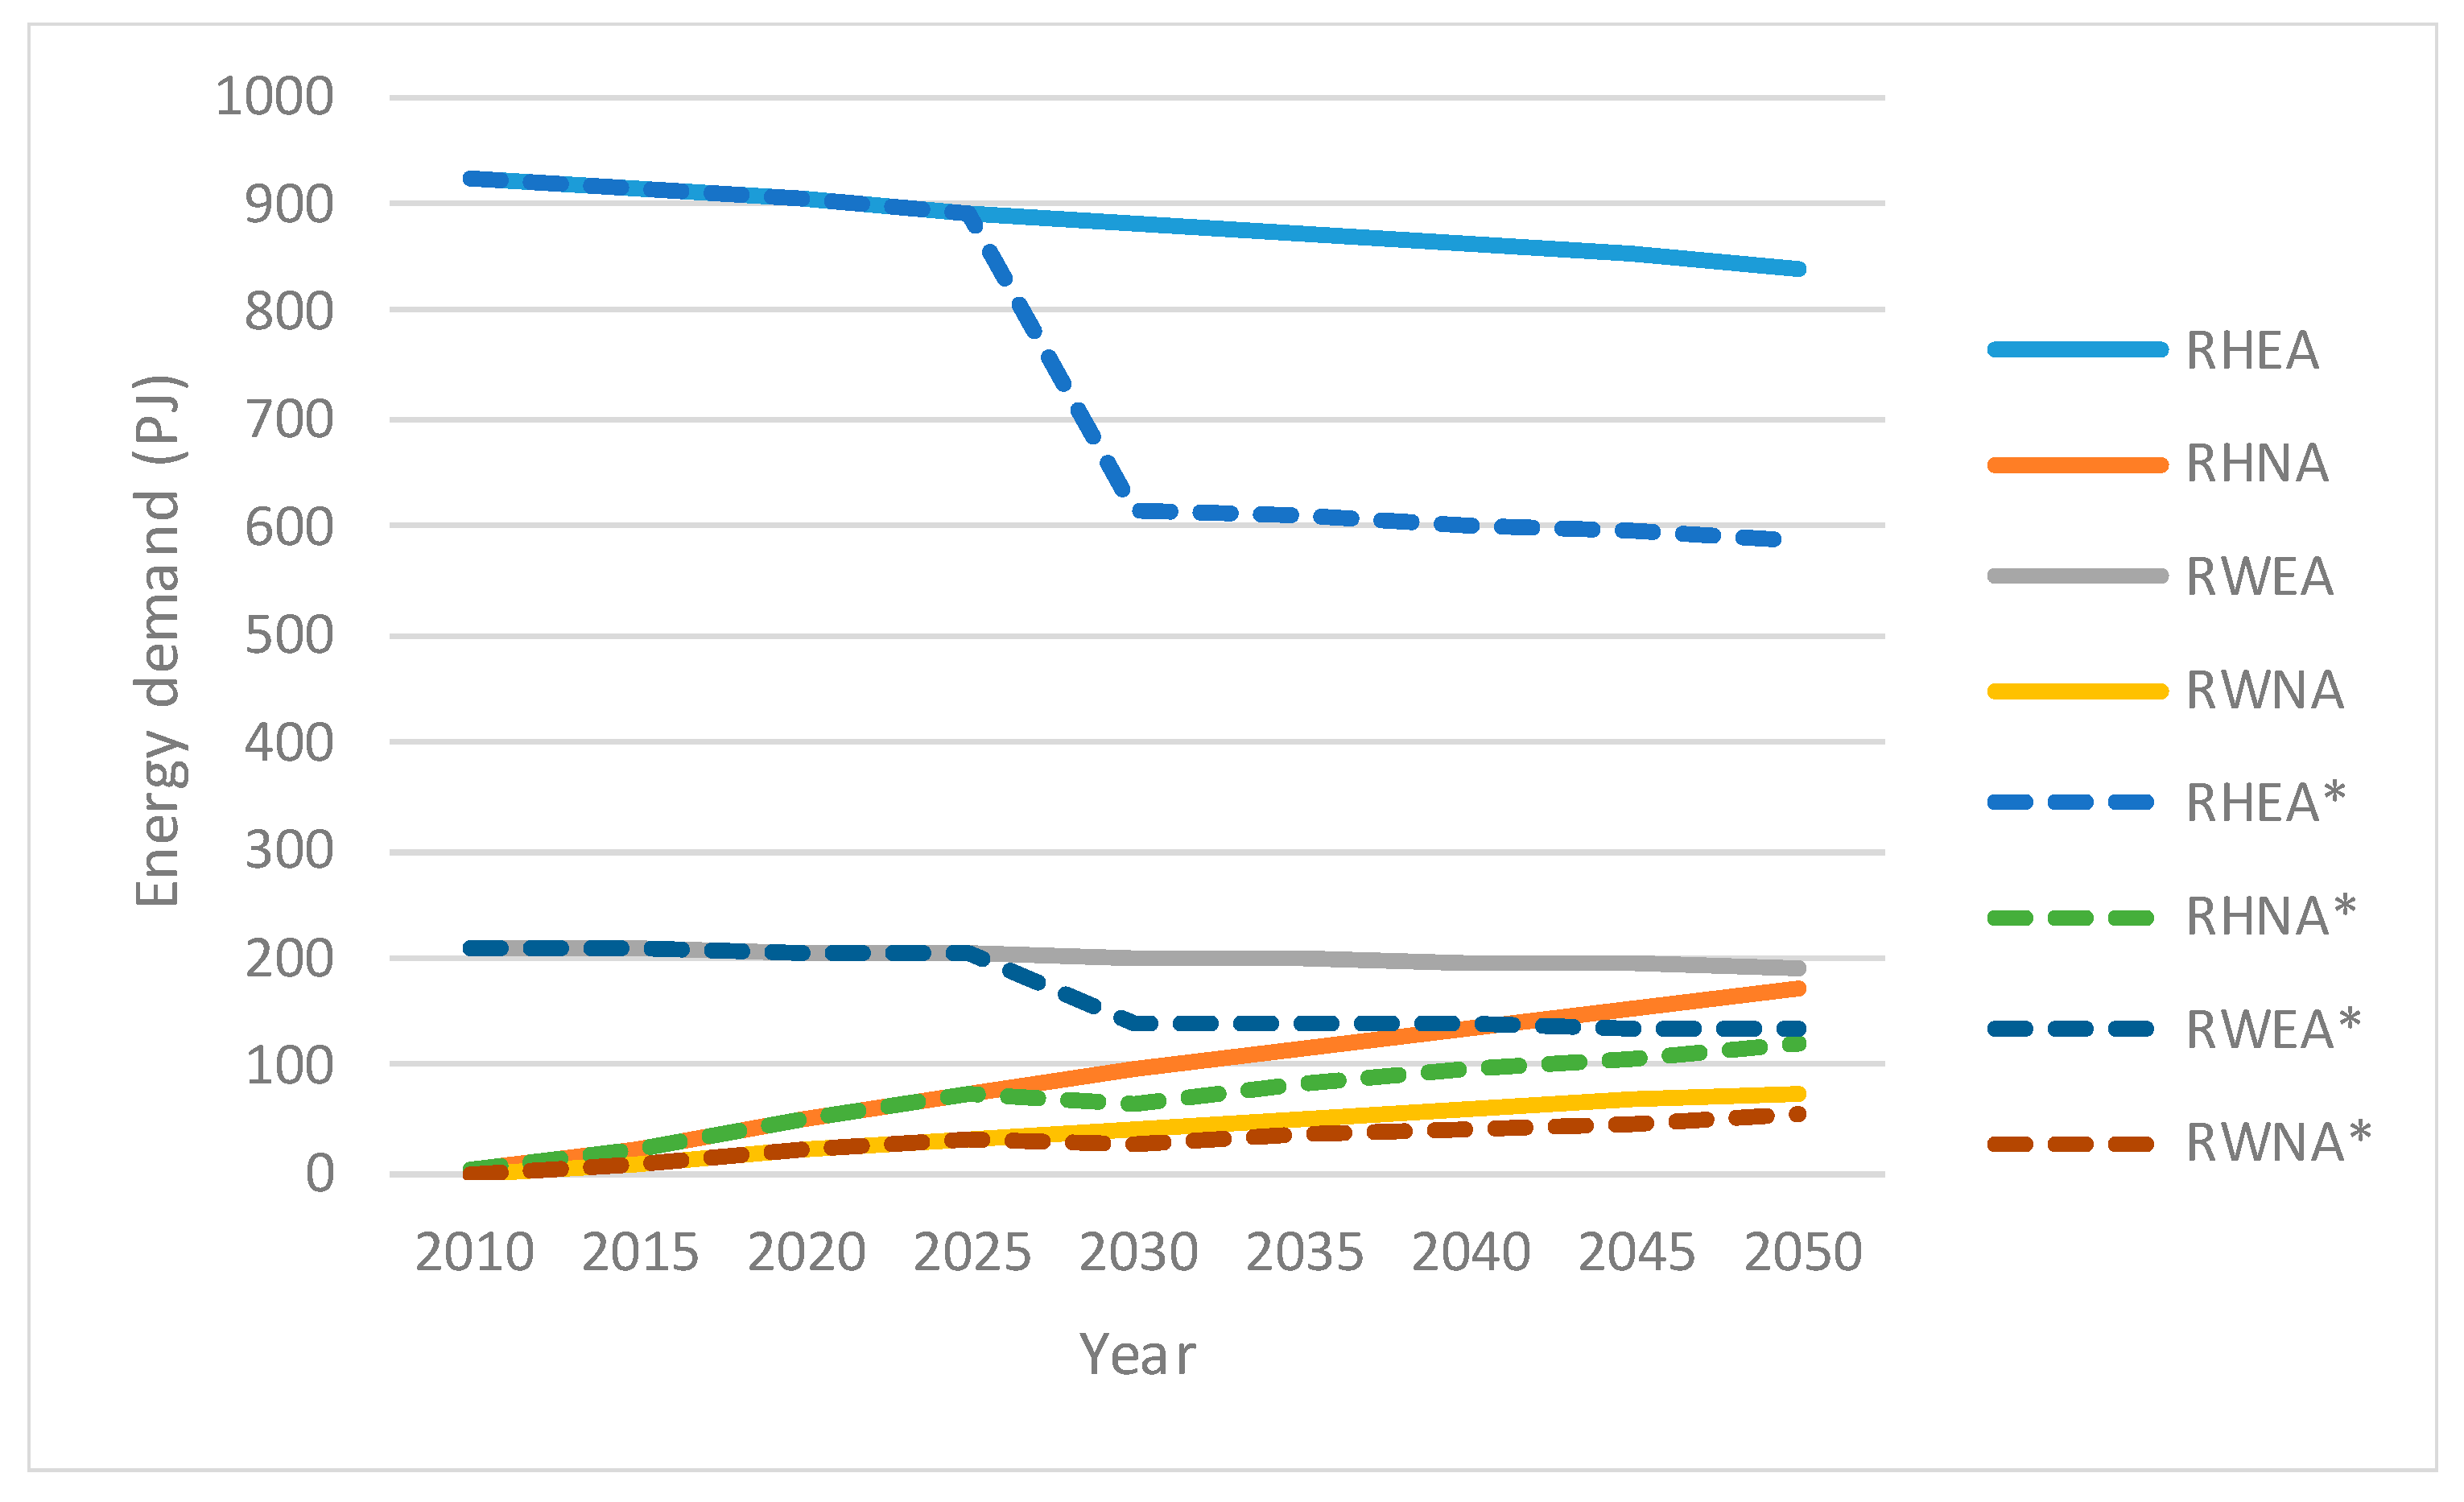
Figure 7.
Comparison of heating technology shares across scenarios—technology mix in 2050. S3* implements a relaxed constraint (see Section 4 for details).
Figure 7.
Comparison of heating technology shares across scenarios—technology mix in 2050. S3* implements a relaxed constraint (see Section 4 for details).
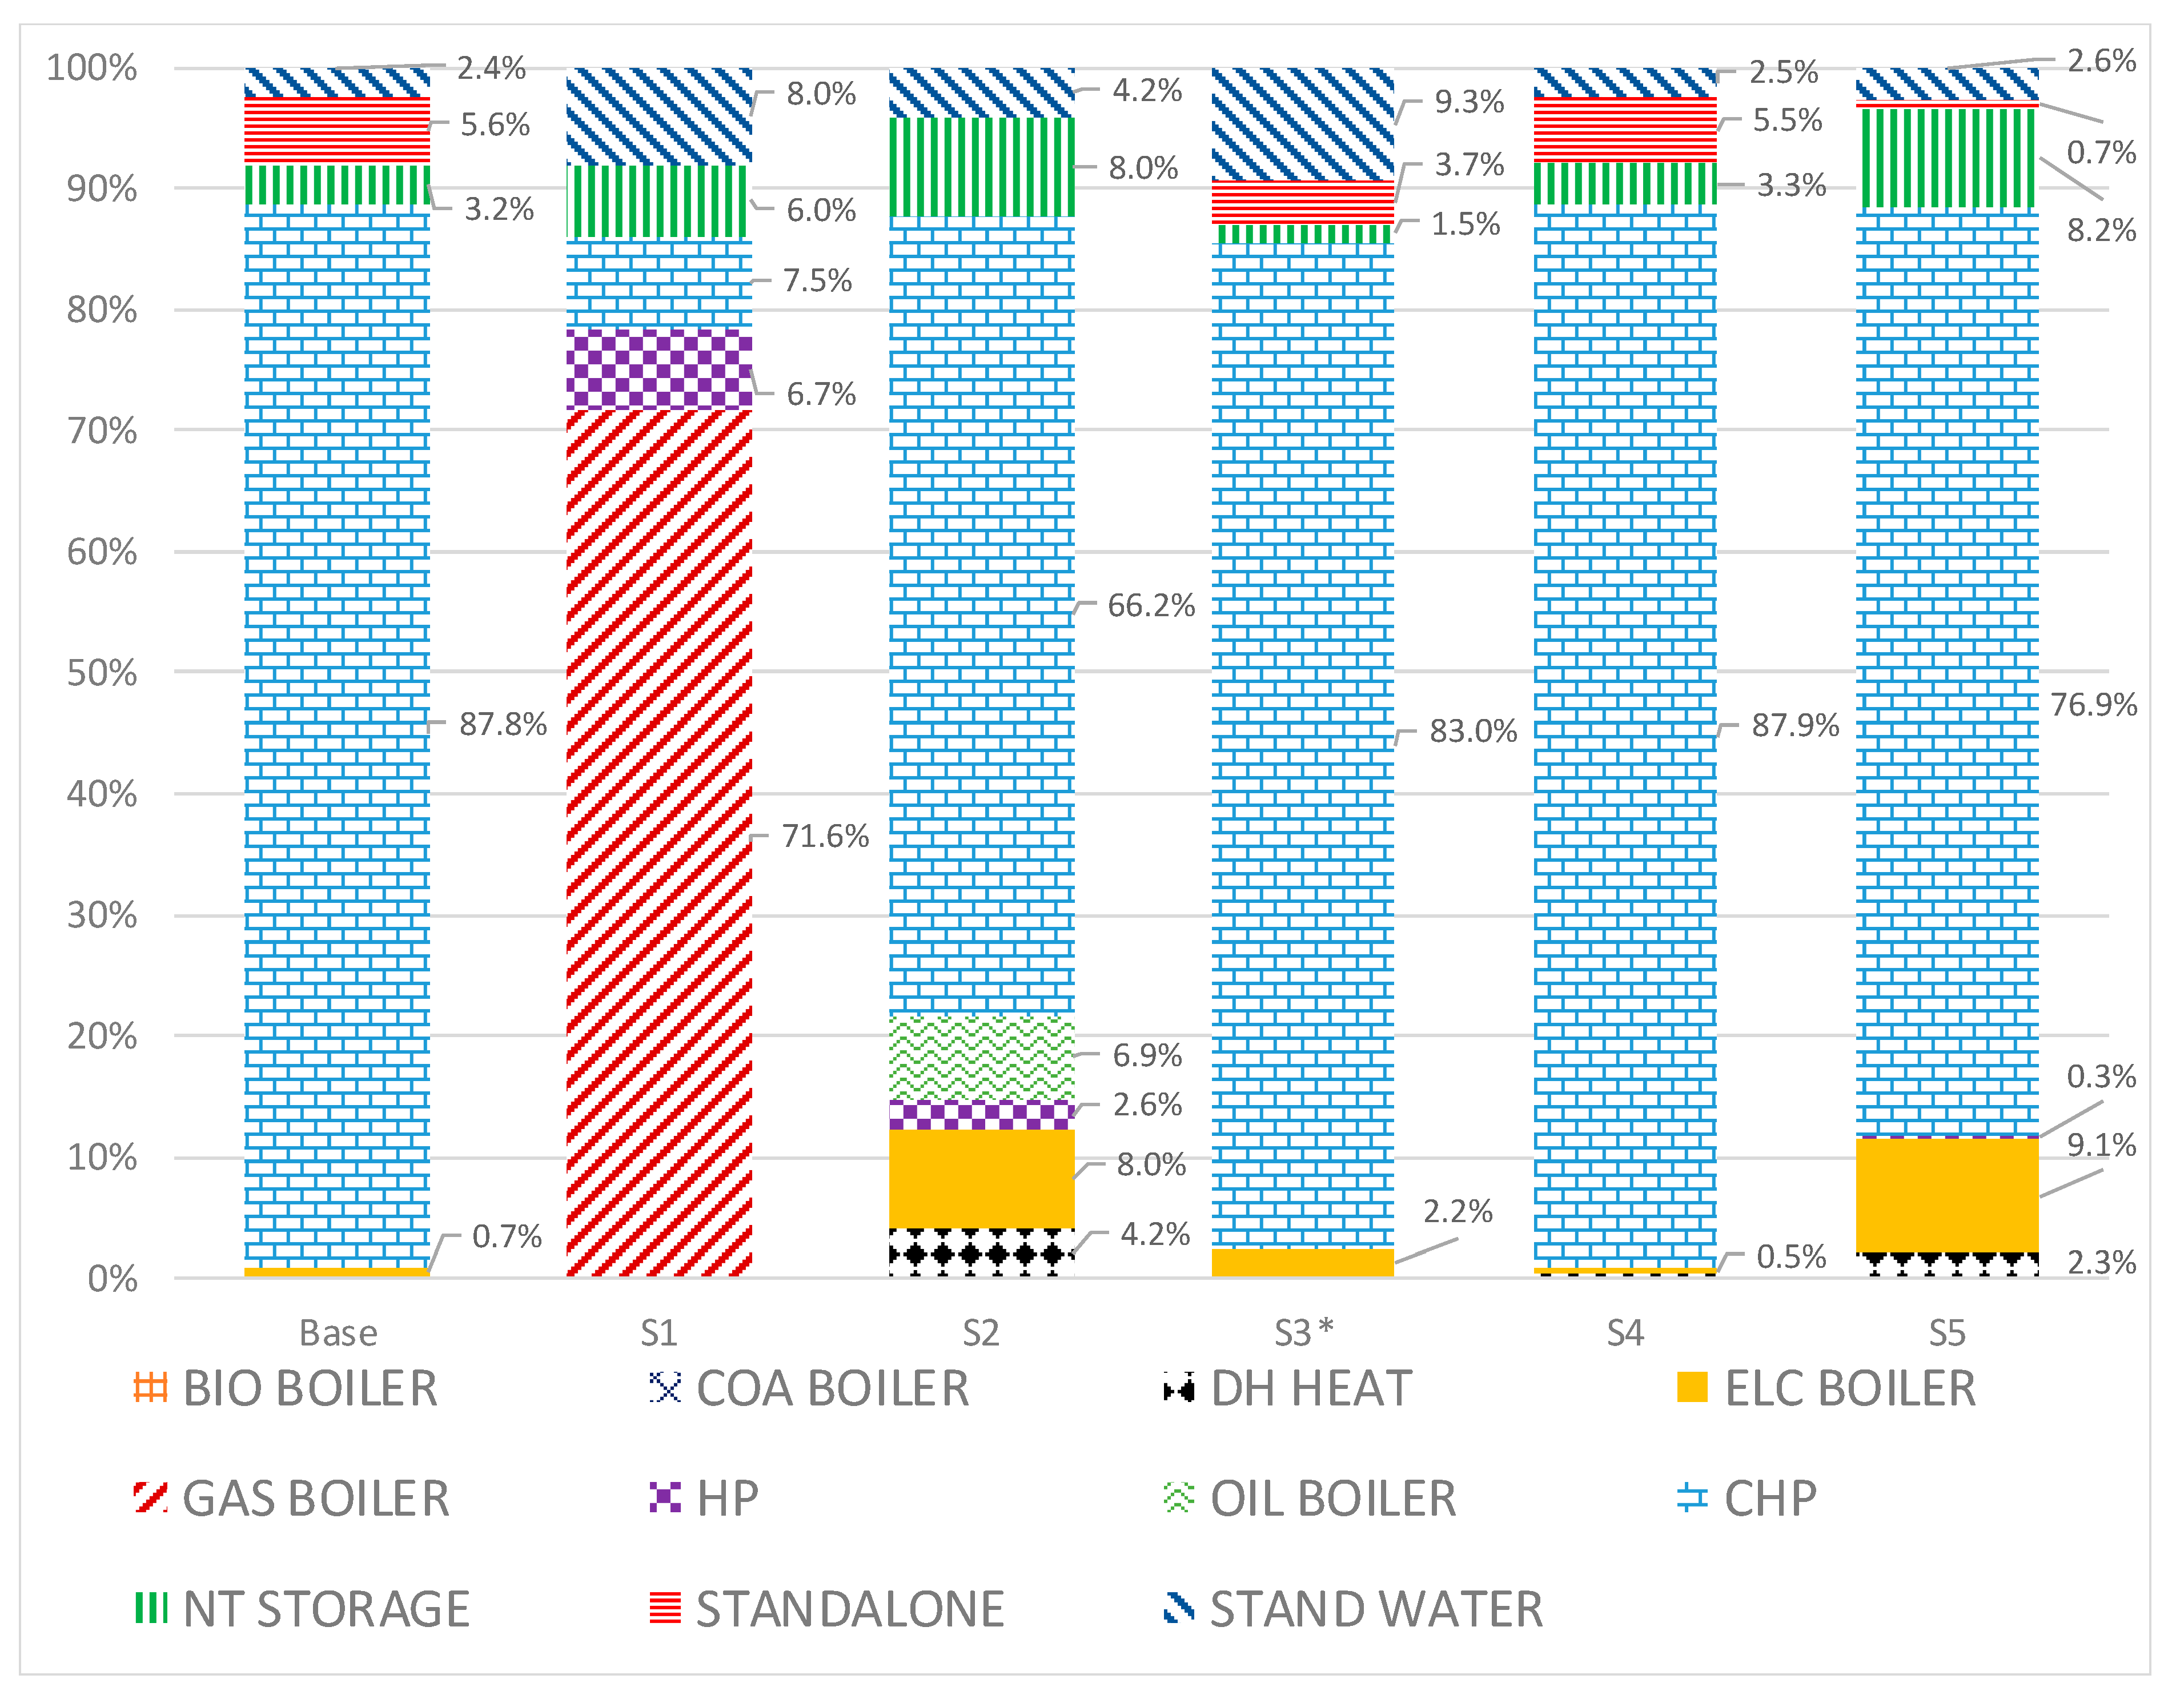
Figure 8.
Comparison of energy conservation technologies across scenarios—Cumulative production up to 2050. S3* implements a relaxed constraint (see Section 4 for details).
Figure 8.
Comparison of energy conservation technologies across scenarios—Cumulative production up to 2050. S3* implements a relaxed constraint (see Section 4 for details).
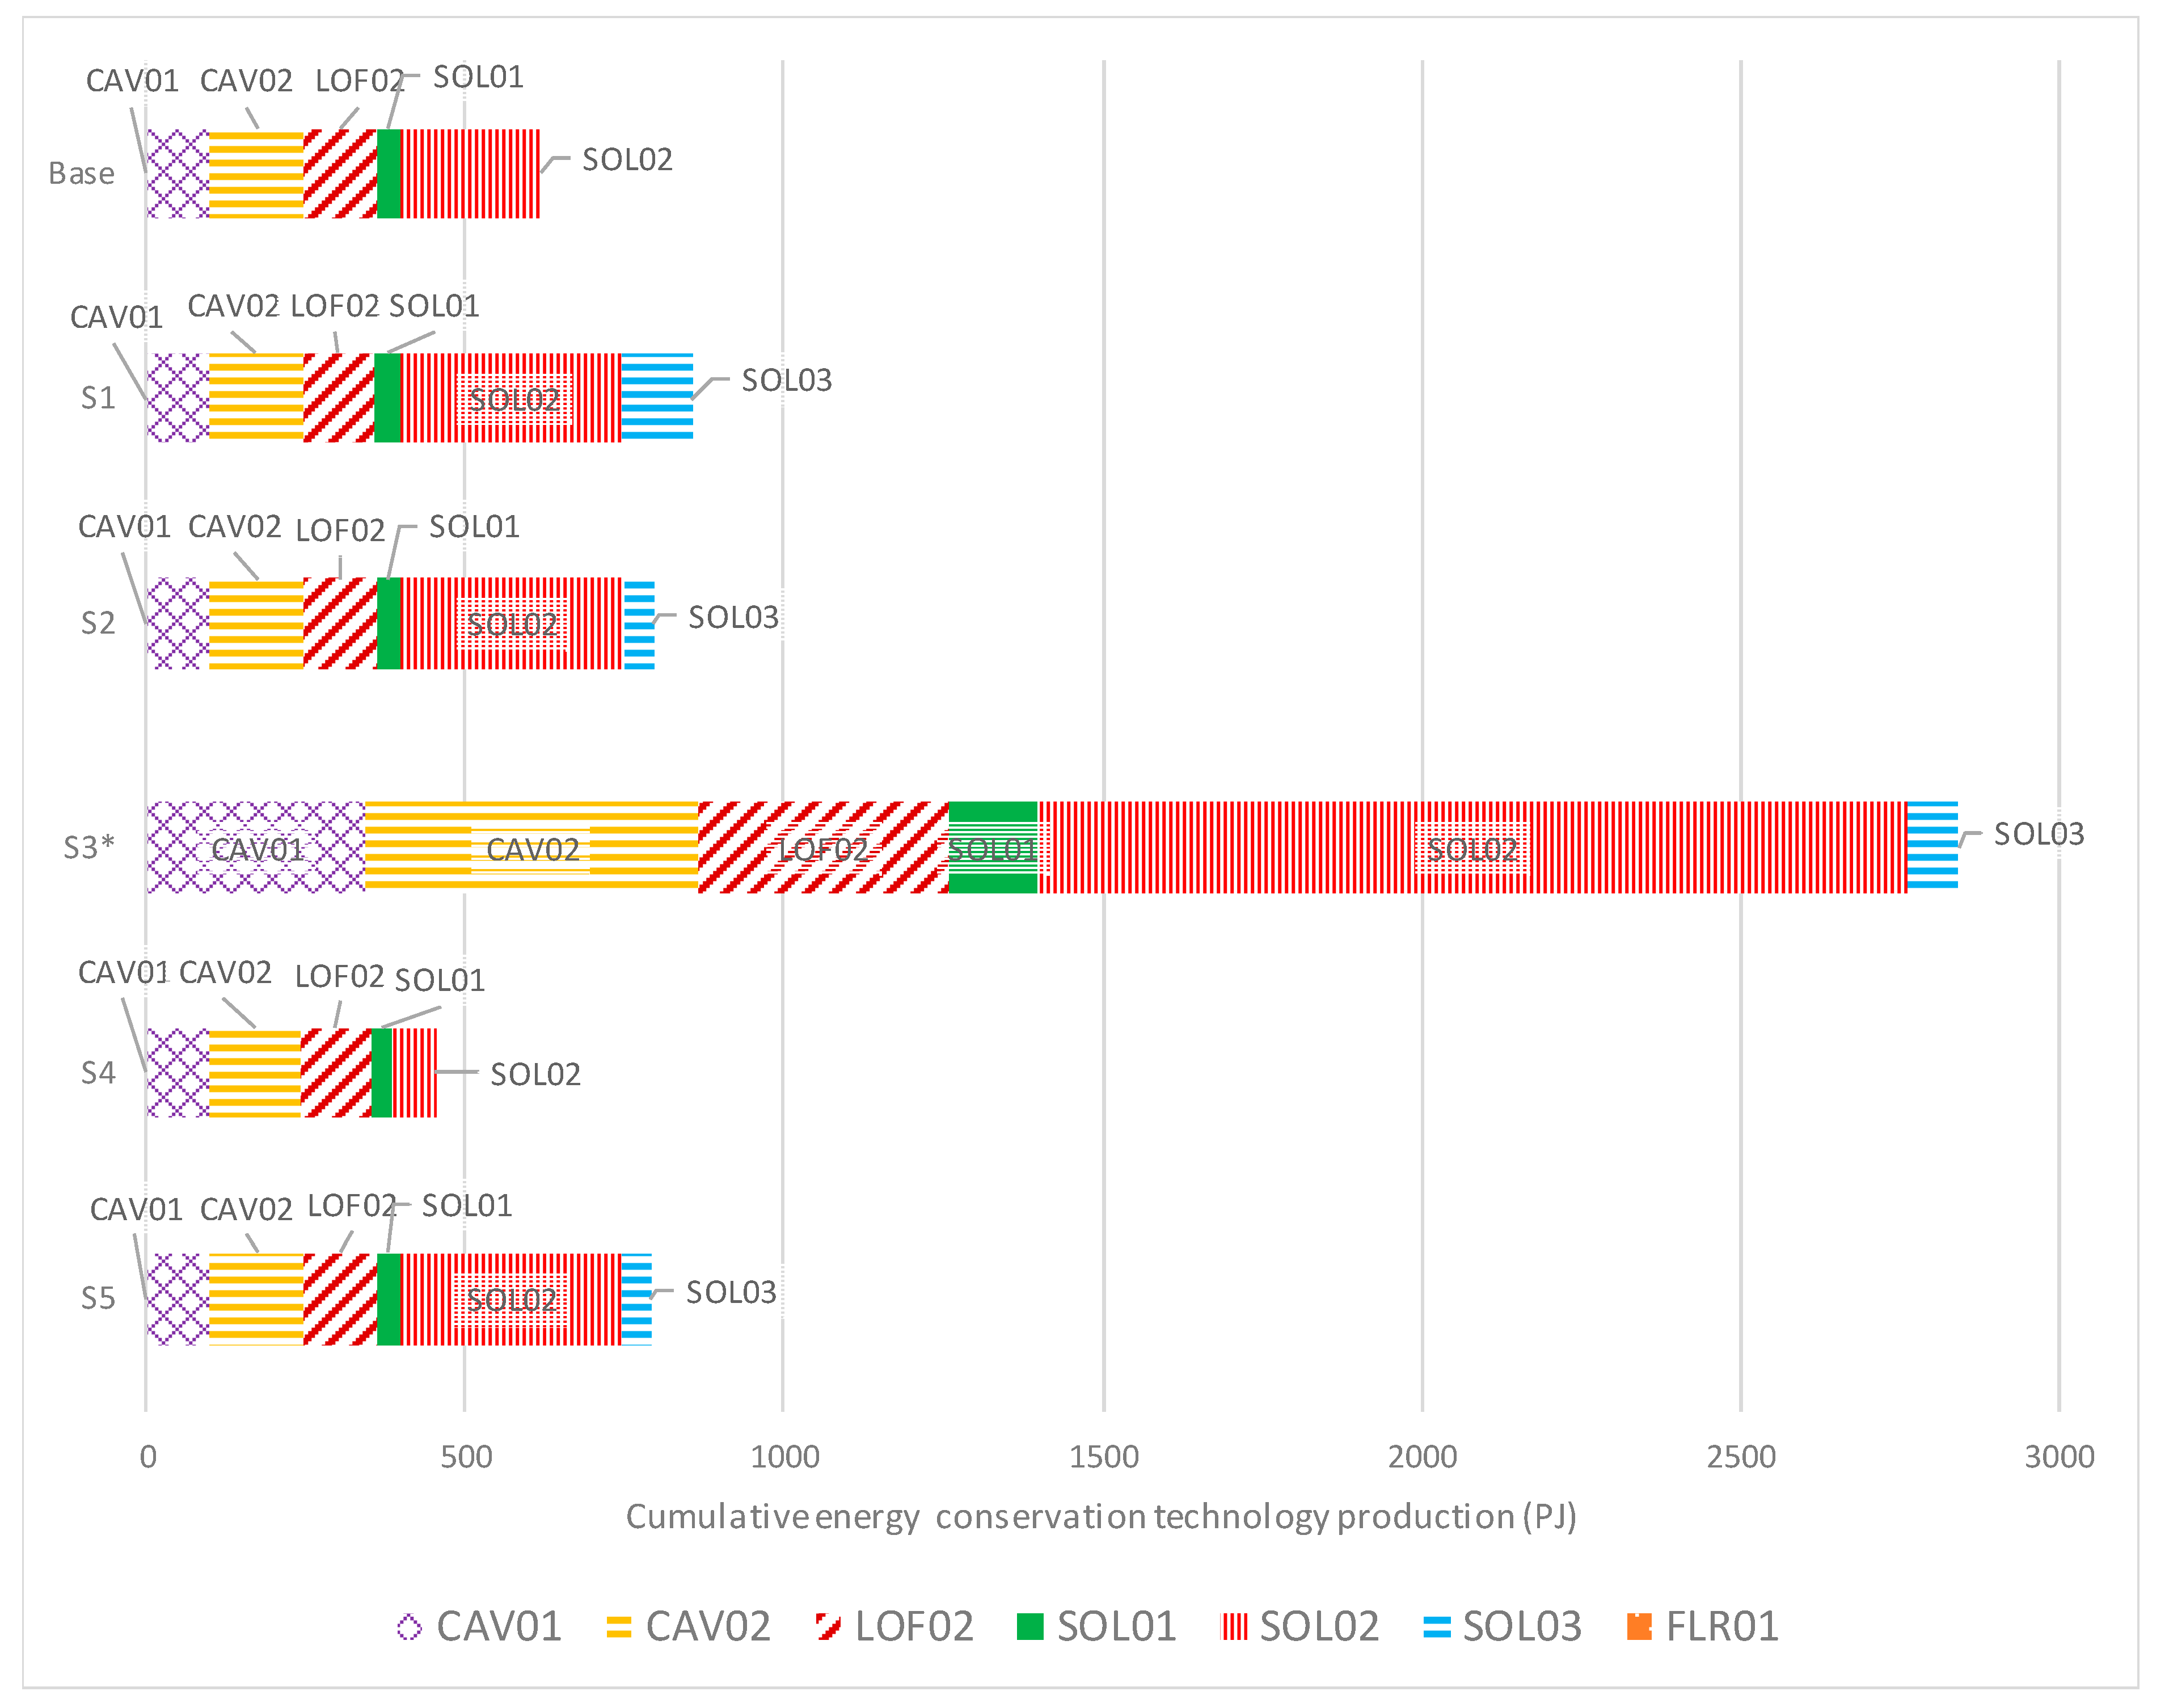
Figure 9.
Residential heating fuel use at 2050. S3* implements a relaxed constraint (see Section 4 for details).
Figure 9.
Residential heating fuel use at 2050. S3* implements a relaxed constraint (see Section 4 for details).

Table 1.
Summary of energy efficiency research using whole energy system models.
| Energy Efficiency Intervention | |||||||
|---|---|---|---|---|---|---|---|
| Ref | Modelling Tool | Focus | Technology Adoption | Energy Use Constraint | Emissions Constraint | Energy Demand Adjustments | Energy Efficiency Scenario Description |
| [11] | TIMES_PT (Portugal) | Sensitivity analysis of different assumptions | × | Relaxing technology adoption constraints | |||
| [13] | Irish TIMES | Analysis of electrification of heating | × | Technology adoption scenarios for the residential sector | |||
| [12] | TIMES-Norway | Reduction in energy use for heating | × | Imposing energy conservation technologies in buildings | |||
| [6] | FORECAST | Decarbonisation scenarios of the industry sector in Germany | × | Energy efficiency improvements as a result of changes in technology and industrial processes | |||
| [16] | FORECAST | Analysis of the macro-economic effects of German energy efficiency policy | × | × | Energy efficiency is implemented as energy use constraints and technology adoption constraints. | ||
| [14] | German TIMES | Energy efficiency on all sectors | × | × | Sectoral energy use constraints and system-wide emission constraints | ||
| [15] | UKTM | Role of industry on decarbonisation | × | × | Energy use constraints, share of renewables and emission constraints | ||
| [20] | MARKAL US | Assess economic and environmental impacts of CHP expansion | × | × | Energy efficiency is implicit in technology adoption and emission reduction scenarios | ||
| [18] | China TIMES | CCS technology role on decarbonisation | × | Decarbonisation targets (emission constraints) | |||
| [17] | TIAM global | Potential of a world with 100% renewables | × | Decarbonisation targets (emission constraints and emission taxes) | |||
| [19] | TIAM World | Decarbonisation scenarios with a soft-linking approach | × | Decarbonisation scenarios based on sectoral and regional emission constraints | |||
| [26] | OSeMOSYS + CitySIM | Decarbonisation pathways in the residential building sector of Austin, Texas. | × | × | Uses CitySIM building model to assess changes in energy demand due to efficiency improvements, and then adjusts this in OSeMOSYS. | ||
| [23] | LEAP (South Korea) | Sustainable development roadmaps of South Korea’s energy system | × | Energy efficiency is implicit in the scenarios, as adjustments in energy demand projections | |||
| [22] | Mesap/PlaNet | Analysis of future policy scenarios in China | × | Adjusting energy services demands, assuming energy efficiency policies implicitly. | |||
| [21] | China TIMES | Energy efficiency in building sector | × | × | Imposing technology adoption and demand projection changes | ||
| [24] | TIMES-DK (Denmark) | Analysis of the role of data centres in the Danish energy system | × | × | Adjusting exogenous demand in TIMES to include data centres, and using the excess heat to improve overall efficiency of heating systems | ||
Table 2.
Cumulative sectorial CO2 emission changes relative to base scenario (in %). S3* implements a relaxed constraint (see Section 4 for details).
Table 2.
Cumulative sectorial CO2 emission changes relative to base scenario (in %). S3* implements a relaxed constraint (see Section 4 for details).
| Sector | S1 | S2 | S3* | S4 | S5 |
|---|---|---|---|---|---|
| CO2 AGR | −1.65 | 2.28 | 0.00 | 0.00 | −2.24 |
| CO2 ELC | 4.05 | 3.15 | −1.26 | −0.97 | 4.72 |
| CO2 HYG | +100 | +100 | 72.96 | 72.96 | +100 |
| CO2 IND | 2.08 | 0.02 | −0.20 | −0.03 | 0.23 |
| CO2 RES | −9.11 | −7.08 | −18.81 | −15.87 | −8.95 |
| CO2 SER | 4.55 | 3.68 | −2.39 | 0.26 | 3.28 |
| CO2 TRA | −0.01 | −0.06 | 0.01 | 0.01 | −0.02 |
| CO2 Total | 0.23 | 1.04 | −3.35 | −2.66 | 0.78 |
Table 3.
Residential heating and energy conservation technology changes for all scenarios (relative to base scenario). S3* implements a relaxed constraint (see Section 4 for details).
Table 3.
Residential heating and energy conservation technology changes for all scenarios (relative to base scenario). S3* implements a relaxed constraint (see Section 4 for details).
| Scenario | CO2 Emissions Res. Sector Change (%) | CO2 Emissions Change Total (%) | Res. Heat Fuel Use Change (%) | Total System Cost Change (%) |
|---|---|---|---|---|
| S1 | −9.1 | 0.2 | −15.0 | 0.5 |
| S2 | −7.1 | 1.0 | −2.6 | 0.4 |
| S3* | −18.8 | −3.4 | −28.0 | −0.4 |
| S4 | −15.9 | −2.7 | −33.2 | −1.3 |
| S5 | −9.0 | 0.8 | −3.7 | 0.2 |
Disclaimer/Publisher’s Note: The statements, opinions and data contained in all publications are solely those of the individual author(s) and contributor(s) and not of MDPI and/or the editor(s). MDPI and/or the editor(s) disclaim responsibility for any injury to people or property resulting from any ideas, methods, instructions or products referred to in the content. |
© 2023 by the author. Licensee MDPI, Basel, Switzerland. This article is an open access article distributed under the terms and conditions of the Creative Commons Attribution (CC BY) license (https://creativecommons.org/licenses/by/4.0/).
Share and Cite
MDPI and ACS Style
Calvillo, C. The Impacts of Energy Efficiency Modelling in Policy Making. Energies 2023, 16, 1811. https://doi.org/10.3390/en16041811
AMA Style
Calvillo C. The Impacts of Energy Efficiency Modelling in Policy Making. Energies. 2023; 16(4):1811. https://doi.org/10.3390/en16041811
Chicago/Turabian StyleCalvillo, Christian. 2023. "The Impacts of Energy Efficiency Modelling in Policy Making" Energies 16, no. 4: 1811. https://doi.org/10.3390/en16041811
Note that from the first issue of 2016, this journal uses article numbers instead of page numbers. See further details here.