
Energy Intensity of Food Industry Production in Poland in the Process of Energy Transformation


Abstract
:1. Introduction
- What is the energy consumption in different branches of the food industry?
- What is the consumption of fossil fuels in food-industry enterprises?
- What energy-efficiency strategies characterize individual branches of the food industry?
- What is the share of energy costs in the total costs of food-industry enterprises?
2. Literature Review
2.1. Research on Energy Consumption in the Food Industry
- -
- use of modern technologies and devices,
- -
- development of energy-management systems and energy-audit systems,
- -
- development of high-efficiency cogeneration,
- -
- introducing a mechanism of financial incentives supporting market transformation towards increasing the share of energy-saving devices,
- -
- introduction of a training program in the field of energy management,
- -
- changes in technology to reduce energy demand,
- -
- reuse of waste energy,
- -
- thermal modernization of facilities.
2.2. Measures of Energy Efficiency in the Food Industry
2.3. Energy Policy of the EU and Poland in the Process of Energy Transformation
- -
- 20% reduction in greenhouse gas emissions in 2020 compared to 1990,
- -
- increasing to 20% the share of energy from renewable sources in 2020 in total energy consumption in the EU compared to 1990,
- -
- increasing energy efficiency by 20% in 2020 compared to 2005.
- -
- Poland’s Energy Policy until 2030 [64],
- -
- National Action Plans (NAPs) concerning energy efficiency.
- improving energy efficiency, increasing the security of fuel and energy supplies, developing RES, including biofuels,
- development of competitive fuel and energy markets and reduction of the impact of the energy sector on the environment.
- -
- the implementation of nuclear energy in 2033,
- -
- reducing greenhouse gas emissions by 30% by 2030,
- -
- an increase in energy efficiency by 23% by 2030 compared to the 2007 primary-energy-consumption forecasts.
- reduction in greenhouse gas emissions by 7% in sectors not covered by the European Emissions Trading Scheme (EU ETS) compared to 2005 levels,
- 21–23% share of renewable energy sources (RES) in gross final energy consumption. At the same time, the 23% target will be achievable if Poland is granted additional EU funds, including for just transition, taking into account:
- -
- 14% share of RES in transport,
- -
- annual increase in the share of RES in heating and cooling by 1.1 percentage points,
- increase in energy efficiency by 23% compared to PRIMES2007 forecasts,
- reduction to 56–60% of the share of coal in electricity production.
2.4. Innovations in Shaping the Energy Transformation
- -
- thermal modernization of buildings,
- modernization and replacement of devices with better energy efficiency (e.g., electrical devices, light sources, electric drives, technologies used in various technological processes),
- increasing the combined generation of electricity and heat,
- -
- reduction in losses in energy transmission,
- -
- increase in the use of energy from renewable sources.
3. Materials and Methods
- Ep—production energy consumption
- Ez—direct energy consumption in a given branch of the food industry
- P—value of production sold in a given branch of the food industry
- Ep—energy intensity of employment
- Ez—direct energy consumption in a given branch of the food industry
- Z—size of employment in a given branch of the food industry
4. Results
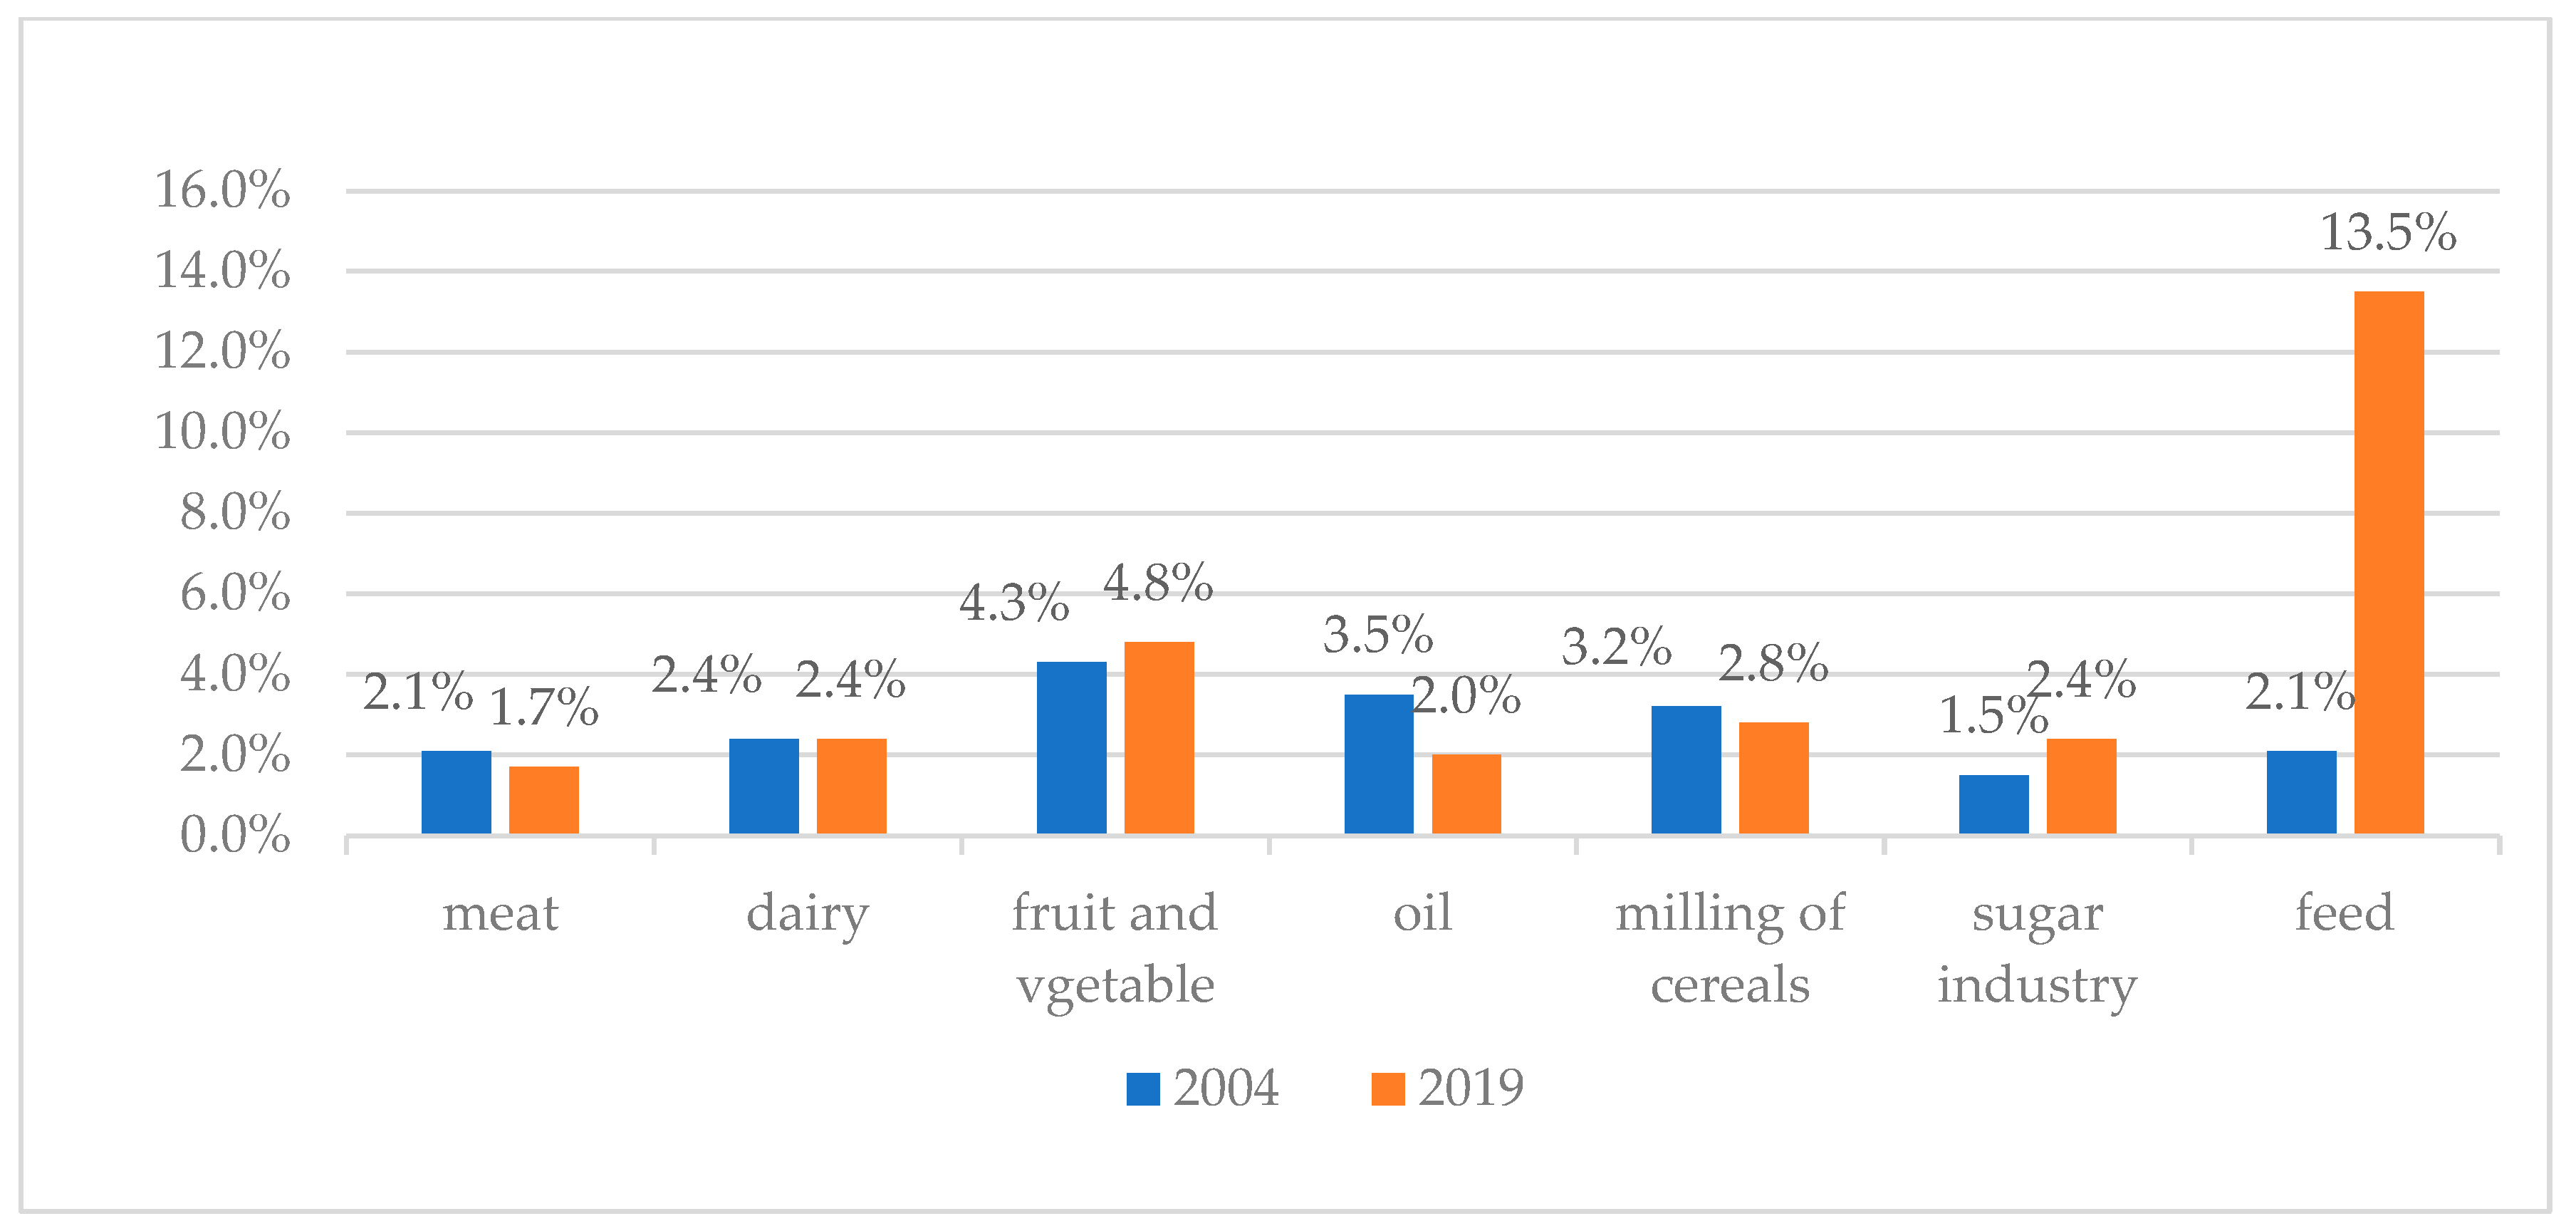
4.1. Consumption of Energy and Fuels in the Food Industry
- -
- consumption of hard coal decreased by 35.8% (to 997 thousand tons),
- -
- the use of coke and semi-coke was reduced by 39.5% (to 26 thousand tons),
- -
- consumption of high-methane natural gas increased by 126.7% (to 916 hm3),
- -
- electricity consumption increased by 71.6% (to 7291 GWh).
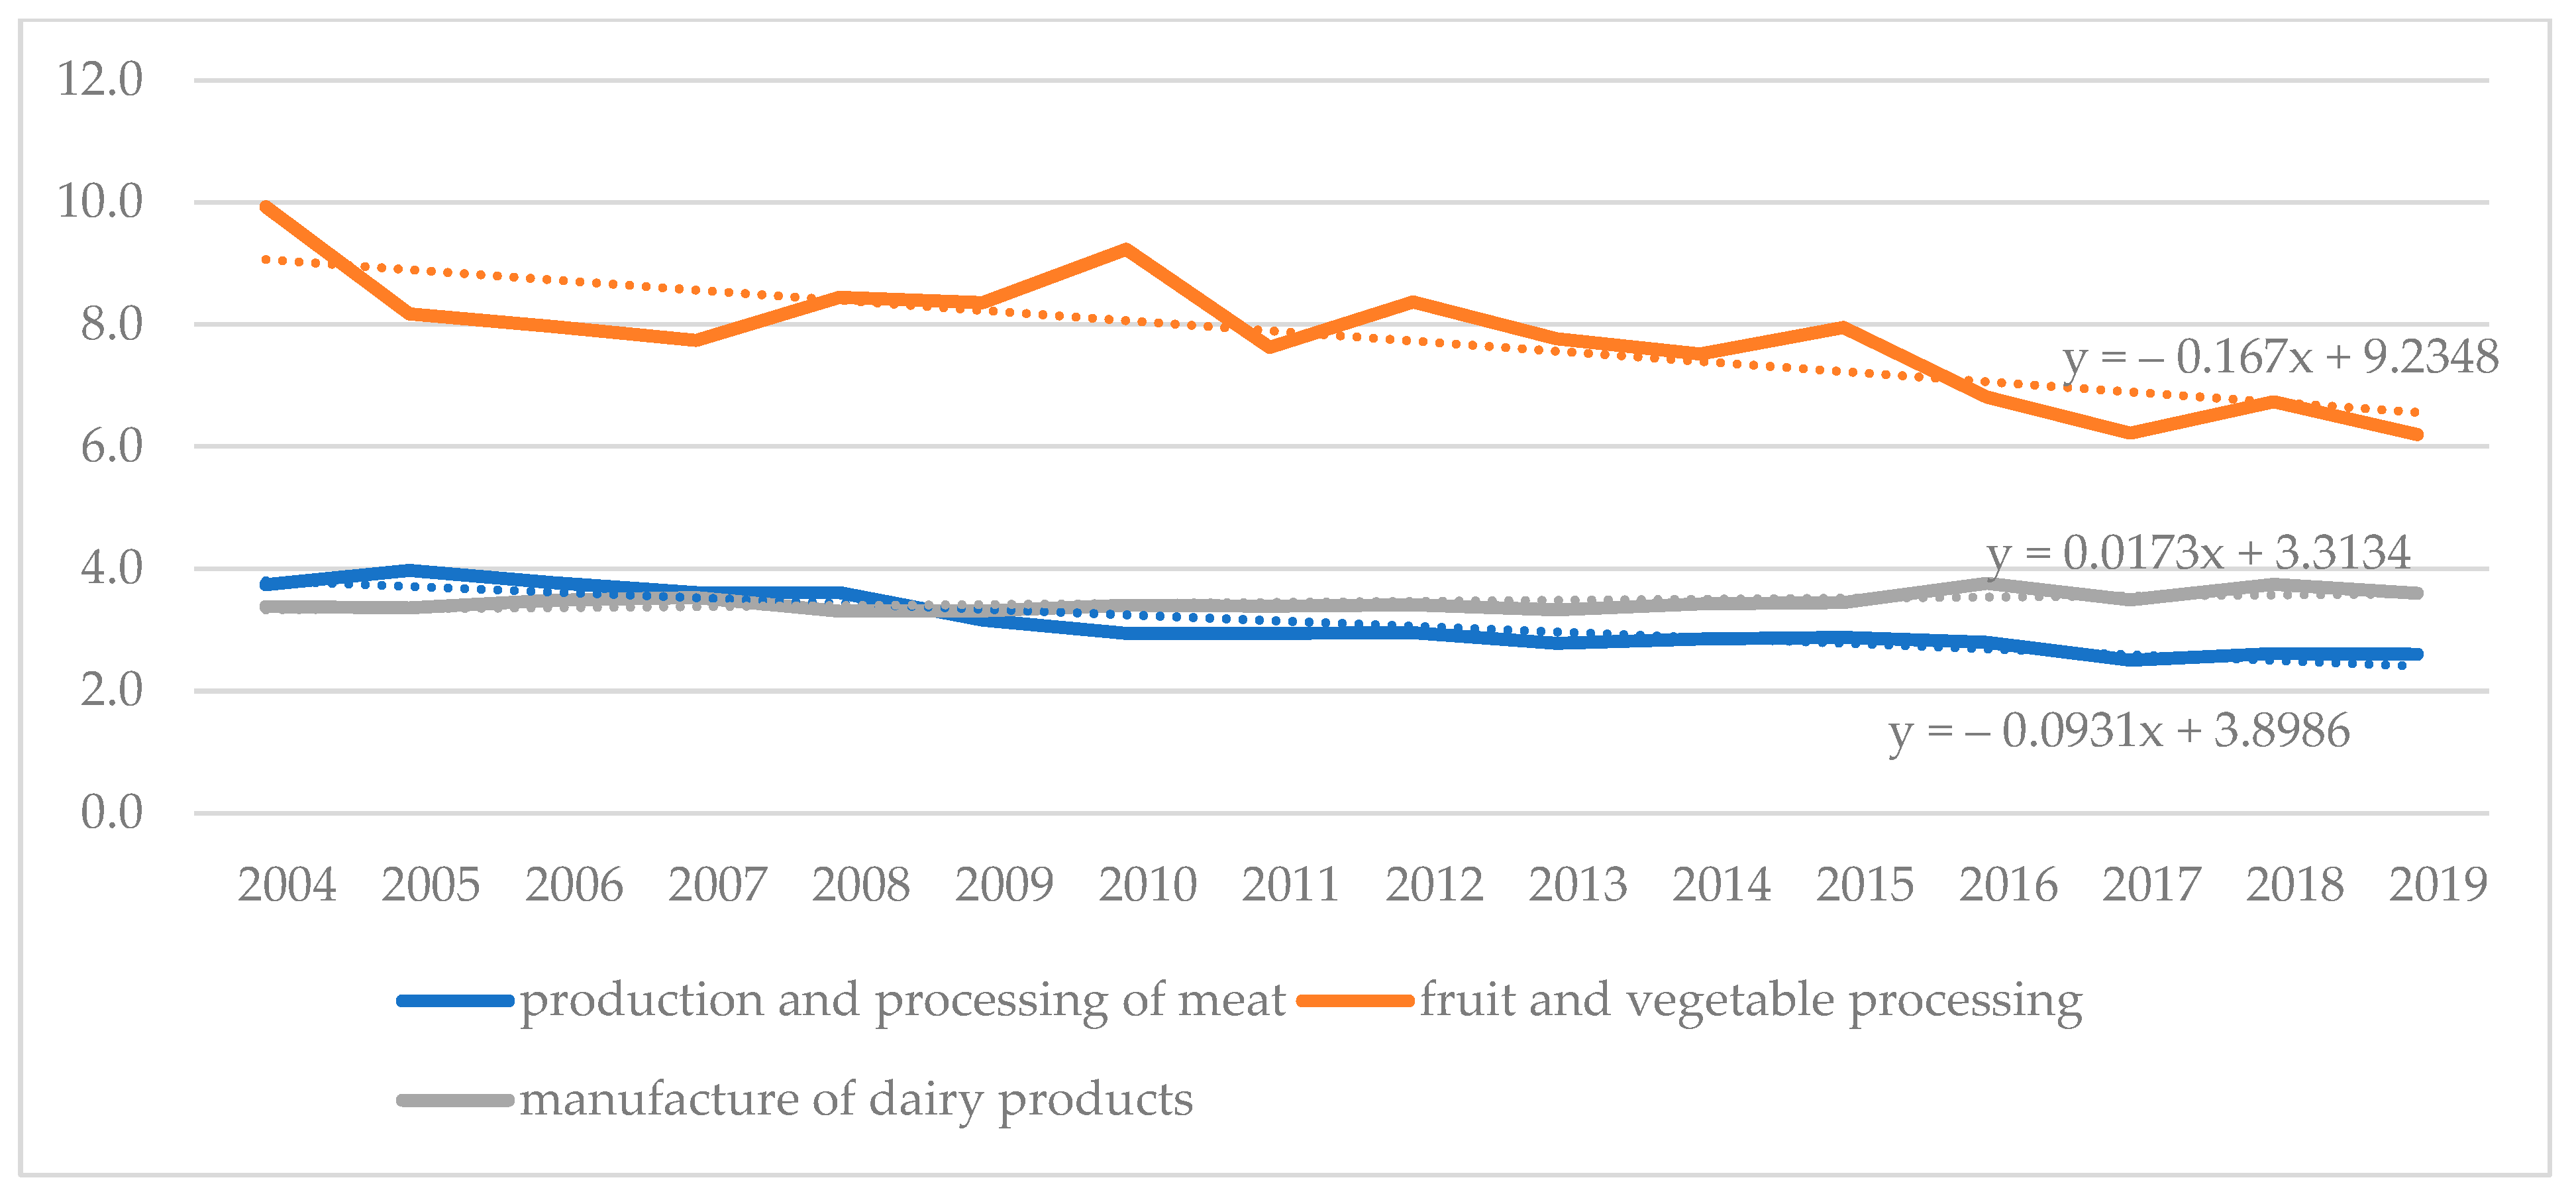
4.2. Energy Intensity of Production and Employment in the Food Industry
- -
- meat industry (production, processing, and preservation of meat and meat products),
- -
- dairy industry with ice cream (manufacture of dairy products),
- -
- fruit and vegetable industry.
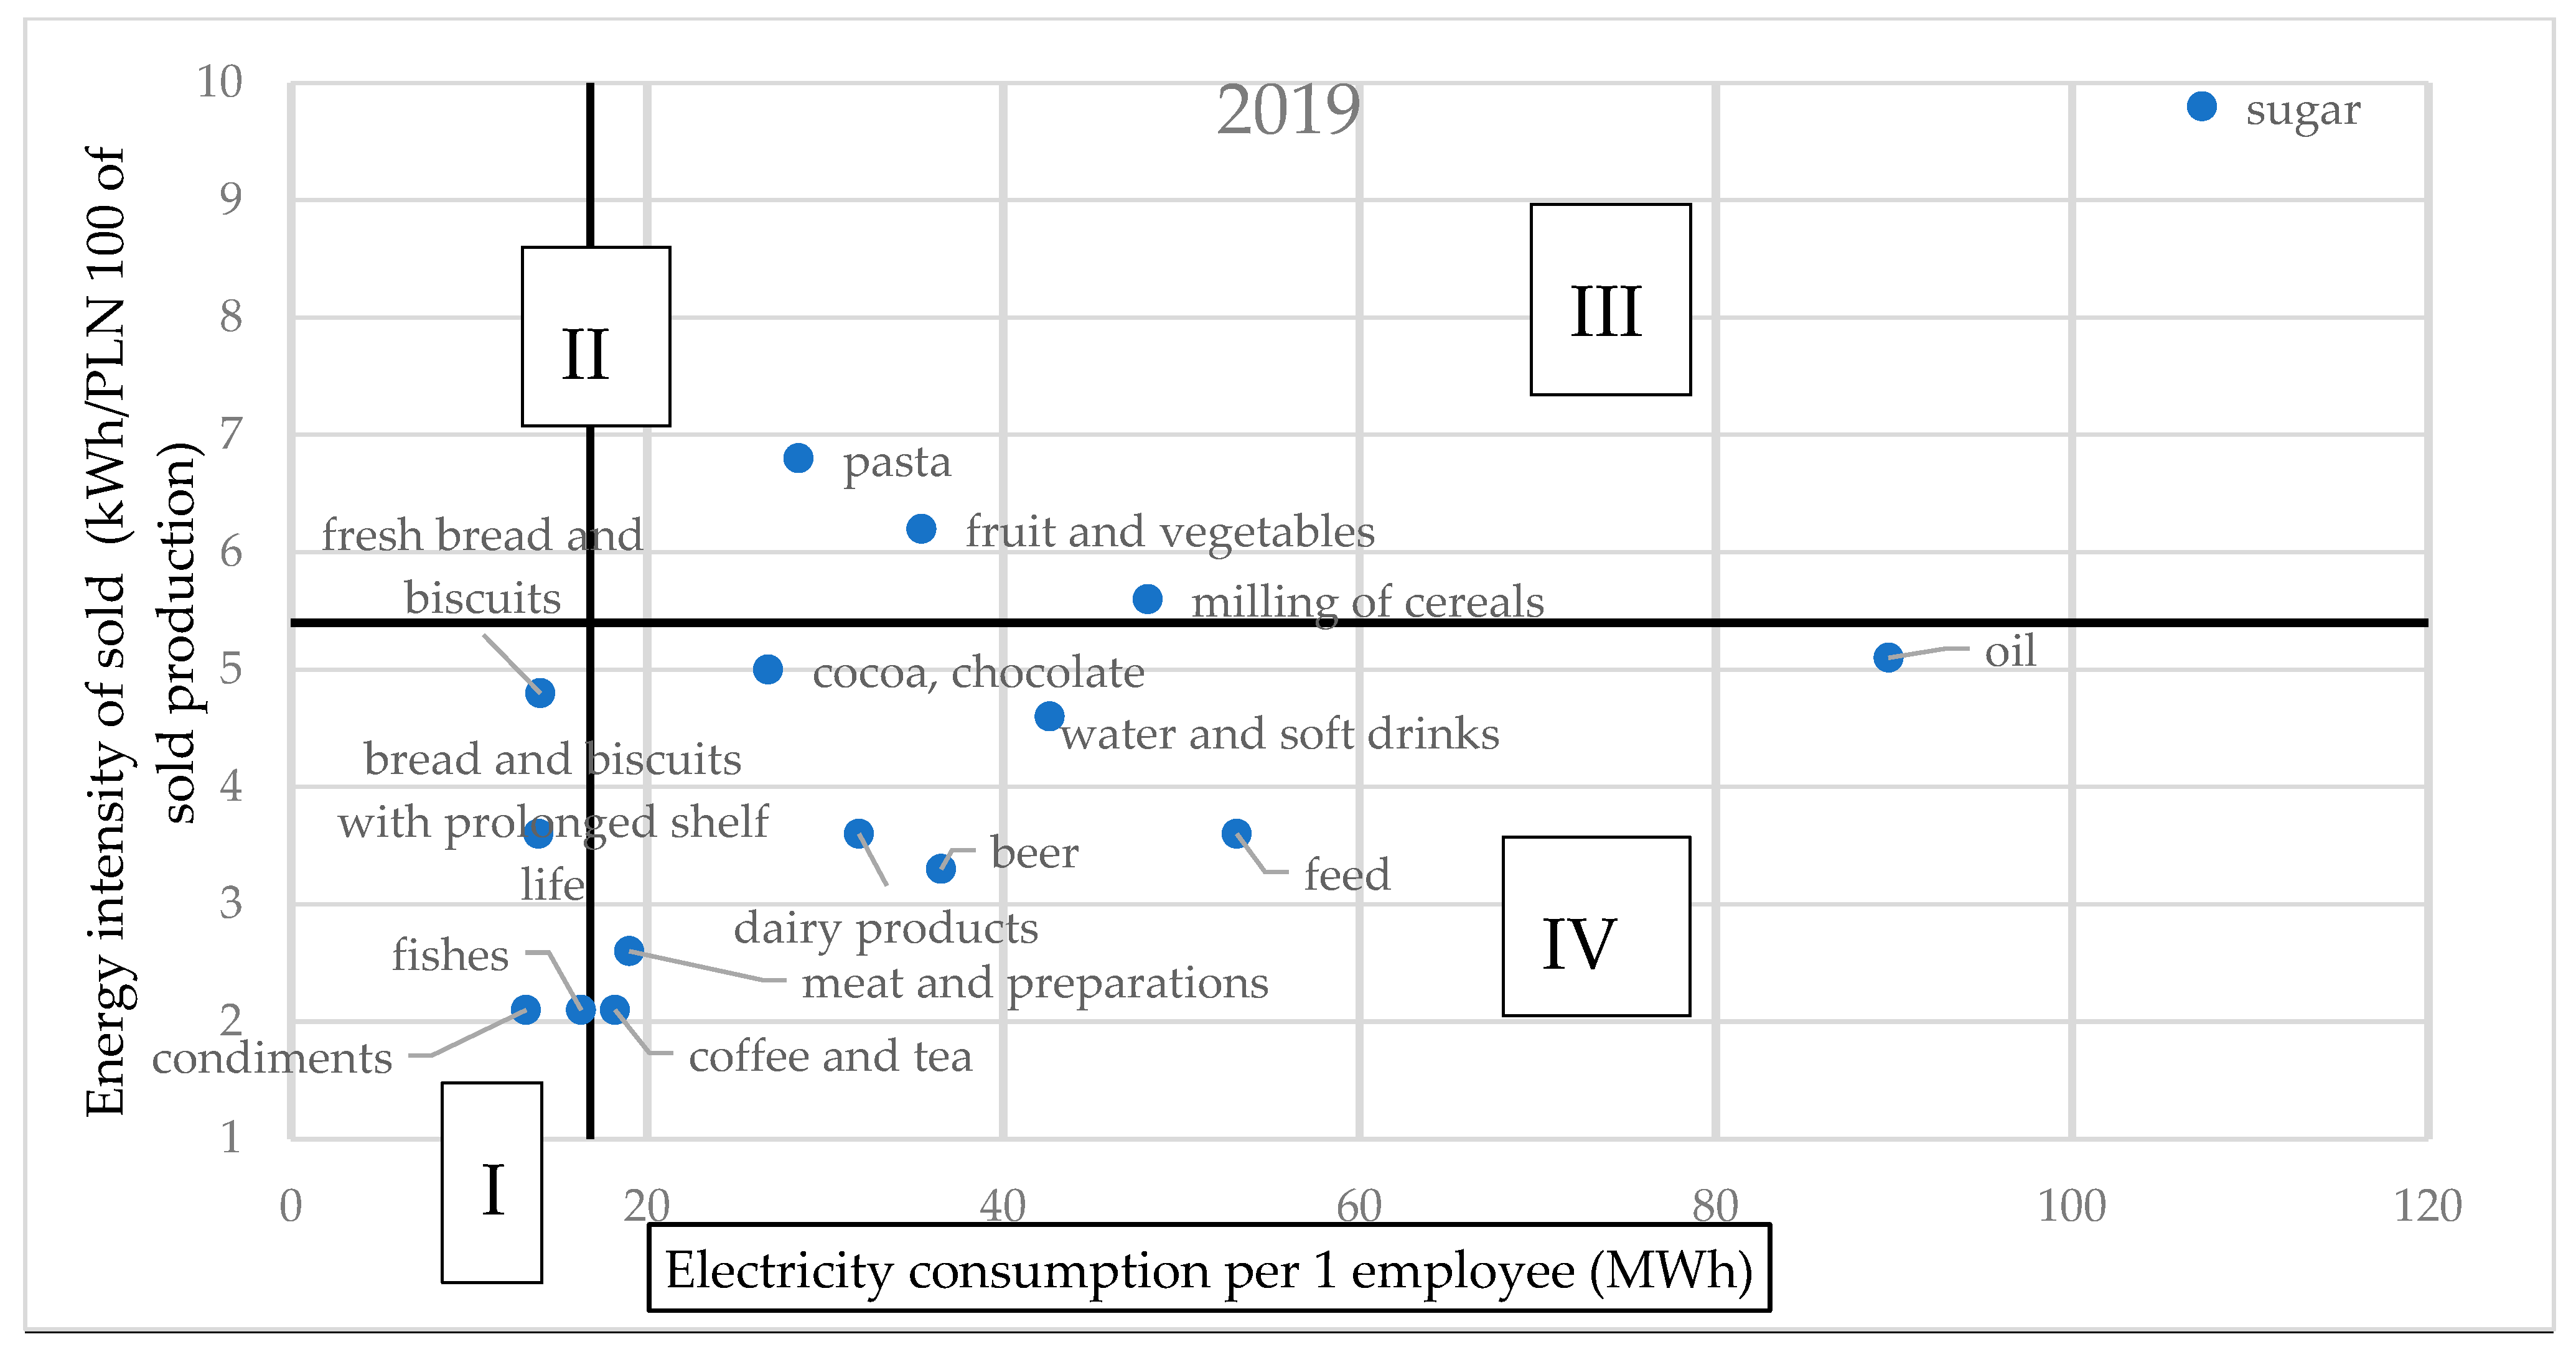
- I—low energy consumption of production and employment,
- II—high energy consumption of production and low energy consumption of employment,
- III—high energy intensity of production and employment,
- IV—low energy consumption of production and high energy consumption of employment.
4.3. The Share of Energy in Production Costs in Selected Branches of the Food Industry
5. Discussion
6. Conclusions
Author Contributions
Funding
Data Availability Statement
Conflicts of Interest
References
- FAO. The Future of Food and Agriculture—Trends and Challenges; Food and Agriculture Organization of the United Nations: Rome, Italy, 2017; Available online: http://www.fao.org/3/a-i6583e.pdf (accessed on 15 November 2020).
- Energy Information Administration (EIA). International Energy Outlook (2017). Available online: https://www.eia.gov/outlooks/archive/ieo17/pdf/exec_summ.pdf (accessed on 10 November 2020).
- FAO. Energy-Smart Food for People and Climate; Issue Paper; Food and Agriculture Organization of the United Nations: Rome, Italy, 2011; Available online: http://www.fao.org/docrep/014/i2454e/i2454e00.pdf (accessed on 16 December 2021).
- Sims, R.; Flammini, A.; Puri, M.; Bracco, S. Opportunities for Agri-Food Chains to Become Energy-Smart; FAO: Rome, Italy, 2015; Available online: http://www.fao.org/3/ai5125e.pdf (accessed on 15 November 2020).
- Food Drink Europe. A Time to Act—Climate Action and the Food and Drink Industry; Food Drink Europe: London, UK, 2015; Available online: http://www.fooddrinkeurope.eu/uploads/publications_documents/FoodDrink_Europe_Climate_Action_Brochure.pdf (accessed on 22 November 2010).
- Department for Business, Energy and Industrial Strategy. Digest of United Kingdom Energy Statistics (DUKES) July 2018; Department for Business, Energy and Industrial Strategy: London, UK, 2018. Available online: https://assets.publishing.service.gov.uk/government/uploads/system/uploads/attachment_data/file/736148/DUKES_2018.pdf (accessed on 15 December 2021).
- Department for Business, Energy and Industrial Strategy. Annual Prices of Fuels Purchased by Manufacturing Industry (p/kWh); Department for Business, Energy and Industrial Strategy: London, UK, 2018. Available online: https://assets.publishing.service.gov.uk/government/uploads/system/uploads/attachment_data/file/743784/table_314.xls (accessed on 15 May 2020).
- EEA. The European Environment—State and Outlook 2015: Synthesis Report; European Environment Agency: Copenhagen, Denmark, 2015; Available online: https://www.eea.europa.eu/soer/#pdf-choice-synthesis (accessed on 15 November 2020).
- Horton, J.; Palumbo, D.; Bowler, T. Russia Sanctions: Can the World Cope without Its Oil and Gas? BBC News. 26 January 2022. Available online: https://www.bbc.co.uk/news/58888451 (accessed on 2 May 2022).
- NIK. Efektywność Energetyczna Gospodarki; Najwyższa Izba Kontroli: Warsaw, Poland, 2019. Available online: https://www.nik.gov.pl/kontrole/P/18/021/ (accessed on 15 May 2020).
- Gembicki, J. Energy efficiency in the agricultural and food industry illustrated with the example of the feed production plant. E3S Web Conf. 2016, 10, 00138. [Google Scholar] [CrossRef]
- Laitner, J.A. An overview of the energy efficiency potential. Environ. Innov. Soc. Transit. 2013, 9, 38–42. [Google Scholar] [CrossRef]
- Dobes, V. New tool for promotion of energy management and cleaner production on no cure, no pay basis. J. Clean. Prod. 2013, 39, 255–264. [Google Scholar] [CrossRef]
- Pye, M.; McKane, A. Making a stronger case for industrial energy efficiency by quantifying non-energy benefits. Resour. Conserv. Recycl. 2000, 28, 171–183. [Google Scholar] [CrossRef]
- Bunse, K.; Vodicka, M.; Schoensleben, P.; Brülhart, M.; Ernst, F.O. Integrating energy efficiency performance in production management e gap analysis between industrial needs and scientific literature. J. Clean. Prod. 2011, 19, 667–679. [Google Scholar] [CrossRef]
- Semkov, K.; Mooney, E.; Connolly, M.; Adley, C. Efficiency improvement through waste heat reduction. Appl. Therm. Eng. 2014, 70, 716–722. [Google Scholar] [CrossRef]
- Energia Ze Źródeł Odnawialnych. Noty Tematyczne o Unii Europejskiej. Available online: https://www.europarl.europa.eu/factsheets/pl/sheet/70/energia-ze-zrodel-odnawialnych (accessed on 15 May 2020).
- Wszystko, Co Powinieneś Wiedzieć O Audycie Energetycznym W Firmie. Available online: https://energia.rp.pl/zielony-dom/art18969851-wszystko-co-powinienes-wiedziec-o-audycie-energetycznym-w-firmie (accessed on 20 November 2020).
- Zwiększanie Efektywności Energetycznej W Przemyśle. Available online: https://dalkiapolska.com/pl/zwiekszanie-efektywnosci-energetycznej-w-przemysle (accessed on 20 December 2021).
- Clairand, J.M.; Briceño-León, M.; Escrivá-Escrivá, G.; Pantaleo, A.M. Review of energy efficiency technologies in the food industry: Trends, barriers, and opportunities. IEEE Access 2020, 8, 48015–48029. [Google Scholar] [CrossRef]
- Degerli, B.; Nazir, S.; Sorgüven, E.; Hitzmann, B.; Özilgen, M. Assessment of the energy and exergy efficiencies of farm to fork grain cultivation and bread making processes in Turkey and Germany. Energy 2015, 93, 421–434. [Google Scholar] [CrossRef]
- Lin, B.; Xie, X. Factor substitution and rebound effect in China’s food industry. Energy Convers. Manag. 2015, 105, 20–29. [Google Scholar] [CrossRef]
- Özilgen, M. Energy utilization and carbon dioxide emission during production of snacks. J. Clean. Prod. 2016, 112, 2601–2612. [Google Scholar] [CrossRef]
- Wang, L. Energy efficiency technologies for sustainable food processing. Energy Effic. 2014, 7, 791–810. [Google Scholar] [CrossRef]
- GUS. Efektywność Wykorzystania Energii W Latach 2010–2020. Available online: https://stat.gov.pl/files/gfx/portalinformacyjny/pl/defaultaktualnosci/5485/9/5/1/efektywnosc_wykorzystania_energii_w_latach_2010-2020.pdf (accessed on 18 December 2022).
- Hendrickson, J. Energy Use in the U.S. Food System: A Summary of Existing Research and Analysis; Center for Integrated Agriculture Systems: Madison, WI, USA, 2008; Available online: https://www.cias.wisc.edu/wp-content/uploads/2008/07/energyuse.pdf (accessed on 18 December 2021).
- Carlsson-Kanyama, A.; Faist, M. Energy Use in the Food Sector: A Data Survey; Swedish Environmental Protection Agency: Stockholm, Sweden, 2000. Available online: http://citeseerx.ist.psu.edu/viewdoc/download?rep=rep1&type=pdf&doi=10.1.1.205.8375 (accessed on 18 December 2021).
- Foster, C.; Green, K.; Bleda, M.; Dewick, P.; Evans, B.; Flynn, A.; Mylan, J. Environmental Impacts of Food Production and Consumption: A Report to the Department for Environment Manchester; Food and Rural Affairs, Manchester Business School: Manchester, UK, 2006. Available online: http://randd.defra.gov.uk/Document.aspx?Document=EV02007_4601_FRP.pdf (accessed on 18 May 2021).
- Compton, M.; Willis, S.; Rezaie, B.; Humes, K. Food processing industry energy and water consumption in the Pacific northwest. Innov. Food Sci. Emerg. Technol. 2018, 47, 371–383. [Google Scholar] [CrossRef]
- Wojdalski, J.; Drożdż, B. Efektywność energetyczna zakładów przemysłu spożywczego. Zarys problematyki i podstawowe definicje. Inżynieria Przetwórstwa Spożywczego 2012, 3, 37–49. [Google Scholar]
- Leszczyńska, A.; Lee, K. Źródła i bariery efektywności energetycznej polskich przedsiębiorstw. Ann. Univ. Maria Curie-Skłodowska 2016, 3, 105–111. [Google Scholar]
- Dołęga, W. Efektywność energetyczna w aspekcie bezpieczeństwa dostaw energii i bezpieczeństwa ekologicznego. Rynek Energii 2014, 2, 24–28. [Google Scholar]
- Sardianou, E. Barriers to Industrial Energy Efficiency Investments in Greece. J. Clean. Prod. 2008, 16, 1416–1423. [Google Scholar] [CrossRef]
- Hertel, M.; Menra, K. Adoption of energy-efficient technologies in German SMEs of the horticultural sector—The moderating role of personal and social factors. Energy Effic. 2015, 9, 791–806. [Google Scholar] [CrossRef]
- Christoffersen, L.B.; Larsen, A.; Togeby, M. Empirical Analysis of Energy Management in Danish Industry. J. Clean. Prod. 2006, 14, 516–526. [Google Scholar] [CrossRef]
- Thollander, P.; Ottosson, M. An Energy Efficient Swedish Pulp and Paper Industry—Exploring Barriers to and Driving Forces for Cost-Effective Energy Efficiency Investments. Energy Effic. 2008, 1, 21–34. [Google Scholar] [CrossRef]
- Rohdin, P.; Thollander, P.; Solding, P. Barriers to and Drivers for Energy Efficiency in the Swedish Foundry Industry. Energy Policy 2007, 35, 672–677. [Google Scholar] [CrossRef]
- Stern, P.C.; Aronson, E. Energy Use: The Human Dimension; Stern, P.C., Aronson, E., Eds.; W.H. Freeman: New York, NY, USA, 1984. [Google Scholar]
- Stern, P.C. What Psychology Knows about Energy Conservation. Am. Psychol. 1992, 47, 1224–1232. [Google Scholar] [CrossRef]
- O’Driscoll, E.; Cusack, D.O.; O’Donnell, G.E. The development of energy performance indicators within a complex manufacturing facility. Int. J. Adv. Manuf. Technol. 2013, 68, 2205–2214. [Google Scholar] [CrossRef]
- Jeon, H.W.; Taisch, M.; Prabhu, V.V. Modelling and analysis of energy footprint of manufacturing systems. Int. J. Prod. Res. 2014, 53, 7049–7059. [Google Scholar] [CrossRef]
- Efektywność Energetyczna. Available online: https://pgeenergiaciepla.pl/strefa-klienta/efektywnosc-energetyczna (accessed on 10 September 2022).
- Wojdalski, J.; Grochowicz, J.; Drózdz, B.; Bartoszewska, K.; Zdanowska, P.; Kupczyk, A.; Ekielski, A.; Florczak, I.; Hasny, A.; Wójcik, G. Energy efficiency of a confectionery plant—Casestudy. J. Food Eng. 2015, 146, 182–191. [Google Scholar] [CrossRef]
- Martínez, C.I.P. Analysis of energy efficiency development in the German and Colombian foodindustries. Int. J. Energy Sect. Manag. 2010, 4, 113–136. [Google Scholar] [CrossRef]
- May, G.; Taisch, M.; Prabhu, V.; Barletta, I. Energy related key performance indicators—State-of-the-art, gaps and industrial needs. Advances in production management systems. Sustainable production and service supply chains. Adv. Inf. Commun. Technol. 2013, 414, 257–267. [Google Scholar]
- Eichhammer, W.; Mannsbart, W. Industrial Energy Efficiency—Indicators for a European cross-country comparison of energy efficiency in the manufacturing industry. Energy Policy 1997, 25, 759–772. [Google Scholar] [CrossRef]
- Reindl, D.T.; Jekel, T.B.; Elleson, J.S. Industrial Refrigeration Energy Efficiency Guidebook; The University Wisconsin IRC, Industrial Refrigeration Consortium: Madison, WI, USA, 2005. [Google Scholar]
- Fysikopoulos, A.; Pastras, G.; Alexopoulos, T.; Chryssolouris, G. On a generalized approach to manufacturing energy efficiency. Int. J. Adv. Manuf. Technol. 2014, 73, 1437–1452. [Google Scholar] [CrossRef]
- Tristo, G.; Bissacco, G.; Lebar, A.; Valentinčič, J. Real time power consumption monitoring for energy efficiency analysis in micro EDM milling. Int. J. Adv. Manuf. Technol. 2015, 78, 1511–1521. [Google Scholar] [CrossRef]
- Sivill, L.; Manninen, J.; Hippinen, I.; Ahtila, P. Success factors of energy management in energy-intensive industries: Development priority of energy performance measurement. Energy Res. 2013, 37, 936–951. [Google Scholar] [CrossRef]
- Aguirre, F.; Villalobos, J.R.; Phelan, P.E.; Pacheco, R. Assessing the relative efficiency of energy use among similar manufacturing industries. Int. J. Energy Res. 2011, 35, 477–488. [Google Scholar] [CrossRef]
- Mukherjee, K. Energy use efficiency in the Indian manufacturing sector: An interstate analysis. Energy Policy 2008, 36, 662–672. [Google Scholar] [CrossRef]
- Hu, J.L.; Lio, M.C.; Kao, C.H.; Lin, Y.L. Total-factor Energy Efficiency for Regions in Taiwan. Energy Sources Part B Econ. Plan. Policy 2012, 7, 292–300. [Google Scholar] [CrossRef]
- Wang, Z.-H.; Zeng, H.-L.; Wei, Y.-M.; Zhang, Y.-X. Regional total factor energy efficiency: An empirical analysis of industrial sector in China. Appl. Energy 2012, 97, 115–123. [Google Scholar] [CrossRef]
- Özkara, Y.; Atak, M. Regional total-factor energy efficiency and electricity saving potential of manufacturing industry in Turkey. Energy 2015, 93, 495–510. [Google Scholar] [CrossRef]
- Honma, S.; Hu, J.L. Total-factor energy efficiency for sectors in Japan. Energy Sources Part B Econ. Plan. Policy 2013, 8, 130–136. [Google Scholar] [CrossRef]
- Martínez, C.P. Energy efficiency development in German and Colombian non-energy-intensive sectors: A non-parametric analysis. Energy Effic. 2011, 4, 115–131. [Google Scholar] [CrossRef]
- Pradella, A.M.; Rocha de, L.E.F.; Gouvea da, C.S.E.; Pinheiro de, L.E. Energy efficiency in the food industry: A systematic literature review. Braz. Arch. Biol. Technol. 2019, 62, 1–15. [Google Scholar] [CrossRef]
- Marszałek, M. Normatywne uwarunkowania procesu wdrażania transformacji energetycznej w Polsce na podstawie polityk energetycznych UE i Polski oraz wobec zagrożeń i wyzwań unijnego wewnętrznego rynku. Polityka Społeczeństwo 2018, 16, 64–76. [Google Scholar] [CrossRef]
- European Council (8/9 March 2007) Presidency Conclusions 7224/1/07 REV 1 (2 May 2007). Available online: https://www.consilium.europa.eu/uedocs/cms_data/docs/pressdata/en/ec/93135.pdf (accessed on 20 December 2022).
- European Council (23 and 24 October 2014)—Conclusions. Available online: https://data.consilium.europa.eu/doc/document/ST-169-2014-INIT/en/pdf (accessed on 20 October 2022).
- Communication from the Commission to the European Parliament, The Council, the European Economic and Social Committee and the Committee of the Regions United in delivering the Energy Union and Climate Action—Setting the Foundations for a Successful Clean Energy Transition COM/2019/285. Available online: https://eur-lex.europa.eu/legal-content/EN/TXT/?uri=CELEX%3A52019DC0285 (accessed on 20 November 2022).
- European Commission. Proposal for a Directive of the European Parliament and of the Council on Energy Efficiency. COM/2021/558. 2021. Available online: https://eur-lex.europa.eu/resource.html?uri=cellar:a214c850-e574-11eb-a1a5-01aa75ed71a1.0001.02/DOC_1&format=PDF (accessed on 15 September 2021).
- Ministerstwo Gospodarki. Polityka Energetyczna Polski do 2030 Roku. Załącznik do Uchwały nr 202/2009 Rady Ministrów z Dnia 10 Listopada 2009 r. Available online: https://www.pigeor.pl/media/js/kcfinder/upload/files/Polityka-energetyczna-Polski-do-2030r.pdf (accessed on 15 September 2021).
- Ministerstwo Klimatu i Środowiska. Polityka Energetyczna Polski do 2040 Roku. Załącznik do Uchwały nr 22/2021 Rady Ministrów z Dnia 2 Lutego 2021 r. Available online: File:///C:/Users/Ela/Downloads/PEP2040_2021-02-02.pdf (accessed on 15 September 2021).
- Ministerstwo Klimatu i Środowiska. Krajowy Plan Na Rzecz Energii i Klimatu Na Lata 2021–2030. Available online: https://www.gov.pl/web/klimat/krajowy-plan-na-rzecz-energii-i-klimatu (accessed on 15 September 2022).
- Długoterminowa Strategia Renowacji Budynków. Załącznik do Uchwały nr 23/2022 Rady Ministrów z Dnia 9 Lutego 2022 r. Available online: https://www.gov.pl/web/rozwoj-technologia/Dlugoterminowa-strategia-renowacji-budynkow (accessed on 15 December 2022).
- The National Energy and Climate Plan for 2021–2030 Objectives and Targets, and Policies and Measures. Available online: https://energy.ec.europa.eu/system/files/2020-08/pl_final_necp_part_1_3_en_0.pdf (accessed on 25 December 2022).
- Polska Net-Zero 2050: Podręcznik Transformacji Energetycznej dla Samorządów. Available online: http://climatecake.ios.edu.pl/wp-content/uploads/2022/01/Polska-net-zero.-Podrecznik-transformacji-energetycznej-dla-samorzadow..pdf (accessed on 15 September 2020).
- Ustawa z Dnia 20 Maja 2016 r. o Efektywności Energetycznej. Dz.U. 2016 poz. 831. Available online: https://isap.sejm.gov.pl/isap.nsf/download.xsp/WDU20160000831/T/D20160831L.pdf (accessed on 15 December 2022).
- Biogaz w Polsce—Raport 2022. Available online: www.magazynbiomasa.pl (accessed on 10 September 2022).
- CIRE.PL Centrum Informacji o Rynku Energii. Transformacja Energetyczna, a Produkcja Żywności. Available online: https://www.cire.pl/artykuly/materialy-problemowe/transformacja-energetyczna-a-produkcja-zywnosci (accessed on 10 September 2022).
- Featherstone, S. Canning with Pulses and Pasta. In A Complete Course in Canning and Related Processes; Elsevier: Amsterdam, The Netherlands, 2016; pp. 169–197. [Google Scholar]
- Woolley, E.; Luo, Y.; Simeone, A. Industrial Waste Heat Recovery: A Systematic Approach. Sustain. Energy Technol. Assess. 2018, 29, 50–59. [Google Scholar] [CrossRef]
- Luo, Y.; Jagtap, S.; Trollman, H.; Garcia-Garcia, G. A Framework for Recovering Waste Heat Energy from Food Processing Effluent. Water 2023, 15, 12. [Google Scholar] [CrossRef]
- Gierszewska, G.; Romanowska, M. Analiza Strategiczna Przedsiębiorstw; PWE: Warsaw, Poland, 2003. [Google Scholar]
- GUS. Roczniki Statystyczne Przemysłu; GUS: Warsaw, Poland, 2006. [Google Scholar]
- GUS. Roczniki Statystyczne Przemysłu; GUS: Warsaw, Poland, 2021. [Google Scholar]
- GUS. Roczniki Statystyczne Przemysłu; GUS: Warsaw, Poland, 2005. [Google Scholar]
- GUS. Rocznik Statystyczny Przemysłu; GUS: Warsaw, Poland, 2020. [Google Scholar]
- Szajner, P.; Szczepaniak, I. Challenges of energy management in the food industry in Poland in the context of the objectives of the European Green Deal and the „Farm to Fork” strategy. Energies 2022, 15, 9090. [Google Scholar]
- GUS. Rocznik Statystyczny Przemysłu; GUS: Warsaw, Poland, 2010. [Google Scholar]
- GUS. Rocznik Statystyczny Przemysłu; GUS: Warsaw, Poland, 2015. [Google Scholar]
- Su, C.-W.; Yuan, X.; Tao, R.; Umar, M. Can new energy vehicles help to achieve carbon neutrality targets? J. Environ. Manag. 2021, 297, 113348. [Google Scholar] [CrossRef]
- Su, C.-W.; Yuan, X.; Umar, M.; Chang, T. Dynamic price linkage of energies in transformation: Evidence from quantile connectedness. Resour. Policy 2022, 78, 102886. [Google Scholar] [CrossRef]
- Jagtap, S.; Rahimifard, S.; Duong, L.N.K. Real-time data collection to improve energy efficiency: A case study of food manufacturer. J. Food Process. Preserv. 2022, 46, e14338. [Google Scholar] [CrossRef] [Green Version]
- Malagié, M.; Jensen, G.; Graham, J.C.; Smith, D.L. Encyclopaedia of Occupational Health and Safety; [CD-ROM]; International Labour Organization: Geneva, Switzerland, 1998; Available online: http://www.ilocis.org/documents/chpt67e.htm (accessed on 18 May 2021).
- Seck, G.S.; Guerassimoff, G.; Maizi, N. Heat recovery with heat pumps in non-energy intensive industry: A detailed bottom-up model analysis in the French food & drink industry. Appl. Energy 2013, 111, 489–504. [Google Scholar]
- Leduc, G.; Kamiński, J. Energy efficiency improvement options for the EU food industry. Energy Policy J. 2010, 13, 81–96. [Google Scholar]
- Charun, H. Podstawy Gospodarki Energetycznej. Cz. 1. Wybrane Zagadnienia Dydaktyczne; Wydawnictwo Uczelniane Politechniki Koszalińskiej: Koszalin, Poland, 2011. [Google Scholar]
- Szalbierz, Z.; Kott, M.; Kott, J. Wskaźniki energochłonności w przemyśle. Zarządzanie Finans. 2012, 1, 585–593. [Google Scholar]
- Pagan, R.; Renouf, M.; Prasad, P. Eco-Efficiency Manual for Meat Processing; Meat and Livestock Australia, Ltd.: Sydney, Australia, 2002. [Google Scholar]
- Pelletier, N. Environmental performance in the US broiler poultry sector: Life cycle energy use and greenhouse gas, ozone depleting, acidifying and eutrophying emissions. Agric. Syst. 2008, 98, 67–73. [Google Scholar] [CrossRef]
- Salminen, E.; Rintala, J. Anaerobic digestion of organic solid poultry slaughterhouse waste—A review. Bioresour. Technol. 2002, 83, 13–26. [Google Scholar] [CrossRef]
- Truchliński, J.; Podgórski, W.; Koper, R.; Lebiedowicz, W. Bioenergetyczne aspekty produkcji brojlerów kurzych. MOTROL—Motoryz. Energetyka Rol. 2001, 4, 333–340. [Google Scholar]
- Firmy z Branży Spożywczej Przyspieszą Transformację Energetyczną. Available online: https://biznes.newseria.pl/biuro-prasowe/przemysl_spozywczy/firmy-z-branzy,b792052749 (accessed on 10 December 2021).
- Chiaroni, D.; Chiesa, M.; Chiesa, V.; Franzo, S.; Frattini, F.; Toletti, G. Introducing a new pespective for the economic evaluation of industrial energy efficiency technologies: An empirical analysis in Italy. Sustain. Energy Technol. Assess. 2016, 15, 1–10. [Google Scholar] [CrossRef]
- Backlund, S.; Thollander, P.; Palm, J.; Ottosson, M. Extending the energy efficiency gap. Energy Policy 2012, 51, 392–396. [Google Scholar] [CrossRef]
- Tanaka, K. Review of policies and measures for energy efficiency in industry sector. Energy Policy 2011, 39, 6532–6550. [Google Scholar] [CrossRef]
- Transformacja Energetyczna—Zysk Czy Koszt Dla Przemysłu Spożywczego? Available online: https://www.portalspozywczy.pl/technologie/artykuly/transformacja-energetyczna-zysk-czy-koszt-dla-przemyslu-spozywczego,215489.html (accessed on 20 December 2022).


| Specification | 2004 | 2010 | 2019 | |||
|---|---|---|---|---|---|---|
| in TJ | hare (%) | in TJ | share (%) | in TJ | share (%) | |
| Industrial processing | 940,154 | 100.0 | 897,955 | 100.0 | 1,023,241 | 100.0 |
| including production: | ||||||
| 91,327 | 9.7 | 71,478 | 8.0 | 88,839 | 8.7 |
| 9048 | 1.0 | 9676 | 0.9 | ||
| 1043 | 0.1 | 1418 | 0.2 | 1692 | 0.2 |
| 10,207 | 1.1 | 3757 | 0.4 | 3857 | 0.4 |
| 1889 | 0.2 | 1683 | 0.2 | 1036 | 0.1 |
| 1218 | 0.1 | 790 | 0.1 | 613 | 0.1 |
| 30,645 | 3.3 | 33,098 | 3.7 | 48,490 | 4.7 |
| 50,491 | 5.4 | 52,040 | 5.8 | 82,422 | 8.1 |
| 190,757 | 20.3 | 244,024 | 27.2 | 252,083 | 24.6 |
| 199,637 | 21.2 | 179,635 | 20.0 | 195,911 | 19.1 |
| . | . | 3184 | 0.4 | 2886 | 0.3 |
| 14,843 | 1.6 | 16,871 | 1.9 | 26,534 | 2.6 |
| 161,644 | 17.2 | 97,900 | 10.9 | 96,525 | 9.4 |
| 12,512 | 1.3 | 13,565 | 1.5 | 16,524 | 1.6 |
| 3819 | 0.4 | 2361 | 0.3 | 1720 | 0.2 |
| 9905 | 1.1 | 6757 | 0.8 | 7480 | 0.7 |
| 14,601 | 1.6 | 9918 | 1.1 | 8466 | 0.8 |
| 9411 | 1.0 | 12,573 | 1.4 | 15,445 | 1.5 |
| 9753 | 1.0 | 6086 | 0.7 | 10,723 | 1.0 |
| 126,452 | 13.5 | 131,769 | 14.7 | 152,319 | 14.9 |
| Specification | Hard Coal | High-Methane Natural Gas | Nitrogenated Natural Gas | Coke and Semi-Coke | Electrical Energy | |||||
|---|---|---|---|---|---|---|---|---|---|---|
| Total | Including Direct | Total | Including Direct | Total | Including Direct | Total | Including Direct | Total | Including Direct | |
| in thousand tons | in hm3 | in hm3 | in thousand tons | in GWh | ||||||
| Total | 72,822 | 7369 | 7203 | 5306 | 2567 | 552 | 4463 | 1393 | 74,130 | 71,863 |
| including: | ||||||||||
| Industrial processing | 21,218 | 6337 | 5716 | 5069 | 379 | 376 | 4434 | 1384 | 42,606 | 42,606 |
| including production: | ||||||||||
| 1699 | 1554 | 407 | 404 | 54 | 53 | 43 | 43 | 4248 | 4248 |
| 1 | 1 | 4 | 4 | 2 | 2 | - | - | 84 | 84 |
| 11 | 10 | 11 | 11 | 3 | 2 | 1 | 1 | 147 | 147 |
| 278 | 268 | 75 | 75 | 9 | 9 | 0 | 0 | 1609 | 1609 |
| 738 | 594 | 36 | 36 | 26 | 26 | 0 | 0 | 2938 | 2938 |
| 11,293 | 148 | 655 | 44 | 0 | 0 | 62 | 2 | 2693 | 2693 |
| 1758 | 1237 | 2444 | 2441 | 6 | 6 | 132 | 132 | 7446 | 7446 |
| 200 | 107 | 63 | 59 | 6 | 6 | 1 | 1 | 1591 | 1591 |
| 3199 | 500 | 638 | 628 | 131 | 130 | 4000 | 1010 | 10,952 | 10,952 |
| - | - | 0 | 0 | - | - | - | - | 2 | 2 |
| 18 | 16 | 55 | 54 | 4 | 4 | 1 | 1 | 761 | 761 |
| 36 | 20 | 64 | 61 | 5 | 5 | 2 | 2 | 1121 | 1121 |
| 86 | 67 | 9 | 9 | 0 | 0 | 0 | 0 | 699 | 699 |
| Specification | Hard Coal | High-Methane Natural Gas | Nitrogenated Natural Gas | Coke and Semi-Coke | Electrical Energy | |||||
|---|---|---|---|---|---|---|---|---|---|---|
| Total | Including Direct | Total | Including Direct | Total | Including Direct | Total | Including Direct | Total | Including Direct | |
| in thousand tons | in hm3 | in hm3 | in thousand ions | in GWh | ||||||
| Total | 58,250 | 4862 | 11,061 | 7666 | 3365 | 877 | 2650 | 457 | 86,173 | 85,140 |
| including | ||||||||||
| Industrial processing | 18,275 | 4690 | 9268 | 7393 | 492 | 459 | 2 643 | 450 | 56,196 | 56,196 |
| including production: | ||||||||||
| 1027 | 938 | 844 | 830 | 51 | 50 | 26 | 26 | 6632 | 6632 |
| 59 | 59 | 91 | 86 | 2 | 2 | 0 | 0 | 659 | 659 |
| 2 | 2 | 14 | 14 | 5 | 5 | - | - | 248 | 248 |
| 2 | 2 | 11 | 11 | 0 | 0 | - | - | 95 | 95 |
| 64 | 60 | 35 | 35 | 19 | 19 | - | - | 2594 | 2594 |
| 576 | 335 | 216 | 205 | 125 | 94 | - | - | 4711 | 4711 |
| 11,246 | 29 | 3004 | 1174 | - | - | 76 | - | 3823 | 3823 |
| 27,744 | 2067 | 2462 | 2455 | 96 | 96 | 81 | 81 | 7825 | 7825 |
| 163 | 75 | 149 | 148 | 4 | 4 | - | - | 4157 | 4157 |
| 1458 | 195 | 707 | 702 | 121 | 121 | 2385 | 269 | 8768 | 8768 |
| 1 | 1 | 10 | 10 | 0 | 0 | - | 311 | 311 | |
| 22 | 19 | 44 | 44 | 5 | 5 | 2 | 2 | 1225 | 1225 |
| 17 | 16 | 92 | 92 | 9 | 9 | - | - | 2600 | 2600 |
| 4 | 3 | 15 | 15 | 1 | 1 | - | - | 1110 | 1110 |
| Fuels and Electricity | Rank in 2004 | Fuels and Electricity | Rank in 2019 |
|---|---|---|---|
| hard coal | 1 | hard coal | 2 |
| high-methane natural gas | 3 | high-methane natural gas | 3 |
| nitrogen-rich natural gas | 2 | nitrogen-rich natural gas | 4 |
| coke and semi-coke | 3 | coke and semi-coke | 4 |
| electricity | 3 | electricity | 3 |
| Specification | 2004 | 2019 | Change (%) 2019 2004 | 2004 | 2019 | 2004 | 2019 | Change (%) 2019 2004 |
|---|---|---|---|---|---|---|---|---|
| Value of Sold Production (PLN million) | Energy Intensity of Sold Production (kWh/PLN 100 of sold production) | Total Energy Intensity of Marketed Production (MWh) | ||||||
| Food and beverage production, including: | 87,481.7 | 217,635.4 | 148.8 | 5.4 | 3.7 | 4,724,011.8 | 8,052,509.8 | 70.5 |
| food | 76,044.8 | 197,428.5 | 159.6 | 5.6 | 3.7 | 4,258,508.8 | 7,354,975.2 | 71.5 |
| drinks | 11,436.9 | 20,206.9 | 76.7 | 4.2 | 3.4 | 480,349.8 | 697,534.6 | 43.0 |
| Selected activities, including: | ||||||||
| production, processing, and preservation of meat and meat products | 20,870.0 | 66,681.1 | 219.5 | 4.7 | 2.6 | 980,890.0 | 1,733,708.6 | 76.7 |
| fish processing and preservation | 2342.7 | 12,027.2 | 413.4 | 3.4 | 2.1 | 79,651.8 | 252,571.2 | 217.1 |
| processing of fruit and vegetables, including: | 8635.3 | 16,434,3 | 90.3 | 9.0 | 6.2 | 777,177.0 | 1,018,926.6 | 31.1 |
| 1322.5 | 2714.0 | 105.2 | 7.5 | 5.3 | 99,187.5 | 143,842.0 | 45.0 |
| 2284.0 | 5096.1 | 123.1 | 4.8 | 4.3 | 109,632.0 | 219,132.3 | 99.9 |
| 5028.8 | 8624.2 | 71.5 | 11.4 | 7.6 | 573,283.2 | 655,439.2 | 14.3 |
| production of oils and fats of vegetable and animal origin | 2302.6 | 3744.9 | 62.6 | 4.3 | 5.1 | 99,011.8 | 190,989.9 | 92.9 |
| manufacture of dairy products, including: | 14,871.0 | 31,910.3 | 114.6 | 4.8 | 3.6 | 713,808.0 | 1,148,770.8 | 60.9 |
| 14,377.7 | 30,094.0 | 109.3 | 4.5 | 3.3 | 646,996.5 | 993,102.0 | 53.5 |
| 493.3 | 1816.3 | 268.2 | 12.7 | 8.3 | 62,649.1 | 150,752.9 | 140.6 |
| manufacture of cereal milling products, starch, and starch products | 2675.8 | 6060.4 | 126.5 | 9.4 | 5.6 | 251,525.2 | 339,382.4 | 34.9 |
| production of ready-made animal feed | 6248.8 | 14,317.1 | 129.1 | 4.0 | 3.6 | 249,952.0 | 515,415.6 | 106.2 |
| production of bread and fresh pastry products | 2339.5 | 10,664.4 | 355.8 | 5.9 | 4.8 | 138,030.5 | 511,891.2 | 270.9 |
| production of bread and pastry products with prolonged durability | 1329.7 | 2547.3 | 91.6 | 4.3 | 3.6 | 57,177.1 | 91,702.8 | 60.4 |
| sugar production | 4232.4 | 4027.5 | −4.8 | 11.7 | 9.8 | 495,190.8 | 394,695.0 | −20.3 |
| production of cocoa, chocolate, and confectionery | 4833.2 | 10,966.1 | 126.9 | 3.9 | 5.0 | 188,494.8 | 548,305.0 | 190.9 |
| pasta production | 429.4 | 850.7 | 198.1 | 7.3 | 6.8 | 31,346.2 | 57,847.6 | 84.5 |
| coffee and tea processing | 1405.7 | 3292.7 | 134.2 | 2.5 | 2.1 | 35,142.5 | 69,146.7 | 96.8 |
| production of spices | 786.1 | 5546.2 | 605.5 | 2.6 | 2.1 | 20,438.6 | 116,470.2 | 469.9 |
| production of beverages, including: | ||||||||
| 1480.4 | 3 710.4 | 150.6 | 1.8 | 1.6 | 26,647.2 | 59,366.4 | 122.8 |
| 240.5 | . | 4.3 | . | 10,341.5 | . | . | |
| 5778.1 | 7898.0 | 36.7 | 4.2 | 3.3 | 242,680.2 | 260,634.0 | 7.4 |
| 3036.1 | 7731.4 | 154.6 | 5.8 | 4.6 | 176,093.8 | 355,644.4 | 102.0 |
| Specification | 2004 | 2019 | Change (%) 2019 2004 | 2004 | 2019 | 2004 | 2019 | Change (%) 2019 2004 |
|---|---|---|---|---|---|---|---|---|
| Average Paid Employment (tys.) | Electricity Consumption per Employee (MWh) | Total Energy Consumption (MWh) | ||||||
| Food and beverage production, including: | 289.2 | 321.9 | 11.3 | 16.8 | 26.6 | 4,858,560.0 | 8,562,540.0 | 76.2 |
| food | 262.9 | 302.6 | 15.1 | 16.6 | 26.2 | 4,356,230.0 | 7,917,920.0 | 81.8 |
| drinks | 26.3 | 19.3 | −26.6 | 19.1 | 33.4 | 502,330.0 | 644,620.0 | 28.3 |
| Selected activities, including: | ||||||||
| production, processing, and preservation of meat and meat products | 86.4 | 95.3 | 10.3 | 11.7 | 19.0 | 1,010,880.0 | 1,810,700.0 | 79.1 |
| fish processing and preservation | 9.5 | 15.9 | 67.4 | 7.9 | 16.3 | 75,050.0 | 259,170.0 | 245.3 |
| processing of fruit and vegetables, including: | 33.4 | 28.7 | −14.1 | 22.6 | 35.4 | 754,840.0 | 1,015,980.0 | 34.6 |
| 4.9 | 3.7 | −24.5 | 20.5 | 38.0 | 100,450.0 | 140,600.0 | 40.0 |
| 5.3 | 6.5 | 22.6 | 19.2 | 34.7 | 101,760.0 | 225,550.0 | 121.6 |
| 23.2 | 18.5 | −20.3 | 24.0 | 35.2 | 556,800.0 | 651,200.0 | 17.0 |
| production of oils and fats of vegetable and animal origin | 2.6 | 2.2 | −15.4 | 38.0 | 89.7 | 98,800.0 | 197,340.0 | 99.7 |
| manufacture of dairy products, including: | 42.1 | 36.1 | −14.3 | 17.1 | 31.9 | 719,910.0 | 1,151,590.0 | 60.0 |
| 38.8 | 31.6 | −18.6 | 16.9 | 31.8 | 655,720.0 | 1,004,880.0 | 53.2 |
| 3.3 | 4.5 | 36.4 | 19.6 | 32.9 | 64,680.0 | 148,050.0 | 128.9 |
| manufacture of cereal milling products, starch, and starch products | 6.5 | 8.3 | 27.7 | 40.5 | 48.1 | 263,250.0 | 399,230.0 | 51.7 |
| production of ready-made animal feed | 6.5 | 9.6 | 47.7 | 41.0 | 53.1 | 266,500.0 | 509,760.0 | 91.3 |
| production of bread and fresh pastry products | 23.1 | 44.7 | 93.5 | 6.4 | 14.0 | 147,840.0 | 625,800.0 | 323.3 |
| production of bread and pastry products with extended shelf life | 7.3 | 7.0 | −4.1 | 8.2 | 13.9 | 59,860.0 | 97,300.0 | 62.5 |
| sugar production | 11.9 | 3.7 | −68.9 | 39.4 | 107.3 | 468,860.0 | 397,010.0 | −15.3 |
| production of cocoa, chocolate and confectionery | 16.6 | 20.7 | 24.7 | 9.9 | 26.8 | 164,340.0 | 554,760.0 | 237.6 |
| pasta production | 2.7 | 2.1 | −22.2 | 11.1 | 28.5 | 29,970.0 | 59,850.0 | 99.7 |
| coffee and tea processing | 3.2 | 4.0 | 25.0 | 11.7 | 18.2 | 37,440.0 | 72,800.0 | 94.4 |
| production of spices | 2.9 | 9.0 | 210.3 | 5.8 | 13.2 | 16,820.0 | 118,800.0 | 606.3 |
| production of beverages, including: | ||||||||
| 3.7 | 3.9 | 5.4 | 7.0 | 14.8 | 25,900.0 | 57,720.0 | 22.9 |
| 1.0 | . | . | 10.5 | . | 10,500.0 | . | . |
| 8.7 | 7.3 | −16.1 | 28.0 | 36.5 | 243,600.0 | 266,450.0 | 9.4 |
| 11.2 | 7.1 | −36.6 | 16.9 | 42.6 | 189,280.0 | 302,460.0 | 59.8 |
Disclaimer/Publisher’s Note: The statements, opinions and data contained in all publications are solely those of the individual author(s) and contributor(s) and not of MDPI and/or the editor(s). MDPI and/or the editor(s) disclaim responsibility for any injury to people or property resulting from any ideas, methods, instructions or products referred to in the content. |
© 2023 by the authors. Licensee MDPI, Basel, Switzerland. This article is an open access article distributed under the terms and conditions of the Creative Commons Attribution (CC BY) license (https://creativecommons.org/licenses/by/4.0/).
Share and Cite
Szymańska, E.J.; Mroczek, R. Energy Intensity of Food Industry Production in Poland in the Process of Energy Transformation. Energies 2023, 16, 1843. https://doi.org/10.3390/en16041843
Szymańska EJ, Mroczek R. Energy Intensity of Food Industry Production in Poland in the Process of Energy Transformation. Energies. 2023; 16(4):1843. https://doi.org/10.3390/en16041843
Chicago/Turabian StyleSzymańska, Elżbieta Jadwiga, and Robert Mroczek. 2023. "Energy Intensity of Food Industry Production in Poland in the Process of Energy Transformation" Energies 16, no. 4: 1843. https://doi.org/10.3390/en16041843
APA StyleSzymańska, E. J., & Mroczek, R. (2023). Energy Intensity of Food Industry Production in Poland in the Process of Energy Transformation. Energies, 16(4), 1843. https://doi.org/10.3390/en16041843