Article

Research on Aerodynamic Design of an End Wall Based on a Quasi-3D Optimization Method

School of Energy Science and Engineering, Harbin Institute of Technology, Harbin 150001, China
*
Author to whom correspondence should be addressed.
Energies 2023, 16(4), 1859; https://doi.org/10.3390/en16041859
Submission received: 9 January 2023 / Revised: 9 February 2023 / Accepted: 9 February 2023 / Published: 13 February 2023

Abstract

:
To investigate the effects of different passage structures on the aerodynamic performance of the transonic fans, this paper develops a reliable and practical quasi-3D optimization method for the hub based on the experimental data of Stage 67. In the method, the hub profile of Stage 67 can be optimized without changing the geometrical data of the blades. The optimization results show that stream tube diffusion characteristics depend on the hub profile’s curvature in the boundary layer near the hub. In the front part of the hub, the end wall with a concave construction can enhance the expansion of the stream tubes near the root of the rotor blade, which helps control the diffusion flow of viscous fluid effectively to decrease the low-energy fluid’s energy degradation and radial secondary flow in the boundary layer. In the latter part of the hub, the end wall with a convex construction facilitates the shrinkage of stream tubes to decrease the secondary flow loss and separated flow loss by controlling the separation of the boundary layer efficiently. This construction of the hub profile is beneficial to promote the aerodynamic performance of a transonic fan.

1. Introduction

With the development of the aviation power industry, the fans, a key part of the aviation power system, are designed to possess better aerodynamic performance [1,2,3]. It is hoped that the fan not only has the aerodynamic performance of a high-pressure ratio and high efficiency but also can operate stably under different conditions. People also wish fans can run steadily under more different conditions. Thus, it is required that the airflow can reach the expected state in the passages of fans and at the same time, the blade passages can control stream tubes and adjust the direction of flow in a transonic environment skillfully. Its purposes are to prevent lower-energy fluid from converging in the corner and producing large-scale flow separation in the boundary layer induced by expansion pressure or strong shear. A high efficiency of the system can be achieved to decrease fuel consumption. However, traditional aerodynamic design has failed to meet all requirements of the tough task. As a consequence, it is necessary to develop an advanced aerodynamic design method for fans. In this method, it is imperative to consider complex multi-factor coupling conditions, such as viscous gas, shock waves, and three-dimensional flow in the end wall. Moreover, the expected design goals for the compression system to maintain high aerodynamic efficiency and expand the stall margin with mass flow need to be achieved.
Based on the design idea of controlling and adjusting the fluid in blade passages efficiently, many advanced aerodynamic design concepts and design methods emerged gradually. In the design of blade geometry, Wu et al. [4] proposed the theory of S1/S2 stream surfaces, and various solutions for S1/S2 stream surfaces theory have been put forward. Since then, the solution methods for S1/S2 stream surfaces theory have emerged one after another. The main representative is the streamlined curvature through-flow method proposed by Novak [5], which is used to solve the radial balance equation. In addition, Marsh [6] proposed a matrix flow method for coupled stream functions. In the early 1960s, the concept and design method of curved blades based on the theory of boundary layer migration was put forward [7,8,9,10]. And the curved blade technology has been paid much attention to because its highly individualized end wall characteristics can control the radial migration of low-energy fluid in the boundary layer, and it has been widely used in the design of the stator and even rotor blades of the progressive compression system since that time. It is worth noting that the research group headed by Mark Turner establishes an aerodynamic optimization design system for turbomachinery based on the control of blades’ geometry curvature, which couples with three-dimensional CFD. The distinguishing feature of this system is to relate the curvature of the blade profiles to the aerodynamic performance of the cascade. It also explores the relationship between the geometric characteristics of the blade and the flow field parameters [11,12].
In view of the high cost and long cycle of blade optimization, it is difficult to fully consider the constraints of the actual engineering, such as structural strength and reliability. Therefore, for the past few years, researchers have turned to investigating the optimization of the turbomachinery’s end wall (hub/shroud). Based on the gradient method, Roque Corral et al. [13] optimized the hub profile of a low-pressure compressor and obtained a non-axisymmetric end wall by solving the N-S equations. The result shows that the optimized end wall structure could effectively reduce the secondary flow loss near the end wall zone. Hartland et al. [14] adopted the idea of inverse problem design and studied the cascade using the non-axisymmetric end wall modeling technology. The result shows that a non-axisymmetric end wall can effectively control the static-pressure distribution in the end wall region. Jin Donghai et al. [15] constructed the end wall optimization platform for compressors to obtain a better S-type end wall structure, which successfully reduced the angular separation of the hub and inhibited the migration of low-momentum fluids. Zheng Xinqian et al. [16] made use of the end wall technology and shock-control technology for a five-stage compressor to increase its efficiency, pressure ratio, and blockage flow rate by 1.1%, 1.1%, and 1.2%, respectively. Hu Shuzhen et al. [17] conducted an optimization study on the hub of a high subsonic axial-flow compressor. The result shows that a suitable hub profile can restrain the development of passage vortices and increase efficiency by 0.45%. Aiming at the complex flow in the turbine, Giacomo et al. [18] adopted a three-dimensional end-wall fence structure to reduce the infiltration of secondary flow and increase the longitudinal uniformity of vorticity. Zhang et al. [19] used the boundary layer suction method to control flow losses for the NACA65 blade profile and achieved good aerodynamic performance at both design and off-design points.
The above design methods highlight the importance of the through-flow portion in blade passages in terms of adjusting and controlling viscous fluid. At the same time, engineering practicality should be paid more attention to instead of a single technology breakthrough. However, it relies heavily on the solution system of three-dimensional viscous CFD. Therefore, it will pay a heavy price in computing resources, the number of variables, and the design cycle.
Based on the in-depth analysis of the internal flow field and geometric characteristics of the transonic fan, this paper proposes a quasi-3D aerodynamic optimization method for the hub profile and develops the corresponding optimization design platform. Due to the lack of 3D geometric data of the two-stage transonic fan NASA Stage 67, the aerodynamic designs of 1D and quasi-3D are carried out. Then the redesigned fan by the quasi-3D design is optimized. Comparing and analyzing the flow field in the fan passage before and after optimization, the superiority of the optimization platform and the design idea of the fore-convex and aft-concave hub profile in this paper is proved. The research work of this paper is intended to further expand the aerodynamic design system of advanced turbomachinery, which provide ideas for subsequent aerodynamic optimization research.

2. Research Object and Numerical Simulation Method Validation

2.1. D and Quasi-3D Aerodynamic Design

The two-stage transonic fan NASA Stage 67 is selected as an example to investigate the quasi-3D end wall optimization method. Stage 67 is designed to develop a higher-efficiency and lighter-weight engine for short-haul aircraft in the 1980s. Table 1 presents the initial design parameters of Stage 67 [20].
It is necessary to complete 1D and quasi-3D aerodynamic design for Stage 67 based on the existing design program of the research group, aimed to investigate the end wall quasi-3D optimization method because the author only has experimental data for Stage 67 without three-dimensional geometry. By 1D design, the geometrical profile of the meridional passage is obtained shown in Figure 1. The results indicate that the meridional passage redesigned matches with that in the NASA report well, which is regarded as reliable results for the next quasi-3D design and optimization.
Based on 1D design results, research on quasi-3D aerodynamic design is carried out based on the flow-tube iteration method. Figure 2 shows the comparison results between the total pressure ratio and the total temperature ratio of the two stages fan at different axial positions with equal middle diameters and the experimental data. Numbers 1–8 indicate the position number in turn, as shown in Figure 2c. The research results show that the 1D and quasi-3D design results in this paper are in good agreement with those in the NASA report, indicating that the 1D and quasi-3D design methods adopted have high calculation accuracy. It is worth noting that the quasi-3D design results are slightly lower than the 1D design results and more consistent with the experimental data. The reason is that various loss models are introduced to predict the loss of the passage in the quasi-3D design process.

2.2. Independence Verification

The aerodynamic performance and the three-dimensional viscous flow of the two-stage transonic fan are studied by numerical simulation in the FINE/Turbo module of Numeca. The three-dimensional flow information of the transonic two-stage fan is based on solving the Navier-Stokes equations. In view of the calculation time and solution precision, the Spalart-Allmaras model is chosen as the turbulence model, which has excellent robustness and a great ability to deal with complex flow. The space term chooses the central difference scheme. The time term is discretized by the 4-order explicit Runge-Kutta method, and the multi-grid method and local time step are adopted to accelerate the speed of convergence. The transmission of parameters between the blade rows is accomplished via the mixing-plane method. No-slip and adiabatic wall conditions are employed for all the wall boundaries. For each simulation, the convergence criterion is established, which is that the operation will be terminated when the normalized RMS residual is lower than 1 × 10⁻⁵.
The numerical analysis of the redesigned fan is carried out. The specific boundary conditions are set as follows. The absolute total temperature is 288.15 K and the absolute total pressure is 101,325 Pa at the inlet of the calculation domain. The designed rotating speed is 16,042.8 rpm. The static pressure of the center of the outlet plane is provided. Among them, the static pressure at the design point is 229,000 Pa, and the pressures of other radial positions on the outlet plane are calculated by the radial equilibrium equation. The y+ near the end wall surface is ensured to be less than 10 to capture the flow information of the boundary layer.
The computation grid is generated by AutoGrid5 and the grid configuration of the rotor/stator is obtained through O4H topology. To select an optimal grid resolution, the verification of grid independence was carried out based on the redesigned fan at the design point and choke condition. As shown in Table 2 and Table 3. When the total grid number exceeds 2.25 million, the relative changing rate of the mass flow is no more than 0.5%. The change in total pressure ratio and efficiency can be neglected. Therefore, in consideration of the prediction accuracy and the calculation cost, the total grid number of 2.25 million is applied to the further calculation. The geometry and grid structure of the two-stage fan are presented in Figure 3.
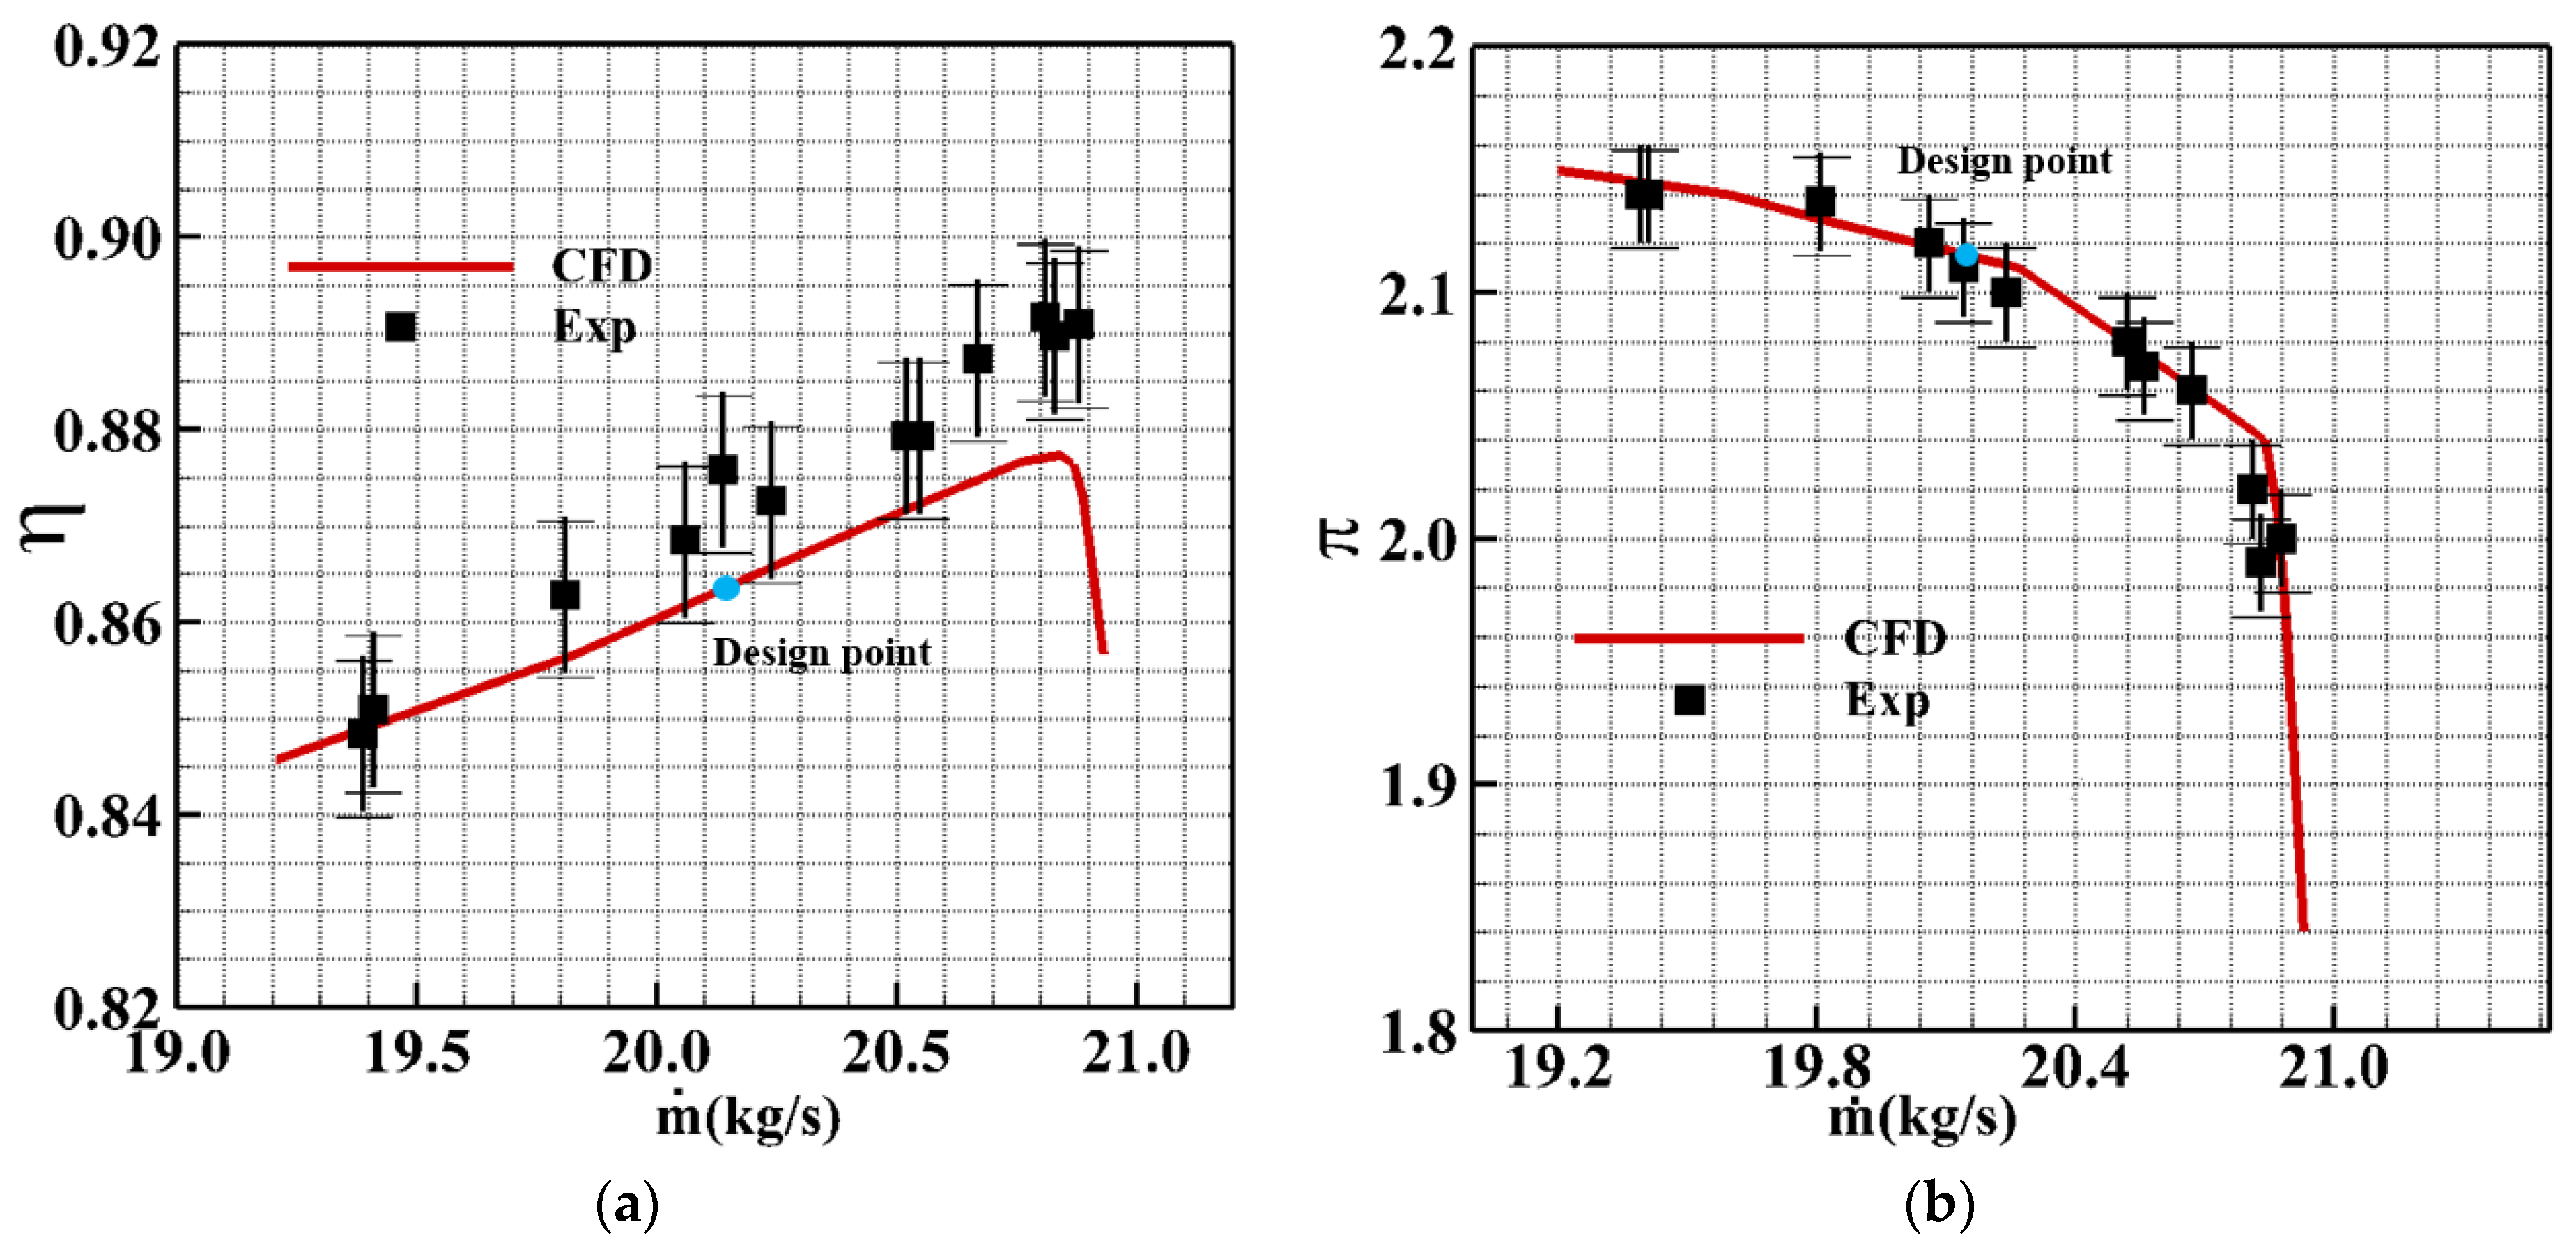
To verify the reliability of the turbulence model and boundary conditions selected in this paper, NASA Rotor 37 is selected for numerical simulation verification. Figure 4 presents the total pressure ratio and adiabatic efficiency of the NASA Rotor 37 at the designed rotating speed of 17,188.7 rpm. The experimental errors are also displayed. It is evident that the total pressure is predicted preferably and consistent with the experimental value basically. The predicted values of adiabatic efficiency are slightly smaller than the experiment data and the deviation of peak efficiency is around 1%. Thus, despite existing errors between the experiment and the numerical simulation, the research results show that the numerical method is credible as well, because the errors are small enough within the accepted range [21,22].
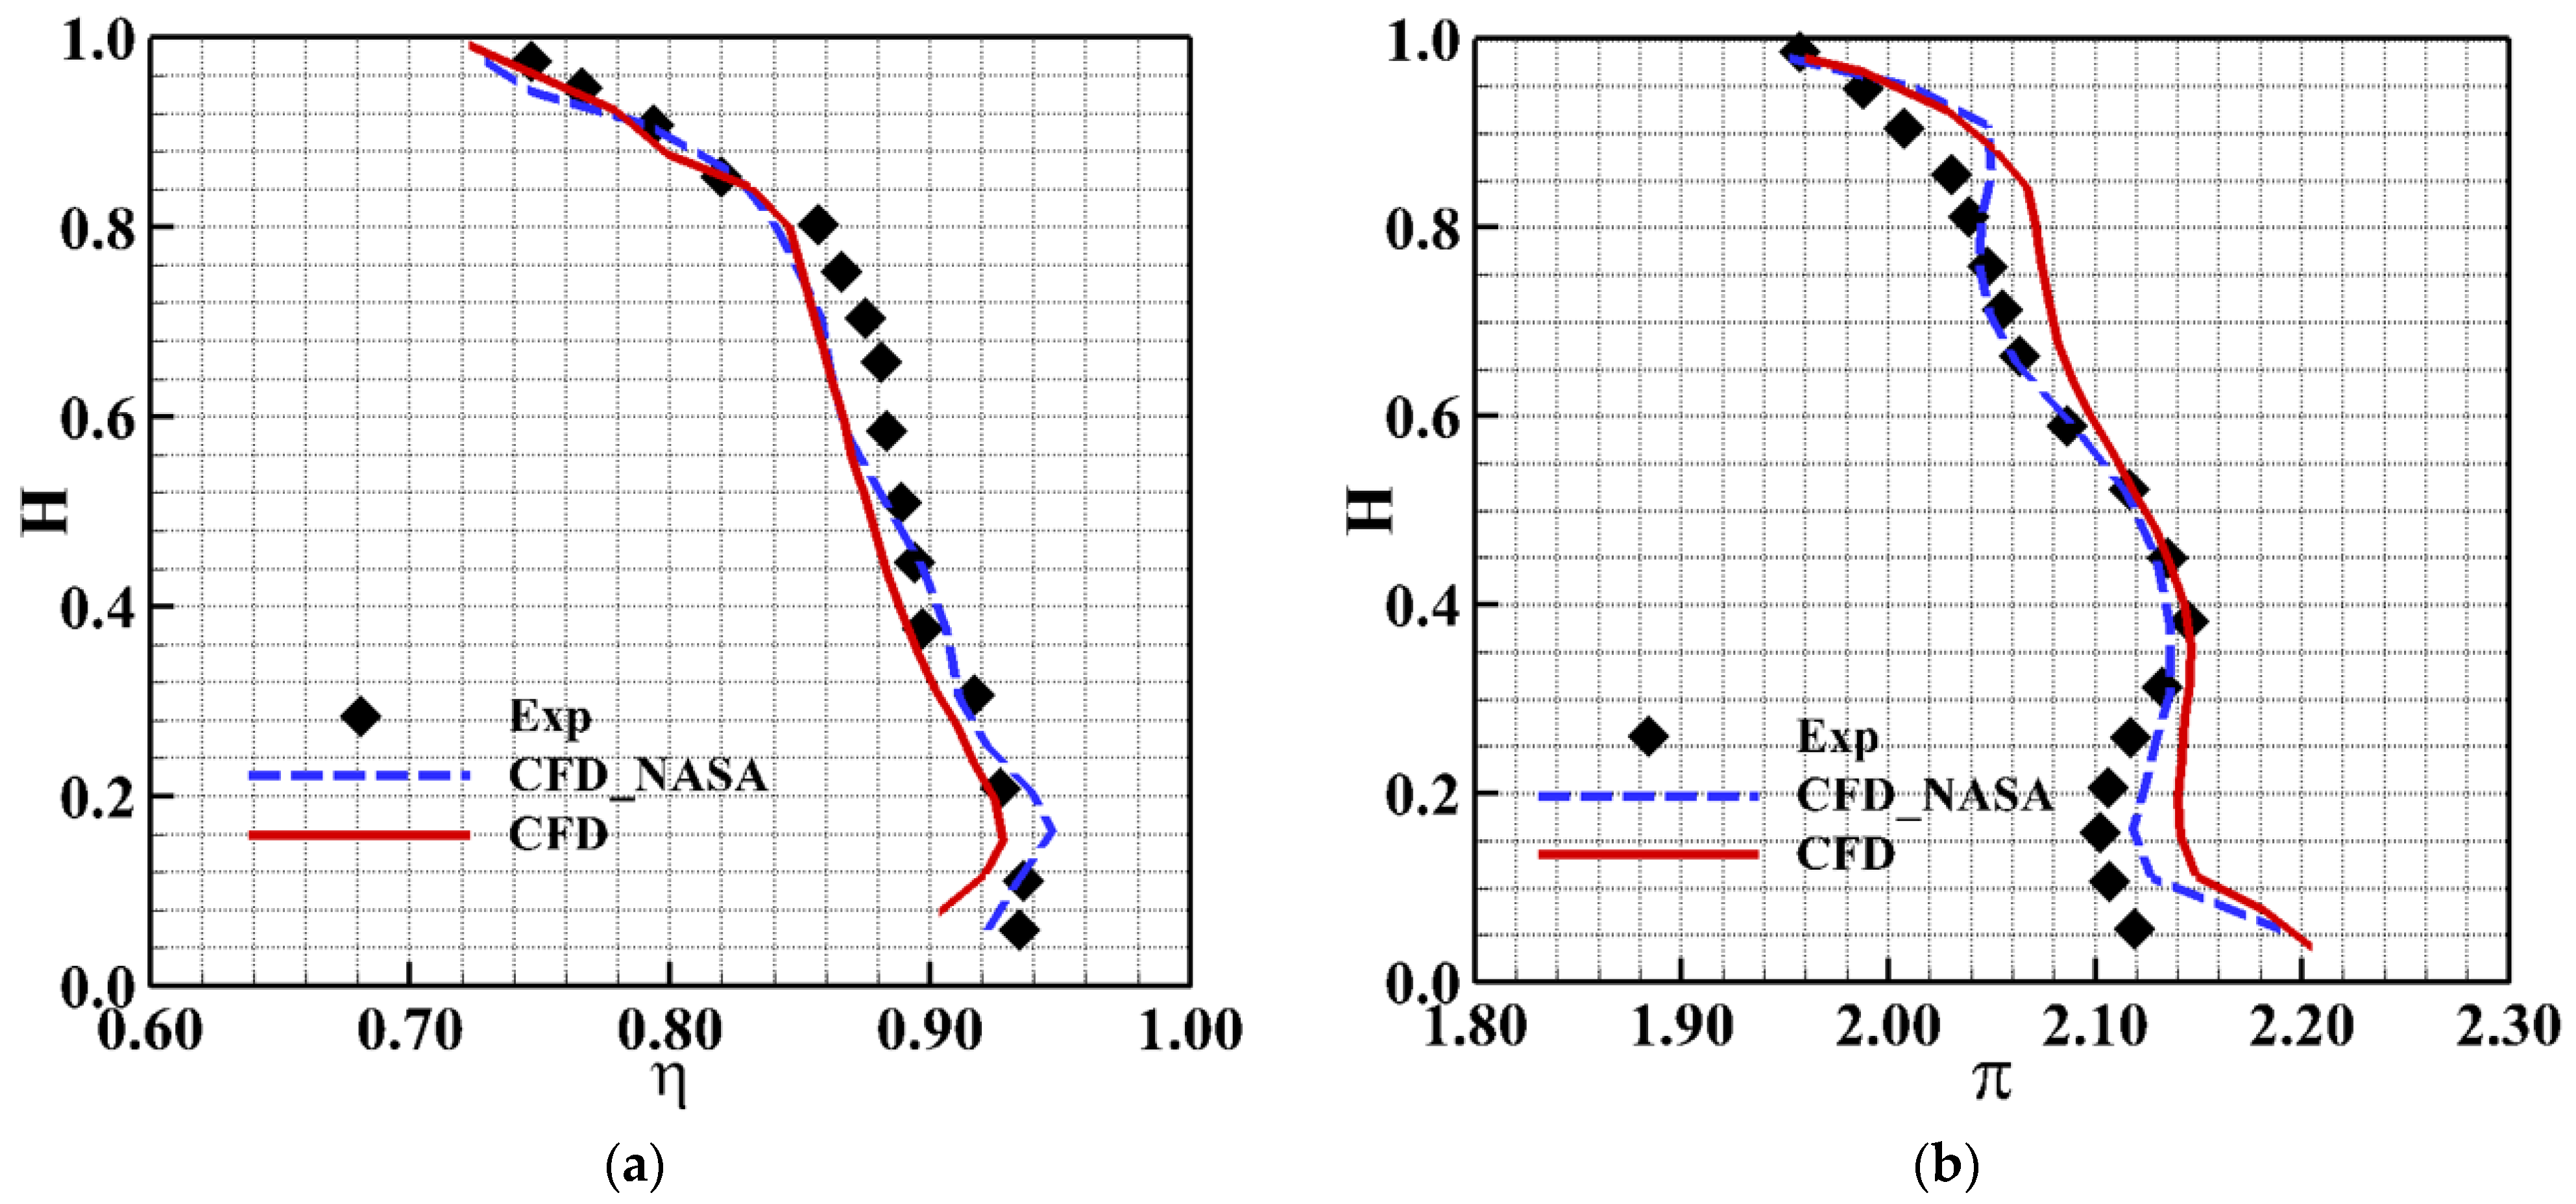
In addition, Bruna et al. [23] also performed CFD calculations on NASA Rotor 37. Figure 5 shows at the design point, the distribution characteristics of the total pressure ratio and adiabatic efficiency along the blade height at the outlet. The calculation results in this paper are named CFD, and those of Bruna are named CFD_NASA. In the figure, H represents the height along the direction of blade height and is a dimensionless number. The results calculated by using the numerical model in this paper are basically consistent with the experimental data and the simulation results of Bruna et al. Compared with the experimental data, the total pressure ratio is slightly higher, and the adiabatic efficiency in the middle of the blade is slightly lower. However, in general, the numerical simulation results have the same trend of increase and decrease with the experimental data, and the deviation of the numerical results is basically within 3%, meeting the requirements of experimental error.

3. Quasi-3D End Wall Optimization Method

3.1. Aerodynamic Optimization Theory of the End Wall

Many scholars have put forward various methods to reduce the energy loss caused by end wall flow separation and secondary flow in compression systems, including constructing small blades, and optimizing airflow angle/camber lines and stacking points. These optimized methods almost focus on optimizing the shapes or structures of blades [18,19]. At the same time, there exist lots of complex and hard-operation optimization steps in these optimized methods. Thus, some researchers start trying to optimize end wall profiles to improve the aerodynamic performance of fans or compressors by various techniques. Therein, some people design the hub profile by means of constructing axial functions, and some also make use of the non-axisymmetric end wall method.
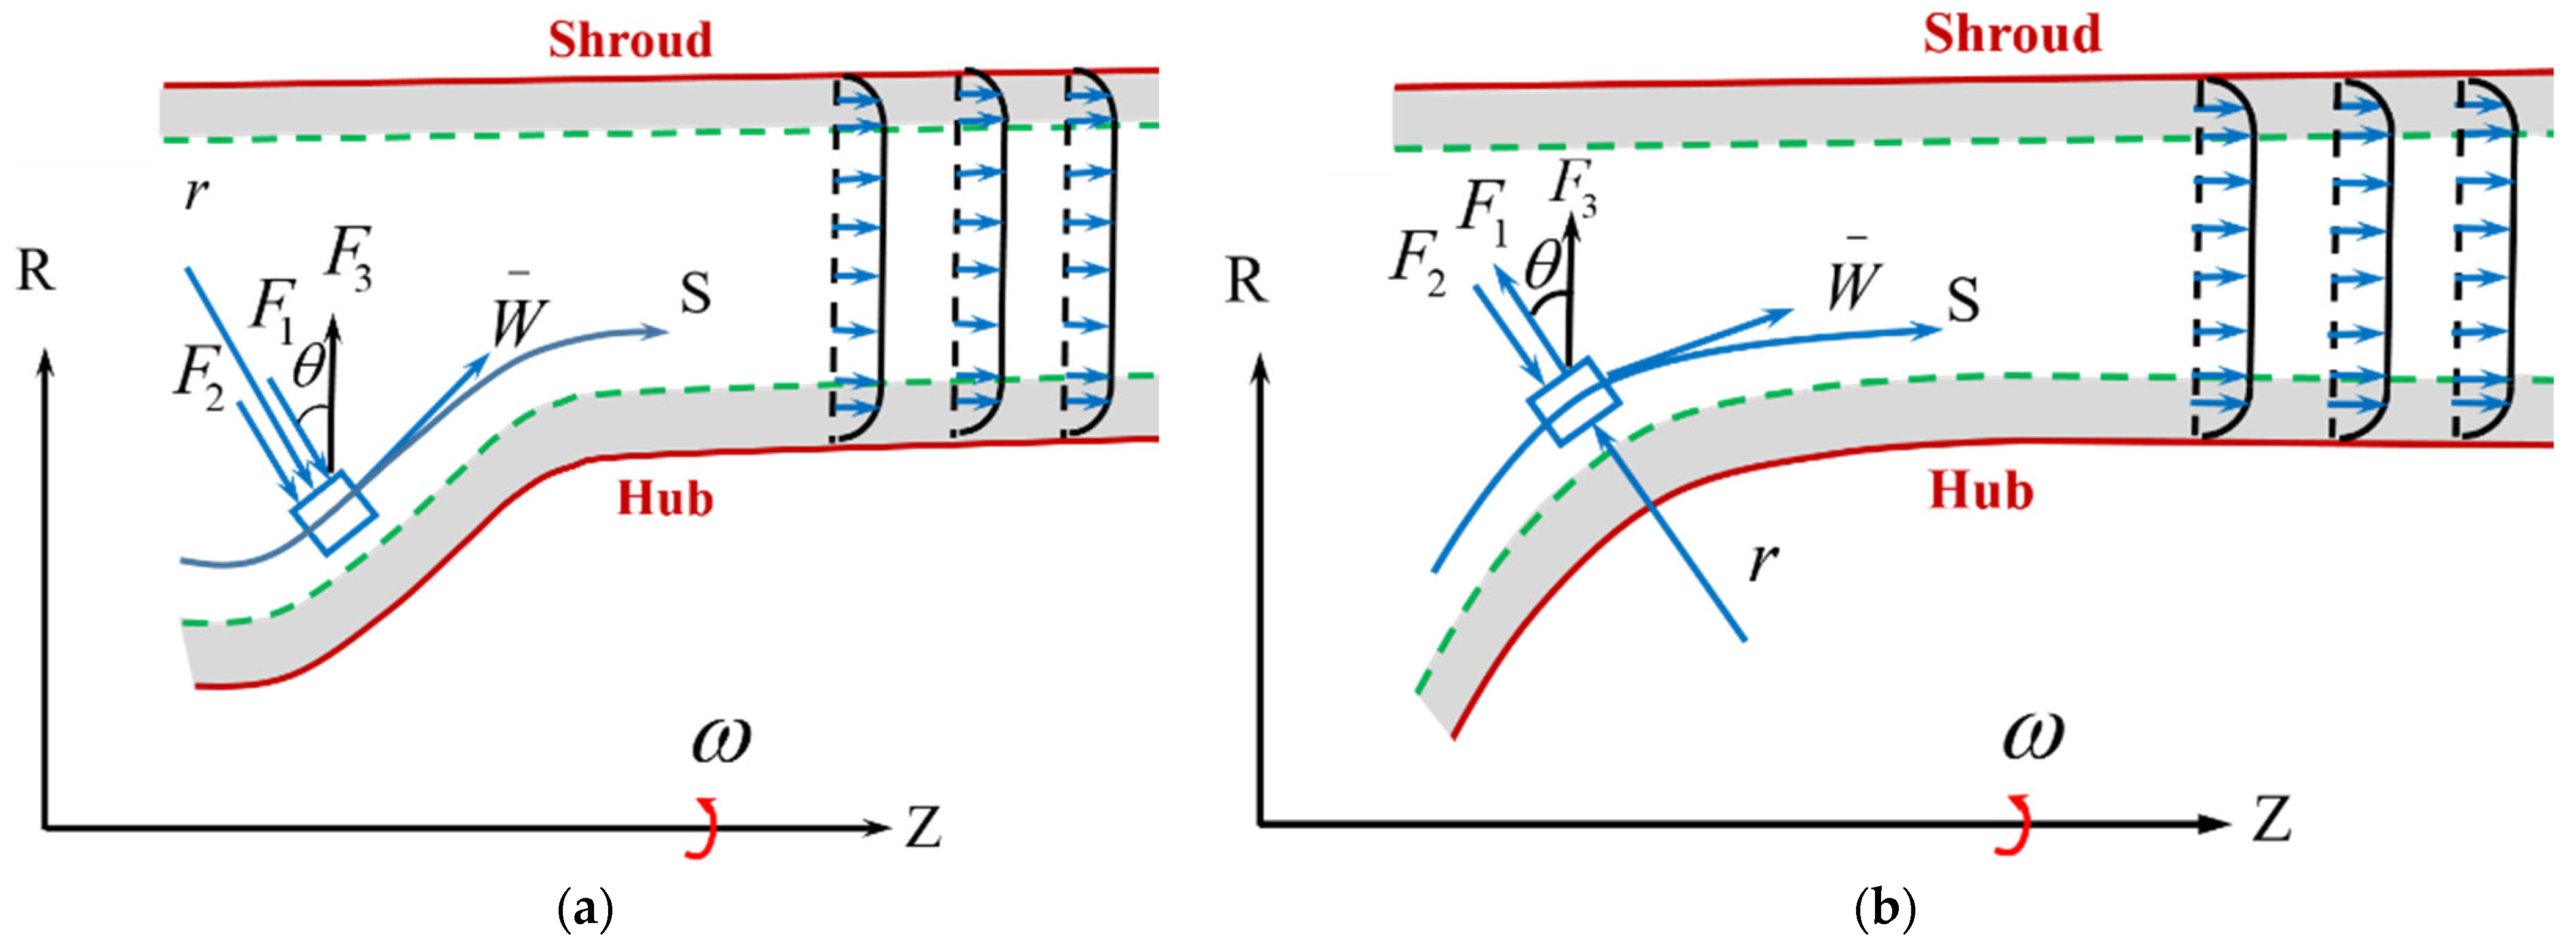
There are two mainstream hub constructions. One is the convex construction (corresponding to positive curvature) and the other is the concave construction (corresponding to negative curvature). In these two different constructions, the forces exerted on the fluid, especially near the hub are not identical entirely. The schematic diagram of the forces in the two hub constructions is as follows in Figure 6.
Because of the rotating speed of axial fans, the fluid in rotor rows is affected by a strong radial centrifugal force (F3) and moves along with the direction from the hub to the shroud, which produces more secondary flow to reduce adiabatic efficiency. In addition, the fluid in rotor rows is forced to accumulate at the blade tip due to the radial centrifugal force, which leads to the increase of fluid density near the tip. And then the pressure near the shroud is higher than that near the hub, which forms a normal pressure gradient (F2) from the shroud to the hub in the meridian passage. At the same time, centrifugal inertia force (F1) is exerted on the fluid when the fluid flows along streamlines.
For the concave end wall profile, the forces exerted on a fluid particle are expressed as:
F 1 = δ m W 2 r F 2 = δ m P d A 1 F 3 = δ m ω 2 R
F = δ m ( ω 2 R p d A 1 cos θ ) δ m W 2 r cos θ
For the convex end wall profile, the forces exerted on a fluid particle are expressed as:
F = δ m ( ω 2 R p A 1 cos θ ) + δ m W 2 r cos θ
According to the analysis of the above two structures, it can be seen that the centrifugal inertia forces of the two structures have different directions in the centrifugal movement along the streamline. In the concave structure, the centrifugal inertia force points in the direction of the exterior normal, which is the same as the pressure gradient in the meridional passage. As a consequence, the fluid tends to flow along the streamline to control separation flow and improve aerodynamic efficiency. However, in the convex structure, the direction of the centrifugal inertia force is the same as the adverse pressure gradient in the meridional passage. This leads to the fluid in the convex structure moving more easily to the tip, obstructing the mainstream and producing secondary flow loss.
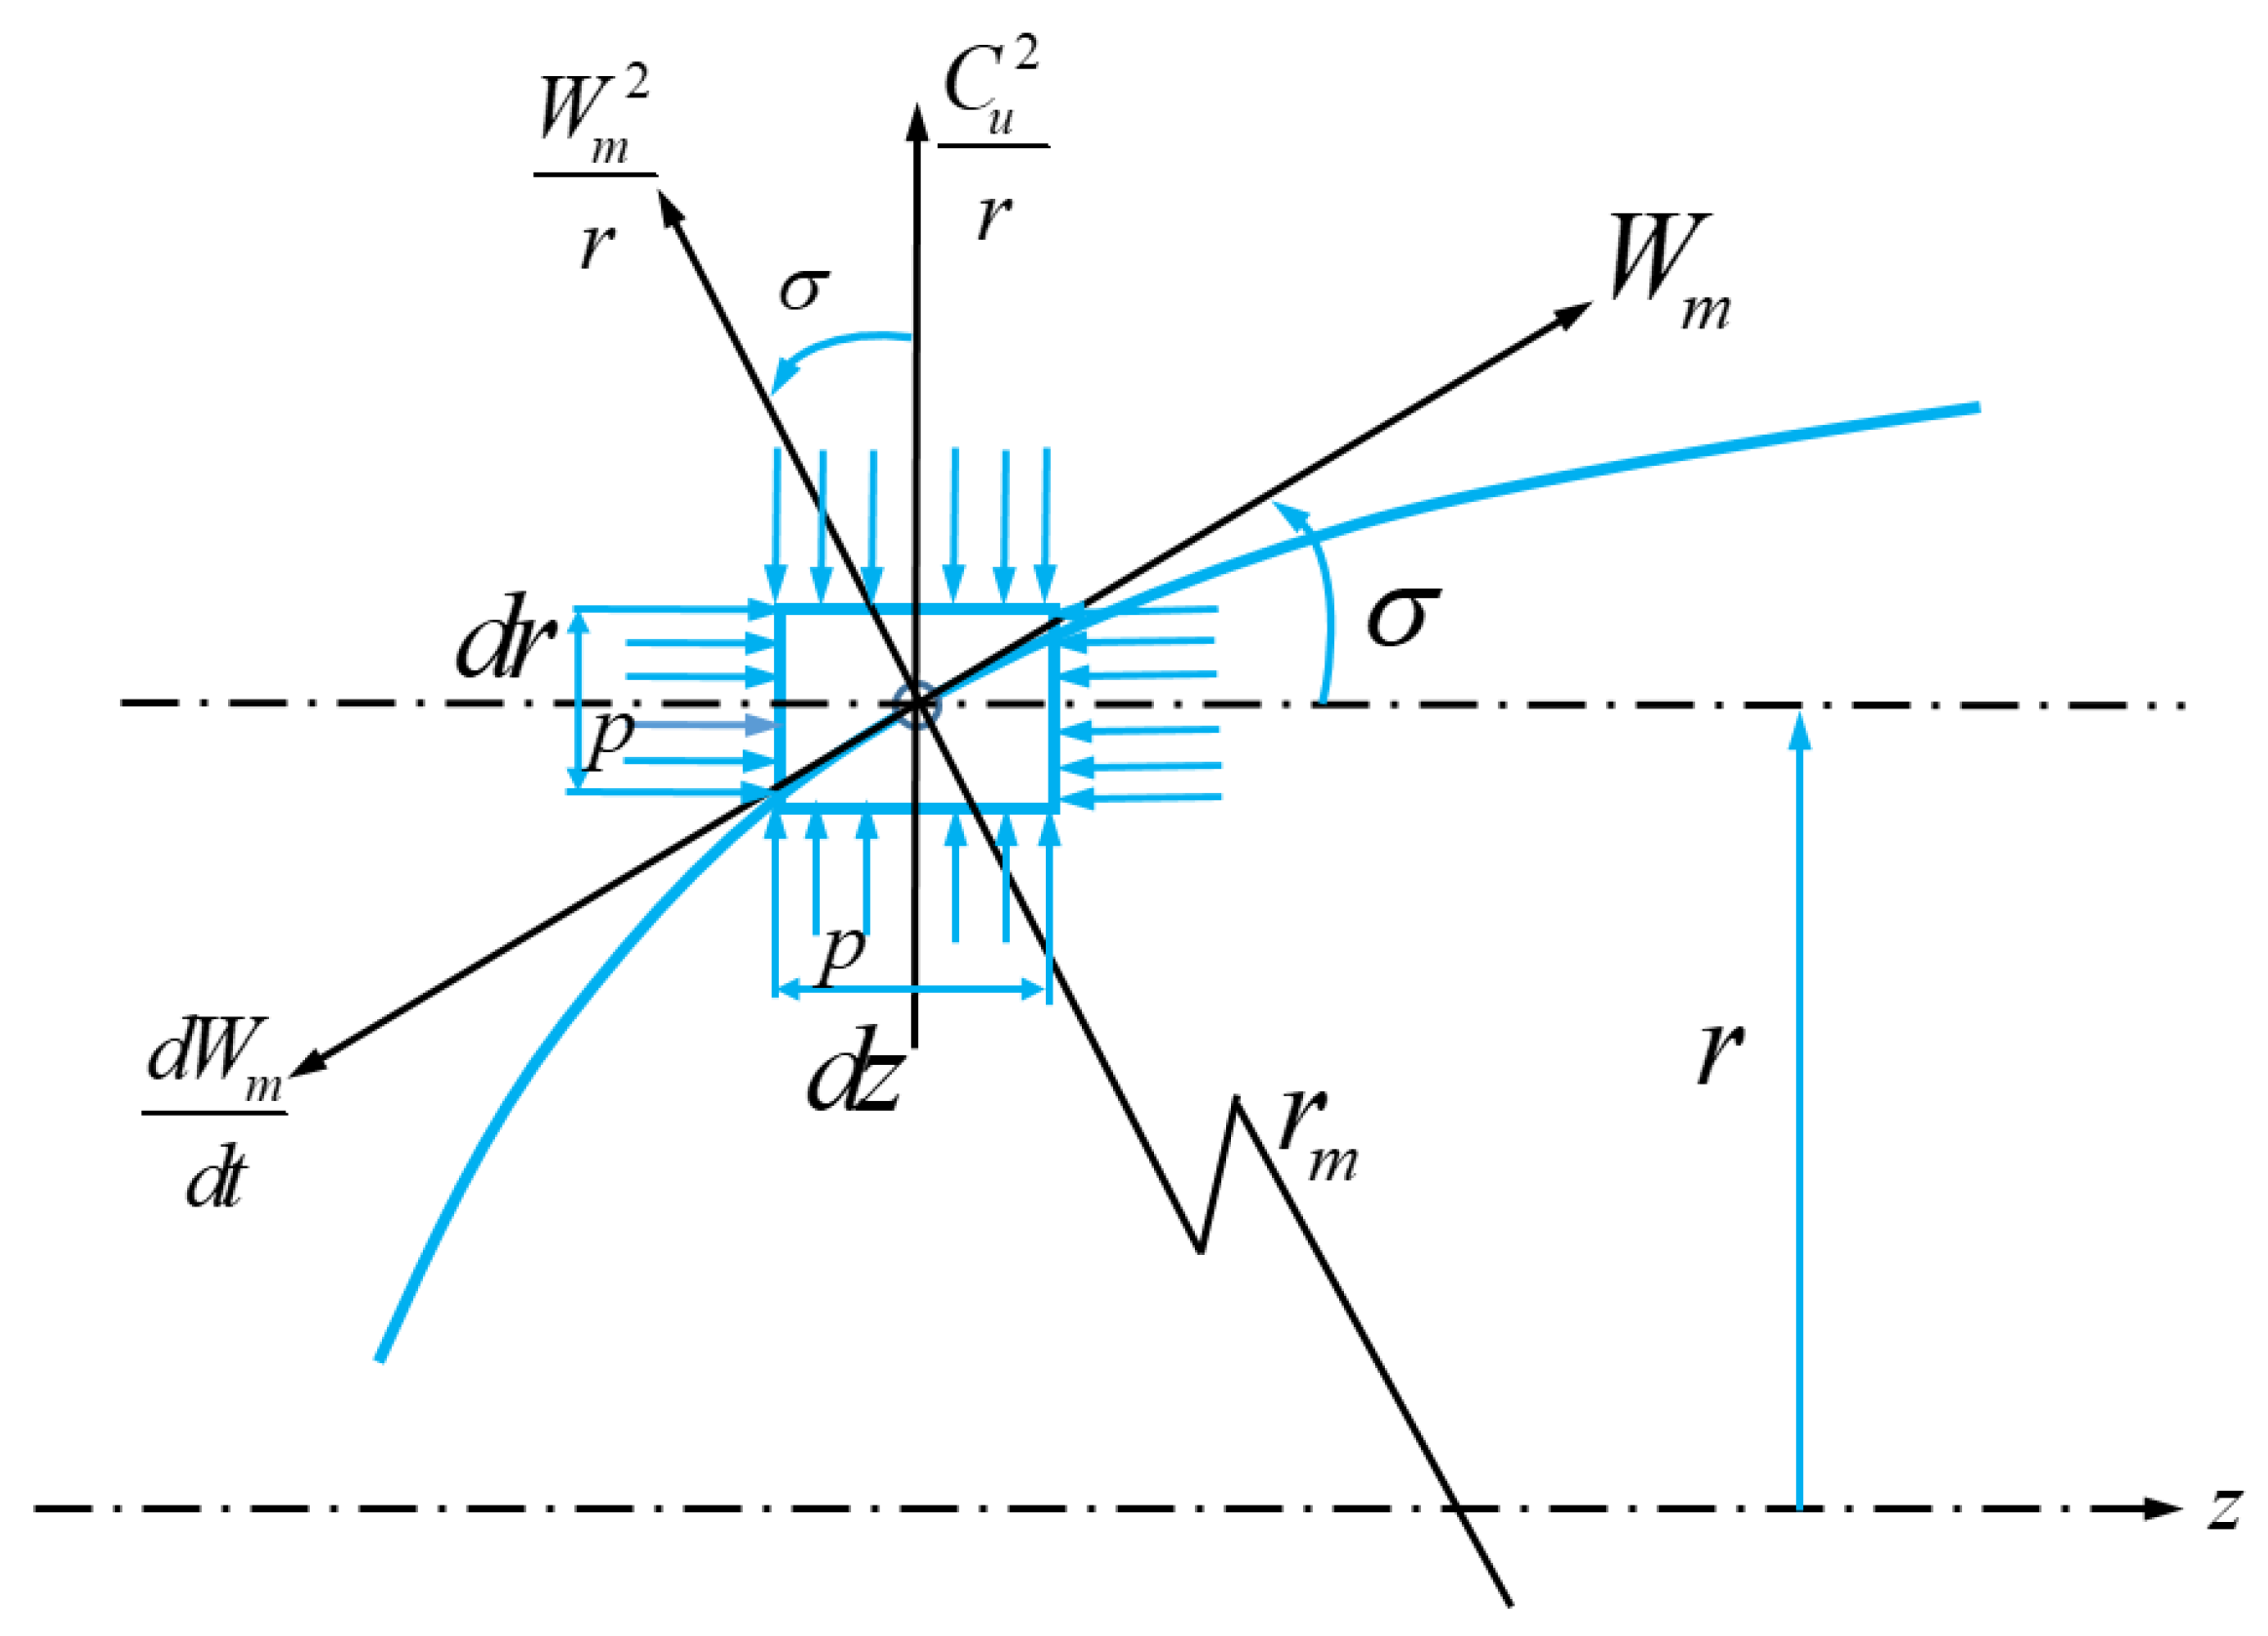
For the concave and convex configurations of the end wall profile, we can also utilize the radial balance equation to analyze them. The relation between absolute and relative velocity is covered in the first component of the motion equation for the S2 stream surface, Cu = Wu + ωr. Here are some results:
1 ρ p r = C u 2 r W z 2 ( D t g σ d z + t g σ D ln W z d z ) + F r
D σ d m = 1 r m W z = W m cos σ
We can make use of simple Formula (5) to get a normal radial-equilibrium equation:
1 ρ p r = C u 2 r ( cos σ W m 2 r m + W m sin σ D W m d m ) + F r
It is obvious that the radial static pressure gradient is mainly composed of four parts:
(1)
The centripetal acceleration caused by the circumference velocity Cu2/r;
(2)
The radial component of the centripetal acceleration Wm2/rm in the meridional plane due to the curve motion;
(3)
The radial component of the meridional acceleration dWm/dt;
(4)
The radial component of the F is caused by the uneven static pressure in the circumference.
The first three can be easily seen in Figure 7. The key one is the second part because the direction of the radial component for this part is different in the two end wall profiles. The radial component is positive in the convex end wall profile. It can increase static pressure gradient and enhance radial secondary flow, which makes flow easier to separate and increases the aerodynamic loss. But, in the concave end wall profile, the radial component is negative. It can decrease the static pressure gradient of the radial flow and the fluid can be enforced to flow along streamlines, which controls secondary flow and flow separation effectively. The forces Fr, Wmsinσ DWm/dm in the radial-equilibrium equation are often overlooked in the approximate calculation of the axial impeller machine. Because the approximate calculation is used only in the circumferential gap in blade rows instead of the blade passages. It can be considered that the velocity moment of the flow is constant and the airflow surface is composed of radial lines. Moreover, the radial component of the axial impeller is usually small and the component velocity Wm in the meridional plane tends to change less sharply in the meridional plane.

3.2. Aerodynamic Optimization Method and Platform of the End Wall

The optimization cycle based on 3D blade geometric characteristics is long, and there are many limitations in the selection of the optimal scheme at the initial stage of design. The aerodynamic optimization method based on the quasi-3D can efficiently meet the initial scheme screening of the multi-stage fan. It is also a desirable research approach to use three-dimensional CFD to verify and improve after the research scheme is determined.
It can be seen that improving the end wall structure of the fan can optimize overall aerodynamic performance. So, a quasi-3D optimization design method for axial fan end wall profile is put forward in this paper. This method can be described as follows:
Firstly, the parametric definition for the end wall profile of a fan is established based on the end wall structure. Secondly, according to the quasi-3D procedure and genetic algorithm, the optimization platform for end wall profiles can be built, which is utilized to optimize the control parameters of the end wall profile and obtain the optimal design parameters of the end wall-profile structure. Finally, the reliability and correctness of the optimized end wall profiles are verified by three-dimensional CFD technology in the stage environment of fans.
The key of this method is to correlate the cubic spline function with the control-point parameters of the end wall profiles. The hubs and shrouds profiles of axial fans in different schemes are matched by means of the cubic spline. The optimal end wall profile is sought by comparing each scheme autonomously and the final purpose is to improve the overall aerodynamic performance of fans.
The definition of the cubic spline function is as follows:
v ( u ) = S i ( t u ) = r = 0 3 P i + r B r ( t u ) ,   t 0 , 1
Wherein, Pi+r is the coordinate value of the control points in the section i curve (Si), Br(tu) is the spline basis function, tu is the value of parameters t at u ∈ [0,1].
The mathematical definition of the cubic spline basis function is:
B 1 ( t ) = ( ( t 3 ) + ( 3 × t 2 ) ( 3 × t ) + 1 ) / 6 B 2 ( t ) = ( ( 3 t 3 ) ( 6 × t 2 ) + 4 ) / 6 B 3 ( t ) = ( ( 3 t 3 ) + ( 3 × t 2 ) + ( 3 × t ) + 1 ) / 6 B 4 ( t ) = ( 3 t 3 ) / 6
The mathematical expression (8) is relatively simple, and the second-order derivative is continuous. Therefore, it is convenient for aero-engine engineering designers to understand and apply it. At the same time, it can ensure the smoothness of end wall profiles and help us obtain a better end wall structure of fans with some higher aerodynamic performance.
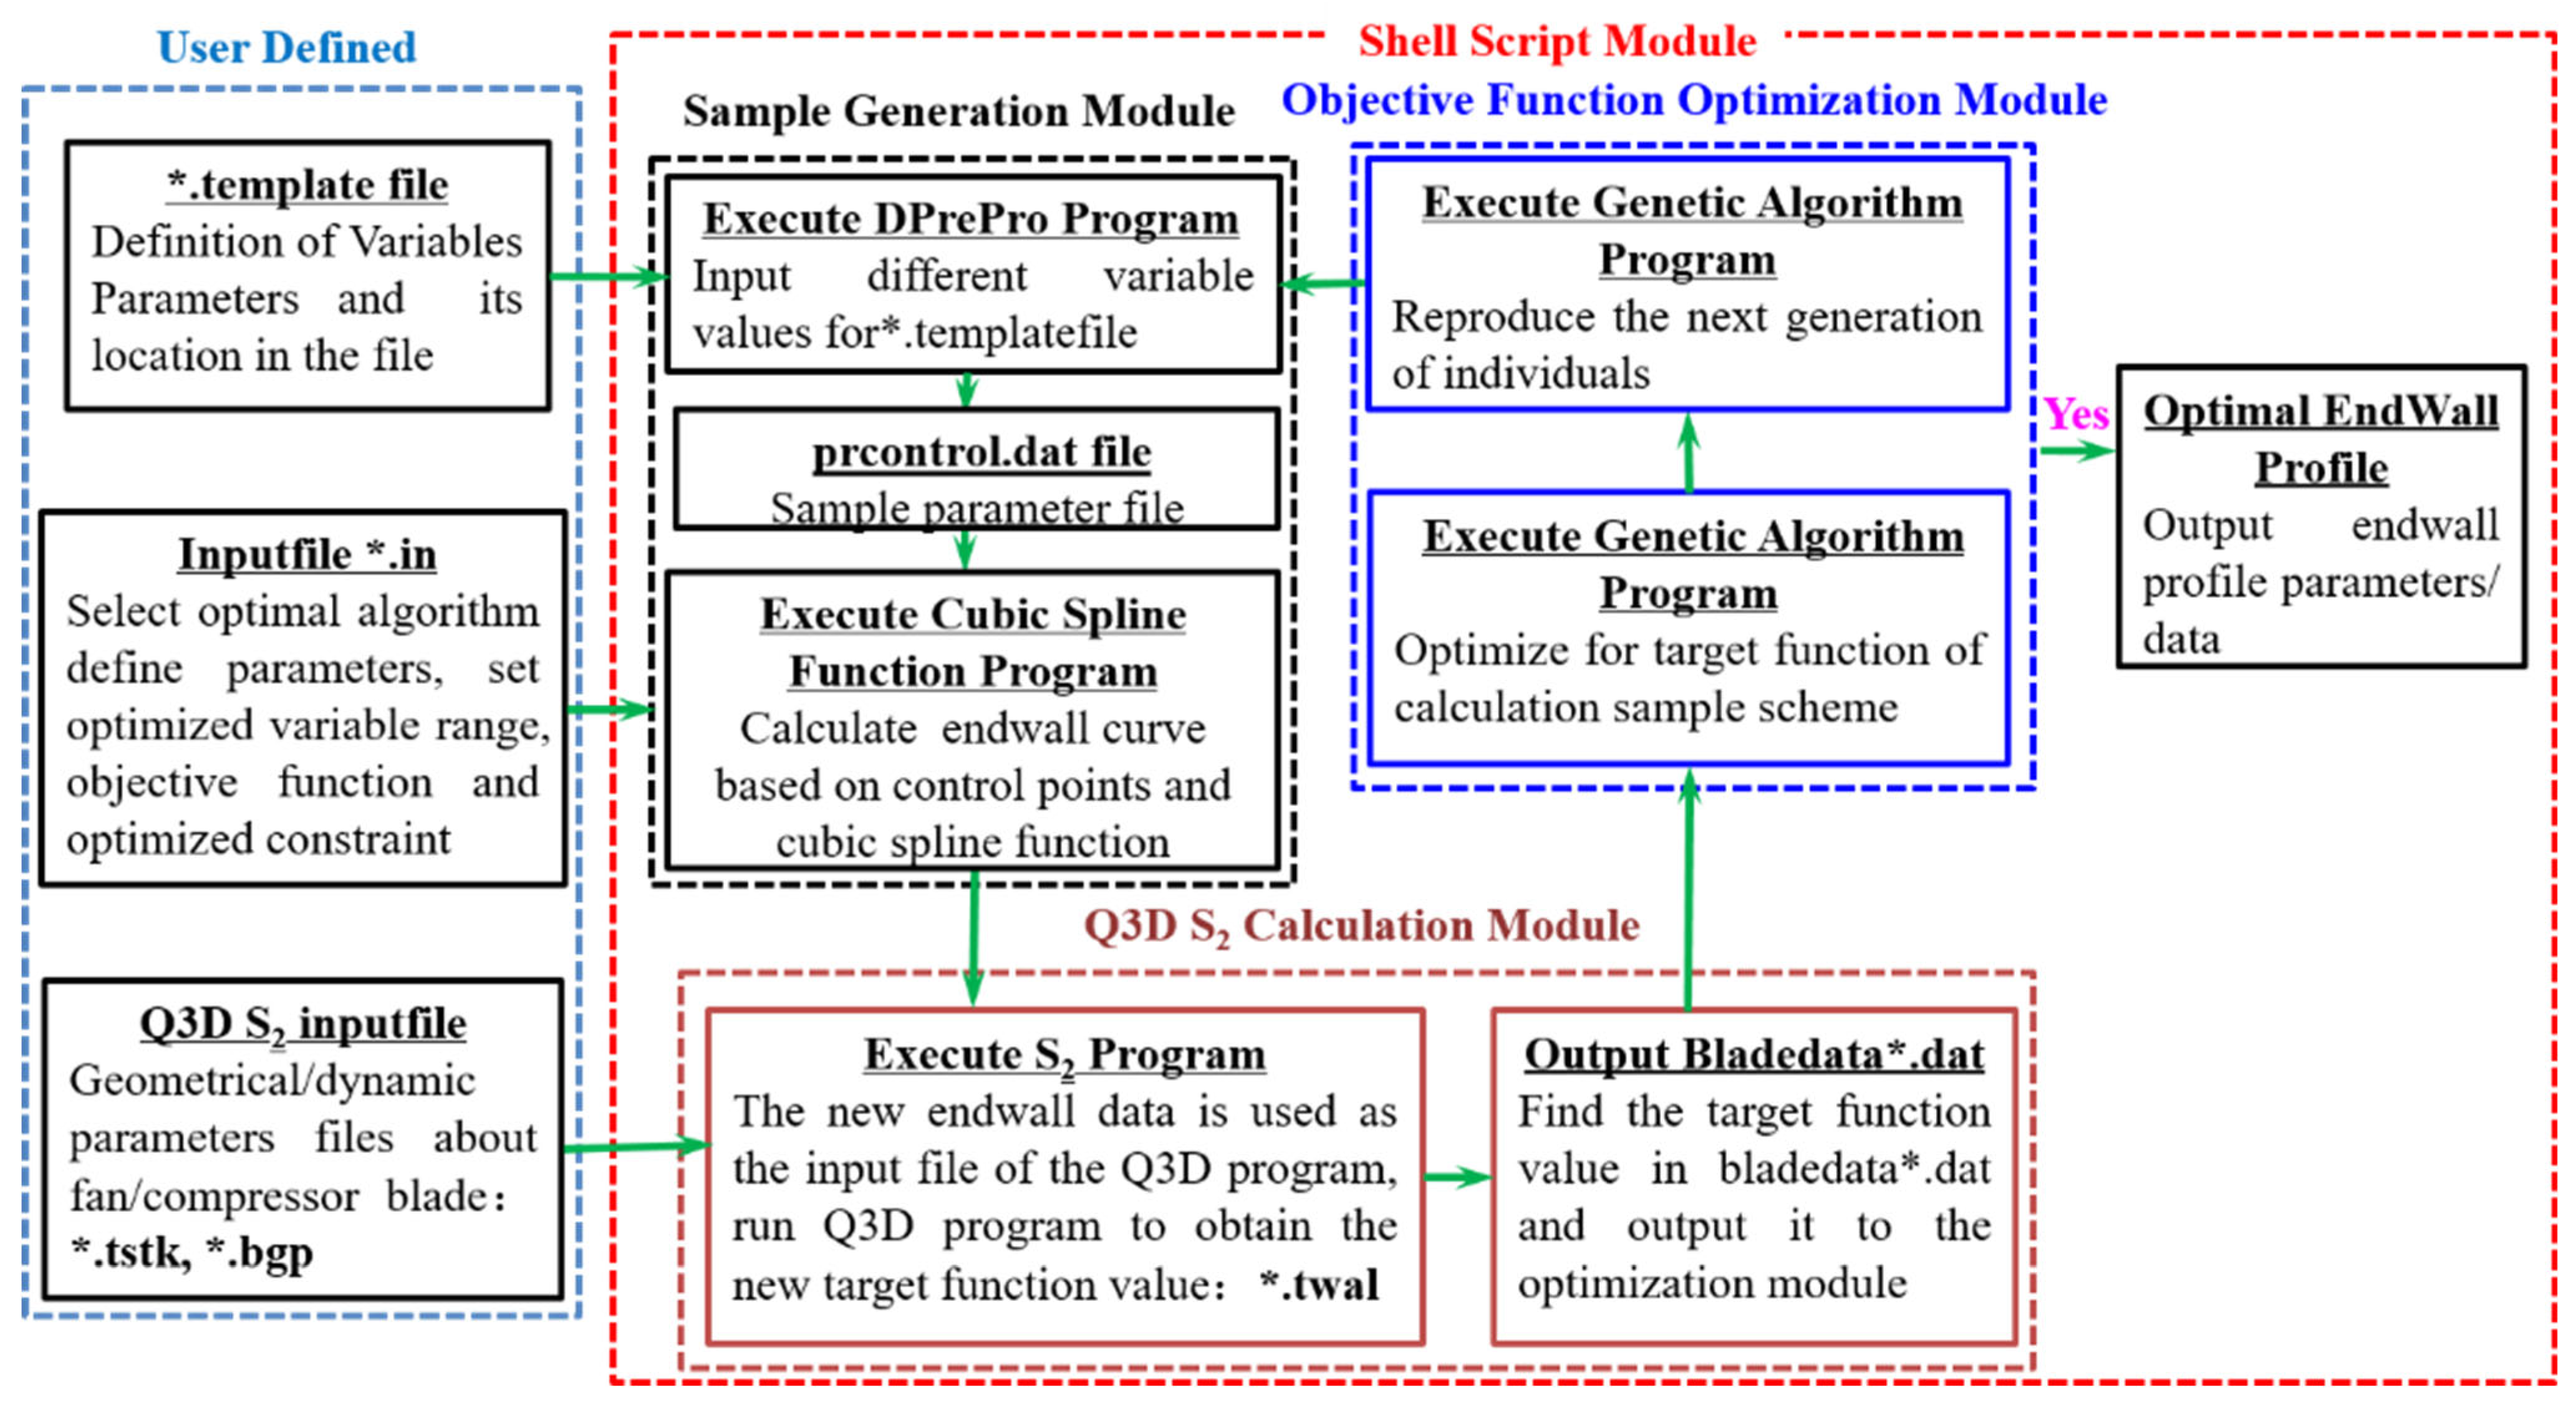
Figure 8 shows the stream map of the optimization platform. The optimization platform for the end wall profile consists of two main modules, namely the user-defined module and the shell script module. where *. is the file name. Among them, the shell script module has the function of sample generation, quasi-3D S2 stream surface calculation, and objective function optimization. The optimization algorithm uses the automatic-topology artificial neural network in the Design 3D module of NUMECA141. The Latin hypercube method is used in the design of experiments. The specific optimization process is as follows:
In the first step, the user needs to define the parameters or variates which need optimizing and the range of their values. The objective function, constraint conditions, optimization method, and the input file of the quasi-3D calculation are also defined in the user-defined module. Figure 9 presents the optimal calculation domain and the positions of 8 control points in the hub and shroud. The CPhs are the control points of the hub, and the CPss are the control points of the shroud. In the second step, according to the number of optimization variables/parameters and the range of their values, the optimized platform executes the shell script files to produce a new scheme in the Linux system. In the third step, the parameters of control points in a new scheme and cubic spline function are combined to obtain the new hub/shroud coordinates, which are thought as the input parameters to calculate the quasi-3D S2 stream surface. And then the information of the S2 stream surface is computed for acquiring the value of new end wall profiles’ objective functions. In the fourth step, based on the results of the calculation in the third step, the optimal parameters of end wall profiles and structures are obtained by searching for global optimization with the genetic algorithm. Compared with the reference [13], the optimization platform developed in this paper has simpler operation steps and better stability. In addition, the multistage turbomachinery can be optimized at the same time, which improves computational efficiency.

4. The Analysis of the Optimized-Hub Results for a Two-Stage Fan

4.1. Aerodynamic Performance Analysis

To improve the aerodynamic performance of a two-stage transonic fan and verify the quasi-3D optimization method, we need to optimize the redesigned two-stage fan. The following is a brief description of the mathematical model of optimal design:
Optimization objective: adiabatic efficiency η, search for the max adiabatic efficiency in the optimization process;
Constraints: mass flow rate m ˙ m ˙ (redesigned fan), total pressure ratio ππ (redesigned fan);
Design variables: The position of 8 control points of the hub, the constant in the optimization process is the overall geometric shape of the blade;
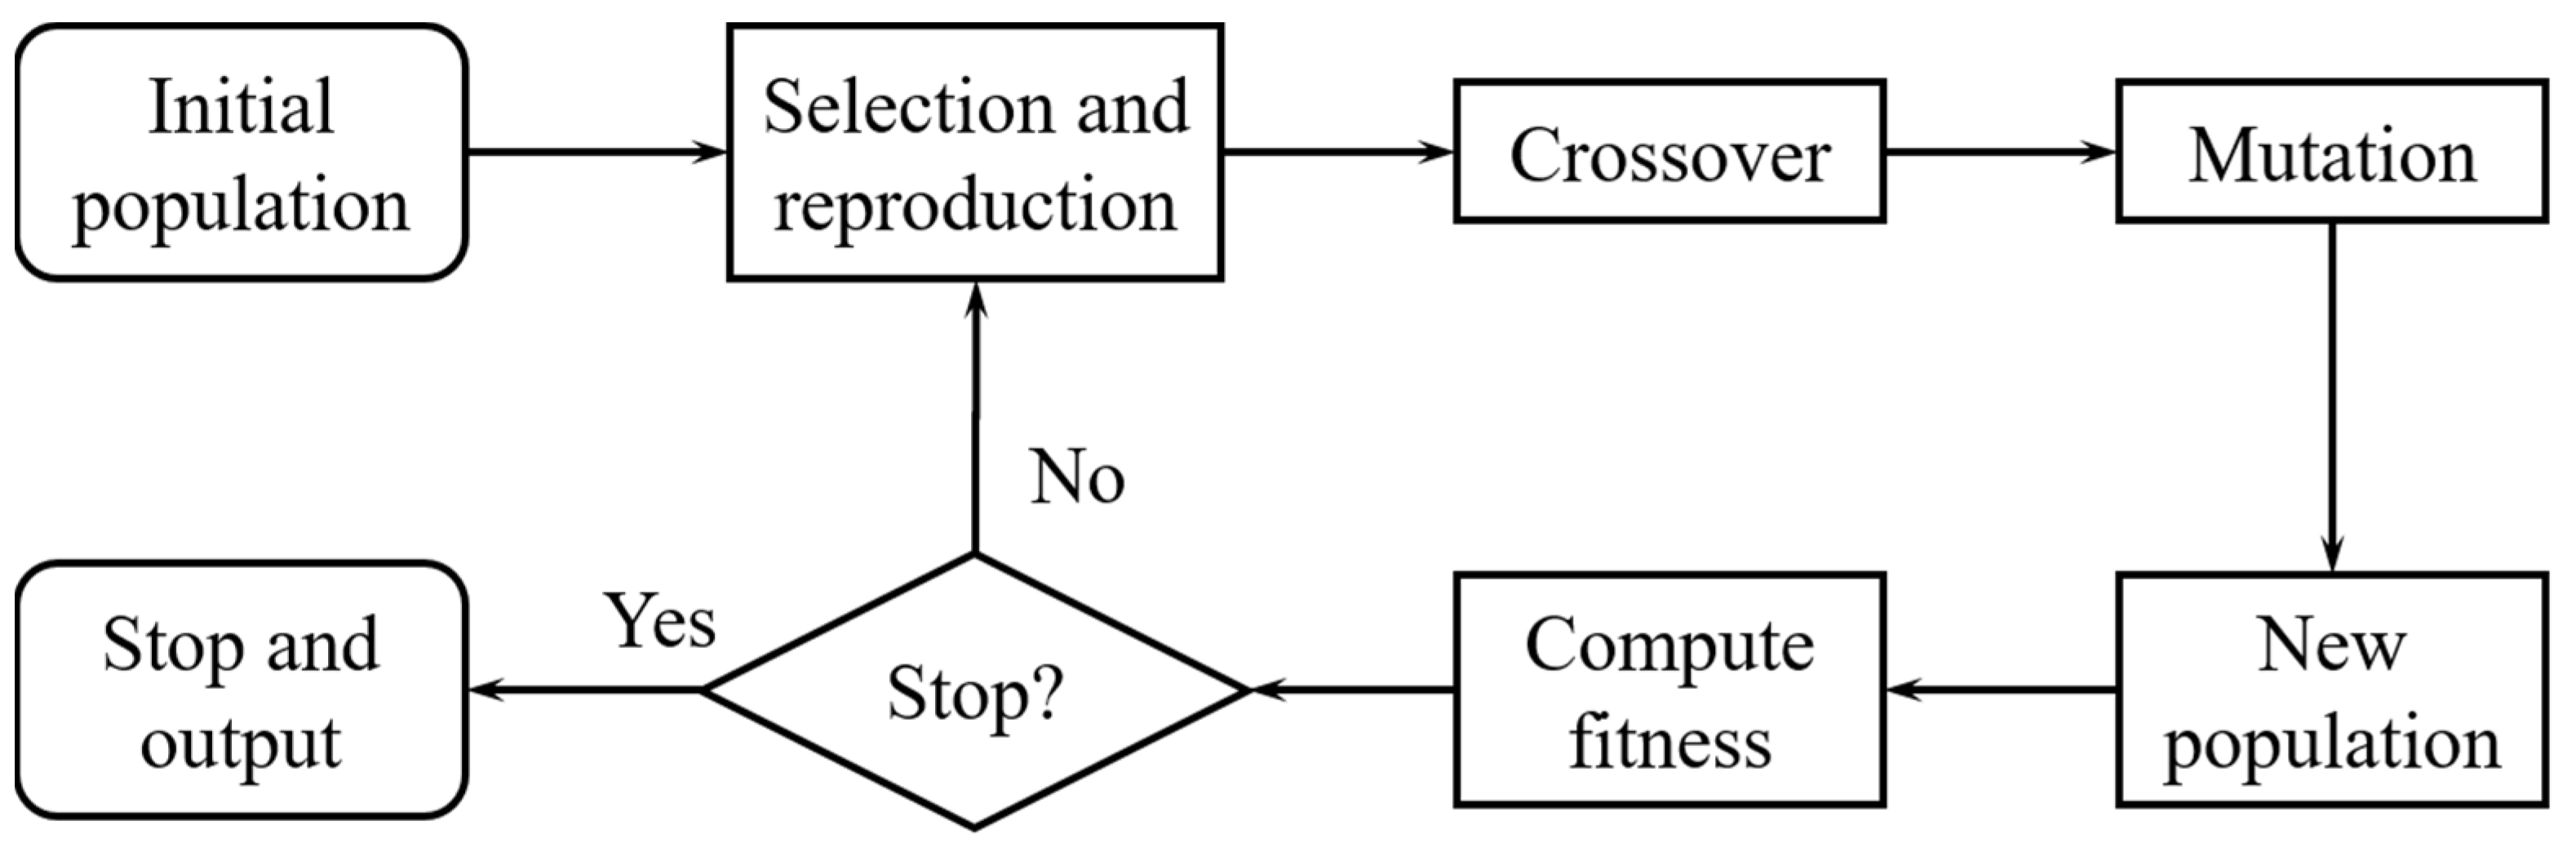
Genetic Algorithm parameters: Genetic algorithm is used for global optimization, the population size is 30, the maximum iteration is 150, the crossover probability is 0.6, the mutation probability is 0.1, and the multiplication algebra is 10. The flow chart of the single objective genetic algorithm is shown in Figure 10.
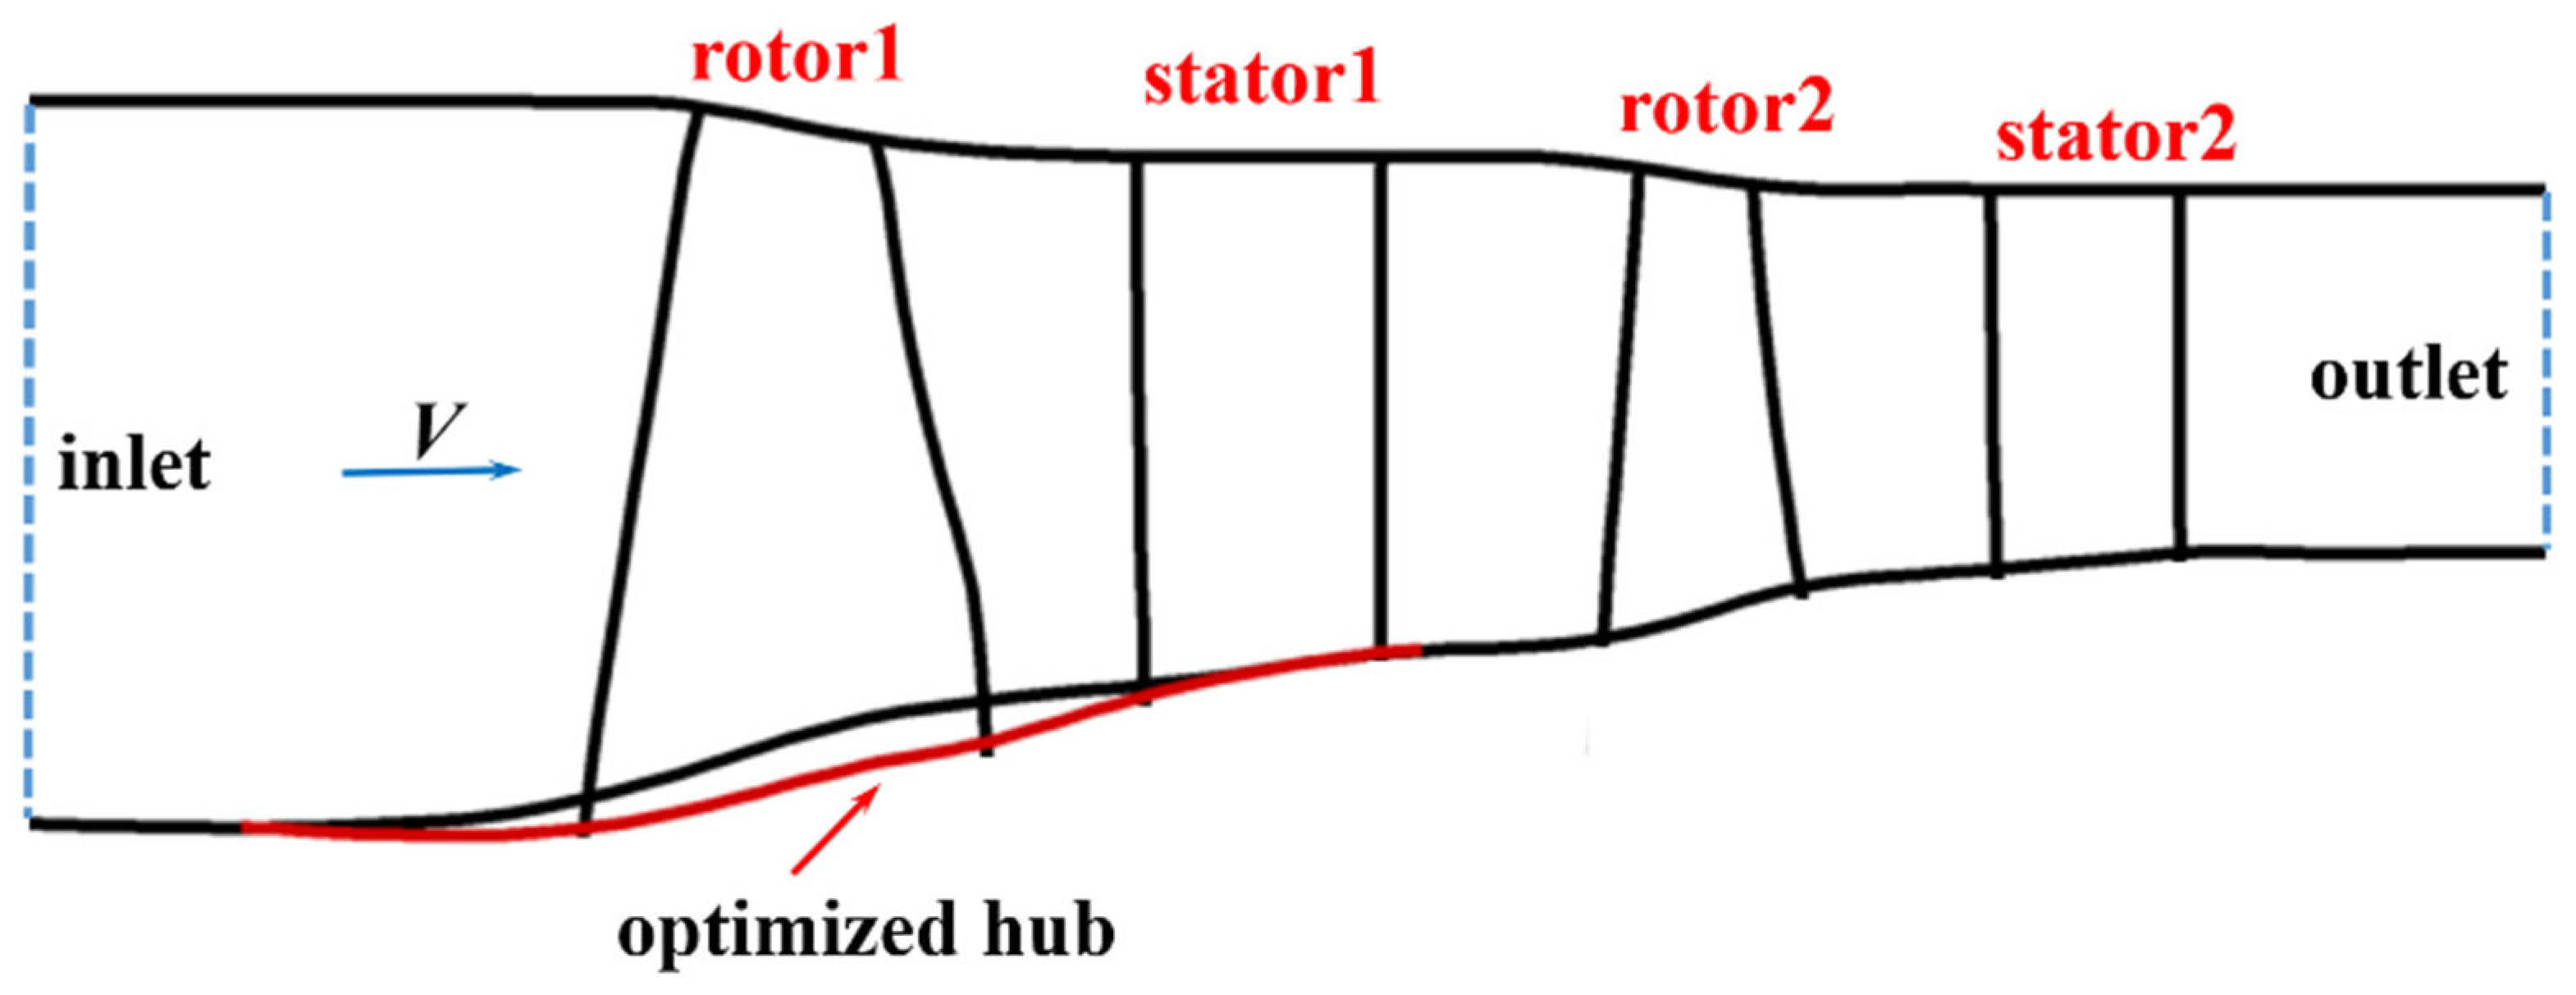
Figure 11 shows the optimized results compared with the redesigned two-stage fan. It is shown that the optimized hub profile possesses a concave construction (negative curvature) in the front part of the hub and the latter part of the hub possesses a convex construction obviously, which is consistent with previous results and explains the reliability of the optimization method proposed in this paper.
The aerodynamic performance of optimized results is compared with the redesigned two-stage fan at the design point, as shown in Table 4. In the following, the simulation results of redesigned fan are named 3D_CFD. The optimized results are named Opt. The NASA experimental data are named Exp. The research results show that the adiabatic efficiency, total pressure ratio, and stall margin of the optimized fan increase a little, because this method only optimizes the hub of the two-stage fan without changing the geometric parameters and aerodynamic parameters of the blades. However, the mass flow rate and choking flow rate increased by 2.66% and 2.72% respectively. It is obtained that the flow rate is more sensitive to the concave construction of the hub, which results in the performance curve shifting to the larger flow. The simulation results in this paper verify the research conclusions in reference [17] that adjusting the concave convex curvature of the end wall can improve the flow field and thus improve the starting performance.
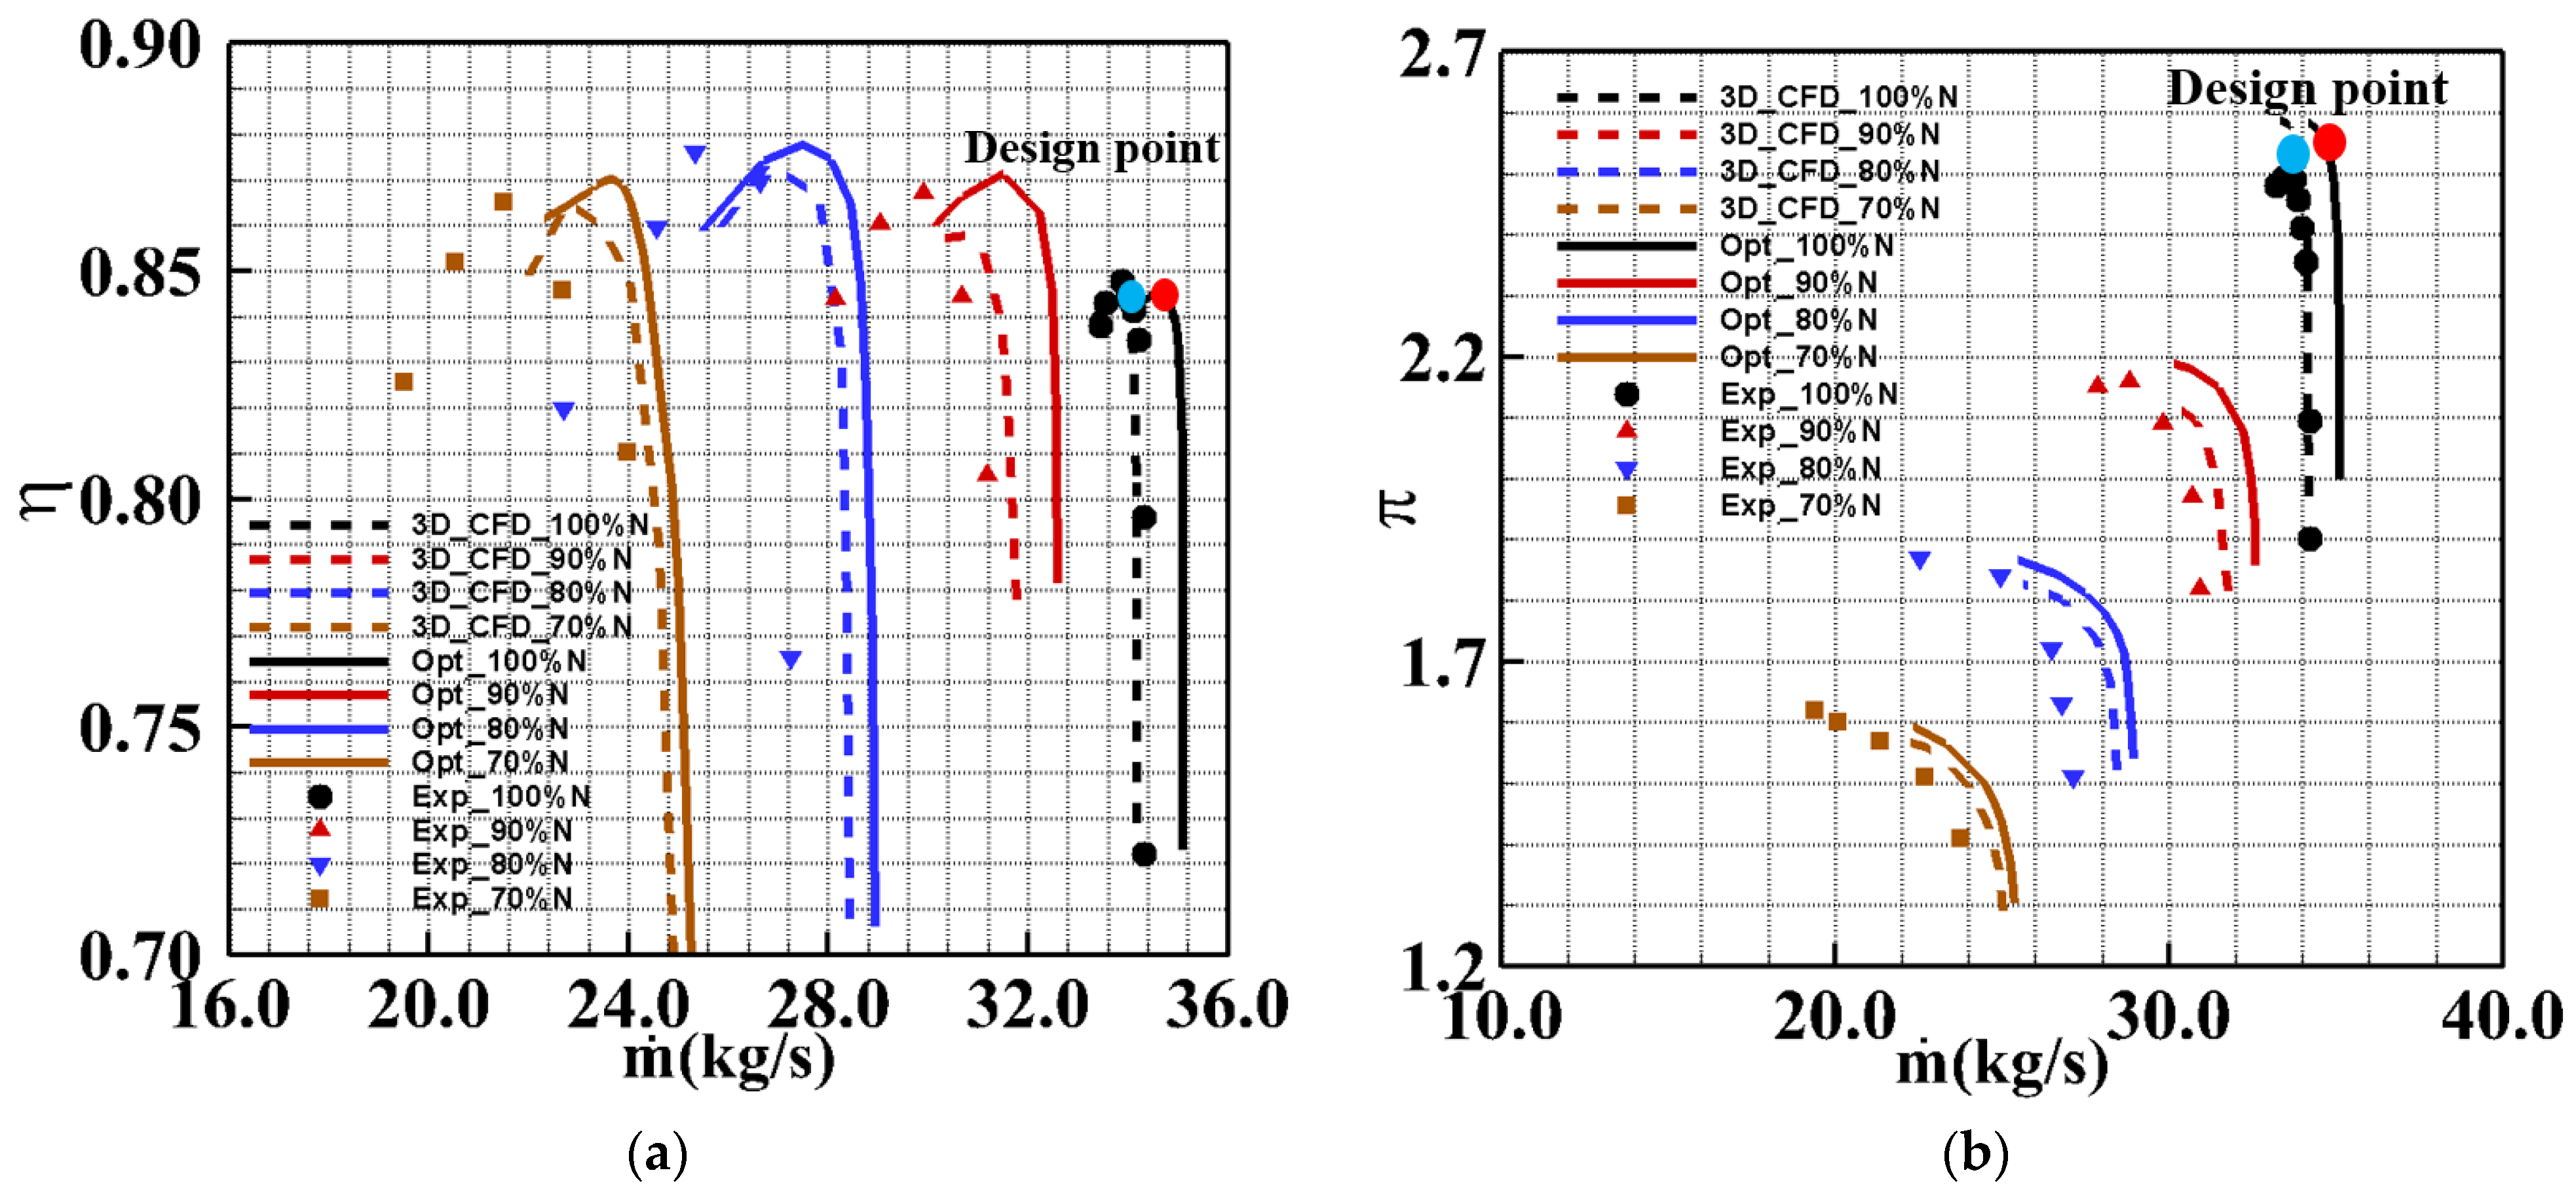
The results of aerodynamic performance curves at different rotational speeds are present in Figure 12. And these optimized results are compared with the redesigned and experimental data. At the design rotating speed, the comparison result shows that the optimized performance curves of the two-stage fan move to the right, that is, chocking mass flow rate has increased, which is very helpful for improving the stall margin of the fan. The total pressure ratio of the two-stage fan is increased, and the total pressure ratio increases by 0.79% compared with the redesigned scheme. At the off-design rotating speed, the adiabatic efficiency and the total pressure ratio are significantly increased compared with the results of the redesigned fan. The above analysis results confirm the improvement of the comprehensive aerodynamic performance of the two-stage fan after end wall optimization, and also verify the feasibility of the end wall optimization method.

4.2. Comparison and Analysis of Flow Detail

The comprehensive aerodynamic performance of the optimized fan is improved, which reflects the feasibility of the end wall optimization method to a certain extent. To deeply analyze the aerodynamic performance and flow field details before and after optimization, this part will analyze the advantages and disadvantages of the fan based on the quasi-3D results and three-dimensional results.
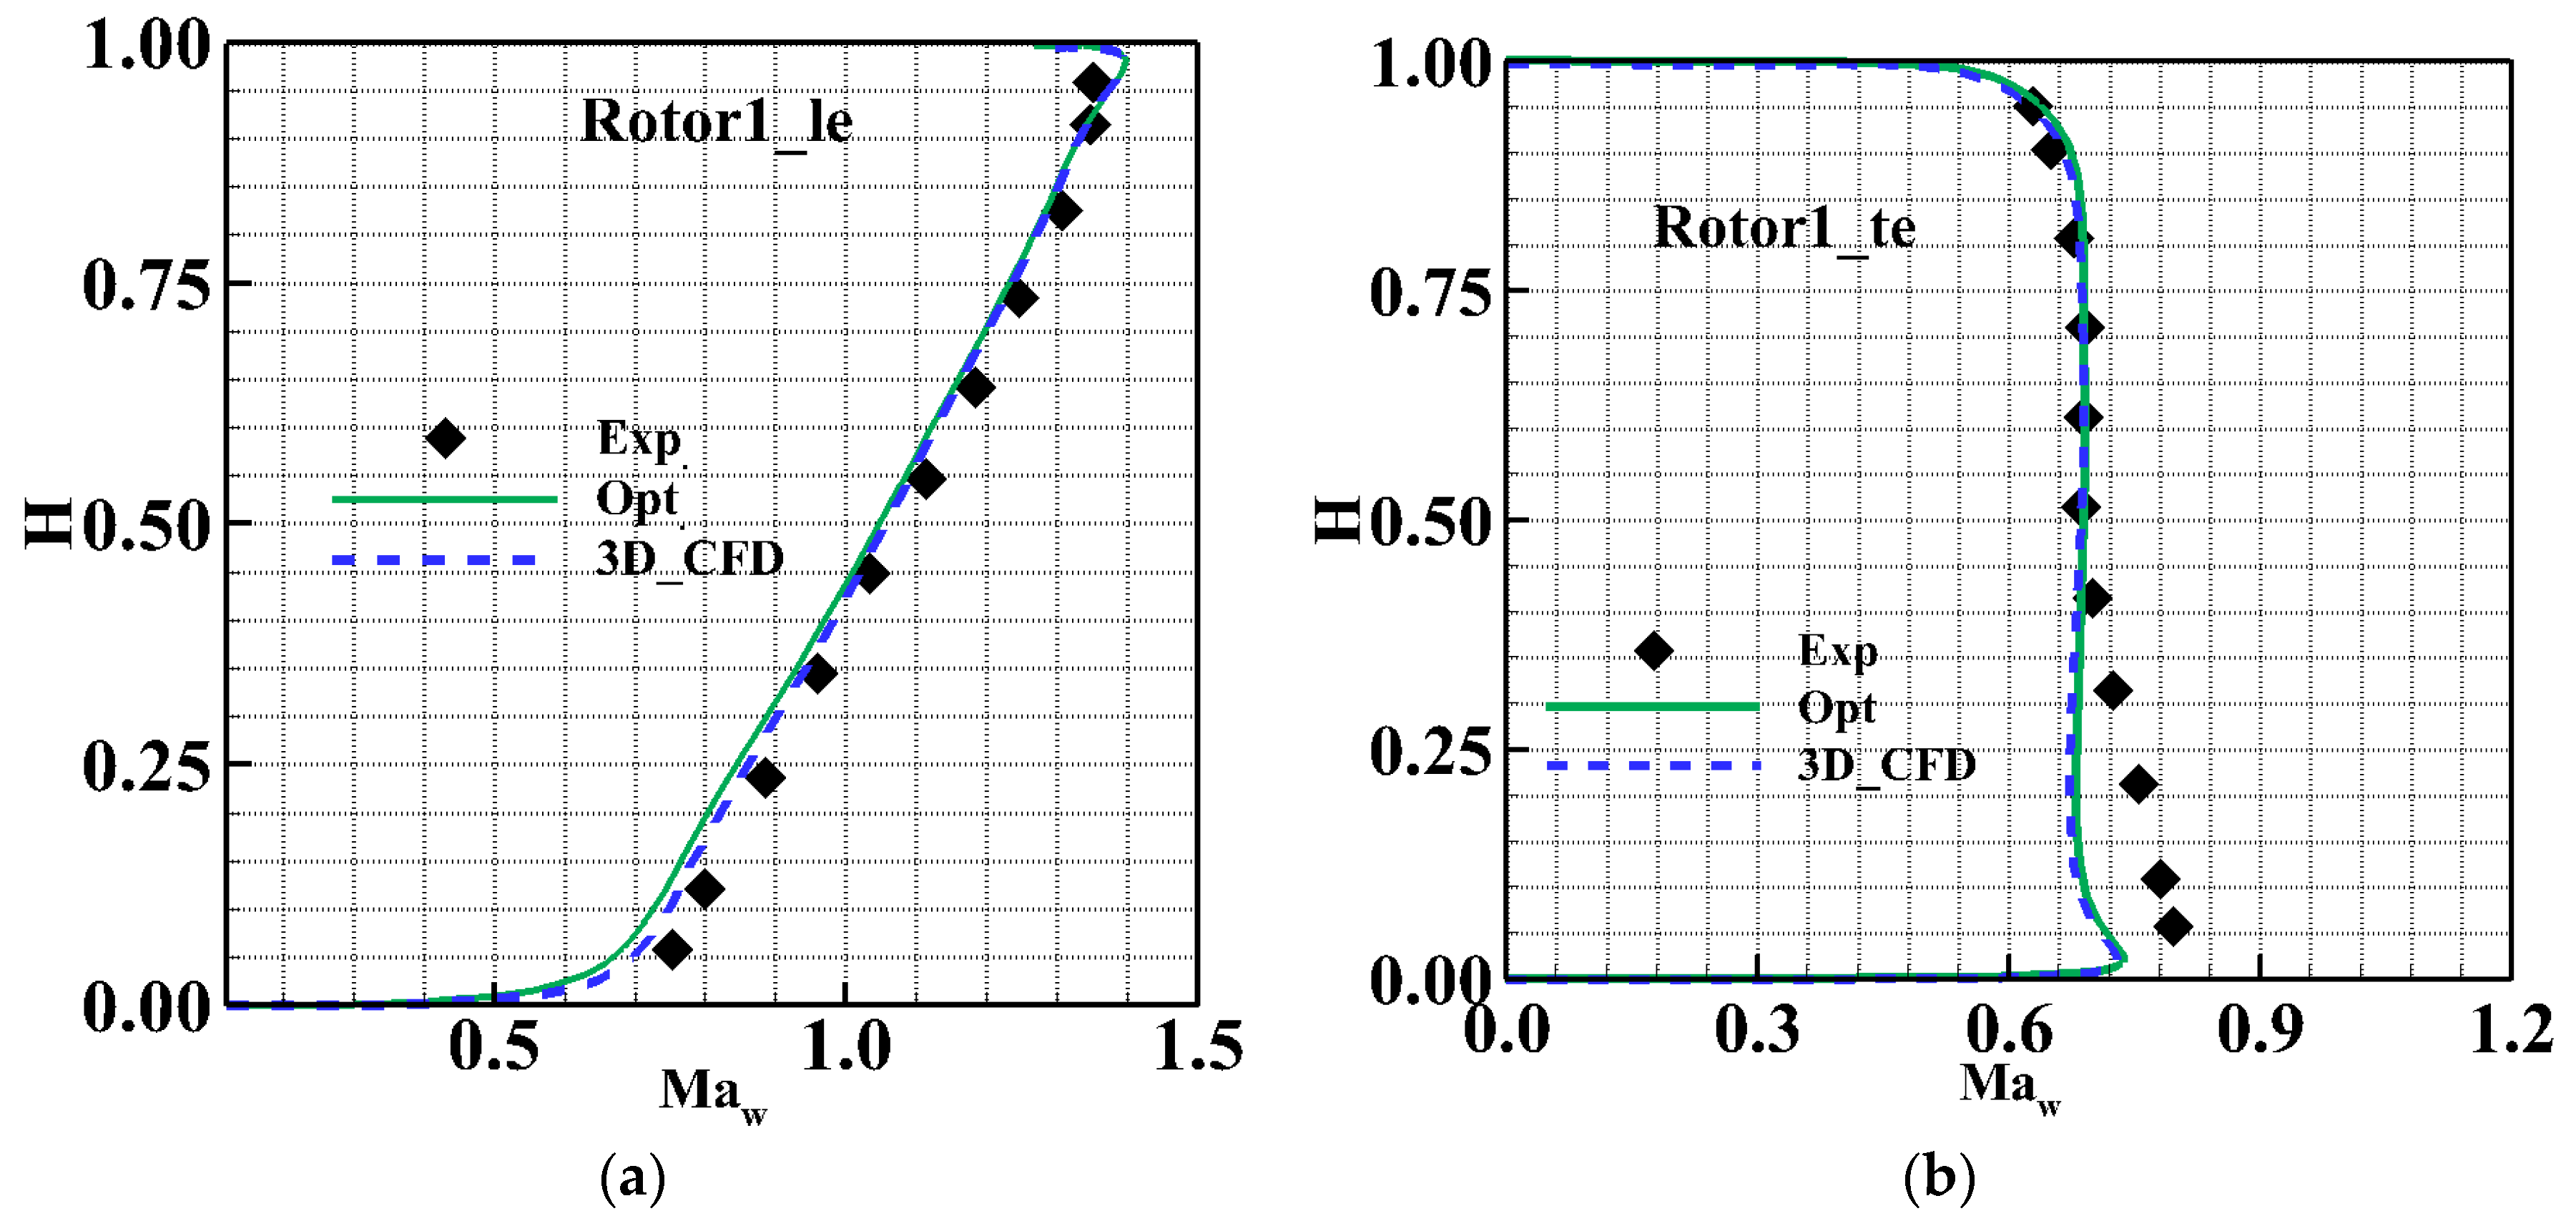
Figure 13 shows the relative Mach number distribution characteristics at different axial positions. H refers to the direction along the blade height, which has been dimensionless. The results show that the relative Mach number at the trailing edge of the rotor1 for the optimized fan is consistent with the redesigned fan and smaller than the experimental data. For transonic fans’ design requirements, a large Mach number in the radial distribution is necessary. Because the larger Mach number will produce a larger flow and higher pressure ratio. However, this does not mean that the larger the Mach number, the greater its efficiency is. The increase of the Mach number will be extremely easy to generate shock waves, which produce irreversible losses. In addition, it can be seen that the Mach number near the hub reduces slightly, and this partial adjustment can control shock waves efficiently and weaken efficiency loss brought by the shock wave well.
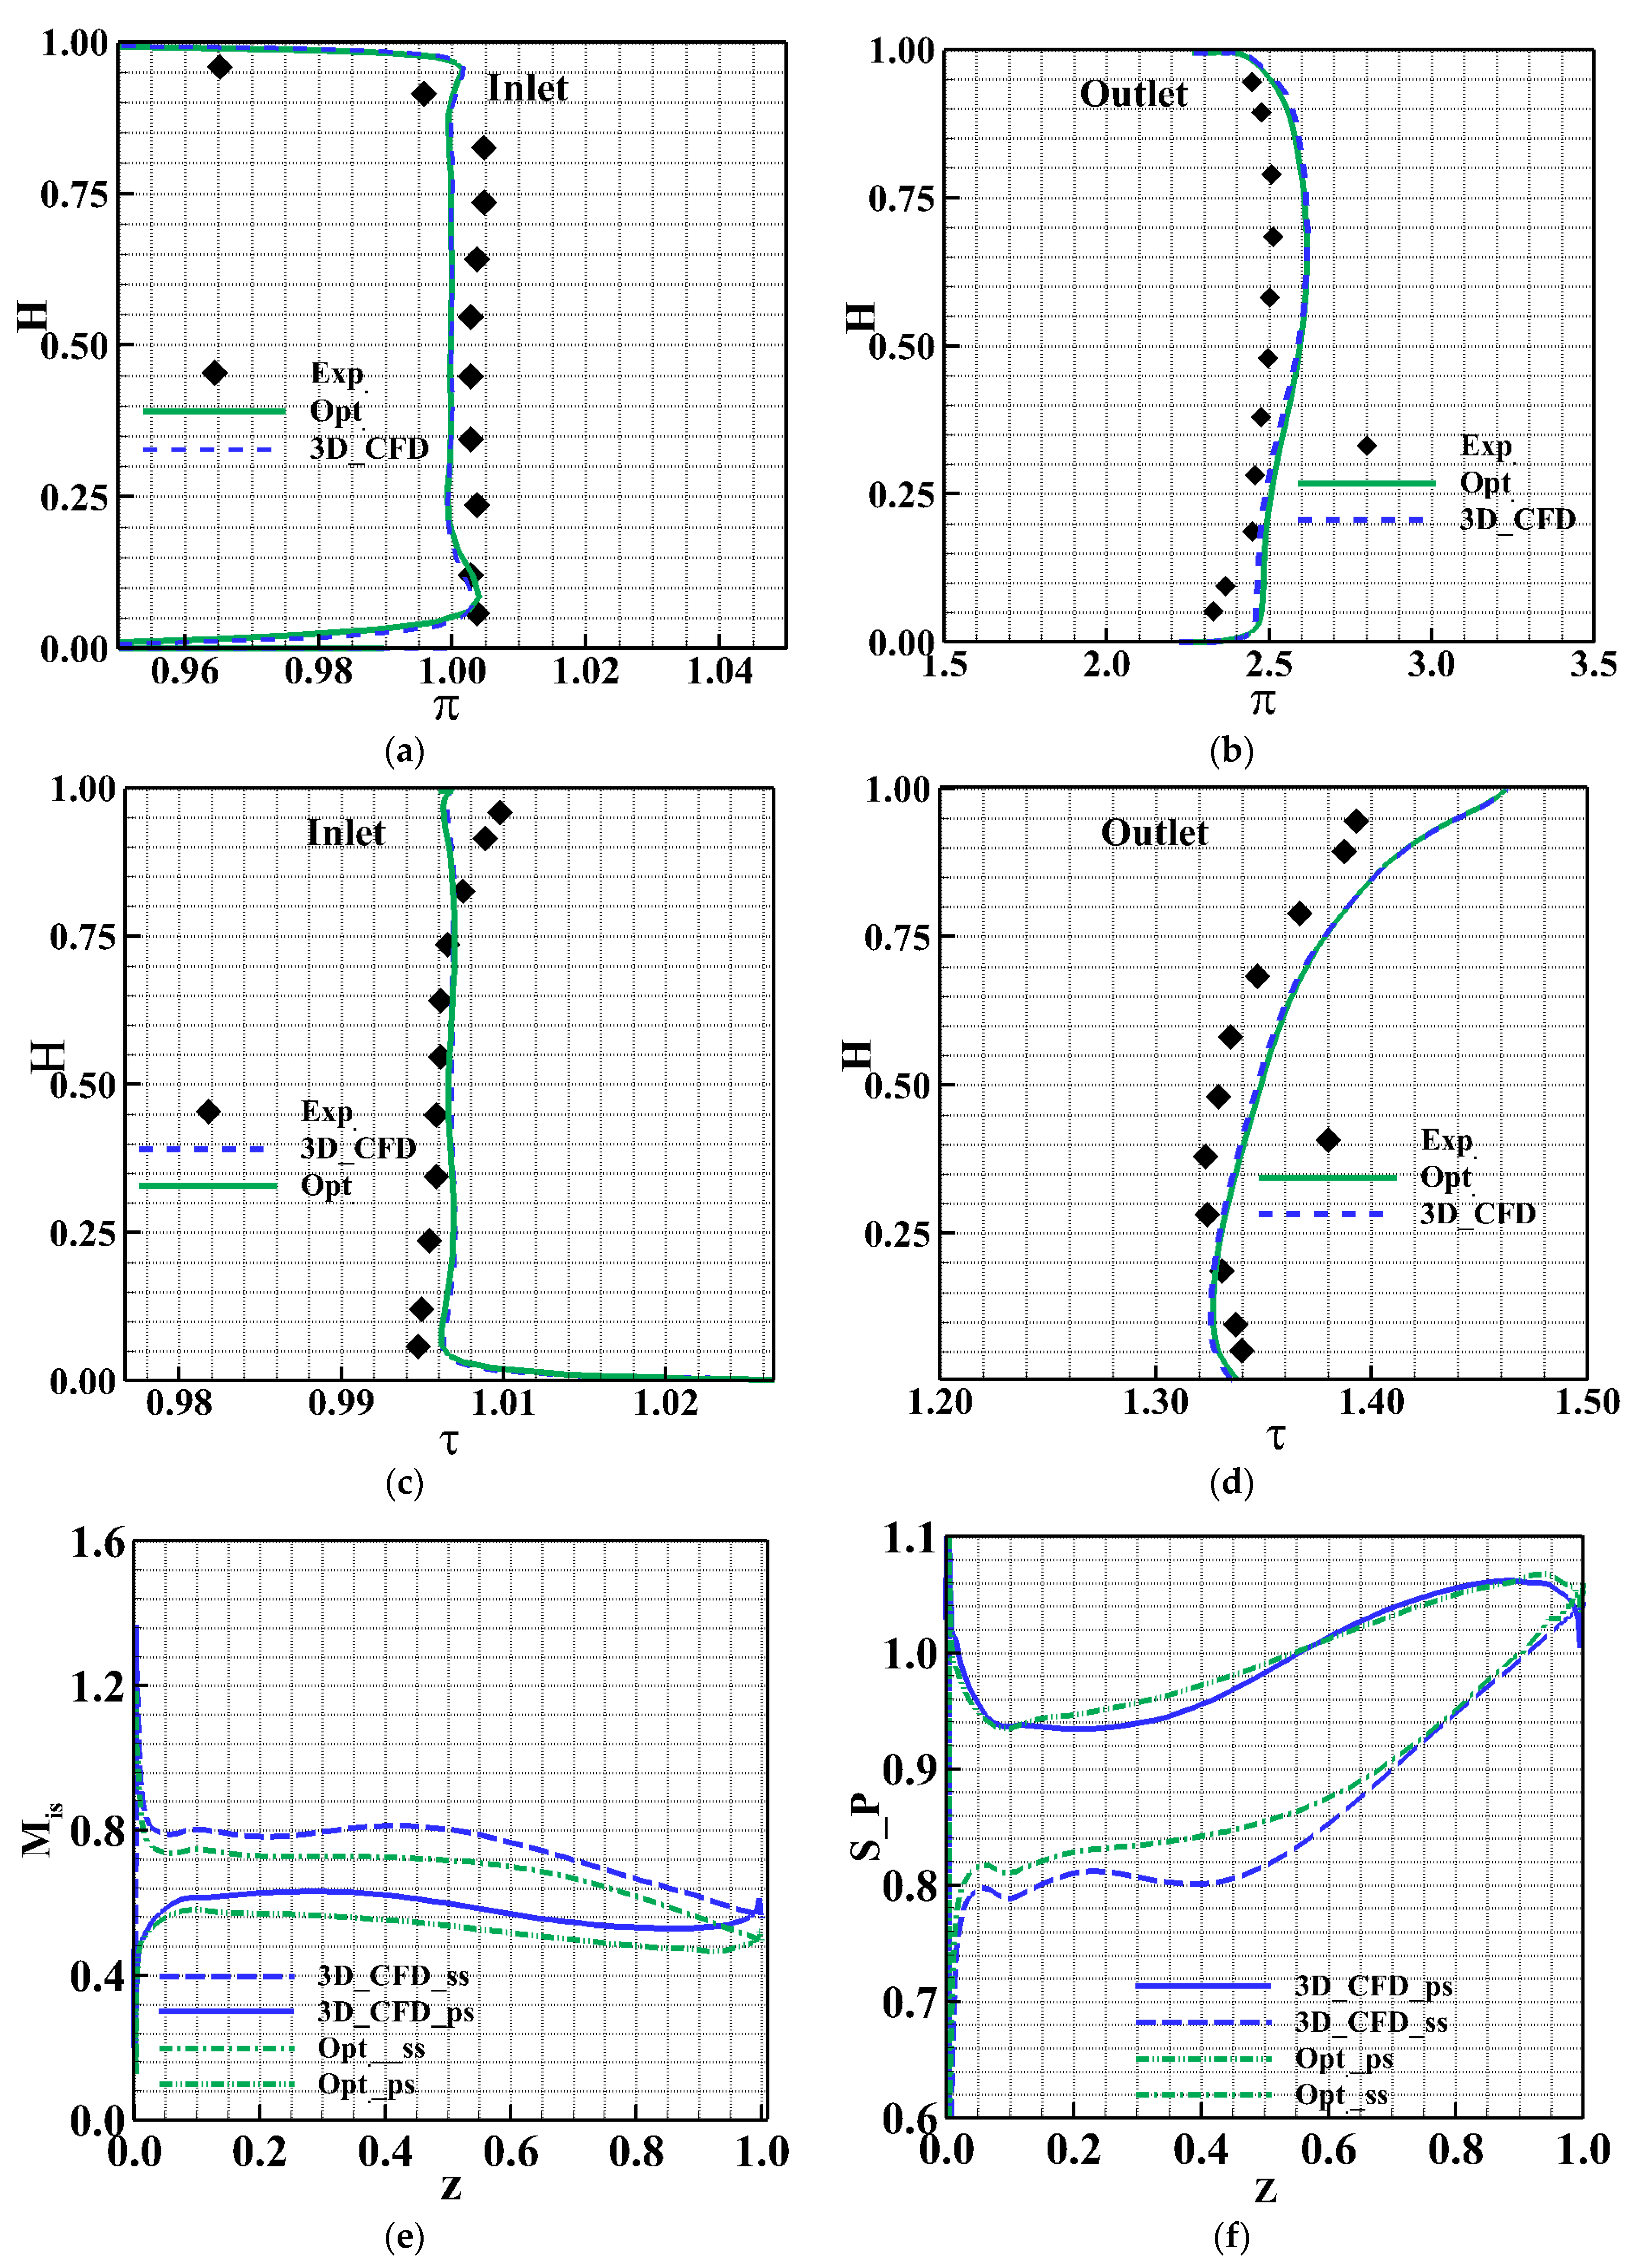
Figure 14a,b show the comparison of the total pressure ratio at the inlet and outlet of the fan before and after optimization. Figure 14c,d presents the comparison of the total temperature ratio at the inlet and outlet of the fan before and after the optimization respectively. The results show that the total pressure ratio and total temperature ratio of the optimized result at the inlet match well with those of the redesigned fan, and there are some differences only near the end wall, which is closely related to the uniform axial flow at the inlet. In most areas of the outlet, the total pressure ratio and total temperature ratio along the spanwise of the optimized result are higher than those of the redesigned fan. But the overall trend of optimized result is consistent with the experimental data, maintaining the pressurization consistency, this law is in line with the actual operation of the fan and also achieves the purpose of optimization.
The most prominent change is the area of the hub corresponding to the rotor1. For this area, it is necessary to carefully study the changes in the flow field structure. Figure 14e,f presents the distribution of the isentropic Mach number and S_P at the 0.5% span section of rotor1 before and after optimization respectively. S_P is the ratio of static pressure to total pressure at the inlet. The dimensionless number is used to facilitate a comparison of the pressure distribution trend. The results show that the S_P of the redesigned fan changes more dramatically along the axial direction. Especially the S_P is reduced clearly when the Z is range from 20% to 40% of the suction surface, which is contrary to the concept of pressurization for the fan. But the S_P increases rapidly when the Z is range from 60% to 100% of the suction surface, which leads to a rapid increase of the inverse pressure gradient. In such a situation, the flow separation is highly likely to be aggravated. After optimization, the S_P is improved smoother relatively. Although compared with the redesigned fan, the total pressure ratio of the rotor1 is not significantly improved. However, the optimized scheme distributes the pressurization load more evenly to the entire range of blade profiles from the leading edge to the trailing edge, instead of rapidly pressurizing in a centralized area, which reduces the situation of excessive local adverse pressure gradient, which also eases the separation of flow, thus turning into efficiency improvement.
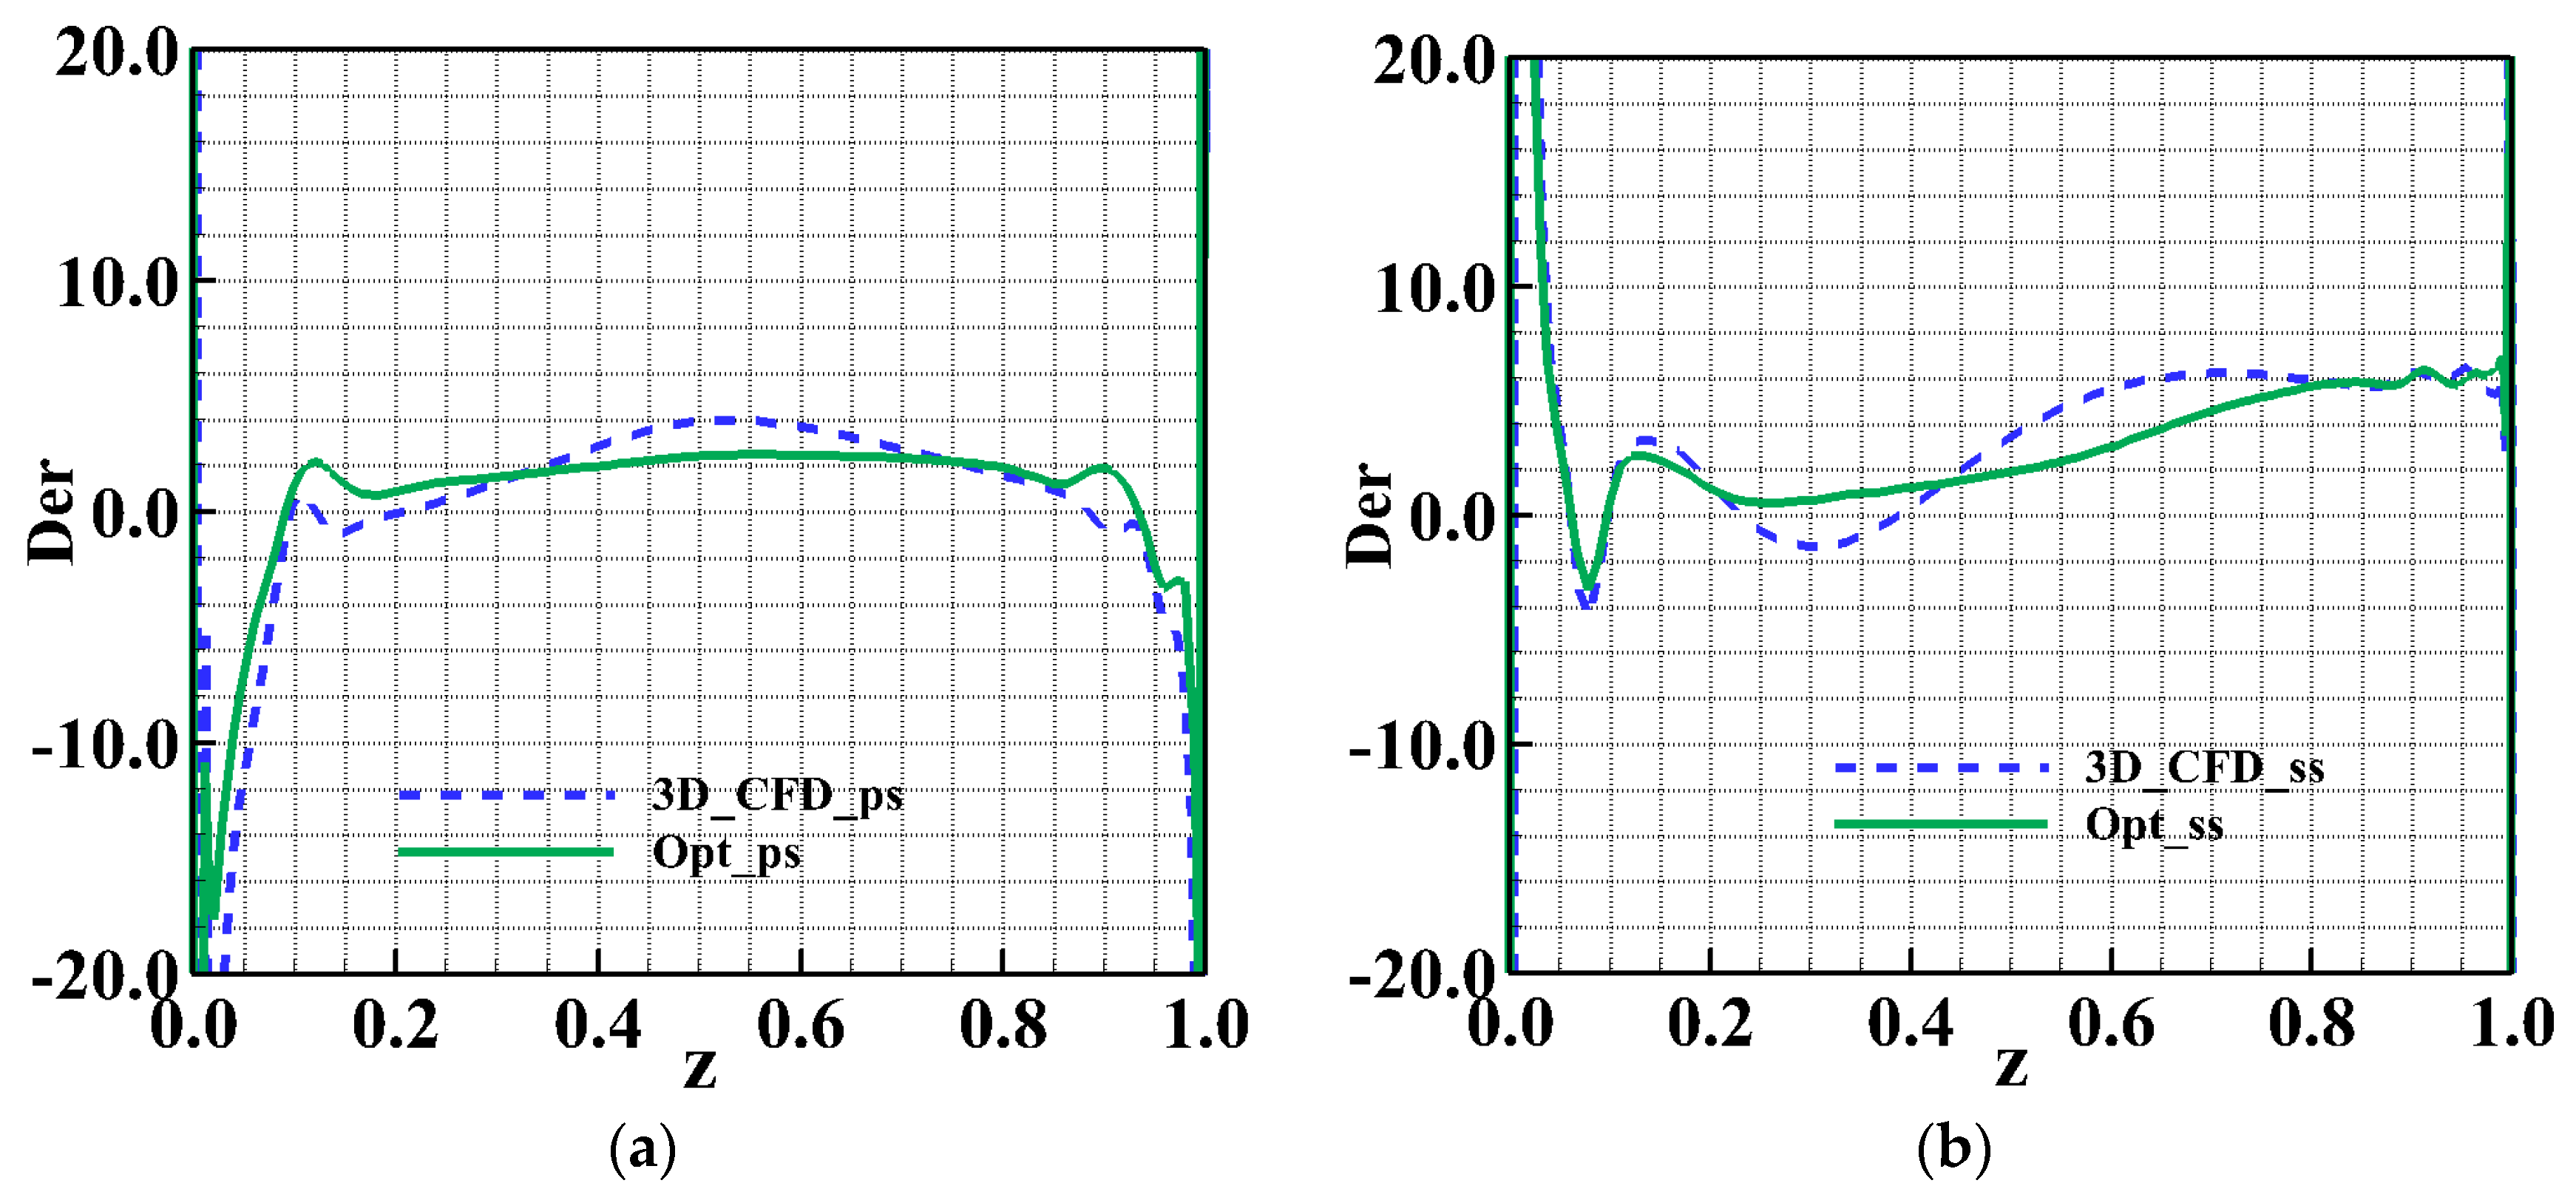
Figure 15 shows the comparison of the first derivative of the static pressure at the 0.5% span section of rotor1 before and after optimization. The research results show that for the redesigned scheme, the first derivative of static pressure is less than zero in the area from the leading edge to 0.5% of the pressure surface and from 5% to 10% of the suction surface, which once again shows that the redesigned fan has depressurized there. Moreover, on the suction and pressure surfaces, the value of the first derivative of static pressure changes greatly along the relative chord length. For the optimized fan, the first derivative of static pressure in the pressure/suction surface waves more weakly, which controls flow separation well and is more suitable for the pressurization mechanism in the physical structure of the fan.
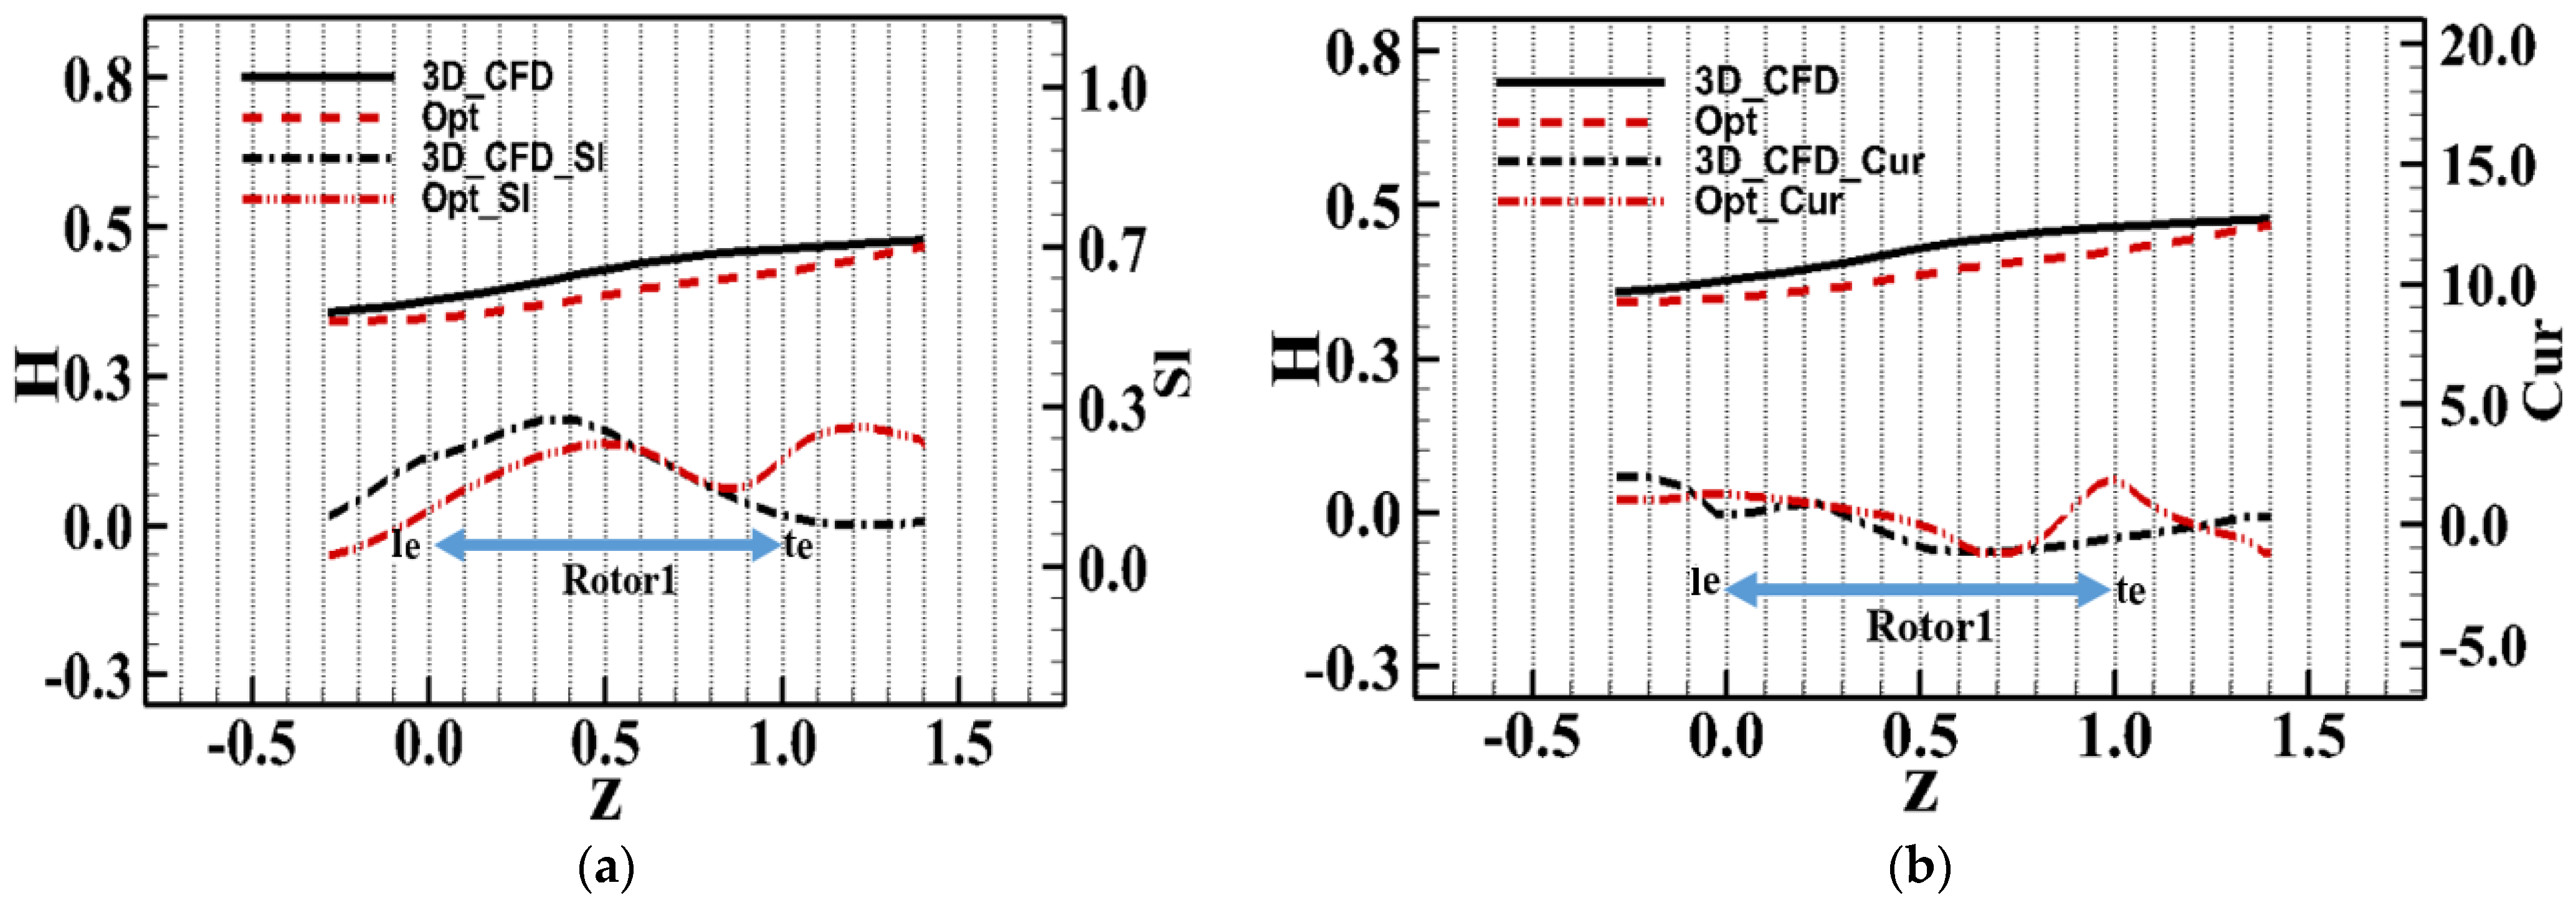
The slope and curvature of the hub in the rotor1 interval are shown in Figure 16. No matter the slope or curvature, the optimized result is smoother than the redesign scheme, which reflects the structural advantages of the optimized hub to better manage flow conditions and ultimately improve the overall aerodynamic performance of the fan.
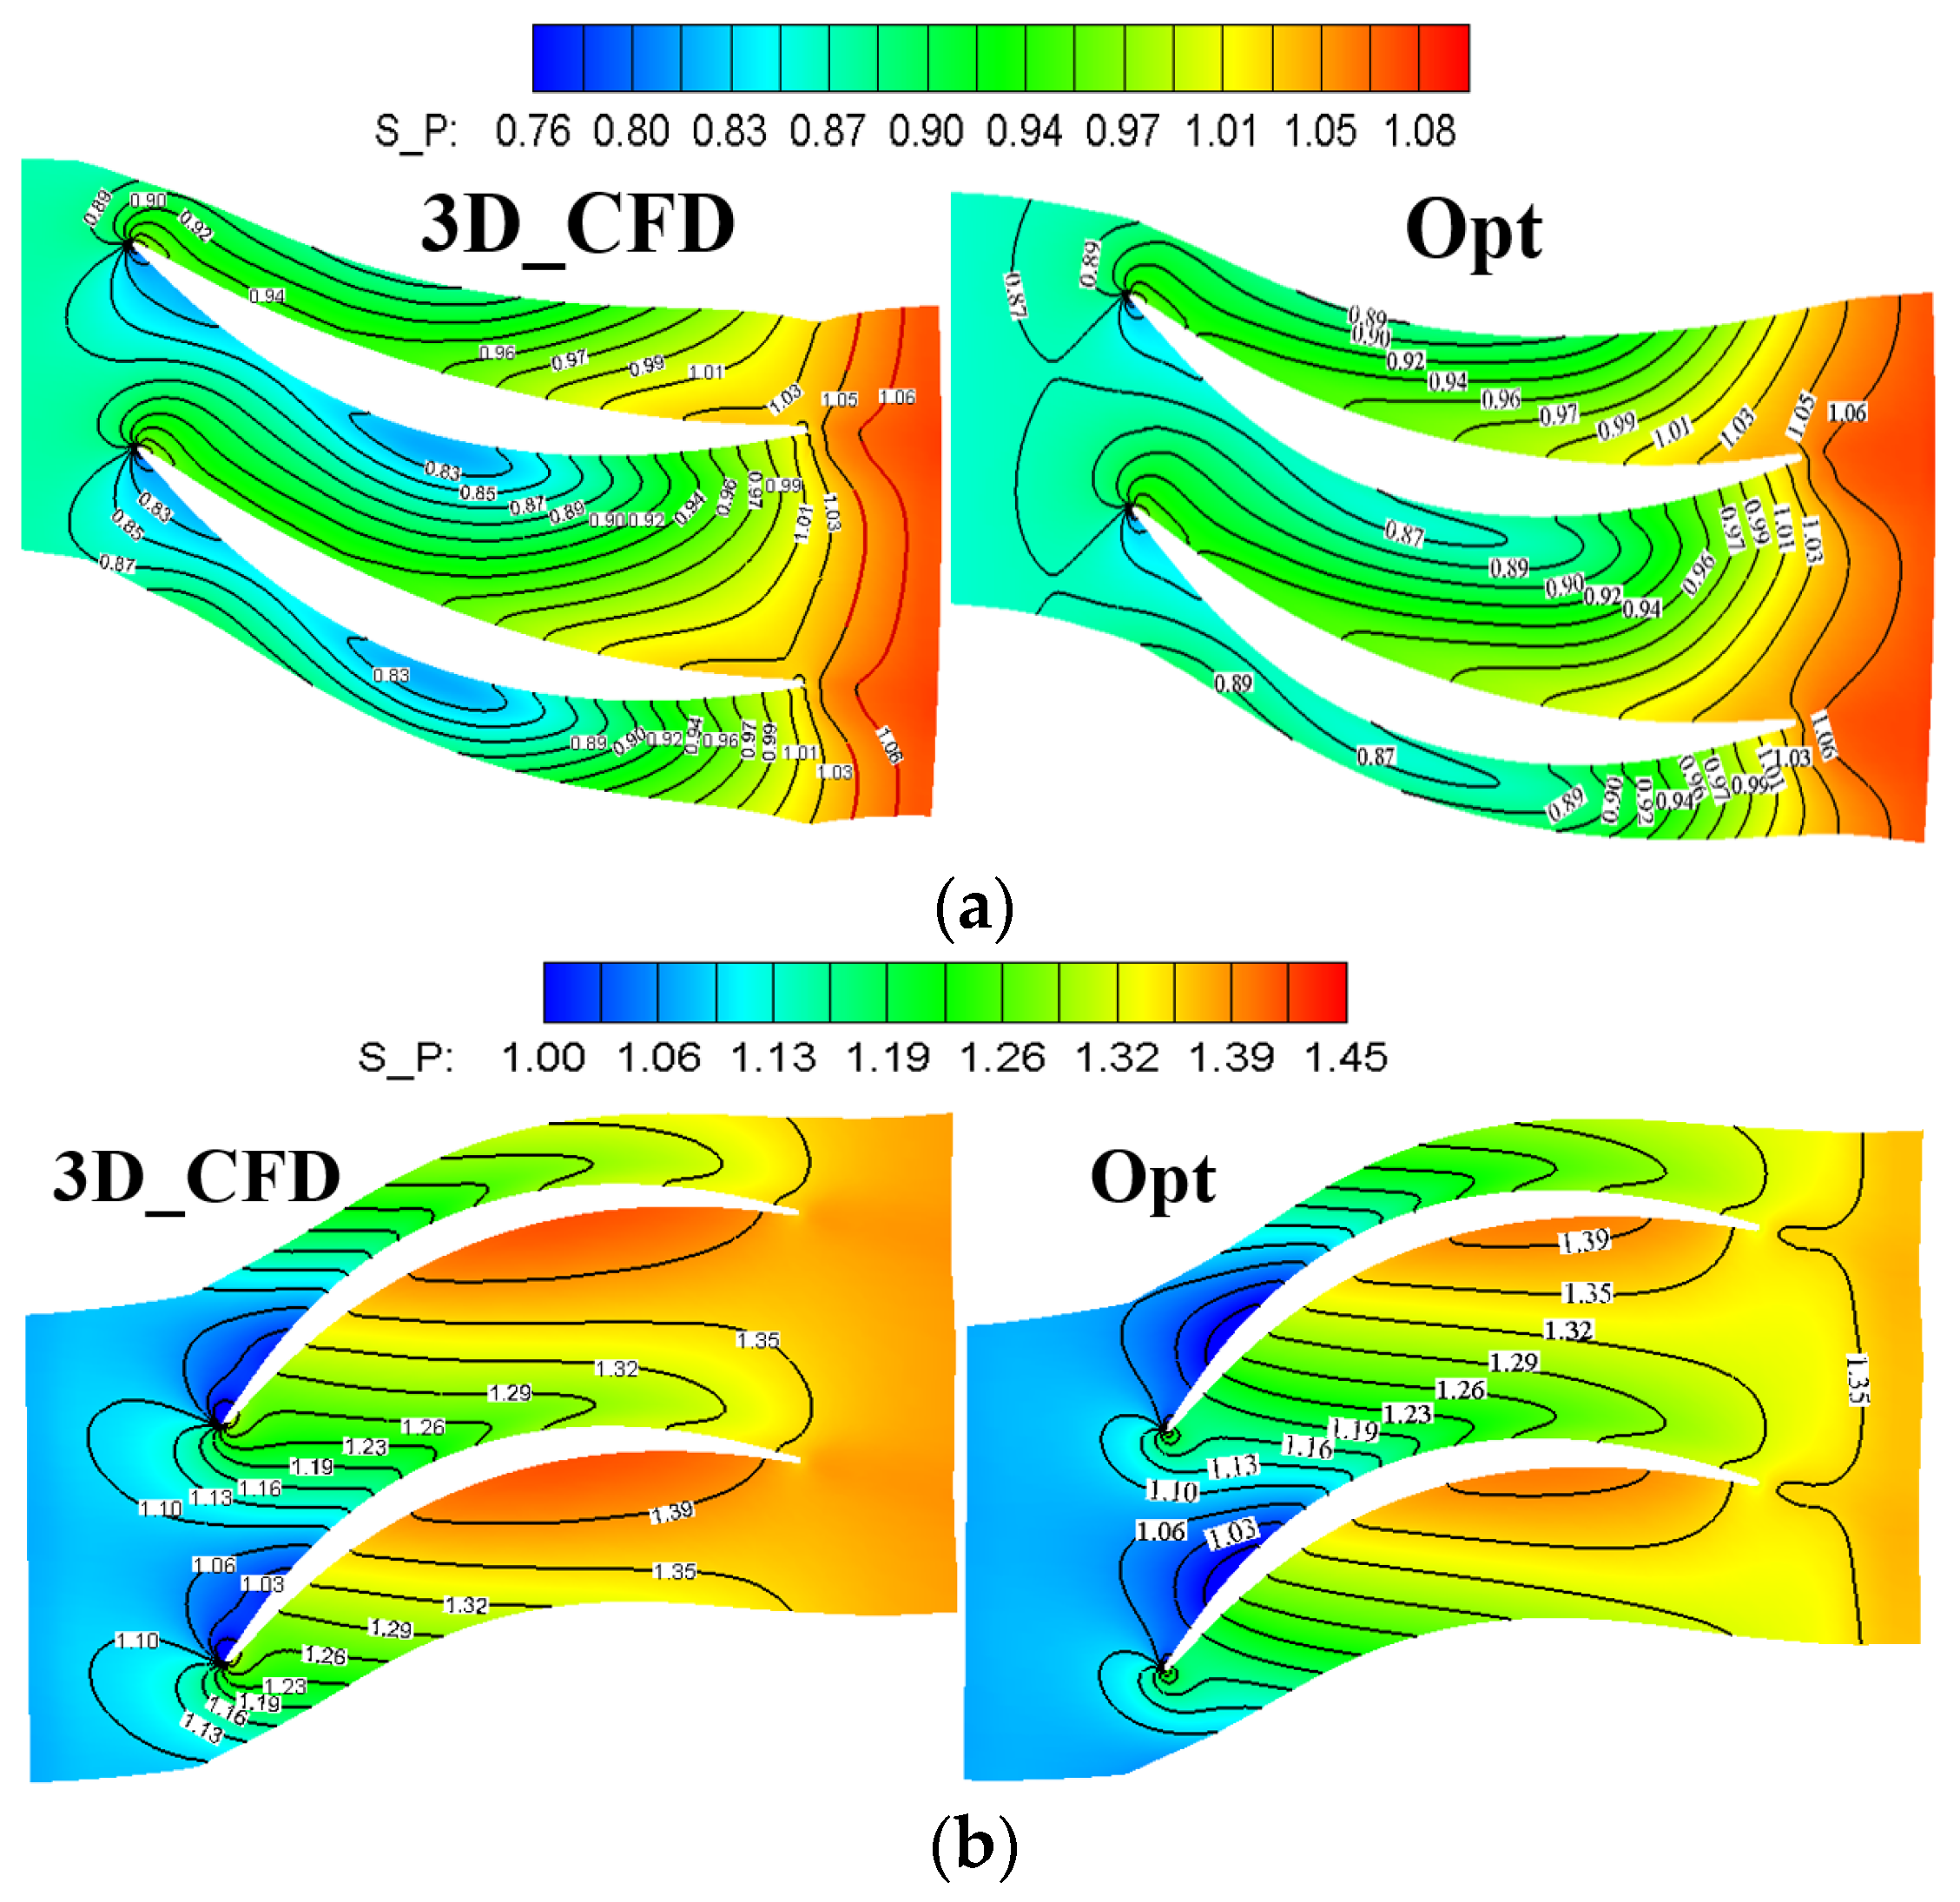
Figure 17 presents the distribution of S_P at the 0.5% span section. The results show that the S_P from the pressure surface to the suction surface is increased uniformly in the rotor1 interval of the optimized fan, which also shows that the chaos degree of vortex in the adverse-pressure passage is reduced. The pressurization effect of the passage is more uniform, and there is no local low-pressure area in the optimized scheme, which is consistent with the S_P trend of the suction surface in Figure 14f. In addition, the decrease in the area of the low-pressure zone also indicates a decrease in airflow separation losses, which helps to improve fan efficiency. After optimization, it is worth noting that the S_P of stator1 decreases, indicating that the pressurization power is insufficient.
To analyze the flow state before and after optimization in many aspects, Figure 18 shows the distribution characteristics of the relative Mach number at the rotor1 outlet under the choking condition. The comparison of the redesigned and optimized results shows that the gradient of the relative Mach number decreases from the hub to the tip region of the optimized fan. The blue area in the figure is located in the wake region, and its area can predict the losses of airflow separation. The larger volume of low energy flow will reduce the through-flow area, which blocks the flow and reduces the aerodynamic efficiency of the fan. After optimization, some low-energy fluid moves to the tip with weakening flow deterioration, and the relative Mach number distribution is more uniform, which will improve the flow quality at the blade outlet. The above discussions also prove that the state of flow in the channel can be improved only through hub modification.
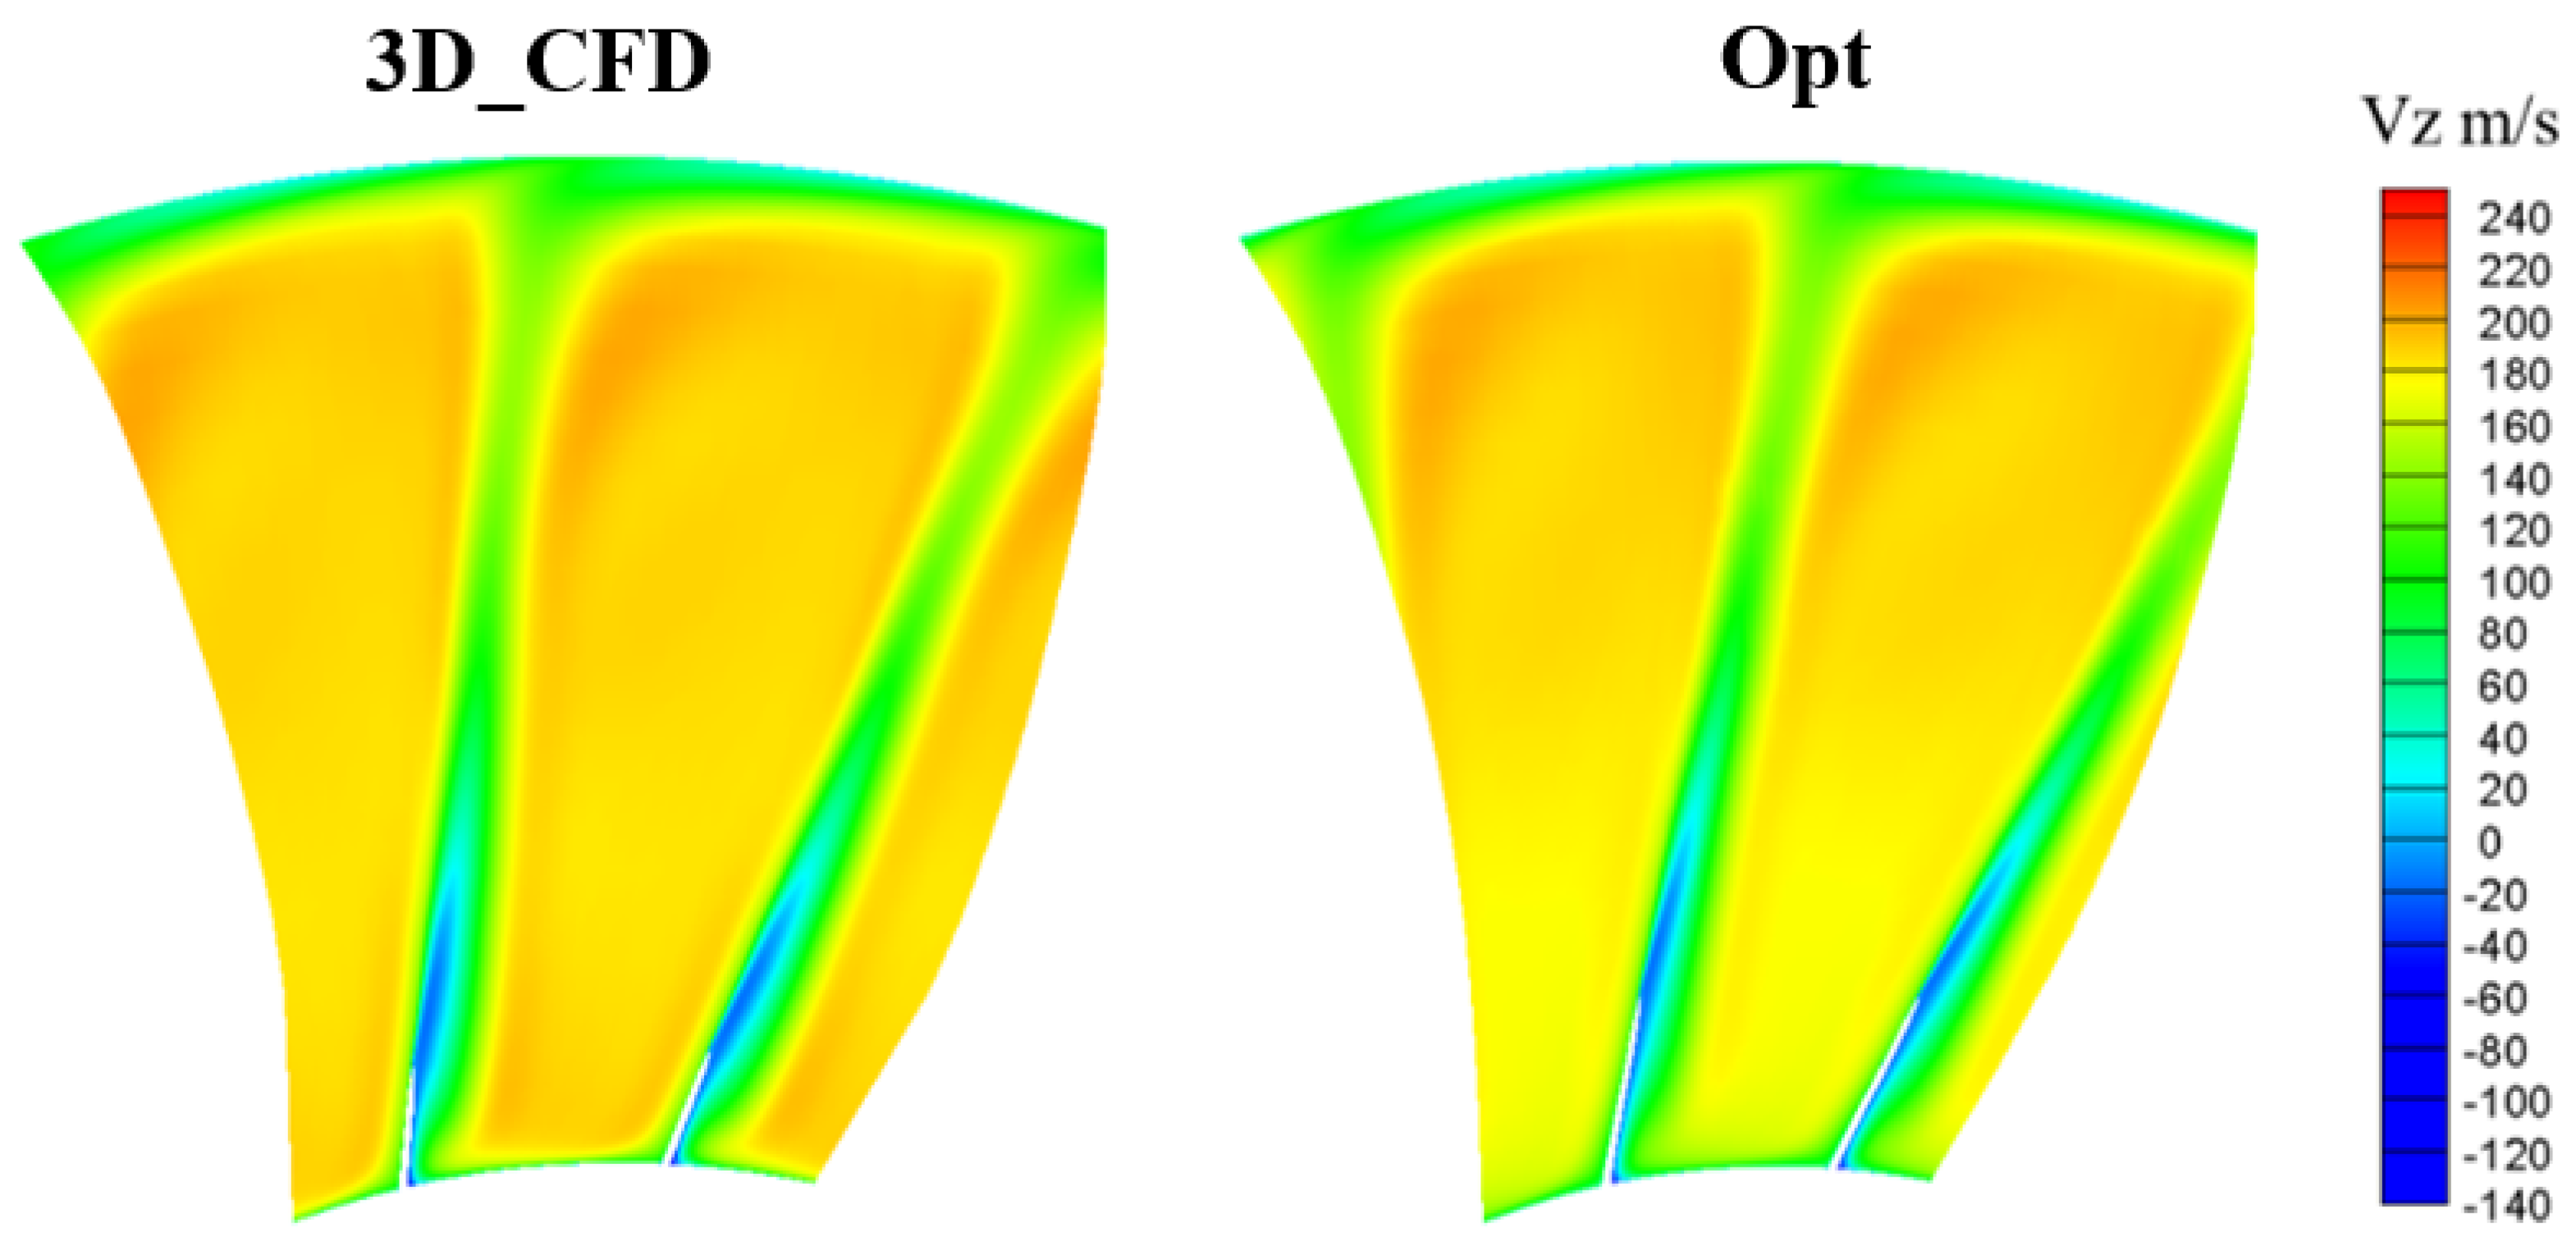
Figure 19 shows the distribution of the axial velocity at the rotor1 outlet before and after optimization. The results show that in the main flow area of the blade passage, the magnitude of axial velocity is basically the same. The axial velocity of airflow near the end wall is obviously lower than that in the main flow area, which is the result of multiple factors such as leakage vortex and passage vortex. The blue area is the separation area of air, where there are large flow losses. After optimization, the migration of low-speed fluid in the hub area towards the blade tip is consistent with the conclusion in Figure 18. The flow condition is improved only in the area near the end wall, but not in the mainstream area of the blade passage. To obtain the flow passage geometry blade with better aerodynamic performance, it is necessary to optimize the three-dimensional geometry of the blade.
Figure 20 shows the distribution of entropy and skin-friction vector lines on the rotor1 suction surface under the choking condition before and after optimization. The results of entropy show that the region from the 50% span section to the tip of the blade is in a state of supersonic flow, and supersonic flow generates the shock wave at the leading edge of the blade. The airflow near the shock wave produces a flow field with high entropy, which reduces the efficiency of the fan. And the entropy gradient before and after the shock wave is larger. In addition. Under the combined action of high-speed rotation and adverse pressure gradient, a secondary flow is formed at the trailing edge of the blade. The flow formed a strong backflow between the trailing edge and the shock wave, and this vortex structure severely limited the flow capacity of the passage. After optimization, the significant decrease in the high entropy production region indicates an increase in efficiency. The secondary flow intensity of the low-velocity fluid mass near the root migrating along the radial direction is obviously weakened. The weakening of the secondary flow in the channel enhances the flow capacity of the blade channel and expands the range of high-efficiency work.
The overall aerodynamic performance of the aero-engine compression system can be increased by optimizing the hub of the axial fan, which is verified by the example above. This optimization method can be also applied to other turbomachinery including axial/radial turbines, pumps, and compressors. In addition, the optimized steps of this method are enough detailed and practical for engineering applications.

5. Conclusions

In this paper, due to the lack of 3D geometric data, Stage 67 is redesigned first and is optimized by means of the quasi-3D end wall optimization method based on stream tube iteration. The whole aerodynamic performance of the optimized fan is improved based on the redesigned results. Therein, the adiabatic efficiency and total pressure ratio of the optimized fan at the design point are increased by 0.04% and 0.79% respectively, and the adiabatic efficiency and total pressure ratio are also improved at the off-design point.
With the diagnosis of the flow influenced by different end wall structures, the flow mechanism analysis in the convex/concave structure of the end wall has been given. In the front part of the domain of the hub for the rotor, the concave structure promotes stream tubes near the hub of the passage to diffuse, and also effectively controls the diffusion of viscous fluid to restrain the radial secondary flow of the low-energy fluid. In the latter part, the convex structure (positive curvature) of the hub accelerates the shrinkage of stream tubes. It can decrease the secondary flow loss and separated flow loss by controlling the boundary layer separation of viscous fluid. The fore-convex and aft-concave structure of the hub profile is good at promoting the aerodynamic performance of the transonic fan.
Furthermore, the quasi-3D end wall optimization method for fans in this paper emphasizes partial optimization for the end wall of fans in the quasi-3D stage, without modifying blade geometry data. The quasi-3D optimization method of the end wall can obviously improve the flow state near the end wall. But, it has little influence on the flow conditions in the mainstream area of the blade passage. The mainstream area of the passage will be optimized by improving the flow angle and the camber line.

Author Contributions

Conceptualization, H.C.; Methodology, T.Y., Z.W. and Y.L.; Software, H.C., Y.L. and P.Y.; Validation, T.Y.; Investigation, P.Y.; Writing—original draft, T.Y.; Supervision, H.C. All authors have read and agreed to the published version of the manuscript.

Funding

This research was funded by the National Science and Technology Major Project (J2019-II-0016-0037).

Institutional Review Board Statement

Not applicable.

Informed Consent Statement

Not applicable.

Data Availability Statement

Not applicable.

Acknowledgments

The authors would like to thank the editor and the reviewers for their helpful comments and suggestions.

Conflicts of Interest

The authors declare no conflict of interest.

Nomenclature

Variables
m ˙ Mass flow rate (kg/s)
NRotational speed (rpm)
T*Total temperature (K)
P*Total pressure (pa)
MaWRelative Mach number
UTangential velocity (m/s)
nHub ratio
rRotor or radius
sStator
FForce
SStreamline
WThe tangential direction of the streamline
ZThe axial direction
PStatic pressure (pa)
CAbsolute velocity (m/s)
CPControl points
VFlow speed (m/s)
HThe spanwise direction
AArea or zone (m2)
VZAxial velocity (m/s)
NSNavier-Stokes
Greek
ηAdiabatic efficiency
πTotal pressure ratio
αAbsolute flow angle (°)
ΔTip clearance (mm)
ϕFlow mass coefficient
ωAngular speed (rad/s)
σAngle (°)
θAngle (°)
τTotal temperature ratio
Subscripts/Superscripts
*Total condition
inInlet conditions
outOutlet conditions
uTangential component
hHub
sShroud
isThe isentropic term
wThe relative term
Abbreviations
1DOne dimensional
Q3DQuasi-three dimensional
3DThree dimensional
S_PStatic pressure/Total pressure at the inlet
DerThe first derivative of static pressure
leLeading edge
teTrailing edge
SlSlope
CurCurvature

References

  1. Otter, J.J.; Goulos, I.; Christie, R. Design and analysis of non-axisymmetric installed aero-engine exhaust systems. Aerosp. Sci. Technol. 2020, 106, 106210. [Google Scholar] [CrossRef]
  2. Jaron, R.; Moreau, A.; Guerin, S. Multidisciplinary Design Optimization of a Low-Noise and Efficient Next-Generation Aero-Engine Fan. J. Turbomach. 2022, 144, 011004. [Google Scholar]
  3. Luo, D.; Sun, X.; Huang, D. Design of 1+ 1/2 counter rotating centrifugal turbine and performance comparison with two-stage centrifugal turbine. Energy 2020, 211, 118628. [Google Scholar] [CrossRef]
  4. Wu, C.H. A general theory of three-dimensional flow in subsonic and supersonic turbomachines of axial, radial, and mixed-flow types. J. Fluids Eng. 1952, 74, 1363–1380. [Google Scholar] [CrossRef]
  5. Novak, R.A.; Hearsey, R.M. A nearly three-dimensional intrablade computing system for turbomachinery. J. Fluids Eng. 1977, 99, 154–166. [Google Scholar] [CrossRef]
  6. Marsh, H. A Digital Computer Program for the Through-Flow Fluid Mechanics in an Arbitrary Turbomachine Using a Matrix Method; Aeronautical Research Council R & M: London, UK, 1968; No. 3509. [Google Scholar]
  7. Shang, E.; Wang, Z.; Su, J.X. IGTC-13 A Perspective and Effective Way to Improve the Compressor Cascade Performance; Gas Turbine Society of Japan: Tokyo, Japan, 1991. [Google Scholar]
  8. Deich, M.E.; Gubalev, A.B.; Filippov, G.A. A new method of profiling the guide blade cascades of turbine stages with small diameter-span ratio. Teploenergetika 1962, 8, 42–46. [Google Scholar]
  9. Ding, X.; Jin, D.; Gui, X. Effect of load distribution at the roots among stages on performance of a high bypass-ratio fan/booster. J. Phys. Conf. Ser. 2018, 1064, 012052. [Google Scholar] [CrossRef]
  10. Wang, Z.; Su, J.; Zhong, J. The effect of the pressure distribution in a three-dimensional flow field of a cascade on the type of curved blade. In Proceedings of the ASME International Gas Turbine & Aeroengine Congress & Exposition, The Hague, The Netherlands, 13–16 June 1994. [Google Scholar]
  11. Mahmood, S.; Turner, M.G.; Siddappaji, K. Flow characteristics of an optimized axial compressor rotor using smooth design parameters. In Proceedings of the ASME Turbo Expo 2016: Turbomachinery Technical Conference and Exposition, Seoul, Republic of Korea, 13–17 June 2016. 2C Turbomachinery. [Google Scholar]
  12. Nemnem, A.F.; Turner, M.G.; Siddappaji, K. A smooth curvature-defined meanline section option for a general turbomachinery geometry generator. In Proceedings of the ASME Turbo Expo 2014: Turbine Technical Conference and Exposition, Düsseldorf, Germany, 16–20 June 2014. 2B Turbomachinery. [Google Scholar]
  13. Corral, R.; Gisbert, F. Profiled end-wall design using an adjoint navier-stokes solver. In Proceedings of the ASME Turbo Expo 2006: Power for Land, Sea, and Air, Barcelona, Spain, 8–11 May 2006; Volume 6, pp. 1363–1372, Turbomachinery, Parts A and B. [Google Scholar]
  14. Hartland, J.; Gregory-Smith, G.; Harvey, W. Nonaxisymmetric turbine end wall design: Part II—Experimental validation. J. Turbomach. 2000, 122, V001T03A050. [Google Scholar] [CrossRef]
  15. Jin, D.H.; Liu, X.W. Optimization of Endwall Contouring in Axial Compressor S-shaped Ducts. Chin. J. Aeronaut. 2015, 28, 1076–1086. [Google Scholar] [CrossRef]
  16. Zheng, X.; Yang, H. End-wall boundary layers and blockages of multistage axial compressors under different conditions. J. Propuls. Power 2017, 33, 908–916. [Google Scholar] [CrossRef]
  17. Hu, S.; Lu, X. Numerical investigation of a high-subsonic axial-flow compressor rotor with non-axisymmetric hub endwall. J. Therm. Sci. 2010, 19, 14–20. [Google Scholar] [CrossRef]
  18. Giacomo, M. Secondary Flow Mitigation in Vanes through Endwall Fence Shape Optimization; Delft University of Technology: Delft, The Netherlands, 2018. [Google Scholar]
  19. Zhang, H.; Chen, S.; Meng, Q. Flow Separation Control Using Unsteady Pulsed Suction Through Endwall Bleeding Holes in a Highly Loaded Compressor Cascade. Aerosp. Sci. Technol. 2018, 72, 455–464. [Google Scholar] [CrossRef]
  20. Donald, C.U.; William, T.G.; Walter, S.C. Performance of Two-Stage Fan Having Low-Aspect-Ratio, First-Stage Rotor Blading; NASA Report; NASA: Washington, DC, USA, 1979; pp. 49–78. [Google Scholar]
  21. Ru-Gen, W.; Jia, H.U.; Chao, Y.U. Research on swecondary flow vortex structure in transonic compressor rotor. J. Propuls. Technol. 2015, 4, 504–512. [Google Scholar]
  22. Dalbert, P.; Wiss, D.H. Numerical transonic flow field predictions for NASA compressor rotor 37. In Proceedings of the ASME International Gas Turbine & Aeroengine Congress & Exposition, Houston, TX, USA, 5–8 June 1995; p. V001T01A090. [Google Scholar]
  23. Bruna, D.; Turner, M.G. Isothermal Boundary Condition at Casing Applied to the Rotor 37 Transonic Axial Flow Compressor. J. Turbomach. 2013, 135, 420–431. [Google Scholar] [CrossRef]
Figure 1. The end wall profile of the 1D design result.
Energies 16 01859 g001
Figure 2. Comparison of performance parameters. (a) Total pressure ratio; (b) Total temperature ratio; (c) The distribution of axis location.
Energies 16 01859 g002
Figure 3. The geometry and grid structure of the two-stage fan.
Energies 16 01859 g003
Figure 4. NASA Rotor 37 aerodynamic performance of the experiment and the simulation. (a) Flow mass rate vs. adiabatic efficiency; (b) Flow mass rate vs. total pressure ratio.
Energies 16 01859 g004
Figure 5. Aerodynamic performance comparison of the experimental results and the simulated results. (a) Adiabatic efficiency; (b) Total pressure ratio.
Energies 16 01859 g005
Figure 6. The forces of the fluid particle in concave and convex hub profiles. (a) concave hub; (b) Convex hub.
Energies 16 01859 g006
Figure 7. Force analysis in the radial balance equation.
Energies 16 01859 g007
Figure 8. The stream map of the optimization platform.
Energies 16 01859 g008
Figure 9. The schematic diagram of the control points’ locations.
Energies 16 01859 g009
Figure 10. The stream map of the single objective genetic algorithm.
Energies 16 01859 g010
Figure 11. The schematic diagram of the optimized hub profile.
Energies 16 01859 g011
Figure 12. The comparison of the aerodynamic performance curves for a two-stage fan at different speeds. (a) Flow mass rate vs. adiabatic efficiency; (b) Flow mass rate vs. total pressure ratio.
Energies 16 01859 g012
Figure 13. The spanwise distribution of relative Mach number in different axial positions. (a) Rotor1_leading edge; (b) Rotor1_trailing edge.
Energies 16 01859 g013
Figure 14. The spanwise distribution of aerodynamic parameters. (a)The total pressure ratio at the inlet; (b) The total pressure ratio at the outlet; (c) The total temperature ratio at the inlet; (d) The total temperature ratio at the outlet; (e) The isentropic Mach number at the 0.5% span section of rotor1; (f) The static pressure at the 0.5% span section of rotor1.
Energies 16 01859 g014
Figure 15. The first derivative of static pressure at the 0.5% span section of rotor1. (a) The pressure surface; (b) The suction surface.
Energies 16 01859 g015
Figure 16. The slope and curvature of the hub in the rotor1 interval. (a) The slope of the hub; (b) The curvature of the hub.
Energies 16 01859 g016
Figure 17. The cloud chart of static pressure at the 0.5% span section. (a) Rotor1; (b) Stator1.
Energies 16 01859 g017
Figure 18. The distribution of relative Mach number under the choking condition.
Energies 16 01859 g018
Figure 19. The distribution of the axial velocity at rotor1 outlet under the choking condition.
Energies 16 01859 g019
Figure 20. The distribution of entropy and skin-friction vector lines on the rotor1 suction surface.
Energies 16 01859 g020
Table 1. The design data of the two-stage fan.
Design ParametersValues
Stage number2
Design flow rate m ˙ (kg/s)33.248
Corrected design angular velocity N (rpm)16,042.8
Inlet total temperature T * (K)288.15
Inlet total pressure P * (Pa)101,325.0
Outlet absolute flow angle αout (deg)0.0
Outlet absolute Mach number M0.442
Tangential speed at L. E. of the rotor tip U (m/s)428.9
Relative velocity at L. E. of the rotor tip W (m/s)458.4
Clearance at Rotor1 tip Δ (mm)0.4
Tip flow coefficient of rotor ϕ0.491
Hub/tip ratio at the inlet of the first rotor ν0.705
The number of blades (r1, s1, r2, s2)(22, 34, 38, 42)
Table 2. Grid independence verification at the design point.
CaseTotal Grid Cell NumberPerformance Parameters
Efficiency ηTotal Pressure Ratio π m ˙
11,943,7400.84152.51033.42
22,098,4280.84352.52133.66
32,252,7880.84512.54433.82
42,450,4480.84532.55033.86
52,581,8960.84532.54833.85
Table 3. Grid independence verification at choke condition.
CaseTotal Grid Cell NumberPerformance Parameters
Efficiency ηTotal Pressure Ratio π m ˙
11,943,7400.72531.76033.79
22,098,4280.72711.76934.00
32,252,7880.72921.79234.18
42,450,4480.72941.79334.20
52,581,8960.72931.79334.21
Table 4. The comparison of aerodynamic performance.
Different
Programs
3D_CFD ResultsOpt ResultsValues
Differences
Percentage
Differences
Different
Parameters
Design pointAdiabatic efficiency η84.51%84.55%0.04%0.04%
Total pressure ratio π2.542.560.020.79%
Mass flow rate m ˙ (kg/s)33.8234.720.902.66%
Choking mass flow rate m ˙
(kg/s)
34.1835.110.932.72%
Stall mass flow rate m ˙ (kg/s)33.4134.010.61.80%
Disclaimer/Publisher’s Note: The statements, opinions and data contained in all publications are solely those of the individual author(s) and contributor(s) and not of MDPI and/or the editor(s). MDPI and/or the editor(s) disclaim responsibility for any injury to people or property resulting from any ideas, methods, instructions or products referred to in the content.