Article

How Applicable Are Turbulence Assumptions Used in the Tidal Energy Industry?

1
King’s Buildings Campus, University of Edinburgh, Edinburgh EH8 9YL, UK
2
College of Engineering Mathematics and Physical Sciences, University of Exeter, Exeter EX4 4QF, UK
3
The Charles Clouston Building ORIC, European Marine Energy Centre, Back Road, Stromness KW16 3AW, UK
4
Fundy Ocean Research Centre for Energy, 1156 W Bay Rd, Parrsboro, NS B0M 1S0, Canada
*
Author to whom correspondence should be addressed.
Energies 2023, 16(4), 1881; https://doi.org/10.3390/en16041881
Submission received: 18 January 2023 / Revised: 9 February 2023 / Accepted: 10 February 2023 / Published: 14 February 2023
(This article belongs to the Section A3: Wind, Wave and Tidal Energy)

Abstract

:
As tidal current and marine hydro-kinetic energy converters start to be deployed in pre-commercial arrays, it is critical that the design conditions are properly characterised. Turbulence is known to influence fatigue loads and power production, so developers use turbulence models to generate unsteady flows in order to simulate device performance. Most such models construct a synthetic flow field using a combination of measured parameters and theoretical assumptions. The majority in use today are based on atmospheric flow conditions and may have limited applicability in tidal environments. In the present work, we compare key turbulence model assumptions (which are recommended by the tidal turbine standards and are used in design software) to turbulence measurements from two tidal test sites in Scotland and Canada. Here, we show that the two sites have different levels of conformity to theoretical models, with significant variability within nearby locations at the same site. The agreement with spectral models is shown to be depth-dependent. The vertical component spectrum is better represented by the Kaimal model, while the streamwise spectrum is better represented by the von Kármán model. With the exception of one site, the shear profiles follow a power law, although with a different exponent to that commonly assumed. Both sites show significant deviations from the theoretical length scales and isotropy ratios. Such deviations are likely to misrepresent the loads experienced by a device. These results highlight the turbulence characteristics at real deployment sites, which are not well represented by current models, and, hence, which must be determined using field measurements.

1. Introduction

Tidal energy could meet a significant portion of electricity requirements, with an estimated exploitable tidal stream resource of 11.5 GW in the UK and 35 GW in Canada alone [1,2]. Tidal energy can also provide a viable, competitive solution for remote islands and areas where access to energy is difficult. The technology development has recently received a significant boost when the UK Government announced a dedicated tidal stream allocation under its Contracts for Difference (CfD) scheme—the UK government’s main mechanism for supporting low-carbon electricity generation [3]. However, the risks associated with the durability of these relatively new technologies are not yet fully understood and can lead to conservative designs, driving up costs [4].
To be commercially viable, tidal-energy converters (TECs) must endure up to 25 years in the water without requiring major overhaul or repair [5]. Several studies [5,6,7,8,9,10] highlight that turbulence, as well as other sources of unsteady loading, can significantly impact fatigue life and power output, affecting the device’s commercial viability. Power quality and energy yield are both affected by turbulence, the latter because a dynamic controller will sacrifice energy yield for power quality during turbulent flow [6,11].
There are two main sources for tidal turbine design guidelines: IEC 62600 Technical Specifications [12] and the DNVGL-ST-0.164: Tidal turbines standard [13]. Both sources provide limited information on the treatment of turbulence-induced loading. Typically, where direct measurements are not available, it is recommended to use semi-analytical models for the velocity shear profile, turbulence spectrum and spatial coherence. Such models are often based on atmospheric flow conditions and may have limited applicability in tidal environments. Recommendations from standards are also implemented in commercial software, such as Tidal Bladed and OpenFAST/TurbSim. These tools and guides were originally developed for wind energy and, hence, many of the recommendations are aligned with the wind standard (BSI Standards Publication: Wind energy generation systems IEC 61400 [14]). Tidal-flow turbulence will have different characteristics to atmospheric flows due to boundary-layer effects, tidal cycles, density and other factors. Using atmospheric-based models may present additional uncertainty in tidal turbine load simulations. In this paper, we aim to clarify the applicability of the key turbulence models typically used in the industry.

2. Review of Models

Commercial codes, such as Tidal Bladed, construct a turbulent flow field from a set of measured or assumed input parameters, as illustrated in Figure 1. The flow field is advected past the rotor area which defines the velocity vector at each calculation point at the rotor at each time instant. This is then used as input for the blade element momentum (BEM) model calculations. The key input parameters for the flow field are explained in this section.

2.1. Frequency

2.1.1. Turbulence Spectrum

The turbulence spectrum expresses how the turbulence energy is distributed among various frequencies. Typically, this would be represented by a model spectrum, which is a function of the current magnitude U, variance σ u 2 and length scales, L. The Kaimal and von Kármán spectra are the most commonly used models in commercial codes and guides. These semi-empirical forms use coefficients applicable to atmospheric boundary-layer flows. Length scales can be specified by the user or theoretical values may be applied. The models are defined in the variance-preserving format as follows:
Kaimal : f S u ( f ) σ u 2 = 4 f L u K / U ¯ ( 1 + 6 f L u K / U ¯ ) 2 ) 5 / 3 ,
von Kármán : f S u ( f ) σ u 2 = 4 f L u V K / U ¯ ( 1 + 70.8 ( f L u V K / U ¯ ) 2 ) 5 / 6 .
The Kaimal spectrum has the same form for v and w components as in Equation (1), but with different length scales. The von Kármán form for components i = v , w is:
f S i ( f ) σ i 2 = 4 f L i V K / U ¯ ( 1 + 755.2 ( f L i V K / U ¯ ) 2 ) ( 1 + 283.2 ( f L i V K / U ¯ ) 2 ) 11 / 6 .
Isotropy describes the degree to which turbulence is statistically invariant under rotations. The anisotropy ratio, α is given by Equation (4) and ranges from 0 for extremely anisotropic turbulence to 0.5 for isotropic turbulence [16].
α = σ w σ u + σ v
Isotropy is implied when using the von Kármán model [17]; the Kaimal model assumes an anisotropy ratio, σ u : σ v : σ w = 1 : 0.8 : 0.5 .
Tidal Bladed provides options to use either the von Kármán, Kaimal or Mann models for generating turbulent flows, while TurbSim allows the use of Kaimal or von Kármán, as well as some other case-specific, atmospheric turbulence spectra.

2.1.2. Spatial Coherence

Spatial coherence describes the correlation of the streamwise fluctuations across a separation distance, r, at each distinct frequency.
The IEC wind standard provides an empirical model of streamwise coherence [14], which can be used with the Kaimal or von Kármán model spectra. This IEC coherence model is used in codes such as Tidal Bladed and TurbSim. The model is a function of the average current magnitude, U length scales, L u and separation distance, r and is defined as:
C u ( Δ r , f ) = e x p 8.8 Δ r 0.12 L u 2 + f U ¯ 2 .

2.1.3. Length Scales

The length scale, L is defined qualitatively as the size of the most energetic eddies in a turbulent flow [18]. Length scale values are required as input into the spectral and coherence models. Tidal Bladed and TurbSim give the option to use the default values or user input length scales [19]. The default values for the IEC models define the streamwise length scale, L u = 8.10 Λ U , where Λ U = 0.7 × min (30 m, hub height), in line with the IEC 61400-1 wind standard [15,20]. The default length scale values are based on atmospheric flows and tend to ignore the upper limit on eddy size imposed by the air–water interface [21].
Another way to estimate the length scale is according to open-channel flow theory, where the measured turbulent length scales across the lower half of the water column can be approximated as L u z H , where z is the relative elevation from the sea bottom [22].

2.1.4. Mean Velocity Profile

The shear profile of the velocity normal to the seabed in a tidal race constitutes a high Reynolds number turbulent boundary layer. The DNVGL-ST-0.164: Tidal turbines standard states that, when detailed field measurements are not available, the variation in sub-surface current velocity with depth may be modeled as a simple power law, where the exponent α is typically taken as 1 / 7 :
U c , s u b ( z ) = U r e f ( d + z h r e f ) α for z 0 .
It does, however, caution that, in some cases, where more complex current speed shear profiles are featured, log-law or parabolic profiles could be observed [13]. Tidal Bladed recommends the use of the 1/7th-power-law profile but provides functionality to change the exponent value.

2.1.5. Turbulence Intensity

Turbulence intensity, I, is a term adopted from the wind industry and is a measure of the magnitude of fluctuations as a percentage of the mean flow velocity: [23]:
I t o t a l = 1 3 u 2 + v 2 + w 2 u ¯ × 100
I u = u 2 u ¯ × 100 = σ u u ¯ × 100
Tidal Bladed and TurbSim use the standard deviation (or turbulence intensity) for each velocity component to scale the velocity fluctuations. They typically allow input of only the hub height value, neglecting any variation across the rotor.

3. Literature Review

A number of studies have attempted to validate the models described in the preceding section against tidal-flow measurements.
Comparisons of the Kaimal and von Kármán spectrum models to measurements generally show an agreement with the shape of the curve; however, the peak of the spectrum is often not aligned. Moreover, there is no agreement on which model is more appropriate for tidal flows. Comparing the two models to ADCP data from the Grand Passage in Nova Scotia, ref. [21] found that the streamwise variance at large scales is better predicted by the Kaimal model than the von Kármán, provided that the degree of anisotropy is permitted to vary throughout the water column. Another study, from the Sound of Islay [24], found that the Kaimal model over-predicted the energy content at the lowest frequencies of the streamwise spectrum, while the von Kármán provided a better fit. Comparison of ADV measurements from a shallow tidal flow (<10 m depth) to the non-dimensionalised Kaimal spectrum, showed agreement with the general shape of the spectrum, although the variance in the measured curves was shifted towards higher frequencies [25]. Previous studies mostly focused on measurements near the seabed [24,25], so little is known about the applicability of models higher-up in the water column, which is critical for floating devices.
Due to the seabed roughness, bathymetric effects and the free surface, the real shear profiles can deviate from the analytical cases. A number of studies [26,27,28,29] found the shear profiles at EMEC’s Fall of Warness tidal site had large velocity variations with complex profiles that did not follow the analytical models. Furthermore, the flood and ebb tides had two distinct profile shapes, one logarithmic and one roughly polynomial. The shear profiles were also found to vary by velocity and acceleration/deceleration. Ref. [30] found the velocity profile at Ramsey Sound (Wales, UK) during ebb tides followed a power-law distribution over the entire water column. During flood tides, the logarithmic distribution of velocities was observed over the bottom half of the water column only, with the remainder being almost uniform up to the free surface.
Although turbulence intensity is expected to vary with depth and take on different profiles for various parts of the tidal cycle, models such as Tidal Bladed make the simplification of constant standard deviation throughout the water column, normally just using the hub height parameters [20,31]. In analysing the turbulence intensity profiles at the Ramsey Sound tidal site, in [32] showed notably asymmetric flow conditions during ebb and flood tides and variability within each tidal phase. At peak ebb flow, highest values of I x were found near the seabed and free surface and lowest values were attained at height z / H 0.6 . Conversely, during flood tide, the lowest turbulence intensity levels were found lower down in the water column at z / H 0.2 [32].
Models often assume isotropic turbulence or apply theoretical anisotropy ratios. Comparisons by [24] of observed tidal and atmospheric anisotropic ratios showed that the anisotropy is more pronounced in a tidal channel than in the atmospheric boundary layer. This is consistent with the notion that energy in a tidal channel is restricted by the presence of a free surface, particularly in the vertical direction. In a LES simulation, in [33] found the anisotropy ratio σ u : σ v : σ w to be 1:0.64:0.88, which was quite different to the 1:0.75:0.56 found at the Sound of Islay (Scotland) tidal site or to two-dimensional channel flows, in which the ratio is 1:0.71:0.55 [22].
Past studies suggest that some turbulence models may not be good representations of real tidal sites. The aim of this paper is to carry out a comprehensive comparison of the key parameters used in commercial codes and standards against observations from two energetic tidal test sites. This will help developers understand the applicability of models to real flows that full-scale devices will operate in, and reduce uncertainties associated with using theoretical values in modelling.

4. Methods

4.1. Measurements

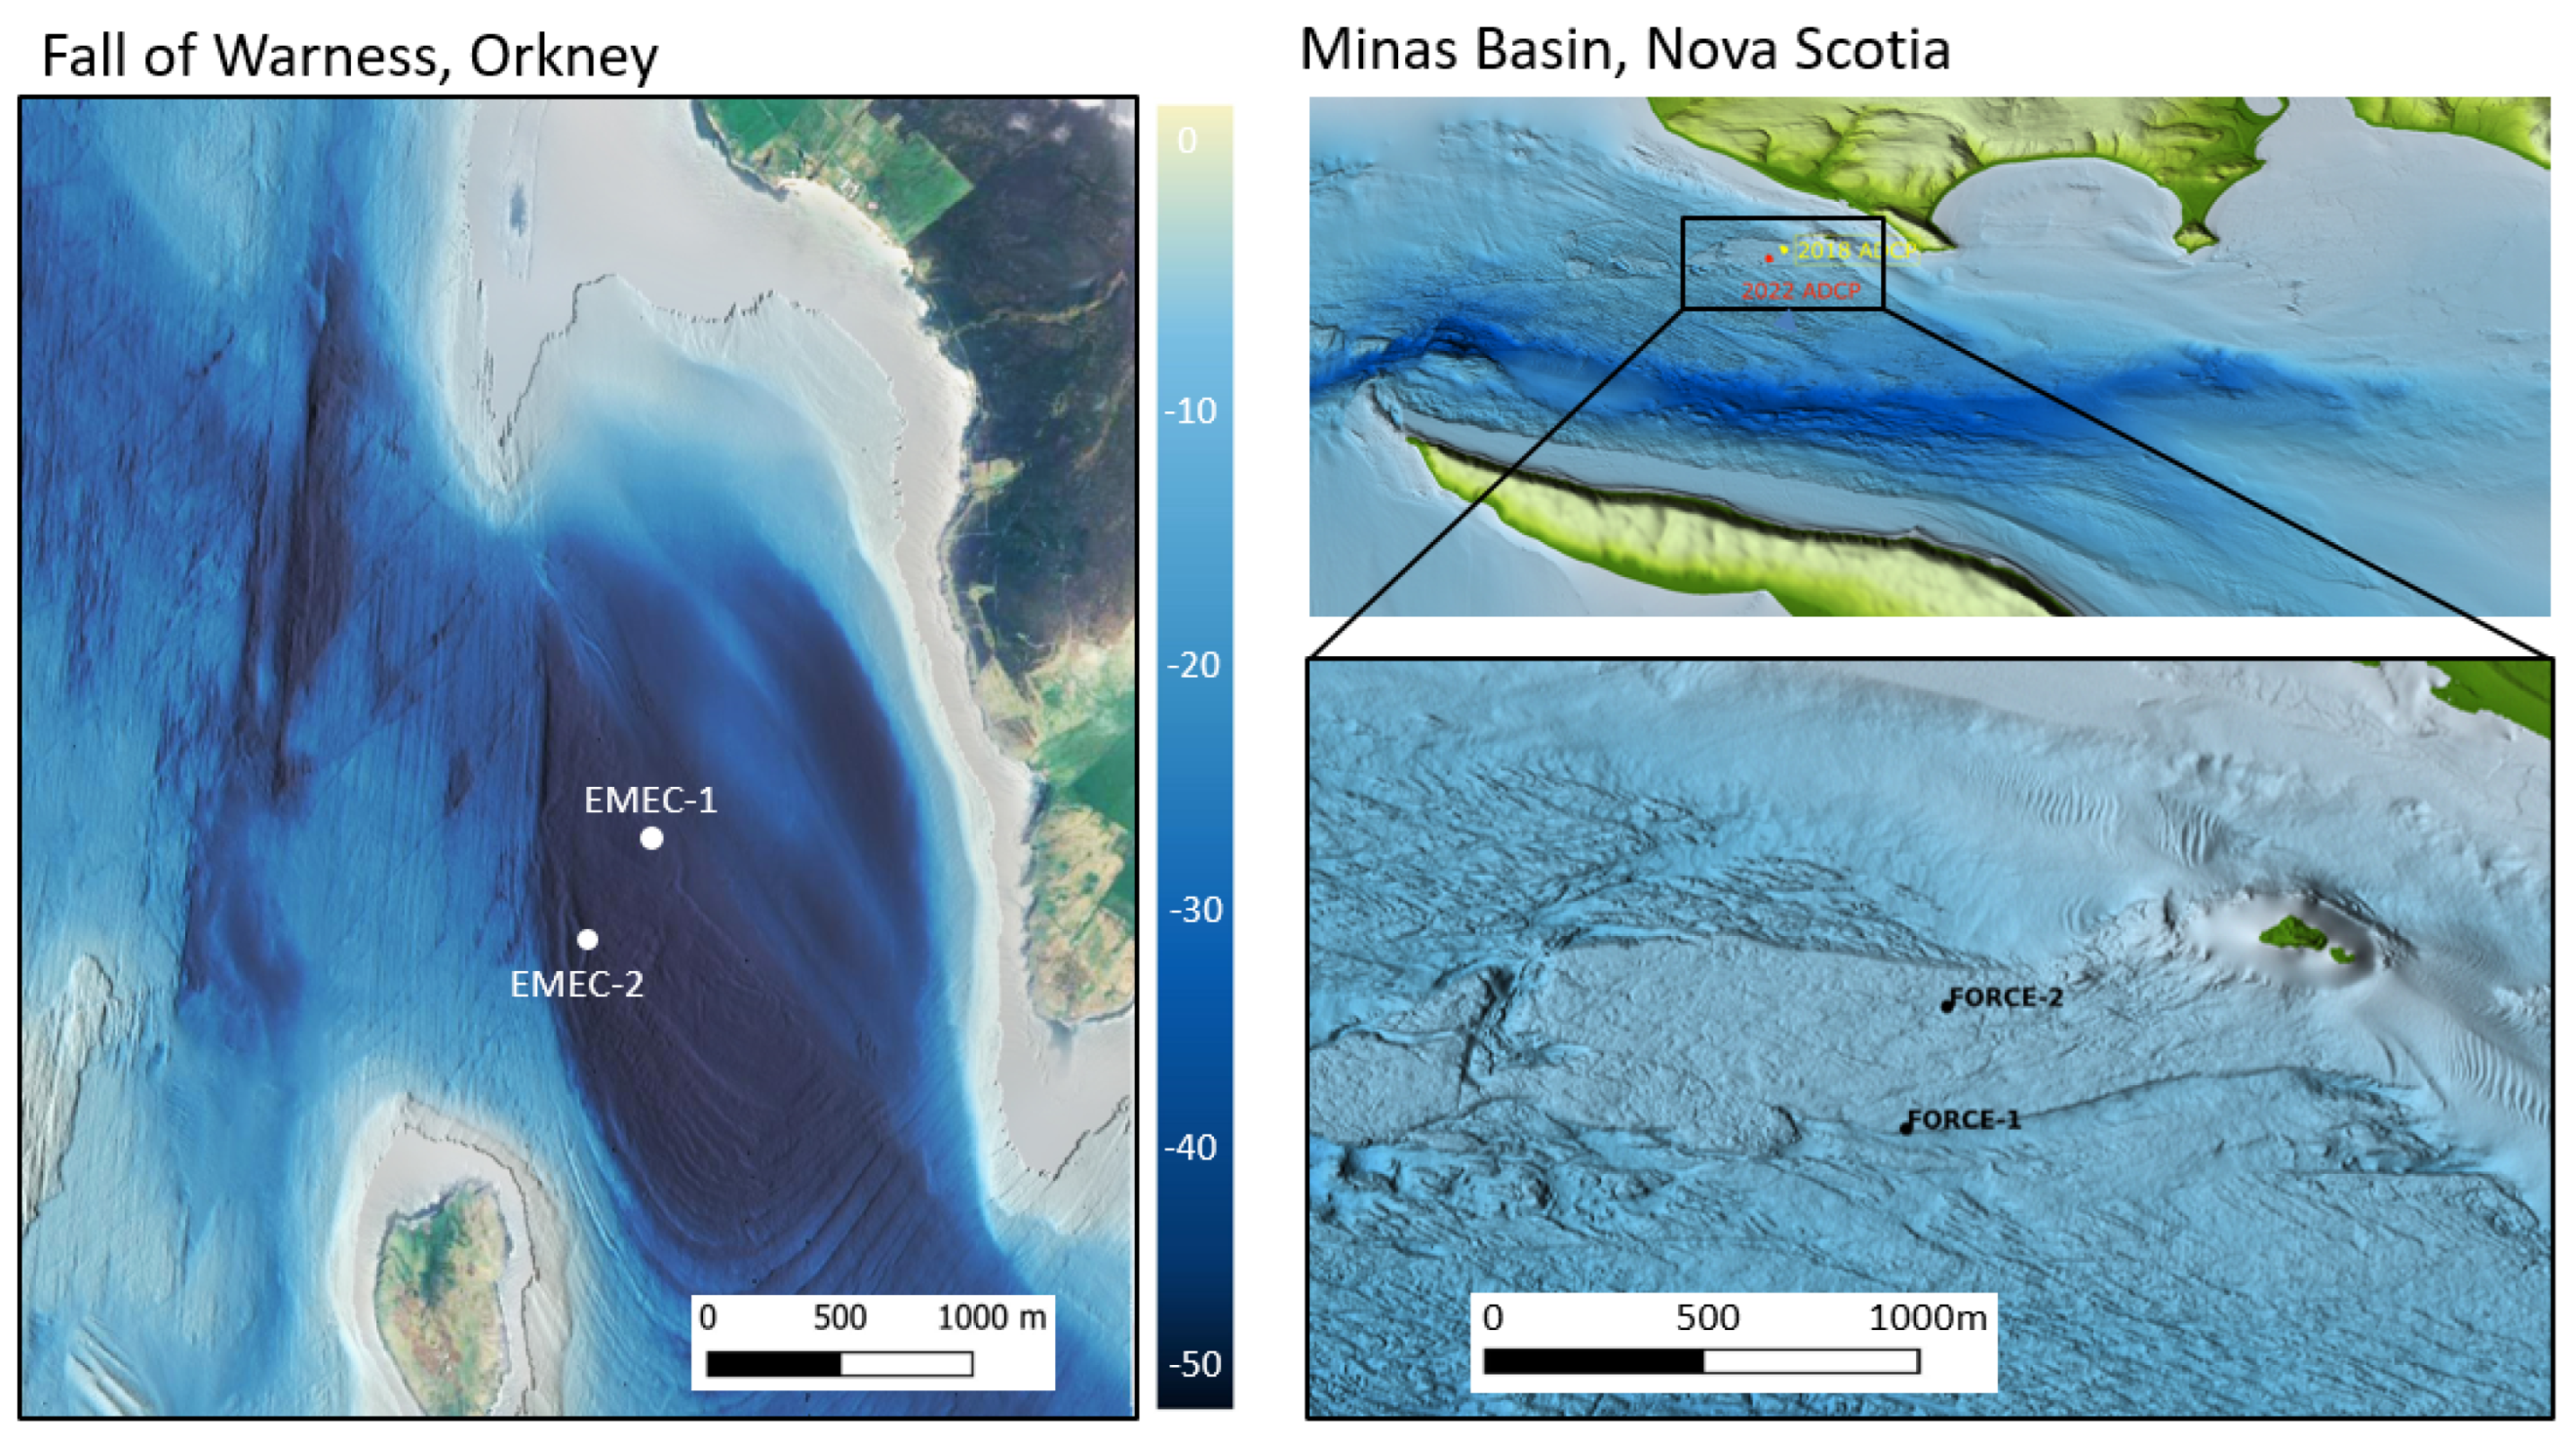
The ADCP velocity data used in this study were gathered at two tidal sites, the European Marine Energy Centre (EMEC) and the Fundy Ocean Research Centre for Energy (FORCE). Data were collected from two nearby locations at each site, as shown in Figure 2, with FORCE-1 and FORCE-2 instruments located approximately 300 m apart and EMEC-1 and EMEC-2 instruments approximately 400 m apart. The instrument configurations are shown in Table 1.
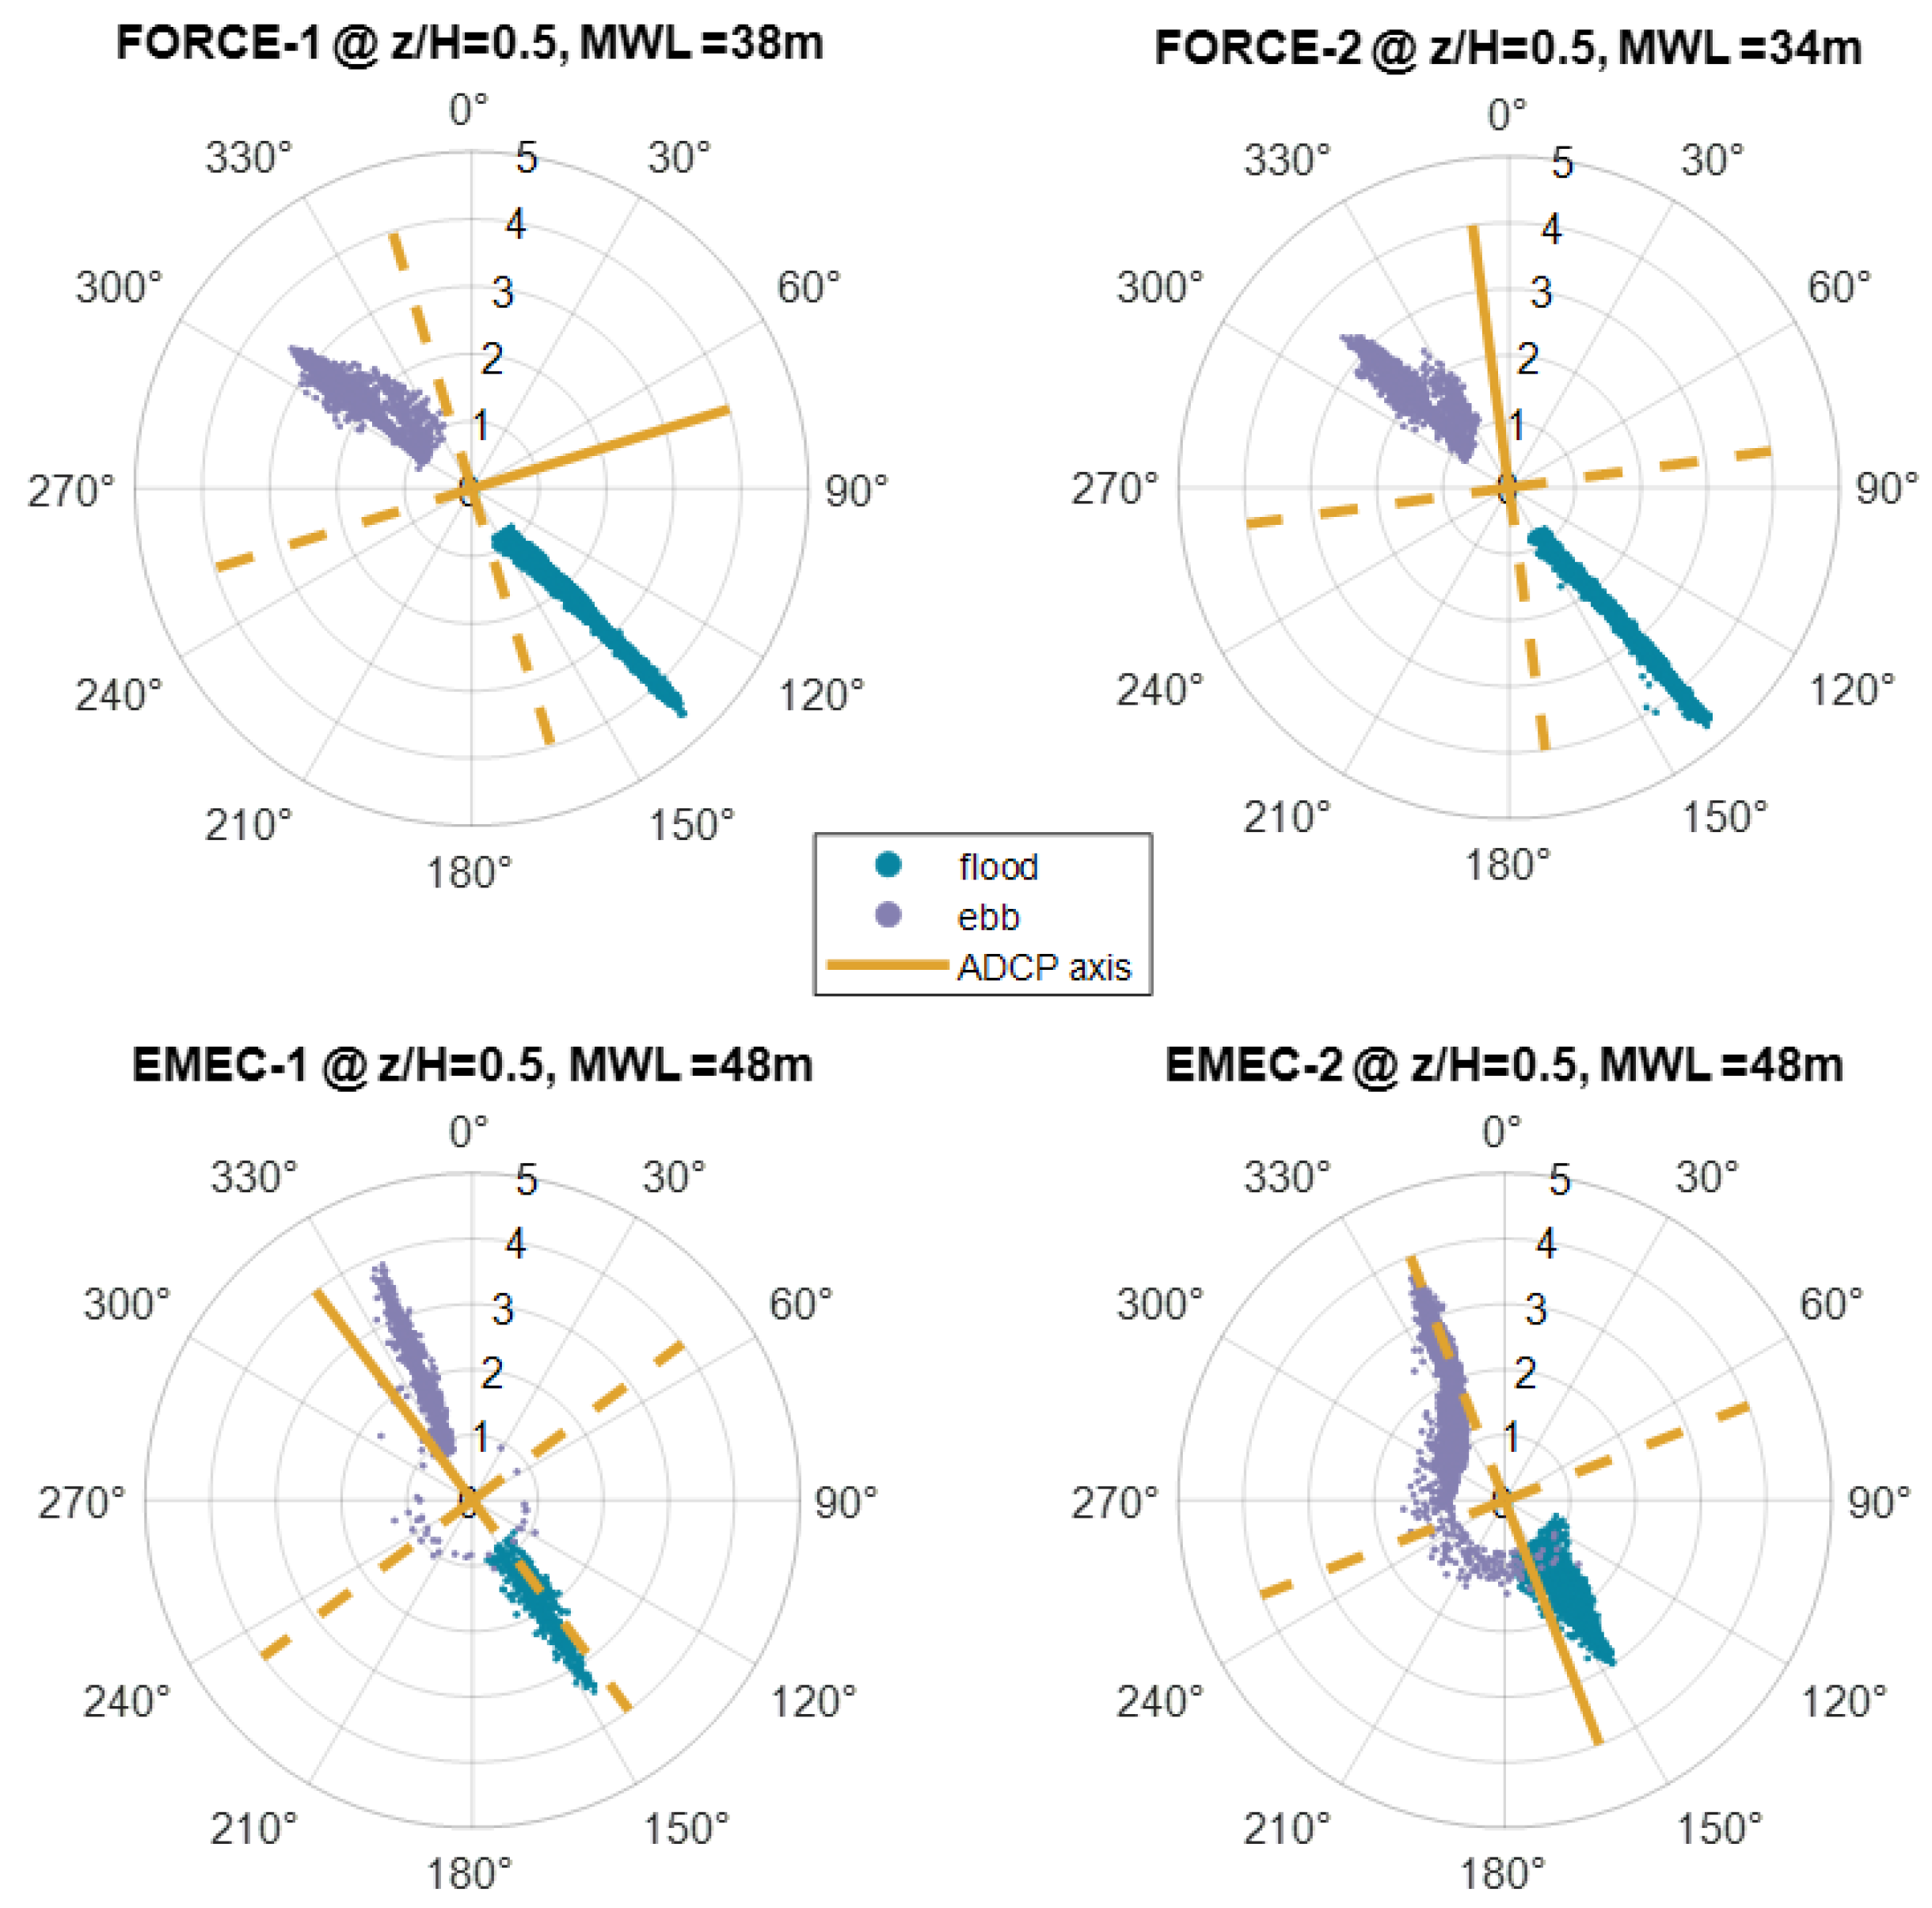
The average heading on both of the EMEC ADCP’s was such that one beam pair was oriented approximately in the streamwise direction of the tidal current; however, FORCE ADCPs were not aligned with the flow (see Figure 3). This has important implications for the parameters which can be derived using the data, as explained in more detail in the following section.

4.2. Data Analysis

The raw data were processed and quality-controlled (QC) using EMEC’s proprietary QC tool, IMPAQCT. This tool follows the Quality Assurance and Quality Control of Real Time Oceanographic data (QARTOD) standard [34], alongside the Nortek instrument manual [35] and flags any data which do not meet the QC thresholds.
To ensure parameters are comparable across the sites, all data have been split into 10-min intervals and binned by tidal cycle, mean flow velocity and relative depth, z / H . Turbulence parameters were calculated for each 10-min interval and averaged for each tidal cycle and flow velocities of 1–3 m/s for all datasets.
Due to the ADCP sampling rates, the spectral and coherence calculations were only carried out for EMEC-1 and FORCE-1 datasets.

4.2.1. Turbulence Spectrum

The MATLAB function pwelch was used to compute the discrete Fourier transform of each 10-min time series using a fast Fourier transform (fft) algorithm. It allows specification for window size, type and overlap. By default, the time series is divided into the longest possible segments to obtain as close to, but not exceeding, eight segments, with 50% overlap, using a Hamming window. The modified periodograms are averaged to obtain the power spectral density (PSD) estimate. The default number of discrete Fourier transform (DFT) points is the greater of 256 or the next power of 2 greater than the length of the segments. In the PSD format, the area under the spectrum curve represents the variance for the data record.
In order to compare the measured spectra to the models, the measured spectra were de-noised and normalised by the variance so that the area under the spectrum = 1. De-noising was carried out by identifying Doppler noise variance for each beam using the spectral-fitting method [36,37,38] and subtracting this variance from the total beam variance. The vertical and streamwise model spectra were constructed using Equations (1) to (3), using measured values of mean velocity magnitude U and length scales L i where i = u , v , w . The measured vertical spectrum was computed directly from the measured vertical beam velocities. Given that the area under the spectrum represents the variance, we apply the variance method [39,40] to calculate the streamwise spectrum from the spectra measured by individual beams:
S u u = S b 1 b 1 + S b 2 b 2 2 c o s 2 θ S b 5 b 5 2 s i n 2 θ ,
where S b 1 b 1 and S b 2 b 2 are the spectra of the two beams aligned to the streamwise direction, S b 5 b 5 is the vertical beam spectrum, and θ is the beam inclination angle.
In the case of the FORCE-1 dataset, due to the misalignment of the instrument, streamwise metrics could not be reliably calculated. In this case, we compared the total energy spectrum, as this is unaffected by the rotation of the instrument, which is further explained in Section 4.2.6. Using the expression for obtaining the total kinetic energy [41] from the individual beam variances, the total measured spectrum was calculated as follows:
S t o t a l = S b 1 b 1 + S b 2 b 2 + S b 3 b 3 + S b 4 b 4 2 ( 2 c o s 2 θ s i n 2 θ ) S b 5 b 5 4 s i n 2 θ .
The total model spectrum is constructed using equation:
S t o t a l = S u u + S v v + S w w 2 ,
where S u u , S v v and S w w are calculated using Equations (1) to (3). All spectra were calculated for relative depths, z / H = 0.2 , 0.5 , 0.7 .

4.2.2. Coherence

Spatial coherence, Γ was computed from two independent measurements of the same component of velocity that are separated in space by a vertical distance, r. Coherence is defined as [42]:
Γ = | F ( u 1 ) F ( u 2 ) | 2 ¯ S ( u 1 ) S ( u 2 ) ¯ ,
where F is the fast Fourier transform, and  S ( u ) = | F ( u ) | 2 . We used the MATLAB function mscohere to calculate coherence for each beam. This function finds the magnitude-squared coherence estimate for two input signals. ADCP’s do not provide a direct measurement of the streamwise velocity component, so we applied the coordinate transform to instantaneous beam velocities to obtain the streamwise component (making the assumption of homogeneity across the beam spread). These values were then used in the coherence calculation. Due to the uncertainty relating to the homogeneity assumption, we also calculated coherence using the raw beam velocities for comparison.
The 95% confidence level of Γ measurements—above which Γ estimates can be considered valid with 95% confidence—is equal to 6 / n D O F , where n D O F is the number of degrees of freedom in the coherence estimate [43]. Coherence was analysed at relative depths z / H = 0.2 , 0.5 , 0.7 for a 5 m separation distance above and below the analysing depth. The model coherence was constructed using Equation (12) using measured length scales L, mean magnitude U and the separation distance, r.

4.2.3. Length Scales

Length scales were required as inputs to the spectral and coherence models, but we also compared the measured values to the default values in commercial codes.
Length scales are calculated by the auto-correlation method (Equation (13)) which measures the duration for which the largest eddies remain correlated and requires the application of Taylor’s frozen field hypothesis. The hypothesis can be applied under the assumption that turbulence advects faster than it evolves (for further explanation, see [44]).
R ( τ ) = ( u t u ¯ ) ( u t + τ u ¯ ) σ u 2 , l u = u ¯ τ = 0 R ( τ ) = 0 R ( τ ) d τ
Correlation methods require instantaneous velocities, which are only reliable in beam coordinates at depths where the beam spread becomes significant. At these depths the beam spread may be interpreted as the minimum length scale of turbulence that is measured accurately by the ADCP [28]. For this reason, a check is carried out to ensure the computed length scales are greater than the beam spread.

4.2.4. Shear Profile

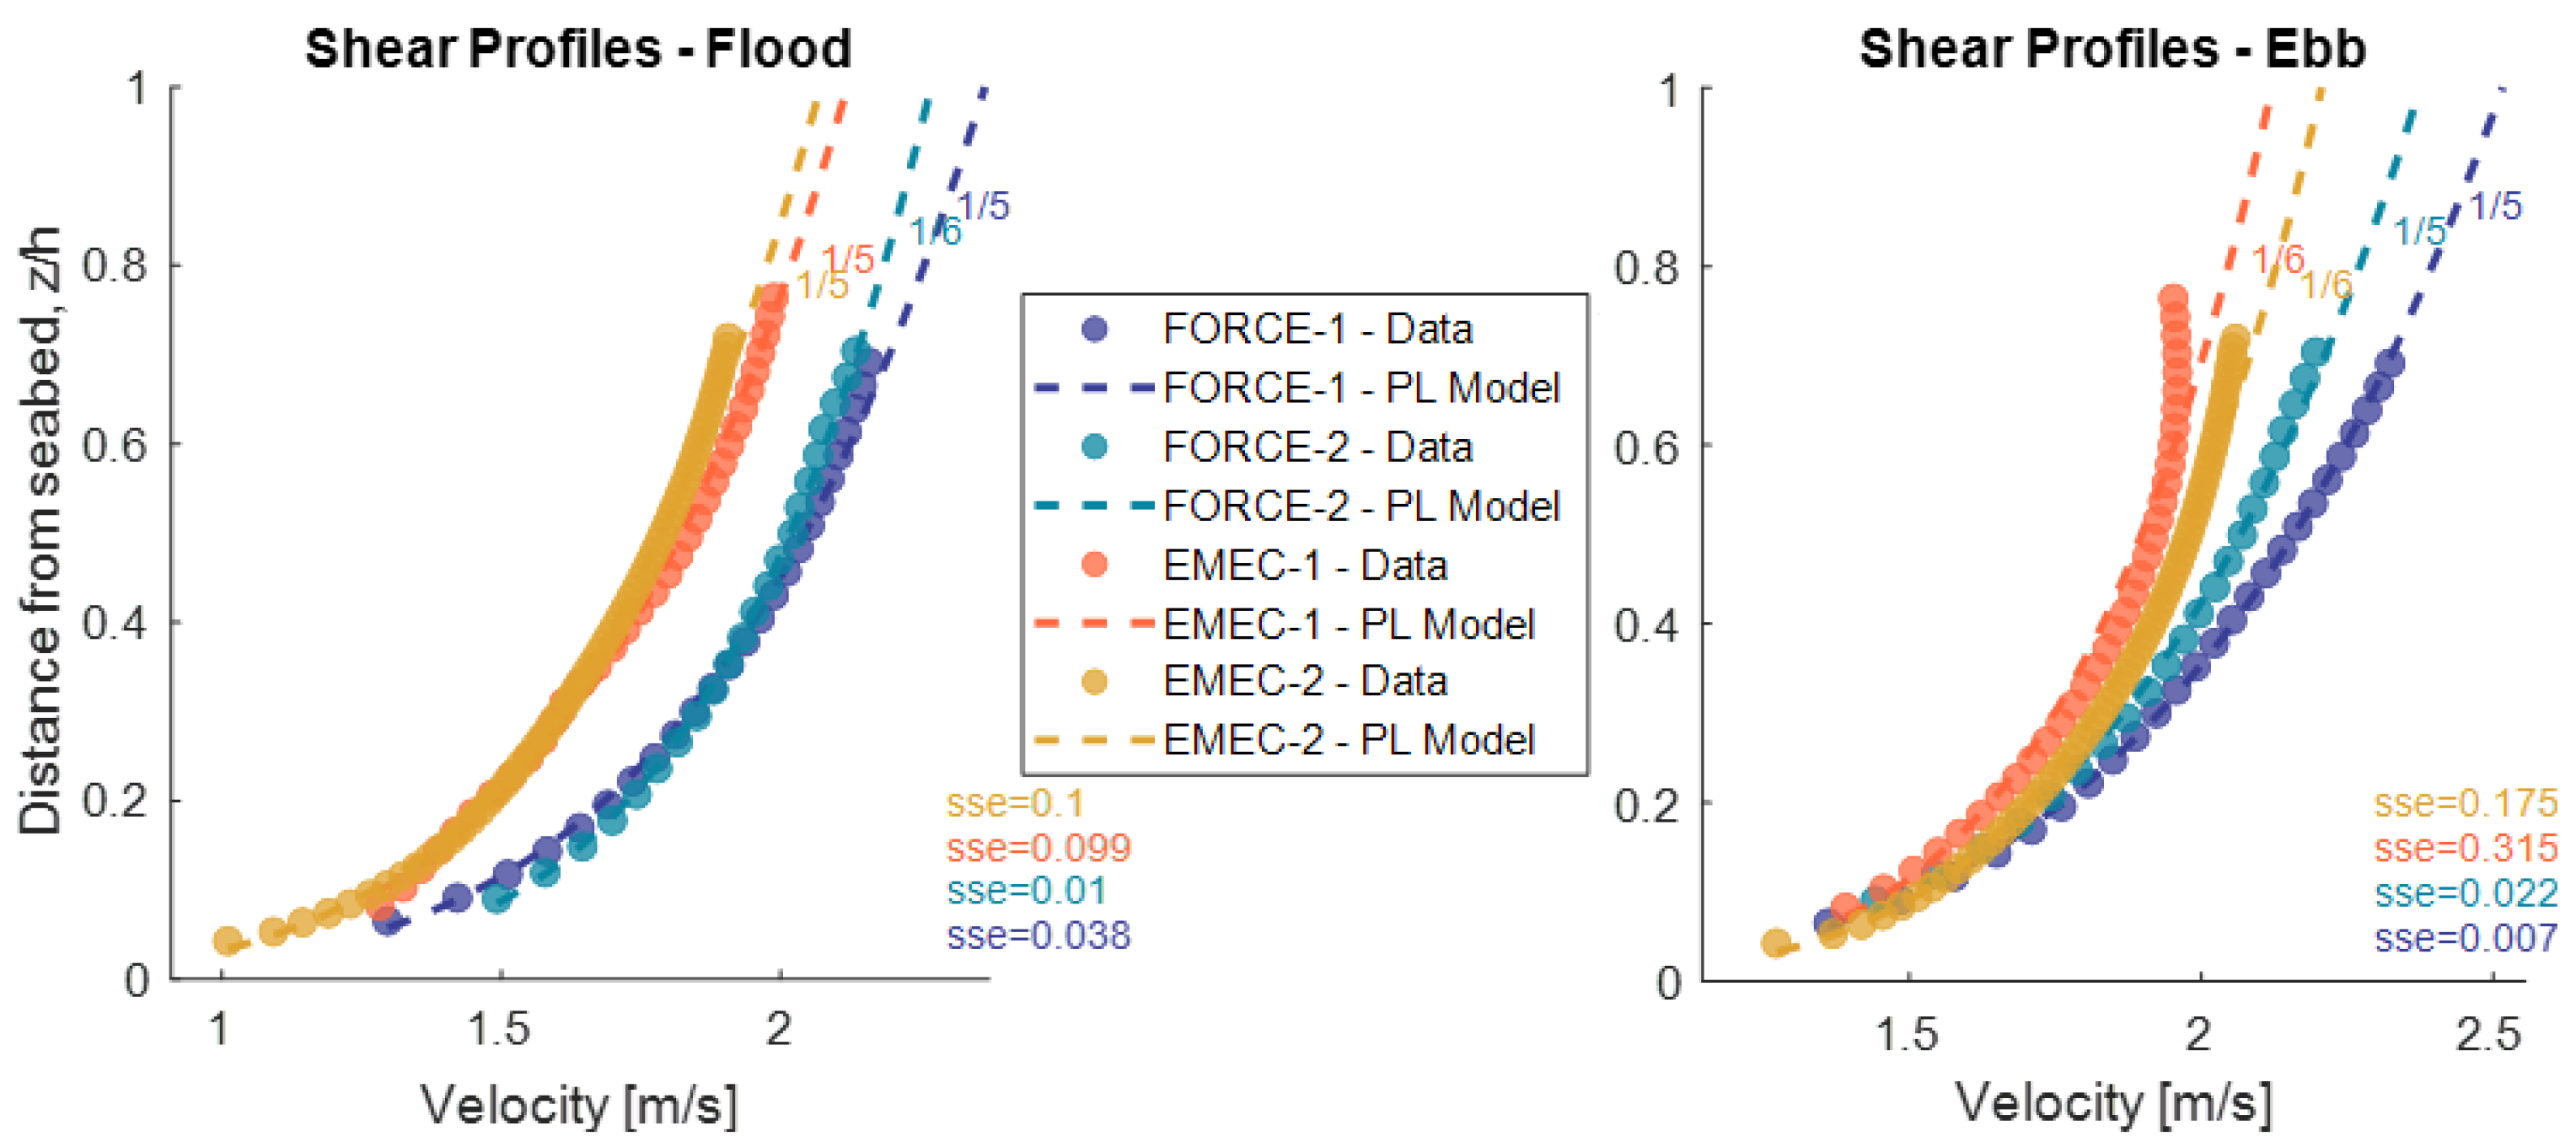
Shear profiles were calculated by averaging velocity magnitudes at each depth bin for the flood and ebb cycles and for the velocity range 1–3 m/s. A power-law model, as described in Equation (6), was fitted to the data, calculating the exponent α .

4.2.5. Turbulence Intensity

Reynolds stresses represent the momentum flux due to turbulent fluctuations and relate to the auto- and cross-spectra terms S i j . The Reynolds stress tensor is defined as [45]:
R i j = ρ u i u j ¯ = ρ u 2 ¯ u v ¯ u w ¯ u v ¯ v 2 ¯ v w ¯ u w ¯ v w ¯ w 2 ¯
where ρ is the fluid density and u , v , w are the streamwise, lateral and vertical velocity components, respectively. Due to symmetry, the tensor contains six unique terms. The normal stresses, on the diagonal, are used to calculate the turbulence intensity, I, defined in Equation (7) or the turbulent kinetic energy ( T K E ), defined as:
T K E = 1 2 u 2 + v 2 + w 2
The off-diagonal terms are the shear stresses, also known as Reynolds stresses.
A 5-beam ADCP allows for a true measurement of vertical velocities and the estimation of five Reynolds stress terms (all but u v ), TKE, I and anisotropy directly from the along-beam velocities [46]. The orientation of the beams to the flow is vital. If the beams are not aligned with the flow direction, only the total I or T K E quantities can be reliably calculated [28], as explained in Section 4.2.6. In other words, unless the beam pairs are aligned to the flow, the Reynolds stress components will not be resolved in the right co-ordinate system, and rotation of the tensor is not possible, as all six Reynolds stress terms are not known.
To calculate the Reynolds stresses, the variance method is employed. The variances are first determined in along-beam coordinates, then combined by assuming statistical characteristics (variance) are homogeneous over the beam spread (for further explanation of the method, see [41,47]). Ignoring the instrument tilt, the variance method equations for a 5-beam ADCP are as follows:
u 2 ¯ = b 1 ¯ + b 2 ¯ 2 b 5 ¯ cos 2 ( θ ) 2 sin 2 ( θ )
v 2 ¯ = b 3 2 ¯ + b 4 2 ¯ 2 b 5 2 ¯ cos 2 ( θ ) 2 sin 2 ( θ )
w 2 ¯ = b 5 2 ¯
u w ¯ = b 2 2 ¯ b 1 2 ¯ 2 sin ( 2 θ )
v w ¯ = b 4 2 ¯ b 3 2 ¯ 2 sin ( 2 θ )

4.2.6. ADCP Alignment Error

Some of the instruments used in this study were not aligned with the principal flow direction. Moreover, the instruments that were aligned would still have misalignment errors due to flow asymmetry, as can be seen in Figure 3. To quantify the misalignment error, we can define the approximate variance u 2 ¯ a p p x , as calculated from the misaligned ADCP data, in terms of the actual variance u 2 ¯ and the misalignment angle ϕ . The derivations are included in Appendix A.1, and the resulting equations are:
u 2 ¯ a p p x = u 2 ¯ cos 2 ϕ + v 2 ¯ sin 2 ϕ u v ¯ sin 2 ϕ
v 2 ¯ a p p x = v 2 ¯ cos 2 ϕ + u 2 ¯ sin 2 ϕ + u v ¯ sin 2 ϕ
q 2 2 a p p x = u 2 ¯ a p p x + v ¯ a p p x + w 2 ¯ 2 = u 2 ¯ + v 2 ¯ + w 2 ¯ 2
α = w 2 ¯ u 2 ¯ a p p x + v ¯ a p p x = w 2 ¯ u 2 ¯ + v ¯
The total quantities, such as total turbulence intensity or total TKE, and the anisotropy ratios remain unaffected by the misalignment due to the cancelling out of the covariance term u v ¯ . However, the parameters in the streamwise and lateral directions will result in errors if the instrument is misaligned. The error will depend on the relative magnitudes of u 2 ¯ , v 2 ¯ and u v ¯ , as well as on the degree of misalignment. The curves in Figure 4 show the range of errors based on possible anisotropy ratios and relative u v magnitudes.
Error estimates show that, in the case of the FORCE-1 and FORCE-2 datasets, with an approximate misalignment of 30 , streamwise I could have errors between 20–60% depending on the relative values of the u and v components. In the case of slight misalignment due to asymmetry, as in the EMEC-1 case (approximately 10 ), the error would range from 5–15%.

5. Results

5.1. Length Scales

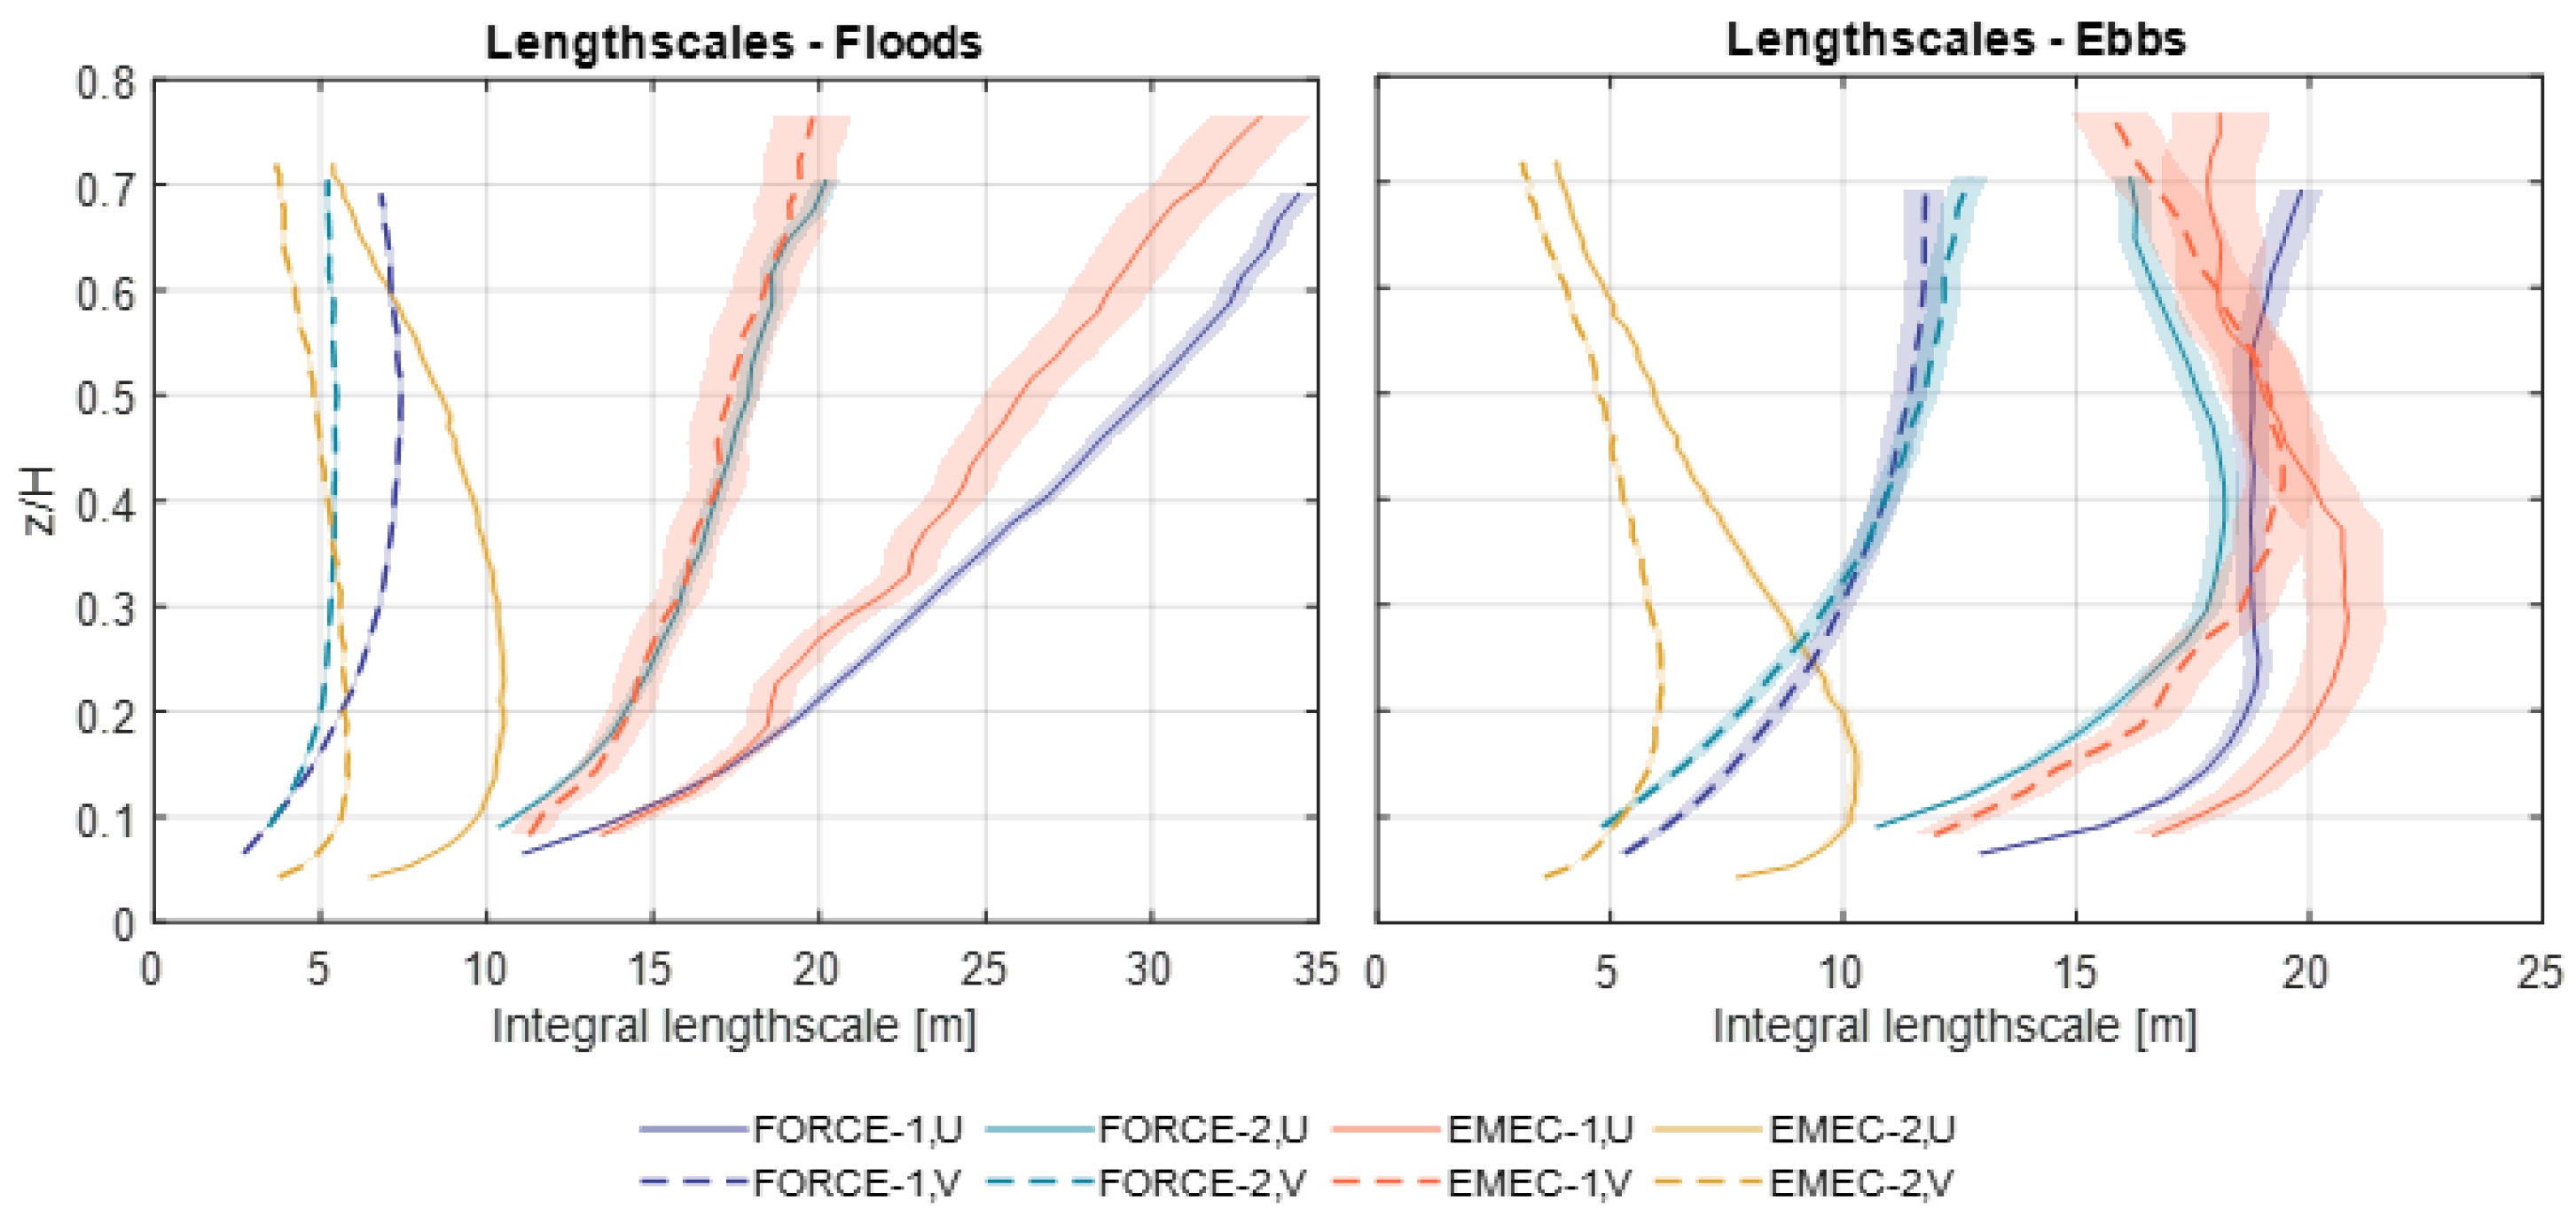
Figure 5 shows that EMEC-1 and FORCE-1 have significantly larger streamwise length scales L u than the other datasets, which may be due to their proximity to bathymetric features. EMEC-1 has a notably larger lateral component length scale, in particular on the ebb tides, relative to the streamwise component. There is a significant variation in profile shapes on the ebb tides across all instruments.
Comparing the length scale profiles to open-channel theory (Figure 6), only the FORCE-2 data show agreement with the model up to z / H = 0.2 on the ebb tides. The FORCE-1 length scale profile follows the theoretical shape on the floods, although skewed towards higher velocities. All other results show a significant deviation from the theoretical profile, especially on the ebb tides.

5.2. Turbulence Spectrum

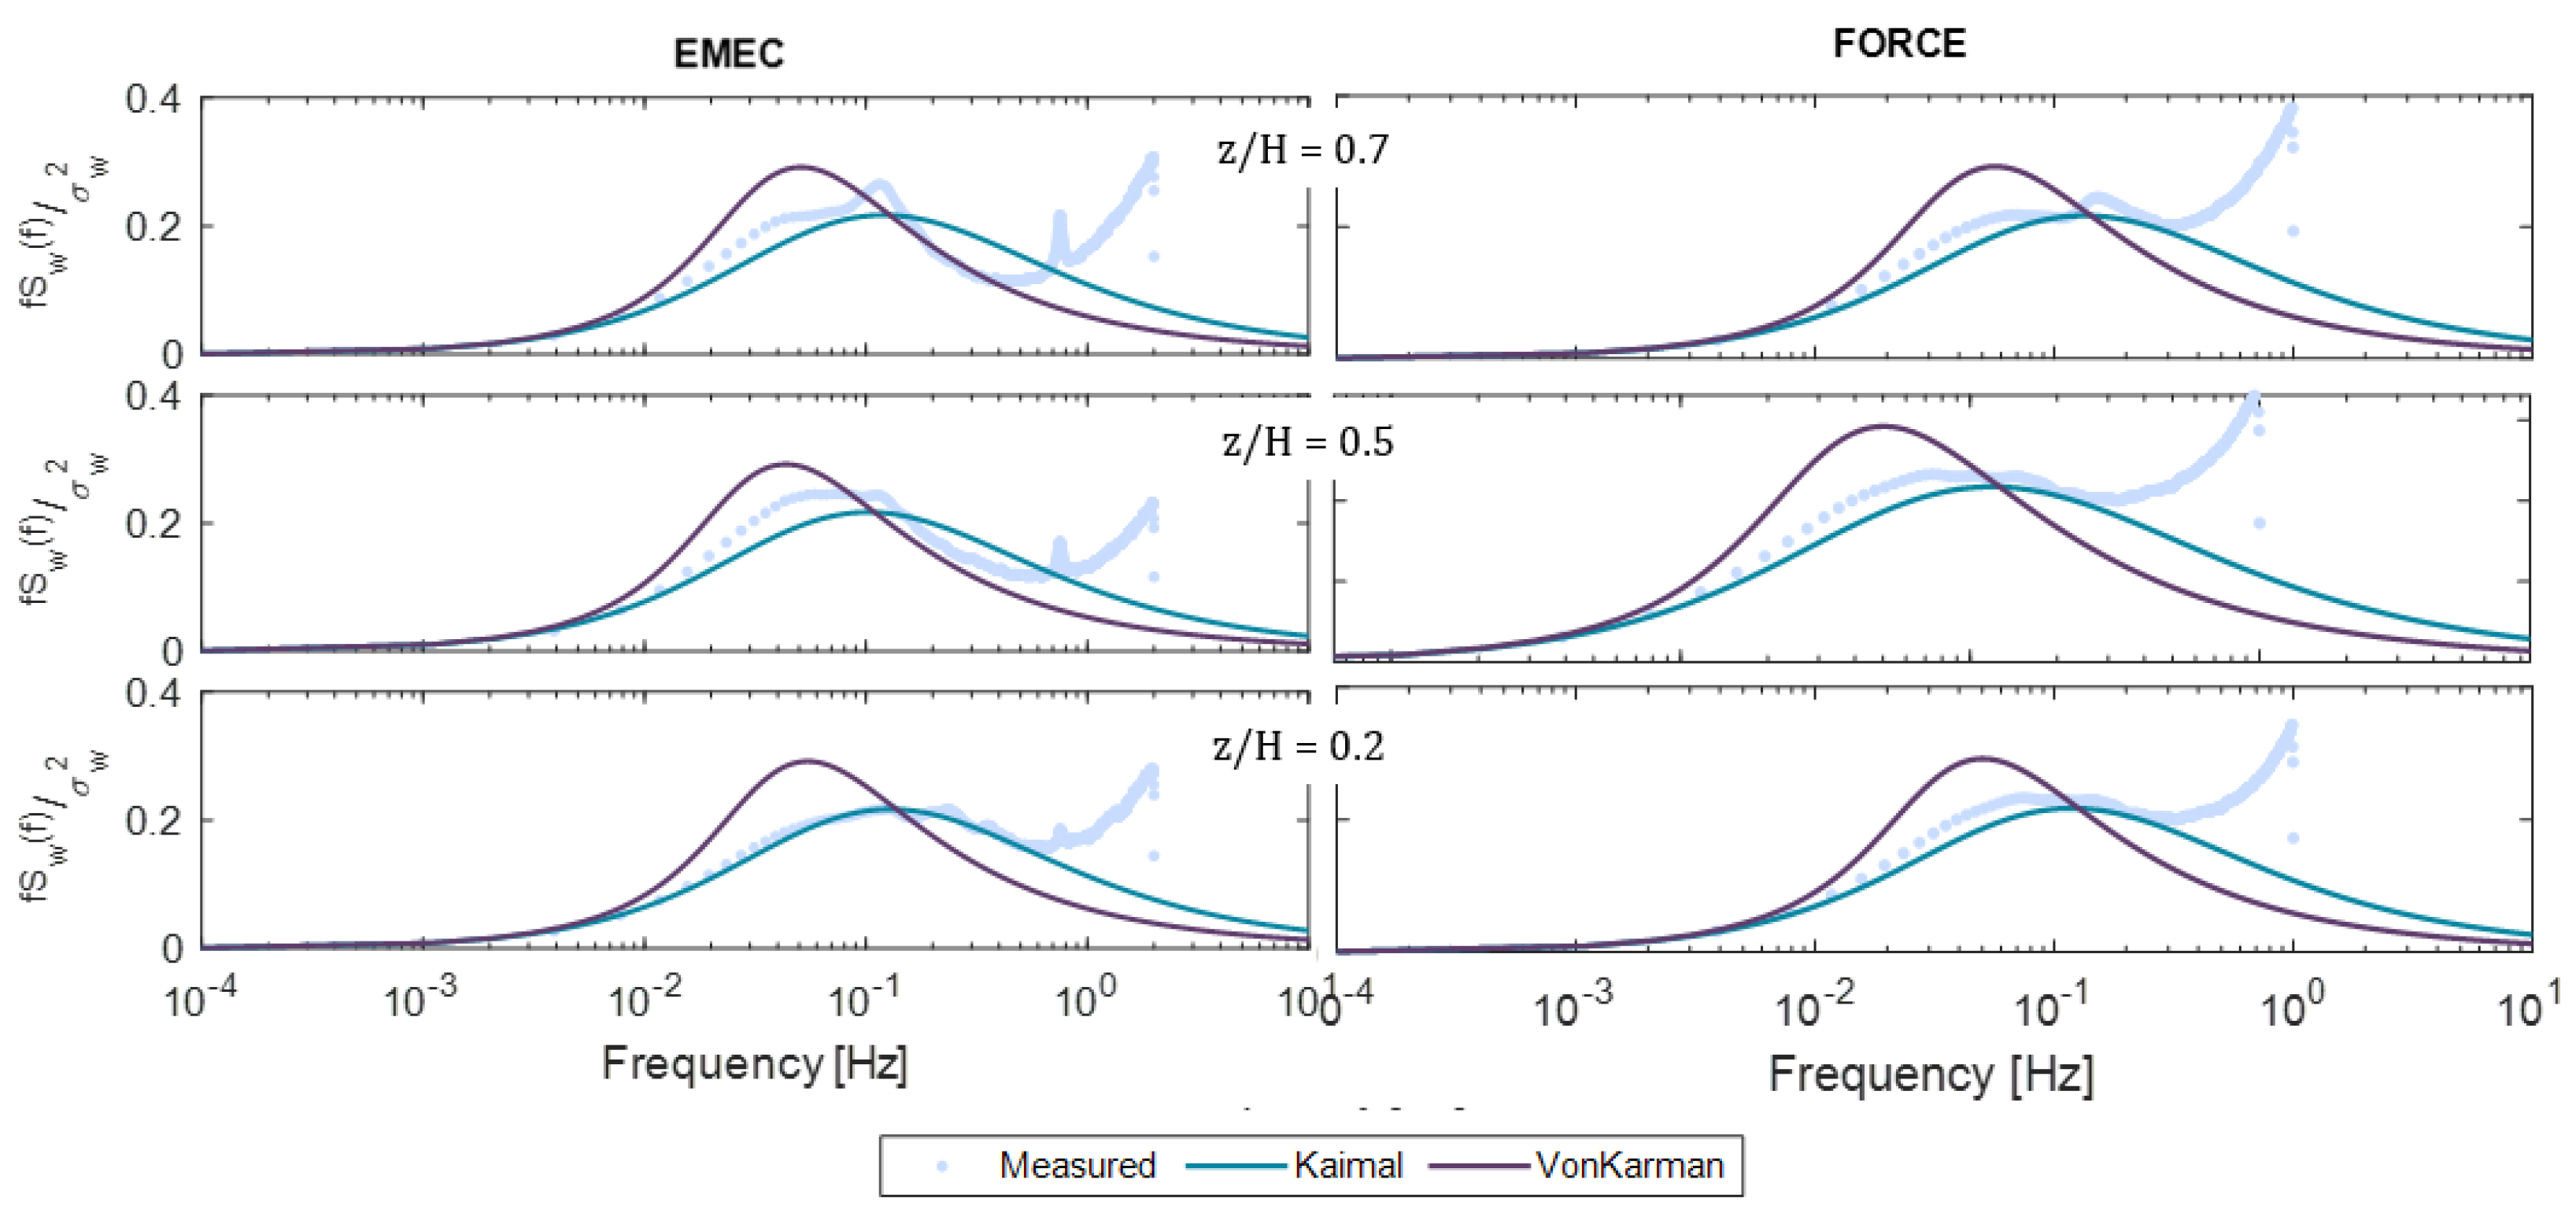
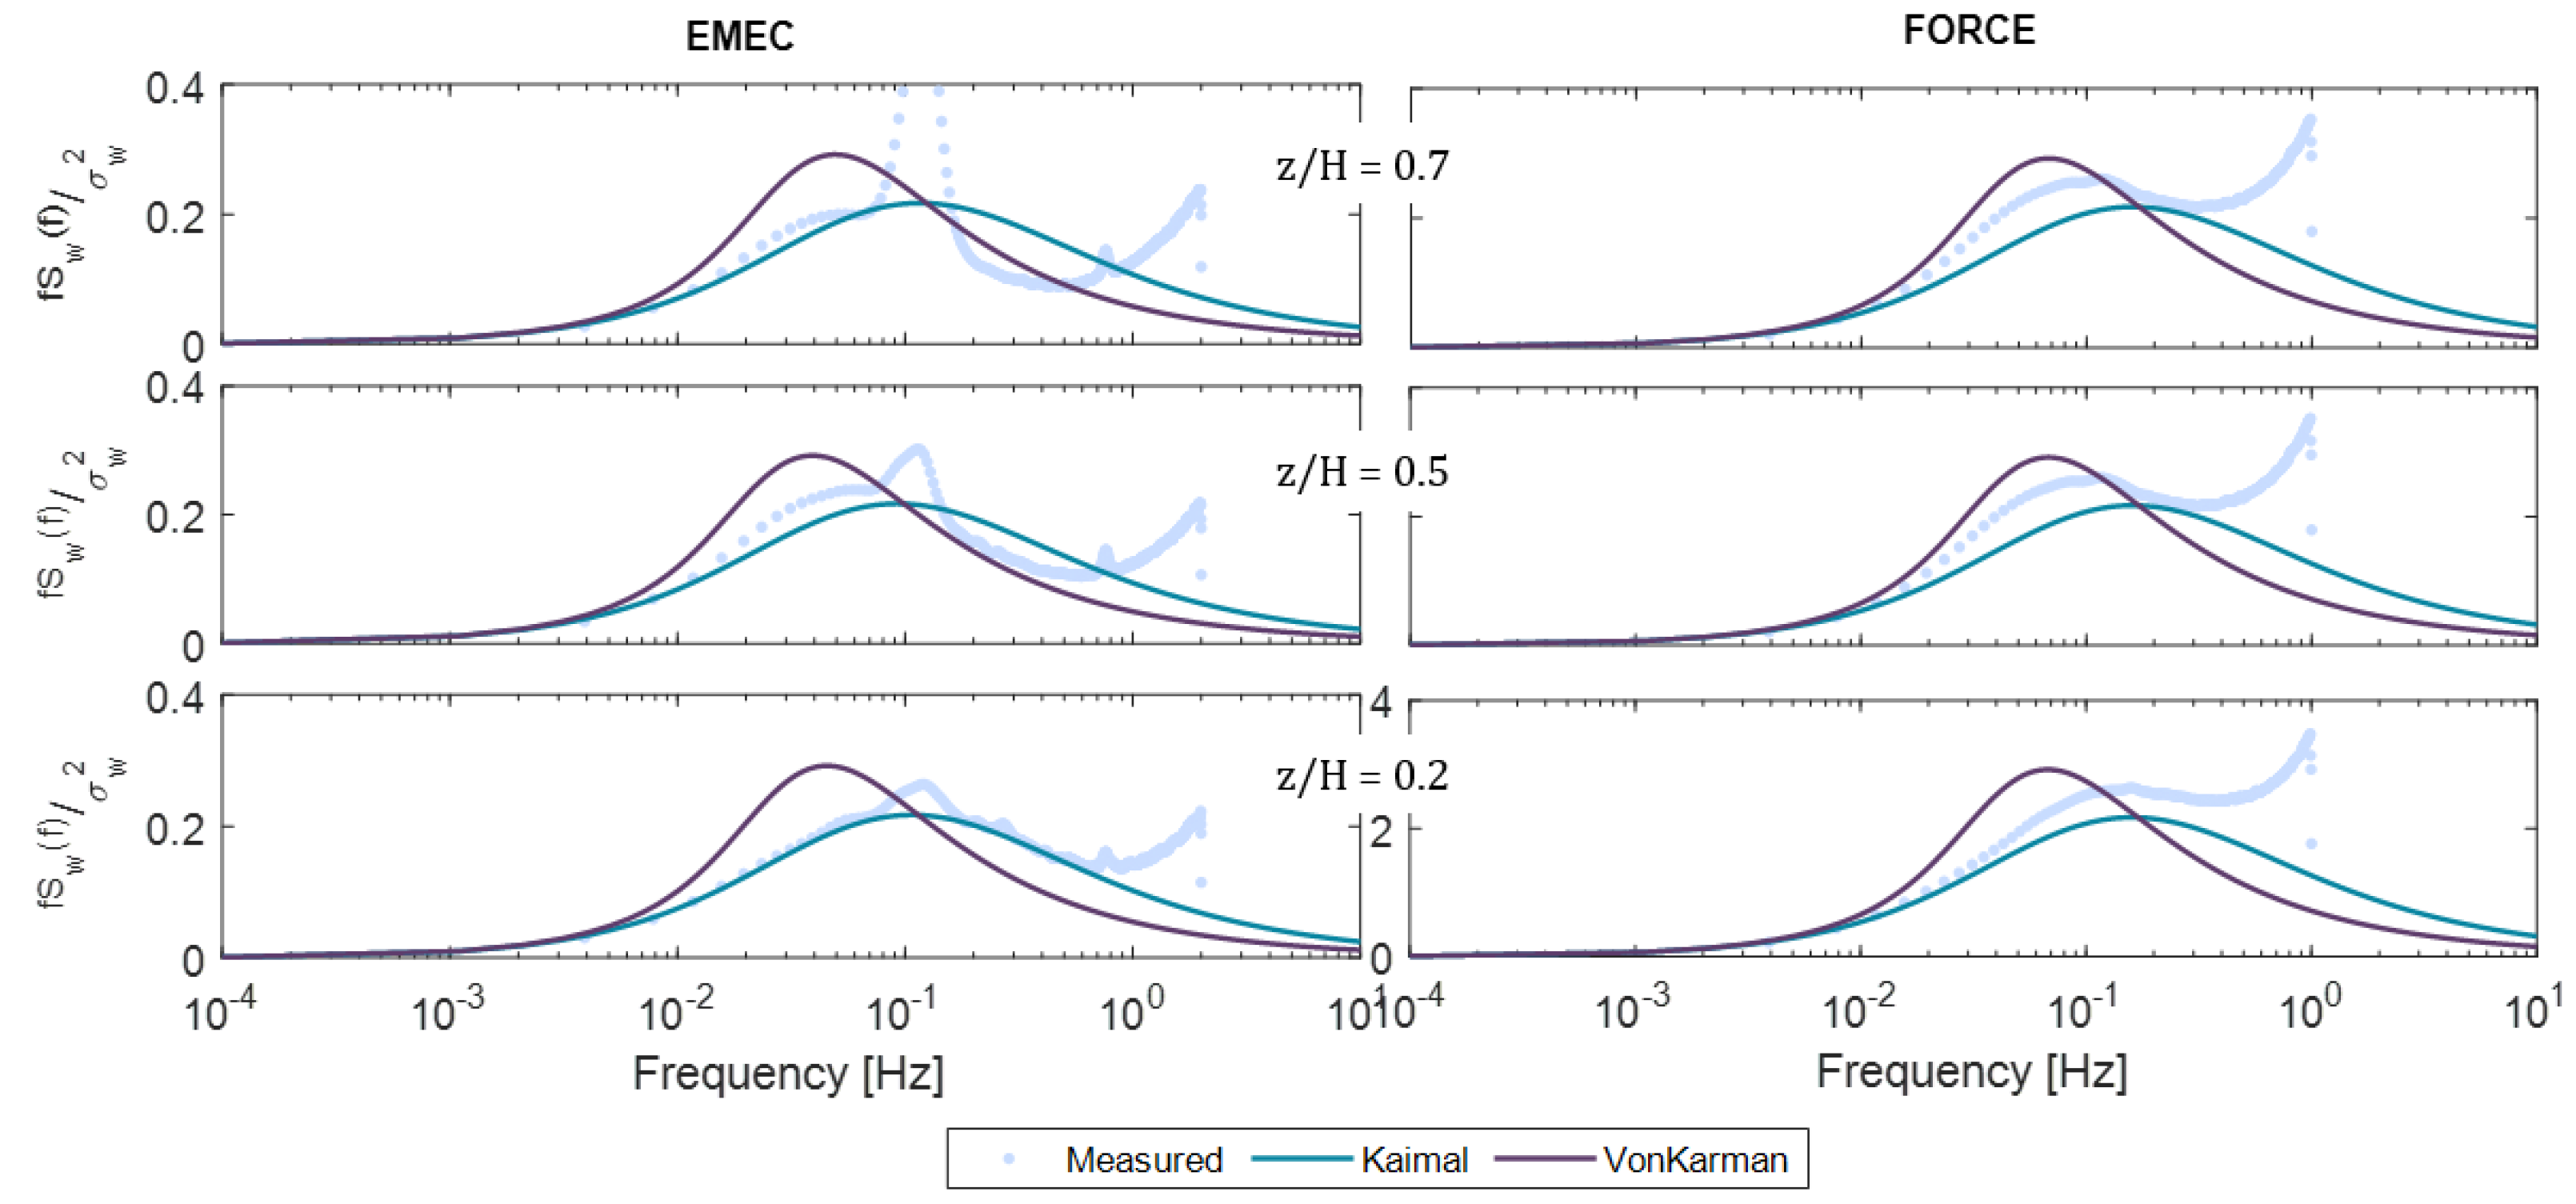
The direct measurement of the vertical velocity spectrum is available from the vertical ADCP beam. The measured spectra were normalised by the variance and are compared to the Kaimal and von Kármán models, as shown in Figure 7 and Figure 8.
For both sites, the Kaimal model provides a better fit with good agreement near the seabed. The von Kármán model peak has a higher amplitude and is shifted to lower frequencies compared to the observed spectrum. The FORCE-1 spectra show better agreement on the flood tides than the ebb, whereas EMEC-1 is similar for both.
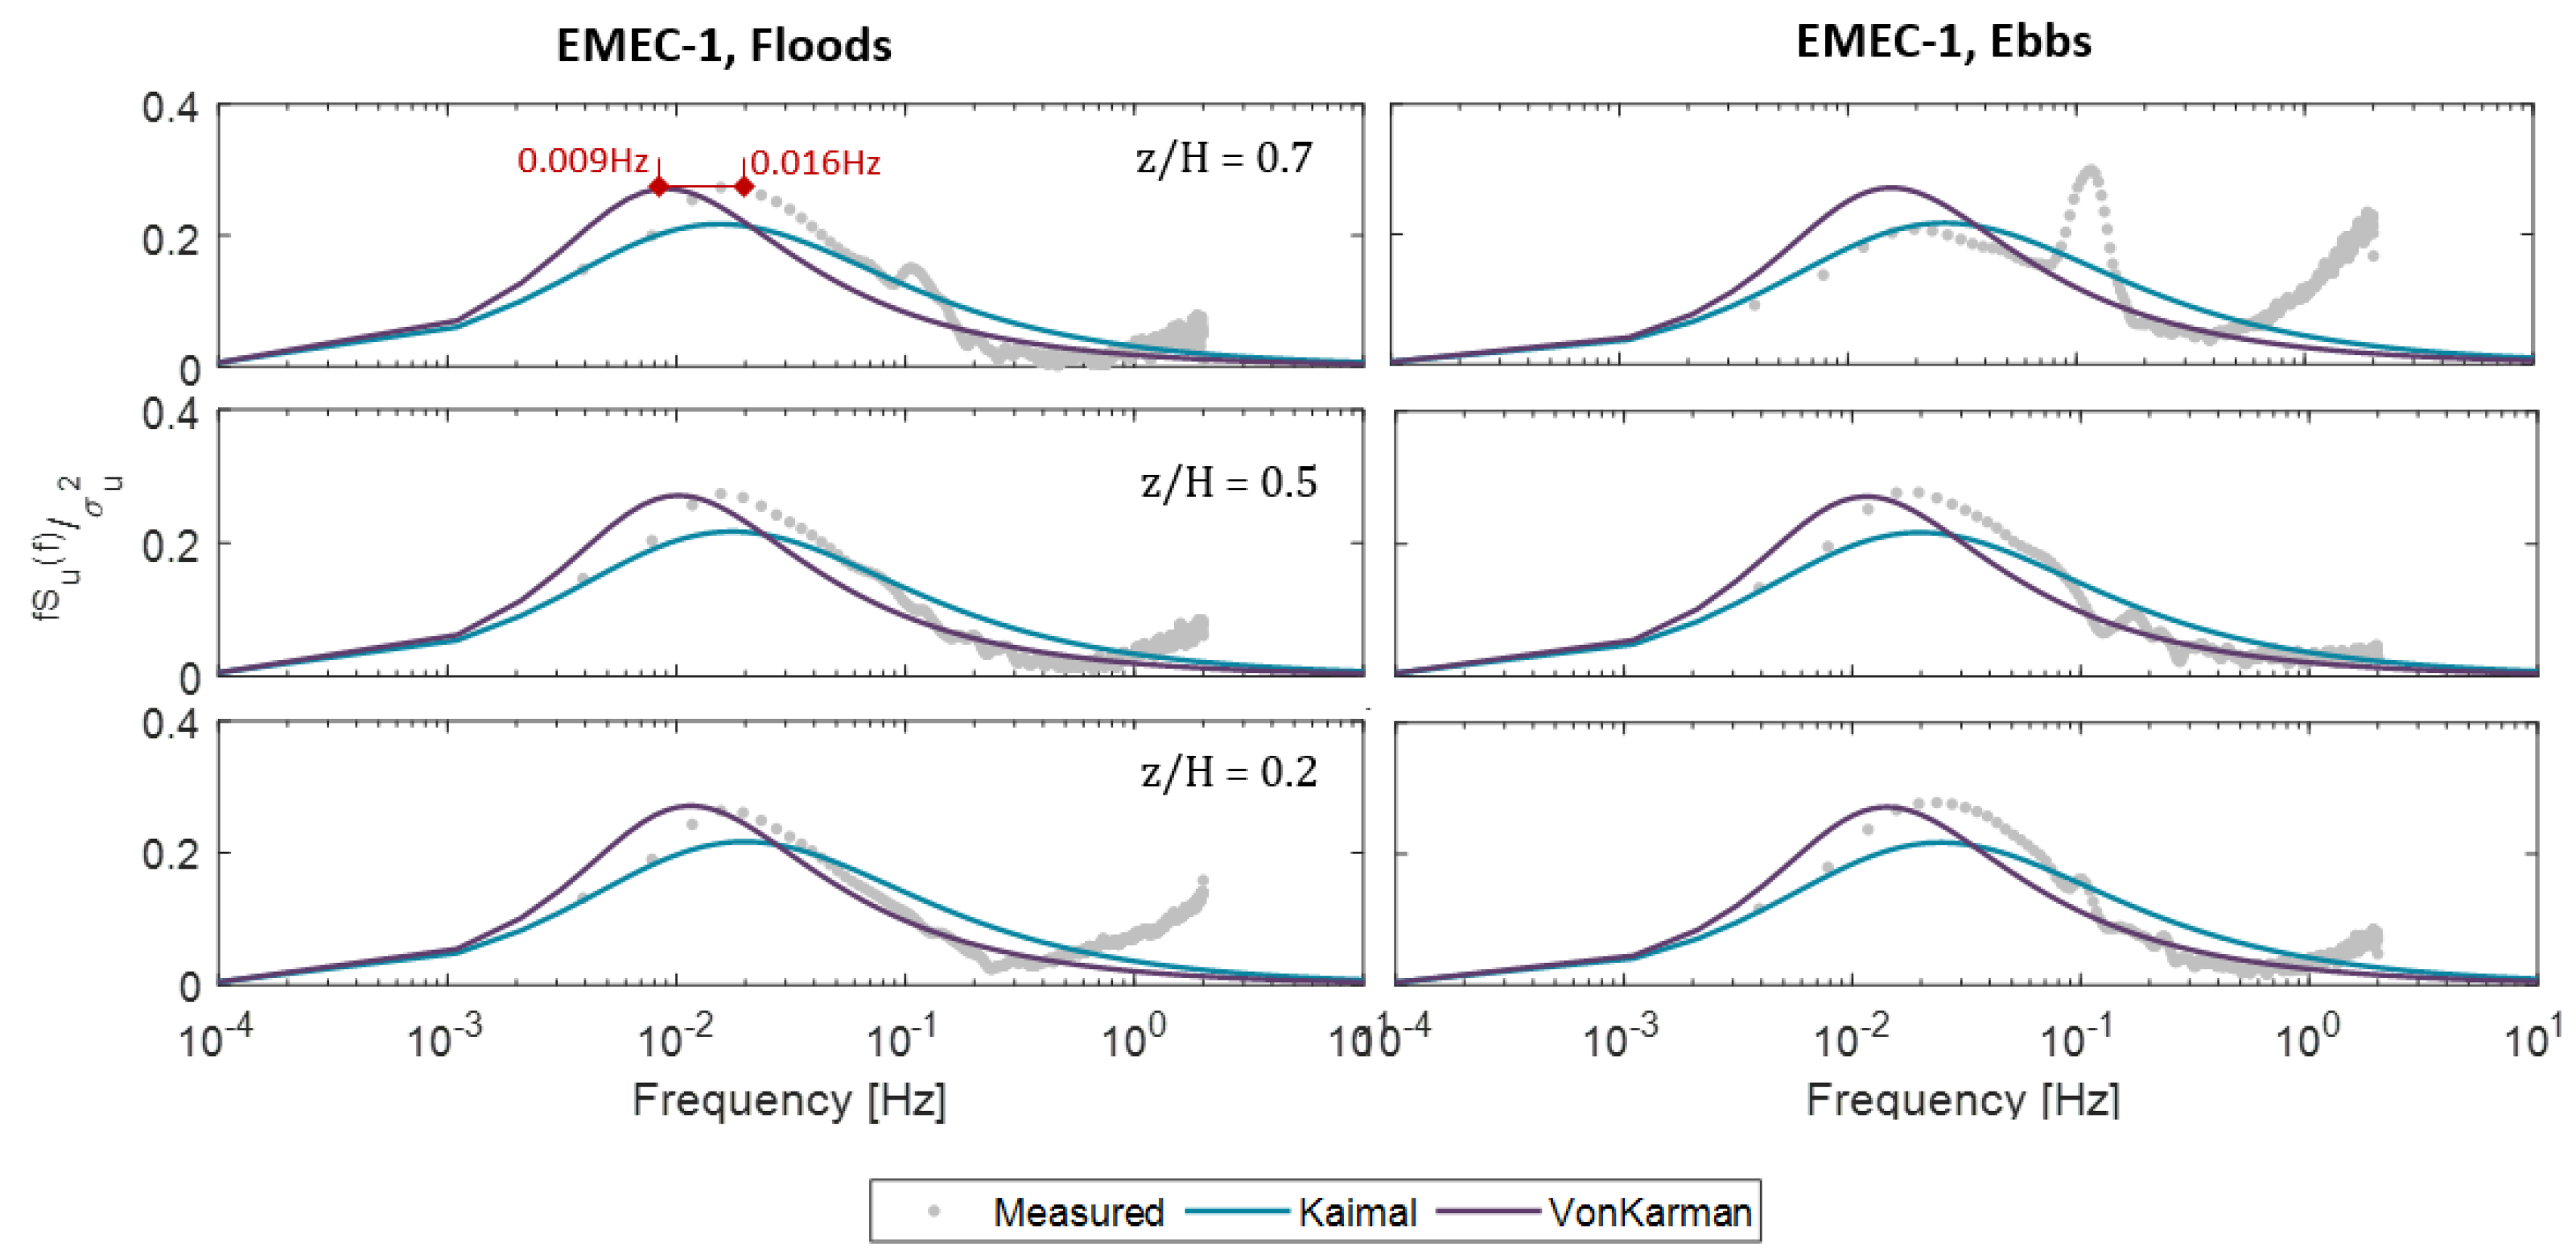
The streamwise spectrum model is compared with the measurements for the EMEC-1 dataset only as this instrument was aligned to the flow.
Figure 9 shows that, in the streamwise case, the von Kárman model better represented the measured spectra, albeit with the model peak shifted to lower frequencies. In the presented case, this means the measured energy is concentrated around a frequency almost twice as high as the model suggests. On the ebb tides, near the top of the water column, the measured spectrum deviates from the von Kármán model and aligns more to the Kaimal model. This may be due to wave interference, clearly visible as a spike at around 0.1 Hz, creating an energy deficit in the lower frequencies in the spectrum calculation.
The FORCE-1 measurements could only be analysed at a total energy level due to the instrument misalignment. Figure 10 demonstrates that, similar to the streamwise comparison of the EMEC-1 data, the von Kármán model agrees well with the total measured spectrum.

5.3. Coherence

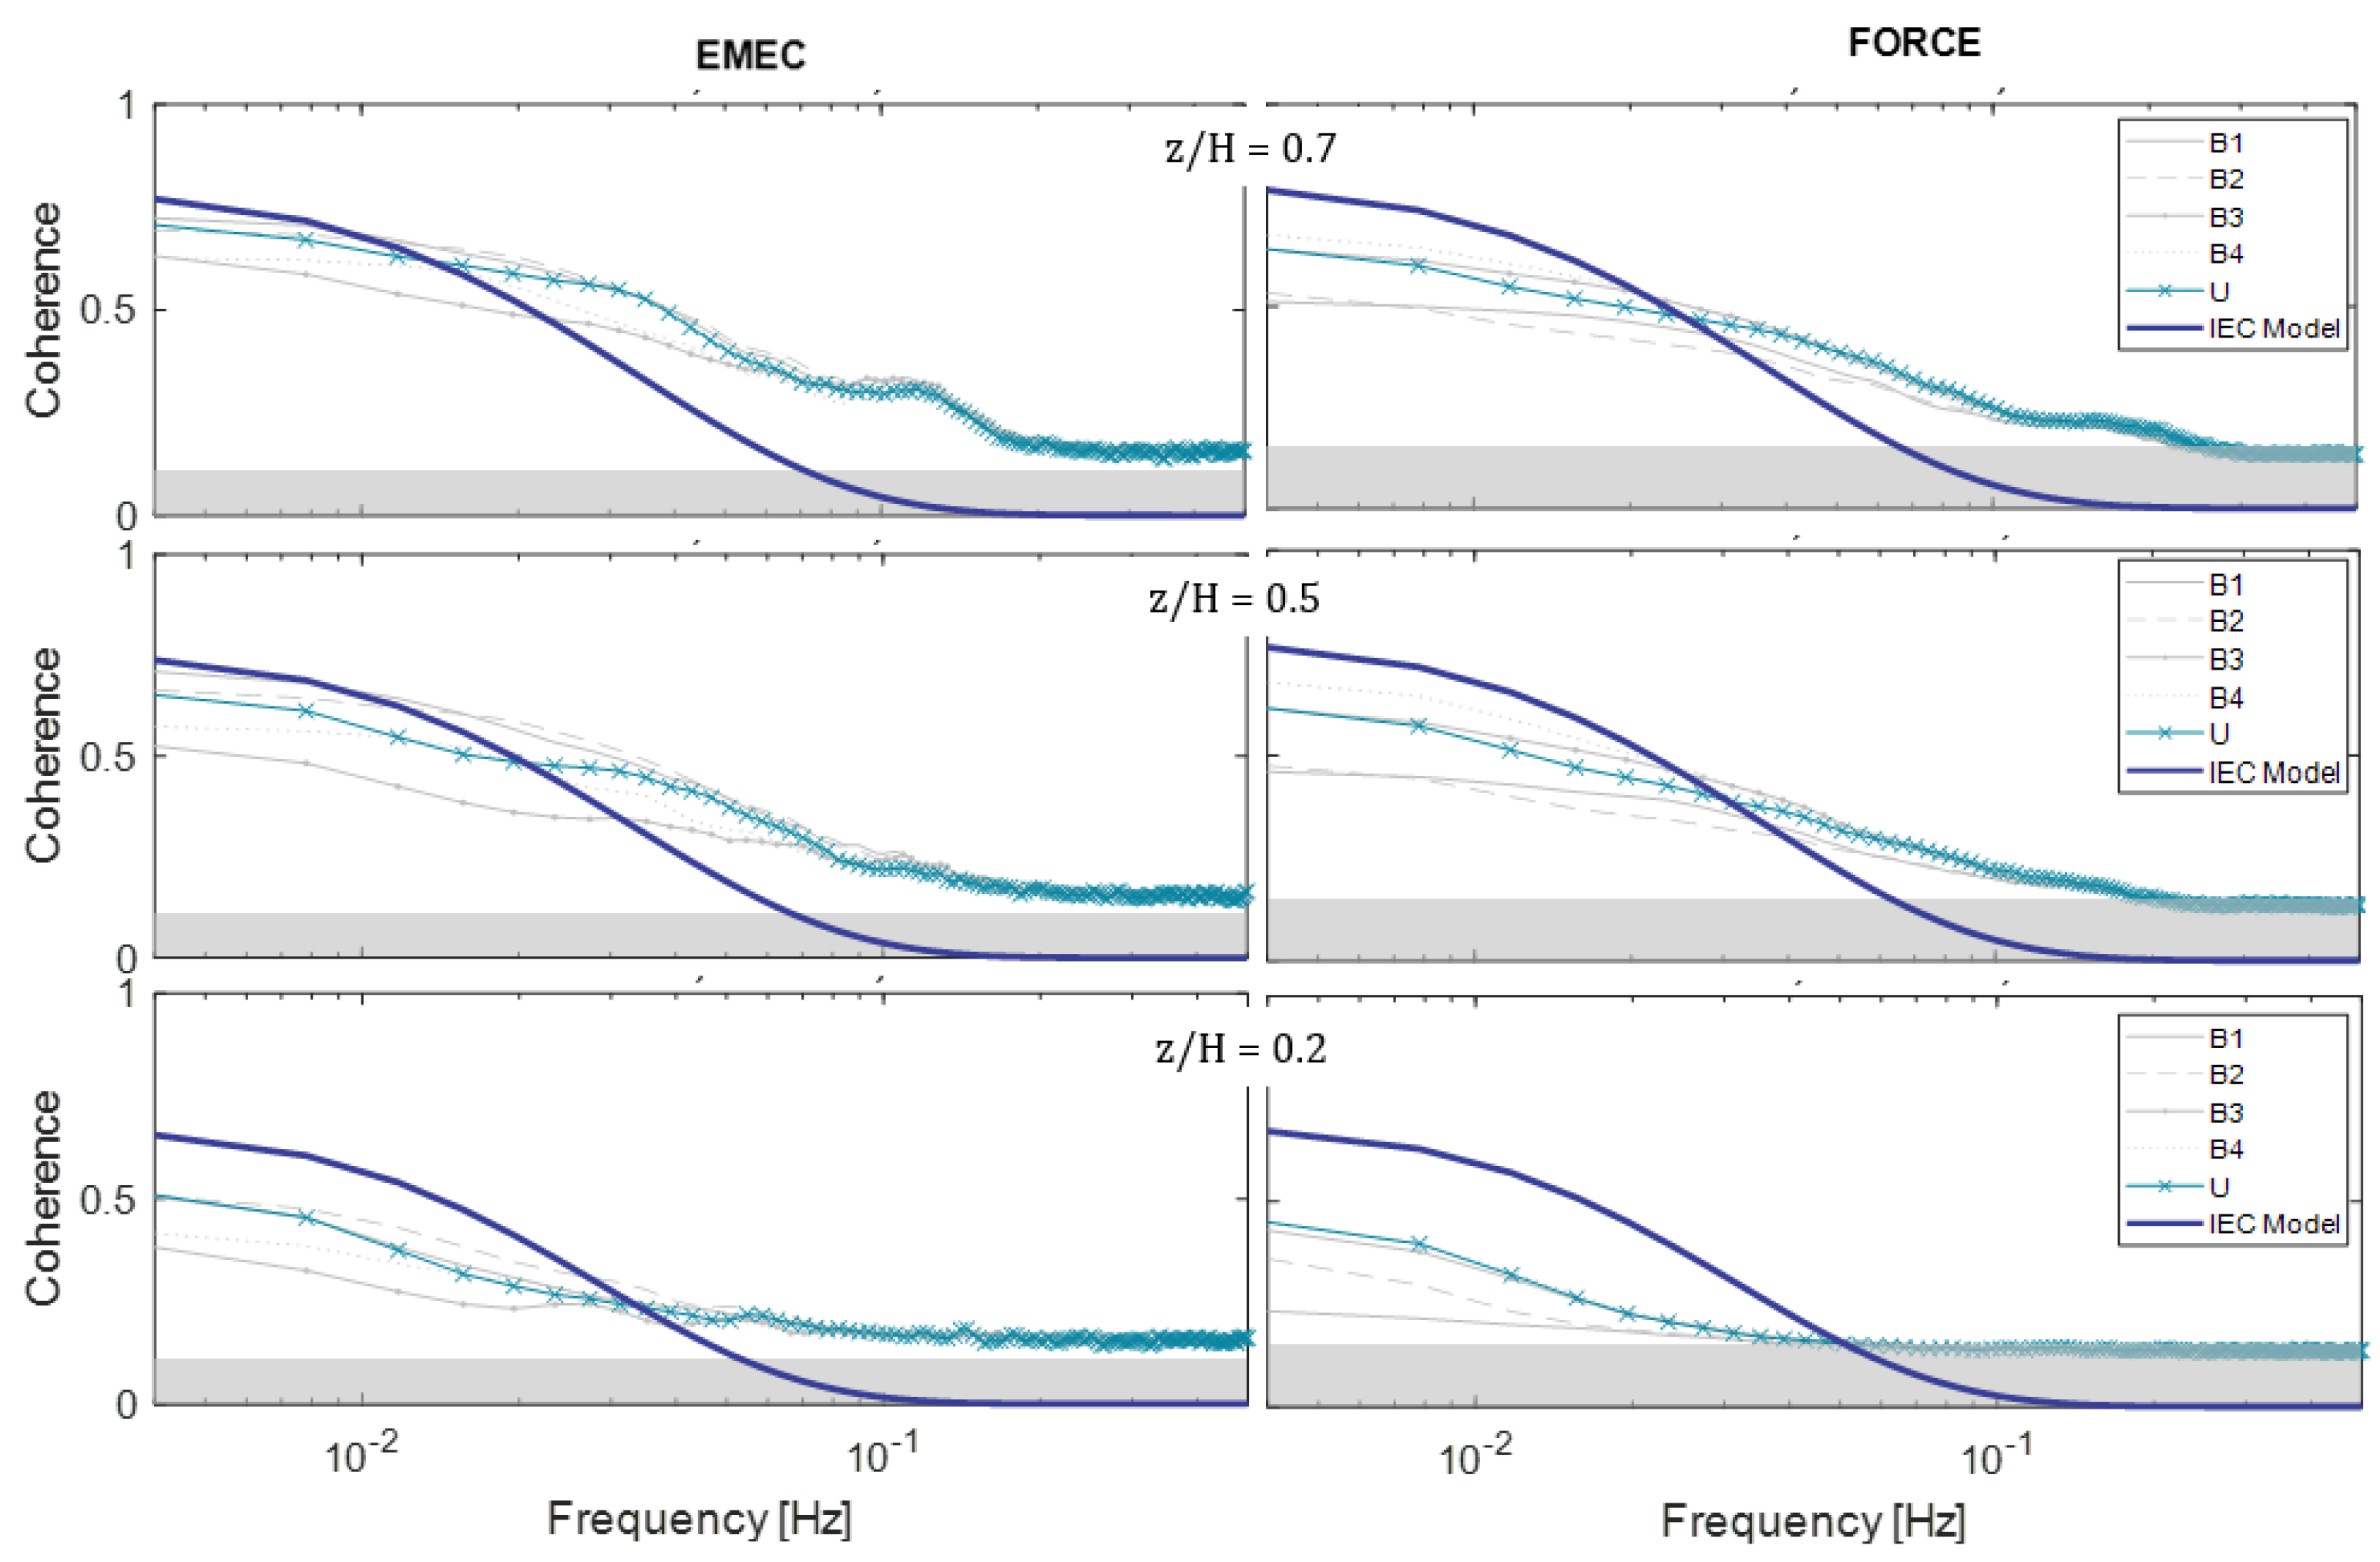
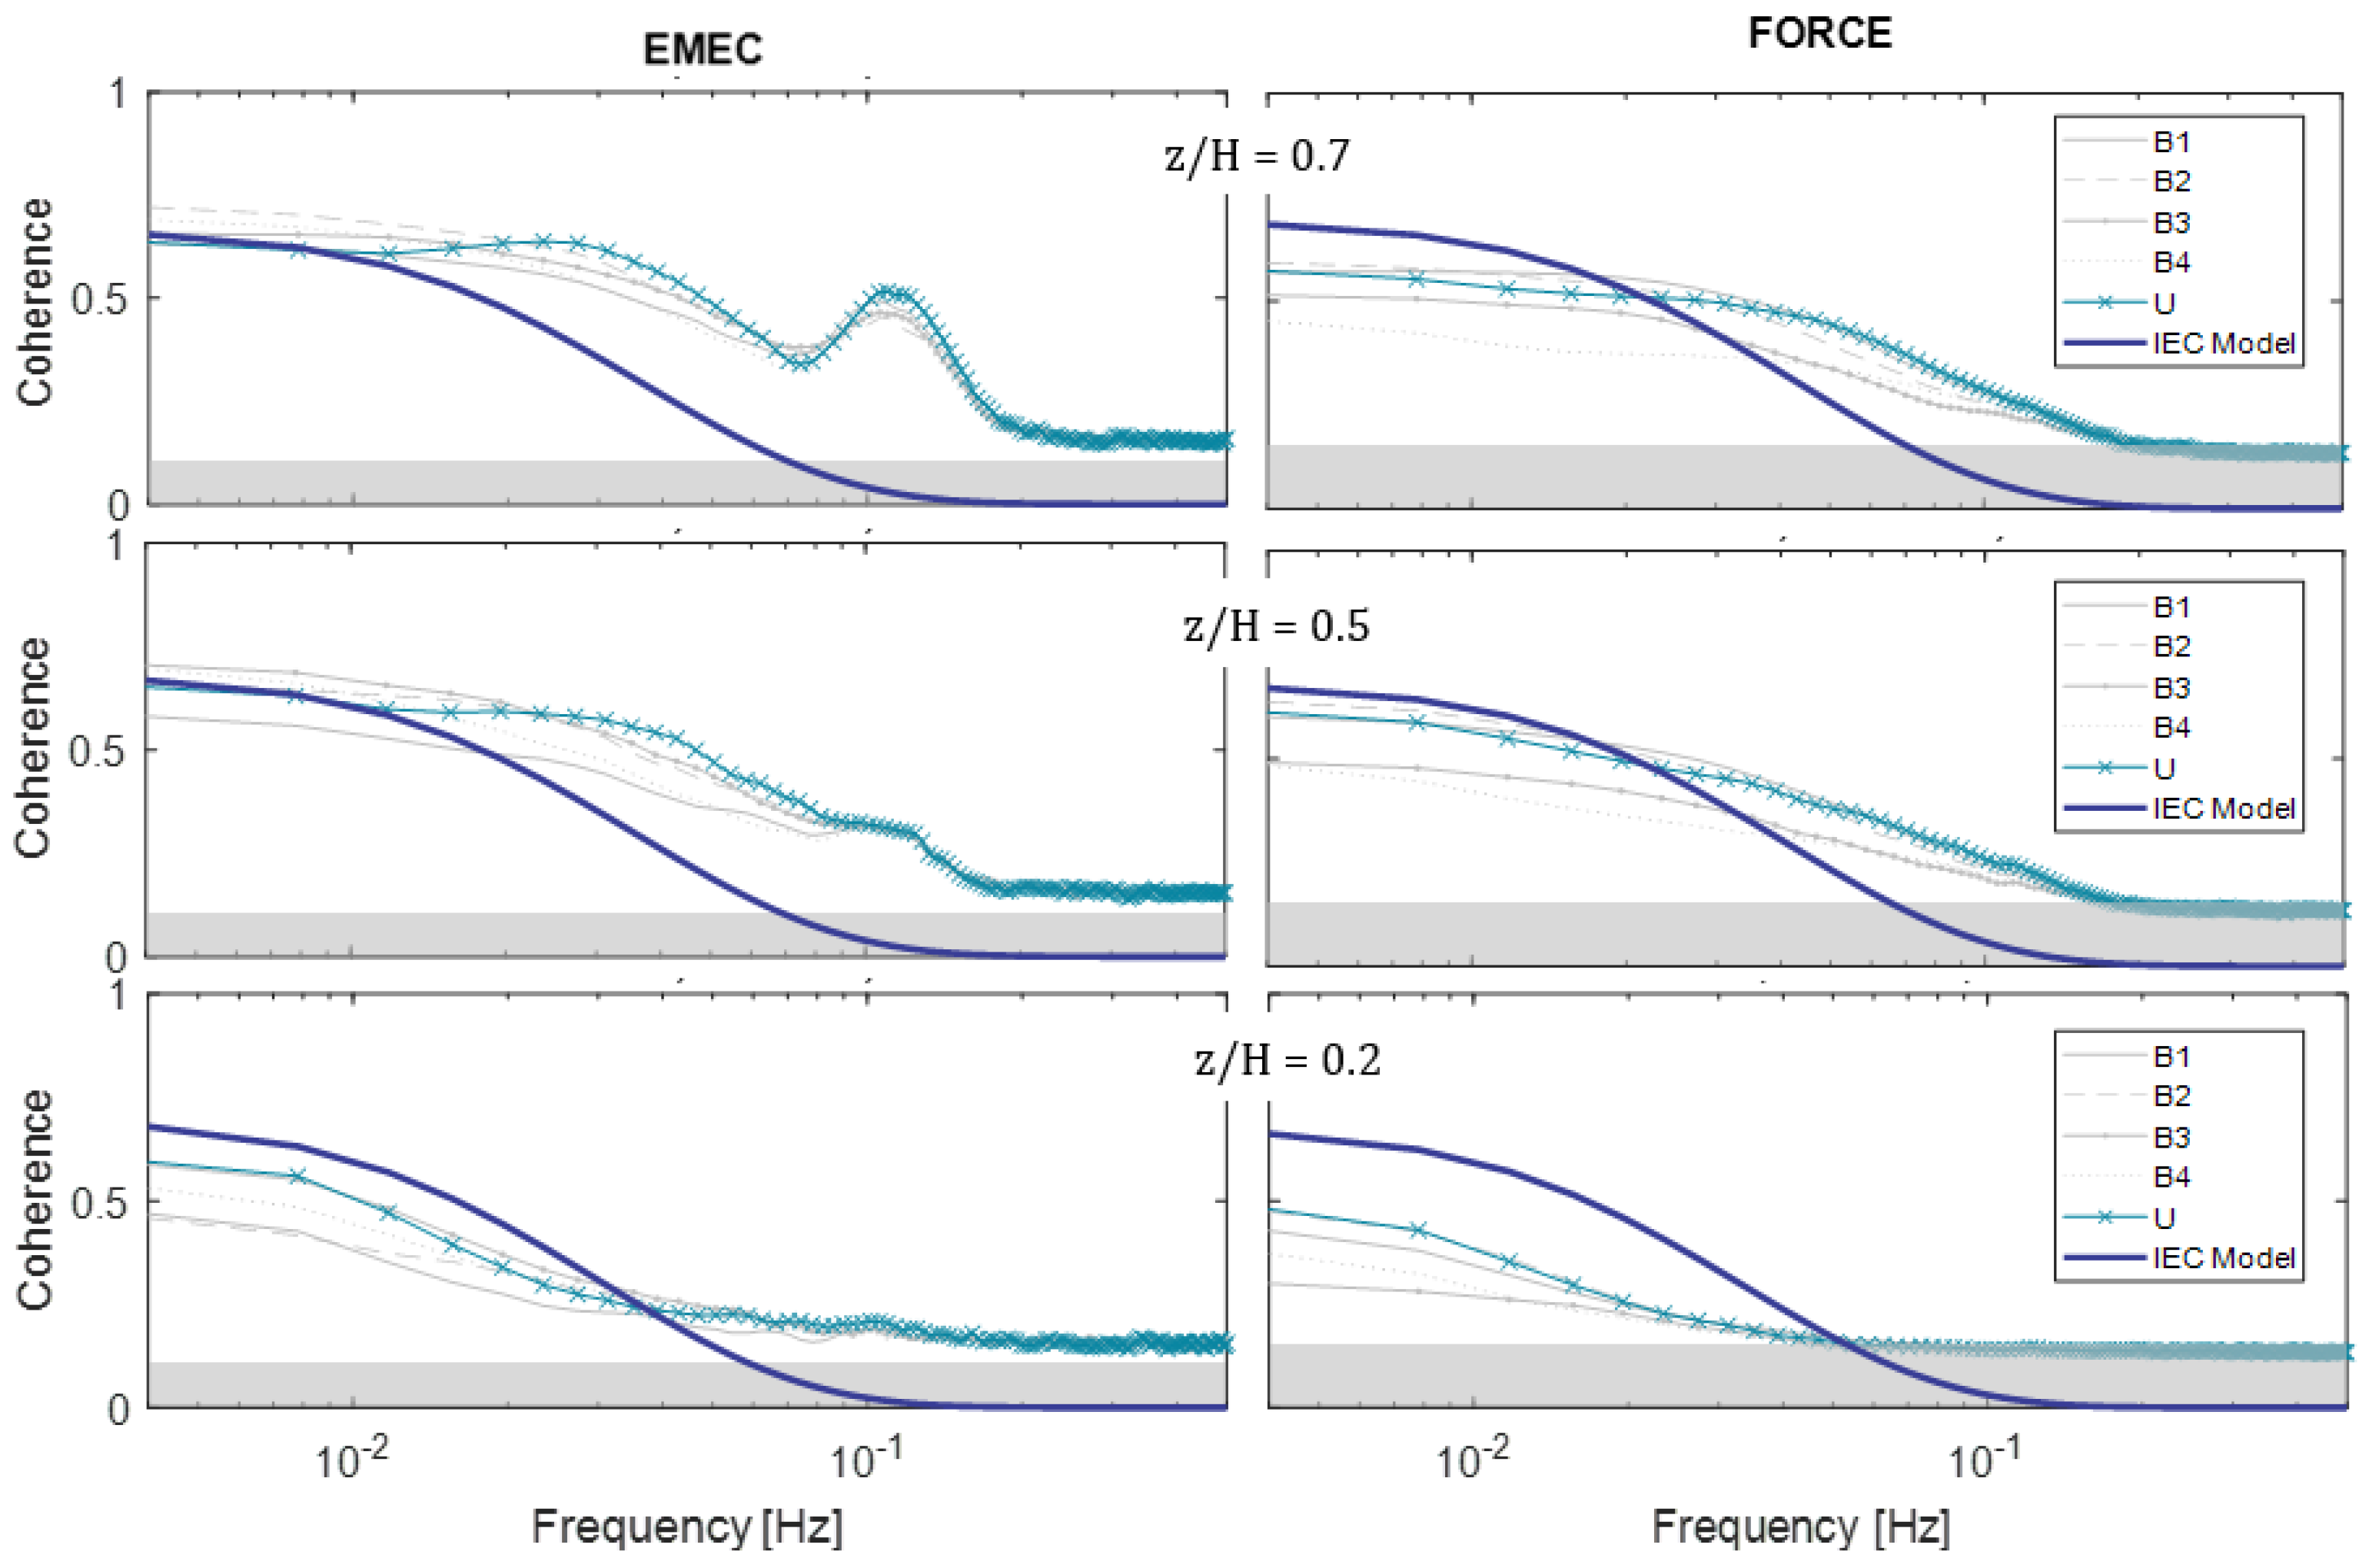
As there is no definition of the general coherence model for the vertical component, we compare the horizontal model, defined by Equation (12), to the coherence calculated from the instantaneous streamwise velocity component. Due to the uncertainty of using instantaneous data in such a way, we also include the coherence from the inclined beams for comparison. The results are presented in Figure 11 and Figure 12 and show that the EMEC-1 data agree well with the model at low frequencies in the upper water column, while the FORCE-1 data show less agreement. In both cases, the coherence curve is less steep, i.e., the measured coherence is higher in the high-frequency range. In both datasets, coherence tends to be higher in the upper water column. The measured streamwise coherence is similar to the highest beam coherence, suggesting the method used is appropriate.

5.4. Shear Profile

The shear profiles for all instruments conform to a 1/5th- or a 1/6th-power-law model relatively well on the flood cycles (Figure 13), with the FORCE-1 and FORCE-2 datasets showing the closest fit. On the ebb cycles, the EMEC-1 profiles deviate significantly from the power-law model with a three-fold increase in the sum squared error compared to the flood cycle.

5.5. Turbulence Intensity Profiles

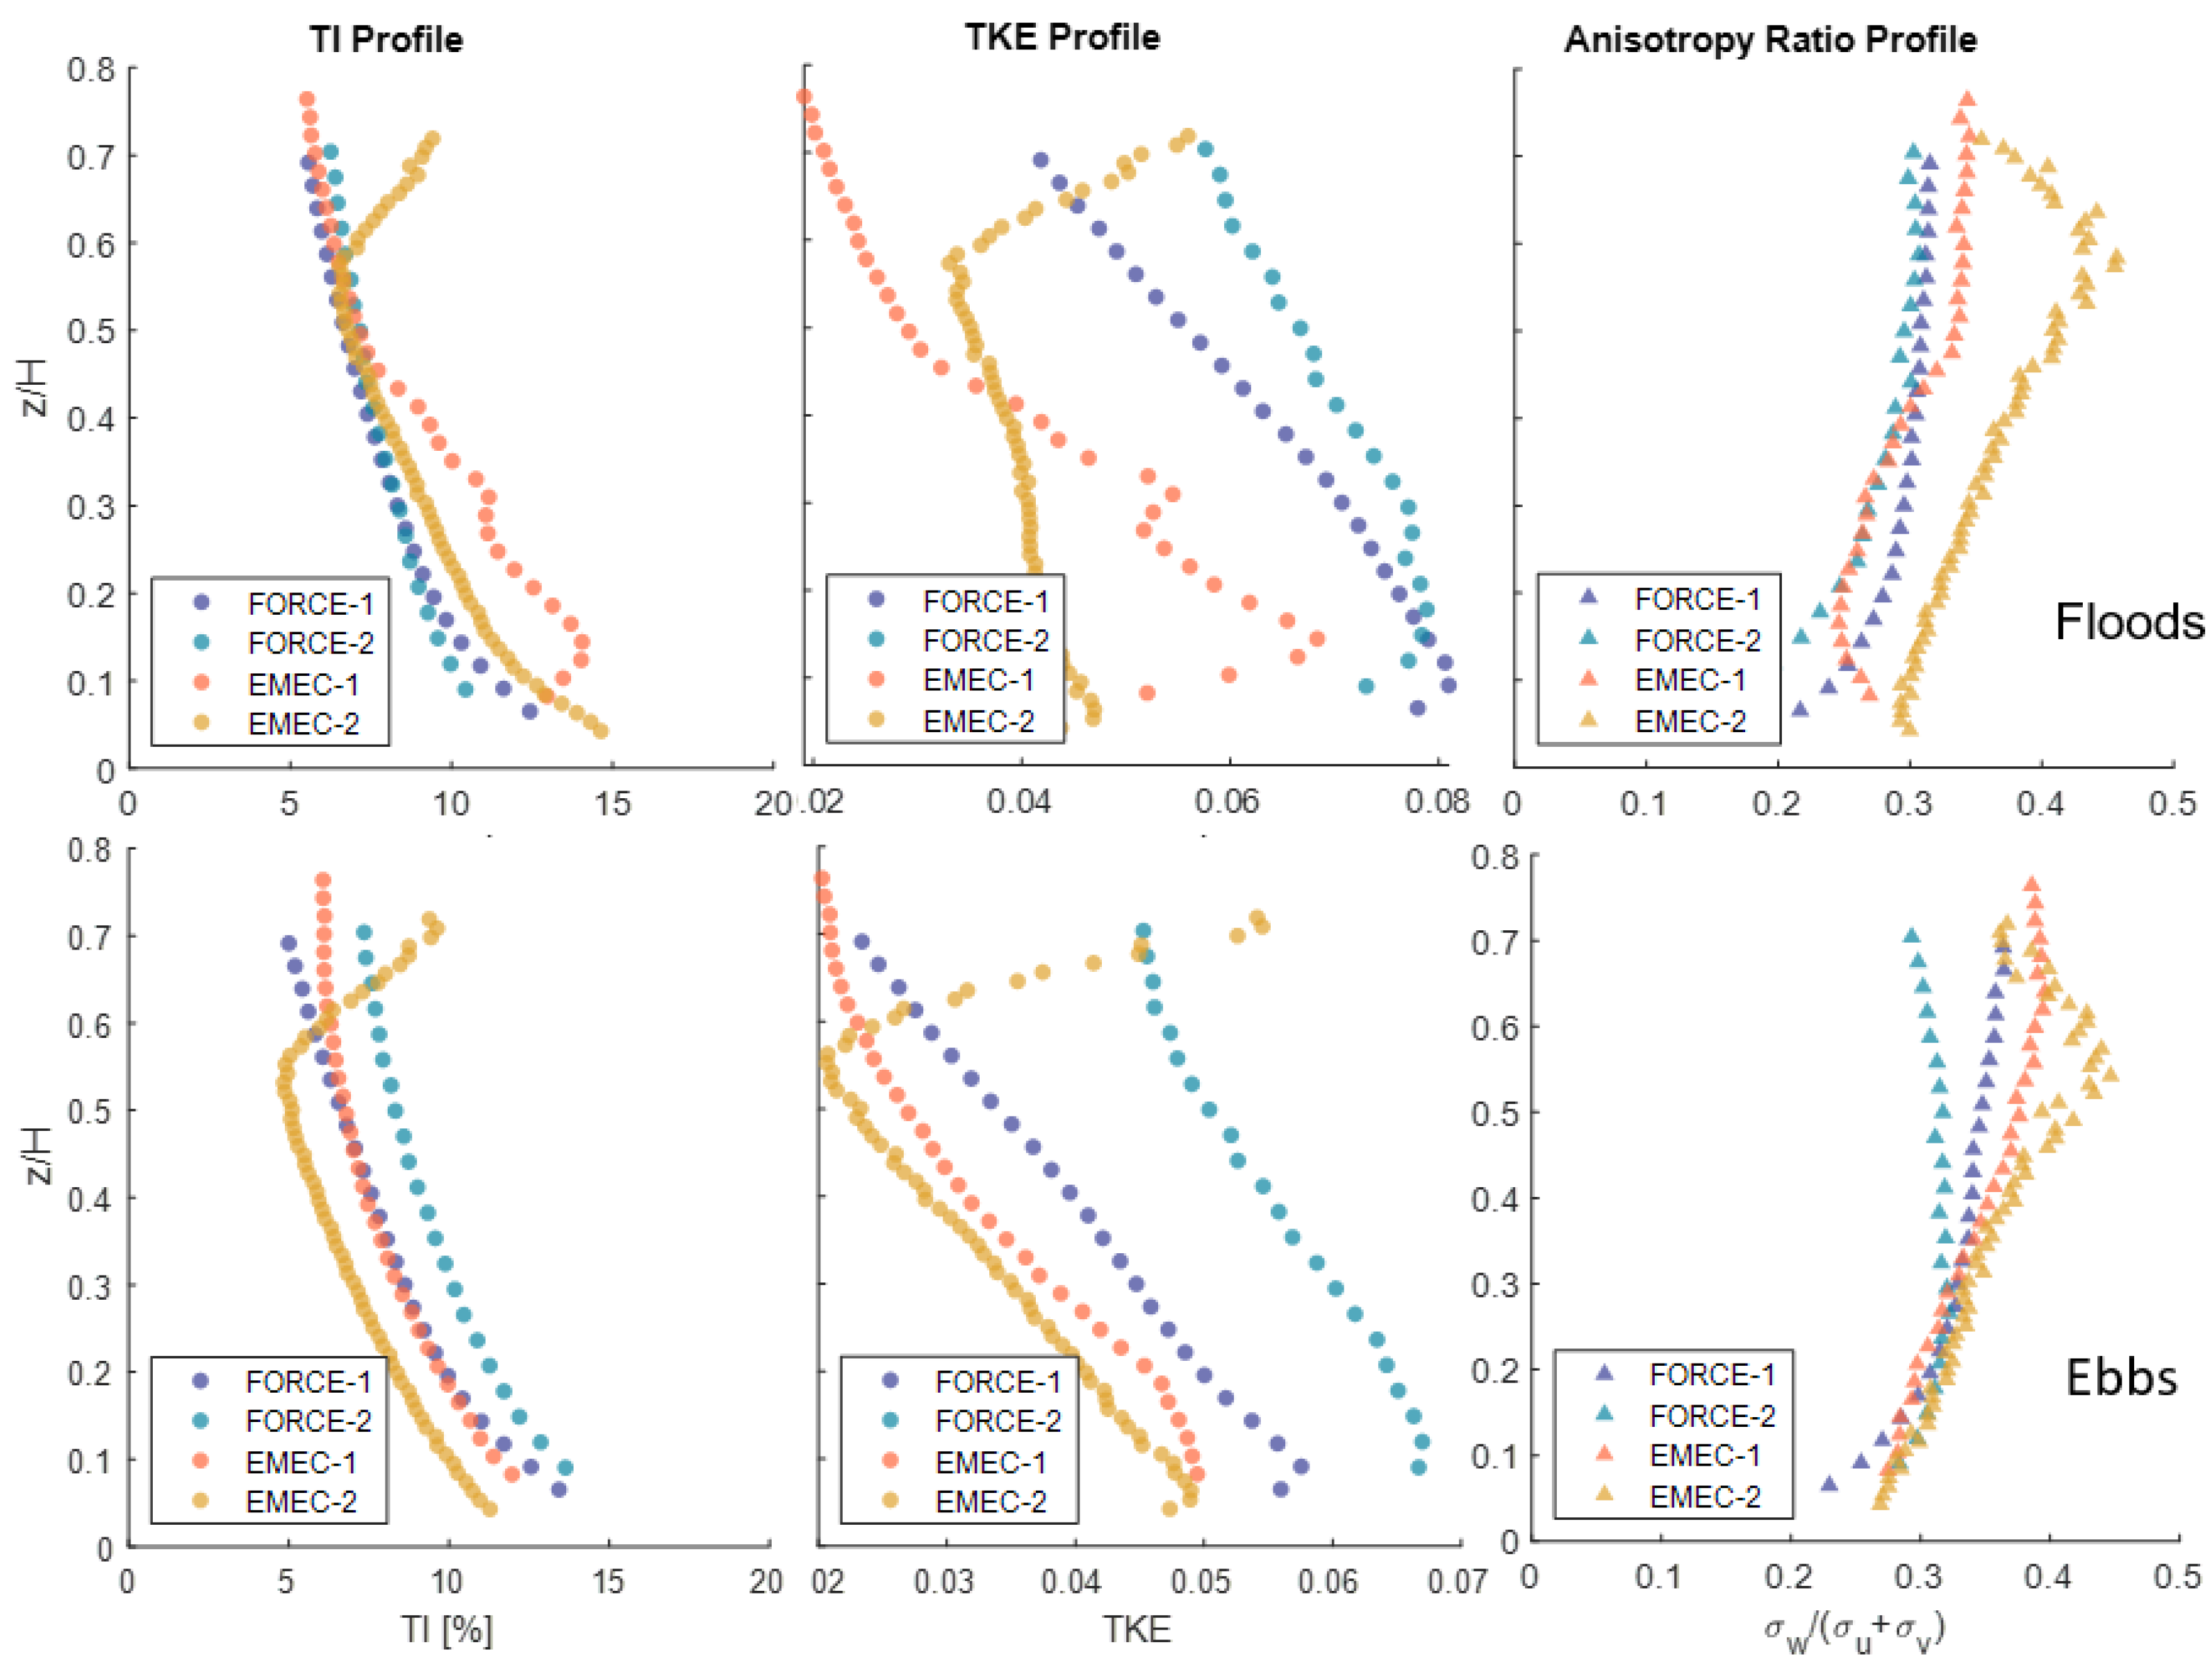
The turbulence intensity profiles across all locations are very similar on the flood tides, especially in the upper part of the water column (Figure 14). The EMEC-1 profile deviates from the rest below z / H = 0.4 ; this is likely due to bathymetry-driven turbulence, also seen in the TKE profiles. The EMEC-2 profiles deviate in the upper part of the water column across all parameters due to significant wave presence. The anisotropy ratios are also very similar for all sites, especially in the lower half of the water column, with the EMEC-2 location showing the most isotropic ratio.

6. Discussion

Commercial models, such as Tidal Bladed and TurbSim, use a combination of measured parameters and theoretical assumptions to construct turbulent flow fields using the spectral method [19], which are then used in BEM calculations. Figure 1 summarises the inputs required for such flow-field generation, which broadly consist of frequency-domain parameters and scaling parameters. The theoretical values of these parameters have been compared to measurements from two tidal sites and their applicability is discussed in this section.

6.1. Frequency Parameters (Spectrum and Coherence)

In order to define the spectrum and coherence models, length scale values must be specified. When measurements are not available, the models define the streamwise length scale, L u = 8.10 Λ U , where Λ U = 0.7 min (30 m, hub height), in line with the IEC 61400-1 wind standard. This would suggest a length scale, L u = 113 m for the mid-water column, which is almost four times more than the highest measured length scale across all datasets (Figure 5). The theoretical values are based on atmospheric turbulence and are clearly not applicable to the tidal channels analysed here, and, therefore, should not be used. Length scales can also be approximated according to open-channel flow theory, where the measured turbulent length scales across the lower half of the water column are defined as L u z H [22]. At the two sites considered, such theoretical values are not representative. Only one instrument, FORCE-2 showed agreement and only up to z / H = 0.2 , with the rest deviating significantly (Figure 6). Length scales have been found to correlate with fatigue loading [7], so, using theoretical length scale values in models is likely to significantly misrepresent loads in simulations.
The vertical velocity spectrum was well represented by the Kaimal model, although the peak was shifted towards higher frequencies in some cases; e.g., for measurements higher-up in the water column. Interestingly, for the streamwise component (and for the total spectrum), the von Kármán model showed much better agreement, again with a peak shift, but towards lower frequencies this time. This is in contrast to findings from the Grand Passage, Nova Scotia [21], where the Kaimal model was found to better predict the streamwise spectra. In previous studies [21,24,25,49], regardless of which model provided a better fit, the streamwise spectrum peak was always shifted towards low frequencies, as in this study. This shift occurs even though actual measured length scales are used as input to the spectrum model, suggesting that the issue is with the coefficients used in this semi-empirical model. In other words, even though the correct length scale is used in constructing the model, the effective length scale (determined by the position of the peak) is incorrect. The extent of this can be seen in Figure 9, where the frequency corresponding to the peak of the measured spectrum is almost double that of the model. In practice, using the ’shifted’ spectrum would mean fewer load cycles at the same magnitude than the real data would suggest. This is likely to underestimate fatigue loads. So although the general shape of the spectra seem to agree with the measurements, care must be taken that the spectrum peak is not significantly shifted.
To the authors knowledge, there have been no studies on validating the IEC coherency models for tidal-energy applications. In this study, the coherence measurements did not show a good agreement with the models, in particular for the FORCE-1 location. The measured coherence curves appear less steep with high coherency continuing into higher frequencies. It is known that, without proper consideration of spatial coherency, at least over the turbine disc area, the detailed interactions between fluid flow and devices are unlikely to be accurately resolved by simulation, whether using simplified models, such as Tidal Bladed, or even higher-order computational fluid dynamics packages [45].

6.2. Scaling Parameters (Mean Velocity and Standard Deviation Profiles)

The shear profile model and standard deviation parameters are used to scale the flow field in the time domain (see Figure 1). The recommended shear profile is a 1/7th-power-law model. It is understood from previous studies ([27,29,30]) that such a power-law model may not always be applicable to real flows. In three of the four locations, the shear profiles matched the expected shape, but showed the best fit to a 1/5th- or 1/6th-power law, suggesting a 1/7th-power law is not accurate. In line with previous studies [26,27,28,29], the EMEC-1 ebb cycle profile clearly deviates from the power-law model. It is expected that shear profiles will have implications for turbine loading. The non-uniform inflow velocity gradient across a turbine’s rotor will cause off-axis, bending moments on the shaft connection, which may be translated into the drive-train, causing excessive wear on internal components, such as bearings and seals [50]. It can also mean that the hub height velocity (typically taken as the reference velocity) is not representative of the average across the rotor disk.
The turbulence intensity profiles for the flood cycles are quite similar for all the measurement locations, with the exception of the EMEC-1 site in the lower half of the water column (see Figure 14). The peaks in EMEC-1 T K E and I suggest that there may be large energetic eddies present in this part of the channel. Some models, such as the Tidal Bladed model, represent the turbulent-flow field with a constant TKE profile, which clearly does not accord with our site measurements. Using a realistic T K E profile rather than a constant value is likely to result in different estimates of loads. In a similar way to the shear profile, it may create a non-uniform inflow gradient across a turbine’s rotor and cause eccentric blade and hub bending.
The measured anisotropy ratio profiles are similar to those measured in other studies, where α increases from 0.2 near the seabed to 0.4 near the surface [48]. The EMEC-1 site shows the highest ratios overall, suggesting the turbulence is more isotropic. When using the von Kármán model, the flow is assumed to be isotropic, i.e., the anisotropy ratio (Equation (4)) is equal to 0.5. This is clearly not the case for any of the site measurements in this study, in particular near the seabed.

6.3. Conclusions

Measured turbulence parameters from two energetic tidal sites were compared to turbulence models and assumptions typically used in the tidal energy industry. Measurements were collected from two nearby locations at FORCE and EMEC tidal sites, enabling comparison across different sites as well as within them. For the first time, we assess the suitability of the complete set of important turbulence parameters, which are used as inputs to commercial codes, such as Tidal Bladed and TurbSim.
The input parameters broadly fall into two categories: spectral representation, including spectrum and coherence models, and scaling parameters, which define the mean velocity profile as well as the overall standard deviation (or turbulence intensity).
Our findings show that the Kaimal model better represented the vertical spectrum, while von Kármán better represented the streamwise spectrum. In practice, only one model would be used, in which case either the vertical or streamwise fluctuations would be misrepresented. In line with other studies, we found that, even when the spectral model shape matched the measured spectrum, the peak was often shifted to lower frequencies. In a fatigue simulation, this would result in less frequent turbulent fluctuations (and, hence, fewer load cycles), potentially resulting in an underestimation of loads.
The measured length scales varied significantly between the four datasets, even within the same site. None of the measurements conformed well to open-channel flow theory. The measured length scales were also significantly smaller than those used as default values in commercial models. Such a large discrepancy is likely to result in significantly different loading behaviour, highlighting the importance of using a measured length scale value rather than a theoretical one.
Our results suggest that measured coherence is higher at higher frequencies and lower at lower frequencies than the IEC model predicts, although the EMEC-1 site showed slightly more agreement with the coherence model. The implication of such discrepancy on load simulations outcomes is unknown; however, it is understood that coherence is an important parameter when it comes to understanding turbulence-induced device loads.
In this study, where the measured shear profiles followed a power law, it was not a 1/7th-power law. Moreover, depending on the location of measurement, the profile can also deviate from a power law, as in the EMEC-1 case. Shear profiles are known to be important for device loads, so care must be taken to use a measured profile rather than an assumed one.
The results of this study highlight the requirement for validating flow models used in load simulations with specific site measurements. There is clearly a lot of variation across sites and within different locations in the same site. If unrepresentative models are used, the loads are likely to be over- or under-estimated, increasing the uncertainty in design.

Author Contributions

Conceptualization, A.N., D.I., I.A. and J.C.; methodology, A.N., D.I., I.A., J.C.; software, A.N.; validation, A.N., D.I. and J.C.; formal analysis, A.N. and J.C.; investigation, A.N.; resources, J.C.; data curation, A.N.; writing—original draft preparation, A.N.; writing—review and editing, A.N., D.I., I.A. and J.C.; visualization, A.N.; supervision, D.I. and I.A.; All authors have read and agreed to the published version of the manuscript.

Funding

This research was funded as part of the EPSRC and NERC Industrial Centre for Doctoral Training in Offshore Renewable Energy (IDCORE), grant number EP/S023933/1.

Data Availability Statement

3rd Party Data. Restrictions apply to the availability of the data used in this study. Data was obtained from the European Marine Energy Centre and Fundy Ocean Research Center for Energy.

Acknowledgments

The authors wish to thank Caroline Lourie from the European Marine Energy Centre for their support for this project.

Conflicts of Interest

The authors declare no conflict of interest.

Appendix A

Appendix A.1. Derivation of ADCP Misalignment Error

Beam velocities can be written in terms of u , v and w velocity components in channel co-ordinates, beam inclination angle, θ and the angle between the principle flow direction and the instrument heading, ϕ , i.e., the misalignment angle:
b 1 b 2 b 3 b 4 = s i n ( θ ) 0 c o s ( θ ) s i n ( θ ) 0 c o s ( θ ) 0 s i n ( θ ) c o s ( θ ) 0 s i n ( θ ) c o s ( θ ) × c o s ( ϕ ) s i n ( ϕ ) 0 s i n ( ϕ ) c o s ( ϕ ) 0 0 0 1 × u v w
b 1 = u s i n θ c o s ϕ v s i n θ s i n ϕ + w c o s θ ( A 2 ) b 2 = u s i n θ c o s ϕ + v s i n θ s i n ϕ + w c o s θ ( A 3 ) b 3 = u s i n θ s i n ϕ + v s i n θ c o s ϕ + w c o s θ ( A 4 ) b 4 = u s i n θ s i n ϕ v s i n θ c o s ϕ + w c o s θ ( A 5 ) b 5 = w ( A 6 )
Assuming the Doppler noise can be removed from beam velocity variances, the beam variances can be written as follows:
b 1 2 ¯ = w 2 ¯ cos 2 θ + u 2 ¯ sin 2 θ cos 2 ϕ + v 2 ¯ sin 2 θ sin 2 ϕ + u w ¯ sin 2 θ cos ϕ u v ¯ sin 2 θ sin 2 ϕ v w ¯ sin 2 θ sin ϕ b 2 2 ¯ = w 2 ¯ cos 2 θ + u 2 ¯ sin 2 θ cos 2 ϕ + v 2 ¯ sin 2 θ sin 2 ϕ + v w ¯ sin 2 θ sin ϕ u v ¯ sin 2 θ sin 2 ϕ u w ¯ sin 2 θ cos ϕ b 3 2 ¯ = w 2 ¯ cos 2 θ + v 2 ¯ sin 2 θ cos 2 ϕ + u 2 ¯ sin 2 θ sin 2 ϕ + u v ¯ sin 2 θ sin 2 ϕ + u w ¯ sin 2 θ sin ϕ + v w ¯ sin 2 θ cos ϕ b 4 ¯ = w 2 ¯ cos 2 θ + v 2 ¯ sin 2 θ cos 2 ϕ + u 2 ¯ sin 2 θ sin 2 ϕ + u v ¯ sin 2 θ sin 2 ϕ u w ¯ sin 2 θ sin ϕ v w ¯ sin 2 θ cos ϕ b 5 ¯ = w 2 ¯
We can substitute the beam variance equations above into the variance method equations below to obtain the channel co-ordinate component variances (as sampled by a misaligned beam). In this example, it is assumed beam numbers 1 and 2, and 3 and 4, are opposite; the numbering convention may change depending on the ADCP instrument.
Variance method equations:
u 2 ¯ = b 1 ¯ + b 2 ¯ 2 b 5 ¯ c o s 2 ( θ ) 2 s i n 2 ( θ ) v 2 ¯ = b 3 2 ¯ + b 4 2 ¯ 2 b 5 2 ¯ c o s 2 ( θ ) 2 s i n 2 ( θ ) w 2 ¯ = b 5 2 ¯ u w ¯ = b 2 2 ¯ b 1 2 ¯ 2 s i n ( 2 θ ) v w ¯ = b 4 2 ¯ b 3 2 ¯ 2 s i n ( 2 θ )
From the above parameters, the total kinetic energy and anisotropy ratios can also be calculated as follows:
α = w 2 ¯ u 2 ¯ + v 2 ¯ q 2 2 = u 2 ¯ + v 2 ¯ + w 2 ¯ 2
Approximate parameters in terms of the ’true’ values and misalignment angle:
u 2 ¯ 1 = u 2 ¯ cos 2 ϕ + v 2 ¯ sin 2 ϕ u v ¯ sin 2 ϕ v 2 ¯ 1 = v 2 ¯ cos 2 ϕ + u 2 ¯ sin 2 ϕ + u v ¯ sin 2 ϕ u w ¯ 1 = sin 2 θ csc 2 θ u 2 cos 2 ϕ + v 2 sin 2 ϕ u v sin 2 ϕ v w ¯ 1 = sin 2 θ csc 2 θ v 2 cos 2 ϕ + u 2 sin 2 ϕ + v u sin 2 ϕ q 2 2 1 = u 2 ¯ 1 + v ¯ 1 + w 2 ¯ 2 = u 2 ¯ + v 2 ¯ + w 2 ¯ 2 α = w 2 ¯ u 2 ¯ 1 + v ¯ 1 = w 2 ¯ u 2 ¯ + v ¯

References

  1. Frost, C. Cost Reduction Pathway of Tidal Stream Energy in the UK and France. Available online: https://ore.catapult.org.uk/?orecatapultreports=cost-reduction-pathway-of-tidal-stream-energy-in-the-uk-and-france (accessed on 12 February 2023).
  2. Marine Renewables Canada, Tidal Energy Facts. Available online: https://marinerenewables.ca/facts/tidal-energy/ (accessed on 12 February 2023).
  3. West, C. Contracts for Difference Allocation Round 4 Results. The Department for Business, Energy and Industrial Strategy. Available online: https://www.gov.uk/government/publications/contracts-for-difference-cfd-allocation-round-4-results (accessed on 7 July 2022).
  4. European Commission. Ocean Energy Strategic Roadmap: Building Ocean Energy for Europe. In Ocean Energy Forum; European Commission: Brussels, Belgium, 2016; p. 74. [Google Scholar]
  5. Scarlett, G.T.; Viola, I.M. Unsteady hydrodynamics of tidal turbine blades. Renew. Energy 2020, 146, 843–855. [Google Scholar] [CrossRef]
  6. McCann, G.; Thomson, M.; Hitchcock, S.; Hassan, G. Implications of Site-Specific Conditions on the Prediction of Loading and Power Performance of a Tidal Stream Device. In Proceedings of the 2nd International Conference on Ocean Energy (ICOE), Brest, France, 15–17 October 2008; pp. 15–17. [Google Scholar]
  7. Blackmore, T.; Myers, L.E.; Bahaj, A.S.; Gaurier, B.; Myers, L.; Germain, G. The Effect of Freestream Turbulence on Tidal Turbines. In Proceedings of the 11th European Wave and Tidal Energy Conference, Nantes, France, 6–11 September 2015. [Google Scholar]
  8. Milne, I.A.; Day, A.H.; Sharma, R.N.; Flay, R.G. Blade loading on tidal turbines for uniform unsteady flow. Renew. Energy 2015, 77, 338–350. [Google Scholar] [CrossRef]
  9. Clark, T.; Roc, T.; Fisher, S.; Minns, N. Part 3: Turbulence and turbulent effects in turbine and array engineering. Turbul. Best Pract. Tidal Power Ind. 2015, 21. [Google Scholar]
  10. Milne, I.A.; Day, A.H.; Sharma, R.N.; Flay, R.G. The characterisation of the hydrodynamic loads on tidal turbines due to turbulence. Renew. Sustain. Energy Rev. 2016, 56, 851–864. [Google Scholar] [CrossRef]
  11. Ortega, A.; Tomy, J.P.; Shek, J.; Paboeuf, S.; Ingram, D. An inter-comparison of dynamic, fully coupled, electro-mechanical, models of tidal turbines. Energies 2020, 13, 5389. [Google Scholar] [CrossRef]
  12. PD IEC/TS 62600-2; 2019 BSI Standards Publication Marine Energy—Wave, Tidal and Other Water Current Converters. International Electrotechnical Commission: London, UK, 2019; p. 62.
  13. DNVGL-ST-0.164; Tidal Turbines. DNV-GL: Bærum, Norway, 2015; p. 230.
  14. Gualtieri, G.; Emejeamara, F.C.; Tomlin, A.S.; Micallef, D.; Bussel, G.V.; Ishugah, T.F.; Li, Y.; Wang, R.Z.; Kiplagat, J.K.; Millward-Hopkins, J.T.; et al. BSI Standards Publication Wind Energy Generation Systems BS EN IEC 61400-1 2019. Available online: https://standards.iteh.ai/catalog/standards/clc/9027bc84-08bf-485d-b139-0869e8a96b59/en-iec-61400-1-2019 (accessed on 5 April 2019).
  15. Neil Kelley National Renewable Energy Laboratory. TurbSim User’s Guide: Version 1. 50 TurbSim User’s Guide; Neil Kelley National Renewable Energy Laboratory: Golden, CO, USA, 2009. [Google Scholar]
  16. Lu, Y.; Lueck, R.G. Using a Broadband ADCP in a Tidal Channel. Part II: Turbulence. J. Atmos. Ocean. Technol. 1999, 16, 1568–1579. [Google Scholar] [CrossRef]
  17. Burton, T. Wind Energy Handbook; John Wiley & Sons, Ltd.: Hoboken, NJ, USA, 2001; p. 368. [Google Scholar]
  18. Pope, S.B. Turbulent Flows; Cambridge University Press: Cambridge, UK, 2000. [Google Scholar] [CrossRef]
  19. Jonkman, B.; Kilcher, L. TurbSim User’s Guide; National Renewable Energy Laboratory: Golden, CO, USA, 2012; pp. 1–87. [Google Scholar]
  20. Khairuzzaman, M.Q. Tidal Bladed Theory Manual. 2016. [Google Scholar]
  21. McMillan, J. Turbulence Measurements in a High Reynolds Number Tidal Channel. Ph.D. Thesis, Dalhousie University, Halifax, NS, Canada, 2017. [Google Scholar]
  22. Nezu, I.; Nakagawa, H. Turbulence in Open Channel Flows; IAHR Monograph: Madrid, Spain, 1993. [Google Scholar]
  23. Sellar, B.G.; Sutherland, D.R. Tidal Energy Site Characterisation At the Fall of Warness, Emec, Uk Energy Technologies Institute Redapt Ma1001 (Md3.8). 2016. 1001. Available online: https://redapt.eng.ed.ac.uk/?p=library_redapt_reports (accessed on 1 February 2023).
  24. Milne, I.A.; Sharma, R.N.; Flay, R.G. The structure of turbulence in a rapid tidal flow. Proc. R. Soc. A Math. Phys. Eng. Sci. 2017, 473. [Google Scholar] [CrossRef]
  25. Walter, R.K.; Nidzieko, N.J.; Monismith, S.G. Similarity scaling of turbulence spectra and cospectra in a shallow tidal flow. J. Geophys. Res. Ocean. 2011, 116, 1–14. [Google Scholar] [CrossRef]
  26. Parkinson, S.G.; Collier, W.J. Model validation of hydrodynamic loads and performance of a full-scale tidal turbine using Tidal Bladed. Int. J. Mar. Energy 2016, 16, 279–297. [Google Scholar] [CrossRef]
  27. Gunn, K.; Stock-Williams, C. On validating numerical hydrodynamic models of complex tidal flow. Int. J. Mar. Energy 2013, 3–4, e82–e97. [Google Scholar] [CrossRef]
  28. Greenwood, C.; Vogler, A.; Venugopal, V. On the variation of turbulence in a high-velocity tidal channel. Energies 2019, 12, 672. [Google Scholar] [CrossRef]
  29. McNaughton, J.; Rolfo, S.; Apsley, D.D.; Stallard, T.; Stansby, P.K. CFD power and load prediction on a 1MW tidal stream turbine. In Proceedings of the 10th European Wave and Tidal Energy Conference, Aalborg, Denmark, 2–5 September 2013; Volume 3. [Google Scholar]
  30. Togneri, M.; Masters, I. Micrositing variability and mean flow scaling for marine turbulence in Ramsey Sound. J. Ocean Eng. Mar. Energy 2016, 2, 35–46. [Google Scholar] [CrossRef]
  31. Kelley, N.D.; Jonkman, B.J.J. Overview of the TurbSim Stochastic Inflow Turbulence Simulator: Version 1.21; (Revised 1 February 2001); U.S. Department of Energy Office of Scientific and Technical Information: Kansas City, MI, USA, 2007; pp. 1–13. [CrossRef]
  32. Harrold, M.; Ouro, P. Rotor loading characteristics of a full-scale tidal turbine. Energies 2019, 12, 1035. [Google Scholar] [CrossRef]
  33. Ouro, P.; Stoesser, T. Impact of Environmental Turbulence on the Performance and Loadings of a Tidal Stream Turbine. Flow Turbul. Combust. 2019, 102, 613–639. [Google Scholar] [CrossRef]
  34. Integrated Ocean Observing System. Manual for Real-Time Quality Control of Stream Flow Observations (Qartod) v2.1; Integrated Ocean Observing System: Silver Spring, MD, USA, 2019. [CrossRef]
  35. Nortek. Signature Manual; Principles of Operation; Nortek: Rud, Norway, 2018. [Google Scholar]
  36. Thomson, J.; Polagye, B.; Durgesh, V.; Richmond, M.C. Measurements of turbulence at two tidal energy sites in puget sound, WA. IEEE J. Ocean. Eng. 2012, 37, 363–374. [Google Scholar] [CrossRef]
  37. Sellar, B.G.; Wakelam, G.; Sutherland, D.R.; Ingram, D.M.; Venugopal, V. Characterisation of tidal flows at the european marine energy centre in the absence of ocean waves. Energies 2018, 11, 176. [Google Scholar] [CrossRef]
  38. Durgesh, V.; Thomson, J.; Richmond, M.C.; Polagye, B.L. Noise correction of turbulent spectra obtained from acoustic doppler velocimeters. Flow Meas. Instrum. 2014, 37, 29–41. [Google Scholar] [CrossRef]
  39. Lu, Y.; Lueck, R.G. Using a broadband ADCP in a tidal channel. Part I: Mean flow and shear. J. Atmos. Ocean. Technol. 1999, 16, 1556–1567. [Google Scholar] [CrossRef]
  40. Milne, I.; Graham, J.; Coles, D. On the scaling of turbulence in a high Reynolds number tidal flow. J. Fluid Mech. 2021, 915, A104. [Google Scholar] [CrossRef]
  41. Dewey, R.K.; Stringer, S. Reynolds Stresses and Turbulent Kinetic Energy Estimates from Various ADCP Beam Configurations: Theory. J. Phys. Oceanogr. 2007, 2, 1–35. [Google Scholar] [CrossRef]
  42. Thomson, J.; Kilcher, L.; Harding, S. Multi-scale Turbulence at Tidal Energy Sites. In Proceedings of the 5th International Conference on Ocean Energy, Halifax, NS, Canada, 4–6 November 2014; pp. 1–6. [Google Scholar]
  43. Kilcher, L.F.; Thomson, J.; Colby, J. Determining the spatial coherence of turbulence at mhk sites. In Proceedings of the 2nd Marine Energy Technology Symposium, Seattle, WA, USA, 15–18 April 2014; pp. 1–7. [Google Scholar]
  44. Schlipf, D.; Trabucchi, D.; Bischoff, O. Testing of Frozen Turbulence Hypothesis for Wind Turbine Applications with a Scanning LIDAR System. Univ. Stuttg. 2010, 12, 5410. [Google Scholar]
  45. Clark, T.; Black, K.; Ibrahim, J.; Hernon, J.; White, R.; Minns, N.; Fisher, S. Part 2: Data processing, classification and characterisation of turbulent flows. Turbul. Best Pract. Tidal Power Ind. 2015. [Google Scholar]
  46. Guerra, M.; Thomson, J. Turbulence measurements from five-beam acoustic doppler current profilers. J. Atmos. Ocean. Technol. 2017, 34, 1267–1284. [Google Scholar] [CrossRef]
  47. Thiébaut, M.; Filipot, J.F.; Maisondieu, C.; Damblans, G.; Duarte, R.; Droniou, E.; Guillou, S. Assessing the turbulent kinetic energy budget in an energetic tidal flow from measurements of coupled ADCPs. Phil. Trans. R. Soc 2020, 378, 20190496. [Google Scholar] [CrossRef]
  48. Vermeulen, B.; Hoitink, A.J.; Sassi, M.G. Coupled ADCPs can yield complete Reynolds stress tensor profiles in geophysical surface flows. Geophys. Res. Lett. 2011, 38, 2–7. [Google Scholar] [CrossRef]
  49. Milne, I.A.; Sharma, R.N.; Flay, R.G.; Bickerton, S. Characteristics of the turbulence in the flow at a tidal stream power site. Philos. Trans. R. Soc. A Math. Phys. Eng. Sci. 2013, 371, 0120196. [Google Scholar] [CrossRef]
  50. Nevalainen, T.M.; Johnstone, C.M.; Grant, A.D. A sensitivity analysis on tidal stream turbine loads caused by operational, geometric design and inflow parameters. Int. J. Mar. Energy 2016, 16, 51–64. [Google Scholar] [CrossRef] [Green Version]
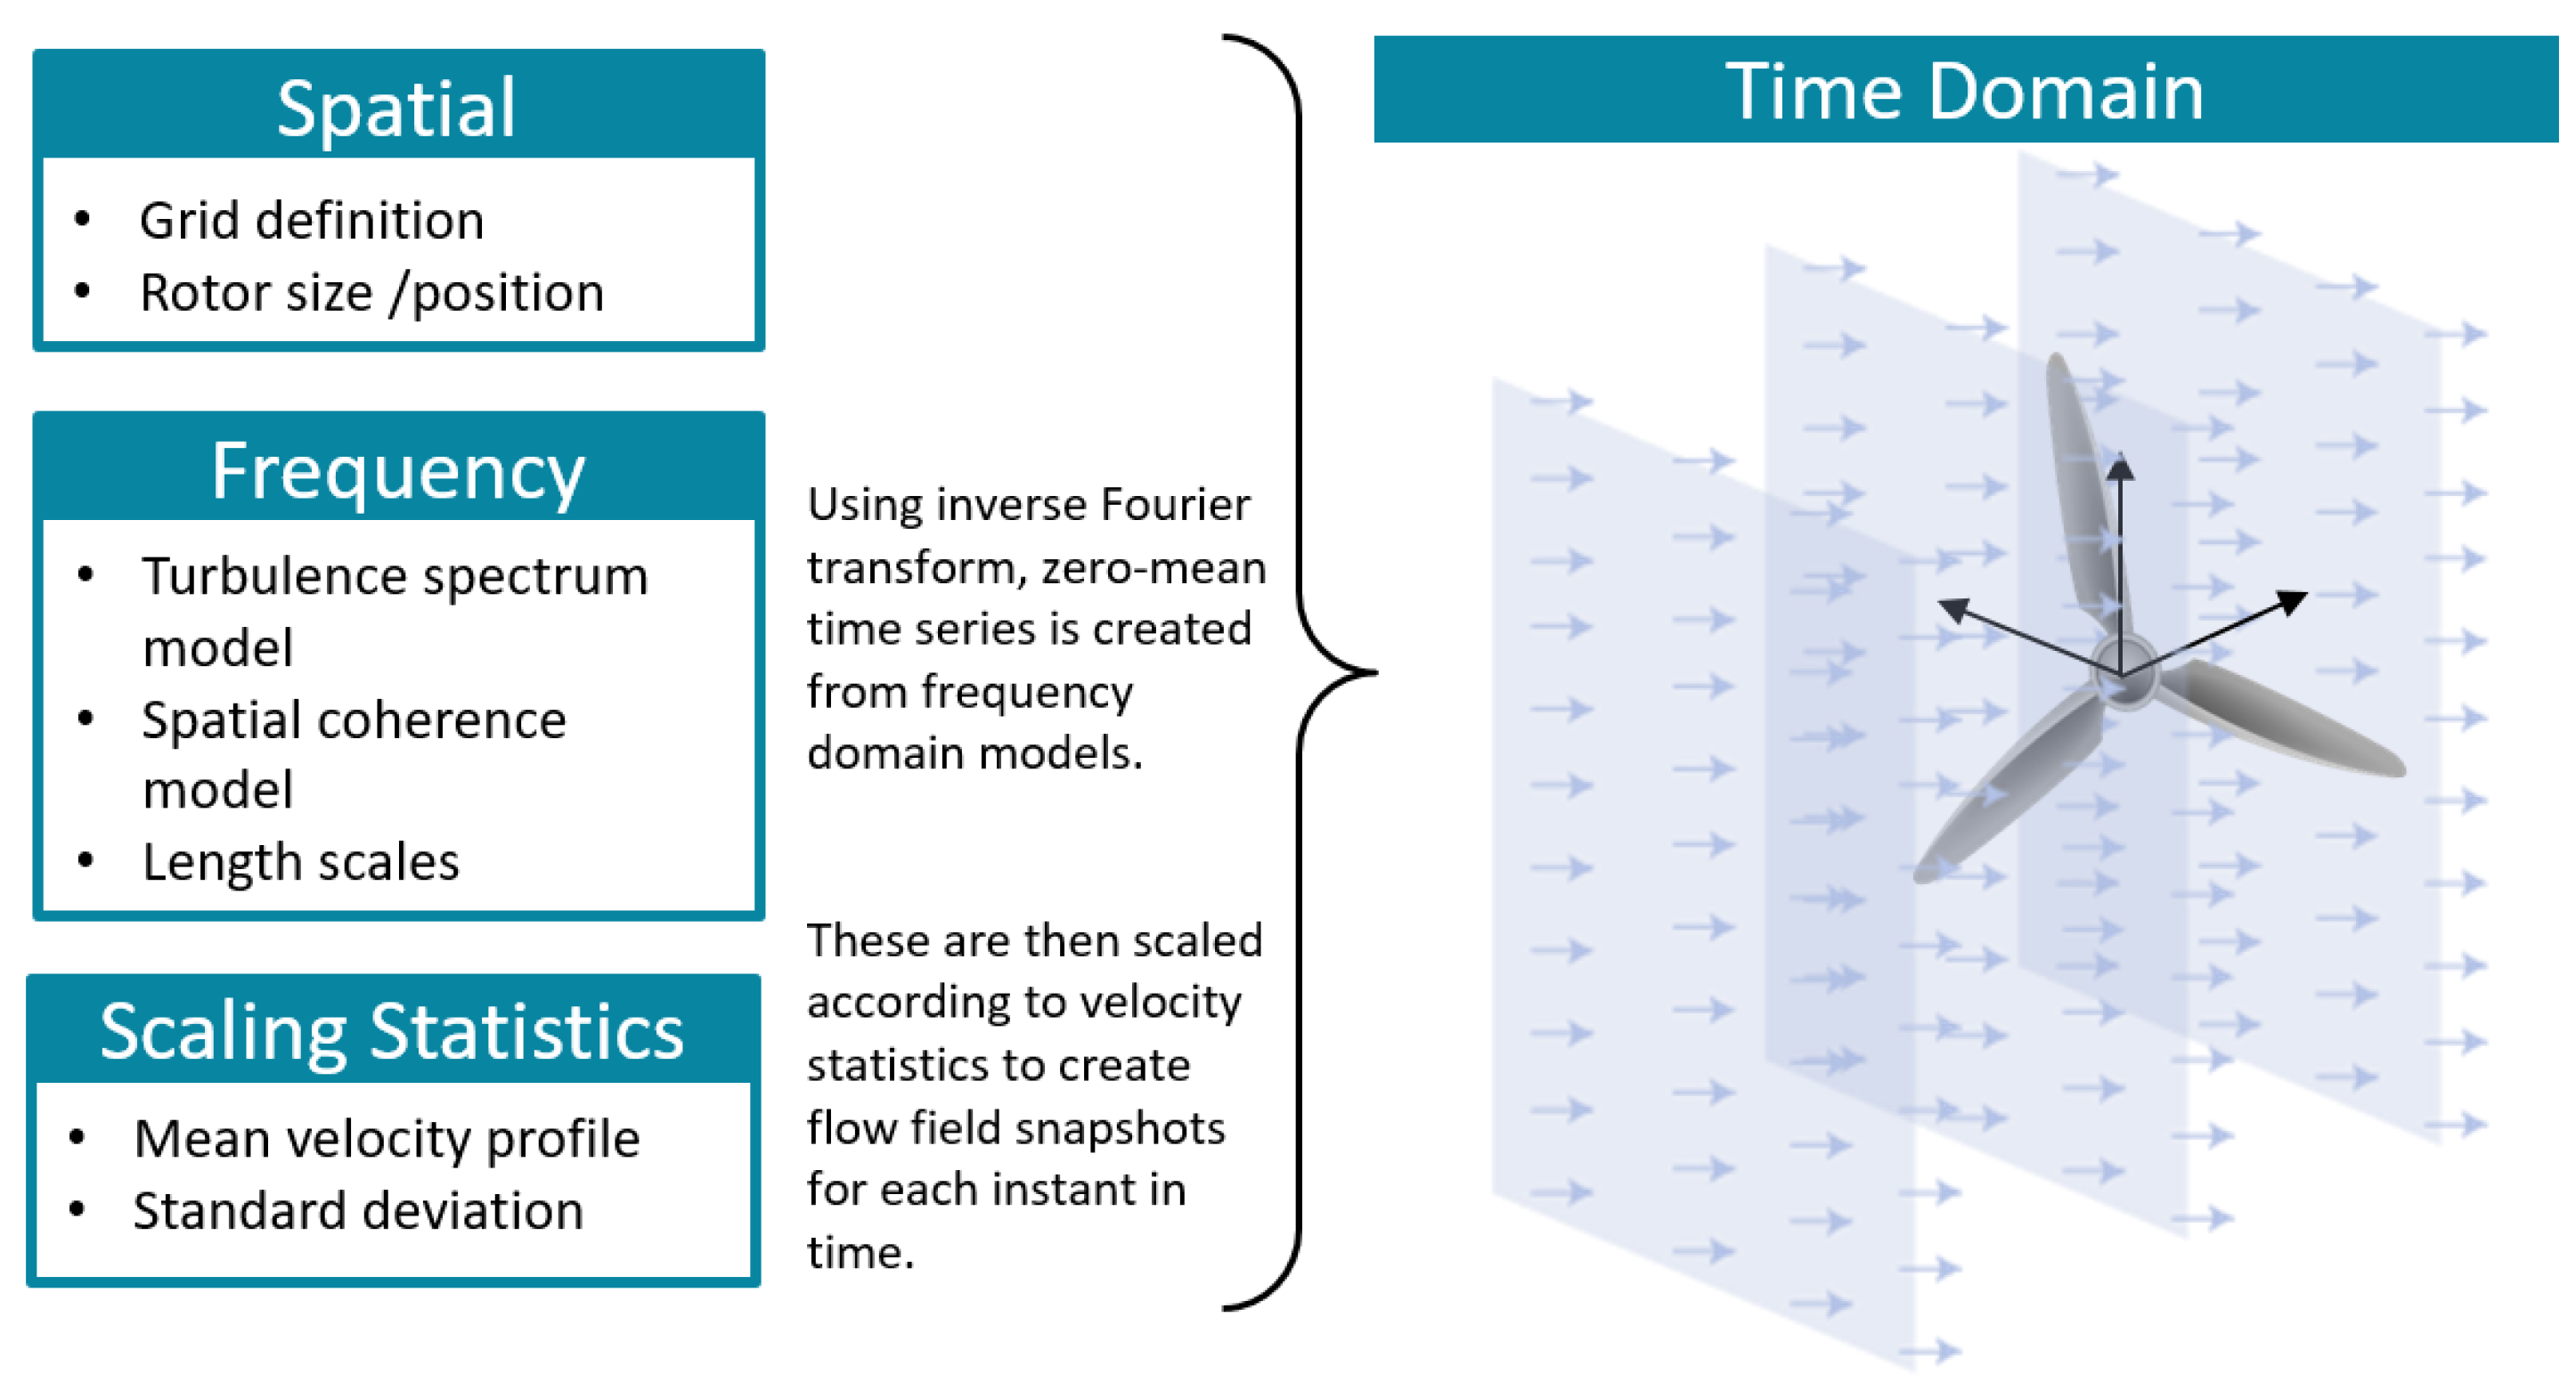
Figure 1. Simplified illustration of input parameters required to construct flow fields in Tidal Bladed and TurbSim, adapted from TurbSim user’s guide [15].
Energies 16 01881 g001
Figure 2. Channel bathymetry and the location of the ADCP instruments at FORCE and EMEC test sites.
Energies 16 01881 g002
Figure 3. Tidal rose plots showing flow direction as well as ADCP orientation. Solid yellow line corresponds to the instrument heading.
Energies 16 01881 g003
Figure 4. Error-ranges for streamwise turbulence intensity calculated from misaligned ADCP data. The ratio σ v / σ u was found to be 0.75 at the Sound of Islay tidal site [24]; the ratio u v ¯ / u 2 ¯ ranged between 0.3–0.75 at Mahakam River, East Kalimantan, Indonesia [48].
Energies 16 01881 g004
Figure 5. Length scales calculated using time-correlation method on rotated instantaneous velocity data. Shaded areas show standard error, which is larger for EMEC-1 due to a shorter dataset.
Energies 16 01881 g005
Figure 6. Streamwise length scales calculated by time-correlation method on instantaneous streamwise velocity data. The dashed lines indicate a theoretical streamwise length scale based on open-channel theory, L u = z H . The bold dot indicates the point above which the beam spread is larger than the length scales.
Energies 16 01881 g006
Figure 7. Comparison of vertical Kaimal and von Kármán models (based on measured length scale) to measured variance normalised spectra for flood cycles. The 10-min spectra are averaged across all flood cycles for velocities 1–3 m/s.
Energies 16 01881 g007
Figure 8. Comparison of vertical Kaimal and von Kárm’an models (based on measured length scale) to measured variance normalised spectra for ebb cycles. The 10-min spectra are averaged across all ebb cycles for velocities 1–3 m/s.
Energies 16 01881 g008
Figure 9. Comparison of the streamwise Kaimal and Von Kármán models (based on measured length scale) to variance-normalised spectra, measured at EMEC-1 location. The 10-min spectra are averaged across flood and ebb cycles with velocities 1–3 m/s.
Energies 16 01881 g009
Figure 10. Comparison of the total Kaimal and von Kármán models (based on measured length scale) to variance-normalised spectra, measured at FORCE-1 location. The 10-min spectra are averaged across flood and ebb cycles for velocities 1–3 m/s.
Energies 16 01881 g010
Figure 11. Measured coherence compared to the general IEC coherence model for flood cycles, velocities 1–3 m/s. The shaded area shows the 95% confidence level for measured coherence.
Energies 16 01881 g011
Figure 12. Measured coherence compared to the general IEC coherence model for ebb cycles, velocities 1–3 m/s. The shaded area shows the 95% confidence level for measured coherence.
Energies 16 01881 g012
Figure 13. Shear profiles for velocities 1–3 m/s. The best-fit power-law exponents and sum squared errors (sse) are displayed for each case.
Energies 16 01881 g013
Figure 14. Total turbulence intensity, TKE and anisotropy ratios for all measurement sites for flood (top row) and ebb (bottom row) tides with flows 1–3 m/s.
Energies 16 01881 g014
Table 1. Instrument set up.
ReferenceInstrumentSample RateBin SizeMeasurement PeriodPeak FlowDepth
EMEC-1Nortek Signature 5004 Hz1 m10 Apr 2020–22 Apr 20203.8 m/s48 m
EMEC-2Sentinel V501 Hz1 m8 Nov 2019–19 Dec 20193.7 m/s48 m
FORCE-1Nortek Signature 5002 Hz1 m27 Jan 2022–2 Apr 20224.6 m/s38 m
FORCE-2Sentinel V1001 Hz0.5 m29 Jun 2018–29 Aug 20184.7 m/s34 m
Disclaimer/Publisher’s Note: The statements, opinions and data contained in all publications are solely those of the individual author(s) and contributor(s) and not of MDPI and/or the editor(s). MDPI and/or the editor(s) disclaim responsibility for any injury to people or property resulting from any ideas, methods, instructions or products referred to in the content.