
Sizing Design for a Hybrid Renewable Power System Using HOMER and iHOGA Simulators


Abstract
:1. Introduction
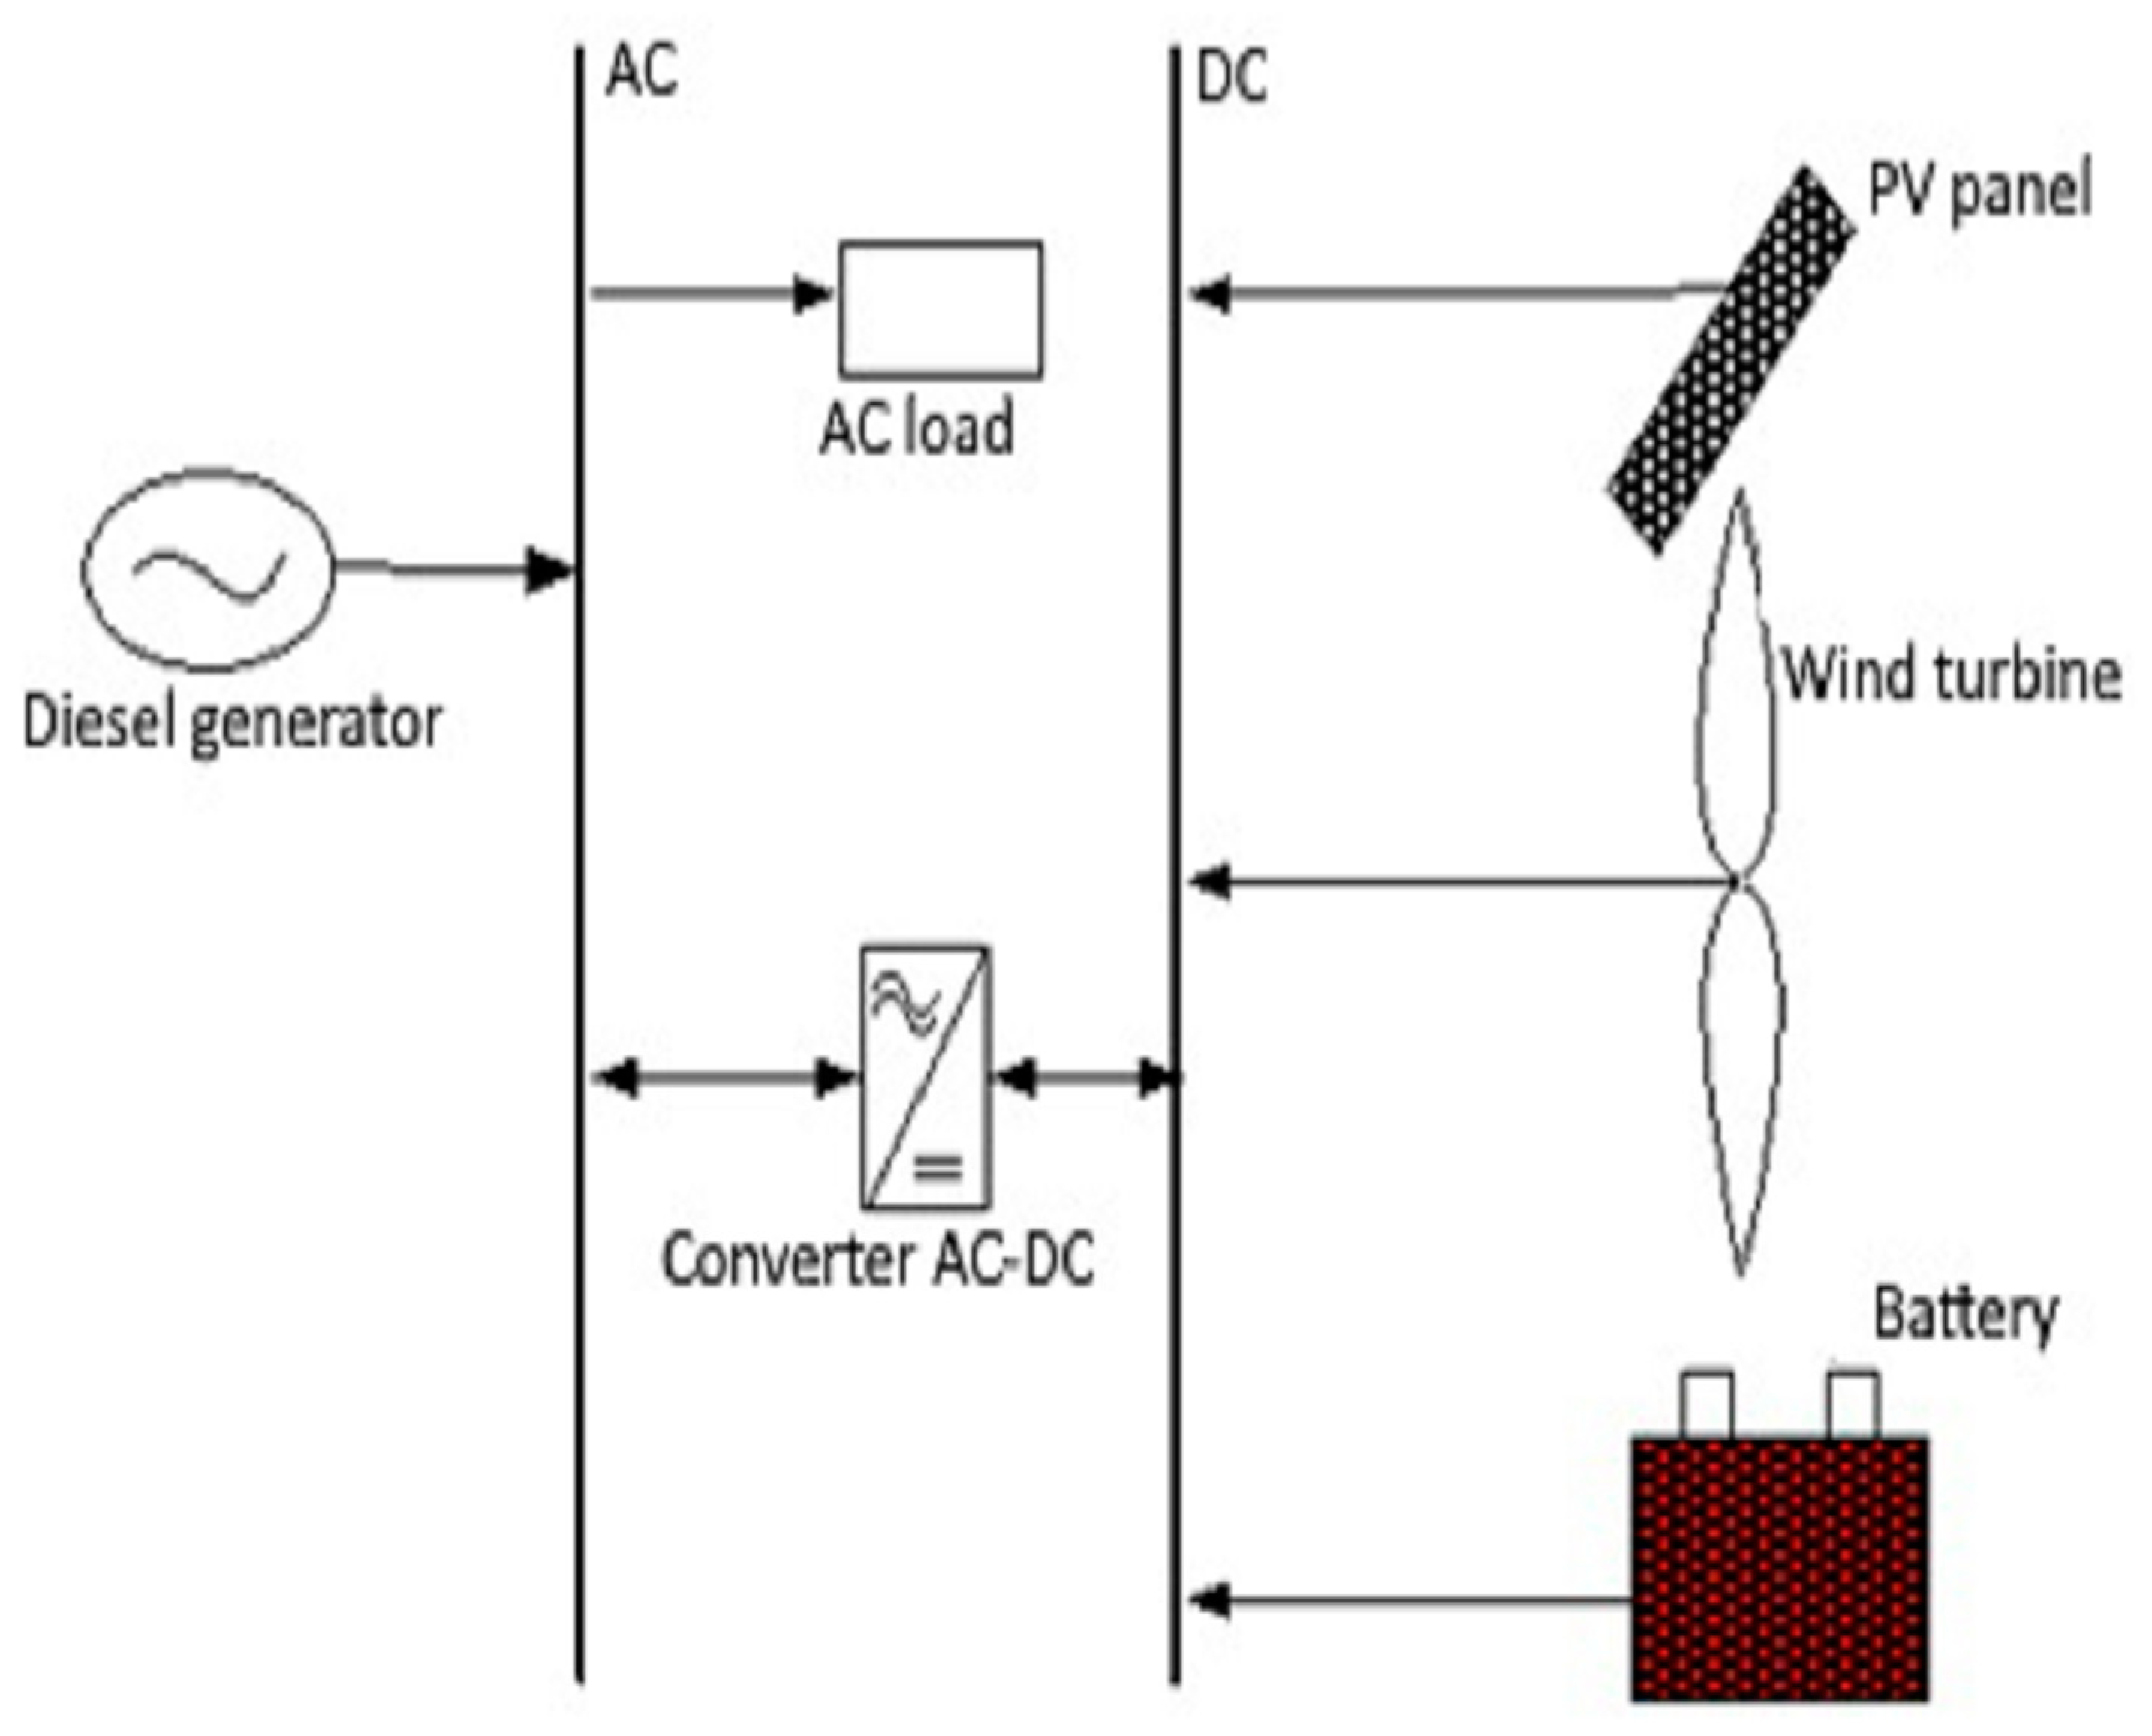
- renewable energy sources: solar, wind, hydro, etc.;
- conventional energy sources: diesel generators and AC grid;
- electrical energy storage components: battery pack and ultracapacitor;
- DC–DC or DC–AC converters;
- DC or AC consumers (load).
- A comparative analysis of the solutions obtained with iHOGA and HOMER simulators for the same HRPS is presented in detail.
- Compared to other similar studies in the design of HRPS (mentioned above), all important parameters (such as the share of renewable energy, operating costs, excess energy, energy cost, and pollutant emissions) were systematically analyzed to determine which solution would be optimal for HRPS implementation in the location.
- The obtained results are compared and discussed, highlighting the fact that iHOGA achieved better results than HOMER.
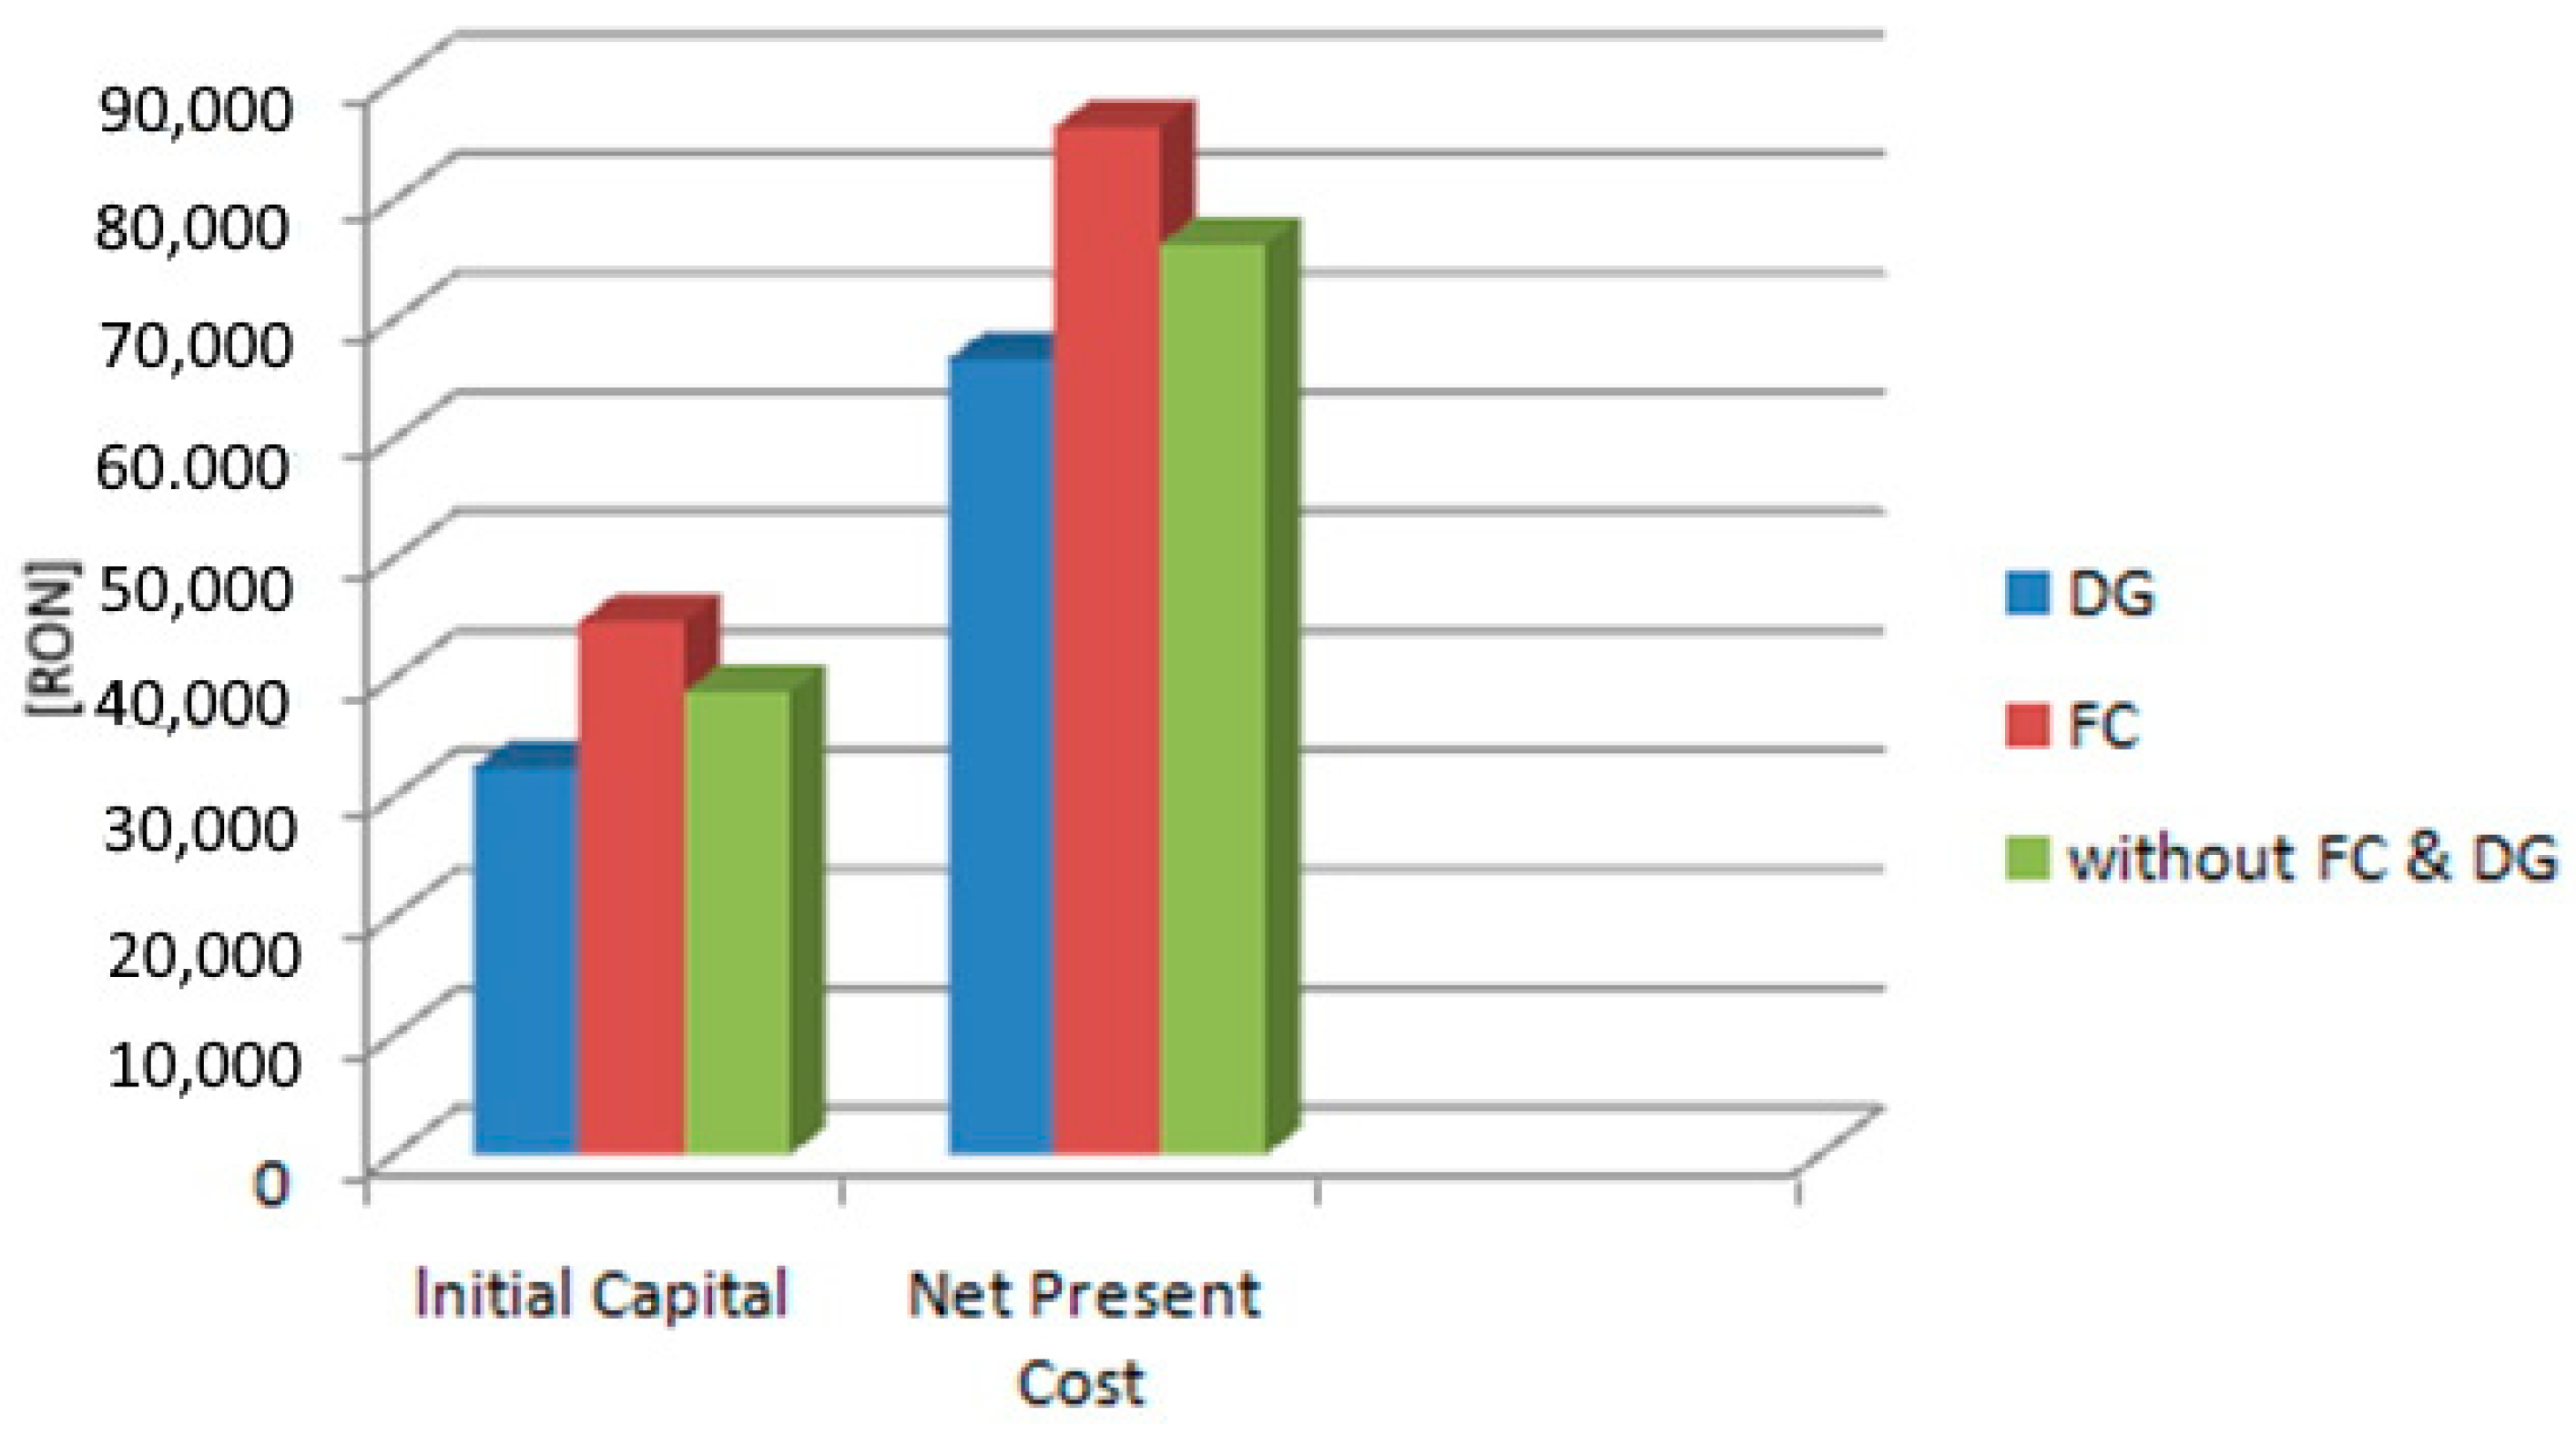
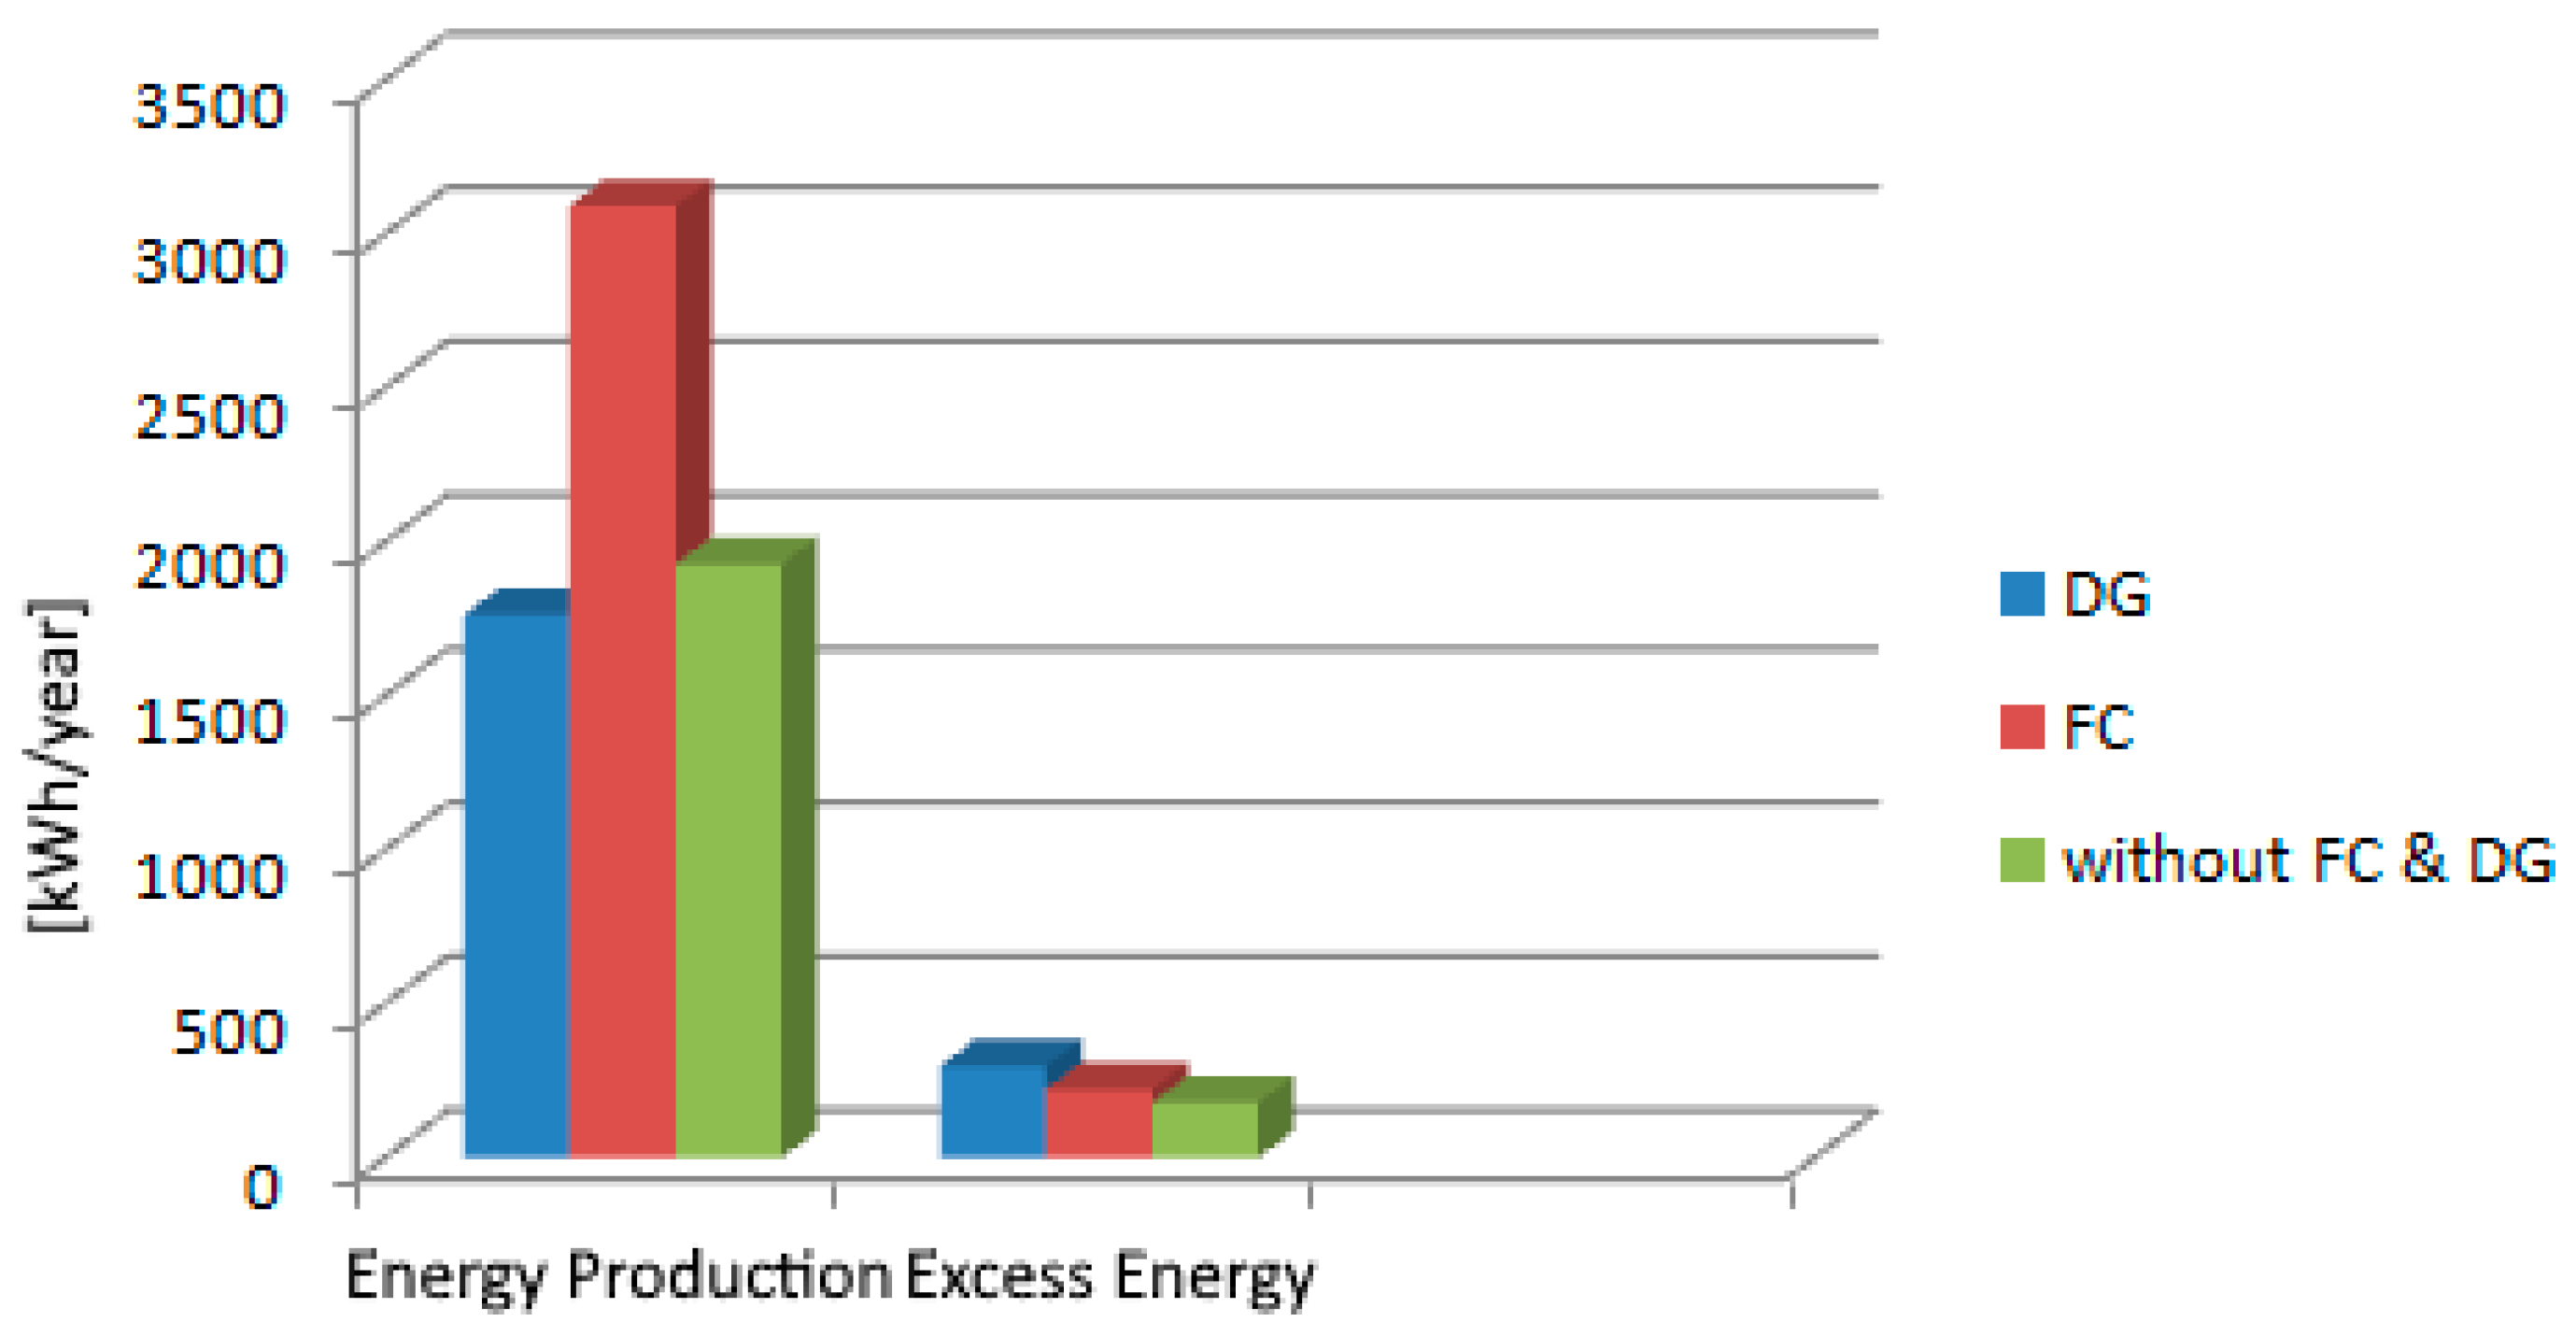
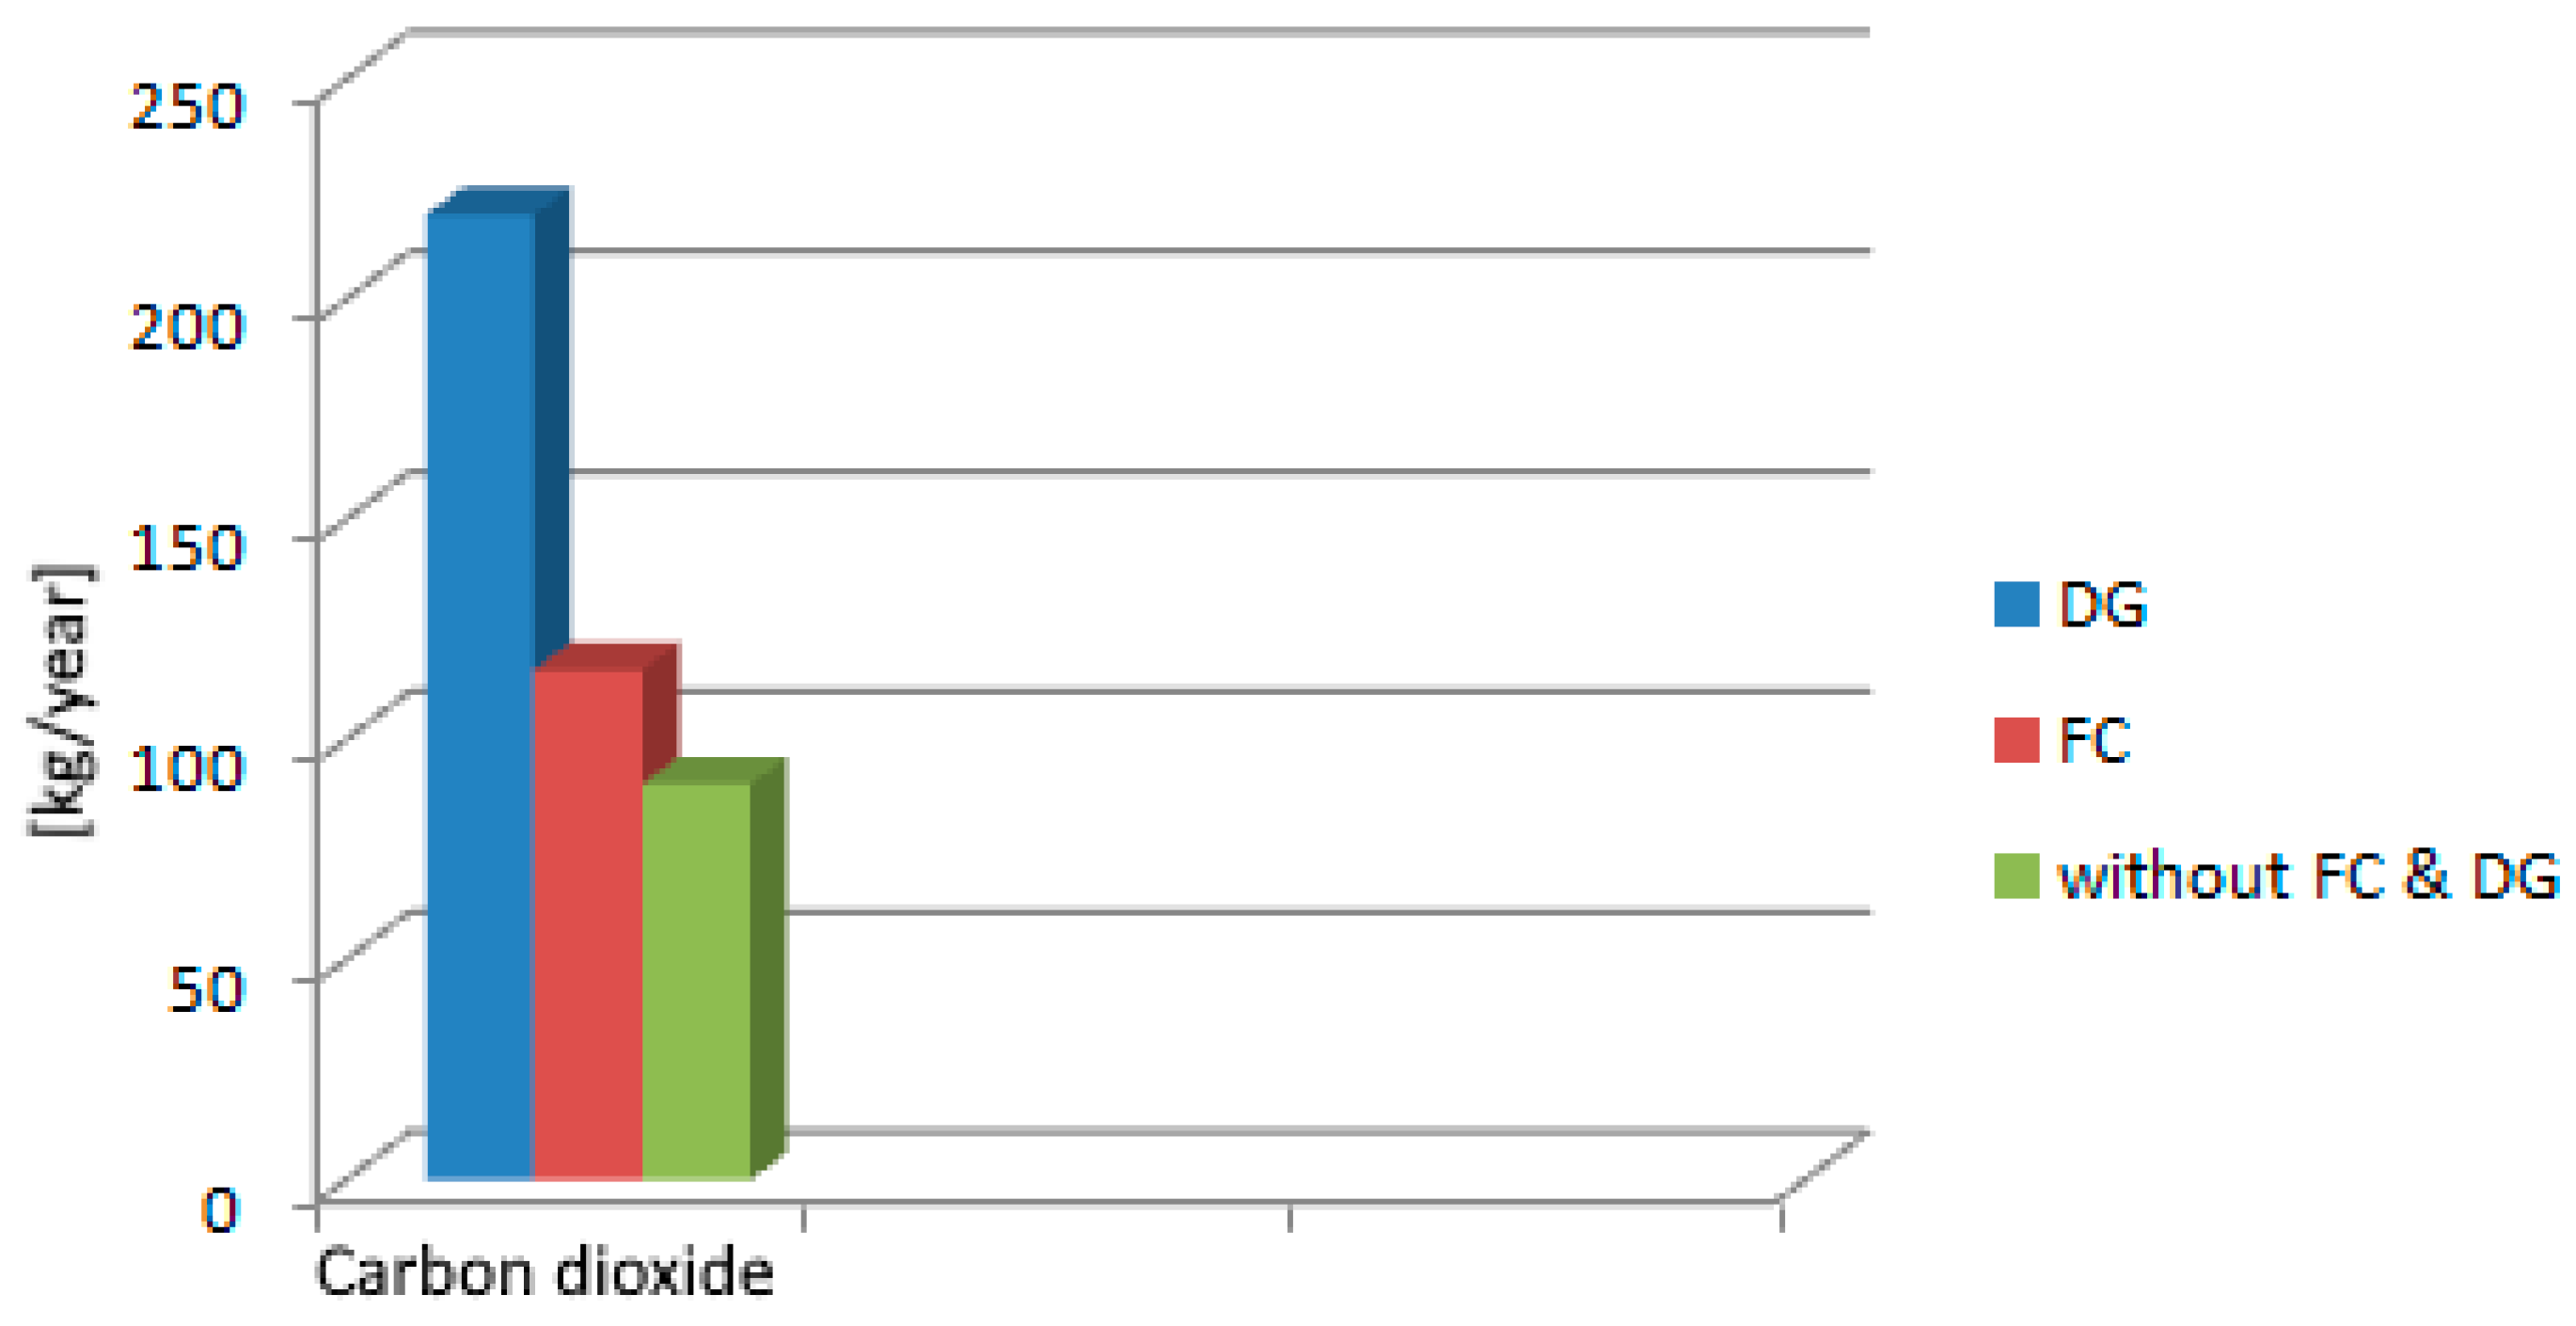
- The comparative analysis of three HRPS projects implemented in iHOGA (with DG, with FC, and without FC and DG) showed that in the HRPS project without DG, the share of renewable energy could increase up to a maximum of 100%, but the NPC also increased by 14.33% (from RON 66,770 to 76,340). Even though iHOGA with DG was the best option from an economic point of view (having the best economic value in terms of initial capital (RON 32,484) and NPC (RON 66,770)), it resulted in higher operating costs compared of the other two cases analyzed, and the pollutant emissions were approximately double those obtained in the case of iHOGA with FC.
2. Mathematical Modeling
2.1. PV Panel
2.2. Wind Turbine
2.3. Battery
2.4. Fuel Cell
3. Case Study Development
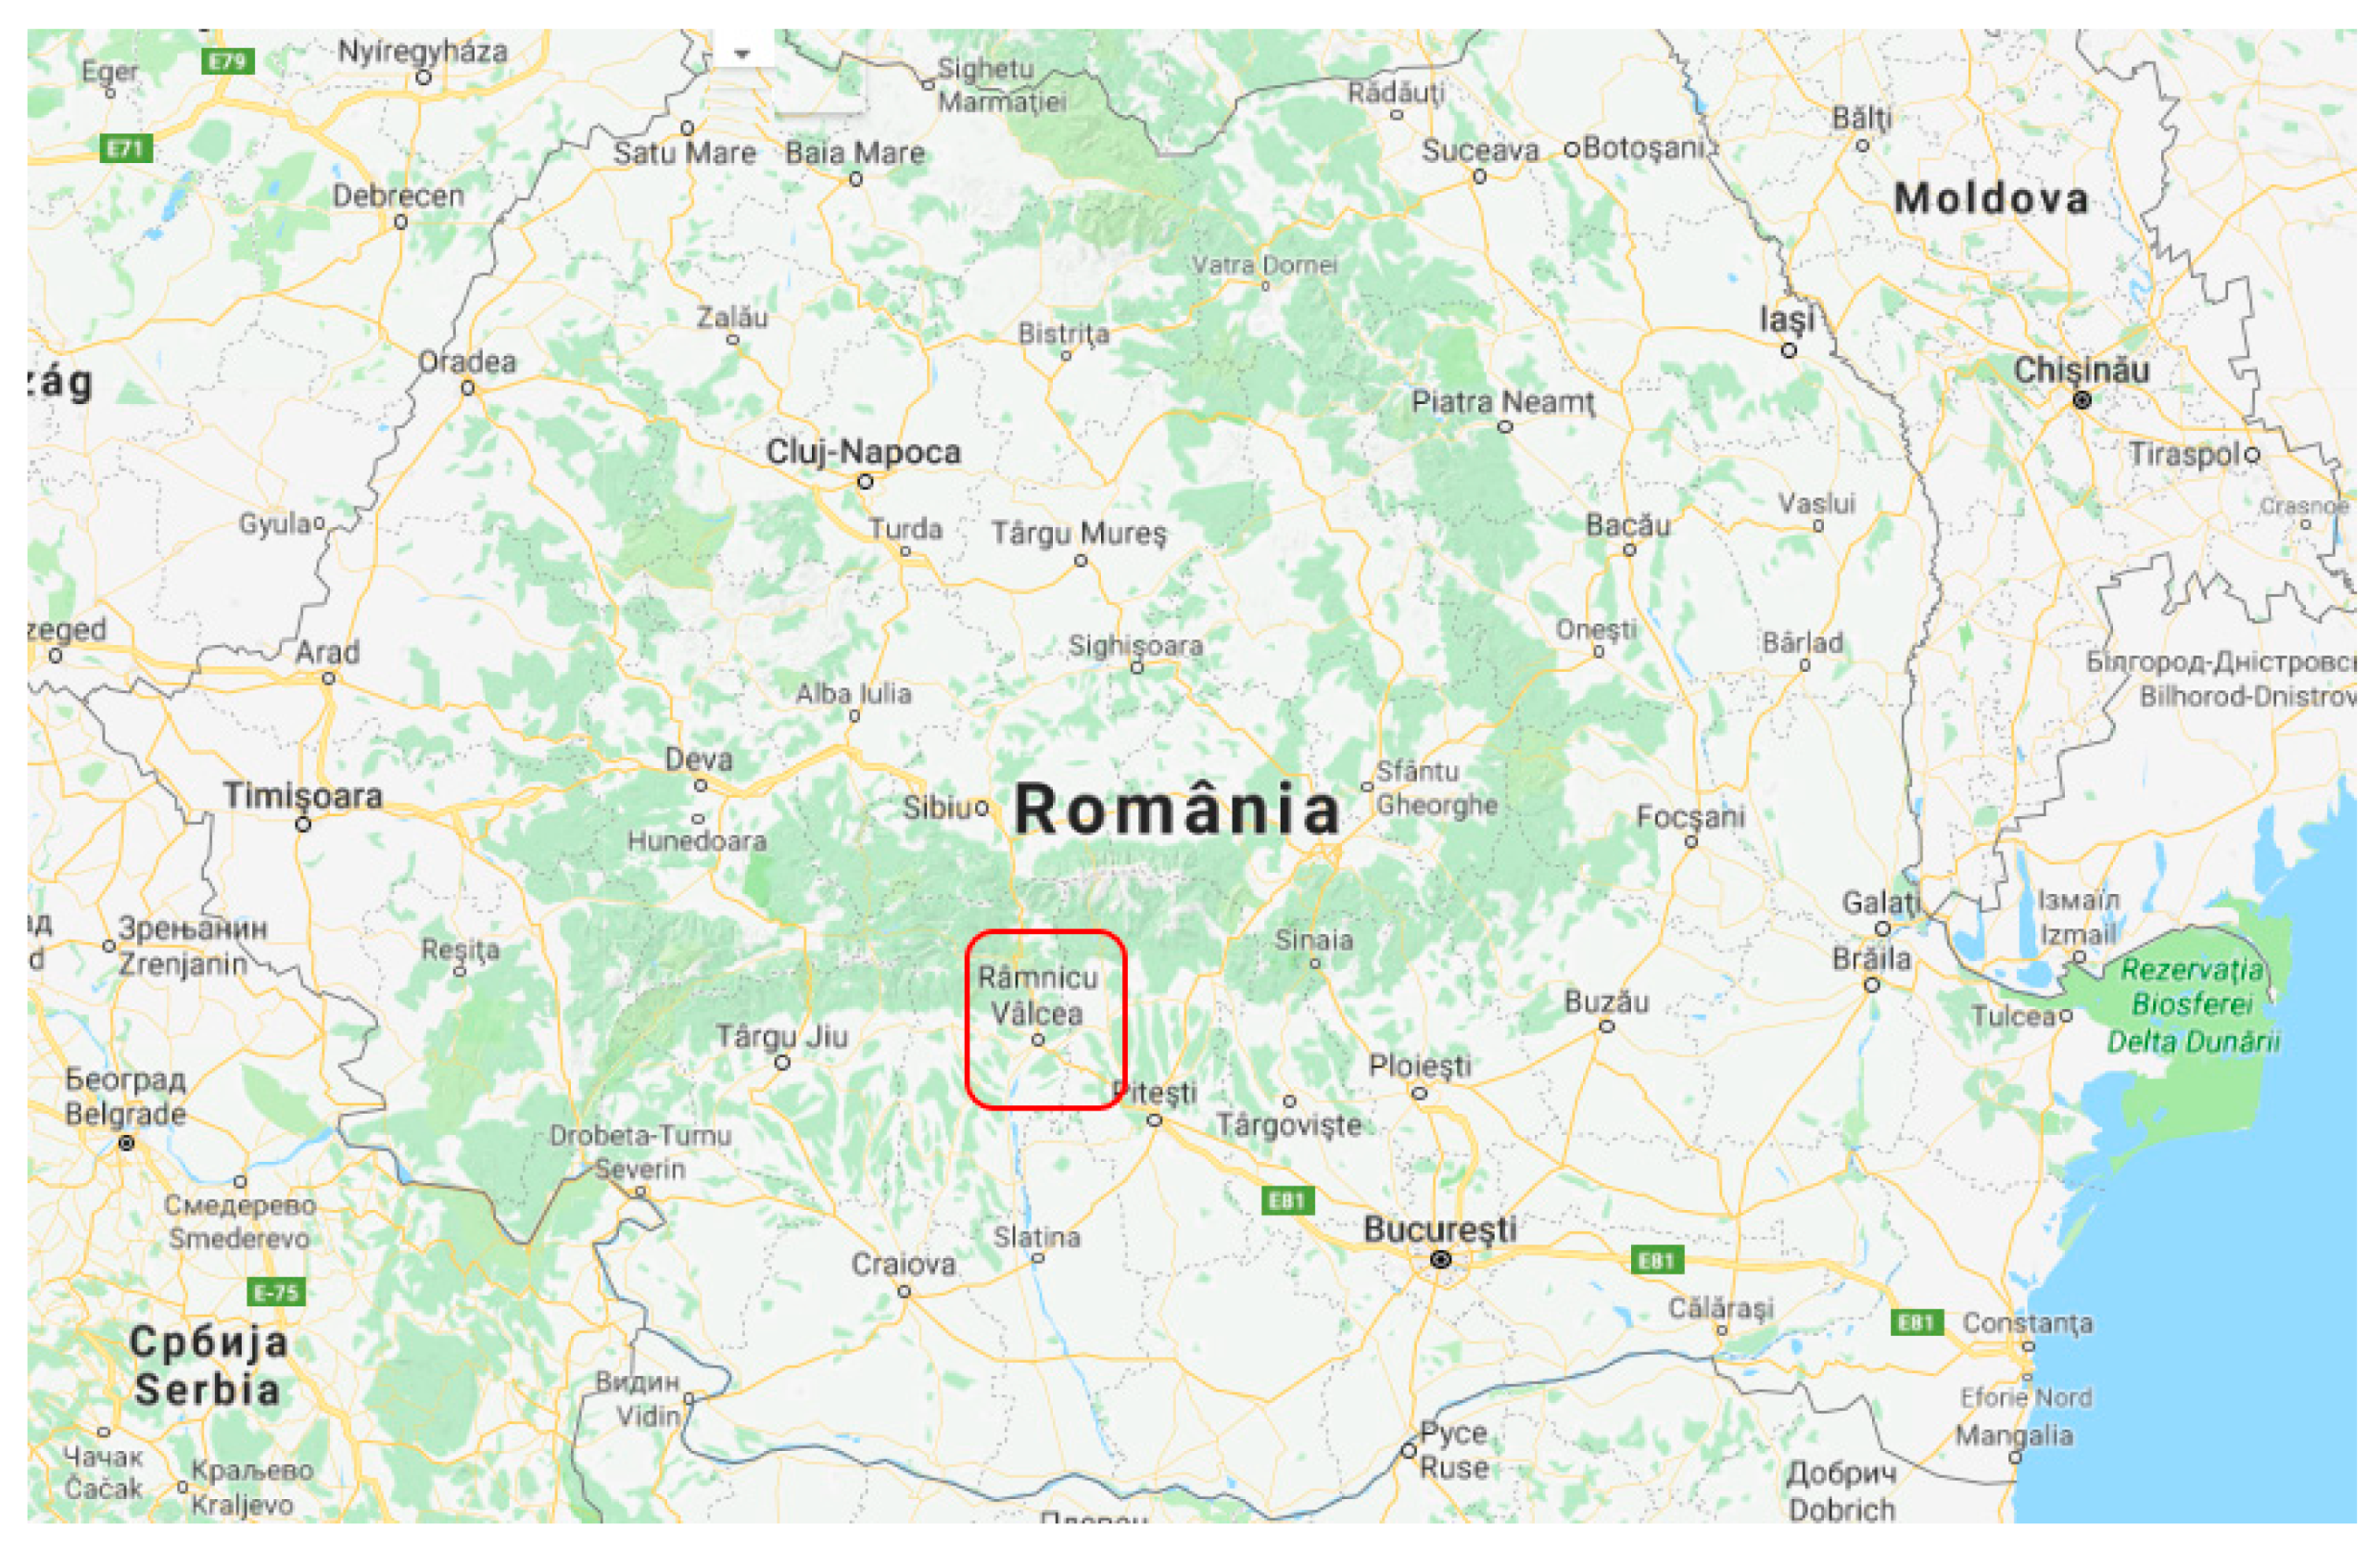
3.1. Location
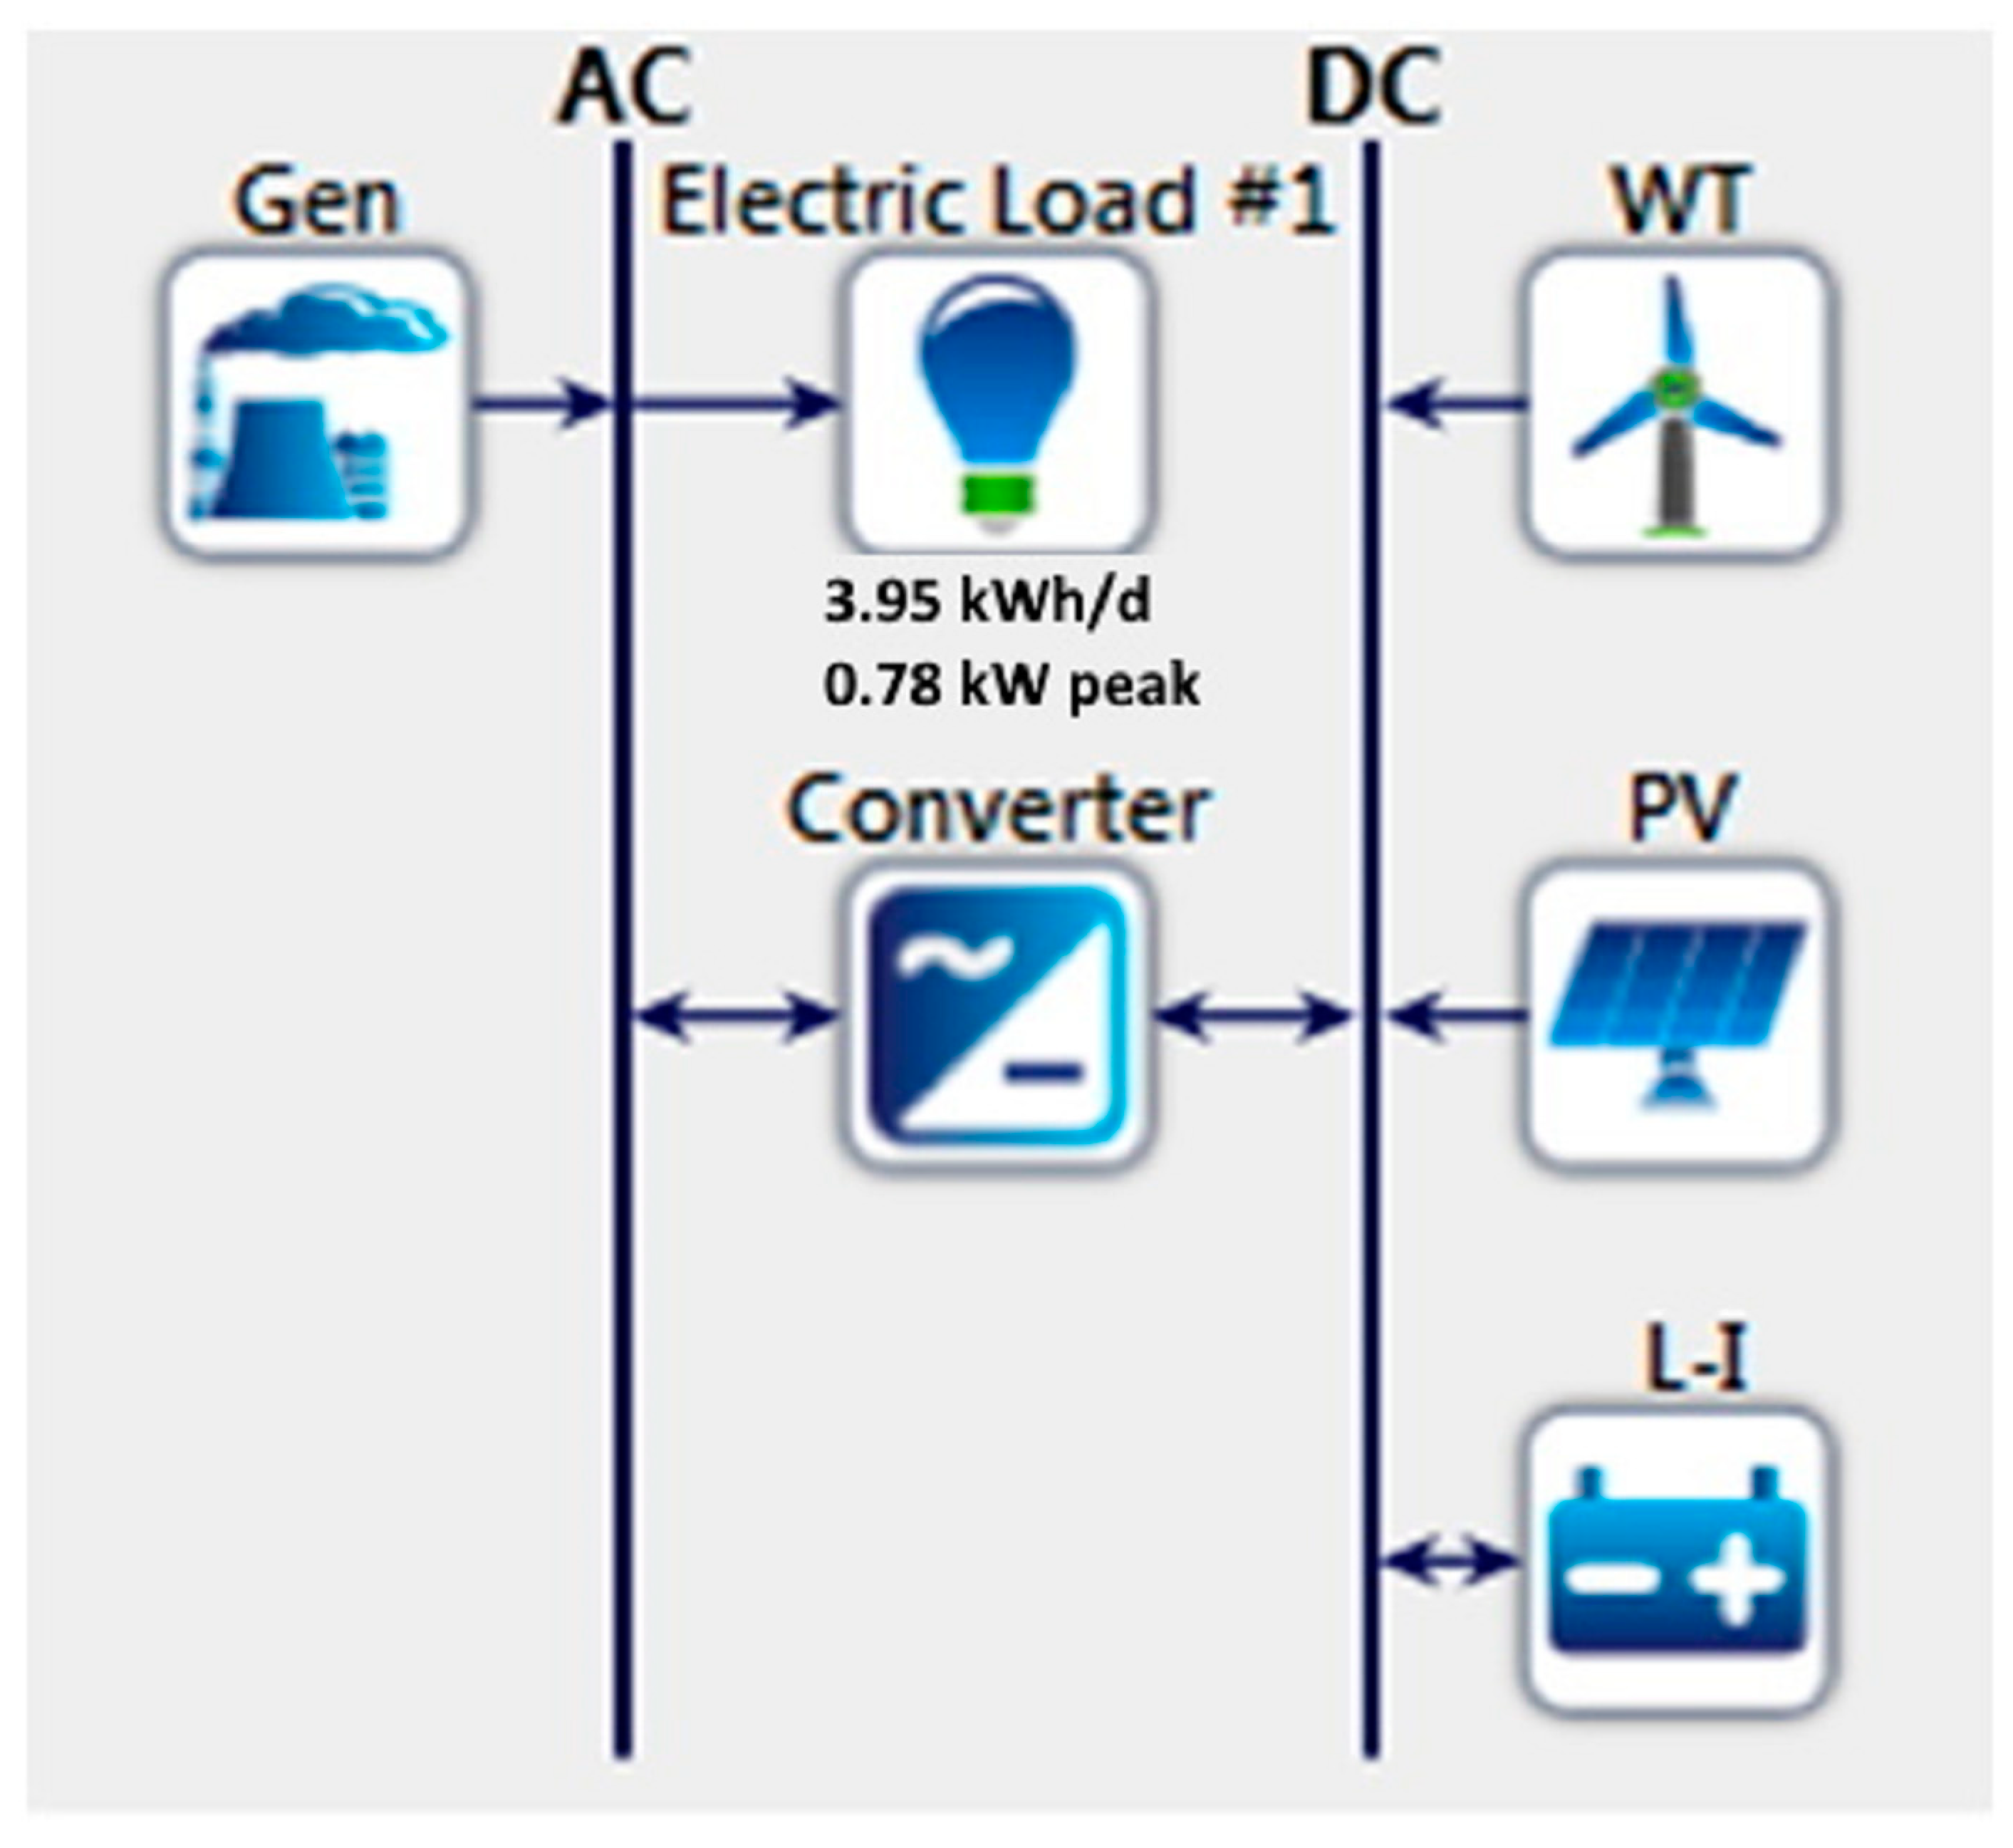
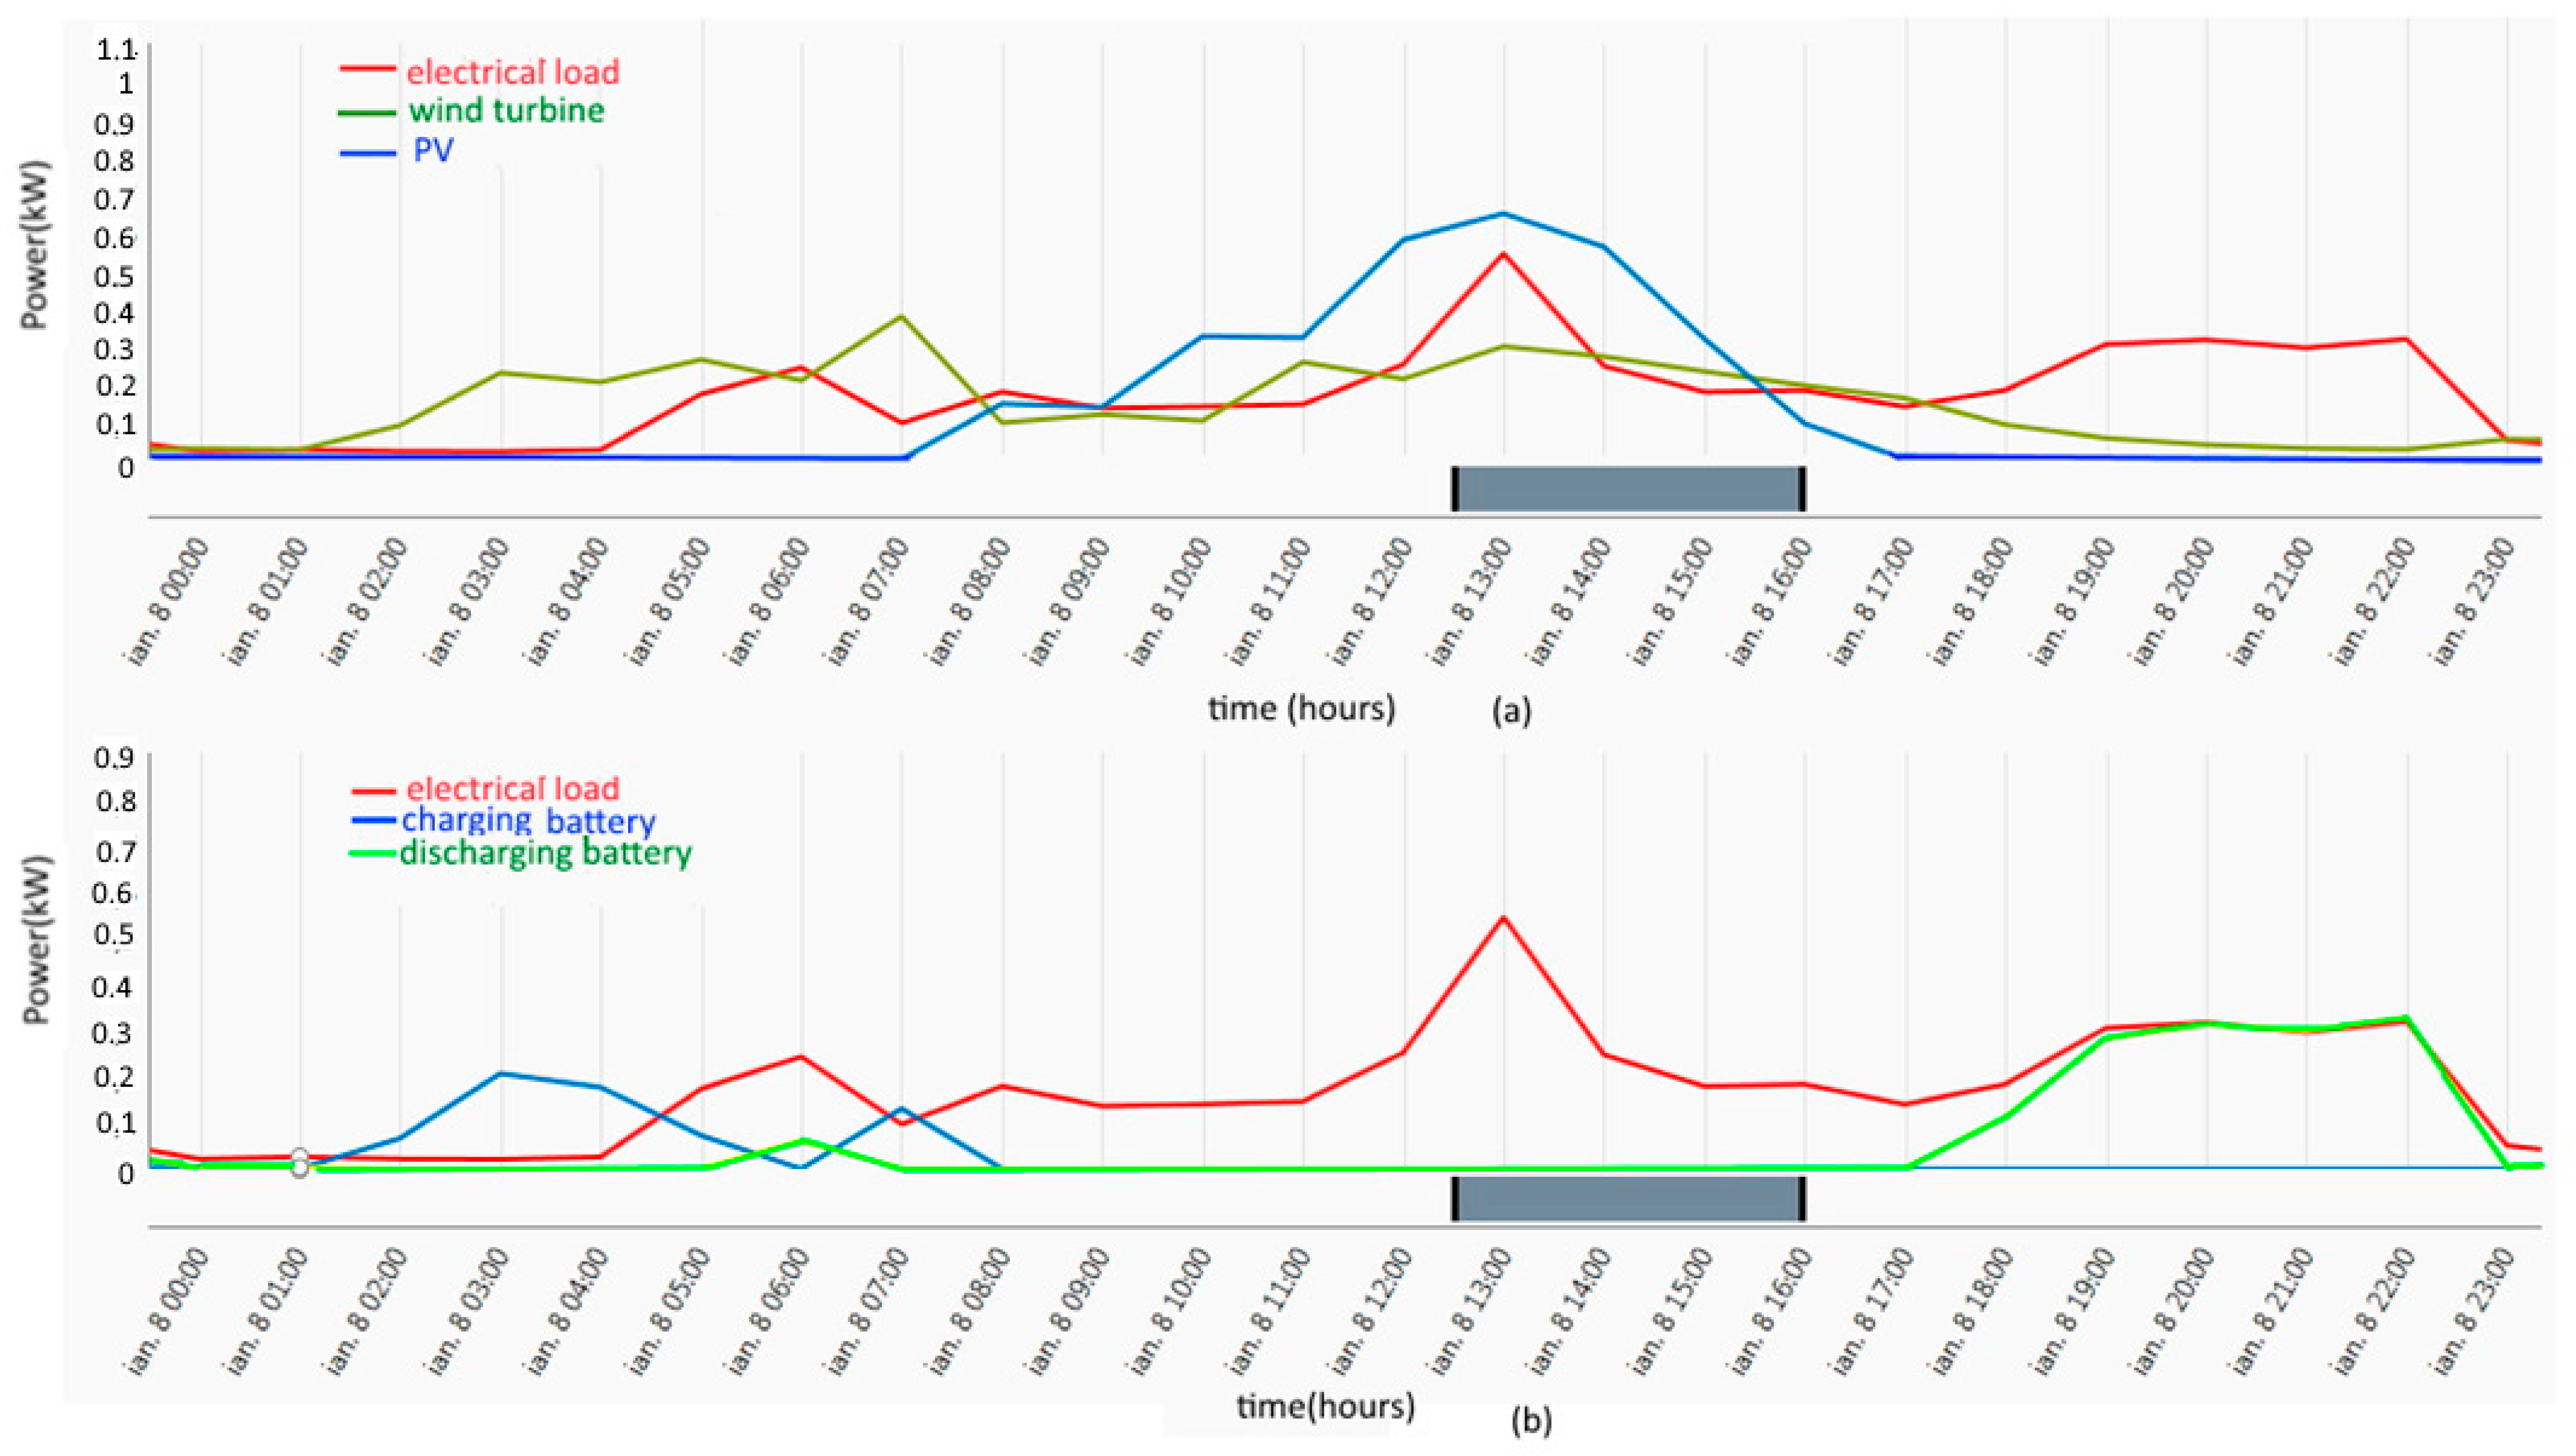
3.2. Load Profile
3.3. Solar Energy Potential of Ramnicu Valcea
3.4. Wind Energy Potential of Ramnicu Valcea
3.5. Analysis Tools
4. HOMER Simulator
4.1. Photovoltaic Panels
4.2. Wind Turbine
4.3. Diesel Generator
4.4. Battery
4.5. Converter
4.6. Simulation Results
5. iHOGA Simulator
5.1. iHOGA with Diesel Generator
5.1.1. PV Panels
5.1.2. Wind Turbine
5.1.3. Battery
5.1.4. Converter
5.1.5. Diesel Generator
5.1.6. Simulation Results
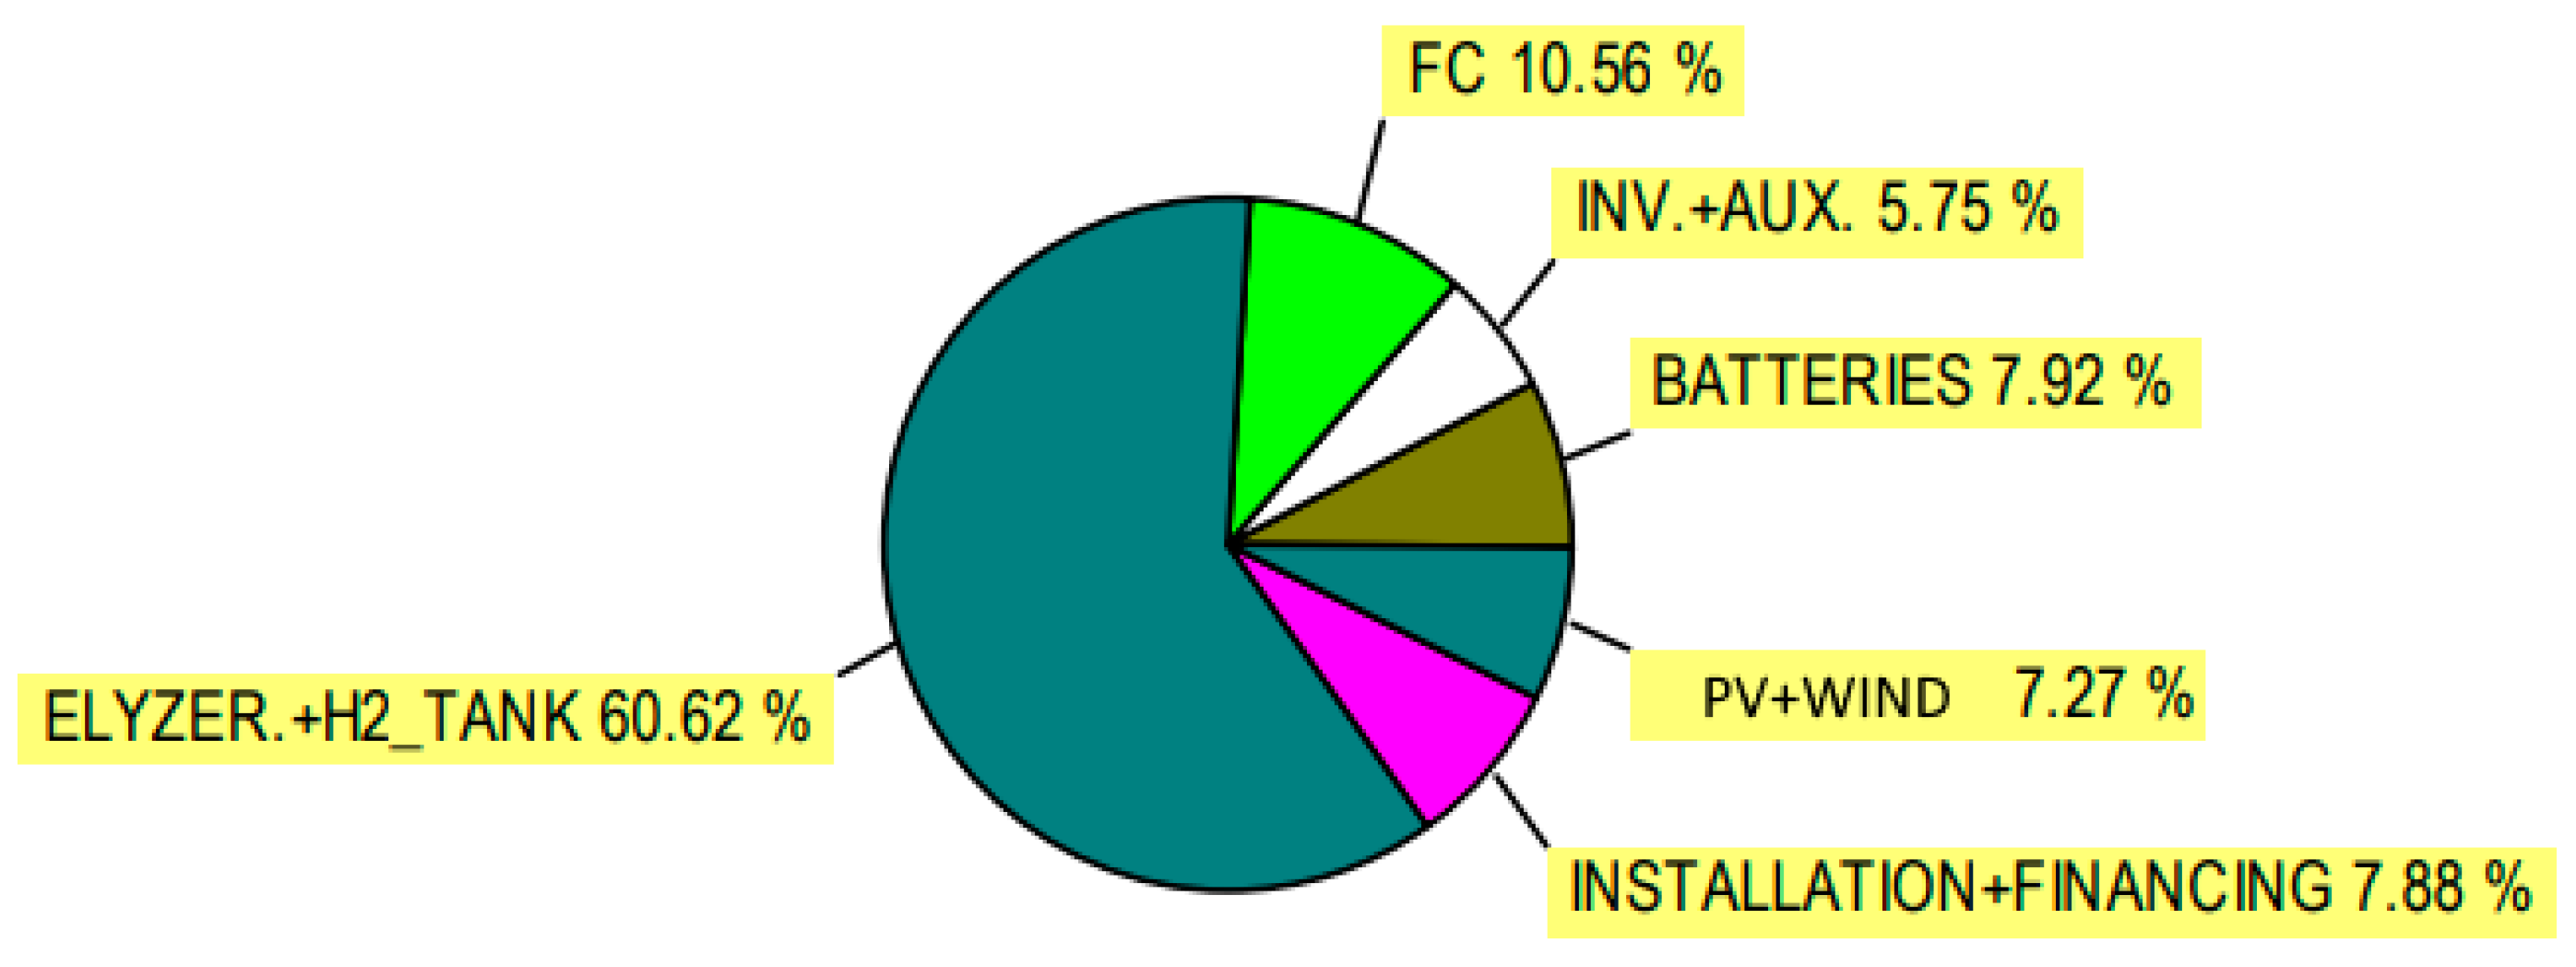
5.2. iHOGA with Fuel Cell
5.3. iHOGA without FC and DG
6. Comparative Analysis and Discussion
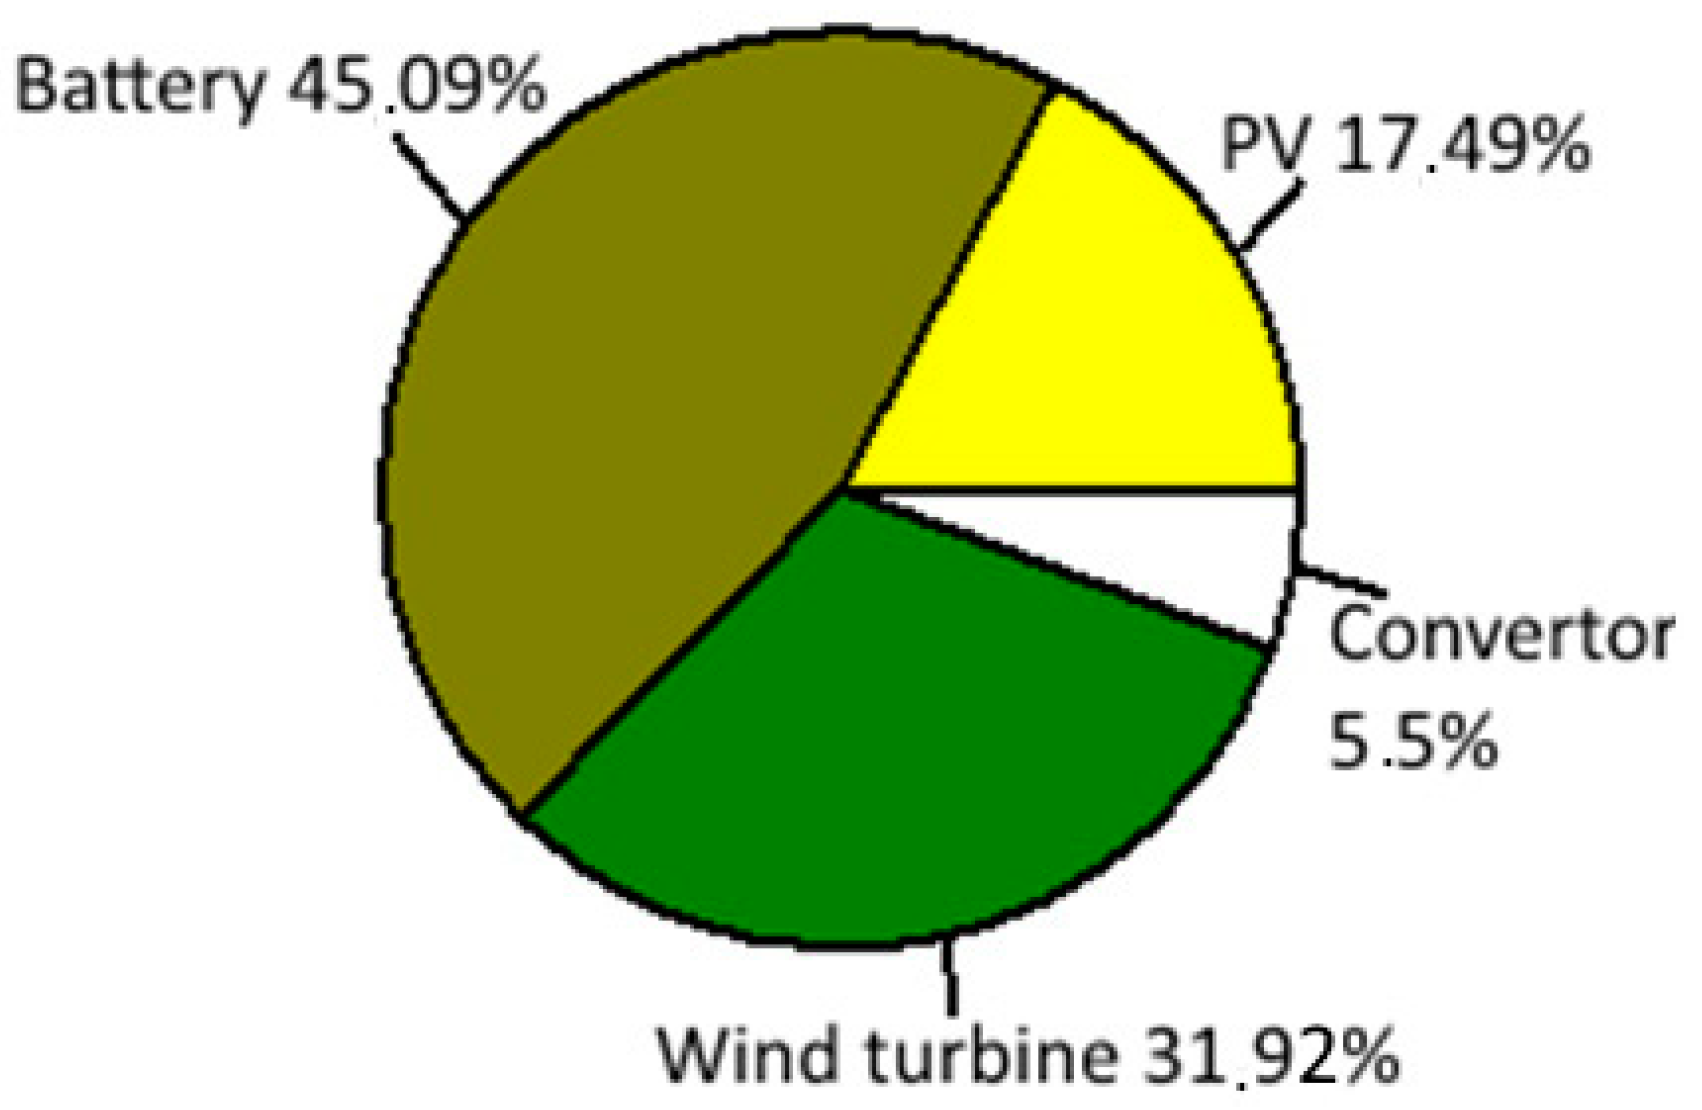
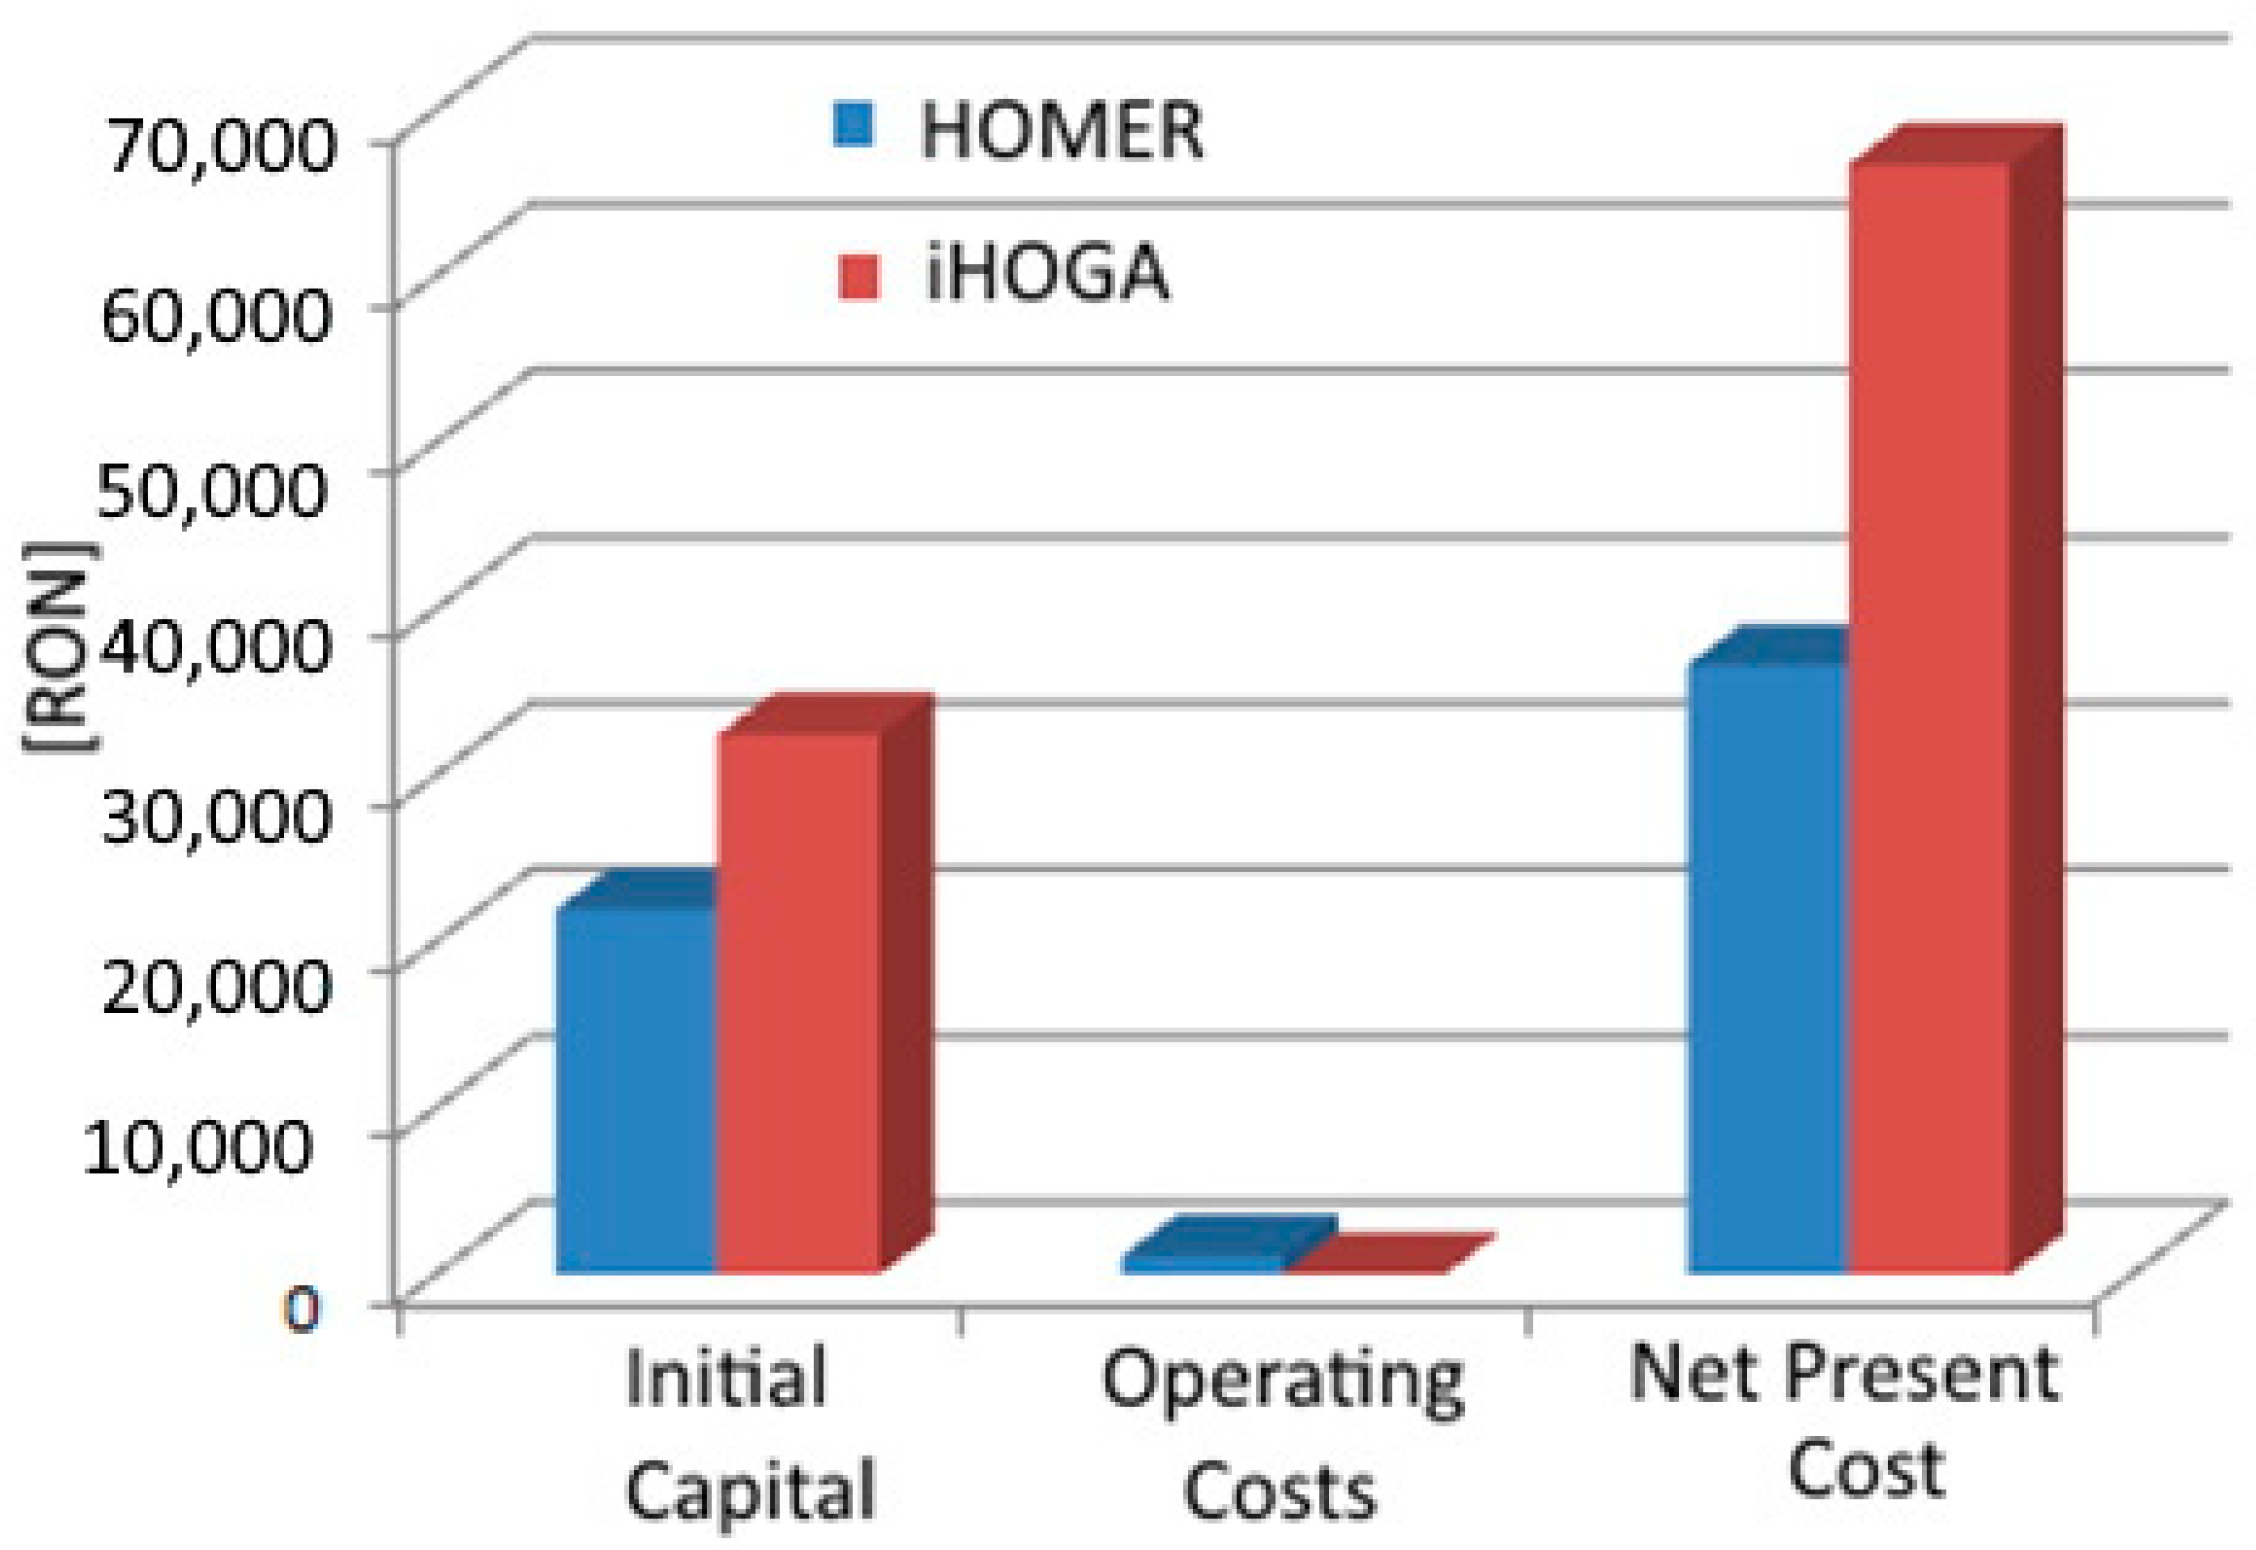
6.1. Economic Comparison
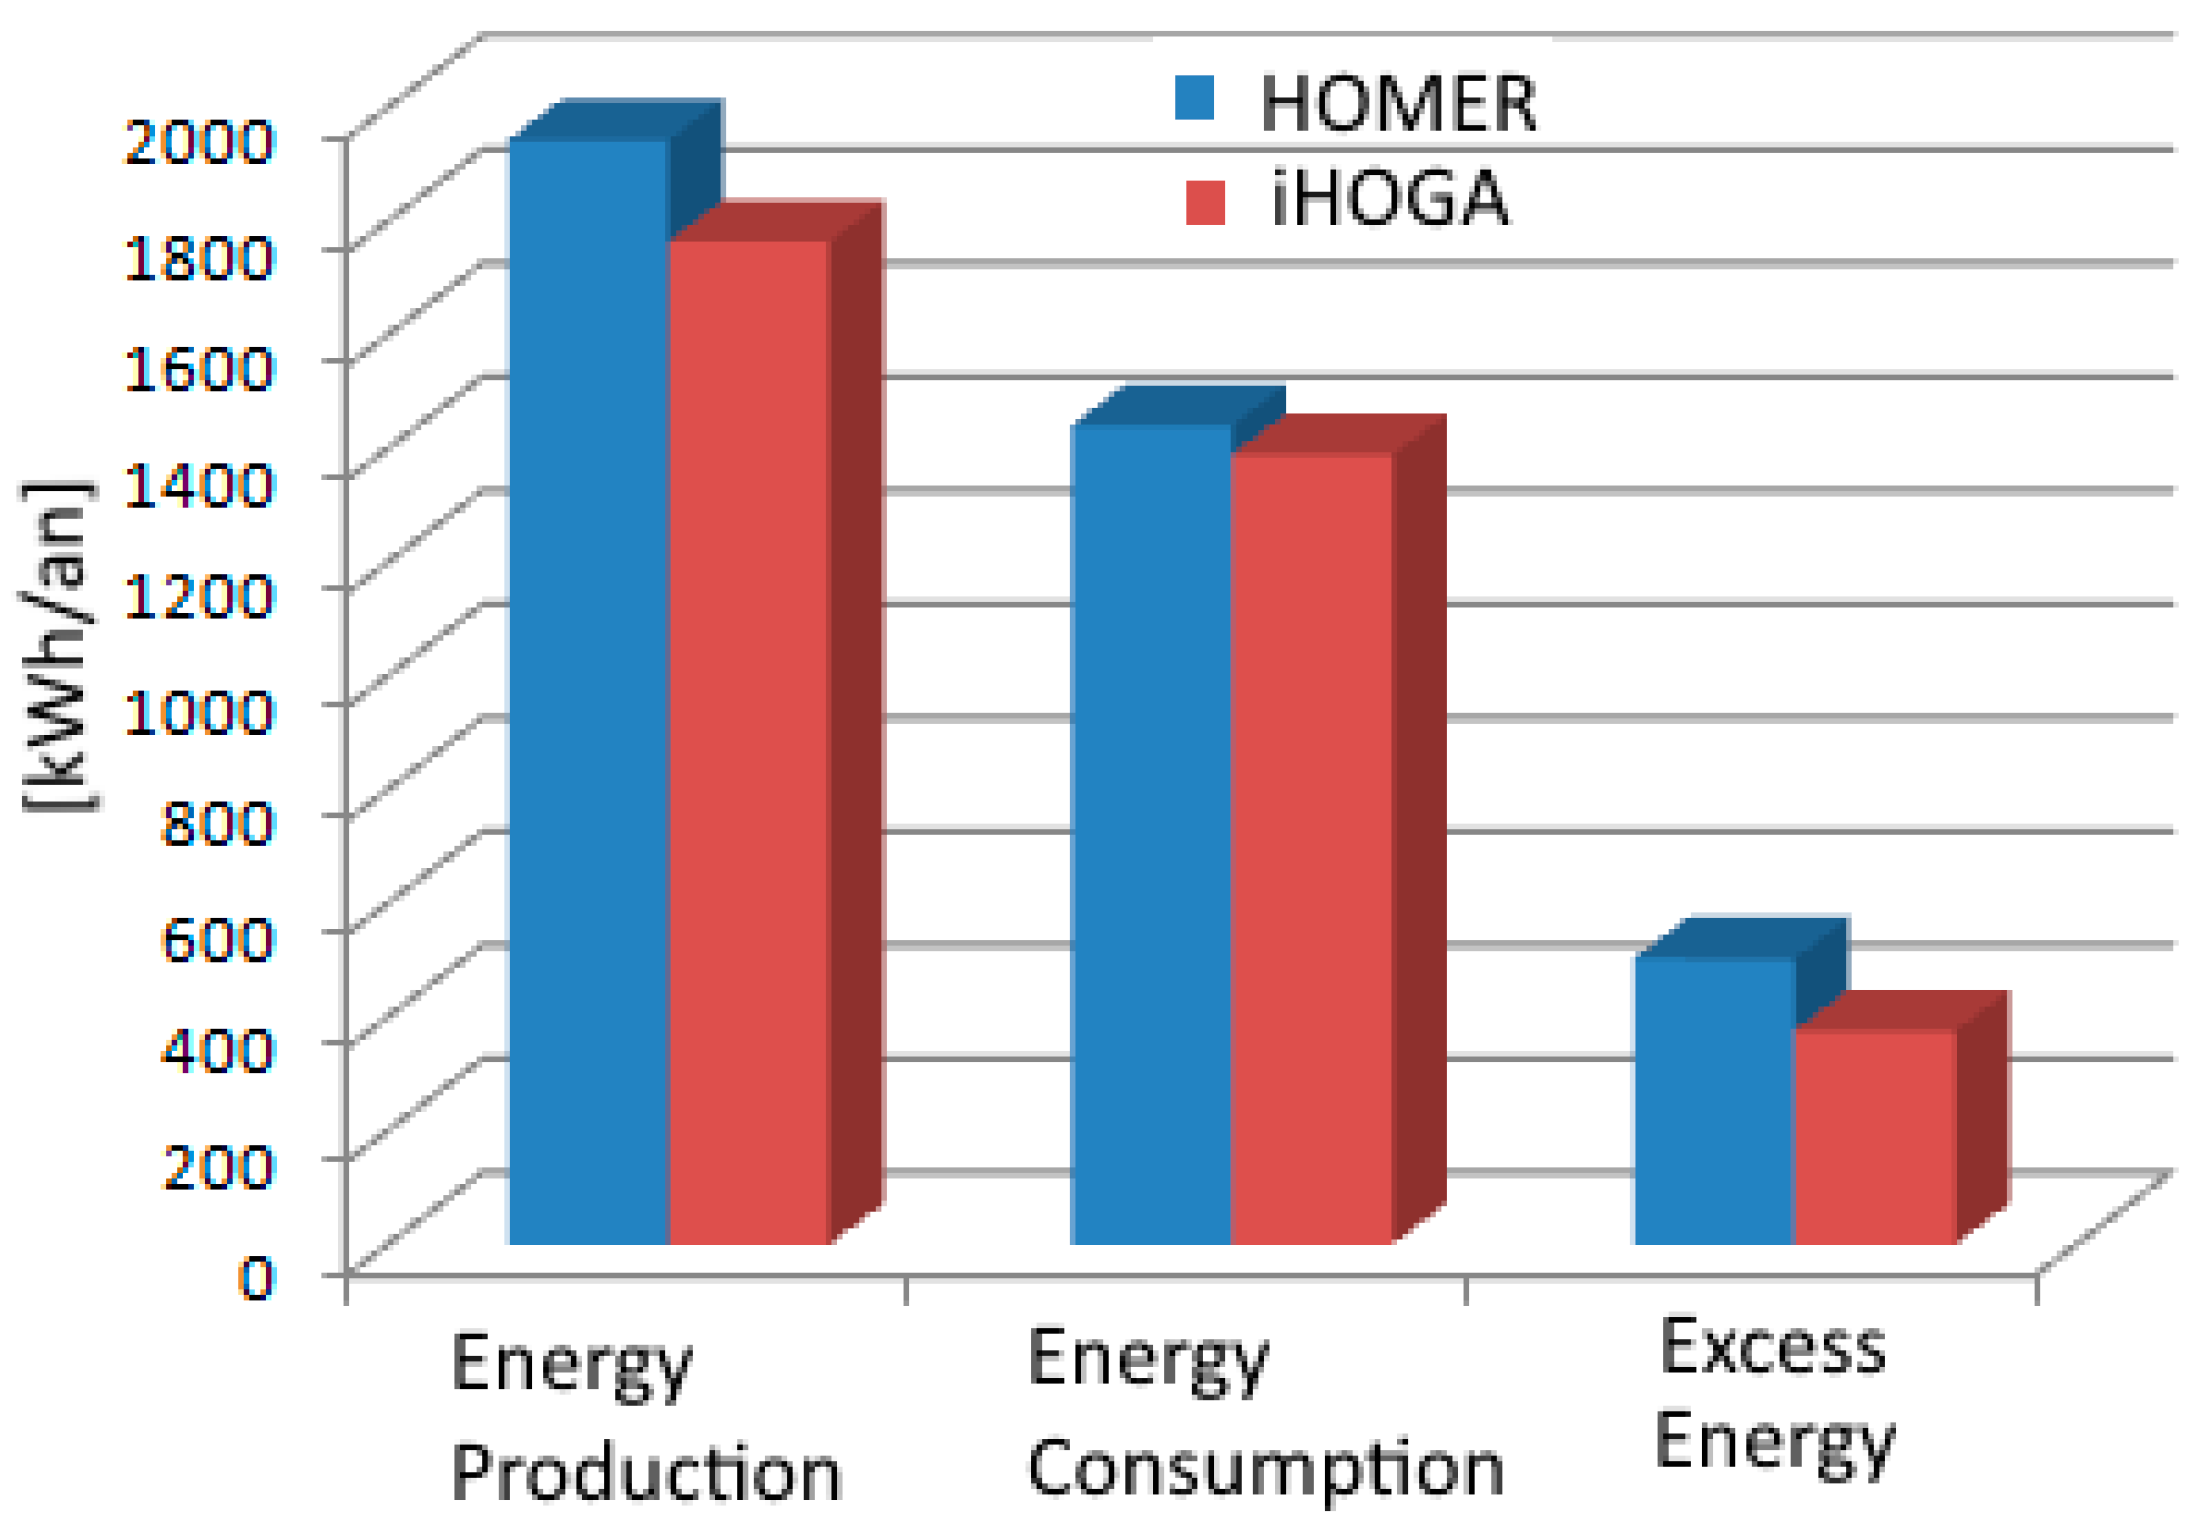
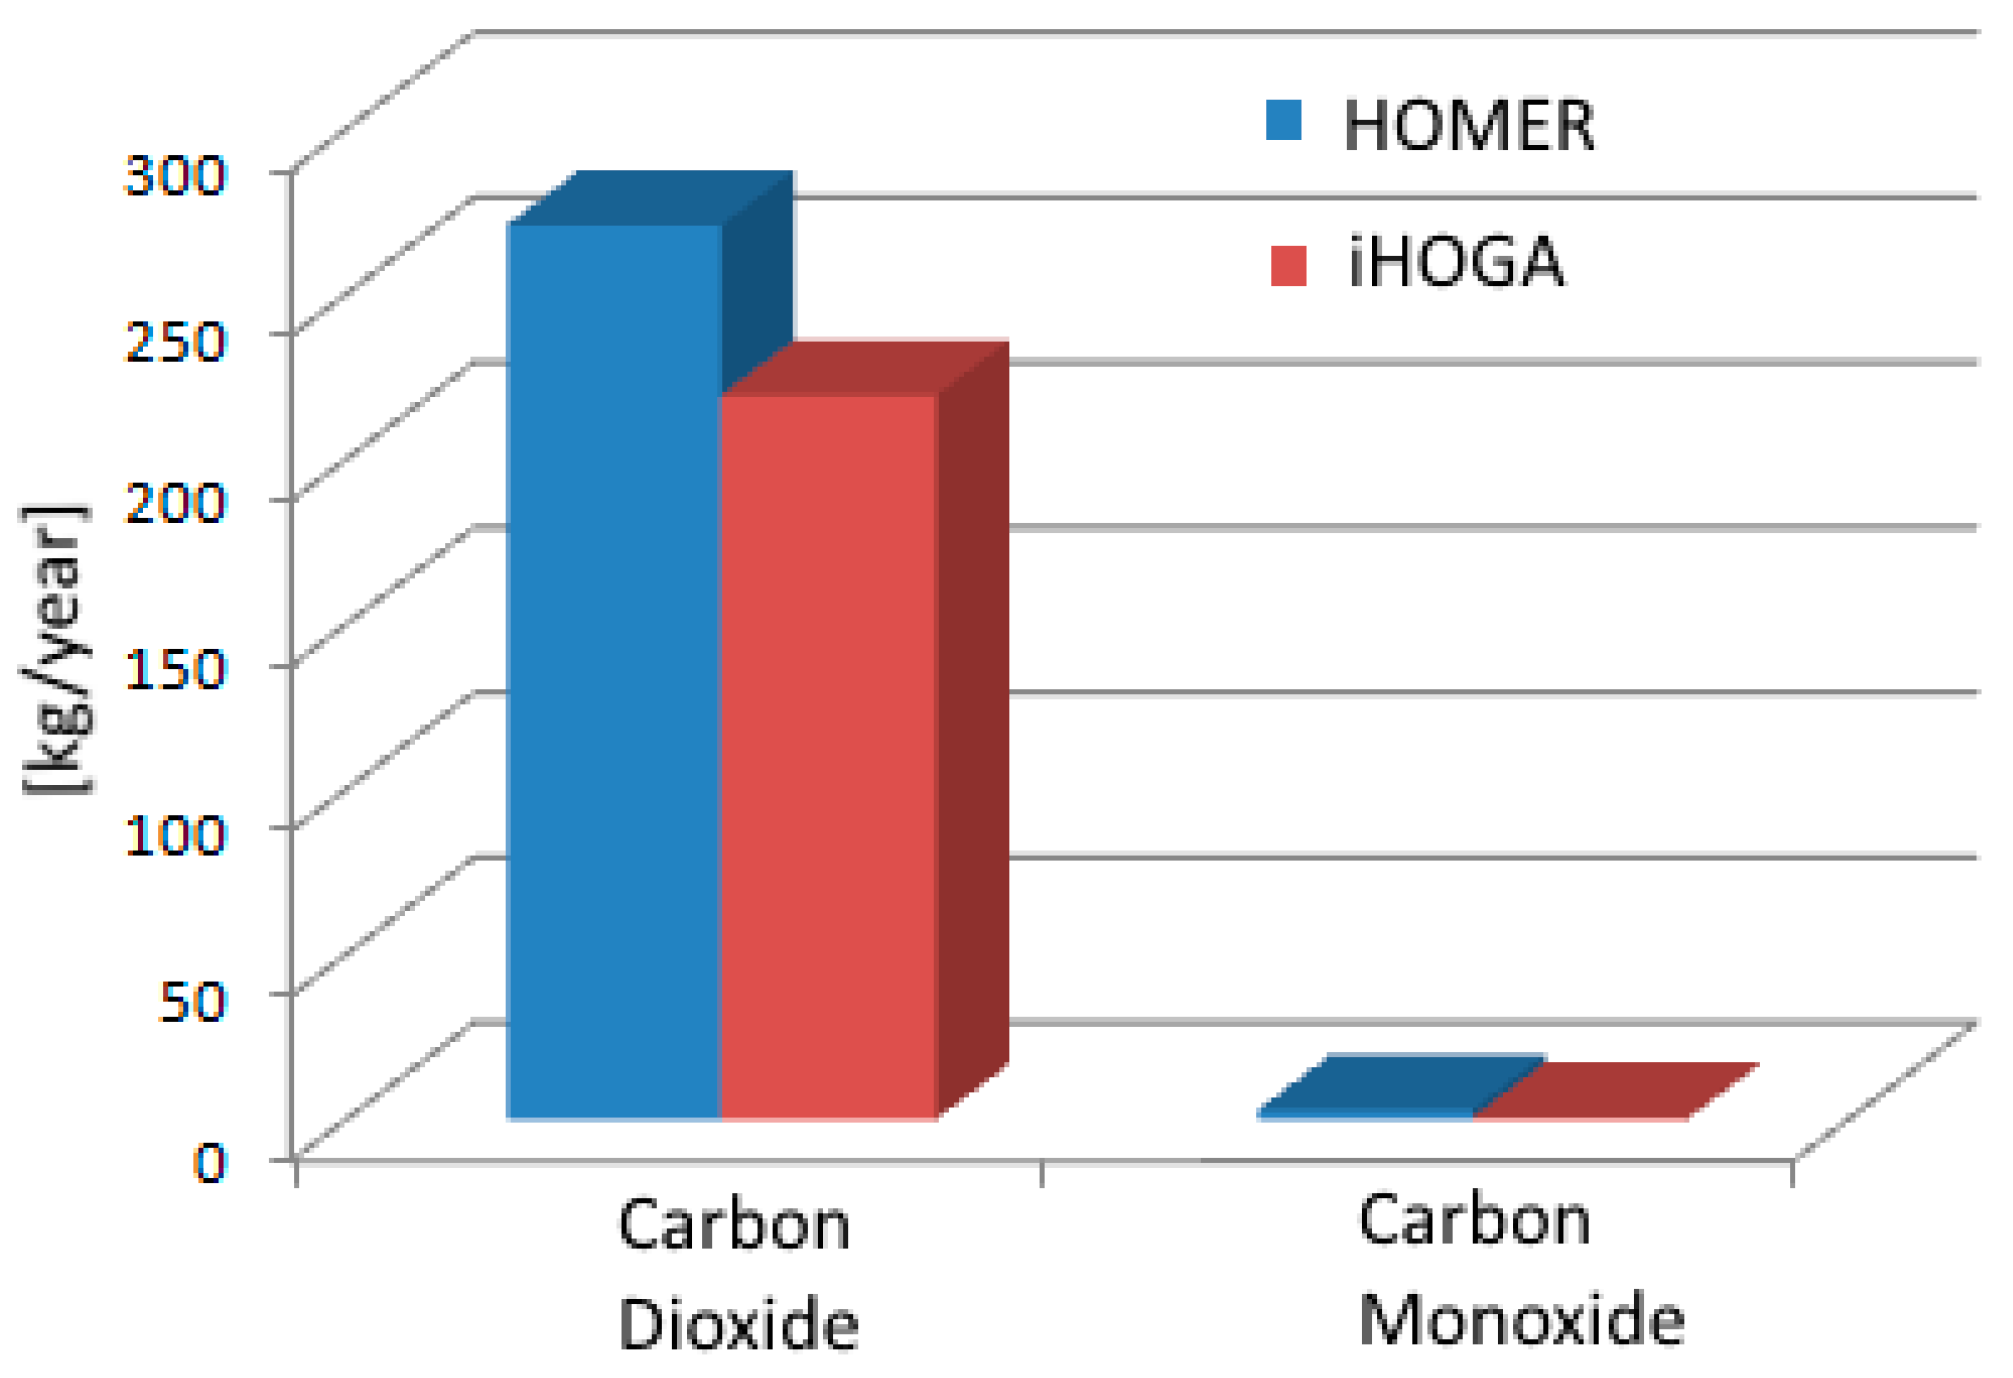
6.2. Comparison of Electrical and Pollutant Emissions
6.3. Comparative Analysis of iHOGA Case Studies
7. Conclusions
Author Contributions
Funding
Data Availability Statement
Conflicts of Interest
References
- Ram, K.; Swain, P.K.; Vallabhaneni, R.; Kumar, A. Critical assessment on application of software for designing hybrid energy systems. Mater. Today Proc. 2022, 49, 425–432. [Google Scholar] [CrossRef]
- Shezan, S.A. Feasibility analysis of an islanded hybrid wind-diesel-battery microgrid with voltage and power response for offshore Islands. J. Clean. Prod. 2021, 288, 125568. [Google Scholar] [CrossRef]
- Kushwaha, P.K.; Bhattacharjee, C. Integrated techno-economic-enviro-socio design of the hybrid renewable energy system with suitable dispatch strategy for domestic and telecommunication load across India. J. Energy Storage 2022, 55, 105340. [Google Scholar] [CrossRef]
- Li, C.; Zheng, Y.; Li, Z.; Zhang, L.; Zhang, L.; Shan, Y.; Tang, Q. Techno-economic and environmental evaluation of grid-connected and off-grid hybrid intermittent power generation systems: A case study of a mild humid subtropical climate zone in China. Energy 2021, 230, 120728. [Google Scholar] [CrossRef]
- Jahangir, M.H.; Bazdar, E.; Kargarzadeh, A. Techno-economic and environmental assessment of low carbon hybrid renewable electric systems for urban energy planning: Tehran-Iran. City Environ. Interact. 2022, 16, 100085. [Google Scholar] [CrossRef]
- Mazzeo, D.; Matera, N.; De Luca, P.; Baglivo, C.; Congedo, P.M.; Oliveti, G. A literature review and statistical analysis of photovoltaic-wind hybrid renewable system research by considering the most relevant 550 articles: An upgradable matrix literature database. J. Clean. Prod. 2021, 295, 126070. [Google Scholar] [CrossRef]
- Olówósejéjé, S.; Leahy, P.; Morrison, A.P. Optimising photovoltaic-centric hybrid power systems for energy autonomy. Energy Rep. 2021, 7, 1943–1953. [Google Scholar] [CrossRef]
- Kumar, R.; Channi, H.K. A PV-Biomass off-grid hybrid renewable energy system (HRES) for rural electrification: Design, optimization and techno-economic-environmental analysis. J. Clean. Prod. 2022, 349, 131347. [Google Scholar] [CrossRef]
- Akorede, M.F. Design and performance analysis of off-grid hybrid renewable energy systems. In Hybrid Technologies for Power Generation; Academic Press: Cambridge, MA, USA, 2022; pp. 35–68. [Google Scholar]
- Roy, D.; Hassan, R.; Das, B.K. A hybrid renewable-based solution to electricity and freshwater problems in the off-grid Sundarbans region of India: Optimum sizing and socio-enviro-economic evaluation. J. Clean. Prod. 2022, 372, 133761. [Google Scholar] [CrossRef]
- Elkadeem, M.R.; Kotb, K.M.; Elmaadawy, K.; Ullah, Z.; Elmolla, E.; Liu, B.; Wang, S.; Dán, A.; Sharshir, S.W. Feasibility analysis and optimization of an energy-water-heat nexus supplied by an autonomous hybrid renewable power generation system: An empirical study on airport facilities. Desalination 2021, 504, 114952. [Google Scholar] [CrossRef]
- Chauhan, A.; Saini, R.P. A review on Integrated Renewable Energy System based power generation for stand-alone applications: Configurations, storage options, sizing methodologies and control. Renew. Sustain. Energy Rev. 2014, 38, 99–120. [Google Scholar] [CrossRef]
- Malekshah, S.; Malekshah, Y.; Malekshah, A. A novel two-stage optimization method for the reliability-based security constraints unit commitment in presence of wind units. Clean. Eng. Technol. 2021, 4, 100237. [Google Scholar] [CrossRef]
- Malekshah, S.; Alhelou, H.H.; Siano, P. An optimal probabilistic spinning reserve quantification scheme considering frequency dynamic response in smart power environment. Int. Trans. Electr. Energy Syst. 2021, 31, e13052. [Google Scholar] [CrossRef]
- Jha, S.K.; Bilalovic, J.; Jha, A.; Patel, N.; Zhang, H. Renewable energy: Present research and future scope of Artificial Intelligence. Renew. Sustain. Energy Rev. 2017, 77, 297–317. [Google Scholar] [CrossRef]
- Manwell, J.F.; Rogers, A.; Hayman, G.; Avelar, C.T.; McGowan, J.G.; Abdulwahid, U.; Wu, K. Hybrid2–a hybrid system simulation model–theory manual. In Renewable Energy Research Laboratory; University of Massachusetts: Amherst, MA, USA, 2006. [Google Scholar]
- Dufo López, D.R. Agustín DJLB. HOGA User Manual; University of Zaragoza: Zaragoza, Spain, 2012. [Google Scholar]
- Malik, P.; Awasthi, M.; Sinha, S. A techno-economic investigation of grid integrated hybrid renewable energy systems. Sustain. Energy Technol. Assess. 2022, 51, 101976. [Google Scholar] [CrossRef]
- Ali, M.; Wazir, R.; Imran, K.; Ullah, K.; Janjua, A.K.; Ulasyar, A.; Khattak, A.; Guerrero, J.M. Techno-economic assessment and sustainability impact of hybrid energy systems in Gilgit-Baltistan, Pakistan. Energy Rep. 2021, 7, 2546–2562. [Google Scholar] [CrossRef]
- Ali, F.; Ahmar, M.; Jiang, Y.; AlAhmad, M. A techno-economic assessment of hybrid energy systems in rural Pakistan. Energy 2021, 215, 119103. [Google Scholar] [CrossRef]
- Kahwash, F.; Maheri, A.; Mahkamov, K. Integration and optimisation of high-penetration Hybrid Renewable Energy Systems for fulfilling electrical and thermal demand for off-grid communities. Energy Convers. Manag. 2021, 236, 114035. [Google Scholar] [CrossRef]
- Liu, J.; Chen, X.; Cao, S.; Yang, H. Overview on hybrid solar photovoltaic-electrical energy storage technologies for power supply to buildings. Energy Convers. Manag. 2019, 187, 103–121. [Google Scholar] [CrossRef]
- Zebra EI, C.; van der Windt, H.J.; Nhumaio, G.; Faaij, A.P. A review of hybrid renewable energy systems in mini-grids for off-grid electrification in developing countries. Renew. Sustain. Energy Rev. 2021, 144, 111036. [Google Scholar] [CrossRef]
- Elkadeem, M.R.; Wang, S.; Sharshir, S.W.; Atia, E.G. Feasibility analysis and techno-economic design of grid-isolated hybrid renewable energy system for electrification of agriculture and irrigation area: A case study in Dongola, Sudan. Energy Convers. Manag. 2019, 196, 1453–1478. [Google Scholar] [CrossRef]
- Luo, X.; Liu, Y.; Liu, X. Bi-level multi-objective optimization of design and subsidies for standalone hybrid renewable energy systems: A novel approach based on artificial neural network. J. Build. Eng. 2021, 41, 102744. [Google Scholar] [CrossRef]
- Al-Othman, A.; Tawalbeh, M.; Martis, R.; Dhou, S.; Orhan, M.; Qasim, M.; Olabi, A.G. Artificial intelligence and numerical models in hybrid renewable energy systems with fuel cells: Advances and prospects. Energy Convers. Manag. 2022, 253, 115154. [Google Scholar] [CrossRef]
- Al Garni, H.Z.; Awasthi, A.; Ramli, M.A. Optimal design and analysis of grid-connected photovoltaic under different tracking systems using HOMER. Energy Convers. Manag. 2018, 155, 42–57. [Google Scholar] [CrossRef]
- Zubi, G.; Fracastoro, G.V.; Lujano-Rojas, J.M.; El Bakari, K.; Andrews, D. The unlocked potential of solar home systems; an effective way to overcome domestic energy poverty in developing regions. Renew. Energy 2019, 132, 1425–1435. [Google Scholar] [CrossRef]
- Bouchekara, H.R.E.H.; Javaid, M.S.; Shaaban, Y.A.; Shahriar, M.S.; Ramli, M.A.M.; Latreche, Y. Decomposition based multiobjective evolutionary algorithm for PV/Wind/Diesel Hybrid Microgrid System design considering load uncertainty. Energy Rep. 2021, 7, 52–69. [Google Scholar] [CrossRef]
- Elkadeem, M.R.; Wang, S.; Azmy, A.M.; Atiya, E.G.; Ullah, Z.; Sharshir, S.W. A systematic decision-making approach for planning and assessment of hybrid renewable energy-based microgrid with techno-economic optimization: A case study on an urban community in Egypt. Sustain. Cities Soc. 2020, 54, 102013. [Google Scholar] [CrossRef]
- Elmorshedy, M.F.; Elkadeem, M.R.; Kotb, K.M.; Taha, I.B.; Mazzeo, D. Optimal design and energy management of an isolated fully renewable energy system integrating batteries and supercapacitors. Energy Convers. Manag. 2021, 245, 114584. [Google Scholar] [CrossRef]
- Khan, F.A.; Pal, N.; Saeed, S.H. Review of solar photovoltaic and wind hybrid energy systems for sizing strategies optimization techniques and cost analysis methodologies. Renew. Sustain. Energy Rev. 2018, 92, 937–947. [Google Scholar] [CrossRef]
- Singh, R.; Bansal, R.C.; Singh, A.R. Optimization of an isolated photo-voltaic generating unit with battery energy storage system using electric system cascade analysis. Electr. Power Syst. Res. 2018, 164, 188–200. [Google Scholar] [CrossRef]
- Quitoras, M.R.; Cabrera, P.; Campana, P.E.; Rowley, P.; Crawford, C. Towards robust investment decisions and policies in integrated energy systems planning: Evaluating trade-offs and risk hedging strategies for remote communities. Energy Convers. Manag. 2021, 229, 113748. [Google Scholar] [CrossRef]
- Abid, H.; Thakur, J.; Khatiwada, D.; Bauner, D. Energy storage integration with solar PV for increased electricity access: A case study of Burkina Faso. Energy 2021, 230, 120656. [Google Scholar] [CrossRef]
- Lyden, A.; Pepper, R.; Tuohy, P.G. A modelling tool selection process for planning of community scale energy systems including storage and demand side management. Sustain. Cities Soc. 2018, 39, 674–688. [Google Scholar] [CrossRef]
- Ridha, H.M.; Gomes, C.; Hizam, H.; Ahmadipour, M.; Heidari, A.A.; Chen, H. Multi-objective optimization and multi-criteria decision-making methods for optimal design of standalone photovoltaic system: A comprehensive review. Renew. Sustain. Energy Rev. 2021, 135, 110202. [Google Scholar] [CrossRef]
- López-González, A. Community-scale rural energy systems: General planning algorithms and methods for developing countries. In Predictive Modelling for Energy Management and Power Systems Engineering; Elsevier: Amsterdam, The Netherlands, 2021; pp. 63–84. [Google Scholar]
- Carroquino, J.; Roda, V.; Mustata, R.; Yago, J.; Valiño, L.; Lozano, A.; Barreras, F. Combined production of electricity and hydrogen from solar energy and its use in the wine sector. Renew. Energy 2018, 122, 251–263. [Google Scholar] [CrossRef] [Green Version]
- Bukar, A.L.; Tan, C.W.; Lau, K.Y. Optimal sizing of an autonomous photovoltaic/wind/battery/diesel generator microgrid using grasshopper optimization algorithm. Sol. Energy 2019, 188, 685–696. [Google Scholar] [CrossRef]
- Alkarrami, F.; Iqbal, T.; Pope, K. Optimal sizing of a stand-alone hybrid energy system for water pumping in Sirte, Libya. In 2016 IEEE Electrical Power and Energy Conference (EPEC); IEEE: Ottawa, ON, Canada, 2016; pp. 1–5. [Google Scholar]
- Abhishek KS, N.; Kumar, M.K.; Ali, R.M.; Rao MR, S.; Reddy, S.S.; Kiran, B.R.; Neelamegam, P. Analysis of software tools for renewable energy systems. In Proceedings of the 2018 International Conference on Computation of Power, Energy, Information and Communication (ICCPEIC), Chennai, India, 28–29 March 2018; pp. 179–185. [Google Scholar]
- Kumar, A.P. Analysis of Hybrid Systems: Software tools. In Proceedings of the 2016 2nd International Conference on Advances in Electrical, Electronics, Information, Communication and Bio-Informatics (AEEICB), Chennai, India, 27–28 February 2016; pp. 327–330. [Google Scholar]
- Xu, S.; Yan, C.; Jin, C. Design optimization of hybrid renewable energy systems for sustainable building development based on energy-hub. Energy Procedia 2019, 158, 1015–1020. [Google Scholar] [CrossRef]
- Saiprasad, N.; Kalam, A.; Zayegh, A. Comparative Study of Optimal Sizing of Renewable Energy System and Triple Bottom Line (TBL) Analysis for a University in Australia. In Proceedings of the 2018 Australasian Universities Power Engineering Conference (AUPEC), Auckland, New Zealand, 27–30 November 2018; pp. 1–6. [Google Scholar]


| Source | Annual Potential | The Application |
|---|---|---|
| Solar energy | 60 PJ 1.2 TWh | Thermal energy Electricity |
| Wind energy | 23 TWh | Electricity |
| Hydro energy | 23 TWh | Electricity |
| Biomass and biogas | 318 PJ | Thermal energy |
| Geothermal energy | 7 PJ | Thermal energy |
| Device | Installed Power (W) | Average Usage (h/day) | Daily Energy Consumption (kWh) | Number of Units | Total Energy Consumption (kWh/day) |
|---|---|---|---|---|---|
| Computer and screen | 200 | 2 | 0.4 | 1 | 0.4 |
| Portable computer | 75 | 1 | 0.075 | 1 | 0.075 |
| Phone charger | 15 | 2 | 0.03 | 1 | 0.03 |
| Refrigerator | 200 | 8 | 1.6 | 1 | 1.6 |
| Fan | 50 | 10 | 0.5 | 2 | 1 |
| Light bulbs | 100 | 5 | 0.5 | 3 | 1.5 |
| Component | Value |
|---|---|
| PV (kW) | 1 |
| Wind turbine 1 kW (units) | 2 |
| Diesel generator (kW) | 1 |
| Battery (units) | 5 |
| Converter (kW) | 1 |
| COE (RON/kWh) | 1.97 |
| NPC (RON) | 36,650 |
| Operating costs (RON/year) | 2134 |
| Initial capital (RON) | 21,995 |
| Renewable resources (%) | 81 |
| Component | Energy Production (kWh/Year) | Energy Production (%) | Energy Consumption of All Consumers (kWh/Year) |
|---|---|---|---|
| PV | 1140 | 58.63 | 1441 |
| Diesel generator | 271 | 13.92 | |
| Wind turbine | 533 | 27.45 | |
| Sum | 1944 | 100 |
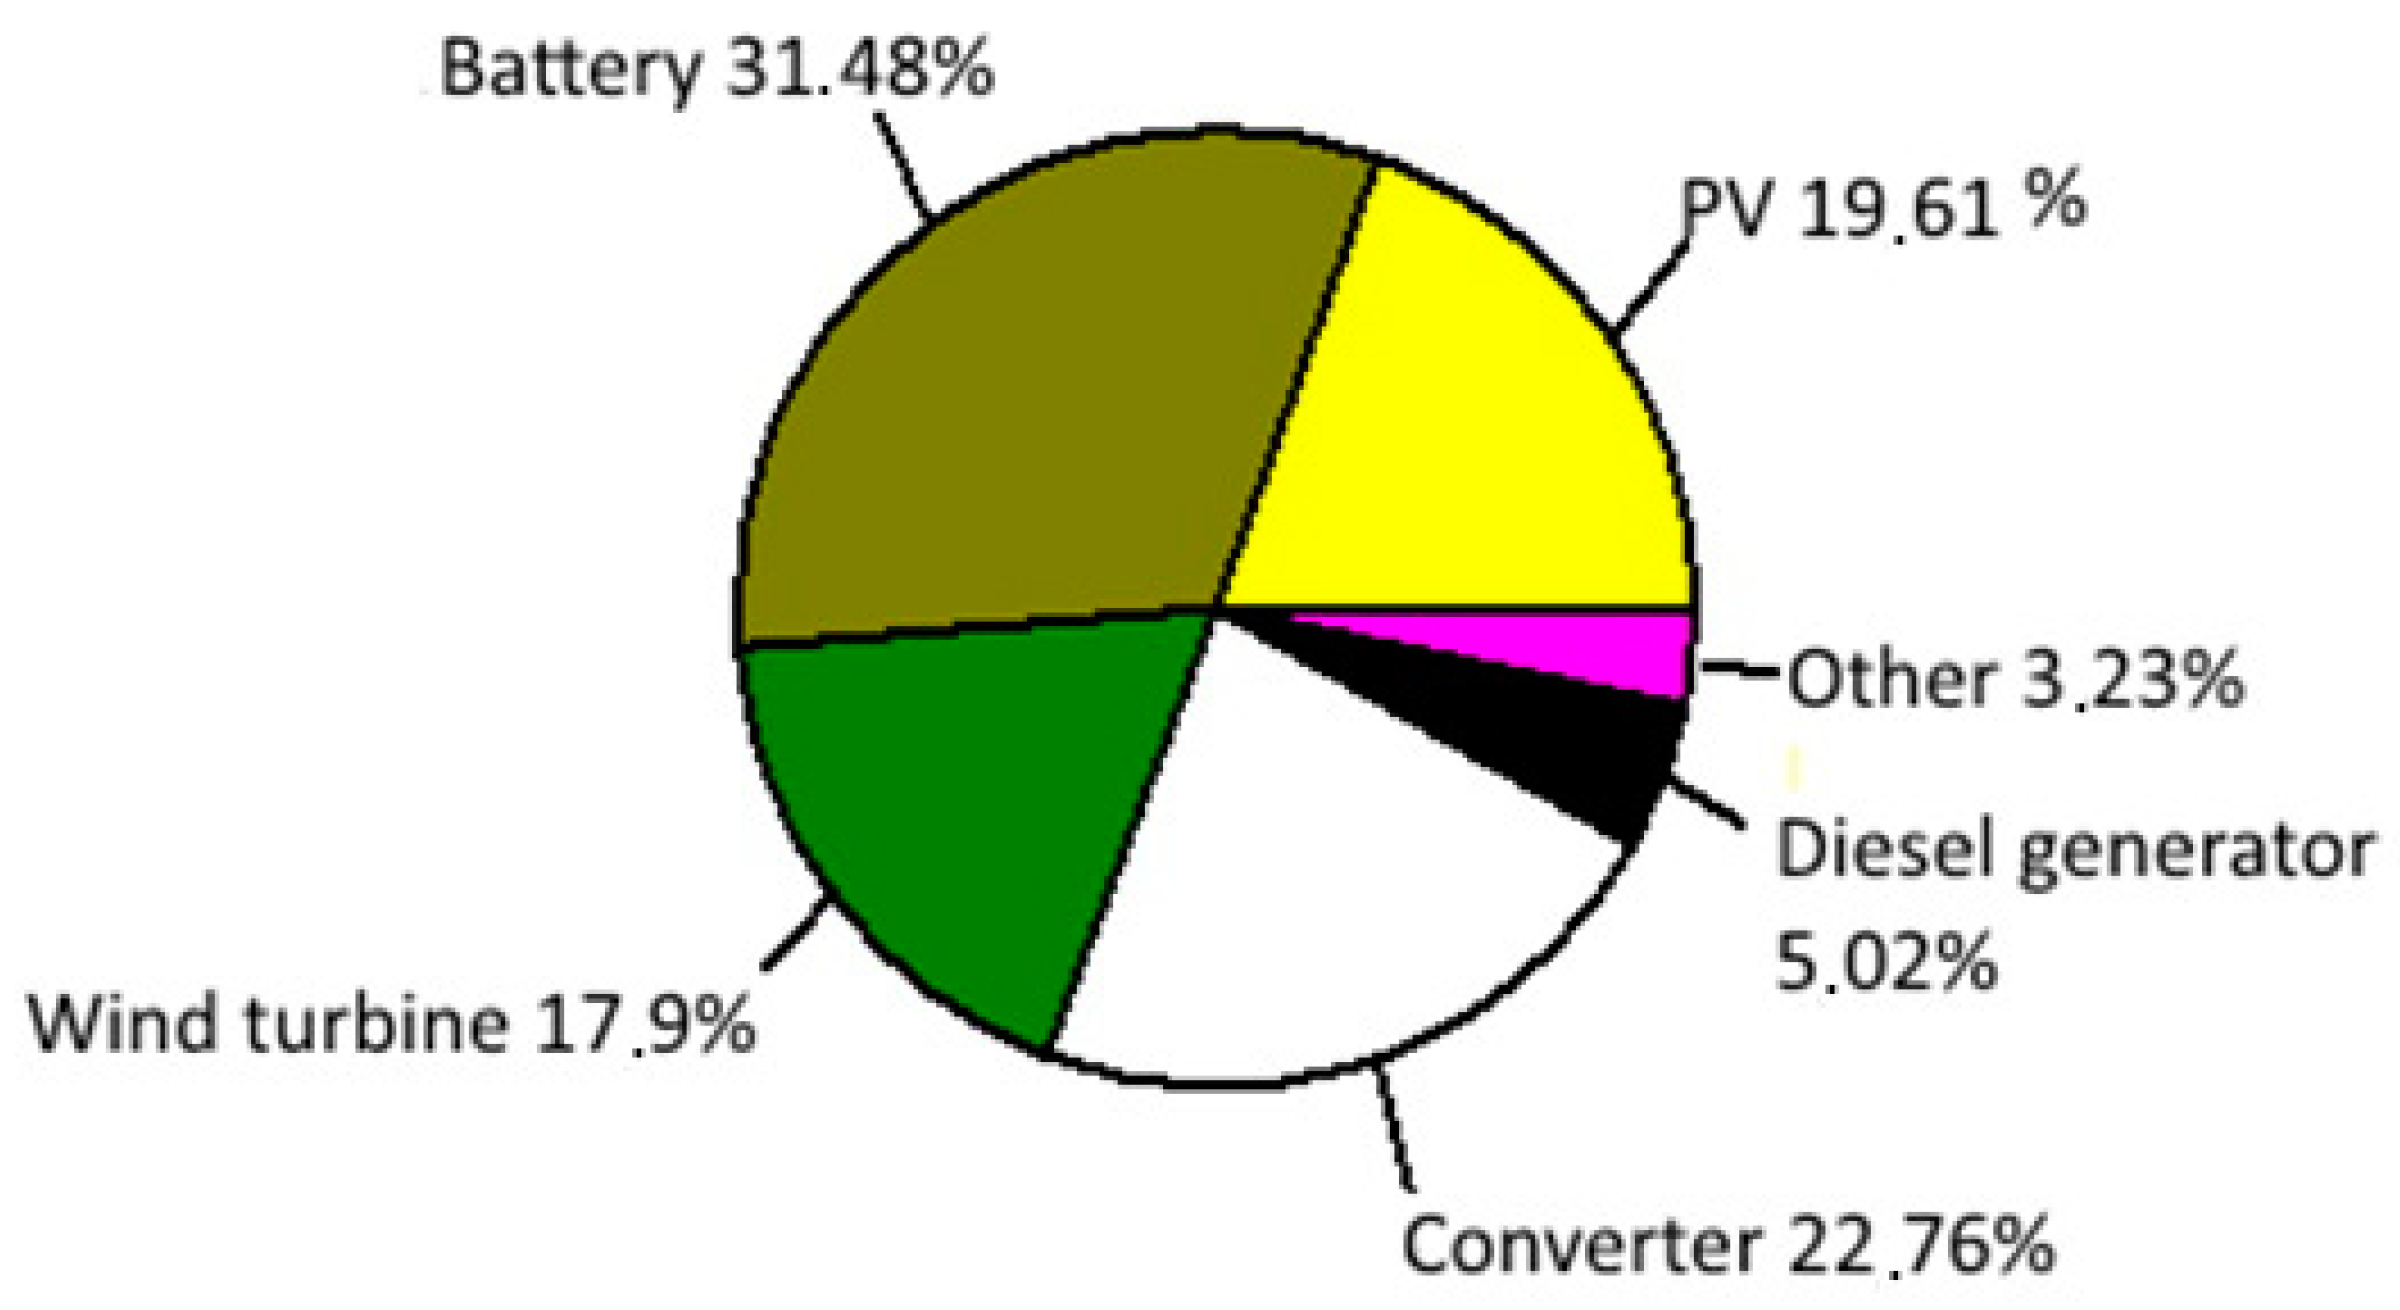
| Component | Social Capital (RON) | Replacement (RON) | Maintenance (RON) | Fuel (RON) | Recovered Amount (RON) | Sum (RON) |
|---|---|---|---|---|---|---|
| PV | 4500 | 4000 | 581.74 | 0 | −3800 | 5081.7 |
| Wind turbine | 8595 | 1807.6 | 5817.4 | 0 | −1018.7 | 15,201 |
| Diesel generator | 2000 | 1800 | 110.92 | 5385.1 | −255 | 7270 |
| Battery | 3500 | 1060 | 646 | 0 | −199.6 | 5007.4 |
| Converter | 3500 | 848.55 | 0 | 0 | −159.71 | 4088.8 |
| System | 21,995 | 3716.9 | 7156.4 | 5385.1 | −1603.7 | 36,650 |
| Emissions | Value (kg/Year) |
|---|---|
| Carbon dioxide | 271 |
| Carbon monoxide | 0.75 |
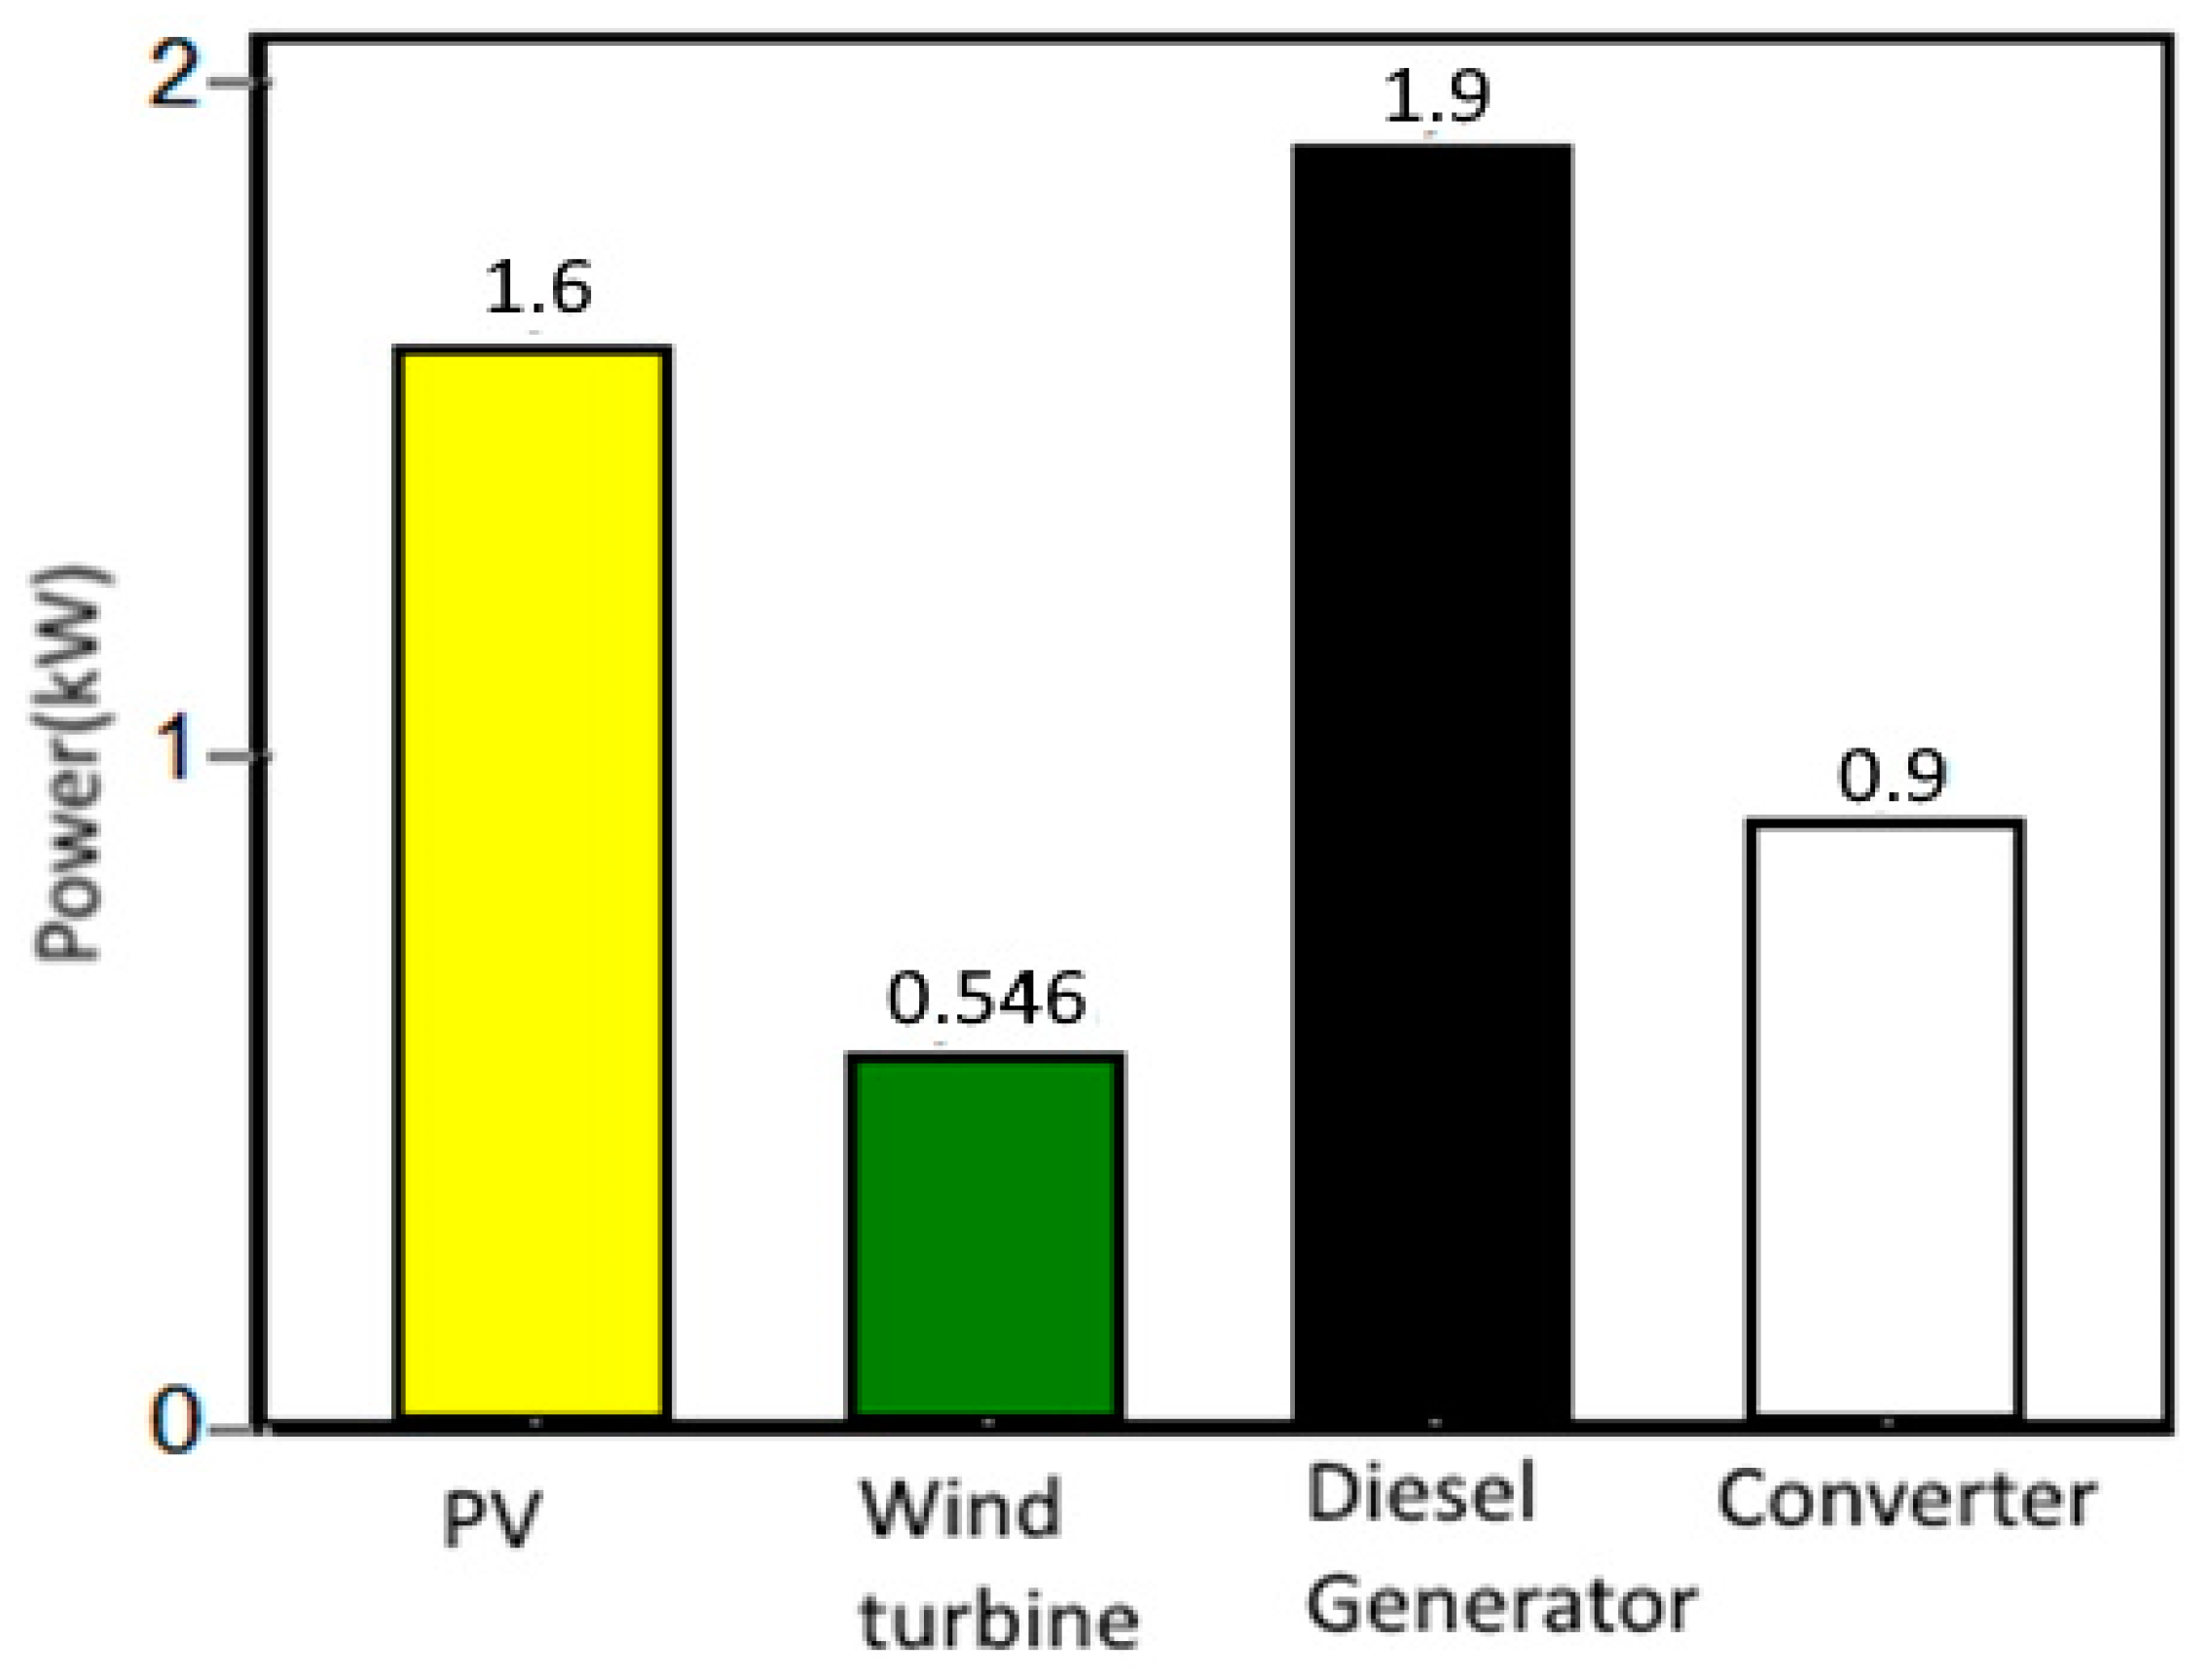
| Component | Value |
|---|---|
| PV (kW) | 1.6 |
| Wind turbine (kW) | 0.546 |
| Diesel generator (kW) | 1.9 |
| Battery (kWh) | 8.6 |
| Converter (kW) | 0.9 |
| COE (RON/kWh) | 1.92 |
| NPC (RON) | 66,770 |
| Operating costs (RON/year) | 70.56 |
| Initial capital (RON) | 32,484 |
| Renewable resources (%) | 92 |
| Component | Energy Production (kWh/Year) | Energy Production (%) | Energy Consumption of Consumers (kWh/Year) |
|---|---|---|---|
| PV | 1392 | 78.86 | 1389 |
| Diesel generator | 104 | 5.89 | |
| Wind turbine | 269 | 15.24 | |
| Sum | 1765 | 100 |
| Emissions | Value [kg/Year] |
|---|---|
| Carbon dioxide | 219.39 |
| Carbon monoxide | 0.54 |
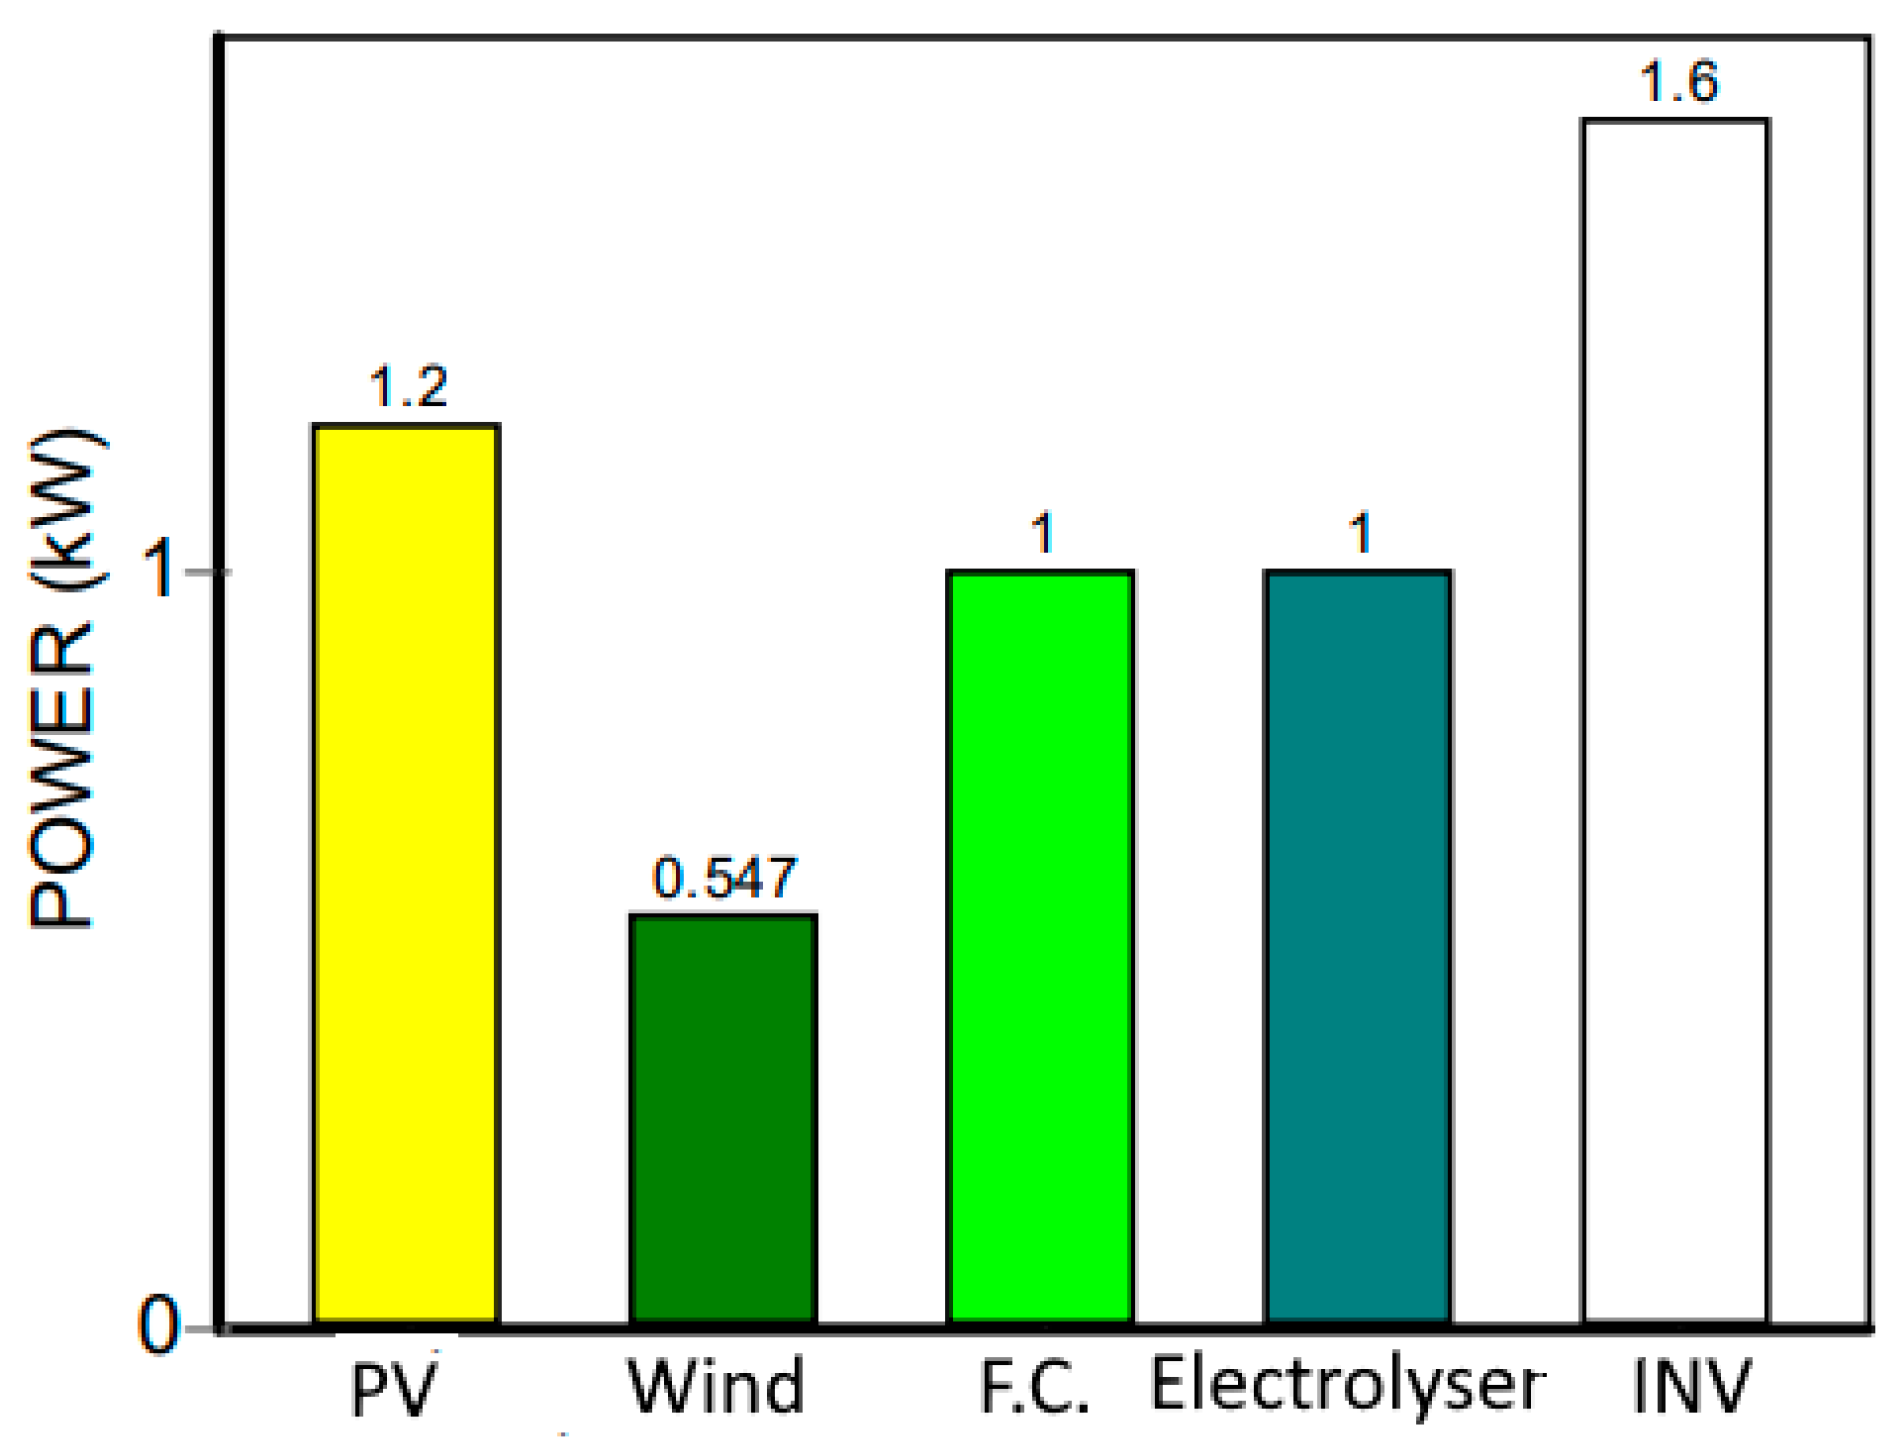
| Component | Value |
|---|---|
| PV (kW) | 1.2 |
| Wind turbine (kW) | 0.547 |
| Battery (kWh) | 8.6 |
| Fuel cell (kW) | 1 |
| Electrolyzer (kW) | 1 |
| Converter (kW) | 1.6 |
| COE (RON/kWh) | 2.6 |
| NPC (RON) | 86,190.7 |
| Initial capital (RON) | 44,693 |
| Renewable resources (%) | 100 |
| Component | Energy Production (kWh/Year) | Energy Production (%) | Energy Consumption of Consumers (kWh/Year) |
|---|---|---|---|
| PV | 2150 | 69.51 | 1389 |
| Wind turbine | 380 | 12.28 | |
| FC | 563 | 18.2 | |
| Sum | 3093 | 100 |
| Emissions | Value (kg/Year) |
|---|---|
| Carbon dioxide | 116 |
| Component | Value |
|---|---|
| PV (kW) | 1.6 |
| Wind turbine (kW) | 1.093 |
| Battery (kWh) | 17.2 |
| Converter (kW) | 0.9 |
| COE (RON/kWh) | 2.21 |
| NPC (RON) | 76,340 |
| Initial capital (RON) | 38,821 |
| Renewable resources (%) | 100 |
| Component | Energy Production (kWh/Year) | Energy Production (%) | Energy Consumption of Consumers (kWh/Year) |
|---|---|---|---|
| PV | 1392 | 72.12 | 1389 |
| Wind turbine | 538 | 27.88 | |
| Sum | 1930 | 100 |
| Economic Comparison | HOMER | iHOGA |
|---|---|---|
| Initial capital (RON) | 21,995 | 32,484 |
| Operating costs (RON/year) | 2134 | 70.56 |
| Net present cost (RON) | 36,650 | 66,770 |
| Cost of energy (RON/kWh) | 1.97 | 1.92 |
Disclaimer/Publisher’s Note: The statements, opinions and data contained in all publications are solely those of the individual author(s) and contributor(s) and not of MDPI and/or the editor(s). MDPI and/or the editor(s) disclaim responsibility for any injury to people or property resulting from any ideas, methods, instructions or products referred to in the content. |
© 2023 by the authors. Licensee MDPI, Basel, Switzerland. This article is an open access article distributed under the terms and conditions of the Creative Commons Attribution (CC BY) license (https://creativecommons.org/licenses/by/4.0/).
Share and Cite
Hoarcă, I.C.; Bizon, N.; Șorlei, I.S.; Thounthong, P. Sizing Design for a Hybrid Renewable Power System Using HOMER and iHOGA Simulators. Energies 2023, 16, 1926. https://doi.org/10.3390/en16041926
Hoarcă IC, Bizon N, Șorlei IS, Thounthong P. Sizing Design for a Hybrid Renewable Power System Using HOMER and iHOGA Simulators. Energies. 2023; 16(4):1926. https://doi.org/10.3390/en16041926
Chicago/Turabian StyleHoarcă, Ioan Cristian, Nicu Bizon, Ioan Sorin Șorlei, and Phatiphat Thounthong. 2023. "Sizing Design for a Hybrid Renewable Power System Using HOMER and iHOGA Simulators" Energies 16, no. 4: 1926. https://doi.org/10.3390/en16041926
APA StyleHoarcă, I. C., Bizon, N., Șorlei, I. S., & Thounthong, P. (2023). Sizing Design for a Hybrid Renewable Power System Using HOMER and iHOGA Simulators. Energies, 16(4), 1926. https://doi.org/10.3390/en16041926