Article

Improving Energy Performance in Flexographic Printing Process through Lean and AI Techniques: A Case Study

1
Jeddah College of Engineering, University of Business and Technology, Jeddah 21448, Saudi Arabia
2
Department of Industrial and Manufacturing Engineering, University of Engineering and Technology, Lahore 54890, Pakistan
3
Department of Industry Engineering, School of Mechanical Engineering, Northwestern Polytechnical University, Xi’an 710072, China
4
Regulated Software Research Center (RSRC), Dundalk Institute of Technology, A91 K584 Dundalk, Ireland
*
Authors to whom correspondence should be addressed.
Energies 2023, 16(4), 1972; https://doi.org/10.3390/en16041972
Submission received: 23 January 2023 / Revised: 10 February 2023 / Accepted: 13 February 2023 / Published: 16 February 2023
(This article belongs to the Special Issue Energy Management: Economic, Social, and Ecological Aspects)

Abstract

:
Flexographic printing is a highly sought-after technique within the realm of packaging and labeling due to its versatility, cost-effectiveness, high speed, high-quality images, and environmentally friendly nature. A major challenge in flexographic printing is the need to optimize energy usage, which requires diligent attention to resolve. This research combines lean principles and machine learning to improve energy efficiency in selected flexographic printing machines; i.e., Miraflex and F&K. By implementing the 5Why root cause analysis and Kaizen, the study found that the idle time was reduced by 30% for the Miraflex machine and the F&K machine, resulting in energy savings of 34.198% and 38.635% per meter, respectively. Additionally, a multi-linear regression model was developed using machine learning and a range of input parameters, such as machine speed, production meter, substrate density, machine idle time, machine working time, and total machine run time, to predict energy consumption and optimize job scheduling. The results of the research exhibit that the model was efficient and accurate, leading to a reduction in energy consumption and costs while maintaining or even improving the quality of the printed output. This approach can also add to reducing the carbon footprint of the manufacturing process and help companies meet sustainability goals.

1. Introduction

The global energy crisis is a major concern that has been present for many years, characterized by a growing demand for energy due to a rapidly increasing population and expanding global economy, as well as scarce fossil fuels sources, that are the dominant energy source for the majority of the globe [1,2,3]. As a result, energy optimization is essential for reducing costs, increasing efficiency, and minimizing environmental impact. In the manufacturing context, energy optimization is a key aspect of sustainable production and efficient economy, involving identifying areas of energy consumption within the manufacturing process and implementing strategies to reduce or efficiently utilize this energy. This not only reduces costs for the company, but also helps to minimize the environmental impacts of manufacturing operations [4,5]. To monitor energy consumption in the manufacturing process, energy management systems can be used, which provide real-time data on energy usage, allowing organizations to identify areas of high energy consumption and act to reduce it [6,7].
The cited studies all focus on the optimization of energy consumption in various settings, such as auto assembly plants, plastics and rubber manufacturing, and IoT networks. Boyd [8] presented a working paper on the energy optimization program of U.S auto assembly plants, where the ENERGY STAR approach was used for the optimization purpose, and it resulted in a drop of 696 million pounds in carbon emissions recorded at the plants. Cresko [9] emphasized the use of advanced practices to reduce the energy consumption in U.S. Plastics and Rubber Manufacturing, and it yielded substantial energy conservations and reductions in environmental impact. Kumar et al. [10] proposed a framework for the energy optimization of a sensor-enabled IoT environment for green communication, and Dev et al. [11] attempted to maximize the energy output in IoT networks using the Harris Hawks Optimization algorithm (HHO), which resulted in reducing the environmental impact of these devices while maintaining their functionality. Overall, these studies emphasize the importance of energy optimization in various industries and the potential for significant energy savings and reduction in greenhouse gas emissions through the implementation of energy efficiency programs and advanced practices. Margolis et al. [12] conducted a study on energy optimization in the printing and publishing industries, where they found that 50% of energy utilization in the printing industry is used for drying, which is linked to the inking system. Additionally, the study suggests that using electro technologies such as ultraviolet (UV) and electron beam (EB) can reduce energy consumption by at least 50% compared to natural gas or hot-air drying processes. Neugebauer et al. [13] also highlighted the importance of reducing power usage in the printing industry as a high-priority concern. They suggest that finding an optimal balance between production and energy consumption is crucial to reducing energy usage and costs in the industry.
Flexographic printing is a widely adopted technique in the packaging and labeling industry, due to its versatility, cost-effectiveness, high printing speed, ability to produce high-quality images and graphics, and environmentally friendly nature [14]. According to the Mordor Intelligence Report [15,16], the flexographic printing process industry is expected to rise at a CAGR of 2.44% from 2021 to 2026, reaching a value of 124.61 billion USD, up from 107.42 billion USD. The printing industry serves a wide range of businesses, particularly in the personal care product sector, such as the toilet tissue market in Pakistan. The toilet tissue market in Pakistan is growing, driven by an increasing population, rising disposable incomes, and improved hygiene standards. A market research report estimated that the toilet tissue market in Pakistan was valued at 106.9 million USD in 2018 and is projected to reach 157.2 million USD by 2025, with a CAGR of 5.3% over the anticipated time frame from 2019 to 2025 [17,18]. These toilet tissue papers are packaged in wrappers that are printed on extruded films of polypropylene (MOPP) using solvent-based inks by flexographic printing process. However, one of the major challenges in this process is the optimization of energy consumption along with other issues, such as print defects, frequent process stoppages, machine fill-ups, and shade inconsistency, which results in high manufacturing costs, including printing and process scrap. Therefore, it is crucial to optimize the process by controlling energy consumption, in order to reduce manufacturing costs, improve print quality, and support environmental sustainability.
The literature on the optimization of the flexographic printing process to minimize manufacturing cost is limited and focuses on parameters such as ink type, viscosity, substrate material, solvent type, drying time, anilox, and printing plates [16,19,20,21,22,23,24,25]. For example, Joshi [16] studied the flexo process variables to optimize the manufacturing cost for a three-layer polyethylene film using blue nitrocellulose ink, and succeeded in maintaining the print quality while reducing ink consumption by 18.26%. Tomasegovic et al. [19] also conducted an optimization study on the flexographic printing process for environmentally friendly substrates. Similarly, Żołek-Tryznowska et al. [20] focused on improving the flexographic printing process by examining different parameters such as ink viscosity, type of substrate, and printing plates, and found that print quality is significantly affected by ink viscosity. Valdec et al. [21] investigated the flexo parameters such as platemaking, printing pressure, line rulings, and top dot shape to improve tone quality on an aluminum foil substrate. Keawkul et al. [22] optimized the printing parameters, including anilox roller and ink temperature, for effective ink transfer on the substrate and found that 25 °C and 30 °C are the suitable ink temperatures for better print quality, while print speed and anilox resolution have no significant impact on the ink transfer.
Lean techniques are widely used in various manufacturing industries to improve process efficiency and reduce waste, and the flexographic printing industry is no exception. The use of lean methods such as Kaizen, value stream mapping (VSM), root cause analysis, and visual management techniques like Kanban boards, can lead to significant improvements in productivity, quality, and cost savings [26,27,28,29]. These techniques have been proven to be effective in reducing lead times, defects, and inventory levels and increasing productivity. As the flexographic printing industry becomes increasingly competitive, the use of lean techniques will become an essential part of the printing process optimization. Zahoor et al. [30] carried out a case study on flexographic printing process improvement by lowering breakdown time using the five why lean technique, resulting in an overall effectiveness of the process, which improved from 30% to 40.2%. Another study by authors improved the flexo process by 24.31% using a hybrid VSM and Kaizen lean approach, resulting in a cost reduction from US$0.762 million to US$0.6 million [31]. Lipiak [32] aimed to improve the flexographic process by employing single-minute exchange of die and quality function deployment lean approaches.
The above-cited literature indicates that the use of flexographic printing machines for the production of tissue paper packaging is prevalent; however, there is a lack of studies investigating the energy efficiency of the flexo process through the implementation of lean methodologies. This gap in research is crucial to address, as it has the potential to result in overall manufacturing cost reductions and environmental improvements by decreasing energy usage in the tissue paper packaging process. The current study is primarily motivated by the need to address this gap. For this study, two flexographic printing machines employed by a reputable packaging company in Pakistan were selected as a case study to examine the energy optimization opportunities through the application of lean techniques (i.e., 5Why root cause analysis and Kaizen). Additionally, machine learning is used to develop a regression model that predicts energy consumption and accordingly adjusts the printing process, and to optimize the scheduling of jobs to minimize energy usage. The following objectives have been established for this case study, taking into consideration the concerns of the relevant industry and after conducting a comprehensive literature review:
  • To optimize energy consumption by the flexographic printing operation for tissue roll packaging;
  • To schedule jobs to the machines based on energy optimization.
The paper is composed in the following format: The methods and materials are explained in depth in Section 2. The results and discussion (Section 3) delve into the integration of a lean approach, showcasing the use of 5Why analysis and Kaizen practices, as well as machine learning modeling. Finally, Section 4 provides conclusions and suggestions for future study.

2. Materials and Methods

Flexographic printing is a method of printing that uses a flexible relief plate, made of rubber or photopolymer, mounted on a cylinder to transfer ink to a substrate, such as paper, plastic, or metal. The process is often used for printing on packaging materials, such as boxes, bags, and labels, and is known for its high speed and ability to print on a wide variety of materials [30,33]. Figure 1 demonstrates the working principle of a flexographic printing machine. The key features of the printing process are as follows:
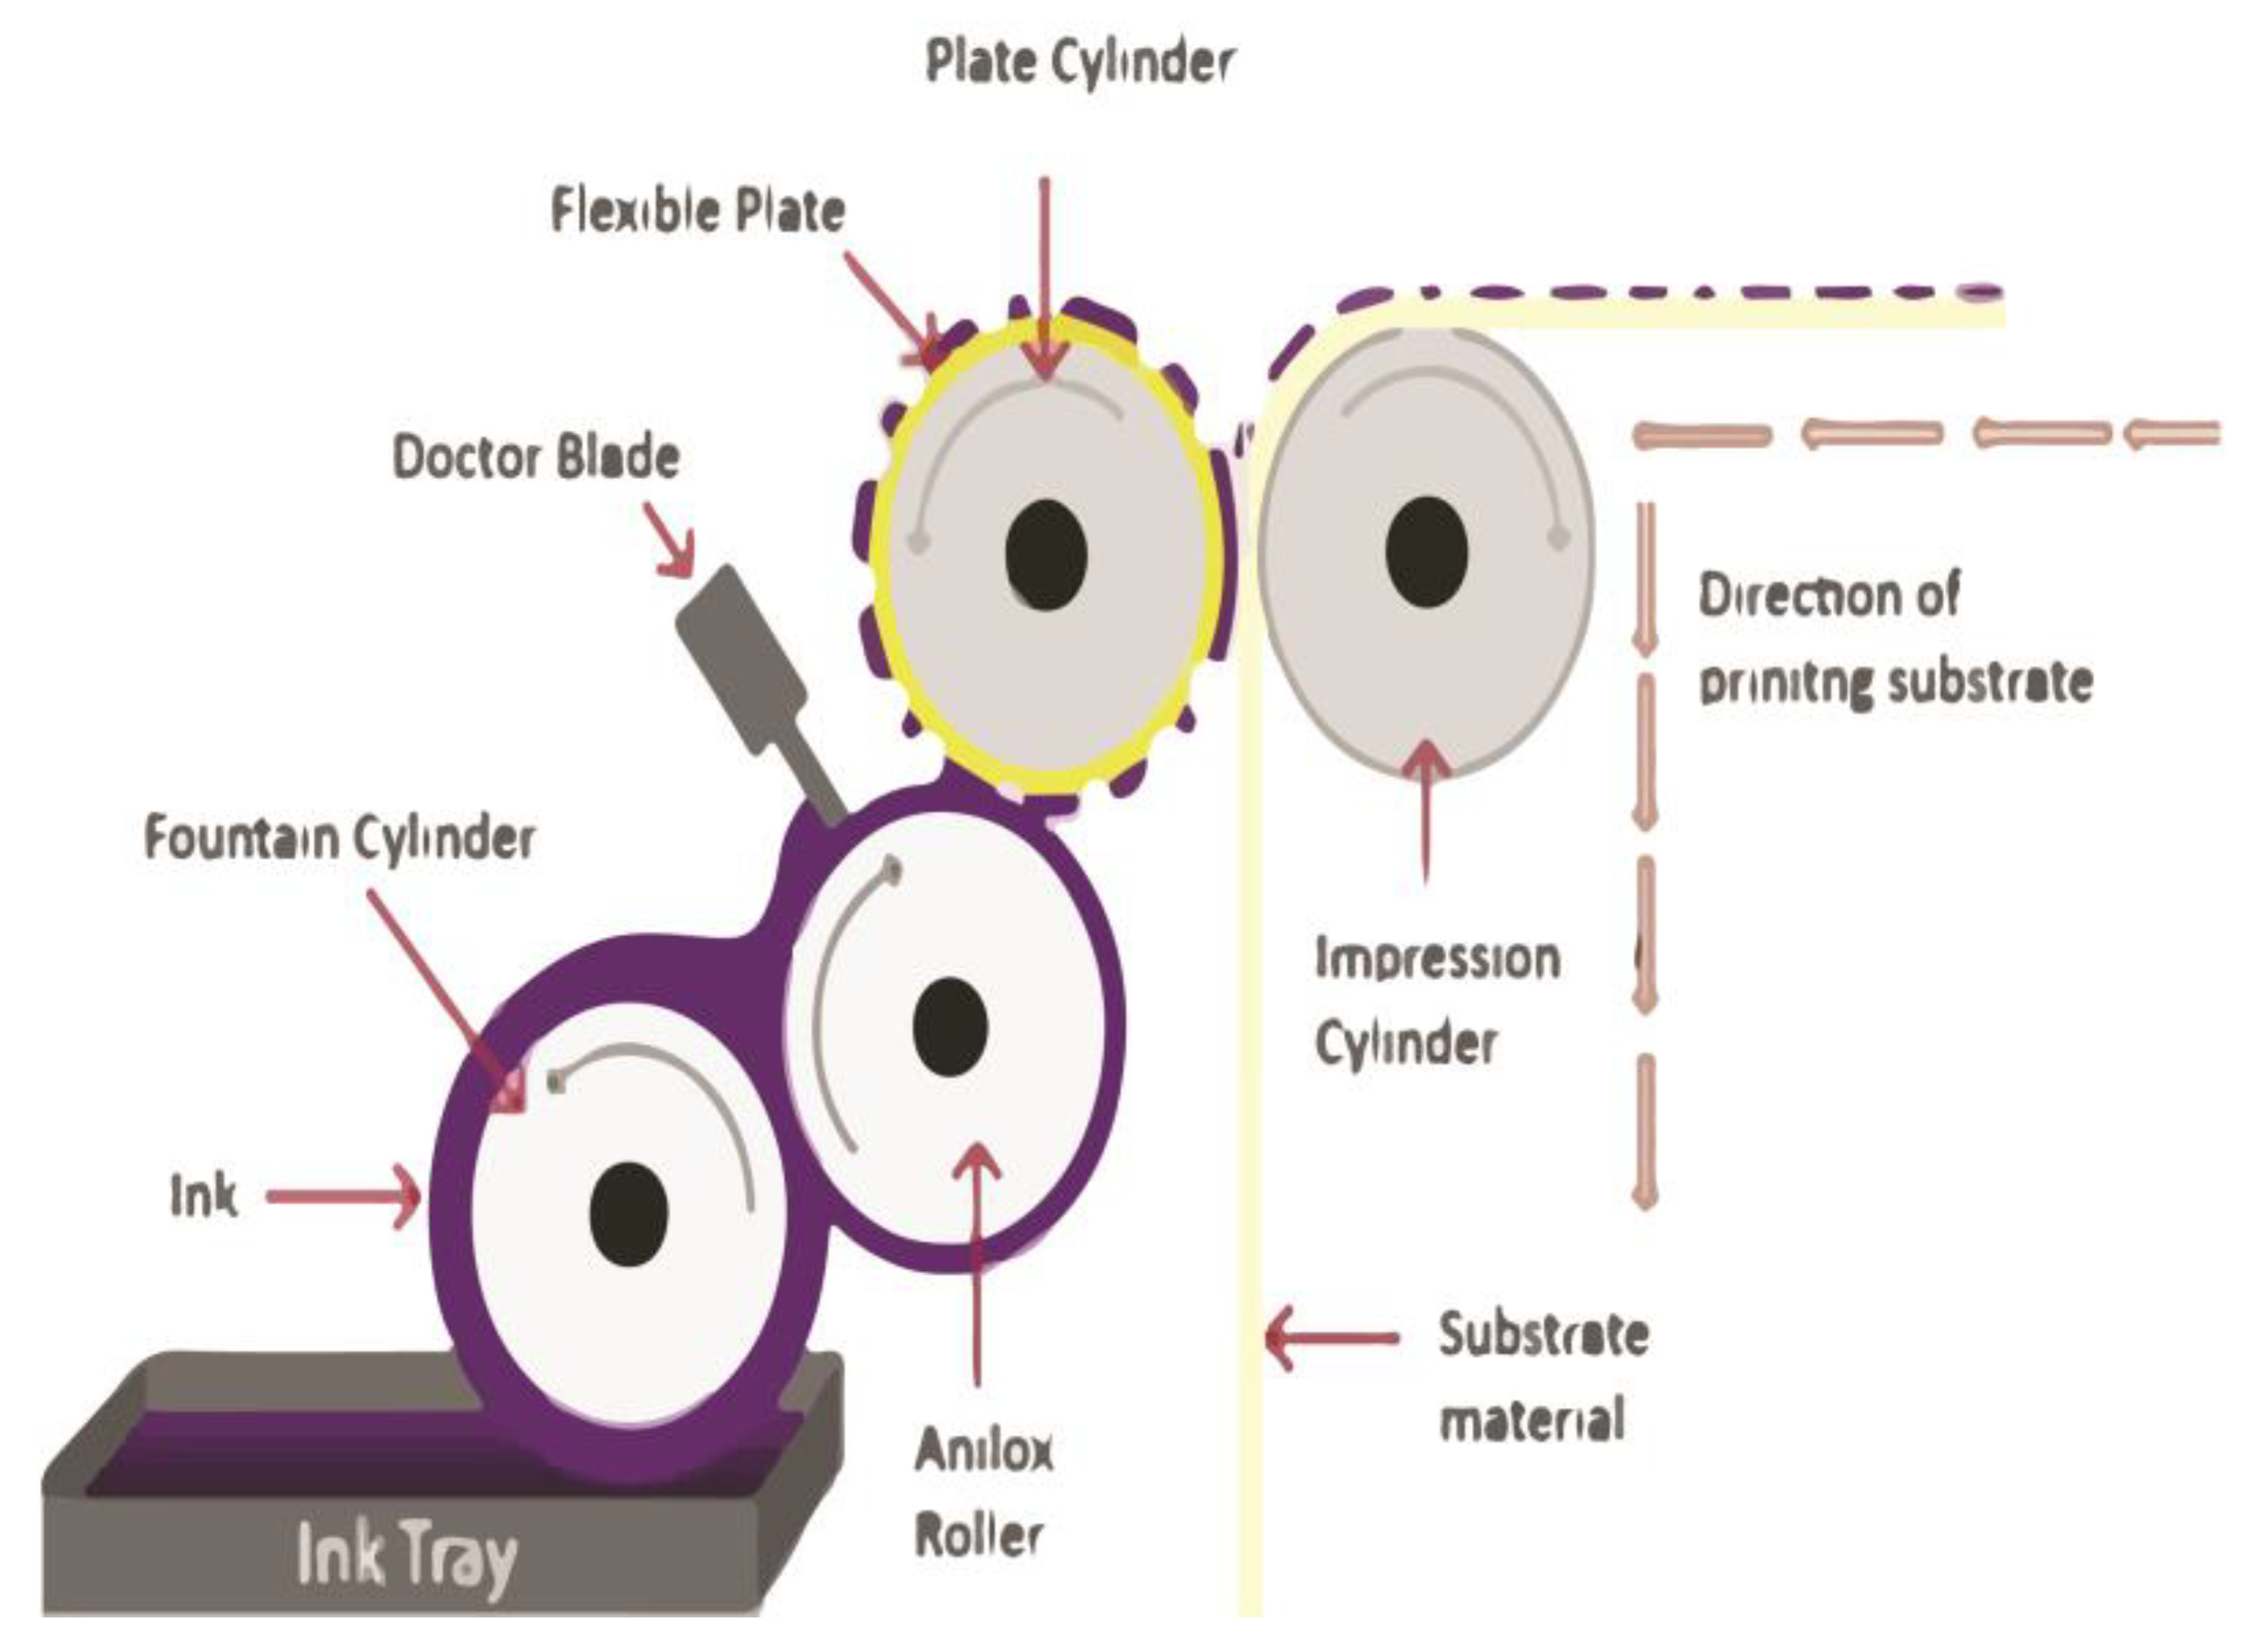
  • The substrate, such as paper, plastic, or metal, is loaded onto the unwinder and fed into the press;
  • The substrate is then passed through the print unit, where it meets the print cylinder, which carries the image to be printed;
  • Ink is transferred from the ink pan to the anilox roller, which in turn transfers the ink to the print cylinder;
  • The impression roller applies pressure to the substrate, ensuring that the ink is transferred from the print cylinder to the substrate;
  • The substrate is then passed through a drying system, which dries the ink on the substrate;
  • The substrate is then rewound onto the rewinder, and the process is repeated as needed to achieve the desired print quality and quantity;
  • The print is inspected for quality and, if needed, adjustments are made to the press to ensure the quality of the print;
  • Finally, the printed substrate is packaged and shipped to the customer.
Figure 1. Schematic of flexographic printing process.
Energies 16 01972 g001
To attain the goals of the research, a case study was conducted using two flexographic printing machines selected from a well-known packaging company in Pakistan. Each flexographic printing equipment belonged to the same type, i.e., common impression cylinder. Table 1 contains a list of both machine’s technical specifications.
The direct method of data collection [34] was employed to gain a thorough understanding of a printing operation. Through careful examination, information regarding process anomalies was gathered and used to pinpoint problem areas that led to excessive energy consumption. This data was then utilized to improve the process. To further investigate the root causes of the problem areas identified through the direct method, semi-structured interviews were conducted with the production manager, supervisor, and operators. The respondents were asked about the issues and causes related to process losses that led to high energy consumption and to also provide suggestions for ways to improve the process. This feedback was used to design Kaizen routines to eliminate these losses. Additionally, to raise awareness and improve the process, the company also held workshops and discussions on lean principles. After reviewing the data collected, it was identified that the main contributors to energy consumption were long periods of machine idle time and poor job assignment. These two issues had a direct impact on energy use. The idle was calculated and recorded with the help of a stopwatch. To measure energy consumption, the company installed Power Monitoring Expert (PME) on both of the printing machines. EcoStruxure PME is a software solution developed by Schneider Electric (USA) that is used to monitor and analyze the performance of electrical power systems. It is a comprehensive, scalable, and modular system and was tailored to the specific needs of the selected industry. The software recorded real-time energy data and updated it in the system after 15 s.
To improve the process and reduce energy consumption, a lean methodology was applied. This lean methodology included measuring the energy usage of the flexographic printing machines on an hourly basis during production. Then, the areas of the process that were using an excessive amount of energy were identified as “hot spots”. After identifying the problem areas, a 5Why analysis was performed to determine the root causes of these issues. This analysis helped to pinpoint the exact causes of the problems. In the next step, a work plan for improvement was proposed using Kaizen, which is a method for continuous improvement by making small, incremental changes and sustaining them over time by involving everyone in the organization. The lean approach is a simple and cost-effective method to increase energy efficiency and improve the productivity of the process. The subsequent step was to successfully implement the work plan. A dedicated departmental-functional team was created to ensure the Kaizen practices were carried out during the implementation phase, and the team worked closely with the existing quality circle in the company within a two-month time period. After the improvements were made, energy consumption was re-measured. To further optimize energy consumption, finally, a machine learning linear regression model was developed using Python and it was trained on historical data. The model took into account various input process parameters that have a direct effect on energy consumption, as listed in Table 2.
To ensure the accuracy of the model, it was validated using confirmatory runs. The model was then used to suggest job assignments to both machines based on production order requirements. The methodology followed during the case study is illustrated in a flow diagram in Figure 2.

3. Results and Discussion

In this study, two flexographic printing machines used in the production of tissue paper packaging were selected from a Business-Unit flexible line. These machines, Miraflex machine (22140) and the F&K machine (22120), were monitored through the use of PME (Power Monitoring Equipment) at various key locations within the machine. This online tool provided a comprehensive analysis of the energy consumption of the machines. The energy data collected were analyzed to determine the relationship between energy consumption and input parameters, such as the number of produced meters and machine idle time (idle time = waiting time + setting time + job changeover time + delay + machine warm-up). The machine speed and substrate type were kept constant throughout the study. The data was collected for eleven months, but, for demonstration purposes, few selected values from the available data were plotted, as shown in Figure 3a–d.
The graph of energy consumption for the Miraflex printing machine (Figure 3a) shows a decrease in energy consumption per unit of output as production increases. However, there are variations in the form of spikes in the graph, which may occur during the initial phase of the production process. These variations can be caused by machine idle time or adjustments in machine settings. As the production process continues, energy consumption per unit of output decreases and the spikes in the graph may become less pronounced. To optimize energy efficiency in flexographic printing, it is important to minimize idle time by regularly maintaining and calibrating the machine. Moreover, use of energy-efficient equipment such as LED-UV curing systems can reduce the energy consumption. Contrary to the previous graph (Figure 3a), it is observed that as idle time increases, energy consumption per hour linearly increases, as shown in Figure 3b. This is because, during idle time, some parts of the machine such as motors, pumps, and other mechanical and electrical systems are still running and consuming electricity, even though the machine is not actively producing. However, it should be noted that energy consumption per meter may spike at certain points on the graph, which indicates that there was more or less idle time for that particular job.
The trend observed in the F&K printing machine is similar to that of the Miraflex machine, as shown in Figure 3c,d. As the production output of a flexographic printing machine increases, the energy consumption per meter of printed material decreases. This is due to the machine becoming more efficient in its printing process as it continuously runs without stoppages, thus reducing idle time. It is worth noting that while the highest energy consumption is recorded for the Miraflex machine (0.055 kwh), both machines consumed the same amount of energy per meter (0.01 kwh) for the same produced meters (10,000 m). Additionally, Figure 3b,d shows that Miraflex used 1300 kwh against 310 h of idle time, while F&K used 410 kwh against the same hours of idle time. The high speed of Miraflex (See Table 1) may be a possible cause for the higher energy consumption [14]. Despite the lower energy consumption, the F&K machine experienced more idle time.
An in-depth examination of the data for both machines was conducted, which led to the discovery of areas in the machines which were causing excessive energy consumption. These areas were primarily responsible for the machine’s idle time. The “hot areas” identified in this analysis are summarized in Table 3.
Problems encountered on the production floor were found to be closely associated with idle time. As idle time increases, the machine consumes more energy before it continues production. To improve energy efficiency over the long term, it is important to minimize idle time as much as possible.
To address the impact of idle time on energy consumption, a 5Why analysis was conducted to identify the root cause of the issue, as shown in Figure 4a–d. In this study, the asking of a “why” question was stopped after the third or fourth time because the root cause was clearly identified. Research also supports this approach [30,35], stating that there is no need to ask the “why” question any further if the root cause has been identified earlier. The results obtained from the 5Why analysis are provided in Table 4.
To eliminate the issues that caused machine idle time, an action plan for improvements is proposed in the following section.

3.1. Suggested Action Plan

After identifying the root causes of the problem areas, a number of improvement strategies were proposed to decrease the machine idle time. The Kaizen approach was used to create an action plan for the comprehensive implementation of these improvements. The specific interventions suggested by Kaizen are outlined as follows:
  • Waiting time: To reduce the waiting time for materials, it was suggested to have effective procurement planning. Additionally, to reduce machine downtime, it was proposed to assign energy-efficient and energy-intensive jobs to machines in an efficient manner. Keeping continuous data was also recommended to avoid any delays in the future. To maintain the cleanliness of the machines, it was suggested to develop standard operating procedures (SOPs) and to provide proper training to the workforce. It was also advised to have a checklist of SOPs that should be reported to the head of the production department;
  • Setting time: The 5Why analysis revealed that by standardizing the process, waiting time for installing the photopolymer plate could be reduced. To ensure that the equipment is correctly placed, it was suggested to have a quality check inspector on the shop floor and to include this in the preventive maintenance plan. Additionally, it was proposed that effective time management planning can be used to eliminate waiting time for reel change. To do this, providing continuous training to the workforce was suggested;
  • Job changeover time: To minimize waiting time during job changeovers, it was proposed to ensure easy availability of raw material, ink, and a workforce by incorporating it into job planning. Furthermore, it was recommended to have regular monitoring of the work floor situation to ensure smooth functioning;
  • Color matching issue: To prevent delays caused by color matching problems, it was recommended to keep a checklist to standardize data for color/shade matching. This will be beneficial for future jobs.

3.2. Implementation of Action Plan

After implementing all of the suggested Kaizen improvements, energy usage data was collected for both printing machines under the same production rate and machine idle time. The data was then plotted and analyzed to track the progress made as a result of applying lean methodology, as shown in Figure 5a–d.
Figure 5a–d illustrates the decrease in energy consumption for both machines. However, the graphical trend is similar to that shown in Figure 3a–d. A similar percentage of reduction in idle time can be observed for both machines (30%) from Figure 5c,d. Furthermore, a 34.198% energy saving per meter and 38.635% energy saving per meter were achieved for the Miraflex machine (22140) and F&K machine (22120), respectively, as shown in Figure 5a,c. The reduction in machine idle time is proof of the effectiveness of the proposed combined lean approach. It also demonstrates that the lean methodology is efficient in identifying specific areas for energy improvement in the flexographic printing process. This method is supported by previous studies, such as the one conducted by Zahoor et al. [30] and Benjamin et al. [36], which found that 5Why analysis is a useful tool in identifying the primary cause of issues and reducing defects in the Toyota production system. The improvement in idle time also demonstrates that Kaizen not only achieved its goals for idle time, but also set a path for sustainable continuous improvement. This is supported by multiple studies such as by Nguyen [37], by Zahoor et al. [30], by Rahmanian and Rahmatinejad [38], and by Jamian et al. [39]. For example, Rahmanian and Rahmatinejad [38] stated that manufacturing companies can use the Kaizen approach for growth and survival.

3.3. Optimization of Flexographic Printing Process Based on Regression Modeling Using Machine Learning

A linear regression model utilizing machine learning techniques was employed to optimize the performance of flexographic printing machines. This could result in a more precise and consistent printing process, as well as cost and energy savings. The general mathematical representation of the multi-linear regression model is represented by Equation (1) [40].
y = b0 + b1 × 1 + b2 × 2………+ bkx
where, y is the response parameter and b0 is a constant when all predictor parameters are zero. The variables x1, x2, …xk represent the predictor input parameters and b1, b2, …bk represent the estimated change in the response parameter for a one-unit increase in each corresponding input parameter value. An advanced machine learning program was developed to optimize the energy consumption of flexographic printing machines [41]. It considers various input parameters such as machine speed, production meter, substrate type, substrate density, machine idle time, and total run time, as per Table 2. The program uses this data to predict energy consumption and adjust it for maximum efficiency. The program was developed and trained using available data for input and output printing parameters and a linear regression model in Python editor (version: 3.11.1, Notebook-6.5.2 IDE). Different Python libraries such as Matplotlib, NumPy, and Pandas [42,43,44], were utilized in the development of the model. To evaluate the accuracy of the data, random values were used as test inputs and the model’s output was compared to ensure it was working as expected. The model was designed to be versatile and can be applied to different flexographic machines by inputting different parameters and substrate specifications. However, having more data in the database could improve the model’s performance in predicting results. The testing showed that the model was performing well. Equation (2) represents the regression model that was developed to predict energy consumption.
Energy consumption = (kwh) b0 + b1 * total machine run time (h) + b2 * produced meter/h (m) + b3 * machine speed (m/h) + b4 * machine working time (h) + b5 * machine setting time (h) + b6 * job changeover time(h) + b7 * machine waiting time (h) + b8 * substrate density (g/cm3)(2)
Energy consumption = (kwh)b0 + b1 * T1 + b2 * M + b3 * V + b4 * T2 + b5 * T3 + b6 * T4 + b7 * T5 + b8 * ρ
Energy consumption = (kwh)1366.2234041595507 + (−1.83712203 × 10² * T1) + (−3.73654160 × 10⁻³ * M) + (0 * V) + (9.88985623 * T2) + (0 * T3) + (3.01566005 × 10² * T4) + (2.85659549 × 10² * T5) + (0.00000000e + 00 * ρ)
To demonstrate the model’s capabilities, predictions for random values were made using the regression model in Equation (2). The results of these predictions are presented in Table 5. From Equation (2), it appears that the parameters of machine speed (V) and job changeover time (T3) have no effect on energy consumption, since the values of these parameters become very small after being converted from seconds to hours for standardization purposes. Additionally, the machine learning model has a high level of precision, reaching eight decimal places, so the values for machine speed and job changeover time have a negligible impact on the equation. While the precision of the model is high, it does not necessarily mean that the impact of these parameters is truly insignificant.

3.4. Model Validation

To verify the accuracy of the model, a random data value for Miraflex (22140) was selected from Table 5 and used to perform a confirmatory test. As shown in Table 6, the confirmatory test value for energy consumption was in excellent agreement with the predicted value with minimal error, which demonstrates the model’s effectiveness.

3.5. Job Scheduling

One of the key advantages of using a machine-learning-based model for the energy optimization of flexographic printing machines is the ability to assign jobs to specific machines based on their energy consumption. The model can predict the energy consumption for a specific job on a specific machine, allowing for the optimization of energy usage. This can be achieved by assigning jobs to the machine with the lowest predicted energy consumption, or by adjusting the input parameters of a specific machine to reduce its energy consumption for a particular job. By assigning jobs in this way, it is possible to reduce overall energy consumption and costs while maintaining or even improving the quality of the printed output.
Additionally, this approach can also help in reducing the carbon footprint of the manufacturing process and help companies to meet sustainability goals. Moreover, it can also help to increase the production efficiency and reduce the downtime of the machines. Overall, job assignment based on energy consumption prediction can bring significant benefits to the companies in terms of cost savings and operational efficiency.

4. Conclusions

The research undertaken in this study used two flexographic printing machines (Miraflex 22140 and F&K 22120) employed by a reputable packaging company in Pakistan as a case study to analyze the opportunities for energy optimization through the application of lean techniques, such as 5Why root cause analysis and Kaizen. The study aimed to develop a regression model using machine learning techniques that predicts energy consumption, accordingly adjusts the printing process, and optimizes the scheduling of jobs to minimize the energy usage. The research results, analysis, and discussion have led to the following conclusions:
  • The study demonstrated that the lean methodology employed during the research was efficient in identifying the specific hot areas for energy improvement in the flexographic printing process. After implementing the lean action plan, a similar percentage of reduction in idle time was observed for both machines (30%). The reduction in machine idle time was proof of the effectiveness of the proposed combined lean approach;
  • Correspondingly, 34.198% energy saving per meter and 38.635% energy saving per meter were achieved for the Miraflex machine (22140) and F&K machine (22120), respectively, due to the reduced idle time;
  • The developed multi-linear regression model using machine learning technique optimized the energy consumption of flexographic printing machines; by considering a variety of input parameters, including machine speed, production meter, substrate density, machine idle time (setting time, changeover time, and waiting time), machine working time, and total run time. The results of the confirmatory test showed that the model was efficient and accurate, and could be used to predict the energy consumption for different substrate materials for both of the machines.
  • The model could also be used to assign jobs to both the machines based on their predicted energy consumption, leading to a further reduction in energy consumption and costs while maintaining or even improving the quality of the printed output. Additionally, this approach could also help in reducing the carbon footprint of the manufacturing process and help companies to meet sustainability goals.
As a future recommendation, the study suggests that the company should consider alternative inking options that are more eco-friendly and have reduced CO2 emissions compared to their current solvent-based inks. Additionally, the study suggests replacing hot air jet dryers with UV-based curing options. UV curing units use less energy and have less respiratory health risks than solvent-based inks, making the working environment safer. It is recommended that the company should investigate these options to further improve energy efficiency and safety in their flexographic printing process.

Author Contributions

Conceptualization, S.Z. and Z.A. and M.K.; Data acquisition, S.Z. and M.S.H.; Methodology, S.Z., Z.A., M.R. and M.K.; Analysis, S.Z., J.M. and R.T.M.; Modelling, S.Z., Z.A. and M.S.H.; Validation, M.K.; Writing—original draft, S.Z., Z.A. and M.S.H.; Writing—review and editing, M.R., J.M., M.K. and R.T.M. All the authors have read and agreed to the published version of the manuscript. All authors have read and agreed to the published version of the manuscript.

Funding

The research received no external funding.

Data Availability Statement

It will be available on request.

Conflicts of Interest

The authors declare no conflict of interest.

References

  1. International Energy Agency. World Energy Outlook 2019; International Energy Agency: Paris, France, 2019. [Google Scholar]
  2. Habib, M.S.; Tayyab, M.; Zahoor, S.; Sarkar, B. Management of animal fat-based biodiesel supply chain under the paradigm of sustainability. Energy Convers. Manag. 2020, 225, 113345. [Google Scholar] [CrossRef]
  3. Kanan, M.; Habib, M.S.; Shahbaz, A.; Hussain, A.; Habib, T.; Raza, H.; Abusaq, Z.; Assaf, R. A Grey-Fuzzy Programming Approach towards Socio-Economic Optimization of Second-Generation Biodiesel Supply Chains. Sustainability 2022, 14, 10169. [Google Scholar] [CrossRef]
  4. U.S. Department of Energy. Energy Efficiency in Manufacturing 2019; U.S. Department of Energy: Washington, DC, USA, 2019.
  5. European Commission. Energy Efficiency in Manufacturing; European Commission: Brussels, Belgium, 2020.
  6. ISO 50001:2018; Energy Management Systems—Requirements with Guidance for Use. International Organization for Standardization: Geneva, Switzerland, 2018.
  7. Government of Canada. Energy Management and Audits. In Natural Resources Canada 2021; Government of Canada: Ottawa, ON, Canada, 2021. [Google Scholar]
  8. Boyd, G.A. Assessing Improvement in the Energy Efficiency of U.S. Auto Assembly Plants. In Duke Environmental Economics 2010, Working Paper EE10-01; Duke University: Durham, NC, USA, 2010. [Google Scholar]
  9. Cresko, J. Bandwidth Study on Energy Use and Potential Energy Savings Opportunities in U.S. Plastics and Rubber Manufacturing; Office of Energy Efficiency and Renewable Energy: Washington, DC, USA, 2017.
  10. Kumar, S.; Kaiwartya, O.; Rathee, M.; Kumar, N.; Lloret, J. Toward Energy-Oriented Optimization for Green Communication in Sensor Enabled IoT Environments. IEEE Syst. J. 2020, 14, 4663–4673. [Google Scholar] [CrossRef]
  11. Dev, K.; Maddikunta, P.K.R.; Gadekallu, T.R.; Bhattacharya, S.; Hegde, P.; Sing, S. Energy Optimization for Green Communication in IoT Using Harris Hawks Optimization. IEEE Trans. Green Commun. Netw. 2022, 6, 685–694. [Google Scholar] [CrossRef]
  12. Margolis, N.G.; Pellegrino, J.L. Energy Efficiency in the Printing and Publishing Industries; Energetics Incorporated: Columbia, MD, USA, 1995; pp. 237–248. [Google Scholar]
  13. Neugebauer, R.; Putz, M.; Keller, C.; Fälsch, S. Reducing Energy Demands of Printing Machines by Energy Reuse Options and Optimization. In Leveraging Technology for a Sustainable World, Proceedings of the 19th CIRP Conference on Life Cycle Engineering, University of California, Berkeley, CA, USA, 23–25 May 2012; Dornfeld, D., Linke, B., Eds.; Springer: Berlin/Heidelberg, Germany, 2012; pp. 107–112. [Google Scholar]
  14. Flexographic Technical Association, Smithers Pira. The Future of Flexographic Printing to 2023. Available online: https://www.flexography.org/industry-news/smithers-pira-future-flexographic-printing-2023-report (accessed on 22 January 2023).
  15. Mordor Intelligence Report. Flexible Plastic Packaging Market by Type (Pouches, Rollstocks, Bags, Wraps), Material (Plastic & Aluminum Foil), Application (Food, Beverage, Pharma & Healthcare, Personal care & Cosmetics), Technology, and Region—Global Forecast to 2025. Available online: https://www.marketsandmarkets.com/MarketReports/flexible-packaging-market-1271.html (accessed on 22 January 2023).
  16. Joshi, A.V. Optimization of Flexo Process Parameters to Reduce the Overall Manufacturing Cost. Int. J. Optim. Control Theor. Appl. 2022, 12, 66–78. [Google Scholar] [CrossRef]
  17. Zion Market Research. Pakistan Toilet Tissue Market—Industry Analysis, Size, Share, Growth, Trends, and Forecast 2019–2025; Zion Market Research: Pune, India, 2019. [Google Scholar]
  18. Research and Markets. Pakistan Toilet Tissue Market—Growth, Trends, and Forecast (2019–2024); Research and Markets: Dublin, Ireland, 2019. [Google Scholar]
  19. Tomasegovic, T.; Pibernik, J.; Poljacek, S.; Madžar, A.M. Optimization of Flexographic Print Properties on Ecologically Favorable Paper Substrates. J. Graph. Eng. Des. 2021, 12, 37–44. [Google Scholar] [CrossRef]
  20. Żołek-Tryznowska, Z.; Rombel, M.; Petriaszeili, G.; Dedijer, S.; Kašiković, N. Influence of Some Flexographic Printing Process Conditions on the Optical Density and Tonal Value Increase of Overprinted Plastic Films. Coatings 2020, 10, 816. [Google Scholar] [CrossRef]
  21. Valdec, D.; Zjakić, I.; Milković, M. The Influence of Variable Parameters of Flexographic Printing on Dot Geometry of Pre-Printed Printing Substrate. Teh. Vjesn. 2013, 20, 659–667. [Google Scholar]
  22. Keawkul, P.; Pachonklaew, P.; Waleetorncheepsawat, B. Optimization of Printing Conditions to Achieve Effective Ink Transfer in Flexographic Printing. J. Print. Sci. Technol. 2022, 59, 298–302. [Google Scholar]
  23. Tomašegović, T.; Mahović Poljaček, S.; Strižić Jakovljević, M.; Urbas, R. Effect of the Common Solvents on UV-Modified Photopolymer and EPDM Flexographic Printing Plates and Printed Ink Films. Coatings 2020, 10, 136. [Google Scholar] [CrossRef]
  24. Poljaček, S.M.; Tomašegović, T.; Leskovac, M.; Jakovljević, S. Neural Network-Based UV Adjustment of The Photopolymer Surface for Modification of Coating Properties Printed in Flexography. JCTR 2020, 17, 271–284. [Google Scholar] [CrossRef]
  25. Faddoul, R.; Reverdy-Bruas, N.; Blayo, A.; Haas, T.; Zeilmann, C. Optimisation of Silver Paste for Flexography Printing on LTCC Substrate. Microelectron. Reliab. 2012, 52, 1483–1491. [Google Scholar] [CrossRef]
  26. Azizi, A.; Manoharam, T. Designing of Future Value Stream Mapping to Reduce Lead Time Using SMED—A Case Study. In Procedia Manufacturing, Proceedings of the 2nd International Materials, Industrial, and Manufacturing Engineering Conference, Bali, Indonesia, 4–6 February 2015; Kurniawan, D., Nor, F.M., Eds.; Elsevier BV: Amsterdam, The Netherlands; Volume 2, pp. 153–158.
  27. Batra, R.; Nanda, S.; Singhal, S.; Singari, R. Study of Lean Production System Using Value Stream Mapping in Manufacturing Sector and Subsequent Implementation in Tool Room; SAE Technical Paper 2016-01-0342; SAE: Warrendale, PA, USA, 2016. [Google Scholar]
  28. Li, W.; Thiede, S.; Kara, S.; Herrmann, C. A Generic Sanky Tool for Evaluating Energy Value Stream in Manufacturing Systems. In Procedia CIRP, Proceedings of the 24th CIRP Conference on Life Cycle Engineering, Kamakura, Japan, 8–10 March 2017; Takata, S., Umeda, Y., Kondoh, S., Eds.; Elsevier BV: Amsterdam, The Netherlands, 2017; Volume 61, pp. 475–480. [Google Scholar]
  29. Rishi, J.P.; Srinivas, T.R.; Ramachandra, C.G.; Ashok, B.C. Implementing the Lean Framework in a Small & Medium & Enterprise (SME)—A Case Study in Printing Press. IOP Conf. Ser. Mater. Sci. Eng. 2018, 376, 012126. [Google Scholar]
  30. Zahoor, S.; Shehzad, A.; Mufti, N.; Zahoor, Z.; Saeed, U. Overall Equipment Efficiency of Flexographic Printing Process: A Case Study. In IOP Conference Series: Materials Science and Engineering, Proceedings of the 4th International Conference on Mechanical, Materials and Manufacturing (ICMMM 2017), Atlanta, GA, USA, 25–27 October 2017; IOP Science: Bristol, UK, 2017; Volume 272, p. 012015. [Google Scholar]
  31. Zahoor, S.; Abdul-Kader, W.; Ijaz, H.; Khan, A.Q.; Saeed, Z.; Muzaffar, S. A Combined VSM and Kaizen Approach for Sustainable Continuous Process Improvement. Int. J. Ind. Eng. Oper. Manag. 2019, 1, 125–137. [Google Scholar] [CrossRef]
  32. Lipiak, J. Methodology for Assessing the Factors Affecting the Quality and Efficiency of Flexographic Printing Process. In Procedia Engineering, Proceedings of the 7th International Conference on Engineering Project and Production Management, Białystok, Poland 21–23 September 2016; Halicka, K., Nazarko, L., Eds.; Elsevier: Amsterdam, The Netherlands, 2017; Volume 182, pp. 403–411. [Google Scholar]
  33. Al Habis, N.; Khushaim, M.; Nabat Al-Ajrash, S.M. Energy Harvesting and Storage Devices through Intelligent Flexographic Technology: A Review Article. Energies 2023, 16, 869. [Google Scholar] [CrossRef]
  34. Dadashnejad, A.; Valmohammadi, C. Investigating the effect of value stream mapping on overall effectiveness: A case study. Total Qual. Manag. Bus. Excell. 2019, 30, 466–482. [Google Scholar] [CrossRef]
  35. Alukal, G. Lean kaizen in the 21st century. Qual. Prog. 2007, 40, 69–70. [Google Scholar]
  36. Benjamin, S.; Marathamuthu, M.S.; Muthaiyah, S. Scrap loss reduction using 5-whys analysis. Int. J. Qual. Reliab. Manag. 2010, 27, 527–540. [Google Scholar]
  37. Nguyen, T.L. STEAM-ME: A Novel Model for Successful Kaizen Implementation and Sustainable Performance of SMEs in Vietnam. J. Hindawi 2019, 2019, 6048195. [Google Scholar] [CrossRef]
  38. Rahmanian, F.; Rahmatinejad, Z. Impact of Kaizen Implementation on Performance of Manufacturing Companies’ Staff. Eur. Online J. Nat. Soc. Sci. 2013, 2, 1094–1103. [Google Scholar]
  39. Jamian, R.; Rahman, M.N.A.; Deros, B.M.; Ismail, N.Z.N. A conceptual model towards sustainable management system based upon 5S practice for manufacturing SMES. Asia Pac. J. Oper. Manag. 2012, 1, 19–31. [Google Scholar]
  40. Zahoor, S.; Mufti, N.A.; Saleem, M.Q.; Shehzad, A. An Investigation into Surface Integrity of AISI P20 Machined Under the Influence of Spindle Forced Vibration. Int. J. Adv. Manuf. Technol. 2017, 96, 3565–3574. [Google Scholar] [CrossRef]
  41. Bushehri, F.; Mohammad Mehdi, S.; Khavari, D.; Hossein, S.; Meybodi, B.; Zarchi, S. Energy Consumption Prediction in Iran: A Hybrid Machine Learning and Genetic Algorithm Method with Sustainable Development Considerations. Environ. Energy Econ. Res. 2022, 6, S034. [Google Scholar]
  42. Sian, A.; Abdolalizadeh, L.; Mako, C.; Torok, B.; Amir, M.; Mosavi, A. Systematic Review of Deep Learning and Machine Learning for Building Energy. Front. Energy Res. 2022, 10, 786027. [Google Scholar] [CrossRef]
  43. Shin, S.Y.; Woo, H.G. Energy Consumption Forecasting in Korea Using Machine Learning Algorithms. Energies 2022, 15, 4880. [Google Scholar] [CrossRef]
  44. Guo, H.; Duan, D.; Yan, J.; Ding, K.; Xiang, F.; Peng, R. Machine Learning-Based Method for Detached Energy-Saving Residential Form Generation. Buildings 2022, 12, 1504. [Google Scholar] [CrossRef]
Figure 2. Flow diagram of the methodology used to optimize the energy consumption of flexographic printing process.
Energies 16 01972 g002
Figure 3. Graphical plots for Miraflex printing machine (a) energy consumed vs. produced meter, (b) energy consumed vs. idle time, for F&K printing machine (c) energy consumed vs. produced meter, (d) energy consumed vs. idle time.
Energies 16 01972 g003aEnergies 16 01972 g003b
Figure 4. 5Why analysis (a) for waiting time, (b) for setting time, (c) for job changeover time, (d) for delay time for color matching.
Energies 16 01972 g004aEnergies 16 01972 g004b
Figure 5. Graphical plots for Miraflex printing machine after implementation of lean action plan (a) energy consumed vs. produced meter, (b) energy consumed vs. idle time, for F&K printing machine (c) energy consumed vs. produced meter, (d) energy consumed vs. idle time.
Energies 16 01972 g005
Table 1. Technical specifications of flexographic machines.
MachineRaw MaterialSpeed
(m/min)
Press TypeColor StationsDrying TypeTotal Run Time
(Hours/Day)
Miraflex machine (22140)PP, Polyester, PET, MOPP, Oil film, WOPE400–500Common impression cylinder8Hot air chamber through electrical oil heaters24
F&K machine (22120)PP, Polyester, PET, MOPP, WOPE250–320Common impression cylinder8Hot air chamber through electrical oil heaters24
Table 2. Details of input process parameters.
Input ParameterUnitSymbol
Variable parameter
Machine production rateProduced meter/hourM
Total machine run timeHourT1
Machine working timeHourT2
Machine Idle time
Machine setting timeHourT3
Job changeover timeHourT3
Machine waiting timeHourT5
Constant parameter
Machine speedmeter/hourV
Substrate densityg/cm3ρ
Table 3. Summary of hot areas adding to the machine idle time.
Hot AreasContribution to the Machine Idle Time
Waiting time
Time for job/material15%
Time for cleaning the machine12%
Setting time
Time for installation of new photopolymer plate8%
Time for reel change5%
Time for job changeover15%
Time delay for color matching7%
Table 4. Summary of 5Why analysis results.
Hot AreaRoot Cause and Effect
Waiting time
Time for job/materialRoot cause: inappropriate procurement planning
Effect: increase in the idle time due to waiting time for job or material
Time for cleaning the machineRoot cause: pressure variation from source supply
Effect: increase in the idle time due to waiting time for cleaning the machine
Setting time
Time for installation of new photopolymer plateRoot cause: misalignment problem during installation
Effect: increase in the idle time due to waiting for real change
Time for reel changeRoot cause: uneven scheduling of reel change
Effect: increase in the idle time due to waiting for photopolymer plate
Time for job changeoverRoot cause: lack of communication of ink department
Effect: increase the idle time due to job changeover
Time delay for color matchingRoot cause: improper fitting issue due to compact space
Effect: increase in the idle time due to waiting for color matching
Table 5. Predicted values of energy consumed using regression model.
Machine
No.
M
(m)
T1
(h)
V
(m/h)
T2
(h)
T3
(h)
T4
(h)
T5
(h)
Ρ
(g/cm3)
Energy Consumed
(kwh)
2214018006.165.50.4500.030.151.4284.1756
2214018006.30610.150.080.1201.4270.4038
2214018006.467.50.250.130.1251.41.4259.0011
221401800781.300.350.180.1301.4177.7854
22140180078.51.450.450.230.1351.4170.0558
Bold: Selected for validation.
Table 6. Confirmatory test results.
Data ValueMachine
No.
M
(m)
T1
(h)
V
(m/h)
T2
(h)
T3
(h)
T4
(h)
T5
(h)
Ρ
(g/cm3)
Energy Consumed
(kwh)
Predicted2214018006.467.50.250.130.1251.41.4259.0011
Recorded2214018006.467.51.150.250.130.1251.4259.0000
Disclaimer/Publisher’s Note: The statements, opinions and data contained in all publications are solely those of the individual author(s) and contributor(s) and not of MDPI and/or the editor(s). MDPI and/or the editor(s) disclaim responsibility for any injury to people or property resulting from any ideas, methods, instructions or products referred to in the content.

