Abstract
The current study addresses the impact of the addition of fullerene and graphene nanoparticles on the AC breakdown voltage (AC BdV) of natural ester (FR3). The nanofluids (NFs) were prepared following the two-step process, and the AC BdV was performed in compliance with IEC 60156 standards. Five different concentrations of NPs were considered (0.1 g/L, 0.2 g/L, 0.3 g/L, 0.4 g/L, and 0.5 g/L). A Student’s t-test was performed to compare the base liquid’s AC BdV data with different nanofluids. The experimental data were checked to see if they obeyed the Weibull distribution fitting curve, and the AC BdV at 1%, 10%, and 50% risk levels were then calculated. The performed t-test provides evidence that AC BdV data from the base liquid were different from those of different NFs (except 0.2 g/L fullerene, and 0.1 g/L and 0.4 g/L graphene NFs). It is also shown that the Weibull distribution fit the BdV data of all liquids (except 0.5 g/L fullerene NF), and remarkable improvements of AC BdVs at 1%, 10%, and 50% were observed. The best improvement was obtained with 0.4 g/L fullerene and 0.3 g/L graphene NFs. These results show the importance of using nanofluids as substitutes for the existing insulating liquids for current oil-filled power transformers.
1. Introduction
Electrical power transformers (PT) often use dielectric fluids for heat dissipation and electrical insulation [1]. The role of these fluids is crucial for adequately operating this type of equipment, which depends, among other things, on the health of the insulating fluids they contain [1]. Therefore, it is essential to develop new fluids to improve the performance of the devices (higher voltage rate and/or reduced volume).
For a time, mineral oil was the preferred solution for oil-filled transformers. This type of oil has been used since the 1930s. It is inexpensive, has remarkable dielectric and heat transfer properties, and is well-compatible with cellulose-based insulating materials [2,3]. Despite these significant benefits, mineral oils have some downsides, such as their flammability, substantial environmental impact, low moisture tolerance, and low flash and fire temperatures [2,3,4,5]. Given their characteristics, those liquids are not the best choice for the future [1]. Thus, many academic and industrial researchers have focused on developing safer, non-flammable, and tolerable fluids for the environment. Therefore, new fluids, particularly esters, have appeared on the market [6,7,8].
For decades, natural esters have been used as insulating liquid in power capacitors. Recently, their utilizations have been extended to large power transformers [9]. Besides being readily biodegradable, natural ester oils show a high flash and poor points compared with mineral oils. Rather than suggesting alternative types of insulating liquids, modifying the existing fluids by adding nanoparticles (called nanofluids) is considered as a possible solution [10,11,12,13]. Nanofluids (NFs) are retained for their excellent heat transfer capability [14] and insulating properties [13,15,16]. As an indication, Segal et al. [17] investigated the impact of iron oxide (Fe3O4) NPs on the AC (60 Hz) breakdown voltage (BdV) of mineral oil. These authors showed that, even after thermal ageing, the prepared NFs remain stable and retain their initial magnetic susceptibility. Better AC BdV of NFs was also shown compared to base liquid. Duzkaya and Beroual [18] revealed that adding zinc-oxide (ZnO) NPS to natural ester (Midel 1204) increased the AC BdV by about 5%. This improvement was achieved with 0.1 g/L ZnO NPs. In similar work, Beroual and Duzkaya [19] investigated the impact of adding fullerene NPs on the BdV of Midel 1204. They showed that 0.4 g/L fullerene gives the best improvement (improved by 7.8% than pure natural ester). The concentrations of 0.05 g/L, 0.1 g/L, and 0.2 g/L showed a decreased AC BdV compared to Midel 1204 [19].
In our previous work [20], the impact of fullerene (C60) and graphene (Gr) NPs on AC BdV and partial discharge activity of the synthetic ester Midel 7131 was analyzed. Five concentrations were considered (0.1 g/L, 0.2 g/L, 0.3 g/L, 0.4 g/L, and 0.5 g/L), with different electrode gap distances (0.1 mm, 0.3 mm, 0.5 mm, 0.7 mm, 0.8 mm, 1 mm, 1.5 mm, and 2 mm). The best improvement in AC BdV, i.e., 28.7%, was obtained with 0.4 g/L C60 NPs (0.5 mm electrode gap distance), while the same concentration with Gr NPs and a 0.7 mm electrode gap distance gives the best improvement, that of about 24.4% compared to pure synthetic ester Midel 7131. In addition, we reported that C60 has a positive impact on the partial discharge activity in SE, while the addition of Gr increases this activity.
This work is part of the search for alternative insulating liquids for the existing ones (mineral oils), with less environmental impact and enhanced dielectric performance for their eventual use in high voltage equipment, and especially in power transformers.
This study aims to study the AC BdV of natural ester and natural ester—C60 and Gr NFs, for five concentrations (0.1 g/L, 0.2 g/L, 0.3 g/L, 0.4 g/L, and 0.5 g/L); AC BdV measurements were carried out in compliance with IEC 60156 standards. The Student’s t-test was performed to provide statistical evidence about the difference in mean values of different NFs compared to the natural ester FR3, and possible mechanisms behind the improvements are discussed. Then, the AC BdV data were statistically analyzed using the Weibull distribution law; BdVs of 1%, 10%, and 50% risk levels were deduced from the fitting plots.
2. Materials and Methods
2.1. Materials
In this study, the host liquid (dispersant medium) used to prepare the NFs was the natural ester dielectric fluid FR3, provided by Cargill. FR3 is readily biodegradable and has high/low fire/pour points. The main characteristics of this liquid are summarized in Table 1 [9]. The nano-additives consisted of C60 NPs and Gr nanosheets. C60 NPs and Gr nanosheets were supplied by Sigma-Aldrich (Massachusetts, USA) and SkySpring Nanomaterials (Houston, TX, USA), respectively; their main characteristics are shown in Table 2. Finally, as a dispersant agent, we used oleic acid (cis-9-Octadecenoic acid, purity of >99%), also supplied by Sigma-Aldrich, USA. Oleic acid was used to avoid aggregation/cluster formation and to enhance the stability of NFs.

Table 1.
Physicochemical properties of natural ester, FR3.
Table 2.
Nanoparticles’ characteristics.
2.2. Preparation of Nanofluids
The preparation steps were based on the two-step method [20,21]—the word two-step significates the isolation of the nanoparticle synthesis from the NFs preparation. The following steps were respected for each NF: (a) purification of the base liquid using a micro membrane filter and a vacuum pump to remove impurities (0.1 mbar), (b) addition of 0.75 wt.% of oleic acid, and mixing the mixture (5 min) using a high shear mixer (HS) at 13,000 rpm, (c) addition of powder NPs (desired amount) to base liquid, and agitating the resulting liquid for 20 min using the HS mixer, (d), and finally, subjecting the NF samples to ultrasonication for 120 min to better disperse the NPs. Five NFs of 400 mL volume, each with NPs concentrations of 0.1 g/L, 0.2 g/L, 0.3 g/L, 0.4 g/L, and 0.5 g/L, were prepared. The 500 W ultrasonication device (operating frequency of 20 kHz) was equipped with a 25 mm solid probe, operating in pulsed mode (67% duty cycle and 15 s of period) with a 60% amplitude setting. The latter was rested for 5 min after every 30 min to prevent the NFs from overheating and damaging the solid probe.
2.3. AC Breakdown Measurement
The AC BdV tests were conducted in compliance with IEC 60156 standards by means of a Baur DTA 100C oil tester. The tester consisted of a generator, reaching 100 kV with a 2 kV/s speed rate. The cell consisted of a sphere-to-sphere electrodes configuration (12.5 mm diameter), spaced by an electrode gap of 2.5 mm. Each liquid was stressed 18 times (three series of six measurements), and the average and standard deviation (St.Dev) were calculated. First, the Anderson–Darling fitting test was executed on the BdV outcomes, and then the statistical analysis was performed using the two-parameter Weibull distribution. The Weibull fit curves were used to evaluate the AC BdV at three important probabilities (1%, 10%, and 50%).
3. Results and Discussion
3.1. Statistical t-Test
However, statistically speaking, the improvements could not be observed from the mean AC BdV point of view since there is an evident overlapping. Hence, a statistical comparison of the mean BdV of base liquid and different NFs was performed to conclude the effect of NPs on the BdV performances. Among the statistical tests that allow such analysis is the two-sample t-test [22,23,24]. Therefore, a two-sample t-test (also known as an independent t-test) was performed on the data sets (pure NE—NF) to show whether they differed significantly. The t-value, the degrees of freedom parameters, the corresponding critical value, and the decision are presented in Table 3 (see Appendix A for the t-test explanation).
Table 3.
t-test results summary.
The calculated t-values, exceeding the critical value, clearly indicate that the AC BdV data of pure NE differ from those of the various NFs (i.e., all investigated NFs expect 0.2 g/L C60 and 0.1 g/L and 0.4 g/L Gr NFs). Otherwise, the null hypothesis cannot be rejected, and in this case, the AC BdV data of pure NE does not differ from those of the various NFs. Therefore, the negative sign does not affect the comparison, and this sign is considered a reduction of the BdV.
3.2. AC Breakdown Voltage
Figure 1 and Figure 2 illustrate the mean AC BdV and St.Dev of base liquid and different NFs with C60 and Gr for different concentrations, respectively. The data and the improvements are numerically depicted in Table 4. As shown in Table 4, the mean AC BdV of 0.1 g/L C60 NF decreased compared to the base liquid. Surpassing this concentration, the AC BdV increased compared to the base liquid. The highest mean AC BdV was observed with 0.4 g/L C60 NF, which gave a 13.08% improvement compared to the base liquid (FR3). Accordingly, the mean AC BdV of Gr-added NF decreased for 0.5 g/L doping concentration, while it showed increased breakdown performance for concentrations of 0.1 g/L, 0.2 g/L, 0.3 g/L, and 0.4 g/L compared to the base liquid. The highest mean AC BdV was observed with 0.3 g/L Gr N, which gives a 12.79% improvement compared to the base liquid.

Figure 1.
Mean breakdown voltages versus fullerene (C60) concentrations.
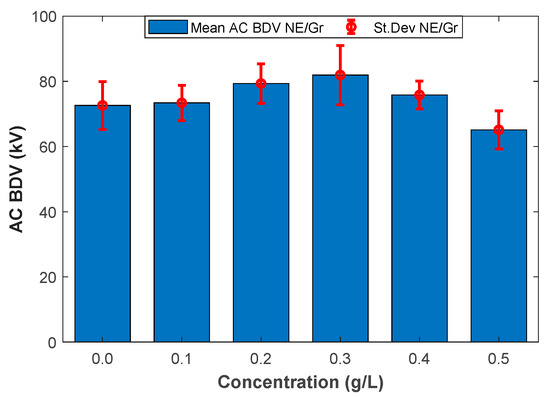
Figure 2.
Mean breakdown voltages versus graphene (Gr) concentrations.
Table 4.
Mean breakdown voltages and standard deviation values of different nanofluids.
Although most studies suggest that NPs’ trapping behavior is responsible for the improvements in the AC BdV of NFs, this mechanism remains a matter of debate. The key to understanding this mechanism, the effect of NPs (conducting, semiconducting, or insulating) on the AC dialectic strength of the base liquid, lies in the appearance of surface charge distribution at the interface between NPs and the base fluid with different conductivities and/or relative permittivities, subjected to a uniform applied electric field (E0). According to Sima et al. [25] and Morgan and Green [26], the surface of NPs contains induced and polarized charges; induced charges in the case of conducting NPs and polarized charges in the case of insulating NPs (dielectric polarization) [25,26]. Contrary to the idea that a material has only one of the two properties (induced or polarized charges), some materials have both (such as conducting Fe3O4 with high relative permittivity, i.e., ε = 80). In addition, there is a difference in charge density on both sides of the particle, which results in an effective or induced dipole across the particle (two hemispheres with opposite signs) aligned with the applied field [26]. This concept is known as polarizability.
According to [27], the mismatch between the base fluid’s conductivities and/or relative permittivities and NPs creates a discrete interface region due to the different valence and conduction band positions of the host liquid and the nano-additive. As a result, the massive electrons in the conductive NPs move in the opposite direction of the local electric field, which polarizes them (positive and negative poles).
In the present work, the C60 and Gr NPs are conductive materials (with low relative permittivity, 2.2 for C60 and 6.6 for graphene), so the process of charge appearance was exclusively due to charge induction [25]. Then, the improvement in the AC BdV in a sphere-to-sphere electrode configuration (quasi-uniform electric field) when adding conducting nanomaterials to natural ester stressed with AC high-voltage source is possibly due to the electron trapping caused by the formation of the surface charge density. The electrons that originate from either ionization or injection move quickly and are trapped by the positively charged pole until saturation is reached. Upon saturation, the negatively charged NPs are considered motionless compared to the mobility of electrons, slowing the streamer’s propagation by reducing its velocity and enhancing the BdV of NFs compared to natural ester.
The explanation mentioned above is valid for a uniform applied electric field; that is, where the relaxation time comes in, where conducting NPs in transformer oil are induced under the applied electric field quickly, faster than the microseconds or nanoseconds needed for the streamer development in transformer oils. As a result, the redistribution of the charge density immediately evens out each time the polarity of the electrodes is reversed.
In the drive to explain the negative impact of adding C60 and Gr on the AC BdV of natural ester, the mechanisms are different due to differences in the concentration range: the lower limit in the case of C60 NF ‘0.1 g/L’ and the upper limit in the case of Gr NF ‘0.5 g/L’.
On the one hand, the negative impact on AC BdV in the case of 0.5 g/L Gr NF could be attributed to the formation of a conductive path between the electrode spacing due to the reduced distance between NPs (a change in concentration from 0.4 g/L to 0.5 g/L leads to the reduced distance between NPs). Another possible reason is the reduction of trapping capability due to cluster formation (due to Van der Waals attraction forces), which reduces the effective surface needed for successful trapping events.
On the other hand, the decrease of AC BdV in the case of 0.1 g/L C60 NF is not negligible and the difference is statistically confirmed (see Table 3). To date it is difficult to explain this decrease for this low concentration.
The reduction in distance and the formation of clusters justify the existence of an optimal concentration, ensuring a good compromise between trapping/space among NPs.
3.3. Weibull Statistical Analysis
In the following, the experimental results are statistically analyzed using the Weibull distribution law [28,29]. This statistical law is among the most frequently used probabilistic distributions to analyze the BdV data of dielectric liquids. Therefore, it constitutes a valuable tool in predicting breakdown voltages at low-risk levels. Hence, it provides hopeful information about the health state of the fluid under test. Furthermore, apart from being beneficial for the probability estimation of a BdV at different risk levels, the Weibull distribution constitutes a means lifetime estimator of insulation liquid; hence the equipment. A goodness-of-fit test is required to use the Weibull fit curves safely. The Anderson–Darling fitting test was performed to check if this distribution law obeys the experimental data (see Appendix B for the explanation of the Anderson–Darling fitting test). Table 5 summarizes the results of the AD fitting test. Except for 0.5 g/L C60 NF, the AC BdV data of all liquids obey the Weibull distribution.
Table 5.
AD goodness-of-fit test results.
From the above analysis, Weibull fit curves can be used for almost all cases to estimate AC breakdown stress at different risk levels. For this purpose, the Weibull fit curves should be plotted. First, the scale (α) and shape (β) parameters were calculated for different liquids, and the results are depicted in Table 6. Those parameters permit the plot of the Weibull probability fit curves versus AC BdV (Figure 3 and Figure 4).
Table 6.
Scale and shape parameters.
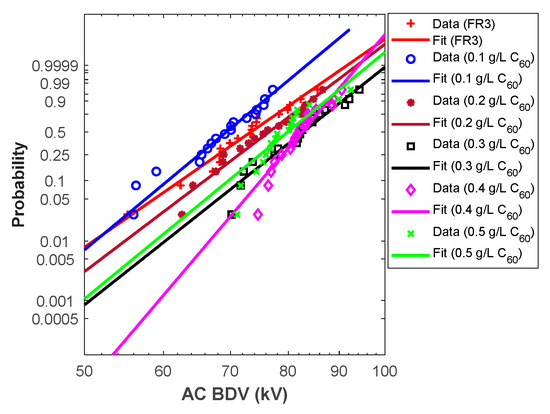
Figure 3.
Fullerene NFs Weibull probability plots.
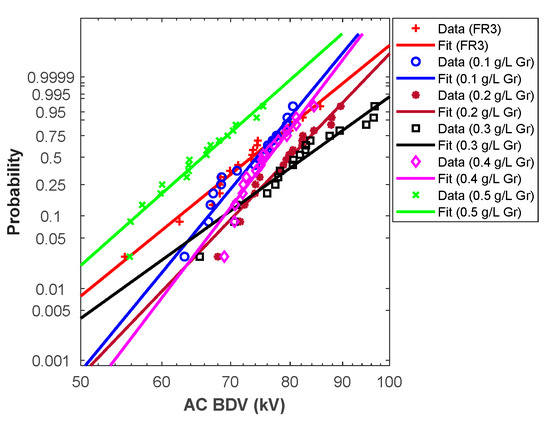
Figure 4.
Graphene NFs Weibull probability plots.
Hence, the above curves (except C60 NF at 0.5 g/L) could be used to assess the AC BdV at the most relevant probabilities (i.e., 1%, 10%, and 50%); the results are depicted in Table 7. For 1% probability, the AC BdVs of NFs with C60 and Gr were optimal with concentrations of 0.4 g/L, which give improvements of 30.53% and 19.37% higher than natural ester, respectively (see Table 7). For 10% probability, the best improvements were with concentrations of 0.4 g/L C60 of NPs, with a 20.32% improvement compared to natural ester and 0.3 g/L Gr of NPs, with a 12.81% improvement compared to natural ester. Finally, for 50% probability, the evaluated AC BdVs have the same tendency as the experimental results.
Table 7.
The AC breakdown voltage for different probability levels, evaluated using Weibull fit curves.
4. Conclusions
This work aims to study the effect of conducting nanoparticles (C60, and Gr) on the AC BdV of natural ester, FR3, for concentrations of 0.1 g/L, 0.2 g/L, 0.3 g/L, 0.4 g/L, and 0.5 g/L. The following conclusions can be drawn
- The t-test showed a significant evident difference in mean AC BdV in the case of natural ester and the different investigated NFs.
- The AC BdV of FR3 increased when adding the C60 and Gr NPs with specified doping concentrations. However, the C60 NFs showed the best improvement of the AC BdV with a 13.08% improvement with 0.4 g/L compared to FR3, while Gr NFs showed the best improvement, i.e., 12.79%, with 0.3 g/L.
- 0.1 g/L C60 NF and 0.5 g/L Gr NF harm natural ester’s mean AC BdV.
- The statistical analysis showed that all the AC BdV outcomes obey the Weibull distribution (except 0.5 g/L C60 NF). So, the fit curves were then used to evaluate the BdVs at different risk levels (1%, 10%, and 50%).
According to the results presented in this work, adding C60 and Gr NPs with well-chosen concentrations to the natural ester FR3 improves the AC BdV.
Author Contributions
Conceptualization, H.K., A.B. and E.V.; methodology, H.K., A.B. and E.V.; software, H.K.; validation, A.B. and E.V.; formal analysis, H.K., A.B. and E.V.; investigation, H.K., A.B. and E.V.; data curation, H.K., A.B. and E.V.; writing—original draft preparation, H.K.; writing—review and editing, H.K., A.B. and E.V.; visualization, A.B.; supervision, A.B. and E.V.; project administration, A.B. and E.V.; funding acquisition, A.B. and E.V. All authors have read and agreed to the published version of the manuscript.
Funding
This research received no external funding.
Data Availability Statement
The data reported in the present study are available upon request; please refer to the corresponding author when asking.
Conflicts of Interest
The authors declare no conflict of interest.
Appendix A. Two-Sample t-Test
Given two sets of data (AC BdV of base liquid and different NFs), the t-test is conducted according to the following steps:
- The calculation of the t-value (two-sample t-test, called the Welch t-test) is given by the formula below [28]:where and are the mean values of set 1 and 2, respectively, Δ is the hypothesized difference (0 for equal and 1 for unequal means), s1 and s2 are the standard deviations of set 1 and 2, respectively, and n1 and n2 are the sizes of set 1 and 2, respectively.
- The degree of freedom (df) for the Welch t-test is given by the formula below [28]The df value is then used to determine the critical values from the t-value table. Because this is a one-tailed test, the alpha level is 0.05.
- The following step consists of looking up t1−α, df (α = 0.05, 1 − α = 0.95, df) value in the t-table [28], and looking for the critical value, which corresponds to the limit t-value for a known degree of freedom.
- If t-value >= t 1-alpha, df, the null hypothesis cannot be rejected in this case, and the two data sets appear different.
- If t-value < t 1-alpha, df, the null hypothesis is rejected in this case, and the two data sets do not appear different.
Appendix B. Anderson–Darling Fitting Test
The conformity check of the AC BdV outcomes to the Weibull distribution was investigated using the Anderson–Darling fitting test (AD-Test) [22,23,24]; its formula is given below
where, {x1 <…< xn} are the ordered AC BdVs points; i and n are the number of data points in the sample and ith sample, respectively. The cumulative distribution function (CDF) of the Weibull distribution is given below:
The scale (α) and the shape (β) parameters represent the AC BdV at a 63% risk level and the slope of the Weibull line curve, respectively.
The next step consists of calculating the corresponding p-value using AD statistic [23]
Finally, the p-value is compared to the significance level (0.05). Hence, if the p-value is less than or equal to 0.05, reject the null hypothesis that the Weibull distribution fits the data; else, accept the null hypothesis that the Weibull distribution fits the data.
References
- Fofana, I. 50 Years in the Development of Insulating Liquids. IEEE Electr. Insul. Mag. 2013, 29, 13–25. [Google Scholar] [CrossRef]
- Krawiec, S. Review of Recent Changes to Mineral Insulating Oil Specifications. In Proceedings of the 2009 IEEE Electrical Insulation Conference, Virginia Beach, VA, USA, 18–21 October 2009; pp. 363–367. [Google Scholar]
- Lyutikova, M.N.; Korobeynikov, S.M.; Rao, U.M.; Fofana, I. Mixed Insulating Liquids with Mineral Oil for High-Voltage Transformer Applications: A Review. IEEE Trans. Dielectr. Electr. Insul. 2022, 29, 454–461. [Google Scholar] [CrossRef]
- Azli, S.A.; Hezri Fazalul Rahiman, M.; Yusoff, Z.M.; Fadzilah Razali, N.; Abd Wahid, S.S.; Sufian Ramli, M. A Review on Alternative Oils as Dielectric Insulating Fluids on Power Transformer. In Proceedings of the 2019 IEEE 15th International Colloquium on Signal Processing & Its Applications (CSPA), Pulau Pinang, Malaysia, 8–9 March 2019; pp. 198–201. [Google Scholar]
- Mehta, D.M.; Kundu, P.; Chowdhury, A.; Lakhiani, V.K.; Jhala, A.S. A Review on Critical Evaluation of Natural Ester Vis-a-Vis Mineral Oil Insulating Liquid for Use in Transformers: Part 1. IEEE Trans. Dielectr. Electr. Insul. 2016, 23, 873–880. [Google Scholar] [CrossRef]
- Oommen, T.V. Vegetable Oils for Liquid-Filled Transformers. IEEE Electr. Insul. Mag. 2002, 18, 6–11. [Google Scholar] [CrossRef]
- Claiborne, C.C.; Pearce, H.A. Transformer Fluids. IEEE Electr. Insul. Mag. 1989, 5, 16–19. [Google Scholar] [CrossRef]
- Rao, U.M.; Fofana, I.; Beroual, A.; Rozga, P.; Pompili, M.; Calcara, L.; Rapp, K.J. A Review on Pre-Breakdown Phenomena in Ester Fluids: Prepared by the International Study Group of IEEE DEIS Liquid Dielectrics Technical Committee. IEEE Trans. Dielectr. Electr. Insul. 2020, 27, 1546–1560. [Google Scholar] [CrossRef]
- Cargill Envirotemp FR3 Fluid; Formulated for Performance 2018; Cargill: Minneapolis, MN, USA, 2018.
- Yu, W.; Xie, H. A Review on Nanofluids: Preparation, Stability Mechanisms, and Applications. J. Nanomater. 2012, 2012, 1–17. [Google Scholar] [CrossRef]
- Sidik, N.A.C.; Mohammed, H.A.; Alawi, O.A.; Samion, S. A Review on Preparation Methods and Challenges of Nanofluids. Int. Commun. Heat Mass Transf. 2014, 54, 115–125. [Google Scholar] [CrossRef]
- Huang, Z.; Li, J.; Yao, W.; Wang, F.; Wan, F.; Tan, Y.; Mehmood, M.A. Electrical and Thermal Properties of Insulating Oil-based Nanofluids: A Comprehensive Overview. IET Nanodielectrics 2019, 2, 27–40. [Google Scholar] [CrossRef]
- Ahmad, F. State-of-Art in Nano-Based Dielectric Oil: A Review. IEEE Access 2019, 7, 15. [Google Scholar] [CrossRef]
- Choi, S.U.; Eastman, J.A. Enhancing Thermal Conductivity of Fluids with Nanoparticles; Argonne National Lab.: Lemont, IL, USA, 1995. [Google Scholar]
- Hwang, J.G.; Zahn, M.; O’Sullivan, F.M.; Pettersson, L.A.A.; Hjortstam, O.; Liu, R. Effects of Nanoparticle Charging on Streamer Development in Transformer Oil-Based Nanofluids. J. Appl. Phys. 2010, 107, 14310. [Google Scholar] [CrossRef]
- Chen, J.; Sun, P.; Sima, W.; Shao, Q.; Ye, L.; Li, C. A Promising Nano-Insulating-Oil for Industrial Application: Electrical Properties and Modification Mechanism. Nanomaterials 2019, 9, 788. [Google Scholar] [CrossRef] [PubMed]
- Segal, V.; Rabinovich, A.; Nattrass, D.; Raj, K.; Nunes, A. Experimental Study of Magnetic Colloidal Fluids Behavior in Power Transformers. J. Magn. Magn. Mater. 2000, 215–216, 3. [Google Scholar] [CrossRef]
- Duzkaya, H.; Beroual, A. Statistical Analysis of AC Dielectric Strength of Natural Ester-Based ZnO Nanofluids. Energies 2020, 14, 99. [Google Scholar] [CrossRef]
- Beroual, A.; Duzkaya, H. AC and Lightning Impulse Breakdown Voltages of Natural Ester Based Fullerene Nanofluids. IEEE Trans. Dielect. Electr. Insul. 2021, 28, 1996–2003. [Google Scholar] [CrossRef]
- Khelifa, H.; Vagnon, E.; Beroual, A. AC Breakdown Voltage and Partial Discharge Activity in Synthetic Ester—Based Fullerene and Graphene Nanofluids. IEEE Access 2022, 10, 5620–5634. [Google Scholar] [CrossRef]
- Khelifa, H.; Beroual, A.; Vagnon, E. Effect of Conducting, Semi-Conducting and Insulating Nanoparticles on AC Breakdown Voltage and Partial Discharge Activity of Synthetic Ester: A Statistical Analysis. Nanomaterials 2022, 12, 2105. [Google Scholar] [CrossRef]
- D’Agostino, R. Goodness-of-Fit-Techniques; Routledge: England, UK, 2017. [Google Scholar]
- Marsaglia, G.; Marsaglia, J. Evaluating the Anderson-Darling Distribution. J. Stat. Soft. 2004, 9, 1–5. [Google Scholar] [CrossRef]
- Anderson, T.W.; Darling, D.A. Asymptotic Theory of Certain “Goodness of Fit” Criteria Based on Stochastic Processes. Ann. Math. Stat. 1952, 23, 193–212. [Google Scholar] [CrossRef]
- Sima, W.; Shi, J.; Yang, Q.; Huang, S.; Cao, X. Effects of Conductivity and Permittivity of Nanoparticle on Transformer Oil Insulation Performance: Experiment and Theory. IEEE Trans. Dielect. Electr. Insul. 2015, 22, 380–390. [Google Scholar] [CrossRef]
- Morgan, H.; Green, N.G. AC Electrokinetics: Colloids and Nanoparticles; Microtechnologies and microsystems series; Research Studies Press: England, UK, 2003; ISBN 978-0-86380-255-3. [Google Scholar]
- Fasehullah, M.; Wang, F.; Jamil, S.; Bhutta, M.S. Influence of Emerging Semiconductive Nanoparticles on AC Dielectric Strength of Synthetic Ester Midel-7131 Insulating Oil. Materials 2022, 15, 4689. [Google Scholar] [CrossRef] [PubMed]
- Boslaugh, S.; Watters, P.A. Statistics in a Nutshell: A Desktop Quick Reference; O’Reilly Media, Inc.: Sebastopol, CA, USA, 2012. [Google Scholar]
- Ferris, C.D.; Grubbs, F.E.; Weaver, C.L. Operating Characteristics for the Common Statistical Tests of Significance. Ann. Math. Stat. 1946, 17, 178–197. [Google Scholar]


Disclaimer/Publisher’s Note: The statements, opinions and data contained in all publications are solely those of the individual author(s) and contributor(s) and not of MDPI and/or the editor(s). MDPI and/or the editor(s) disclaim responsibility for any injury to people or property resulting from any ideas, methods, instructions or products referred to in the content. |
© 2023 by the authors. Licensee MDPI, Basel, Switzerland. This article is an open access article distributed under the terms and conditions of the Creative Commons Attribution (CC BY) license (https://creativecommons.org/licenses/by/4.0/).