Abstract
The working condition of a centrifugal pump as a turbine (PAT) is often unsteady. The rotating speed of a PAT constantly varies as the flow and load change, resulting in transient hydrodynamic behaviors between different working conditions. During the transition, the PAT undergoes a severe change in performance and complicated internal flow structures. In previous work, the fixed rotating speed of a PAT was mostly considered using computational fluid dynamics. To investigate the transient behavior of a PAT, relevant simulation tools are developed to depict transient flow conditions, and the corresponding transient speed of the impeller is calculated. Both large and small fluctuation transitions are simulated for the practical application of the PAT. The simulated results are first verified by experiments. The results show that the rotating speed significantly affects the performance and stability of the PAT. The rapid increment in flow rate and rotating speed lead to large energy dissipation in the internal flow field of the PAT. The range of high efficiency of the PAT expands and migrates to the high flow rate range. The efficiency in the transition condition started a cyclic growth after the flow reached 60 m3/h, and it reached a peak at around 80 m3/h, which was about 5% lower than the calculated value in a quasi-steady state. In the range of high rotating speeds, the rotating speed of the impeller and the operational stability are sensitive to flow fluctuation. The internal flow fields during transition conditions are analyzed as well. The obtained results can be utilized as a reference for studying the hydrodynamic characteristics and stability of fluid machinery in the transition under transient flow conditions.
1. Introduction
A pump as a turbine (PAT) can recover energy from high-pressure fluid simply and effectively [1,2], which is widely used in many industrial applications such as petrochemical and small water conservancy [3]. Ansari et al. [4] study the feasibility of applying a PAT in a hydropower system and its performance on oil pipelines. The result shows that employing the hydropower pump on a high-pressure oil transmission line provides a sustainable opportunity to transform the potential energy of crude oil to the available energy for further operation, and based on experiments on hydropower-driven pump under different inlet pressures, an optimal point was observed for the system to reach the maximum performance of hydropower plants. To maintain the efficient energy recovery of the turbine, the turbine should be working for a long time under its optimal working condition. However, in the actual operation process of the turbine, especially in the pumped-storage power station where the load changes frequently [5,6], the actual operation state of the turbine will change with the changes in the upstream conditions [7]. The constant change of working conditions makes the operation condition of hydraulic machinery unstable and sometimes even causes accidents [8,9].
As the pump is not designed with its inversion, the characteristic relationship between the pump and turbine attracts our attention [10]. Stefanizzi et al. [11] conducted experiments to predict the optimal efficiency relationship between pumps as turbines. Tsukamoto et al. [12] studied the characteristics of pumps under the sinusoidal variation of speed and found that with the increase of speed fluctuation frequency, the dynamic characteristics deviated significantly from the quasi-steady-state characteristics. By combining the moment of inertia and flow inertia, Grover et al. [13] found, through the method of combining experiment and theory, that both of them had an impact on the rate of flow increase, and the moment of inertia of the impeller had a significant impact on the increase of speed. Dazin et al. [14] presented a theoretical analysis of the fast transients of turbo machinery and found that the characteristics of turbines depend not only on the rotational acceleration and flow acceleration but also on the evolution of transient processes. Tanaka et al. [15] conducted an experimental study on the rapid start process of a single-stage volute centrifugal pump. The results showed that the pump performance parameters were greater than the quasi-steady state in the early stage of this stage and then approached the quasi-steady state. There was a larger deviation between the pump parameters and the quasi-steady state under the large flow acceleration. Chalghoum et al. [16] analyzed the dynamic characteristics of the pump during startup using a time-interval method and showed that increasing the pressure can have an important positive effect when the startup time is short, and the pipeline contains a lot of water. Feng et al. [17] summarized that the centrifugal pump mainly includes four modes in this process: the pump mode, braking mode, turbine mode, and runaway mode. Various operation modes of the pump are shown in Figure 1. Model A is the “normal pump” working within the maximum flow rate. Model B is the “breaking model”, and Model C involves normal operation as a turbine. In Model D, the pump works as a break [18].
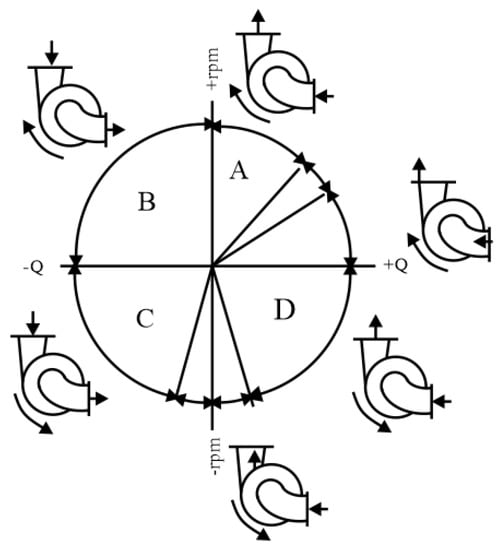
Figure 1.
Operation modes of the pump.
For the starting and stopping conditions of pumps, Wu et al. [19] studied the pump performance and developed a method to simulate the flow field during the start of centrifugal pumps. Li et al. [20] used the sliding mesh method to simulate the quick start-up stage of the centrifugal pump, avoiding the error caused by the unsteady boundary conditions and explaining the evolution characteristics of the transient flow. Zhou et al. [21] investigated the changes of fluid-induced force with impeller eccentricity and the unsteady flow characteristics of the internal flow field of centrifugal pump under different flow conditions and rotation speeds and found that when the rotation speed changes and the flow is similar, the pressure coefficient under different rotation speeds almost coincides. Zhang et al. [22] used the unsteady turbulent flow in pumps that were simulated based on the Navier–Stoke solver embedded with the k-ɛ RNG turbulence model. The studies show that the results of unsteady prediction are more reliable. The fluid acceleration effect of this transient process makes the evolution of the flow field lag behind the quasi-steady flow field on the whole. Su et al. [23] have studied the variable-speed transition process of a hydraulic turbine coherently. Compared with the quasi-steady-state calculation, the simulation of the transient transition process is in better agreement with the experimental results.
In previous work, the fixed rotating speed of a PAT was mostly considered using computational fluid dynamics. However, in practical engineering applications, the working conditions of a PAT change constantly, and the turbine is always in transition between different working conditions. During the transition, the rotation speed of the impeller changes constantly, which results in the PAT undergoing a severe change in performance and complicated internal flow structures. Therefore, the transient hydrodynamic characteristics of a PAT with varying rotating speeds should deserve our attention.
The working conditions change constantly and the turbine is always in transition between different working conditions. When the parameters of the working condition have a large number of changes or even change, the symbol of the transition process is called a large fluctuation transition process; when the parameter change range is small, it is called a small fluctuation transition process [24]. In this paper, we used the user-defined function (UDF) in Fluent for secondary development to control the inlet flow and computed the instantaneous impeller rational speed, and the simulated results are verified using experiments. Different inlet flow changes are set to realize the simulation of the transition process of large and small fluctuations of the PAT, which is close to the practical application of engineering. The characteristic parameters of the PAT with varying rotating speeds and the transient characteristics of the internal flow are analyzed and revealed.
2. Numerical Methods
2.1. Governing Equations and Turbulence Model
The flow characteristics conform to three conservation principles, including mass conservation, momentum conservation, and energy conservation. In this paper, the fluid state in the calculation domain is regarded as incompressible turbulence. The mass and momentum conservation equation was, respectively, expressed as Equations (1) and (2):
where and are the fluid’s density and the velocity in the direction, respectively. represents dynamic viscosity, is the hydrostatic pressure, and is the source term.
The turbulence model solves the transport equations of two scalar turbulent kinetic energies and . Compared with the model, the turbulence model has advantages in dealing with the shear flow, boundary layer turbulence, and moderate separation turbulence. The turbulence model proposed by Wilcox [25] assumed that the turbulence viscosity is related to the turbulence frequency, expressed as Equation (3):
Based on this model, the turbulent kinetic energy and the specific dissipation rate are solved by Equations (4) and (5):
where is the generation term of turbulence.
2.2. Models
The pump consists of six parts: inlet and outlet extensions, front and back chambers, a volute, and an impeller. The computational domain is shown in Figure 2. The pump’s main design parameters are shown in Table 1.
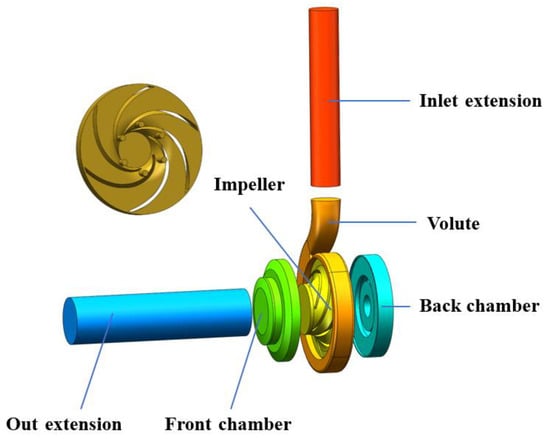
Figure 2.
Three-dimensional geometry of the pump.

Table 1.
Main parameters of the pump.
2.3. Mesh Generation
The three-dimensional geometric model was meshed using Fluent Meshing. Polyhedral mesh can provide more accurate calculation results than tetrahedral mesh when the number of grids is the same. The mesh views of the volute are presented in Figure 3; grids close to the volute tongue and other complex areas appropriate encryption.
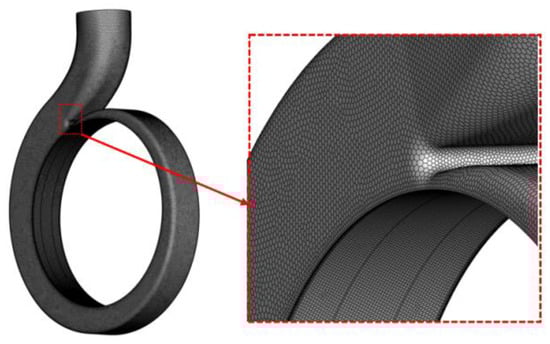
Figure 3.
Polyhedral mesh in the volute domain (left) and a zoomed-in view of the area around the volute (right).
For fluid machinery, efficiency is a critical parameter. The calculation of efficiency is determined by the input power ( expressed in Equation (6)) and net output power ( expressed in Equation (7)) of the impeller. The efficiency of the PAT is expressed in Equation (8). Based on the efficiency, it is used to eliminate the interference of grid size and realize the grid independence verification. The result shown in Figure 4 indicates that when there were 4.10 million grids, the efficiency gap was less than 0.1%; considering the calculation accuracy and efficiency, 4.10 million grids was selected for the research.
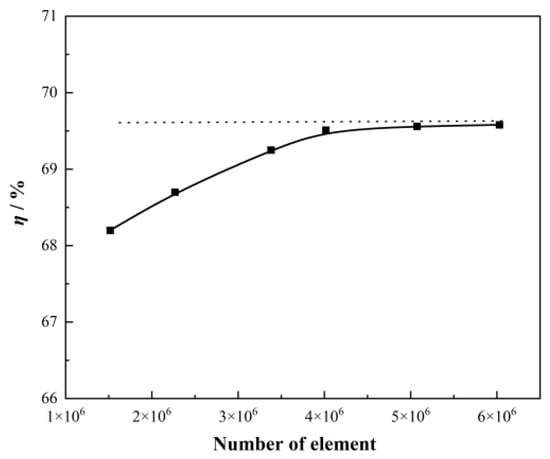
Figure 4.
Mesh independence analysis.
Among them, and represent the total pressures at the inlet and outlet sections, respectively. is the flow rate, and denotes the angular velocity.
2.4. Impeller Rational Speed
To simulate the flow performance of rotating machinery, it is necessary to know the law of the known speed changing with time. When the impeller is under the action of water flow, the angular velocity of the impeller is expressed in Equation (9):
where represents the total torque of the impeller, including the torque obtained by the impeller rotor, load torque , and resistance torque . is the moment of inertia of the rotating system, and is time. The equation is expressed as Equation (10):
The mechanical efficiency of the centrifugal pump is generally 96–99% to calculate the resistance torque . For the load torque , the performance parameter of the load pump at any time can be approximated using the similarity theory (Equation (11). The load torque , at any time, can be expressed as Equation (12):
When the rotational speed changes, the motion equation of rotation is expressed as Equation (13), where is the gravity of the rotating part, and is the diameter of the rotating part:
By discretizing time, the impeller speed can be expressed as Equation (14):
where is the time step of the simulation. For this reason, the compiled UDF was uploaded to Fluent solver to update the impeller speed in real time.
2.5. Numerical Setting
The calculation platform used Ansys Fluent, the flow medium was clean water at 20 °C, the density was , the viscosity was , and the gravity option was opened. The rotor and the volute are in different coordinate systems; the former is in a relative coordinate system, and the latter is in a static coordinate system. The residual value of convergence is set to 10−5, and the wall roughness is set to 50μm. Using the model can effectively predict flow-field characteristics; the convection term adopts second-order discrete, and the diffusion term adopts central difference [26]. As for the boundary conditions, the mass-flow inlet was selected as the inlet boundary; as the outlet boundary condition, the value of the pressure outlet is approximately equal to the downstream pipeline pressure. The impeller angle of each time step of the transient calculation is controlled within 3°; the time step is set as 3.6 × 10⁻⁵ s, and the number of iterations of each step is 15 to ensure the accuracy of calculation.
To simulate the large fluctuation transition condition, the inlet flow index was set to surge, and the flow variation range was set as 30–105 m3/h. The transient of flow can be expressed as Equation (15). To ensure the reliability of the calculation results, the flow will start to transient after running for 0.1 s under the initial working condition, and the whole transient process will last for 0.4 s.
The inlet flow was set as the sinusoidal function in Equation (16) to simulate the transition condition with small fluctuations. To ensure the reliability of the calculation results, the flow began to change after running for 0.1 s under the initial working condition, and the whole process lasted for 1.3 s.
2.6. Numerical Method Validation
Figure 5 shows an overview of the test system, including test schematics (Figure 5a), test platform (Figure 5b), and PAT (Figure 5c). A 45 kW lightweight vertical multistage centrifugal pump was set up upstream for pressurization to provide high pressure fluid for the turbine system. The test bench was equipped with a console to regulate the flow and pressure at the turbine inlet, and an eddy current dynamometer was configured to monitor the output power of the turbine. During the experiment, the turbine speed was maintained near the 2000 rpm and rated speed of 2900 rpm by changing the load. A pressure sensor and an electromagnetic flowmeter are arranged at the inlet and outlet of the turbine to monitor relevant parameters [27].
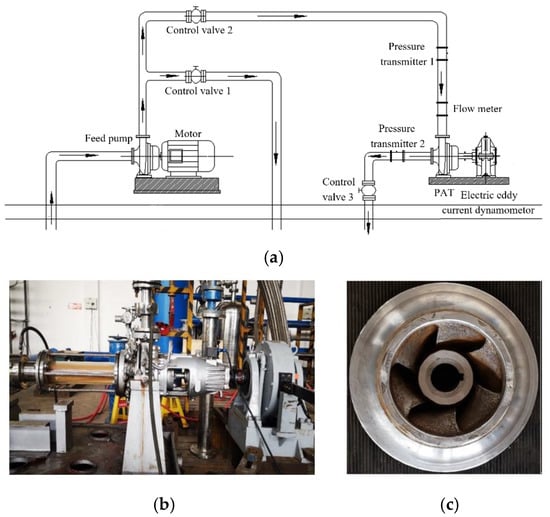
Figure 5.
Schematic of the test system (a), test system platform (b), and PAT (c).
Figure 6 compares the pump characteristic curve predicted using numerical simulation with the experimental results to verify the accuracy of the numerical results. The results show some errors in the sensor and mechanical friction and leakage during the experiment; the external characteristic curve of the numerical calculation is slightly higher than the experimental value, but the error is controlled within 3%, which is within the acceptable range. The numerical model and method presented in this paper show good accuracy and can be used for the subsequent numerical simulation.
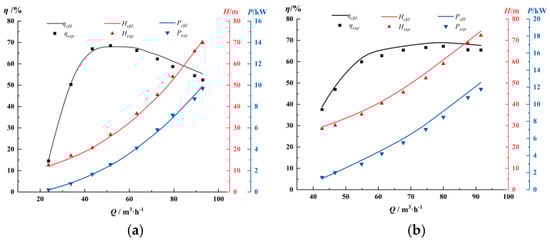
Figure 6.
The numerical result compared with the experiment at 2000 rpm (a) and 2900 rpm (b).
3. Result
3.1. Variation in Rotating Speed
The variation in rotating speed is a key parameter in simulating the transition of a PAT. As the angular acceleration of the impeller directly depends on the moment, it is, therefore, necessary to survey the relationship between the moment and the rotating speed of the impeller under transient flow conditions.
Figure 7 displays the relationship between the rotating speed and torque in a large fluctuation transition. It can be observed that the moment on the impeller increases with the rapid increment in flow. However, the rotating speed does not increase linearly. In the range of small flows, the torque on the impeller steadily increases with small fluctuations, and the rotating speed increases slowly. After the flow reaches 70 m3/h, the torque of the impeller exhibits a rapid increment with increasing fluctuation frequency, and the angular acceleration of the impeller also increases rapidly. The rotating speed of the impeller increases sharply due to the lag in moment change caused by the inertial force of the water flow. As the flow exceeds the rated flow (80 m3/h), the torque of the impeller gets highly disturbed, posing a large impact on the life of the unit and the stability of the PAT.
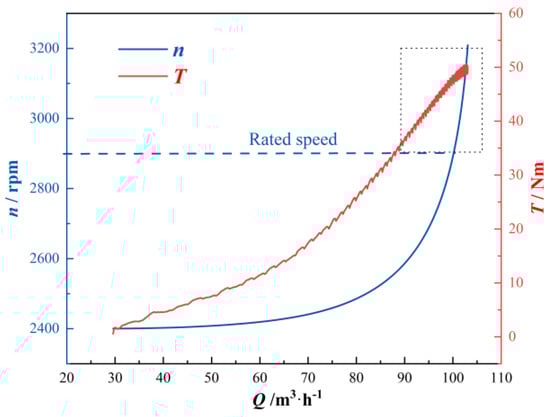
Figure 7.
The relationship between the rotating speed and torque in large fluctuation.
When the PAT works steadily, the impact of the inlet flow fluctuation on the rotating speed directly impacts the efficiency and stability of the PAT. Figure 8 exhibits the relationship between the torque, loading torque, and rotating speed of the impeller in a small fluctuation transition. As revealed, in the small fluctuation transition, the impeller experiences cyclic variations in its moment and rotating speed in the same cycle as the flow fluctuation (0.6 s). In the first cycle, the rotating speed reaches its peak and then gradually drops, which is further maintained stably at about 3025 rpm. In addition, there was a phase difference of 1/3 T between the moment and the rotating speed variations. At the points where there is a lag in the variation in the rotating speed, the phase difference further increases with the decrease in the cycle of flow variation, depicting an increasingly evident lagging of flow in the impeller.
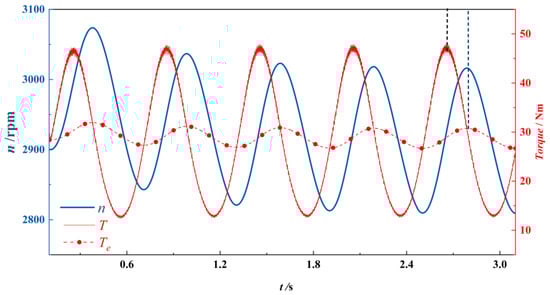
Figure 8.
The relationship between the torque, loading torque, and rotating speed of the impeller in a small fluctuation transition.
3.2. External Characteristic Curve
The existing studies on the comprehensive characteristics of the PAT and its operation with variable rotating speeds focus on the efficiency of energy recovery and similar parameters. In most cases, the data were collected from the experimental or actual operation parameters. However, the PAT often has different operation efficiency, hydraulic performance, and internal flow fields at different rotating speeds and working conditions. In addition, in practical applications of a PAT, flow change may lead to a change in the rotating speed of the impeller. Therefore, an unsteady flow field often corresponds to the rotating speed of the impeller. In this regard, studying the transition between different rotating speeds helps to improve the economic efficiency of the PAT system.
The unsteady flow field is commonly approximated as the computational superposition of infinite steady states. In numerical studies on hydraulic machinery, the quasi-steady-state computation method was frequently adopted to survey the transient processes of pumps, which was further verified experimentally. The external characteristic curves at different rotating speeds of the impeller (1500 rpm, 2000 rpm, and 2900 rpm) were obtained using quasi-steady-state numerical computation and compared with the transition between variable rotating speeds. As illustrated in Figure 9, the PAT has different working ranges at different rotating speeds. The working range is small in the range of low rotating speeds but large in the range of high rotating speeds.
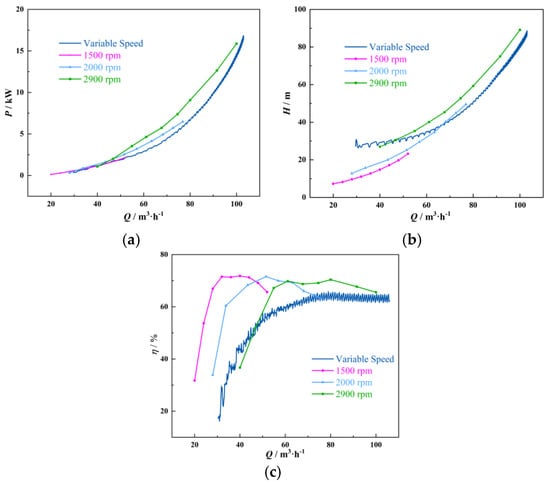
Figure 9.
Power number curves (a), head number curves (b), and efficiency curves (c) for large fluctuation transition.
When the rotating speed was at a low level, Figure 9a shows that the shaft powers at different rotating speeds were similar. With the increment in flow, the shaft powers increased rapidly and gradually produced a large gap. After reaching 40 m3/h, the shaft power in the transition became lower than that in the quasi-steady working condition. The reason is that as the flow increases, the rotating speed of the impeller in transition also increases. Consequently, the hydraulic frictional loss (accompanied by the flow channel) and the hydraulic loss, which is caused by impact, flow separation, and the variations in the direction and value of velocity, consumed some shaft power. As the rotating speed increases continuously, the shaft power gradually moves to a steady working condition after reaching the rated working condition (80 m3/h).
As shown in Figure 9b, the head is directly proportional to the flow. The PAT at a high rotating speed had a high head compared to the PAT at a low rotating speed under the same flow condition. The head during the transition between different rotating speeds is always lower than that in a quasi-steady working condition at 2900 rpm due to the additional water head produced by the acceleration of the fluid flow.
Figure 9c shows that the efficiency error is a cumulative error of the water head and shaft power. As observed, in the transition between different rotating speeds, the efficiency highly fluctuates in a small flow, appearing disordered and noncyclic. During this time, the efficiency is lower than that in a quasi-steady state due to the rotating stall of the PAT in the small flow. The efficiency in the transition between different rotating speeds started a cyclic growth after the flow reached 50 m3/h, and it reached the peak at around 80 m3/h (the rated flow), which was about 5% lower than the calculated value in a quasi-steady state.
In the small fluctuation transition, as shown in Figure 10, the external characteristics of the PAT underwent cyclic changes with the flow variation. The water head and shaft power exhibit roughly identical variation rules, and their fluctuations reach 18 m and 6 kW, respectively. The fluctuations at the peaks are significantly greater than those at the valleys. Thus, the head and shaft power at the peaks are subjected to a large impact from the same flow variation than at the valleys. In addition, the efficiency of the PAT also depicts a cyclic change. The average efficiency is 66.9%, which is lower than the efficiency at the rated flow (69%). This reduction in efficiency is directly proportional to the flow fluctuation and inversely proportional to the cycle. Thereby, the PAT system can work stably with optimum efficiency by reducing the flow fluctuation and increasing the fluctuation cycle.

Figure 10.
The external characteristics of the PAT in the small fluctuation transition.
3.3. Internal Flow Field
Figure 11 demonstrates the static pressure and turbulence intensity nephogram on the radial section of the PAT’s impeller basin. As shown, the internal pressure gradient of the impeller is small at a low rotating speed (2400 rpm), which indicates that the PAT showed a weak ability of pressure energy conversion at this time. Therefore, the PAT has a small working range at small flows and low rotating speeds. As the flow and rotating speed increase, the pressure gradient increases, and the PAT’s pressure energy conversion ability is also enhanced. With the same efficiency at 3000 rpm, the low-pressure area at the outlet begins to spread and occupies the entire flow channel of the impeller. Further, the pressure at the impeller inlet increases gradually, and the pressure outlined at the runner inlet becomes more concentrated due to the increase in speed of the external peripheral of the impeller. In addition, there is a reduction in the number of axial eddies in the flow channel of the runner with the increments in the rotating speed and flow.
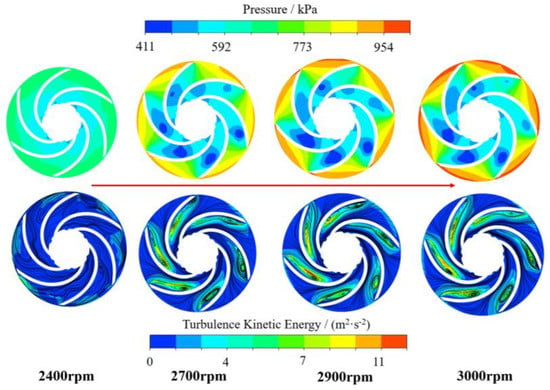
Figure 11.
The static pressure and turbulence intensity nephogram at different speeds.
Turbulence energy is a key parameter reflecting the turbulence intensity, embodies the energy loss in the flow basin, and is mainly supplied by the Reynolds shear stress. It is directly proportional to the energy loss. As shown in Figure 11, the flow line in the impeller is disordered at 2400 rpm but remains uniform overall. There is no area with significantly high turbulence energy. When the rotating speed reaches 2700 rpm, the high turbulence energy area gradually expands with the constant increments in the rotating speed and flow due to the lagging effect of the fluid.
The distribution of turbulence energy in the flow channel of the impeller is displayed in Figure 12. The turbulence energy at the impeller inlet is higher in the transient acceleration than in the quasi-steady state. This is mainly due to the gradual increase in the pressure difference between the stress surface and suction surface of the blade with the acceleration of the impeller in this process. In the meantime, a small number of fluid flow eddies with low turbulence energy appear at the impeller inlet due to the impact of fluid inside the impeller and the acceleration of the impeller. On observing the flow channel of the impeller, it is found that in a quasi-steady state, the area with high turbulence energy and the area with eddies appear near the inside of the flow channel and mainly gather in the center section of the blade’s suction surface. Eddies are evenly distributed in the flow channel inside the impeller and spread along the blade. In contrast, in the transient process, eddies are widely distributed in the impeller and are unevenly distributed in the flow channel. There is a large difference between the turbulence energy levels of eddies. It mainly arises due to the transient effect of the centrifugal pump during the speed increment and the flow inertia of fluid in the pump. Overall, the flow in the centrifugal pump during the transient acceleration is complex; compared to that of the quasi-steady state, the fluid turbulence is fierce, and the eddy distribution area is large.
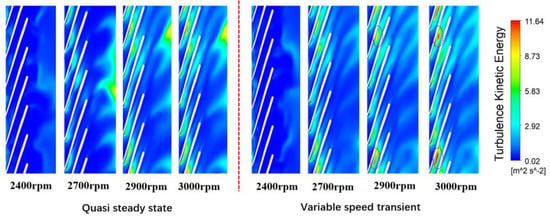
Figure 12.
The distribution of turbulence energy in the flow channel of the impeller.
3.4. Stability
The pressure fluctuation of the PAT has a direct relation with the operational stability of the equipment. It includes the random pressure fluctuation caused by unsteady secondary flow, backflow, wake, eddy, and other factors. It also includes the fluctuation caused by the periodic motion of the rotor and that caused by the cyclicity of the flow channel. In this study, cyclic fluctuation is given more importance. As shown in Figure 13, 8 and 12 checkpoints were set up in the volute flow basin and the impeller flow channel, respectively, to check the pressure fluctuations in the flow passage components.
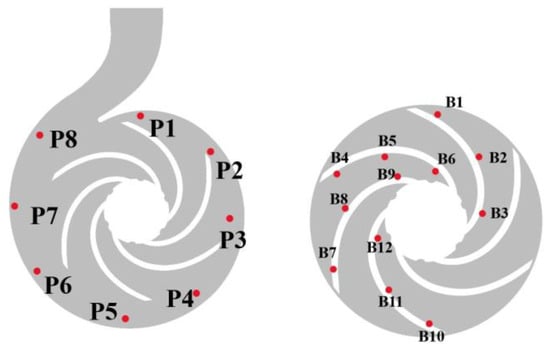
Figure 13.
Distribution of the pressure pulsation monitoring points.
Figure 14 indicates that as the fluid flows counterclockwise in the volute, the pressure fluctuation amplitude constantly increases from checkpoints P8 to P1, which reveals that high amplitudes of pressure fluctuation appear in the small section of the volute flow channel. The pressure fluctuation at the checkpoints displays identical variation rules by accelerating the rotating speed. Particularly, the pressure fluctuation amplitude and frequency increased gradually with the increments in flow and rotating speed. However, after the flow reached the rated flow (80 m3/h), the pressure fluctuation amplitude and frequency started accelerating, and as the flow reached 90 m3/h, the pressure fluctuation became violent.
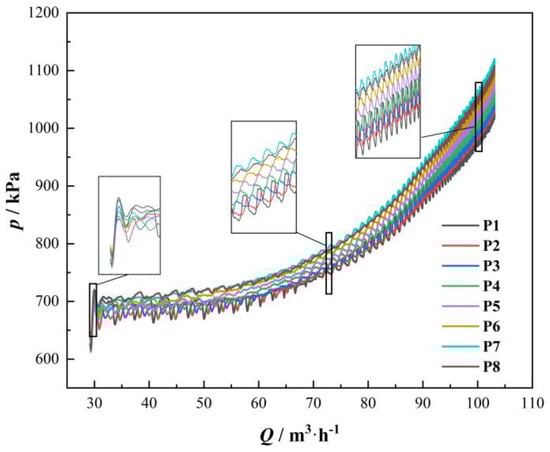
Figure 14.
The pressure fluctuations in the volute during the large fluctuation transition.
Figure 15 shows the pressure fluctuations on the working face and back of the blade during the large fluctuation transition. As can be seen, when the working face of the blade is in the range of low rotating speeds and flows, the pressure fluctuation amplitudes from the blade inlet to the outlet are small and slightly reduced. Compared with the middle (B5 and B11) and outlet (B6 and B12) of the blade, the pressure fluctuation at the blade inlet (B4 and B10) is obvious. This is because the fluid at the blade inlet has a high flow rate and kinetic energy, which act on the impeller when it passes through its flow channel such that the kinetic energy of the fluid is constantly converted into the kinetic energy of the impeller. Consequently, the kinetic energy of the fluid at the blade outlet decreases distinctively. As the rotating speed increases further and the flow exceeds the rated flow (80 m3/h), fierce pressure fluctuation appears from the blade inlet to the outlet, followed by an increment in the pressure. The pressure change at the back of the blade is gentler compared to on the working face. The pressure difference between the blade inlet and outlet increases with the increments in the flow and rotating speed.
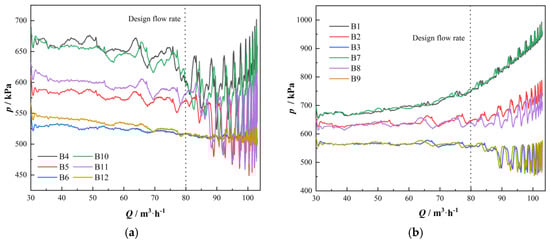
Figure 15.
The pressure fluctuations on the working face (a) and back of the blade (b) during the large fluctuation transition.
Figure 16 displays the pressure fluctuation in the volute flow channel during the small fluctuation transition. As observed, the pressure fluctuation amplitudes at the checkpoints exhibit identical variation rules. The width of the flow channel is inversely proportional to the pressure fluctuation amplitude. The fluctuation rules and the flow variation have identical cyclicity. The fluctuation amplitude at the peak is much larger than that at the valley. Moreover, it can be easily observed that the minimum fluctuation amplitude is 850–900 kPa, which is around the rated flow (80 m3/h). When the flow fluctuation is 25%, the maximum difference in the pressure fluctuation amplitude reaches almost 300 kPa. Thus, it is demonstrated that the pressure fluctuation in the volute flow basin is sensitive to flow fluctuation when the impeller is in the range of high rotating speeds.
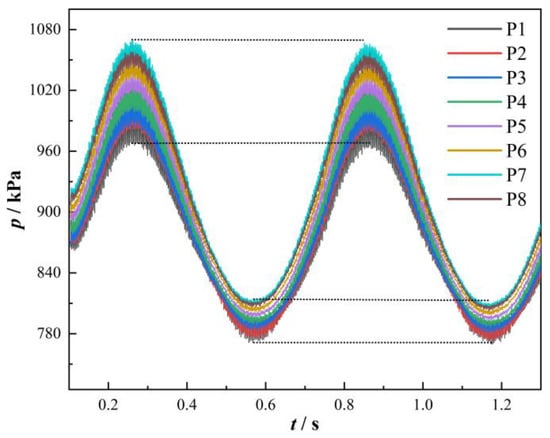
Figure 16.
The pressure fluctuations in the volute during the small fluctuation transition.
Figure 17 illustrates the pressure fluctuations on the working face and back of the blade during the small fluctuation transition. As presented, the pressures on the two faces were cyclic with the flow fluctuation. The pressure decreases gradually from the blade inlet to the outlet. In the previous 1/2 T, the pressure on the working face increases first and then decreases. However, the pressure fluctuation amplitude at the blade outlet (B6, B12) becomes lower than those at the inlet and middle of the blade. In contrast, the pressure fluctuation amplitude at the blade outlet (B3, B9) is higher than those at the inlet and middle of the blade. In the latter 1/2 T, the pressure on the working face fluctuates at the inlet and middle of the blade and then becomes steady at the outlet. The pressures on the back of the blade had similar variation rules to those on the working face, they decrease at the inlet and middle of the blade and fluctuate steadily at the outlet.
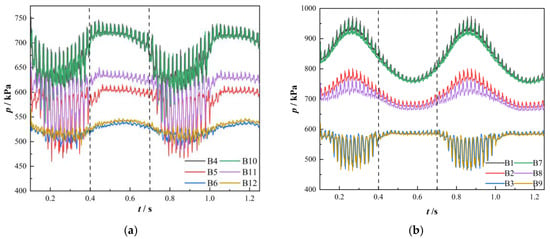
Figure 17.
The pressure fluctuations on the working face (a) and back of the blade (b) during the small fluctuation transition.
3.5. Forces
For the PAT and similar fluid-driven prime movers with high rotating speed and energy, when fluid flows into the runner from the volute, hydraulic excitation occurs due to the unbalanced radial forces from the runner, which are caused by the asymmetric pressure distribution of the fluid in the circumference. This is the main reason for the vibration and noise of the unit and directly determines the operational stability and life of the PAT system. In this study, the transition of the PAT is simulated to check the acting forces of the fluid in the x and y direction of the entire impeller. Finally, the two forces are synthesized into the total radial force of the runner based on the following formula:
As shown in Figure 18, the carmine, green, and black curves represent the projections of the synthesized radial force on the planes t-Fx, t-Fy, and Fx-Fy, respectively. As shown in Figure 18a, in the large fluctuation transition, the radial forces Fx and Fy maintained the same fluctuation rules. In the former 0.22 s, the absolute radial forces are small, and the number of radial force fluctuations increase at the same time interval. The absolute radial forces increase and gradually deviate from the center shaft with increments in flow and rotating speed. Apart from that, their fluctuation frequencies also increase significantly. Finally, the mean value of Fx is maintained at 29.64 N and Fy at 60.83 N, which almost doubles the former. The maximum radial force is obtained as 67.81 N using Equation (17). From the above discussion, the following conclusions can be made: in the range of low flows, the variation in the rotating speed is small, and the transition time is sufficient. The smaller the variation amplitudes in the absolute values of Fx and Fy, the closer the radial force is to the center shaft, and the stability of the operation is greater. The rotating speed is high at a large flow. The absolute radial forces increase at the beginning and finally stabilize at a large value. These variation rules are similar to those of the pressure fluctuation as aforementioned. Hence, it is concluded that the radial forces in the transition are mainly attributable to the non-steady and unbalanced flow with dynamic and static interferences.
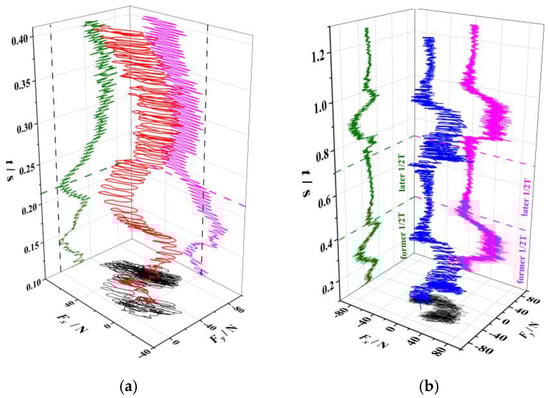
Figure 18.
Radial forces of impeller: (a) the large fluctuation transition; (b) the small fluctuation.
As shown in Figure 18b, in the former 1/2 T of the small fluctuation transition, the radial forces vary with similar rules to the pressure fluctuation; their absolute values increase first and then decrease. The maximum values of Fx and Fy are 60.83 and 69.68 N. The maximum radial force is calculated as 92.49 N using Equation (17). In the latter 1/2 T, the variations in Fx and Fy tend to be stable; the radial forces approach the center shaft, and the PAT operates stably.
4. Conclusions
At present, research on the PAT mainly focus on the effect of geometric parameters and the fixed rotating speed on the performance, and there are few studies on the transition condition with variable speed. In this study, a user-defined function (UDF) was secondary development. Both large and small fluctuation transitions of variable rotation speed were calculated using the Newtonian second law. The numerical results were experimentally verified in stable flow conditions. Further, the variations in the external characteristics and internal flow fields of the PAT in the transition between different rotating speeds were studied under transient flow conditions. Finally, the following conclusions were obtained:
During a transient flow condition, the rotating speed of the impeller does not increase linearly with the increment in flow. In the ranges of low flows and rotating speeds, there is a little and steady increment at the moment on the impeller with a slow increment in the rotating speed. After the flow reaches 70 m3/h, the moment on the impeller rapidly increases, and the rotating speed of the impeller also increases sharply. This trend of being gentle first and then sharp in the rotating speed increment is due to the lagging of moment variation caused by the inertial force of the water flow. Particularly, after the flow exceeds the rated flow (80 m3/h), the torque of the impeller becomes extremely unsteady. To improve the operational stability of the PAT, pay attention to flow variation during times of high flow and try to avoid flow transition when the flow exceeds the rated flow. To prevent an excessive increase in rotating speed, the PAT unit can be equipped with a clutch and speed variation unit.
The efficiency variations of the PAT in the ranges of low flows and low rotating speeds are disordered without evident cyclicity. The efficiency in the transition condition started a cyclic growth after the flow reached 60 m3/h, and it reached a peak at around 80 m3/h, which was about 5% lower than the calculated value in a quasi-steady state. The same flow variation has a significant impact on the water head and shaft power in the range of high flows. By reducing flow fluctuation when the rotating speed is high, the PAT can operate stably and efficiently.
In addition, eddies are widely distributed inside the impeller, while in the flow channel of the impeller, they are unevenly distributed. There are large differences between the turbulence energy levels of eddies. This phenomenon is caused primarily by the centrifugal pump’s transient effect on fluid acceleration and flow inertia in the pump. Meanwhile, as the flow rate increases, the area with high turbulence energy at the impeller outlet expands, resulting in a reduction in the PAT’s efficiency. The flow in the centrifugal pump is complex during the transient acceleration.
Author Contributions
Conceptualization, K.W.; Methodology, J.H.; Software, G.H.; Validation, K.L.; Resources, G.H.; Data curation, L.X.; Writing—original draft, W.S. All authors have read and agreed to the published version of the manuscript.
Funding
This work is supported by the National Natural Science Foundation of China under grant number 51906224 and the Marine Economy Development Foundation of Guangdong Province (GDNRC[2022]44) Technical Support for Stimulation and Testing of Gas Hydrate Reservoirs.
Institutional Review Board Statement
This article does not contain any studies with human participants or animals performed by any of the authors.
Data Availability Statement
Not applicable.
Conflicts of Interest
The authors declare that they have no conflict of interest.
References
- Williams, A.A. Pumps as Turbines Used with Induction Generators for Stand-Alone Micro-Hydroelectric Power Plants; ProQuest LLC: Ann Arbor, MI, USA, 1992. [Google Scholar]
- Chapallaz, J.M.; Eichenberger, P.; Fischer, G. Manual on Pumps Used as Turbines; Informatica International, Incorporated: Redwood City, CA, USA, 1992. [Google Scholar]
- Buono, D.; Frosina, E.; Mazzone, A.; Cesaro, U.; Senatore, S. Study of a pump as turbine for a hydraulic urban network using a tridimensional CFD modeling methodology. Energy Procedia 2015, 82, 201–208. [Google Scholar] [CrossRef]
- Ansari, B.; Aligholami, M.; Rostamzadeh Khosroshahi, A. An experimental and numerical investigation into using hydropower plant on oil transmission lines. Energy Sci. Eng. 2022, 10, 4397–4410. [Google Scholar] [CrossRef]
- Landry, M.; Gagnon, Y. Energy Storage: Technology Applications and Policy Options. Energy Procedia 2015, 79, 315–320. [Google Scholar] [CrossRef]
- Kong, Y.; Kong, Z.; Liu, Z.; Wei, C.; Zhang, J.; An, G. Pumped storage power stations in China: The past, the present, and the future. Renew. Sustain. Energy Rev. 2017, 71, 720–731. [Google Scholar] [CrossRef]
- Goyal, R.; Gandhi, B.K. Review of hydrodynamics instabilities in Francis turbine during off-design and transient operations. Renew. Energy 2017, 116, 697–709. [Google Scholar] [CrossRef]
- Weiyun, S. Theoretical analysis of statistical characteristics of casing pressure at turbine load rejection in Tianhuangping pumped storage station. J. Hydroelectr. Eng. 2005, 24, 79–82. [Google Scholar]
- Chen, S.; Zhang, J.; Li, G.; Yu, X. Influence Mechanism of Geometric Characteristics of Water Conveyance System on Extreme Water Hammer during Load Rejection in Pumped Storage Plants. Energies 2019, 12, 2854. [Google Scholar] [CrossRef]
- Derakhshan, S.; Nourbakhsh, A. Experimental study of characteristic curves of centrifugal pumps working as turbines in different specific speeds. Exp. Therm. Fluid Sci. 2008, 32, 800–807. [Google Scholar] [CrossRef]
- Stefanizzi, M.; Torresi, M.; Fortunato, B.; Camporeale, S.M. Experimental investigation and performance prediction modeling of a single stage centrifugal pump operating as turbine. Energy Procedia 2017, 126, 589–596. [Google Scholar] [CrossRef]
- Tsukamoto, H.; Yoneda, H.; Sagara, K. The Response of a Centrifugal Pump to Fluctuating Rotational Speed. J. Fluids Eng. 1995, 117, 479–484. [Google Scholar] [CrossRef]
- Grover, R.B.; Koranne, S.M. Analysis of pump start-up transients. Nucl. Eng. Des. 1981, 67, 137–141. [Google Scholar] [CrossRef]
- Dazin, A.; Caignaert, G.; Bois, G. Transient behavior of turbomachineries: Applications to radial flow pump startups. J. Fluids Eng. 2007, 129, 1436–1444. [Google Scholar] [CrossRef]
- Tanaka, T.; Toyomoto, T.; Nasu, K. (Eds.) Transient Characteristics of a Centrifugal Pump at Rapid Startup. J. Phys. Conf. Ser. 2021, 1909, 012032. [Google Scholar] [CrossRef]
- Chalghoum, I.; Elaoud, S.; Akrout, M.; Hadj Taieb, E. Transient behavior of a centrifugal pump during starting period. Appl. Acoust. 2016, 109, 82–89. [Google Scholar] [CrossRef]
- Feng, J.; Ge, Z.; Zhang, Y.; Zhu, G.; Wu, G.; Lu, J.; Luo, X. Numerical investigation on characteristics of transient process in centrifugal pumps during power failure. Renew. Energy 2021, 170, 267–276. [Google Scholar] [CrossRef]
- Gülich, J.F. Centrifugal Pumps; Springer: Berlin/Heidelberg, Germany, 2008. [Google Scholar]
- Wu, D.; Wu, P.; Li, Z.; Wang, L. The transient flow in a centrifugal pump during the discharge valve rapid opening process. Nucl. Eng. Des. 2010, 240, 4061–4068. [Google Scholar] [CrossRef]
- Li, Z.; Wu, D.; Wang, L.; Huang, B. Numerical simulation of the transient flow in a centrifugal pump during starting period. J. Fluids Eng. 2010, 132, 081102. [Google Scholar] [CrossRef]
- Zhou, W.; Yu, D.; Wang, Y.; Shi, J.; Gan, B. Research on the Fluid-Induced Excitation Characteristics of the Centrifugal Pump Considering the Compound Whirl Effect. Facta Univ. Ser. Mech. Eng. 2021. [Google Scholar] [CrossRef]
- Zhang, D.S.; Shi, W.D.; Bin, C.; Guan, X.-f. Unsteady flow analysis and experimental investigation of axial-flow pump. J. Hydrodyn. Ser. B 2010, 22, 35–43. [Google Scholar] [CrossRef]
- Su, X.H.; Huang, S.; Zhang, X.J.; Yang, S. Numerical research on unsteady flow rate characteristics of pump as turbine. Renew. Energy 2016, 94, 488–495. [Google Scholar] [CrossRef]
- Li, X.; Chang, J.; Tang, X. (Eds.) New calculated theory of hydraulic machine installation transients in large pumped storage plant. In Proceedings of the 2011 International Conference on Electric Technology and Civil Engineering (ICETCE), Lushan, China, 22–24 April 2011. [Google Scholar]
- Wilcox, D.C. Reassessment of the scale-determining equation for advanced turbulence models. AIAA J. 1988, 26, 1299–1310. [Google Scholar] [CrossRef]
- Mao, J.Y.; Yuan, S.Q.; Pei, J.; Zhang, J.F.; Wang, W.J. Applications of different turbulence models in simulations of a large annular volute-type pump with the diffuser. IOP Conf. Ser. Earth Environ. Sci. 2014, 22, 022019. [Google Scholar] [CrossRef]
- Hu, J.; Su, X.; Huang, X.; Wu, K.; Jin, Y.; Chen, C.; Chen, X. Hydrodynamic Behavior of a Pump as Turbine under Transient Flow Conditions. Processes 2022, 10, 408. [Google Scholar] [CrossRef]


Disclaimer/Publisher’s Note: The statements, opinions and data contained in all publications are solely those of the individual author(s) and contributor(s) and not of MDPI and/or the editor(s). MDPI and/or the editor(s) disclaim responsibility for any injury to people or property resulting from any ideas, methods, instructions or products referred to in the content. |
© 2023 by the authors. Licensee MDPI, Basel, Switzerland. This article is an open access article distributed under the terms and conditions of the Creative Commons Attribution (CC BY) license (https://creativecommons.org/licenses/by/4.0/).