Article

Pore Structure Evolution in Sandstone of Underground Gas Storage during Cyclic Injection and Production Based on Nuclear Magnetic Resonance Technology

1
Key Laboratory of Underground Storage of Oil and Gas Engineer of China National Petroleum Corporation, Langfang 065007, China
2
State Key Laboratory of Geomechanics and Geotechnical Engineering, Institute of Rock and Soil Mechanics, Chinese Academy of Sciences, Wuhan 430071, China
3
University of Chinese Academy of Sciences, Beijing 100049, China
4
PipeChina West East Gas Pipeline Company, Shanghai 200120, China
*
Author to whom correspondence should be addressed.
Energies 2023, 16(5), 2096; https://doi.org/10.3390/en16052096
Submission received: 10 February 2023 / Revised: 17 February 2023 / Accepted: 20 February 2023 / Published: 21 February 2023
(This article belongs to the Section D: Energy Storage and Application)

Abstract

:
The underground gas storage (UGS) in depleted sandstone reservoirs forms the largest proportion of the UGS market in China. Multiple cycles of natural gas injection and production in the sandstone cause the rapid increase and drawdown of pore pressure, which may induce damage to the rock skeleton structure, and cause complex fluid flow paths in the sandstone reservoir. In this paper, transverse relaxation time (T2), nuclear magnetism resonance imaging, and high-pressure mercury intrusion analysis are combined to evaluate the variation in pore structure of medium-grained sandstone. The results show that cyclic injection and production of fluid leads to a slight increase in total pore volume, indicating that weak damage to rocks occurs. The T2 spectrum at the low pore pressure (10 MPa) and high pore pressure (25 MPa) both show that the shrinkage of the medium-size pores occurs after multiple cycles of injection and production. The pore volume of large-size pores was not highly correlated with the number of cycles. With the increase in pore pressure, the pore volume ratio under high pore pressure increased with the number of cycles, while it fluctuated strongly under low pore pressure.

1. Introduction

Underground gas storage (UGS) is essential to the natural gas supply security by playing the natural gas emergency peak shaving and strategic reserves for many countries such as China, Germany, etc. [1]. The annual peak shaving gap of natural gas has exceeded 60% in China, making the Chinese government promote the construction of underground gas storage engineering to improve gas storage peak shaving capacity.
Superior underground gas storage engineering is characterized by large storage space, high permeability, and good sealing performance [2,3], which are significant factors during site selection, construction, and operation. The pore structure, which is the main controlling factor for the estimation of storage space and geological sealing, includes the pore size, spatial distribution of pores, and the geometry and connectivity of the internal pore throat of rocks. The pore structure of the reservoir directly affects the permeability, and works together with stress sensitivity, edge and bottom water intrusion, and change in fluid properties to lead to liquid retention [3], which restricts the effective gas storage capacity, well network arrangement, and the injection and production schemes of the UGS [4,5].
There are many methods for determining the microscopic pore structure of rocks. The conventional methods include optical microscopy used in thin section identification [6], scanning electron microscopy (SEM) [7,8], and the mercury intrusion method, etc. [9]. The unconventional methods include computed tomography (CT) scanning method [10], gas adsorption method, constant velocity mercury intrusion method, and nuclear magnetic resonance technology, etc. [11]. Although optical microscopy can achieve mineral or pore magnification up to hundreds or even thousands of times, the field of vision is very small, resulting in large errors of statistical analysis. SEM has a high magnification (5–300,000 times), but it can only observe the surface of minerals or rocks. The maximum pore size measured by the adsorption method can generally reach 100–150 nm, but the results are inaccurate due to the damage to rocks. The highest mercury intrusion pressure is up to 200 MPa, meaning pore throat radii >4 nm are measurable. This method can reflect the pore size, distribution, and pore throat connectivity, etc., but it cannot record the variation in pore throat structure under real-time loading conditions.
The nuclear magnetic resonance (NMR) technology has been successfully applied in the studies of porosity, movable water saturation, irreducible water saturation, displacement and wettability of the porous media (sandstone, coal rock, mudstone, etc.) [12,13,14,15]. The changes in pore structure during the seepage process and gas or water flooding process can be tracked by using nuclear magnetic imaging [16]. Kenyon et al. [17] established the link between permeability and borehole NMR based on 60 water-saturated sandstone samples. Bu et al. [18] combined CT scanning, high-pressure mercury intrusion, nuclear magnetic resonance, stress sensitivity analysis, etc., to establish the correlation between microscopic pore radius and maximum connected throat pore radius and porosity and permeability. Bencsik and Ramanathan [19] used gas phase magnetic resonance imaging (MRI) to study the local hydrodynamic permeability of a porous medium saturated with pure NMR visible gas. Baldwin and Yamanashi [20] applied MRI to follow the flow of oil and water through the core plug. Bai et al. [21] used the T2 spectrum and cumulative porosity to obtain the maximum and minimum relaxation time, semi-relaxation time, spectral peak relaxation time, interval pore component, maximum porosity component, skewness, and other characteristic parameters, and the classification standard of reservoirs in the Nanpu sag was established. Wang [22] studied the distribution characteristics of the transverse relaxation time spectrum and pore throat size of sandstone samples under different loadings, showing that the number of micropore throats increases with the loading, while the number of large and medium-sized pore throats decreases. With the continuous increase in loading, the number of pore throats increases, and cracks propagate until failure. Almenningen et al. [23] investigated the effect of magnetic field strength on the transverse relaxation time in different lithologies under both low and high field strengths.
In this paper, the high-pressure mercury intrusion method and electron microscopy method are combined with the nuclear magnetic analyzing system that can realize the displacement in rocks under the specific confining pressure, thus revealing the variation of pore structure in the sandstone samples obtained from underground gas storage engineering. The variation in pore structure during the complete process of fluid injection and production was analyzed, which is helpful for the accurate estimation of effective storage capacity of natural gas in porous media during cyclic injection and production.

2. NMR-Based Pore Structure Analytical Method and Classification of Clastic Reservoir

2.1. NMR-Based Pore Structure Analytical Method

Relaxation refers to the transition of the nucleus from an excited state to an equilibrium state during the spin motion. There are three relaxation mechanisms for fluids in the pores of rocks: free relaxation, diffusion relaxation, and surface relaxation. Relaxation can be divided into transverse relaxation and longitudinal relaxation according to the mechanism. The longitudinal relaxation time (T1) is the time elapsed by the magnetization vector where the macroscopic magnetization vector increases from zero to the maximum. The transverse relaxation time (T2) refers to the decay time of the magnetization vector from the maximum value of excited state to zero, as denoted by Equation (1):
1 T 2 = 1 T f + 1 T s + 1 T d
where, T f , T s and T d are transverse free relaxation time, transverse diffusion relaxation time, and transverse surface relaxation time, respectively.
According to the relaxation mechanism of nuclear magnetic resonance, the surface relaxation using water as the pore fluid is much faster than that of free relaxation, and so the free relaxation can be ignored. When the external magnetic field is uniform and stable, the corresponding magnetic field gradient is small, and the diffusion relaxation can also be ignored. There are commonly four types of NMR pulse sequence applied to the rock samples, including the pulsed field gradient spin echo (PGSE), the pulsed field gradient stimulated echo (PGSTE), bipolar pulsed field gradient spin echo (BPGSE) and the Carr–Purcell–Meiboom–Gill sequence (CPMG) [24]. The dephasing would be reversed in a spin echo measurement (CPMG) if the protons are stationary during the echo train, but diffusion through the gradients hinders re-establishment of the phase coherence [23]. Therefore, the transverse relaxation time of the porous medium can be simplified in Equation (2):
1 T 2 = ρ 2 ( S V ) pore
where S is the pore surface area of rocks (m2) and V is the pore volume (m3). ρ 2 is the transverse surface relaxivity, characterizing the affinity between pore walls and fluid molecules, which depends on many factors such as fluid type, mineralogy of the interface, pore size, internal gradient, temperature, and pressure [24,25,26]. The magnitude of transverse relaxation time T2 of rocks is mainly determined by the ratio of the surface area to volume of the pores (S/V). For the spherical pores, S/V = 3/r, where r is the pore radius. For pores that can be simplified to spherical and columnar pipes, Equation (2) can be further simplified to the relationship between the transverse relaxation time T2 and the pore radius r of rocks in Equation (3) [27]:
1 T 2 = ρ 2 r F S
where r is the pore radius (m) and FS is the geometric shape factor (-). For spherical pores, FS = 3. For columnar pores, FS = 2. The T2 distribution can reflect the pore size and pore distribution. The pore size is related to the position of the spectral peak, and the number of pores with different pore size is related to the size of peak area. It can be seen from Equations (1)–(3) that the pore radius is proportional to the T2 value, that is, the larger the transverse relaxation time value, the larger the pore size, and vice versa. Kleinberg and Horsfield [28] thought that the grain surface transverse relaxation strength ρ2 in rocks is independent of the Larmore frequency, and is a variable parameter. The transverse surface relaxation strength ρ2 of rocks often ranges from 1 to 10 μm/ms. The appropriate surface relaxation intensity is key in using the T2 spectrum to analyze pore radius in practical applications. The change in ρ2 will affect the value of pore radius r. When ρ2 is small, it demonstrates that the number of micropores is large and the number of large pores is few. When the value of ρ2 is large, the number of micropores decreases and the number of macropores increases. This leads to differences in the proportion of pore distribution with different pore sizes. However, the difference only affects the pore size division range of the rocks, but does not affect the correlation of pore distribution.
According to the relationship between the pore radius r of the rocks and the transverse relaxation time T2 in Equation (3), the columnar pore model can be used. The value of Fs is 2, and the nuclear magnetic relaxation intensity ρ2 = 5 μm/ms is used to calculate the pore radius with Equation (4):
r = 10 T 2
From Equation (4), the transverse relaxation time T2 spectrum of the rocks can be converted into a pore size distribution curve. The peak value determined by the high-pressure mercury curve can be used to validate the reliability of the pore size curve calculated from the T2 spectrum of NMR.

2.2. Classification of Clastic Reservoirs Based on Pore Throat Characteristics

The size of the pore throat is the fundamental factor determining the capillary pressure and permeability of rocks. The clastic reservoir can be divided into four grades according to the seepage characteristics (e.g., porosity and permeability), pore throat structure reflected by NMR, high pressure mercury intrusion, etc. (Table 1). The maximum connected pore throat of Class I reservoirs is larger than 1.2 μm, and the permeability is larger than 100 mD, which belongs to medium–high porosity and medium–high permeability. The maximum connecting pore throat of Class II reservoirs is 1.13–1.2 μm, and the permeability is 10–100 mD, which belongs to medium porosity and medium–low permeability reservoirs. The maximum pore throat of Class III reservoirs is 1.1–1.13 μm, and the permeability is 1–10 mD, which is mainly characterized by medium and low porosity and low permeability. The maximum connecting pore throat of Class IV reservoirs is smaller than 1.1 μm, and the permeability is smaller than 1 mD, which is mainly characterized by low porosity and low permeability.
At present, there is no consistent standard for the division of pore size distribution of rocks. The International Union of Pure and Applied Chemistry proposed the following classification standards for the pore diameter of rocks in 1994 [29]: micropore (<0.002 μm), mesopore (0.002–0.05 μm), and macropore (>0.05 μm). Chalmers et al. [30,31] proposed the following pore size division standards of rocks: small pore (<0.002 μm), medium pore (0.002–0.05 μm), and large pore (0.05–0.3 μm). For different rock types, the difference in pore size is obvious. Li et al. [32] divided the pores of sandstone into four levels: micropores (<0.1 μm), mini-pores (0.1–1 μm), mesopores (1–10 μm) and macropores (10–100 μm). In general, the pore size of sandstone is greater than 20 μm, and the pore throat size is greater than 2 μm. The pore throat size of the tight sandstone is between 0.03 and 2 μm, while the pore throat size of shale is between 0.005 and 0.05 μm. For some shale, the pore throat size can reach 0.1 μm.

3. Physical and Mechanical Properties of Specimen

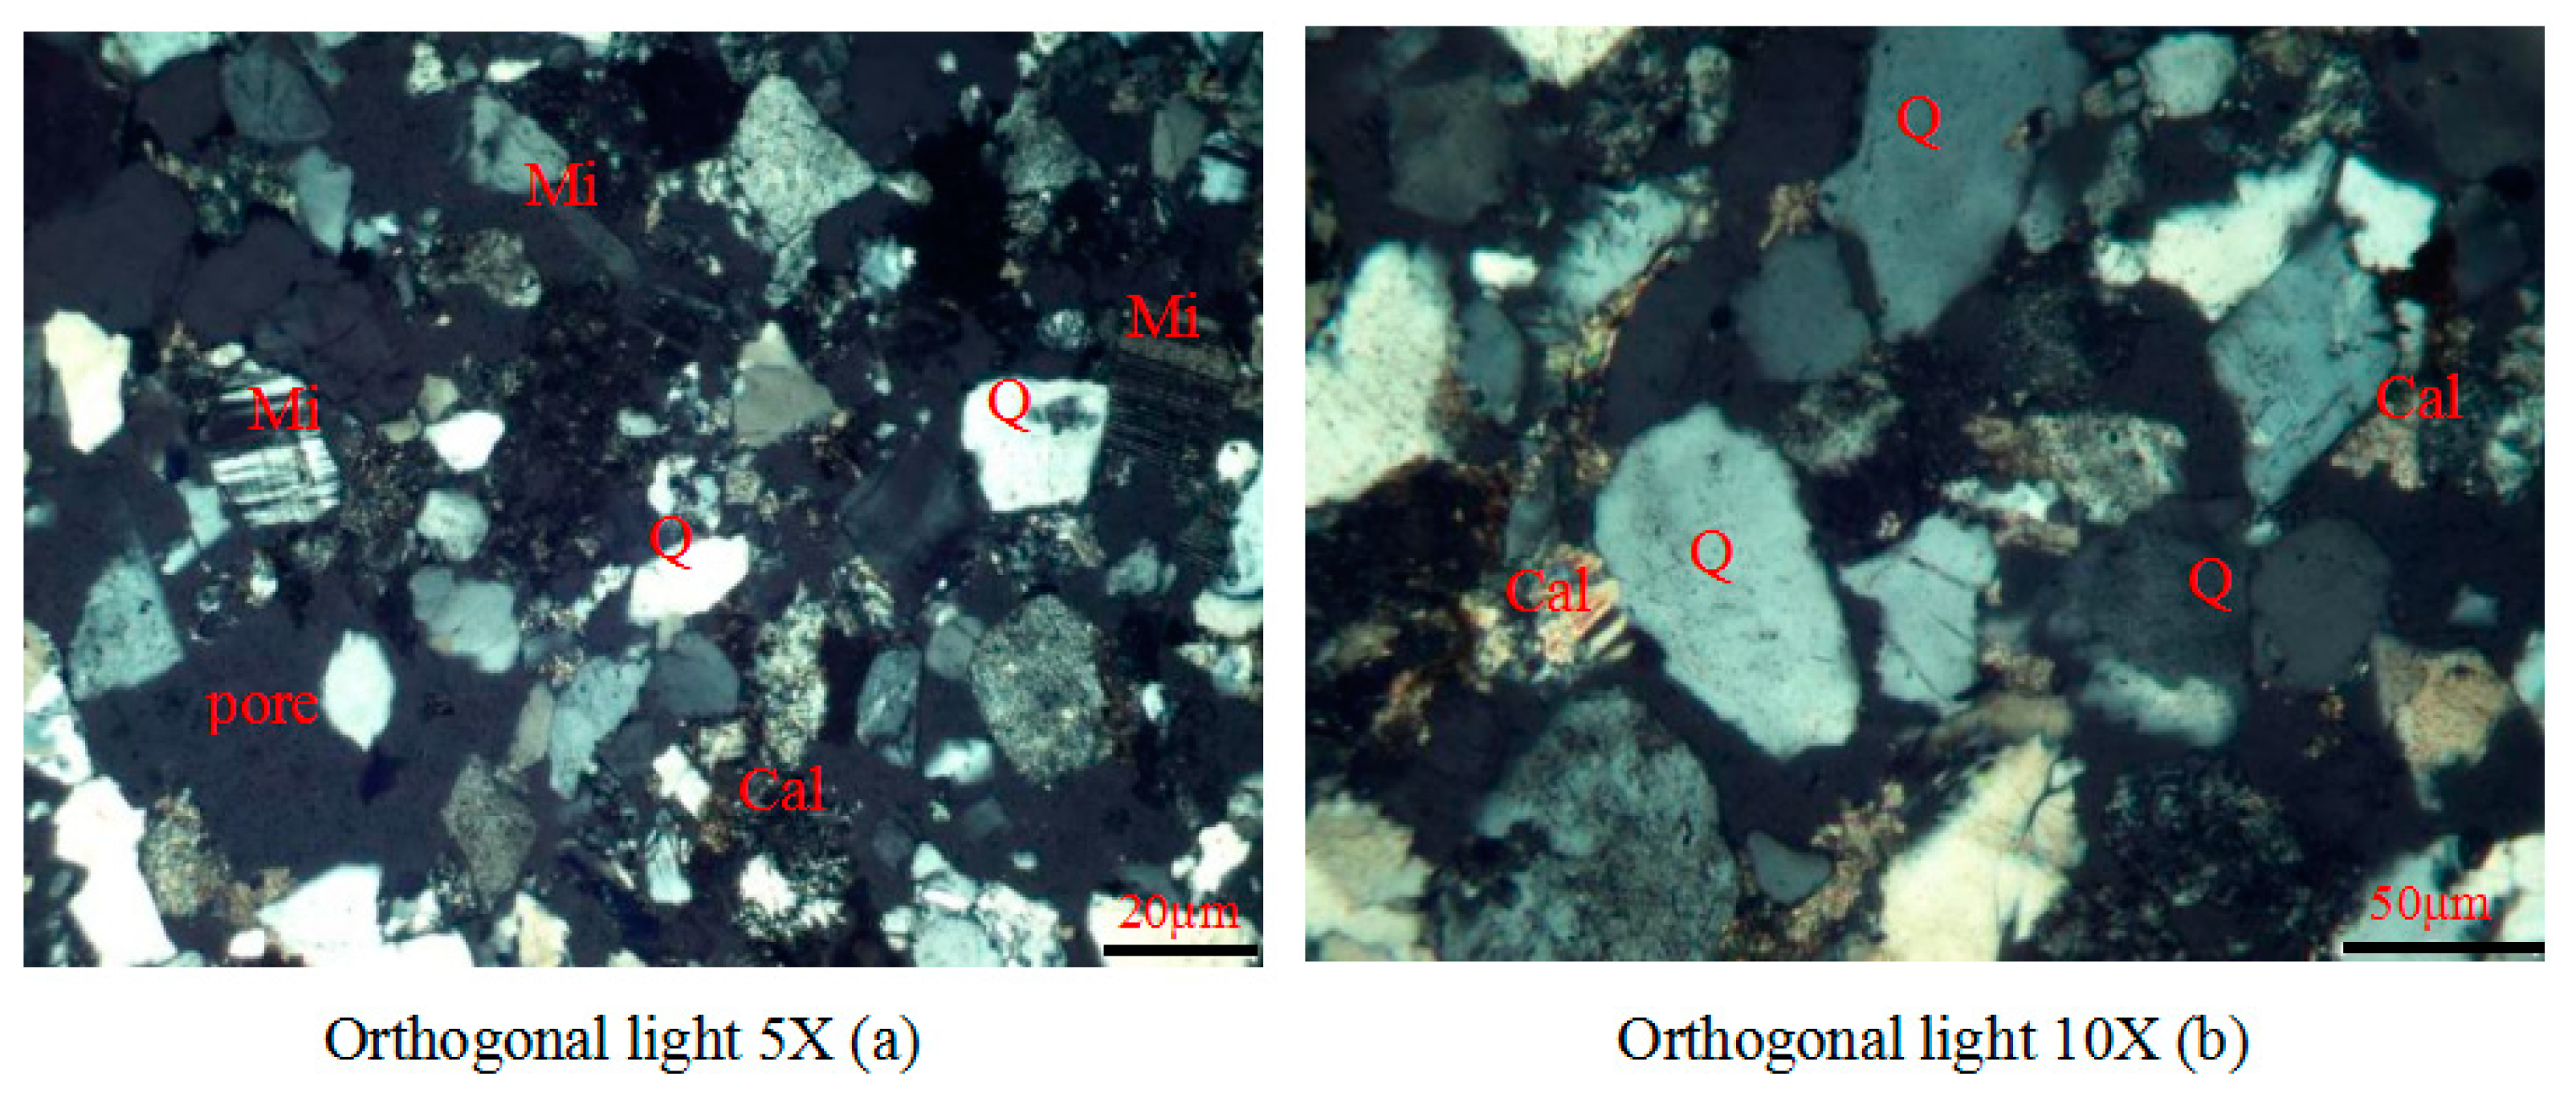
3.1. Mineralogy and Micro-Structure Characteristics

The sandstone core plugs were obtained from the working area of Shuang 6 gas storage, located in the Liaohe oilfield of China. The Shuang 6 gas storage, constrained by the Shuang 6 and Shuang 67 fault blocks, has been put into operation since April 2014, and there are nine cycles of natural gas injection and eight cycles of natural gas production [33]. The buried depth of the target reservoir, which consists of 18 sandstone sub-layers belonging to the Xinglongtai reservoir of the Cenozoic Shahejie formation, is 2400–2900 m, and it has the thickness of 175–200 m [34]. It is characterized by the subfacies of the fan delta front, rich in coarse sandstone and conglomerate sandstone. The porosity of the sandstone reservoir is 17.3% on average, and the permeability is 224 mD on average. The initial formation pressure is 24.27 MPa, and it drops to 5 MPa after depletion. The reservoir temperature is 88–90 degrees Celsius. The mudstone of the Dongying formation acts as the caprock, and the breakthrough pressure reaches 35–42 MPa. The maximum and minimum working pressure of the UGS are 24 MPa and 10 MPa, respectively [33]. The storage capacity of the UGS is designed for 5.75 billion m3. The working gas capacity is 3.22 billion m3, and the peak regulation capacity is 1.95 billion m3, and the daily gas production rate is 15 million m3.
The rocks obtained from the Shuang 6 gas storage are mainly characterized as grey-white in color. The lithology includes siltstone, fine-grained and medium-grained sandstone, conglomerate, etc. The German Bruker AXS D8-Focus X-ray diffractometer was used to analyze the mineral composition, and indicated that quartz, albite, and microclineclase feldspar are the typical felsic minerals, and illite and kaolinite are the main clay minerals of these samples. The fine-grained sandstone (#12-8) does not contain calcite, ankerite, or gypsum. The argillaceous sandstone (#10-21) is rich in illite and kaolinite, while there are small amounts of calcite and gypsum. There is a high content of ankerite in the siltstone (#12-22), while the highest content of calcite is found in the medium-grained sandstone (#11-5) (Table 2).
The density, pore volume, porosity, and permeability of some typical sandstone cores were tested, and the results are shown in Table 3. It shows that the density of the sandstone is in the range of 2020–2360 kg/m3, the porosity of siltstone is 8.35–13.32%, and the permeability is 0.565–2.133 mD. The porosity of the fine-grained sandstone is 3.7%, and the permeability is 9.553 mD. The medium-grained sandstone has a much higher porosity of 16.19–21.87%, and the permeability is about 50.12–65.14 mD. The porosity of the conglomerate is 17.59%, and the permeability is as high as 235.4 mD. Considering that the medium-grained sandstone is the main gas bearing medium in the Shuang 6 gas storage, the medium-grained sandstone was selected to study the evolution of pore structure under cyclic fluid injection and production. Microscopic observations show that the irregular quartz, albite, and microcline feldspar particles in the sandstone are cemented by calcite, while some pores are filled with kaolinite and illite (Figure 1).

3.2. Stress Sensitivity of Permeability in Medium Porosity Sandstone

A triaxial compression experiment using the MTS815 rock mechanics testing system was carried out on the sandstone (#11-5) to obtain the complete stress–strain curve (Figure 2). The failure of the sandstone occurred when the axial strain reaches 0.5%. Based on the complete stress–strain curve, the uniaxial compressive strength, elastic modulus, and the Poisson’s ratio were 23.8 MPa, 4.4 GPa, and 0.12, respectively.
The permeability of sandstone under overburden was measured using the MTS815 rock mechanics testing system with steady-state gas permeability test equipment as described by Ni et al. [35], and the stress sensitivity characteristics of sandstone were studied. In the experiments, the axial stress was set as 20 MPa, while the confining pressure gradually increased from 5.5 MPa to 40.5 MPa, and then gradually decreased to 5.5 MPa. The constant pore pressure was set at 0.5 MPa, and the effective confining stress is in the range of 5–40 MPa. The permeability of the sandstone was measured for a 5 MPa interval of effective confining stress.
It can be seen from Figure 3 that the permeability of sandstone decreased with the increase in stress, which is in accordance with the general law of stress sensitivity on different rocks [36,37]. Without the stress condition, the sandstone permeability was measured at 65 mD, while the permeability decreased to 38.2 mD under the effective confining pressure of 5 MPa. When the effective confining pressure reached 40 MPa, the permeability decreased to 35 mD. The permeability of sandstone during the pressure relief process was slightly lower than that of the pressurization process (<1 mD) for the same effective confining pressure, with a maximum difference of about 2%.

4. Experimental Set-Up

The variation in pore structure can be studied by analyzing nuclear magnetic transverse relaxation time during the process of pore pressure uplift and drawdown. Additionally, the damage characteristics of reservoir rocks during the cyclic injection and production process can be determined by the comprehensive analysis of nuclear magnetic imaging.

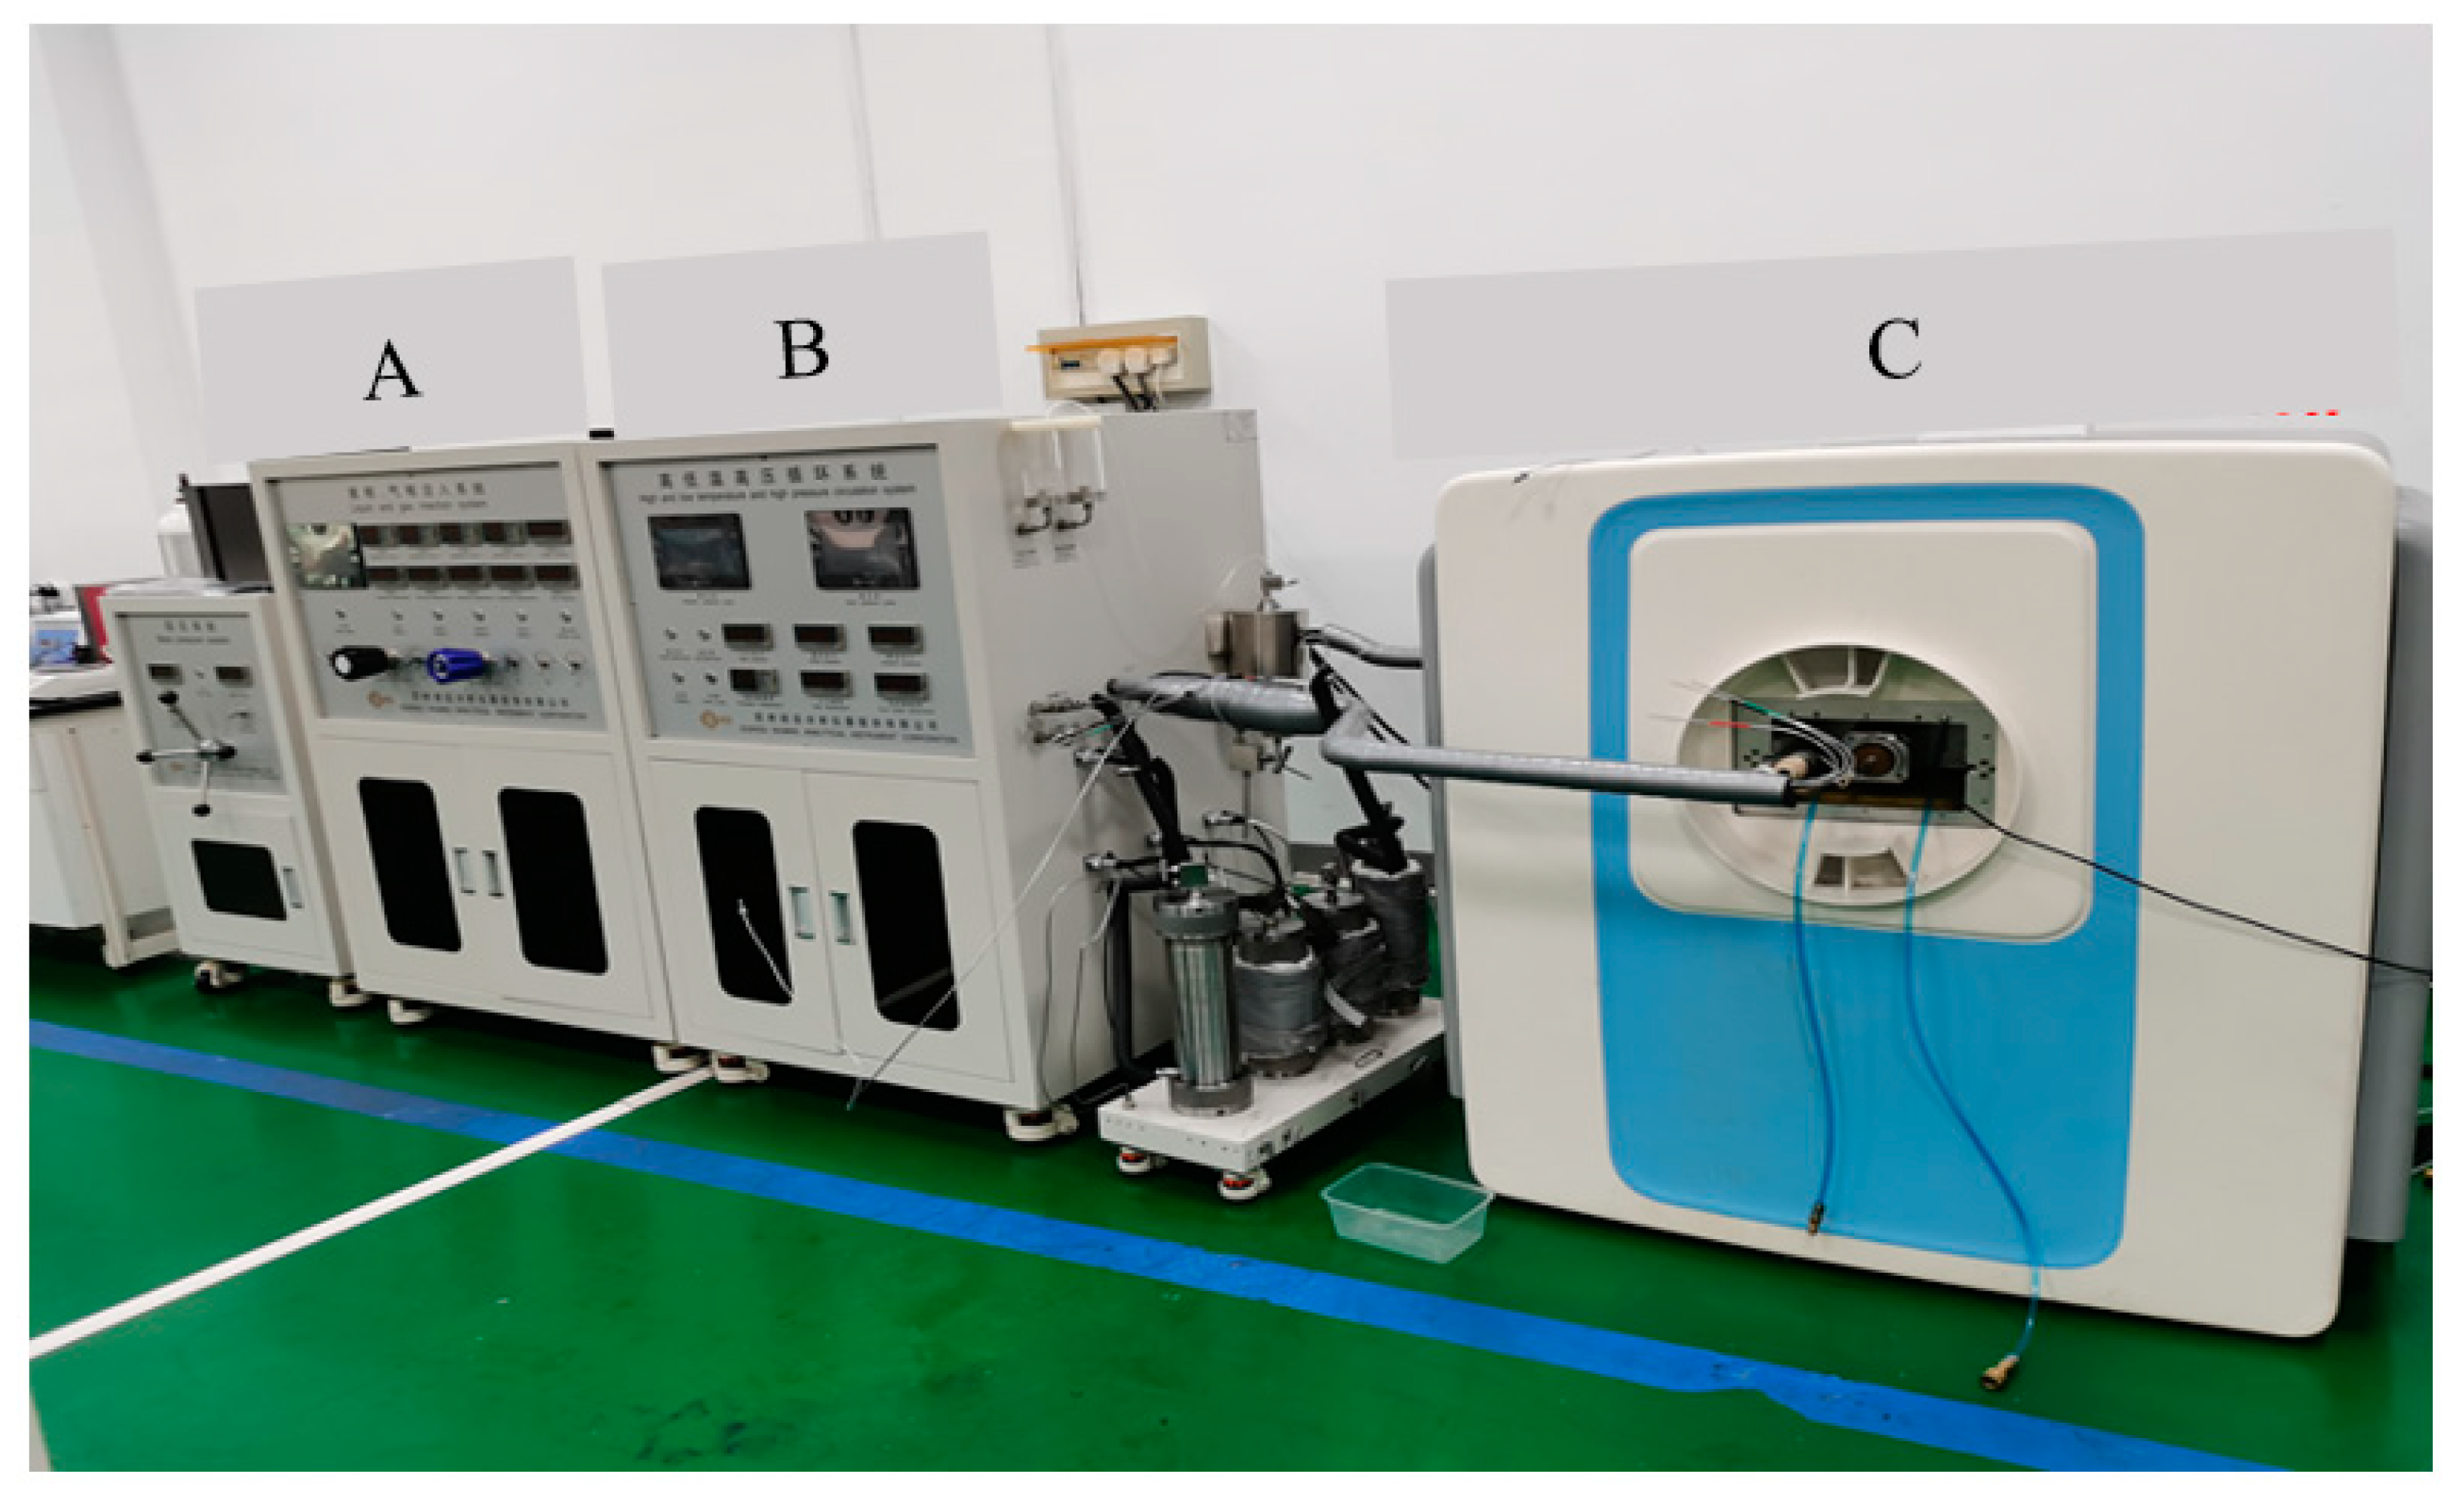
4.1. NMR Experimental System and Rock Preparation

The high-temperature and high-pressure displacement device combined with the low field NMR (resonance frequency of 12 MHz) and imaging system (MicroMR12-110H-GS-HTHP), was used in the experiments (Figure 4). The high-temperature and high-pressure displacement device consisted of (1) a liquid and gas injection system; (2) high and low temperature and high pressure circulation systems; and (3) the confining pressure-controlling system, with the maximum value of 40 MPa. During the experimental process, the magnetic temperature was set at 32 ± 0.01 °C, the field strength was 0.3, and the probe diameter was 25 mm.

4.2. Experimental Conditions

Before NMR testing, the rocks were vacuumized for 3 h, then they were fully water saturated for 12 h in the pressurized saturation device with the pressure at 20 MPa. Afterwards, the water-saturated rocks were moved into the displacement device, where the water was injected or extracted to adjust the pore pressure in the rocks, and the confining pressure was set. The displacement device was placed in the NMR testing system to record the NMR data under the specific conditions described as follows.
The condition of effective stress by the constant confining pressure and varied pore pressure was based on the field condition of the Shuang 6 gas storage located in the Liaohe oilfield, China. The effective minimum horizontal principal stress was about 26.4–33 MPa, and the effective maximum horizontal principal stress was about 41–51 MPa at the buried depth of the gas-bearing reservoir (i.e., 2400–2900 m). The operation formation pressure of the UGS was 10–24.8 MPa. Due to the limitations of the NMR analysis system with the maximum confining pressure of 40 MPa, the pore pressure alternated between 10 and 25 MPa, which is similar to the working pressure of the Shuang 6 gas storage. However, due to the limitations of the apparatus, the effective stress in the experiment was set at 15–30 MPa, which is lower than that of the Shuang 6 gas storage. In the experiment, high-frequency cyclic injection and production (i.e., 1.5 MPa/min) was used, and the confining pressure was kept at a constant of 40 MPa.
The nuclear magnetic data (T2 spectrum and NMR imaging) were recorded using the CPMG sequence at the specific points (e.g., at pore pressure of 10, 15, 20, and 25 MPa during the 1st, 6th, 10th, 20th, 30th, 40th, and 50th cycles of fluid injection and production) shown in Figure 5.

5. Results and Discussion

5.1. Pore Size Distribution Based on High-Pressure Mercury Tests

Experimental data from high-pressure mercury intrusion illustrates that the average pore size of the sandstone specimen is 0.135 μm, the median pore size is 3.3 μm, and the tortuosity is 3.64. The pore volume increment—pore size curve based on mercury intrusion experiments presented a three-peak pattern (Figure 6). The pore diameter ranges of 0–0.3 μm, 0.3–6 μm, and 6–11 μm can be used to divide the left, middle and right peak, respectively, reflecting that the sandstone specimen used in the experiment belongs to a typical class II reservoir. Combining the nuclear magnetic T2 spectrum curve in Figure 6, it shows that T2 = 0.6 ms equates to about 1 μm of macropore size, while T2 = 90 ms equates to about 10 μm in macropore size. There is a good correlation between the T2 spectrum data and the high-pressure mercury experiment for the large pores in the specimen, reflecting the pore size distribution.

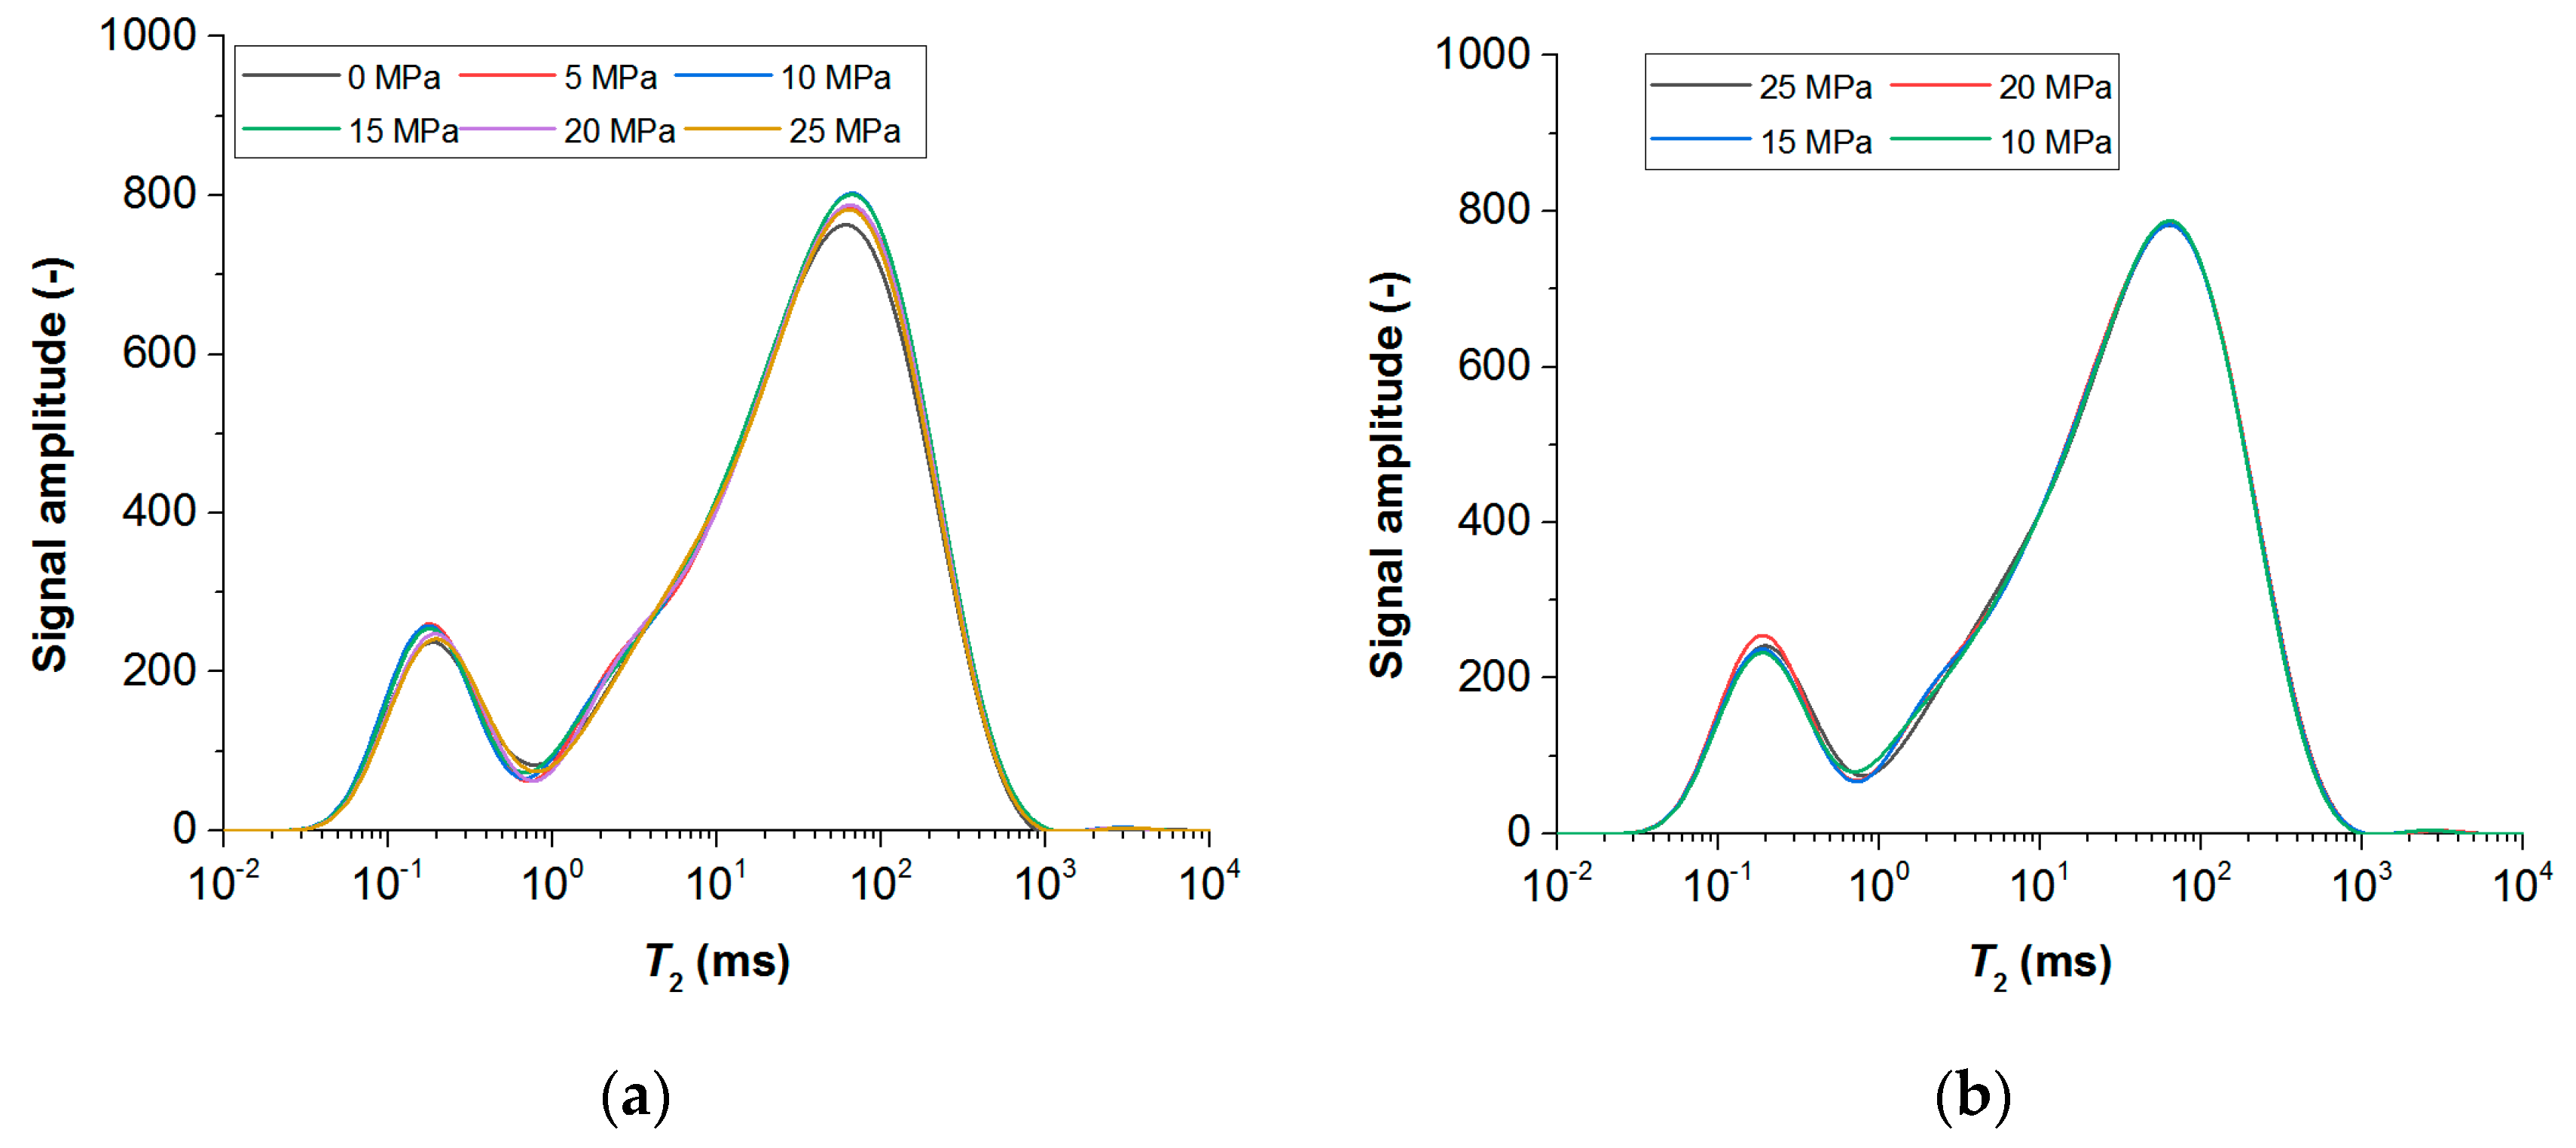
5.2. Peak Area and T2 Spectrum Variation in NMR Data

Table 4 lists parts of the data on the total nuclear magnetic spectral area, spectral peak area, and variation ratio (i.e., the spectral peak area after multiple cycles compared with the initial state). It can be seen that the first spectral peak area of NMR had an overall increasing trend with pore pressure when the cycles were the same. When the pore pressure was kept constant, the spectral area of peak 1 did not homogeneously increase with the number of cycles. The variation ratio of the spectral area for peak 2 was far less than that of the spectral area of the peak 1. It showed an overall decreasing trend with the increase in the injection–production cycles, and the maximum variation value was about 2.33%.
It can be seen that the T2 spectrum of the sandstone specimen has a wide range of distribution (Figure 7). The sandstone had a strong heterogeneity in pore structure, presenting a typical bimodal mode in the T2 spectrum, i.e., two intervals of 0.01–1 ms and 10–1000 ms of spectral peak relaxation time. During the first cycle of the fluid injection process, with the increase in injection pressure, the signal amplitude and volume of macropores increased. However, the increase in injection pressure had no obvious positive effect on increasing the volume of small and medium-sized pores (Figure 7a). During the first cycle of fluid production or pressure decrease process (25 MPa to 10 MPa), the variation in the volume of macropores was negligible, while the volume of mesopores tended to decrease (Figure 7b).
During the first cycle of pressure uplift and decrease, the NMRI characteristics at different pore pressures (Figure 8) imply that the distribution of cementation or pores between particles was heterogeneous. With the continuous increase in injection pressure, the signal strength in the local domain (e.g., A domain in Figure 8) increased obviously, reflecting the increase in macropore volume. As the number of injection and production cycles increased, there was a slight increase in the pore volume (Figure 9), especially in the local domain A.
The T2 spectrum at the high pore pressure of 25 MPa during different cycles of injection–production is shown in Figure 10a. It can be seen that the signal amplitude of the medium-sized pores changed significantly with the number of injection–production cycles, reflecting that the volume of the medium-sized pores increased significantly after multiple cycles of injection–production. The correlation between macropore volume and alternating cycles is strong, but the variation in macropore volume was small after 30 cycles of alternating injection and production. From the T2 spectrum at the low pore pressure of 10 MPa with different cycles (Figure 10b), it can be seen that the signal amplitude value of the medium-sized pore increased after five cycles, while it decreased significantly after ten cycles, followed by an increase in signal amplitude with the increase in the cycling number. This reflects that some medium-sized pores shrink after multiple cycles of fluid injection–production, but then the pore volume increases with the increase in pore pressure. However, there was a weak correlation between macropore volume and alteration cycles.

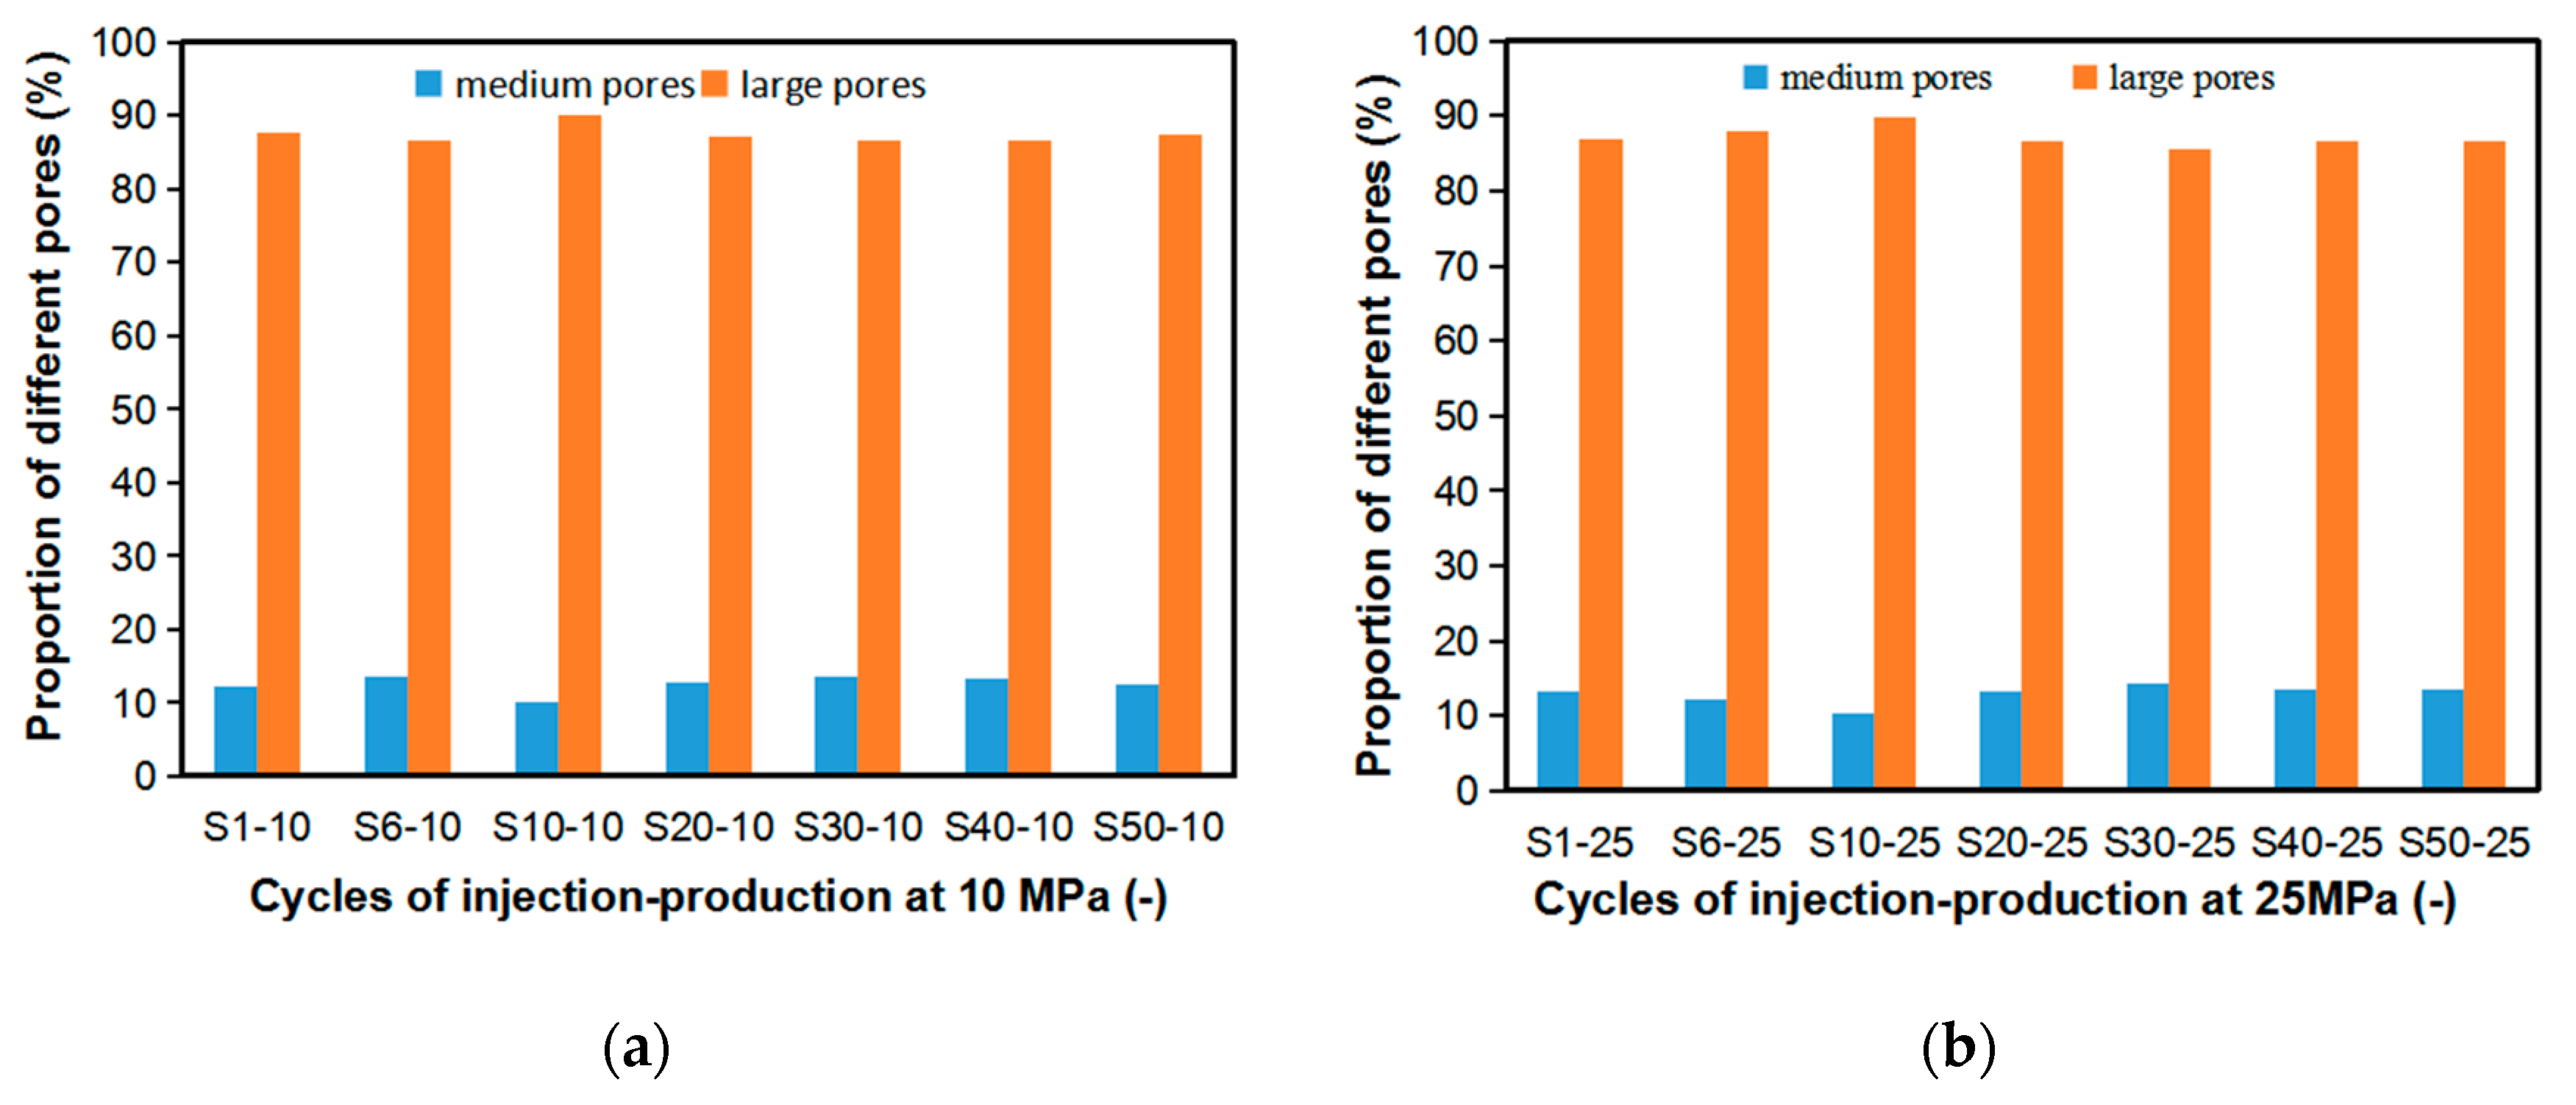
5.3. Proportion of Different Types of Pores under Different Cycles of Injection and Production

From the proportion of pores with two different sizes (i.e., medium and large) after different cycles of injection–production in the medium-grained sandstone specimen, it can be seen that macropores were the dominant type, accounting for more than 85%. The proportion of macropores increased by 2% after six cycles of fluid injection and production, but the overall variation was small (Figure 11a). After six cycles of fluid injection and production, the proportion of macropores increased by <3%, which is only 1% higher than that at the end of the fluid injection period (Figure 11b), implying that increasing the alteration cycles of the Shuang 6 gas storage may not lead to serious damage of the sandstone reservoir.

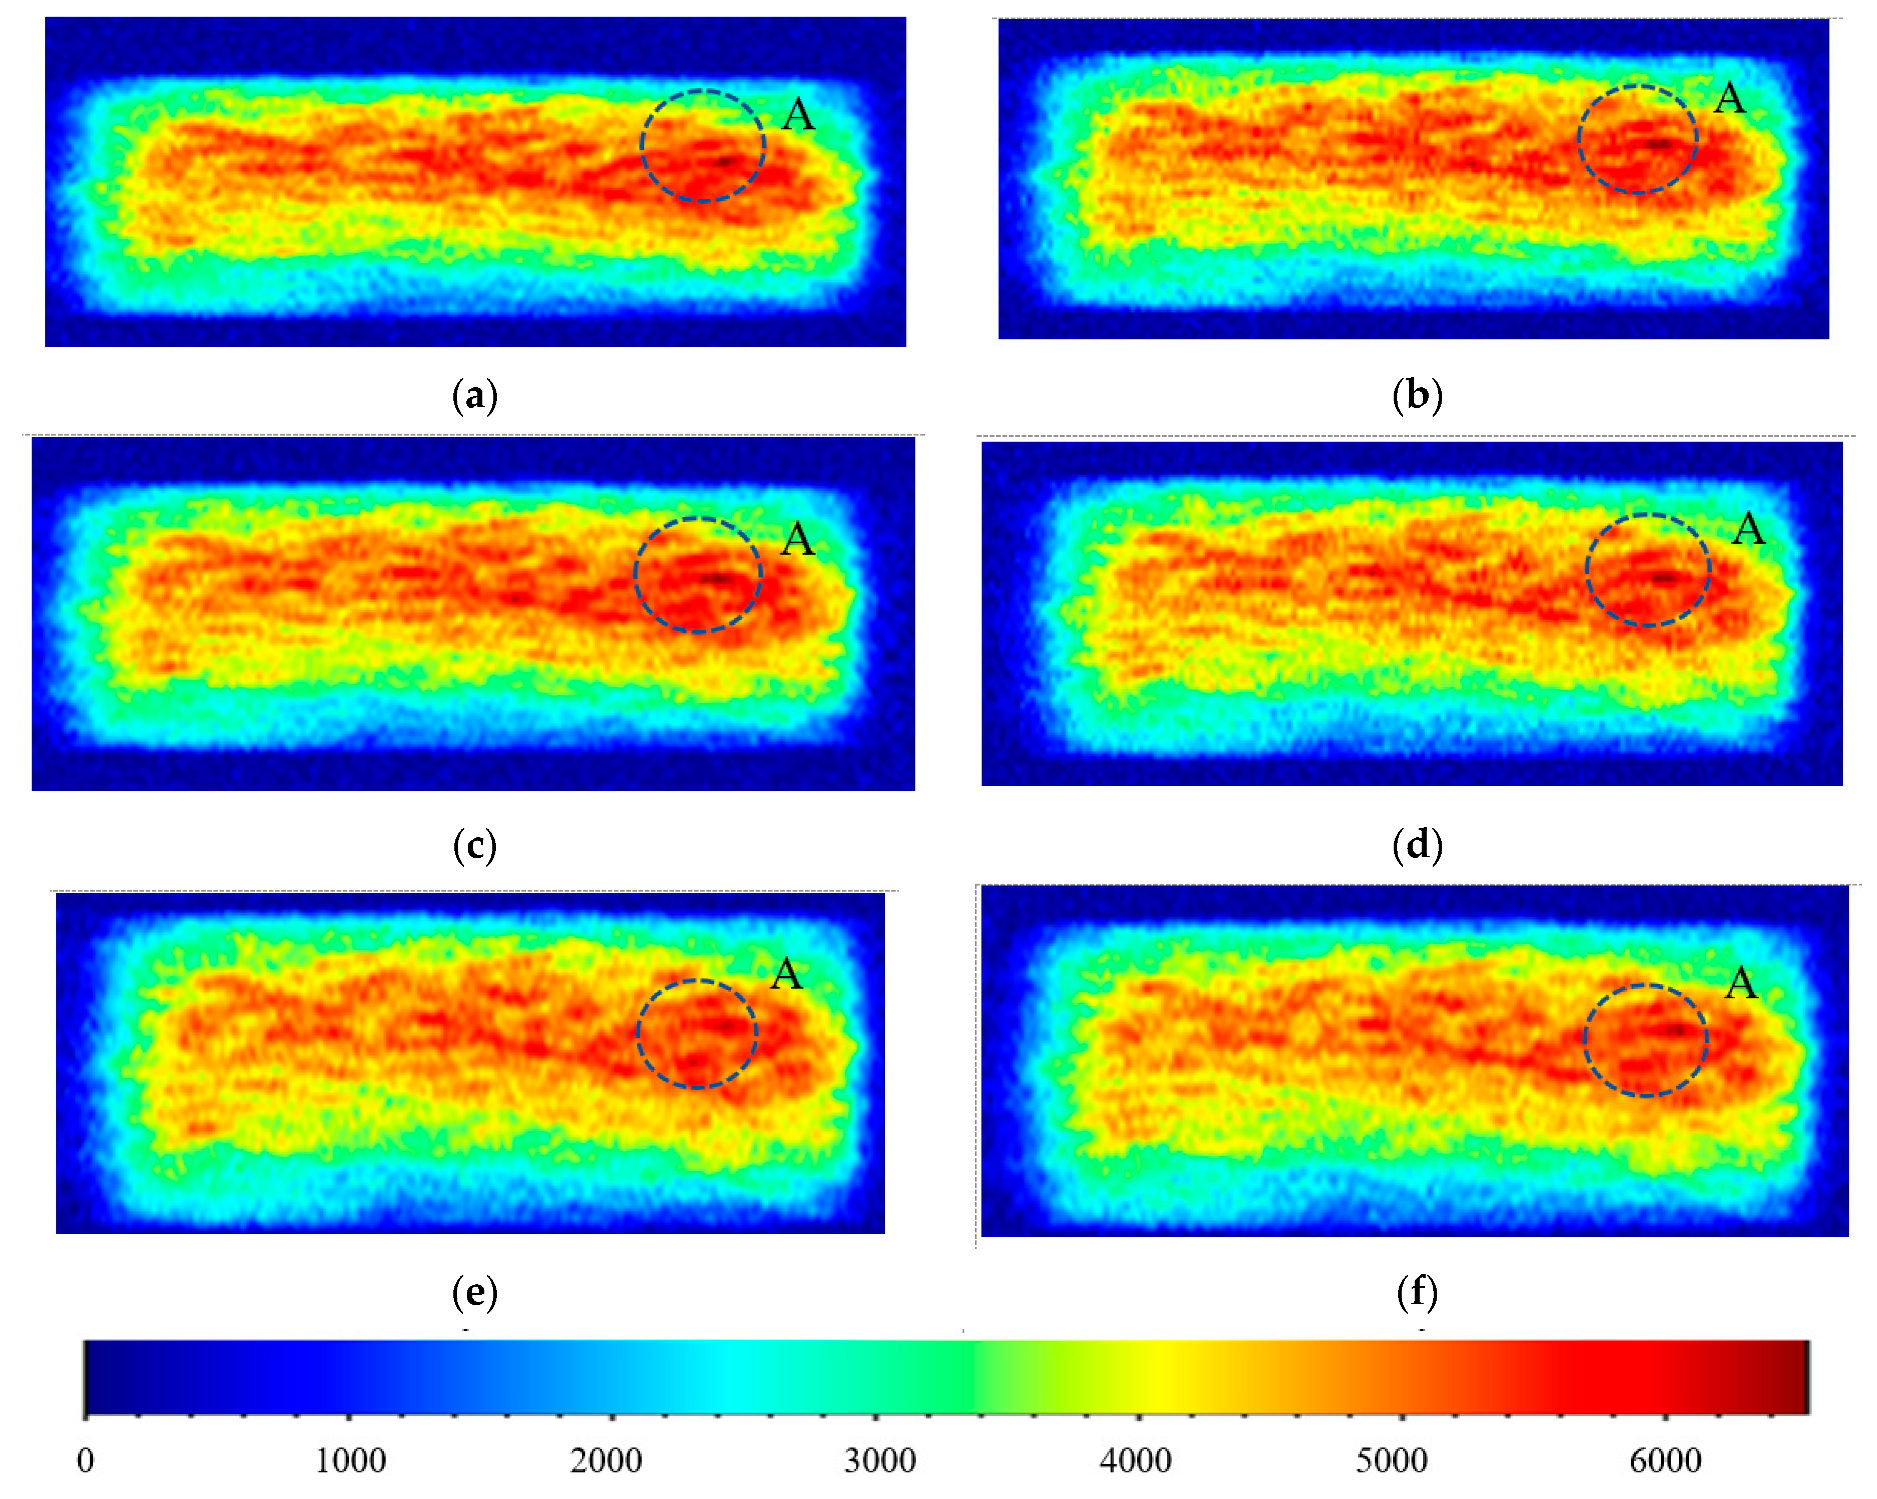
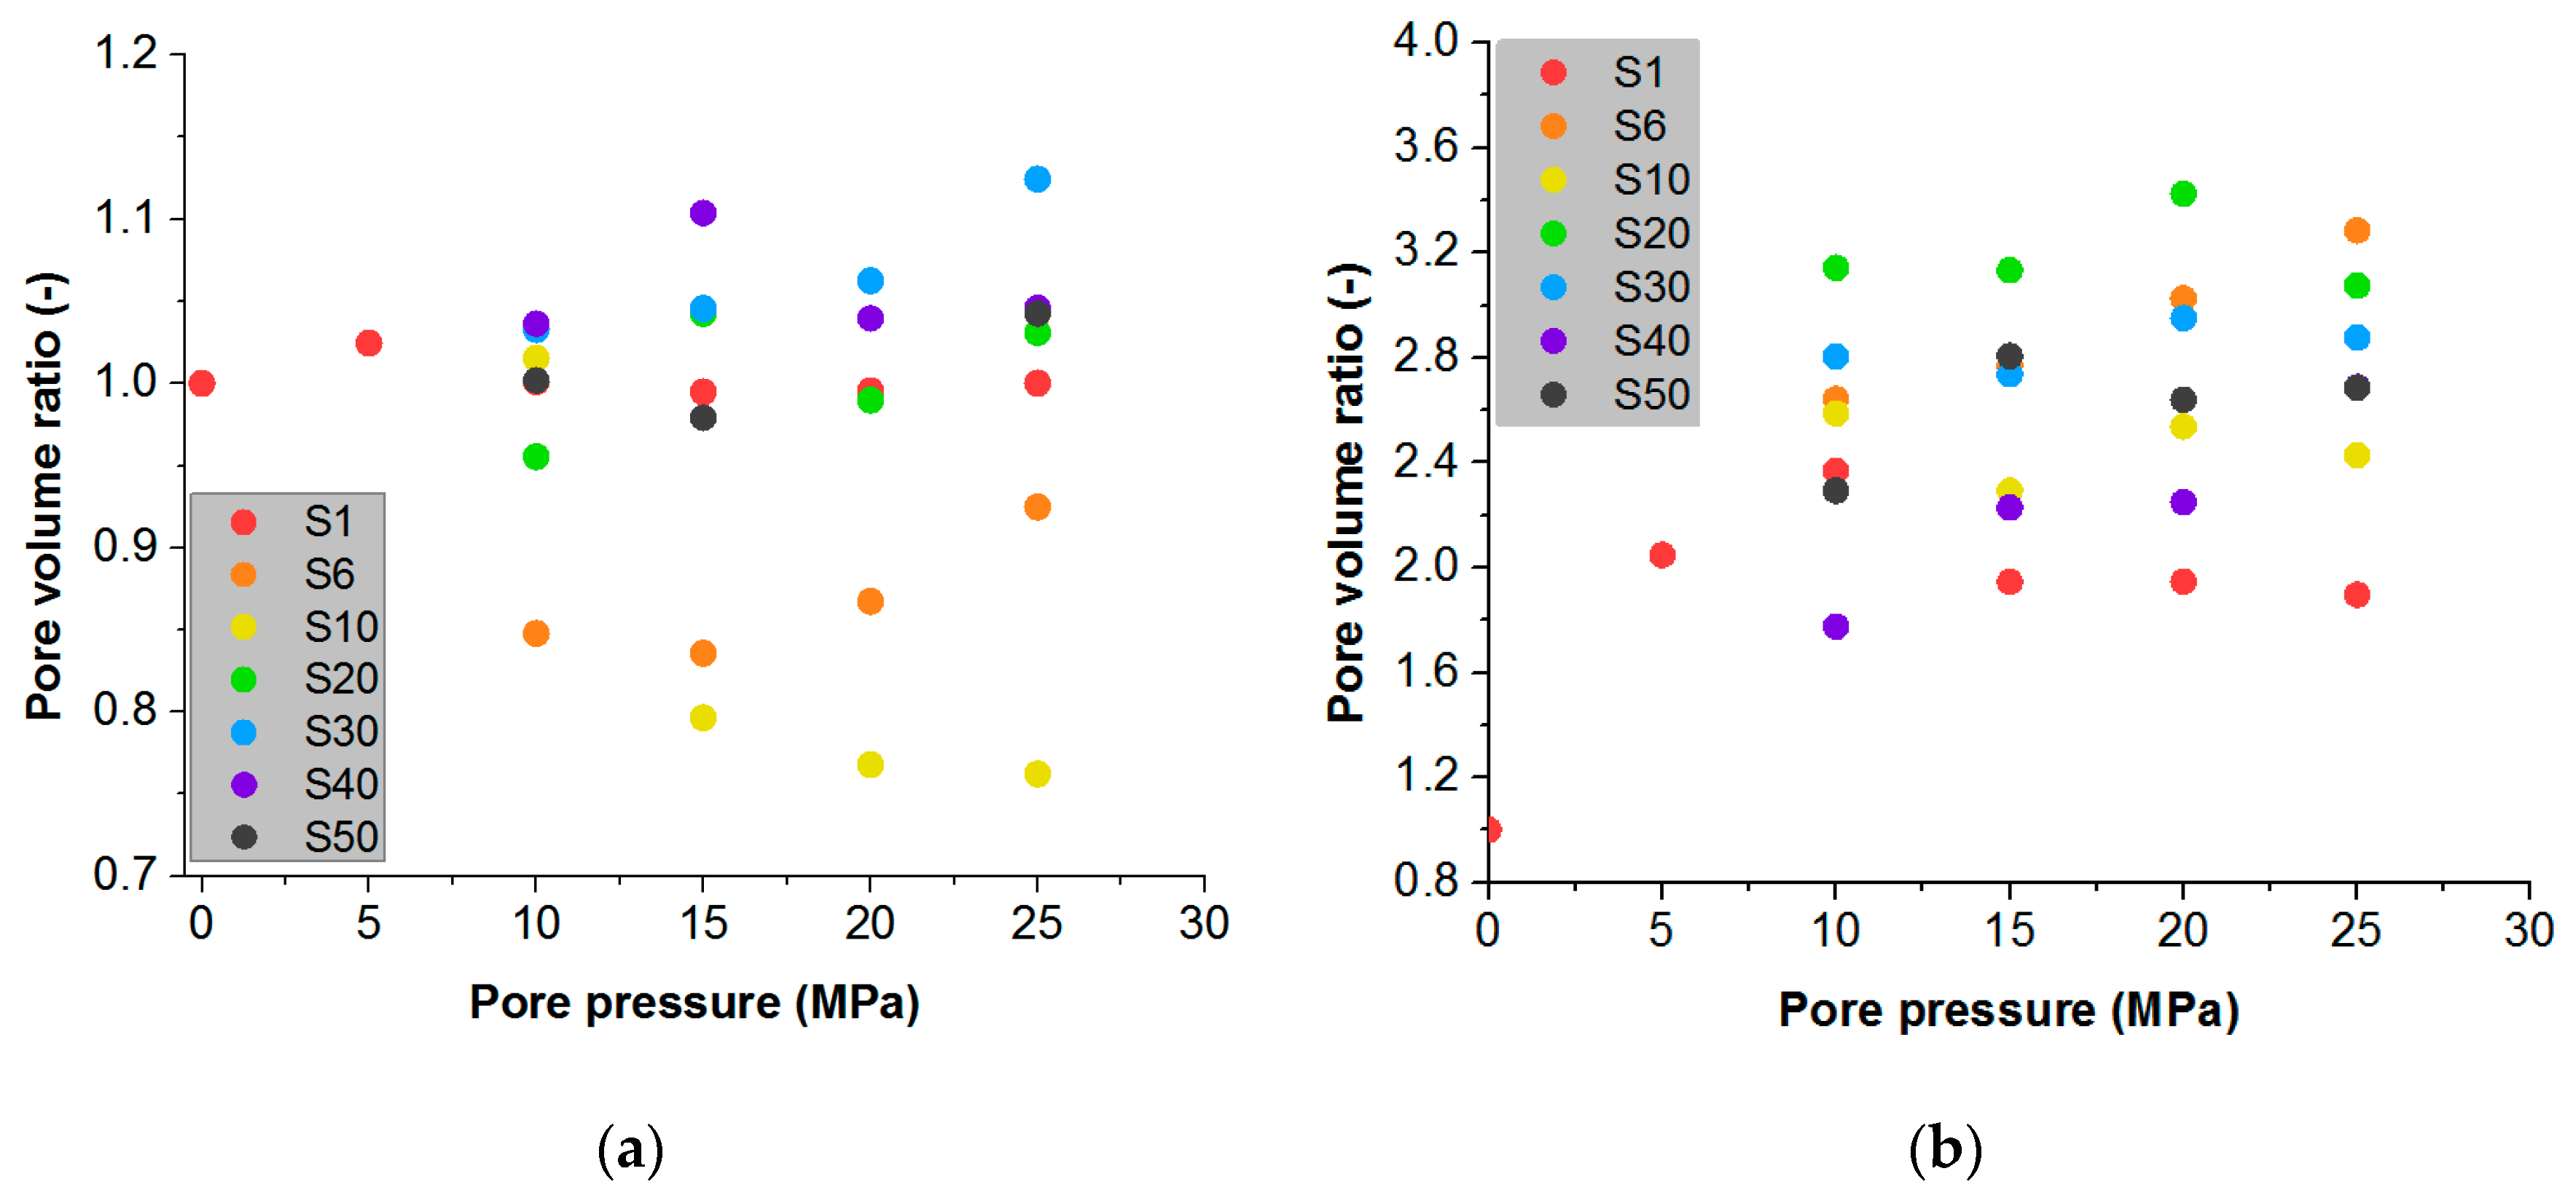
5.4. Rock Damage Evaluation

Here, we present the definition of the pore volume ratio (PVR) of the rock, which is the ratio of the NMR-based spectral peak area of rocks at a specific pore pressure and the number of alteration cycles to the spectral peak area of rocks at the in situ formation state. The decrease in PVR indicates that the rocks are subjected to compaction. That is to say, PVR > 1 indicates the increase in pore volume, implying structural and mechanical damage to rocks. During the fluid injection process, the correlation of the pore volume ratio and the pore pressure was weak for the medium pores, depending highly on the superimposed impact of alteration cycles (0.76 < PVR < 1.13). It should be noted that there was no linear relationship with the increase in the number of cycles. The volume of medium pores tended to increase after 30 alteration cycles of fluid injection and production. The variation interval of pore volume under the high pore pressure was larger than that under low pore pressure (Figure 12a). For macropores, 1< PVR < 1.05, indicating that the pore volume of macropores increased slightly after multiple cycles of fluid injection and production (Figure 12b).
The relationship of the total PVR and effective stress is shown in Figure 13a, demonstrating that the total PVR of the sandstone specimen was in the range of 0.95 and 1.05, and that a slight increase in pore volume occurred after multiple cycles of fluid injection and production. With the increase in effective stress, the PVR curves at different alteration cycles presented an obvious variation trend. During the first cycle of fluid injection and production, with the increase in effective stress (from 15 MPa to 25 MPa), the total pore volume showed a slight increase, but it declined slightly when the effective stress increased up to 30 MPa. After 6, 20, 30, and 40 cycles of fluid injection–production, the pore volume of the studied sandstone specimen decreased slightly with the increase in effective stress, which is in accordance with the general rule of stress sensitivity on pore volume (Hoseini et al., 2009; Zhou et al., 2022). After 50 cycles of fluid injection and production, the pore volume increased with the effective stress, implying that weak damage occurred (Figure 13a). Figure 13b shows the variation in pore volume ratio versus the cycles of fluid injection and production under the pore pressure of 10 MPa and 25 MPa. The data point of pore volume ratio under 10 cycles of fluid injection and production deviates greatly from the experimental trend and it is regarded as invalid data. The PVR at low pore pressure (e.g., 10 MPa) had a fluctuation after 30 cycles of alternated fluid injection and production. Overall, the pore volume ratio presents the power function correlation with the cycles of fluid injection and production (Figure 13b), meaning that a stable state occurred after the rapid increase.
The studies of pore throat structure in this paper are meaningful for the divisions of pore size for reservoir classification based on rock lithology. For sandstone in the underground gas storage (UGS), four levels are suggested based on the gas seepage ability, i.e., micropore (<0.1 μm), medium pore (0.1–1 μm), macropore (1–10 μm), and super-large pore (>10 μm). Large pores and super-large pores are conducive to gas seepage, and mesopores are conducive to gas accumulation. The micropores are usually molecular pores, which have no significant impact on gas seepage, and are difficult to distinguish using scanning electron microscopy.

6. Conclusions

Pore structure in reservoirs for the underground gas storage may have complex variation trends due to the alteration of pore pressure during the multiple cycles of injection and production. The real-time NMR-based pore throat structure analysis method was used to track the evolution of pore structure in the experiments, and some main conclusions were drawn as follows:
(1) From the perspective of natural gas seepage, it is suggested that the pore size of the sandstone reservoir is divided into four levels: micropores (<0.1 μm), medium pores (0.1–1 μm), large pores (1–10 μm), and super-large pores (>10 μm).
(2) The power function is useful to describe the correlation between the total pore volume and the cycling numbers of fluid injection and production, reflecting the weak damage to the sandstone that occurs. Along with the pore pressure impact, the superpositon of cycling numbers also plays an important role in controlling the pore throat structure. It presents different amplitude variation in the micro-structure of different scales of pores, and strong discreteness occurs for medium pores under various pore pressure conditions. There is a weak correlation between macropore volume and alteration cycles.
(3) After six cycles of injection and production, the proportion of large pores in the medium-grained sandstone increased by up to 3% at the end of production, implying that increasing the alteration cycles of the Shuang 6 gas storage may not lead to serious damage of the sandstone reservoir.
It should be noted that this paper mainly focused on the pore structure of the medium-grained sandstone obtained from the Shuang 6 gas storage during the cyclic injection and production process. In order to illustrate the variation law of sandstone reservoirs with different pore structures, the type I and III sandstone reservoirs will be studied in our future work. Methane will be used to adjust the pore pressure, which will be compared with the results of water-saturated sandstone.

Author Contributions

Conceptualization, X.Q. and H.L.; methodology, S.B. and H.L.; Formal analysis, M.L.; Investigation, H.M.; Resources, D.W.; Data curation, Q.Y.; Writing—original draft, X.Q.; Writing—review and editing, H.L.; Supervision, H.L. All authors have read and agreed to the published version of the manuscript.

Funding

This work was supported by the funding from the Pioneer Hundred Talents Program of Chinese Academy of Sciences (Y826031C01) and National Natural Science Foundation of China (U22A20166).

Data Availability Statement

The data presented in this paper are available on request from the corresponding author.

Conflicts of Interest

The authors declare no conflict of interest.

References

  1. Losson, L. Underground gas storage in the world-2022 status. CEDIGAZ Rep. 2022, 45. Available online: https://www.cedigaz.org/wp-content/uploads (accessed on 19 February 2023).
  2. Wang, C.; Liu, X.; Wang, H.; Li, Y. Research on sealing performance of special thread of tubing under complex load. J. Phys. Conf. Ser. 2022, 2230, 012034. [Google Scholar] [CrossRef]
  3. Shao, J.; You, L.; Kang, Y.; Gao, X.; Chen, M.; Meng, S.; Zhang, N. Experimental study on stress sensitivity of underground gas storage. J Petrol. Sci. Eng. 2020, 195, 107577. [Google Scholar] [CrossRef]
  4. Zhang, X.; Ma, X. Sealing capability evaluation and study of operation optimization of one natural gas storage in North China. In Proceedings of the International Petroleum and Petrochemical Technology Conference, Beijing, China, 27–29 March 2019; pp. 343–350. [Google Scholar] [CrossRef]
  5. Wang, J.; Li, Y.; Xu, S.; Li, C.; Wang, J.; He, R.; Wang, S.; Liu, J.; Xie, J.; Zhang, J. Change mechanism of pore structure and filling efficiency during injection production of sandstone underground gas storage. J. Nat. Gas Sci. Eng. 2022, 97, 104366. [Google Scholar] [CrossRef]
  6. Francus, P. An image-analysis technique to measure grain-size variation in thin sections of soft clastic sediments. Sediment. Geol. 1998, 121, 289–298. [Google Scholar] [CrossRef]
  7. Welch, N.; Gray, F.; Butcher, A.; Boek, E.; Crawshaw, J. High-resolution 3D FIB-SEM image analysis and validation of numerical simulations of nanometre scale porous ceramic with comparisons to experimental results. Transp. Porous Media 2017, 118, 373–392. [Google Scholar] [CrossRef] [Green Version]
  8. Liu, H.; Shi, Y.; Fang, Z.; Liu, J.; Zhang, L.; Tong, R. Seepage characteristics of thermally and chemically treated Mesozoic granite from geothermal region of Liaodong Peninsula. Envion. Earth Sci. 2021, 80, 599. [Google Scholar] [CrossRef]
  9. Wang, X.; Peng, Y.; Wang, J.; Zeng, Q. Pore structure damages in cement-based materials by mercury intrusion: A non-destructive assessment by X-ray computed tomography. Materials 2019, 12, 2220. [Google Scholar] [CrossRef] [Green Version]
  10. Faisal, T.F.; Awedalkarim, A.; Chevalier, S.; Jouini, M.S.; Sassi, M. Direct scale comparison of numerical linear elastic moduli with acoustic experiments for carbonate rock X-ray CT scanned at multi-resolutions. J. Petrol. Sci. Eng. 2017, 152, 653–663. [Google Scholar] [CrossRef]
  11. Xu, L.; Li, Q.; Myers, M.; Chen, Q.; Li, X. Application of nuclear magnetic resonance technology to carbon capture, utilization and storage: A review. J. Rock Mech. Geotech. 2019, 11, 892–908. [Google Scholar] [CrossRef]
  12. Gane, P.A.C.; Ridgway, C.J.; Lehtinen, E. Comparison of NMR cryoporometry, mercury intrusion porosimetry, and DSC thermoporosimetry in characterizing pore size distributions of compressed finely ground calcium carbonate structures. Ind. Eng. Chem. Res. 2004, 43, 7920–7927. [Google Scholar] [CrossRef]
  13. Coates, G.R.; Xiao, L.; Prammer, M.G. NMR Logging Principles and Applications; Gulf Professional Publishing: Houston, TX, USA, 1999. [Google Scholar]
  14. Mitchell, J.; Gladden, L.F.; Chandrasekera, T.C. Low-field permanent magnets for industrial process and quality control. Prog. Nucl. Magn. Reson. Spectrosc. 2014, 76, 1–60. [Google Scholar] [CrossRef] [PubMed]
  15. Yao, Y.; Liu, D. Comparison of low-field NMR and mercury intrusion porosimetry in characterizing pore size distributions of coals. Fuel 2012, 95, 152–158. [Google Scholar] [CrossRef]
  16. Wu, Z.; Lu, H.; Weng, L.; Liu, Q.; Shen, J. Investigations on the seepage characteristics of fractured sandstone based on NMR real-time imaging. Ch. J. Rock Mech. Eng. 2021, 40, 263–275. [Google Scholar] [CrossRef]
  17. Kenyon, W.; Day, P.; Straley, C.; Willemsen, J. A three-part study of NMR longitudinal relaxation properties of water-saturated sandstones. SPE Form. Eval. 1988, 3, 622–636. [Google Scholar] [CrossRef]
  18. Bu, T.; Cao, T. Study of pore structure and seepage characteristics of Shaximiao formation reservoir in ZJ gas field. J. Mineral. Petrol. 2018, 38, 104–112. [Google Scholar] [CrossRef]
  19. Bencsik, M.; Ramanathan, C. Direct measurement of porous media local hydrodynamical permeability using gas MRI. Magn. Reson. Imaging 2001, 19, 379–383. [Google Scholar] [CrossRef]
  20. Baldwin, B.A.; Yamanashi, W.S. Detecting fluid movement and isolation in reservoir core with medical NMR imaging techniques. SPE Reserv. Eng. 1989, 4, 207–212. [Google Scholar] [CrossRef]
  21. Bai, S.; Cheng, D.; Wan, J.; Yang, L.; Peng, H.; Guo, X.; Zeng, J. Quantitative characterization of sandstone NMR T2 spectrum. Acta Petrol. Sin. 2016, 37, 382–391, 414. (In Chinese) [Google Scholar] [CrossRef]
  22. Wang, S. The Evolution of Sandstone Pore Size under Different Pressures Based on NMR. Master’s Thesis, China University of Mining and Technology, Beijing, China, 2020. (In Chinese). [Google Scholar] [CrossRef]
  23. Almenningen, S.; Roy, S.; Hussain, A.; Seland, J.G.; Ersland, G. Effect of mineral composition on transverse relaxation time distributions and MR imaging of tight rocks from offshore Ireland. Minerals 2020, 10, 232. [Google Scholar] [CrossRef] [Green Version]
  24. Ge, X.; Myers, M.T.; Liu, J.; Fan, Y.; Zahid, M.; Zhao, J.; Hathon, L. Determing the transverse surface relaxivity of reservoir rocks: A critical review and perspective. Mar. Petrol. Geol. 2021, 126, 104934. [Google Scholar] [CrossRef]
  25. Keating, K.; Knight, R. A laboratory study to determine the effect of iron oxides on proton NMR measurements. Geophysics 2007, 72, 27–32. [Google Scholar] [CrossRef]
  26. Jaeger, F.; Bowe, S.; Van As, H.; Schaumann, G.E. Evaluation of 1H NMR relaxometry for the assessment of pore-size distribution in soil samples. Eur. J. Soil Sci. 2009, 60, 1052–1064. [Google Scholar] [CrossRef]
  27. Stingaciu, L.; Weihermüller, L.; Haber-Pohlmeier, S.; Stapf, S.; Vereecken, H.; Pohlmeier, A. Determination of pore size distribution and hydraulic properties using nuclear magnetic resonance relaxometry: A comparative study of laboratory methods. Water Resour. Res. 2010, 46, W11510. [Google Scholar] [CrossRef] [Green Version]
  28. Kleinberg, R.L.; Horsfield, M.A. Transverse relaxation processes in porous sedimentary rock. J. Mang. Reson. 1990, 88, 9–19. [Google Scholar] [CrossRef]
  29. Rouquerol, J.; Avnir, D.; Fairbridge, C.W.; Everett, D.H.; Haynes, J.H.; Pernicone, N.; Ramsay, J.D.F.; Sing, K.S.W.; Unger, K. Recommendations for the characterization of porous solids, International Union of pure and applied chemistry. Pure Appl. Chem. 1994, 68, 1739–1758. [Google Scholar] [CrossRef]
  30. Chalmers, G.R.L.; Bustin, R.M.; Power, I. Characterization of gas shale pore systems by porosimetry, pycnometry, surface area, and field emission scanning electron microscopy/transmission electron microscopy image analyses: Examples from the Barnett, Woodford, Haynesville, Marcellus, and Doig units. AAPG Bull. 2012, 96, 1099–1119. [Google Scholar] [CrossRef]
  31. Chalmers, G.R.L.; Bustin, R.M. Porosity and pore size distribution of deeply-buried fine-grained rocks: Influence of diagenetic and metamorphic processes on shale reservoir quality and exploration. J. Unconv. Oil Gas Resour. 2015, 12, 134–142. [Google Scholar] [CrossRef]
  32. Li, J.; Kaunda, R.; Zhou, K. Experimental investigations on the effects of ambient freeze-thaw cycling on dynamic properties and rock pore structure deterioration of sandstone. Cold Regions Sci. Technol. 2018, 154, 133–141. [Google Scholar] [CrossRef]
  33. Wang, J.; Shi, L.; Zhang, Y.; Zhang, K.; Li, C.; Chen, X.; Sun, J.; Qiu, X. Simulation of petroleum phase behavior in injection and production process of underground gas storage in a gas reservoir. Petrol. Explor. D 2022, 49, 1386–1397. [Google Scholar] [CrossRef]
  34. Li, J.; Meng, L.; Fu, X.; Jin, Y.; Jiang, M.; Liu, C. Analysis of efficient operation conditions of the Shuang 6 gas storage in Shuangtaizi oilfield, Liaohe Basin. China. Arab. J. Geosci. 2022, 15, 1486. [Google Scholar] [CrossRef]
  35. Ni, X.; Chen, Z.; Wang, P.; Wu, J.; Wu, Y.; Gong, P. Experimental investigation of the influence of differential stress, confining pressure and strain on aquifer sandstone permeability. Eur. J. Environ. Civ. Eng. 2020, 24, 915–930. [Google Scholar] [CrossRef]
  36. Hoseini, M.; Bindiganavile, V.; Banthia, N. The effect of mechanical stress on permeability of concrete: A review. Cem. Concr. Compos. 2009, 31, 213–220. [Google Scholar] [CrossRef]
  37. Zhou, J.P.; Deng, G.R.; Tian, S.F.; Xian, X.F.; Yang, K.; Zhang, C.P.; Dong, Z.Q. Experimental study on the permeability variation of sandstone at cyclic stress: Implication for underground gas storage. J. Energy Storage 2023, 60, 106677. [Google Scholar] [CrossRef]
Figure 1. Microstructure of the medium-grained sandstone in the study region (Mi—microcline, Qz—quartz, Cal—calcite).
Energies 16 02096 g001
Figure 2. Triaxial compressive stress−strain curve of medium porosity and medium permeability sandstone.
Energies 16 02096 g002
Figure 3. Variation in permeability of medium porosity and permeability sandstone with net confining pressure.
Energies 16 02096 g003
Figure 4. MicroMR12-110H-GS-HTHP NMR system with displacement and confining stress loading equipment (A—injection system, B—temperature and pressure control system, C—NMR system with the displacement device).
Energies 16 02096 g004
Figure 5. NMR experimental schematic during different cycles of fluid injection and extraction process (Pn-measuring points).
Energies 16 02096 g005
Figure 6. High−pressure mercury intrusion curve and T2 spectrum curve of sandstone (Vertical lines represent the dividing lines of three different sizes of pores).
Energies 16 02096 g006
Figure 7. Variation curve of transverse relaxation time (T2) during the first cycle of injection and production in sandstone ((a)—Pore pressure increase process; (b)—Pore pressure decrease process).
Energies 16 02096 g007
Figure 8. NMRI evolution of sandstone during the first cycle of fluid injection process (Note: large value of color code represents relatively large pore size, A domain in the circle shows the obvious variation). (a) P = 0 MPa. (b) P = 5 MPa. (c) P = 10 MPa. (d) P = 15 MPa. (e) P = 20 MPa. (f) P = 25 MPa.
Energies 16 02096 g008
Figure 9. NMRI evolution of sandstone at the end of production after different cycles of fluid injection and production (A domain in the circle shows the obvious variation). (a) Cycle 1. (b) Cycle 10. (c) Cycle 20. (d) Cycle 30. (e) Cycle 40. (f) Cycle 50.
Energies 16 02096 g009
Figure 10. Variation curve of T2 spectrum under two types of pore pressure after different cycles of fluid injection and production (a) 25 MPa; (b)10 MPa.
Energies 16 02096 g010
Figure 11. Proportion of the medium-sized and macropores in sandstone at the end of injection (a) and production (b) with different cycles.
Energies 16 02096 g011
Figure 12. Volume ratio of medium pores (a) and large pores (b) during the pore pressure increase process after different cycles of fluid injection–production.
Energies 16 02096 g012
Figure 13. Variation in volume ratio of total pores with effective stress (a) and cycles of injection–production (b).
Energies 16 02096 g013
Table 1. Classification of clastic rocks reservoir considering pore throat characteristics.
Class IClass IIClass IIIClass IV
Types of poresDissolution pores dominated, few cement and clay minerals Micropores dominated, followed by intergranular and intragranular pores Micropores dominatedMicropores dominated
Porosity>20%13–20%4–13%<4%
Permeability>100 mD10–100 mD1–10 mD<1 mD
Pore throat characteristicsGood pore connectivity, the maximum connecting pore throat is >1.2 µmThe pore throat radius is not large, with the maximum value of 1.13–1.2 µmThe maximum connecting pore throat is 1.1–1.13 µmThe maximum connecting pore throat is <1.1 µm
Reservoir typeHigh porosity and medium permeability reservoirMedium porosity and medium permeabilityMedium–low porosity and low permeabilityLow porosity and low permeability
Table 2. Mineral composition of typical reservoir rocks in the Shuang 6 gas storage.
Argillaceous SiltstoneMedium-Grained SandstoneFine-Grained SandstoneSiltstone
Illite19.75%6.10%4.51%8.26%
Kaolinite8.12%2.02%4.47%7.45%
Quartz25.65%29.81%11.95%20.33%
Microcline16.29%26.92%49.46%26.78%
Albite27.82%29.09%29.61%28.92%
Calcite1.04%6.05%--
Ankerite---8.26%
Gypsum1.33%---
Table 3. Density, porosity, and permeability of typical sandstone samples obtained from the Shuang 6 gas storage.
No.LithologyDensity (kg/m3)Pore Volume (cm3)Porosity(-)Permeability (mD)
8-8Siltstone23103.24413.322.133
10-21Argillaceous siltstone22002.60710.710.565
12-22-1Siltstone23602.1338.760.619
12-22-2Siltstone23502.0328.350.586
12-8Fine-grained sandstone21000.9013.79.553
10-27Medium-grained sandstone20205.32621.8750.12
11-5Medium-grained sandstone21503.91116.1965.14
13-26Conglomerate21404.28217.59235.4
Table 4. Spectral peak area of NMR test in sandstone under alternating pore pressures.
CyclesTotal Spectral AreaSpectral Peak Area 1 (SPA1)Variation Ratio of SPA1Spectral Peak Area 2 (SPA2)Variation Ratio of SPA2
S1-038,628.5473597.306-35,031.24-
S1-538,428.7113727.4973.62%34,701.214−0.94%
S1-2538,543.0953494.961−0.03%35,048.1330.05%
S6-2538,235.2244015.57111.63%34,219.653−2.32%
S10-2538,702.3333563.353−0.94%35,138.980.31%
S20-2538,243.9373481.076−3.23%34,762.862−0.77%
S30-2538,709.4753830.7566.49%34,871.83−0.46%
S40-2538,796.9193807.1425.83%34,979.926−0.15%
S50-2538,165.0643949.9069.80%34,215.157−2.33%
Note: For S6-25, S6 represents the 6 cycles, 25 represents the pore pressure at 25 MPa. Peak 1 corresponds to medium pores and peak 2 corresponds to large pores.
Disclaimer/Publisher’s Note: The statements, opinions and data contained in all publications are solely those of the individual author(s) and contributor(s) and not of MDPI and/or the editor(s). MDPI and/or the editor(s) disclaim responsibility for any injury to people or property resulting from any ideas, methods, instructions or products referred to in the content.

