Article

Lithofacies Characteristics and Their Effects on Shale Oil Enrichment: A Case Study from Shahejie Formation of the Qibei Sag, Bohai Bay Basin, China

1
PetroChina Research Institute of Petroleum Exploration and Development, Beijing 100083, China
2
PetroChina Dagang Oilfield Company, Tianjin 300280, China
*
Author to whom correspondence should be addressed.
Energies 2023, 16(5), 2107; https://doi.org/10.3390/en16052107
Submission received: 27 December 2022 / Revised: 26 January 2023 / Accepted: 2 February 2023 / Published: 21 February 2023

Abstract

:
The lithology and lithofacies assemblage of shale are highly complex and heterogeneous in the continental shale formations due to rapid changes in the sedimentary environment and source material, complicating the evaluation of shale oil enrichment areas, such as the member 3 of the Shahejie Formation in the Qikou sag, Bohaibay Basin, China. We used core observations and descriptions of well F39 × 1 and performed X-ray diffraction, scanning electron microscopy, nitrogen adsorption analysis, and nuclear magnetic resonance analysis to investigate the shale lithofacies characteristics and types in member 3 of the Shahejie Formation, and their effects on shale oil enrichment. The results showed the following. (1) The lithofacies are divided into four types according to the shale’s laminar structure, lithological characteristics, mineral composition, and organic matter content: thin laminar shale, thick laminar shale, massive mudstone, and argillaceous siltstone. These are divided into six subcategories. Each lithofacies has thin vertical layers. (2) The thin and thick laminar shale layers have favorable conditions for shale oil enrichment, such as a high total organic carbon content (TOC) (1.1–1.6%), many micropores (with the diameter of 0.5–2 µm) and fissures, a high residual hydrocarbon content (1.0–2.3 mg/g), and a good source-reservoir relationship, making them suitable for shale oil exploration. (3) The degree of lamina development influences the organic matter and residual hydrocarbon contents, the number of micropores, and the degree of shale oil enrichment. The semi-deep and deep lake facies are favorable areas for shale oil development.

1. Introduction

The United States has achieved rapid growth in crude oil production in recent years through the shale oil revolution, becoming the world’s top crude oil producer. The annual crude oil production reached 747 million tons in 2020 [1,2]. This advancement is closely related to the superior geological conditions of the marine shale formation, including the stable tectonics of the North American plate, resulting in the large-scale development of organic-rich shales. One example is the Middle Devonian Marcellus Shale in the Appalachian Basin, covering an area of 114,000 km2. There are large area and stable distribution reservoirs with high contents of brittle minerals, such as quartz and calcite, in marine shale formations. Their porosity exceeds 10% on average, and the compressibility of the formation is high, resulting in favorable geological conditions for shale oil enrichment [3,4,5].
Unlike the United States marine formations, the continental shale formations in China are characterized by complex and diverse lithologies, short lateral distances, and high heterogeneity, including mud shale, siltstone, tuff, dolomite, and volcanic rocks, which are difficult to analyze [6,7]. Petrographic analysis is a critical component of assessing the complex lithology of continental shale oil [8,9]. Lithofacies refers to the rocks or rock associations formed in depositional environments, including the lithology, mineral composition, and sedimentary structure [10]. Continental mud shales have complex and heterogeneous lithology due to rapid changes in the depositional environment of the lake basin and source material. The petrographic characteristics substantially influence the shale’s organic matter type and abundance, pore space development, brittle mineral content, and oil enrichment degree [11,12,13]. Analyses of the Gulong shale oil in Songliao basin, Eastern China, have shown that the petrographic characteristics of the shale formation significantly affect the total contents of organic matter (TOC) and residual hydrocarbons. The organic carbon and free hydrocarbon contents are higher in the laminar and foliated shales, and the laminar layers provide storage space and seepage channels. In contrast, silty and dolomitic shales have low TOC, resulting in low free hydrocarbon contents; however, their brittleness and porosity are relatively high, making them suitable for fracturing [14,15,16]. Therefore, it is of great significance and innovation to carry out the analysis of lithofacies characteristics and classification of continental shale, and to clarify their effects on shale oil enrichment in order to reveal the distribution law and heterogeneity of shale oil, and to carry out the evaluation and prediction of shale oil desserts.
Member 3 of the Paleogene Shahejie Formation(Es3) in the Qibei subsag of the Qikou sag, Baohai Bay basin, has semi-deep to deep lake facies, and the lithology is primarily mud shale with certain amounts of lime, dolomite, and silt [17,18,19], similar to the lithological characteristics of the Gulong Shale oil formation in the Qingshankou Formation, Songliao Basin [20]. The small area of the lake basin, the short sedimentary period, and the high variability of sedimentary facies in the longitudinal direction caused large petrographic variability of Es3, high heterogeneity in the organic matter and residual hydrocarbon contents, influencing the assessment of shale oil exploration areas. Scholars have analyzed the lithology, physical properties, and oil content of the shale oil formation in Es3 of the Qikou sag [17,21]. However, no systematic analyses of the lithofacies characteristics and their influence on shale oil enrichment have been conducted. This information is required to select target areas for shale oil development.
This study uses core observations, thin sections, X-ray diffraction (XRD), scanning electron microscopy (SEM), geochemical analysis, nitrogen adsorption analysis, mercury porosimetry, and nuclear magnetic resonance analysis to characterize the mud shale lithofacies in Es3. The effects of the lithofacies characteristics on organic matter enrichment and reservoir development of different lithofacies are clarified. The influences of residual hydrocarbon contents and source-reservoir relationship on shale oil enrichment in the lithofacies are investigated. The results can be used to select potential target areas for shale oil exploration in the continental shale formations.

2. Geological Setting

The Bohai Bay Basin is located in eastern China. It is a Mesozoic-Cenozoic continental fault basin developed on the basement of the Paleozoic North China Craton. Several depressions have developed due to an uplift from north to south in the basin, including the Liaohe, Bozhong, Changwei, Jiyang, Huanghua, Linqing, and Jizhong depressions. The Cenozoic is the main hydrocarbon formation in the basin. It is dominated by lacustrine clastic rocks, which have been deposited in the entire basin. The layers include, from the bottom to the top, the Kongdian Formation (Ek), Shahejie Formation (Es), Dongying Formation (Ed), Guantao Formation (Ng), Minghuazhen Formation (Nm), and Pingyuan Formation (Qp). The Qikou Sag is located in the northeast of the Huanghua Depression in the Bohai Bay Basin, adjacent to the Cangxian uplift in the west, the Kongdian-Yangsanmu uplift and Chengning uplift on the southern boundary, and the Shabeitian uplift on the northeastern boundary. This depression covers an area of 5200 km2 [21]. The Es3 contains a complete third-order sequence developed in the Paleogene of the Qikou sag. It is divided into three sections. The Qibei subsag is located in the south-central part of the depression. The Es3 is characterized by semi-deep and deep lake facies, with locally shallow lake facies and depositions of dark mud shale with thin layers of siltstone and dolomitic rocks. This is the main source rock formation of the Dagang oil field. During the sedimentation period of the lower Es3, braided river delta and fan delta deposits developed extensively. The semi-deep and deep lake facies deposits are only found in the middle of the depression. A lacustrine transgressive system tract developed during the sedimentation period of the middle section of the Es3. The depression has large areas of fine sediments that developed during the rapid expansion of the lake basin, which is a favorable period for the formation of organic mudstone and shale. A sedimentary transformation occurred from a lacustrine transgressive system to a highstand system tract in the sedimentary period of the upper Es3, forming a relatively closed sedimentary environment. The lake basin reached its maximum area in the sedimentary period of the Es3. Thick and extensive organic mudstone and shale strata developed. This was the most favorable development period for organic mudstone and shale [22,23] (Figure 1).
Shale oil exploration of the Shahejie Formation in the Qikou Sag started in 2010. The main target stratum was the lacustrine carbonate rock of member 1 in the Shahejie Formation (Es1), which was found to contain large geological reserves [24,25]. Due to the successful shale oil exploration of member 2 of Kongdian formation in the Cangdong Sag [18,24,26], old wells have been evaluated, and new wells have been drilled in the Es3 of the Qibei Slope in the Qikou Sag since 2019. The explorations proved successful in Bin60-56, F38 × 1, and other wells, demonstrating the shale oil exploration potential of Es3 [21]. The F39 × 1 well was drilled to evaluate the shale oil exploration potential of semi-deep to deep lake facies of the Es3 in Qibei slope and coring 40.1 m in the middle and upper part of the Es3, providing important first-hand data for geological research of shale oil in this area. This information is used in this study.

3. Materials and Methods

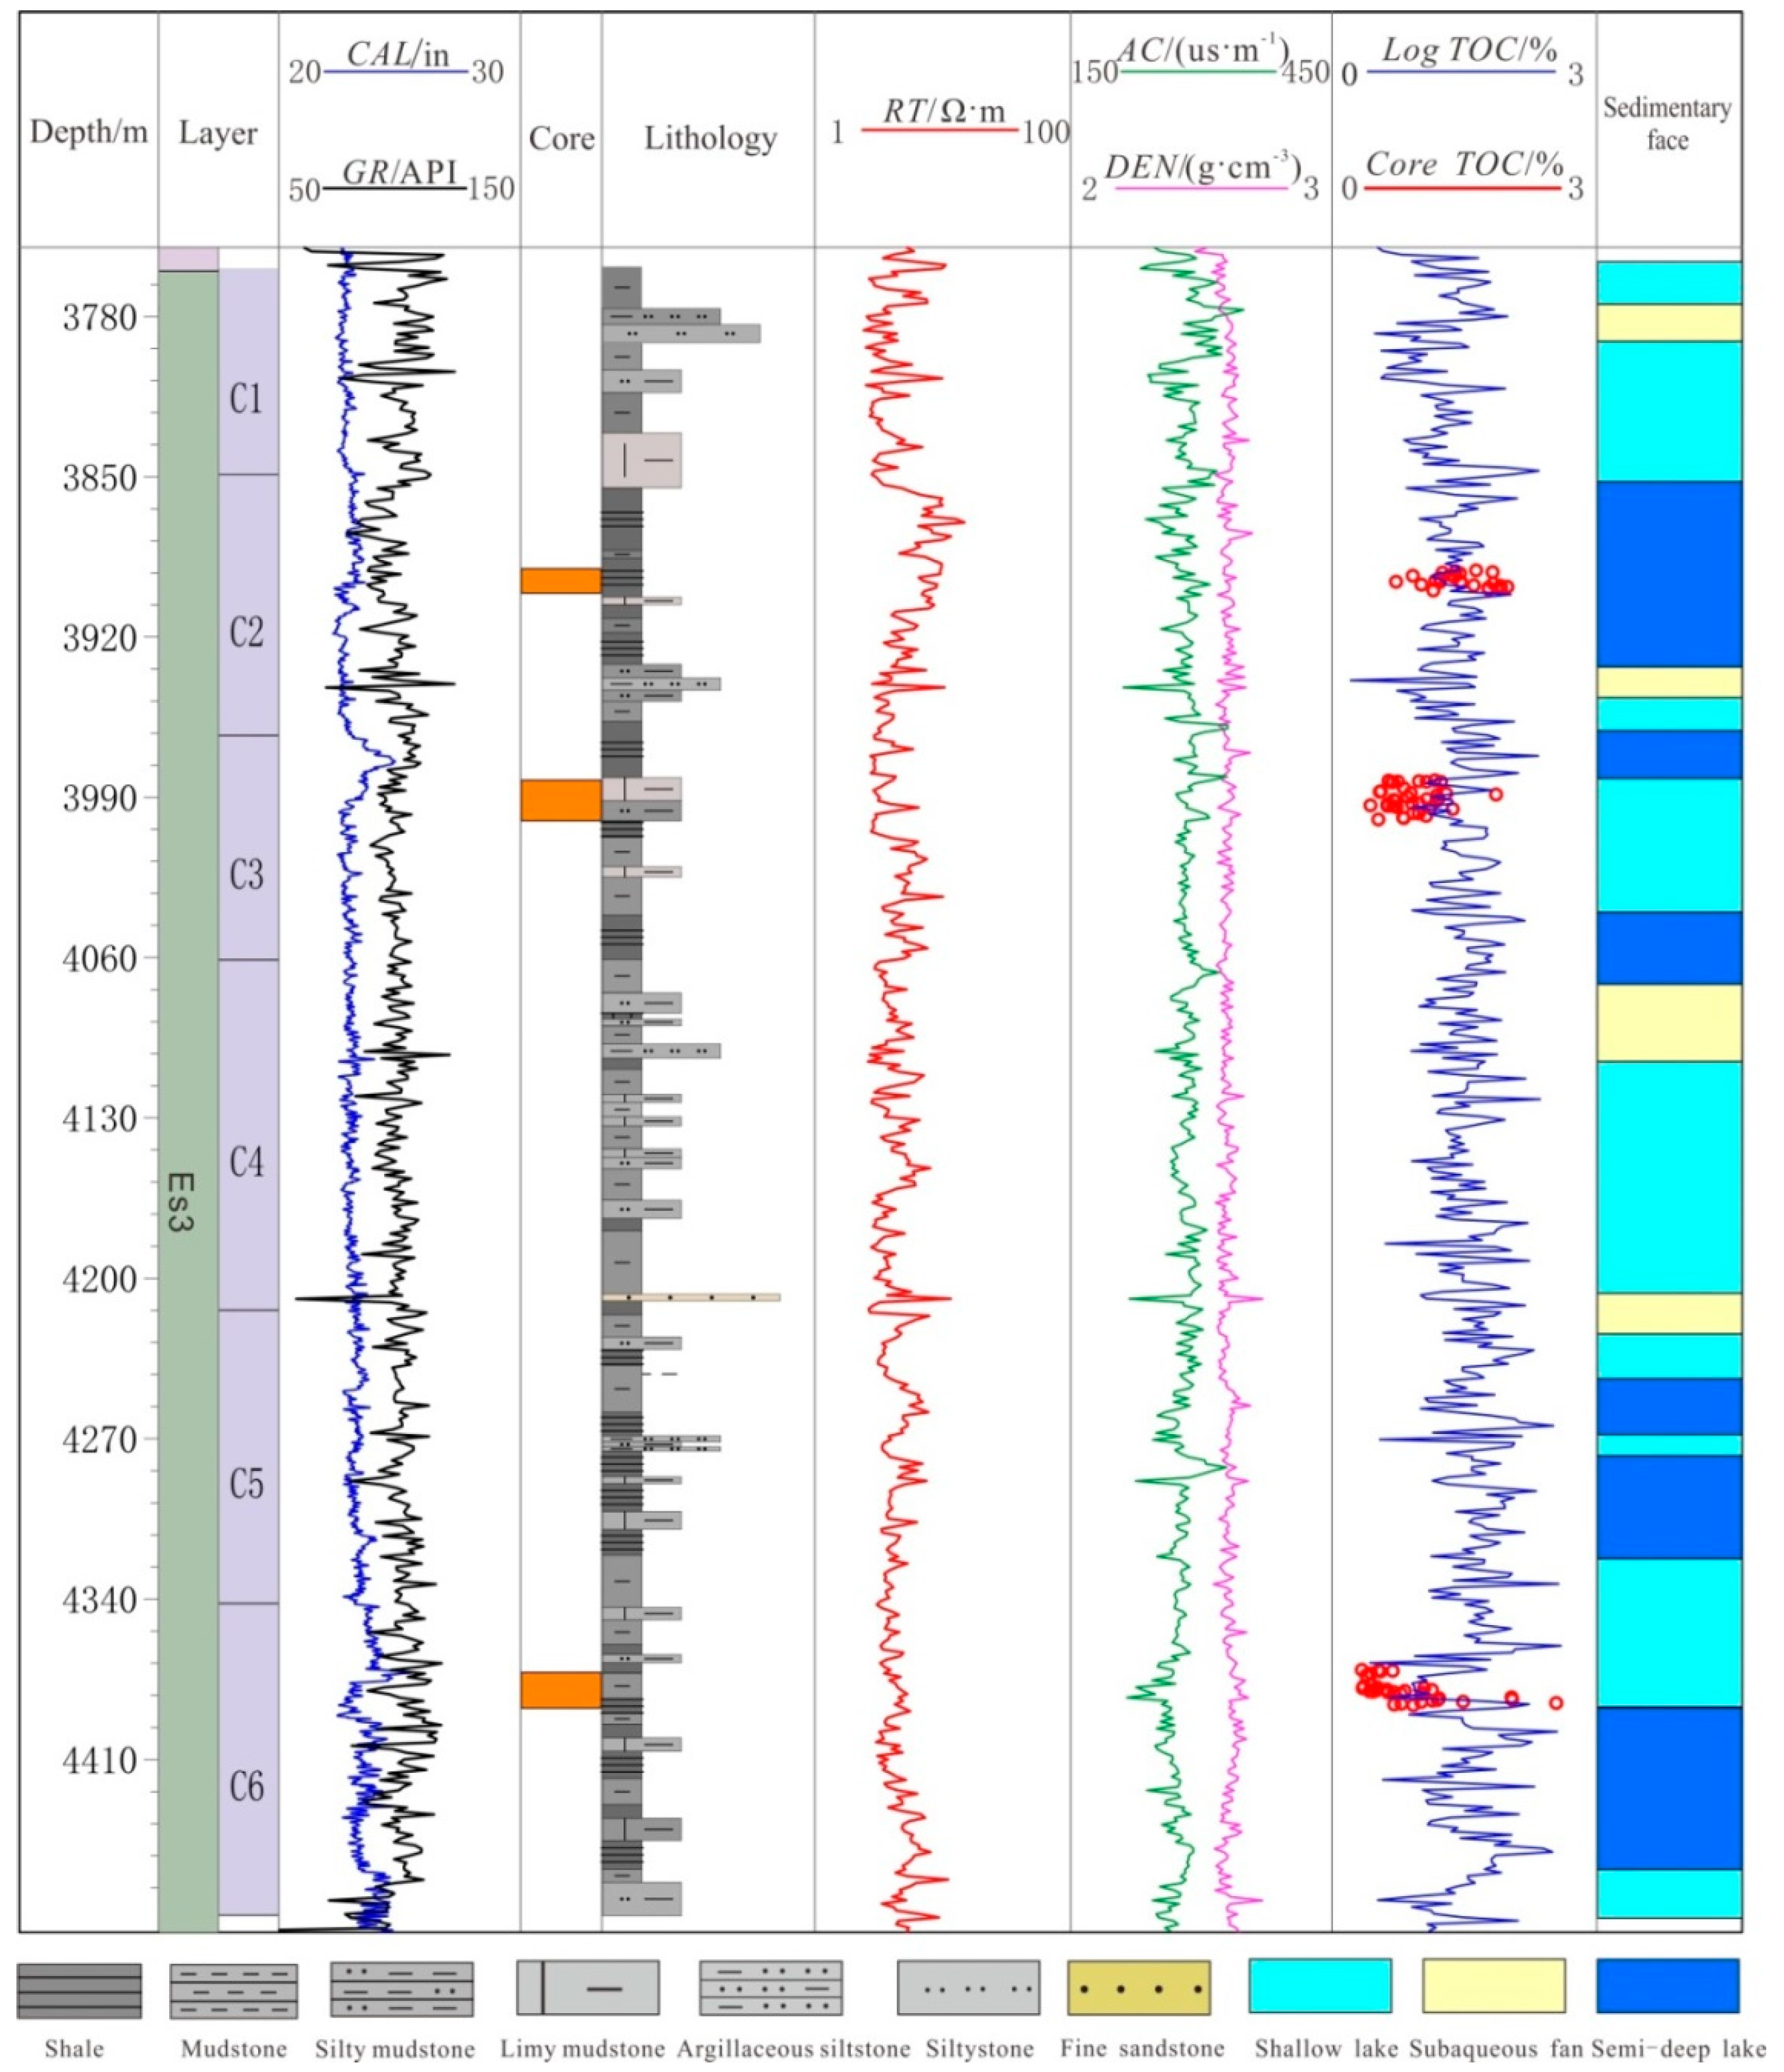
This study used logging data, core samples, geochemical data, and pyrolysis data of Well F39X1 on the Qibei Slope. The core from Well F39X1 is located in the upper section of Es3 and has a thickness of 40.1 m. It has three depth sections: 3890.87–3899.65 m (C2), 3982.57–3999.87 m (C3), and 4371.13–4386.23 m (C6) (Figure 2). The lithology is predominantly gray-dark to gray mud shale mixed with small amounts of siltstone and carbonate rock. The mud shale laminae and thin layers are relatively well developed, and the lithology frequently changes in the longitudinal direction. The organic carbon, pyrolysis, and mineral composition data were obtained from 115 samples in the three depth sections, basically covers all kinds of lithology, with an average depth interval of 0.35 m. Thirty-six samples were taken from different depths section for element analysis and thin sections analysis to identify lithofacies types and basic characteristic of Es3. Seven to ten samples containing different lithofacies types were used to performing electron microscopy, nitrogen adsorption analysis, high-pressure mercury porosimetry, and nuclear magnetic resonance analysis, and chloroform extraction was conducted using 19 samples with different lithofacies and TOC.
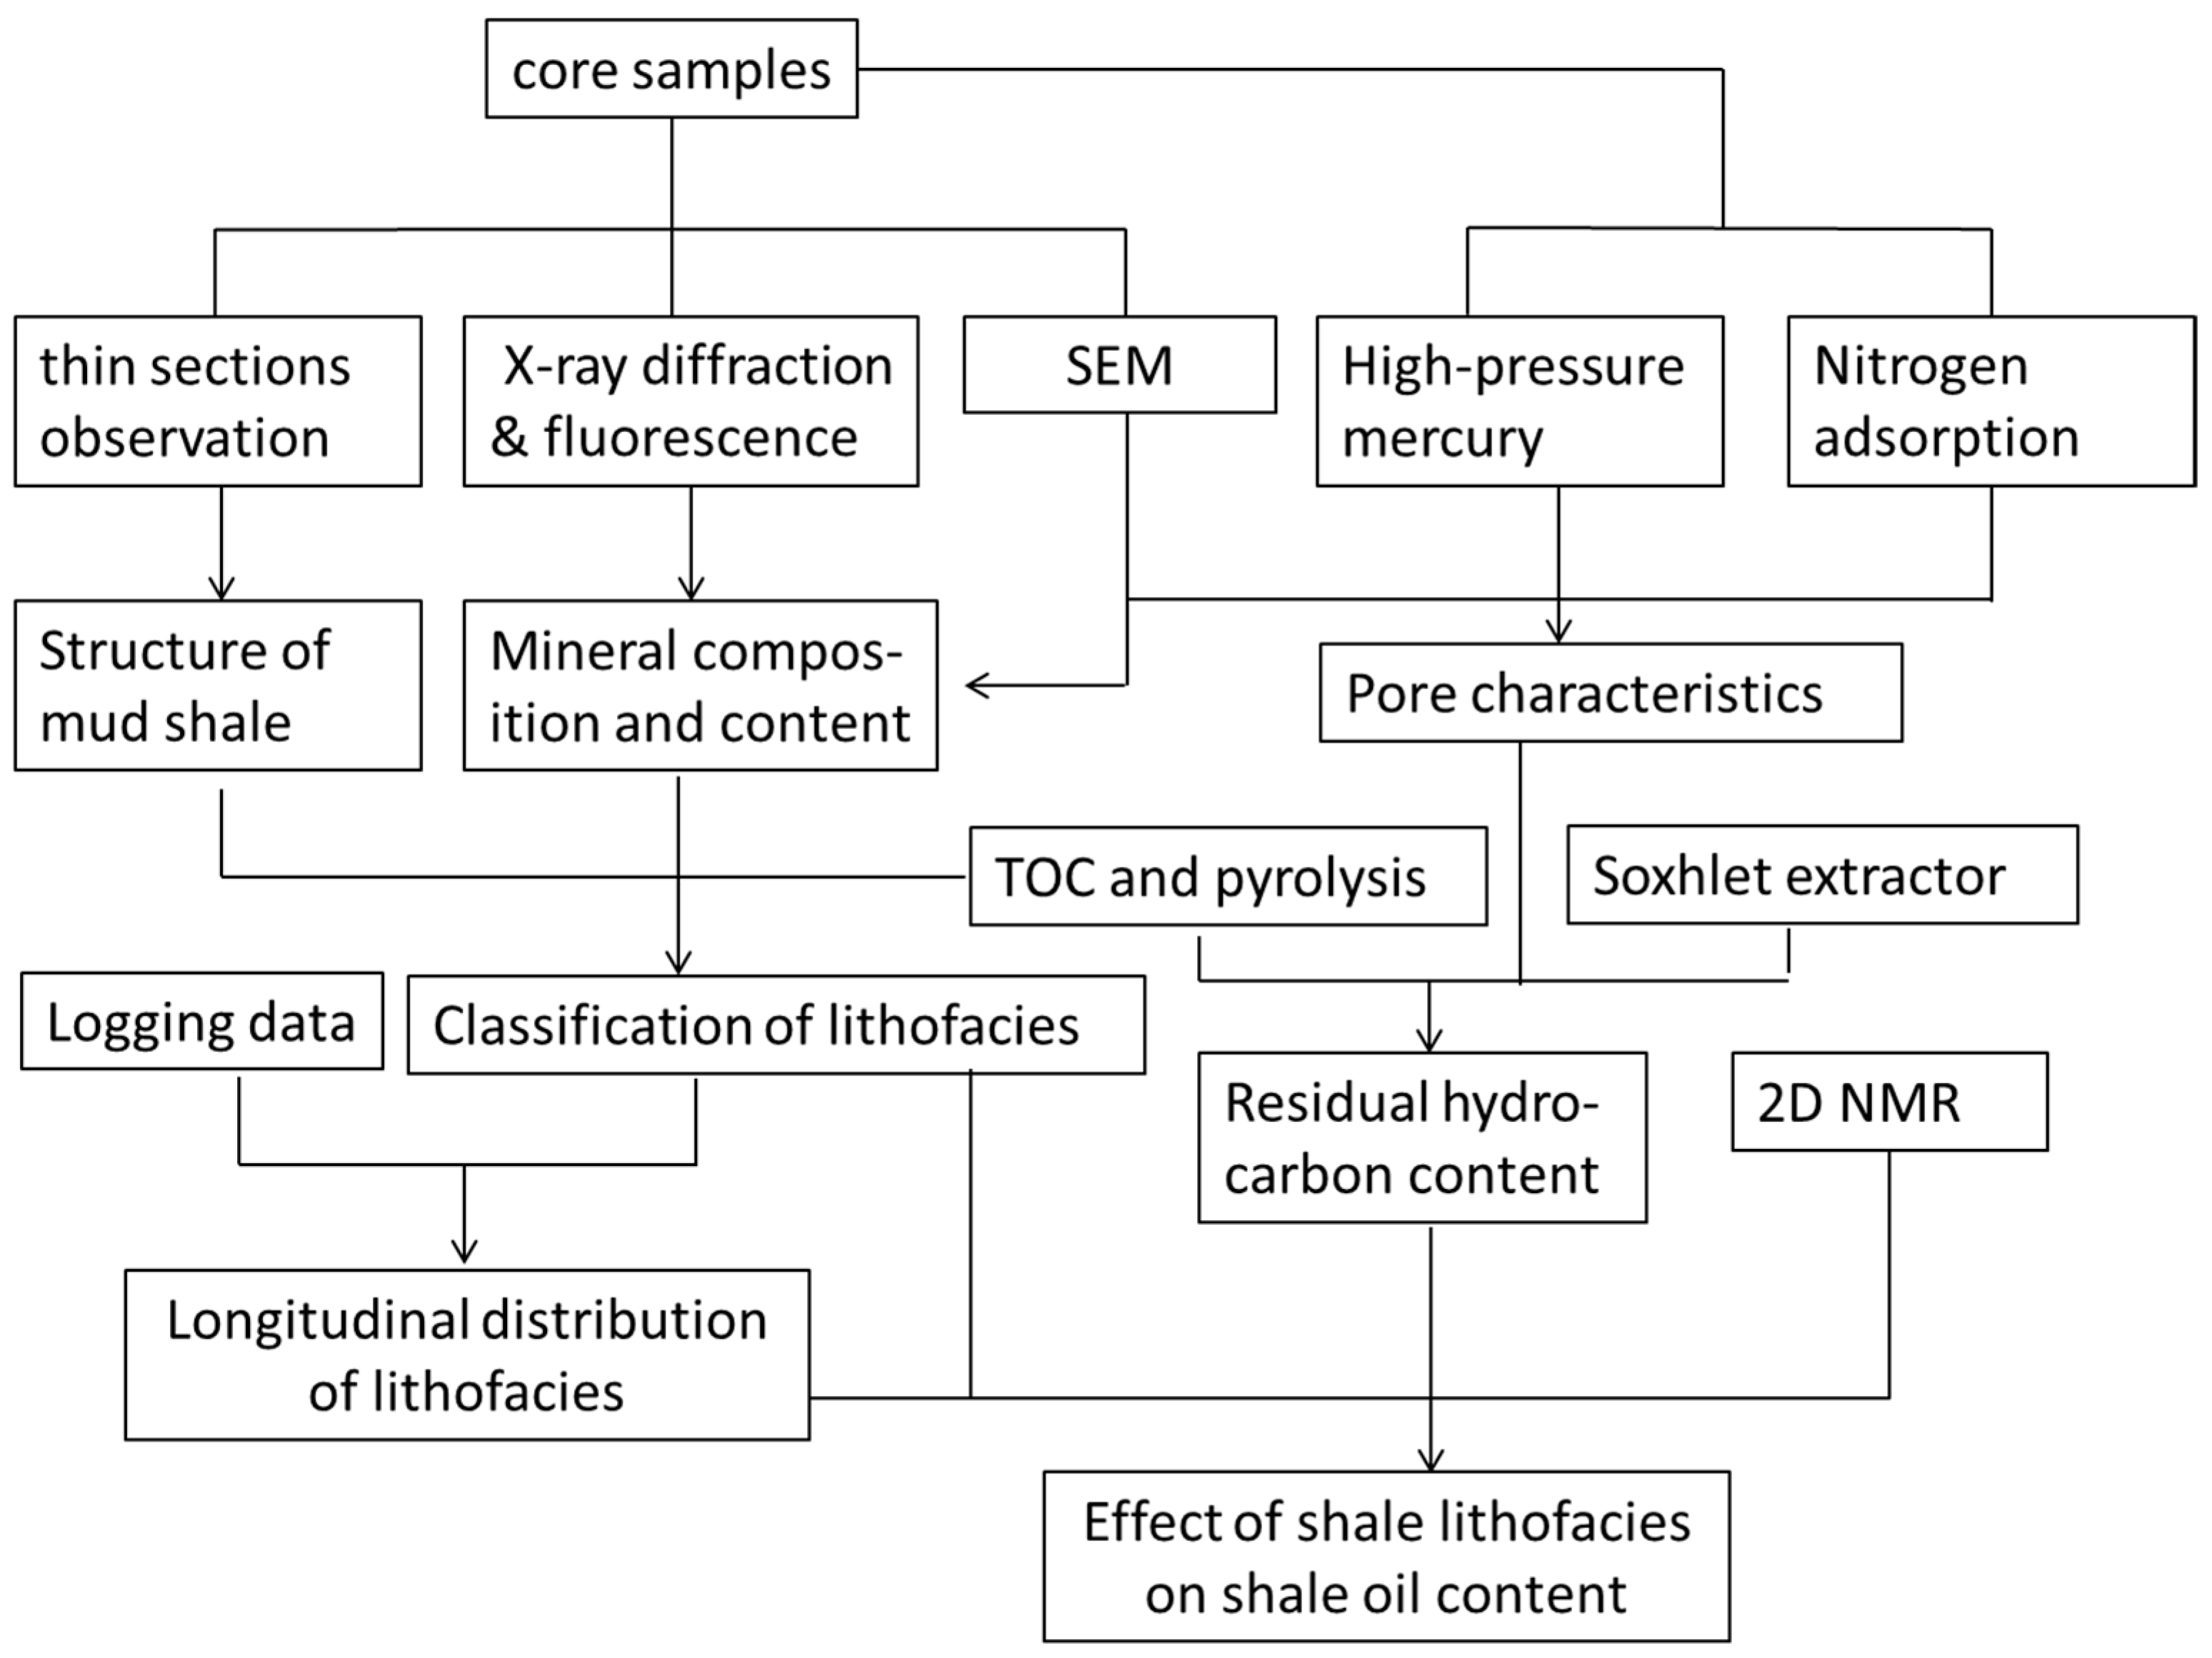
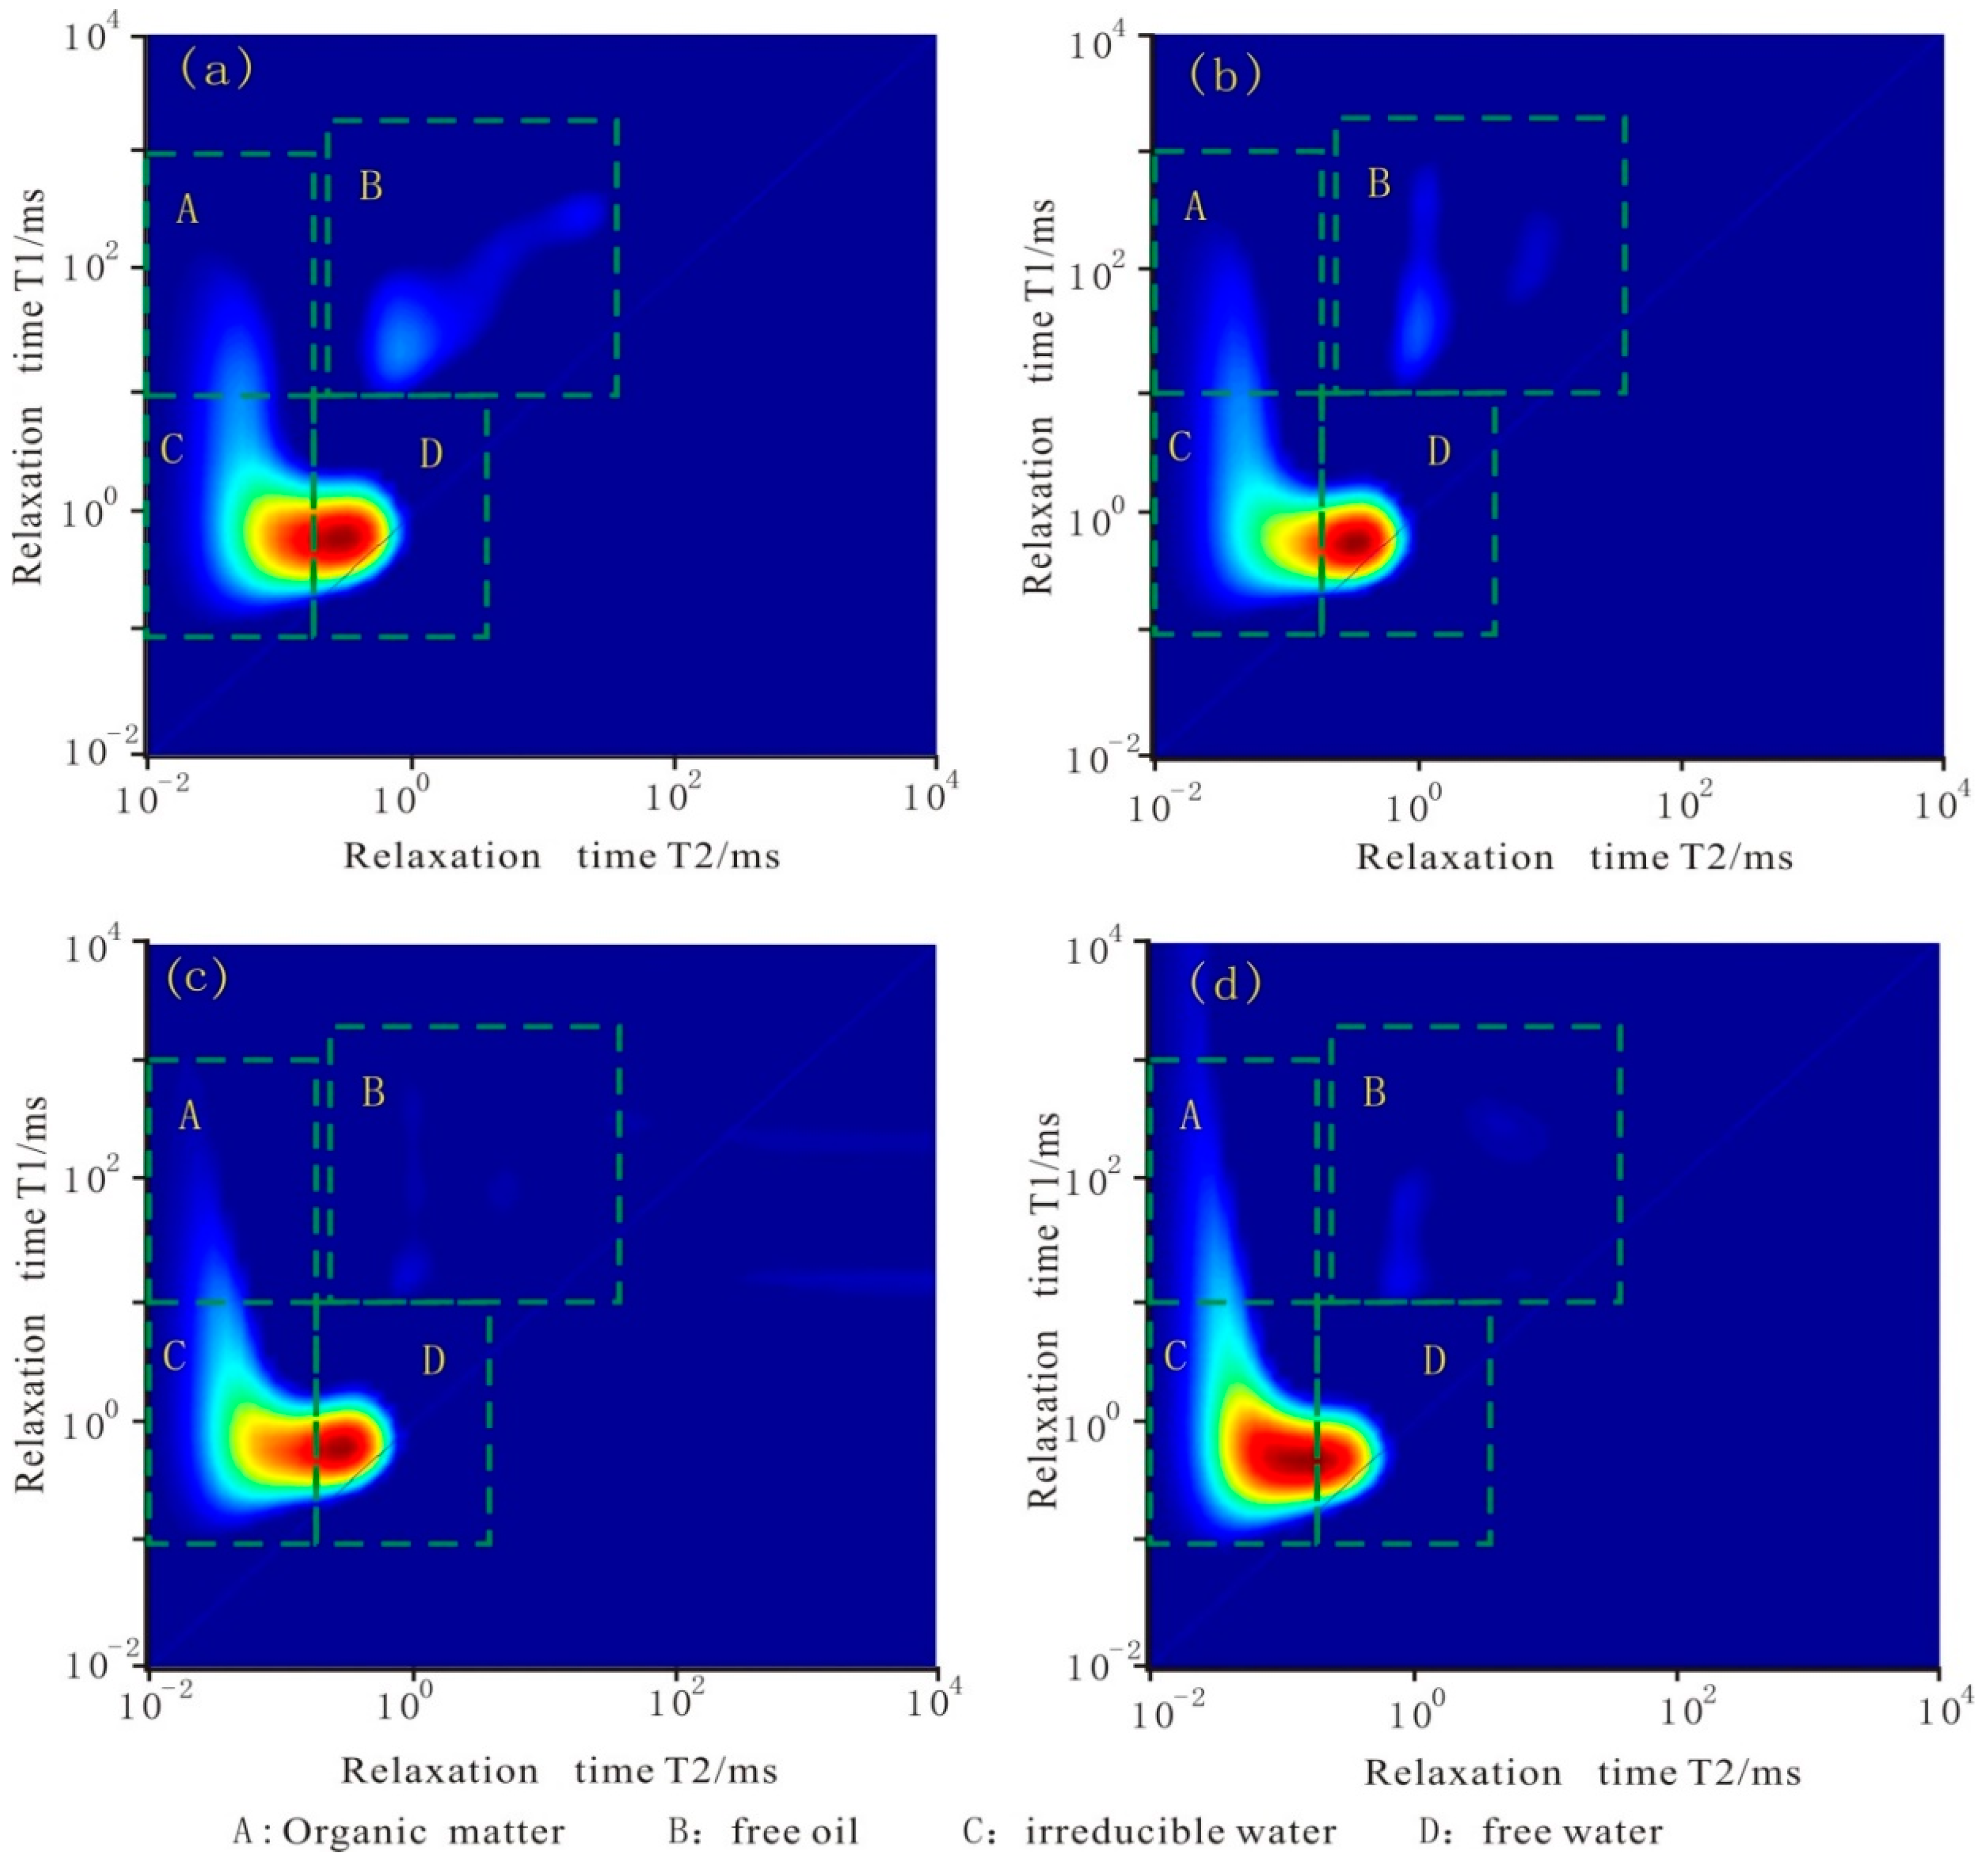
Polarized light microscope observations, X-ray fluorescence (XRF) analysis, XRD, and SEM were conducted to analyze the mineral composition and content of different lithofacies and the lamina structure of the mud shale. The pore types and pore structure characteristics of the shale were analyzed by high-pressure mercury porosimetry and nitrogen adsorption. A sulfur carbon analyzer, Soxhlet extractor, and rock-eval pyrolysis instrument were used to determine the geochemical indices and residual hydrocarbon content of the mud shale. Nuclear magnetic resonance technology has been used to analyze the characteristics of reservoir pore fluid, especially the content of the movable and irreducible fluid [27,28]. Two-dimensional nuclear magnetic resonance spectroscopy and fluorescence spectrum analysis of the shale particles were used to assess the residual oil content in different lithofacies and evaluate the shale’s oil-bearing potential (Figure 3).

4. Results

4.1. Mineral Composition and Content of Mud Shale

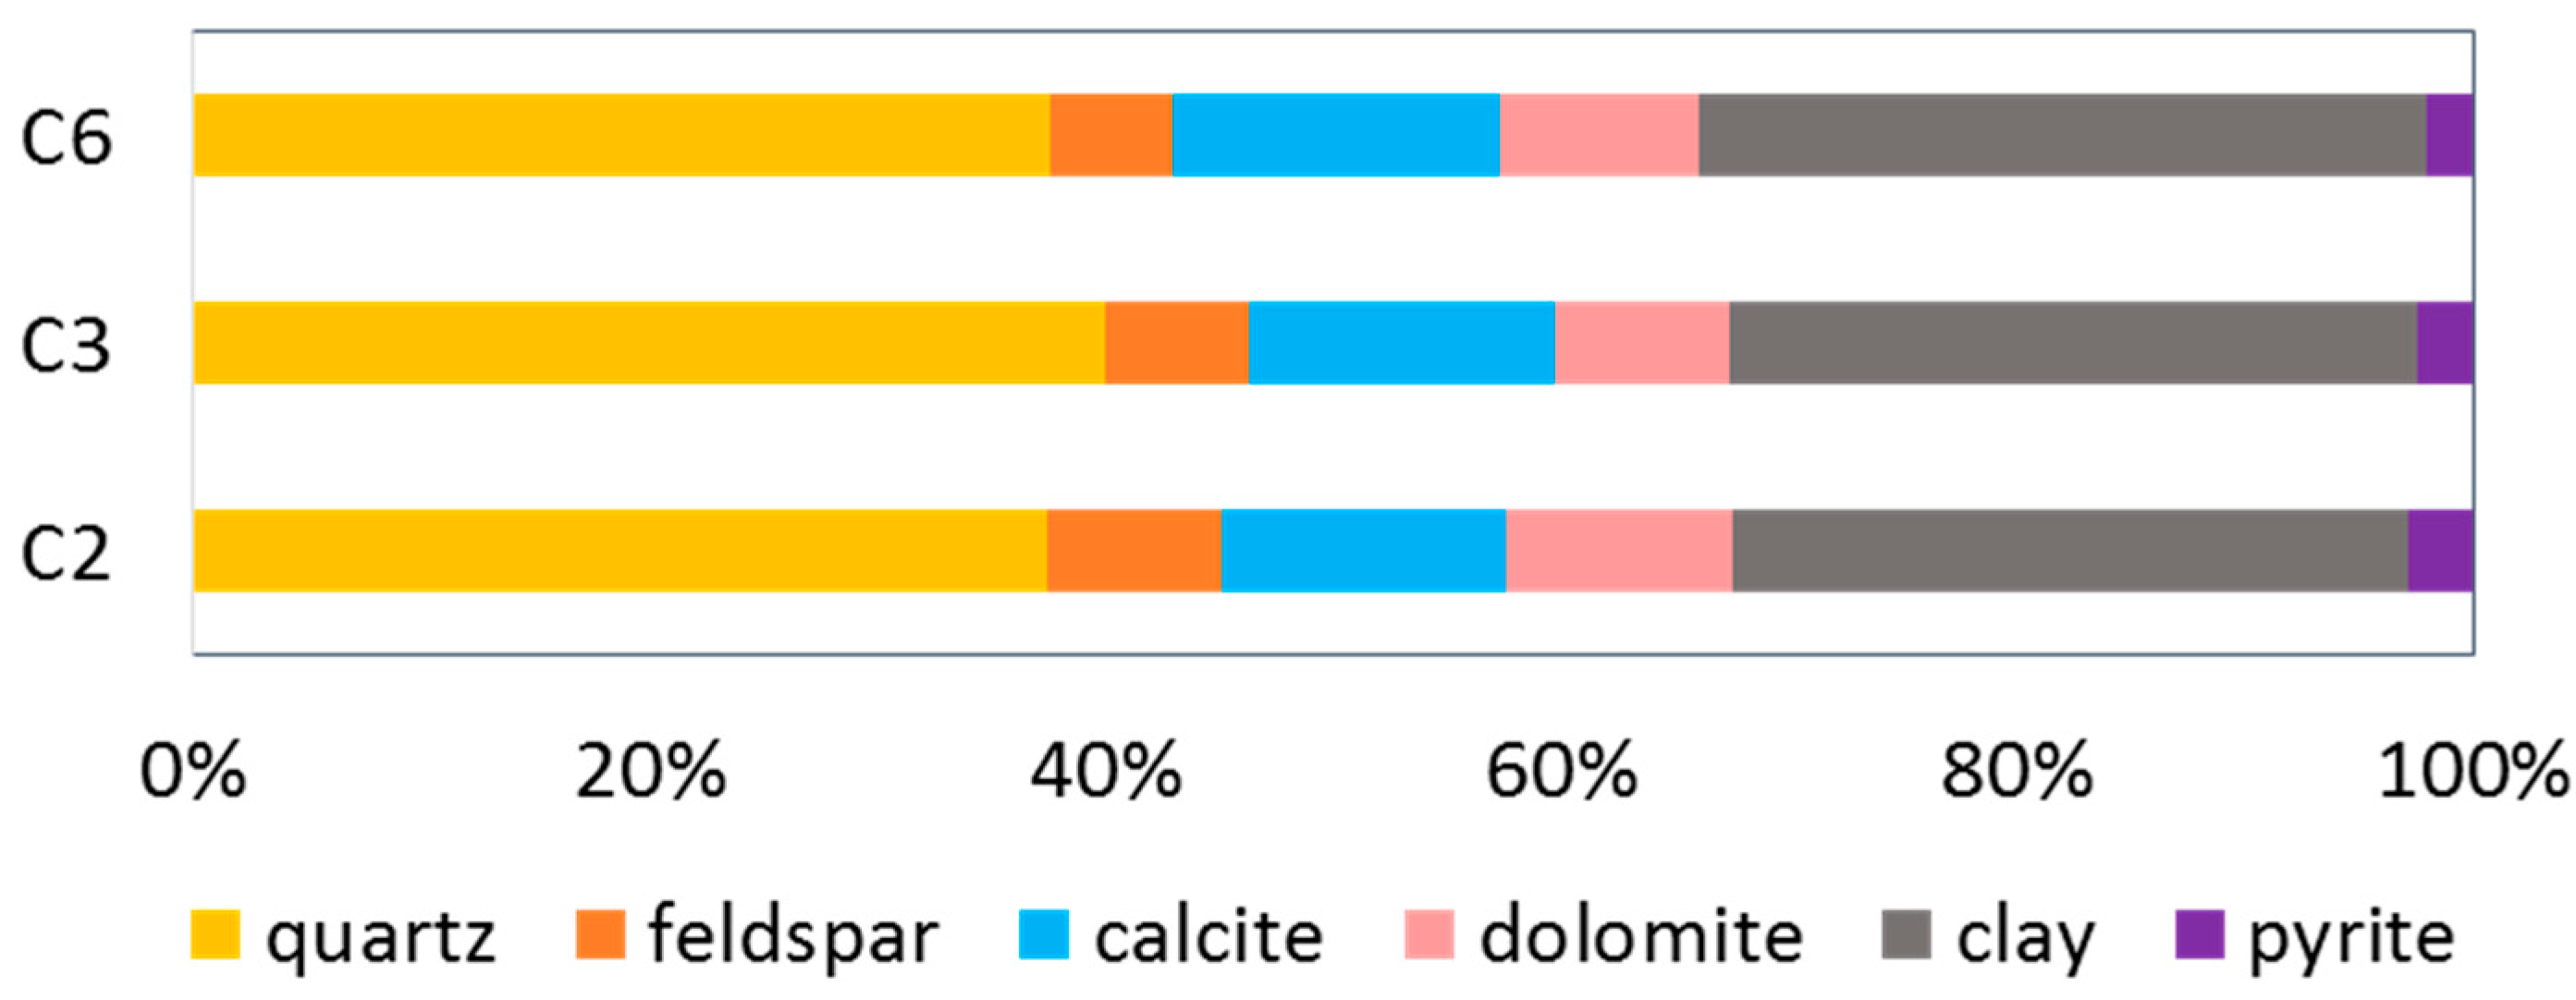
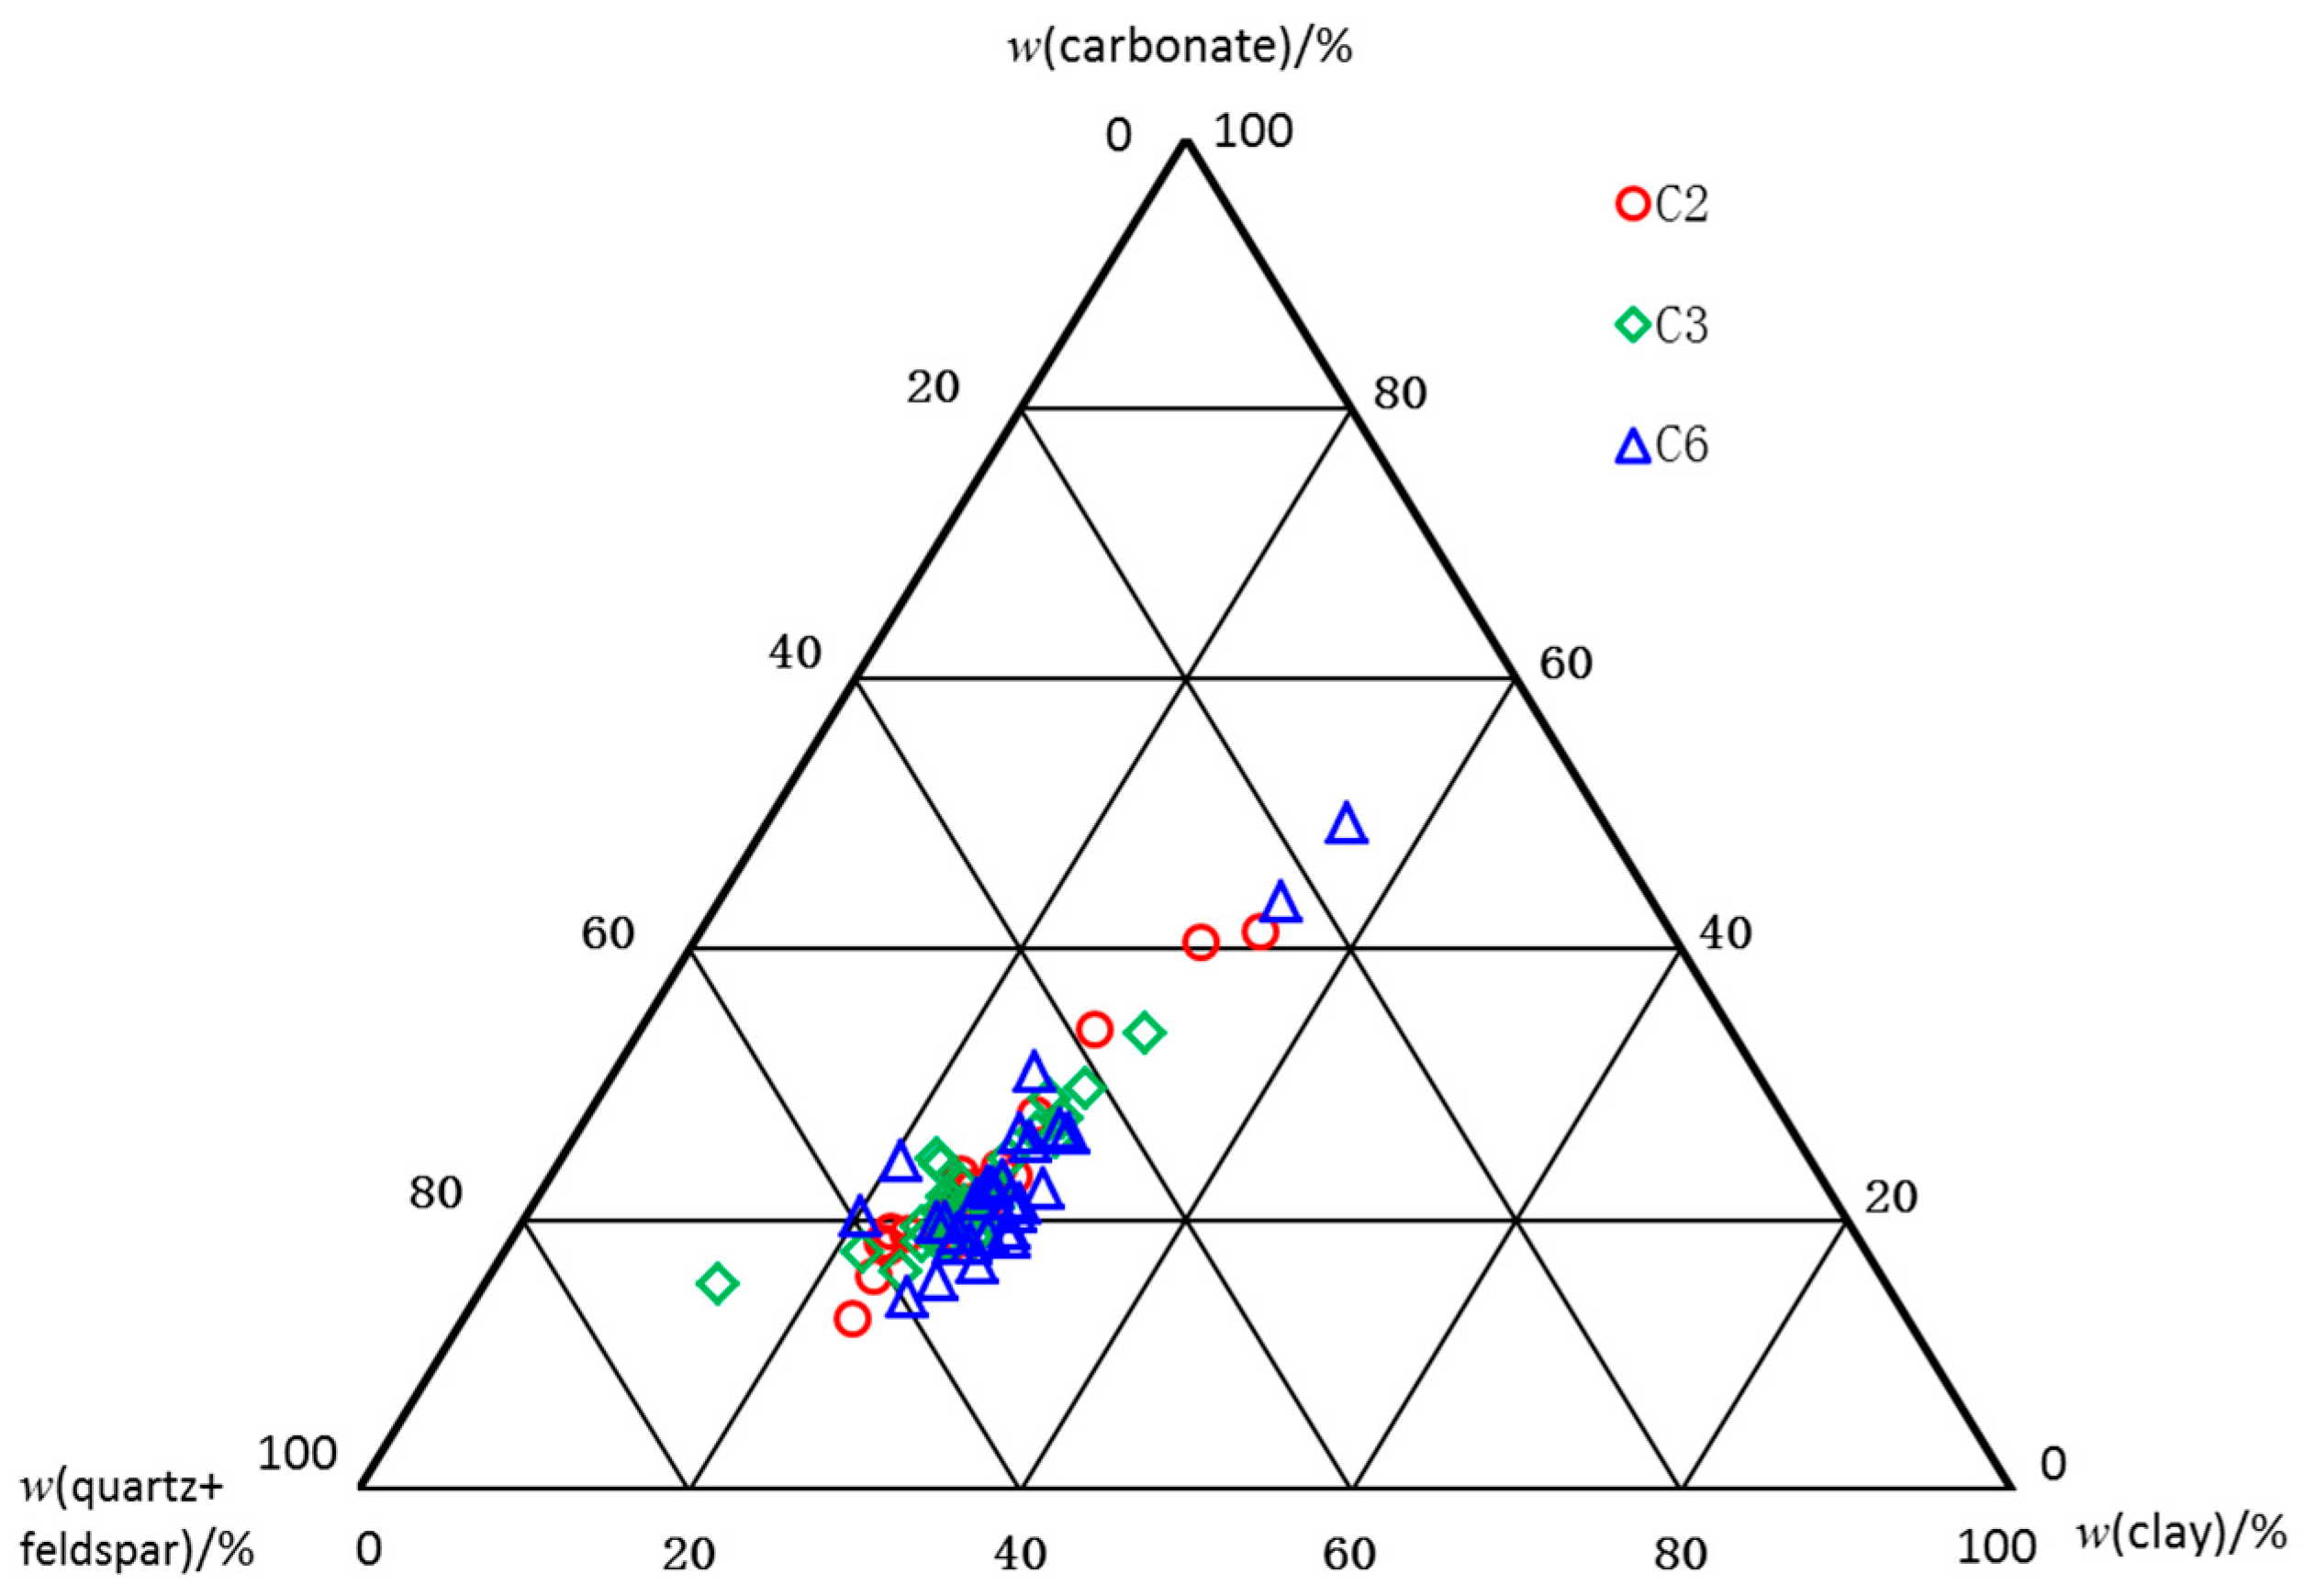
The XRD results show (Figure 4 and Figure 5) that the dominant minerals of the mud shale in the coring section are quartz, feldspar, clay, calcite, dolomite, and a small amount of pyrite. Felsic and clay minerals have the highest contents, with mass fractions of 25–43% and 20–40%, with average values of 38% and 30%, respectively. These are followed by calcite and dolomite, with mass fractions of 10–25% and 5–22%, with average values of 13% and 8%, respectively. The feldspar and pyrite contents are low, with average values of 6% and 2%, respectively. The mineral analysis shows (Figure 4) that the felsic content is generally high (mass fraction of 40–65%), followed by the carbonate content (15–50%). The SEM results show that the main component of the clay minerals is illite, accounting for 80%, followed by montmorillonite and chlorite, indicating that the diagenesis of the mud shales in Es3 has reached the middle diagenetic stage.

4.2. Macro and Microstructure of Mud Shale

The structure of the fine-grained sediments, such as the mud shale, indicates that the laminae or bedding is relatively well developed. Different classification schemes have been used to categorize lamina according to their thickness and shape [29,30,31]. Ingram (1954) categorized them into ultra-thin lamina with a thickness of less than 3 mm, thin laminae (3 mm–1 cm), medium laminae (1–3 cm), and thick laminae (3–10 cm). Campbell (1967) categorized the laminae based on the morphology, into uniform, wavy, and curved laminae. Each category was further divided into continuous parallel, intermittent parallel, continuous non-parallel, and intermittent non-parallel laminae. Liu et al. divided the lacustrine shale of the Yanchang Formation in the Ordos Basin into bright and dark layers. The former contained primarily quartz and plagioclase, and the latter consisted of quartz and illite [32,33]. The core observations in this study show that the shale laminae of the Es3 in the Qikou Depression are relatively well developed, primarily in the horizontal direction, and the thickness of a single lamina is 0.1 mm–10 cm. Therefore, we categorized the laminae into thin laminae (average thickness of less than 10 mm) and thick laminae (thickness of 10 mm–10 cm). When the thickness exceeds 10 mm, the lamination characteristics cannot be determined in the thin sections, but the mudstone characteristics of the graded or homogeneous layer are visible, which have great influence on the reservoir space and permeability. When the thickness exceeds 10 cm, the layer is referred to as massive mudstone.
The three types of mud shale in the F39X1 coring section are relatively well-developed. The upper part consists of thin laminar shale, and the middle and lower coring sections are primarily thick laminar and massive shale. The laminated layers are predominantly horizontal or parallel. The core observation and element analysis show that the thin laminar shale is generally dark gray with dense beddings, and the density of the laminae is 2–5 pieces/mm. The laminae are mainly interbeds of felsic, clay, and carbonate (Figure 6a), while some contain pyrite laminae (Figure 6b). The felsic and carbonate laminae are mostly bright, the clay is mostly dark, and the organic and pyrite laminae are mostly dark gray-black. The thick laminar shale is dark-grey with light-grey interbedded sections (Figure 6b), and the thickness of a lamina is about 0.2–5 cm. The thin-section analysis indicates that the dark-grey areas consist of clay minerals and contain organic matter; the light grey felsic content is high, and the TOC is low (Figure 6c). The massive mudstone is gray or yellow-gray with a rock core, and the laminae cannot be identified under the microscope. Relatively homogeneous layers (Figure 6d) are visible. They consist of yellow or dark-yellow clay layers or felsic clay layers and contain dark-gray to black organic matter and pyrite.

4.3. Classification of Lithofacies

There is no uniform standard for categorizing shale lithofacies. Early research typically classified mud shale lithofacies types according to mineral composition and organic content. The mineral composition is generally divided into felsic, clay, and carbonate. For example, Wang & Carr (2013) classified Marcellus shale into organic-bearing siliceous rock, migmatite, gray siliceous rock. Subsequently, the lithofacies classification also considered the sedimentary structure, dividing the lithofacies into three types: lamellar, layered, and massive, resulting in four components and three categories [5]. For example, Liu (2019) divided the lacustrine shale of member 1 of the Qingshankou Formation in the Gulong Depression into seven types, including high organic matter clayey/felsic bedded mudstone facies, medium organic matter massive felsic mudstone facies, medium organic matter lamellar felsic, and low organic matter bedded limestone facies [12].
No systematic division of the shale lithofacies of the Es3 in the Qikou Depression has been carried out. Due to the small difference in the shale mineral components of Es3, it is difficult to classify the shale according to its components. Therefore, the four-component, three-category scheme is not applicable to this area. In this study, we divided the shale of Es3 into four categories and six subcategories according to the shale lithology, sedimentary characteristics, and TOC (Table 1, Figure 7). The four categories are thin laminar shale, thick laminar shale, massive mudstone, and argillaceous siltstone. The thick laminar shale and massive mudstone were divided into two subcategories according to the TOC (at least 1%): medium organic matter content and low organic matter content. The TOC of all thin laminar shale is greater than 1.0%; thus, all thin laminar shales are medium organic matter content shale. Due to the small differences in the mineral composition of the shale for different lamina types, we did not perform further subdivisions to simplify and facilitate the analysis and application (Table 2).

4.3.1. Lithofacies of Thin Laminar Shale

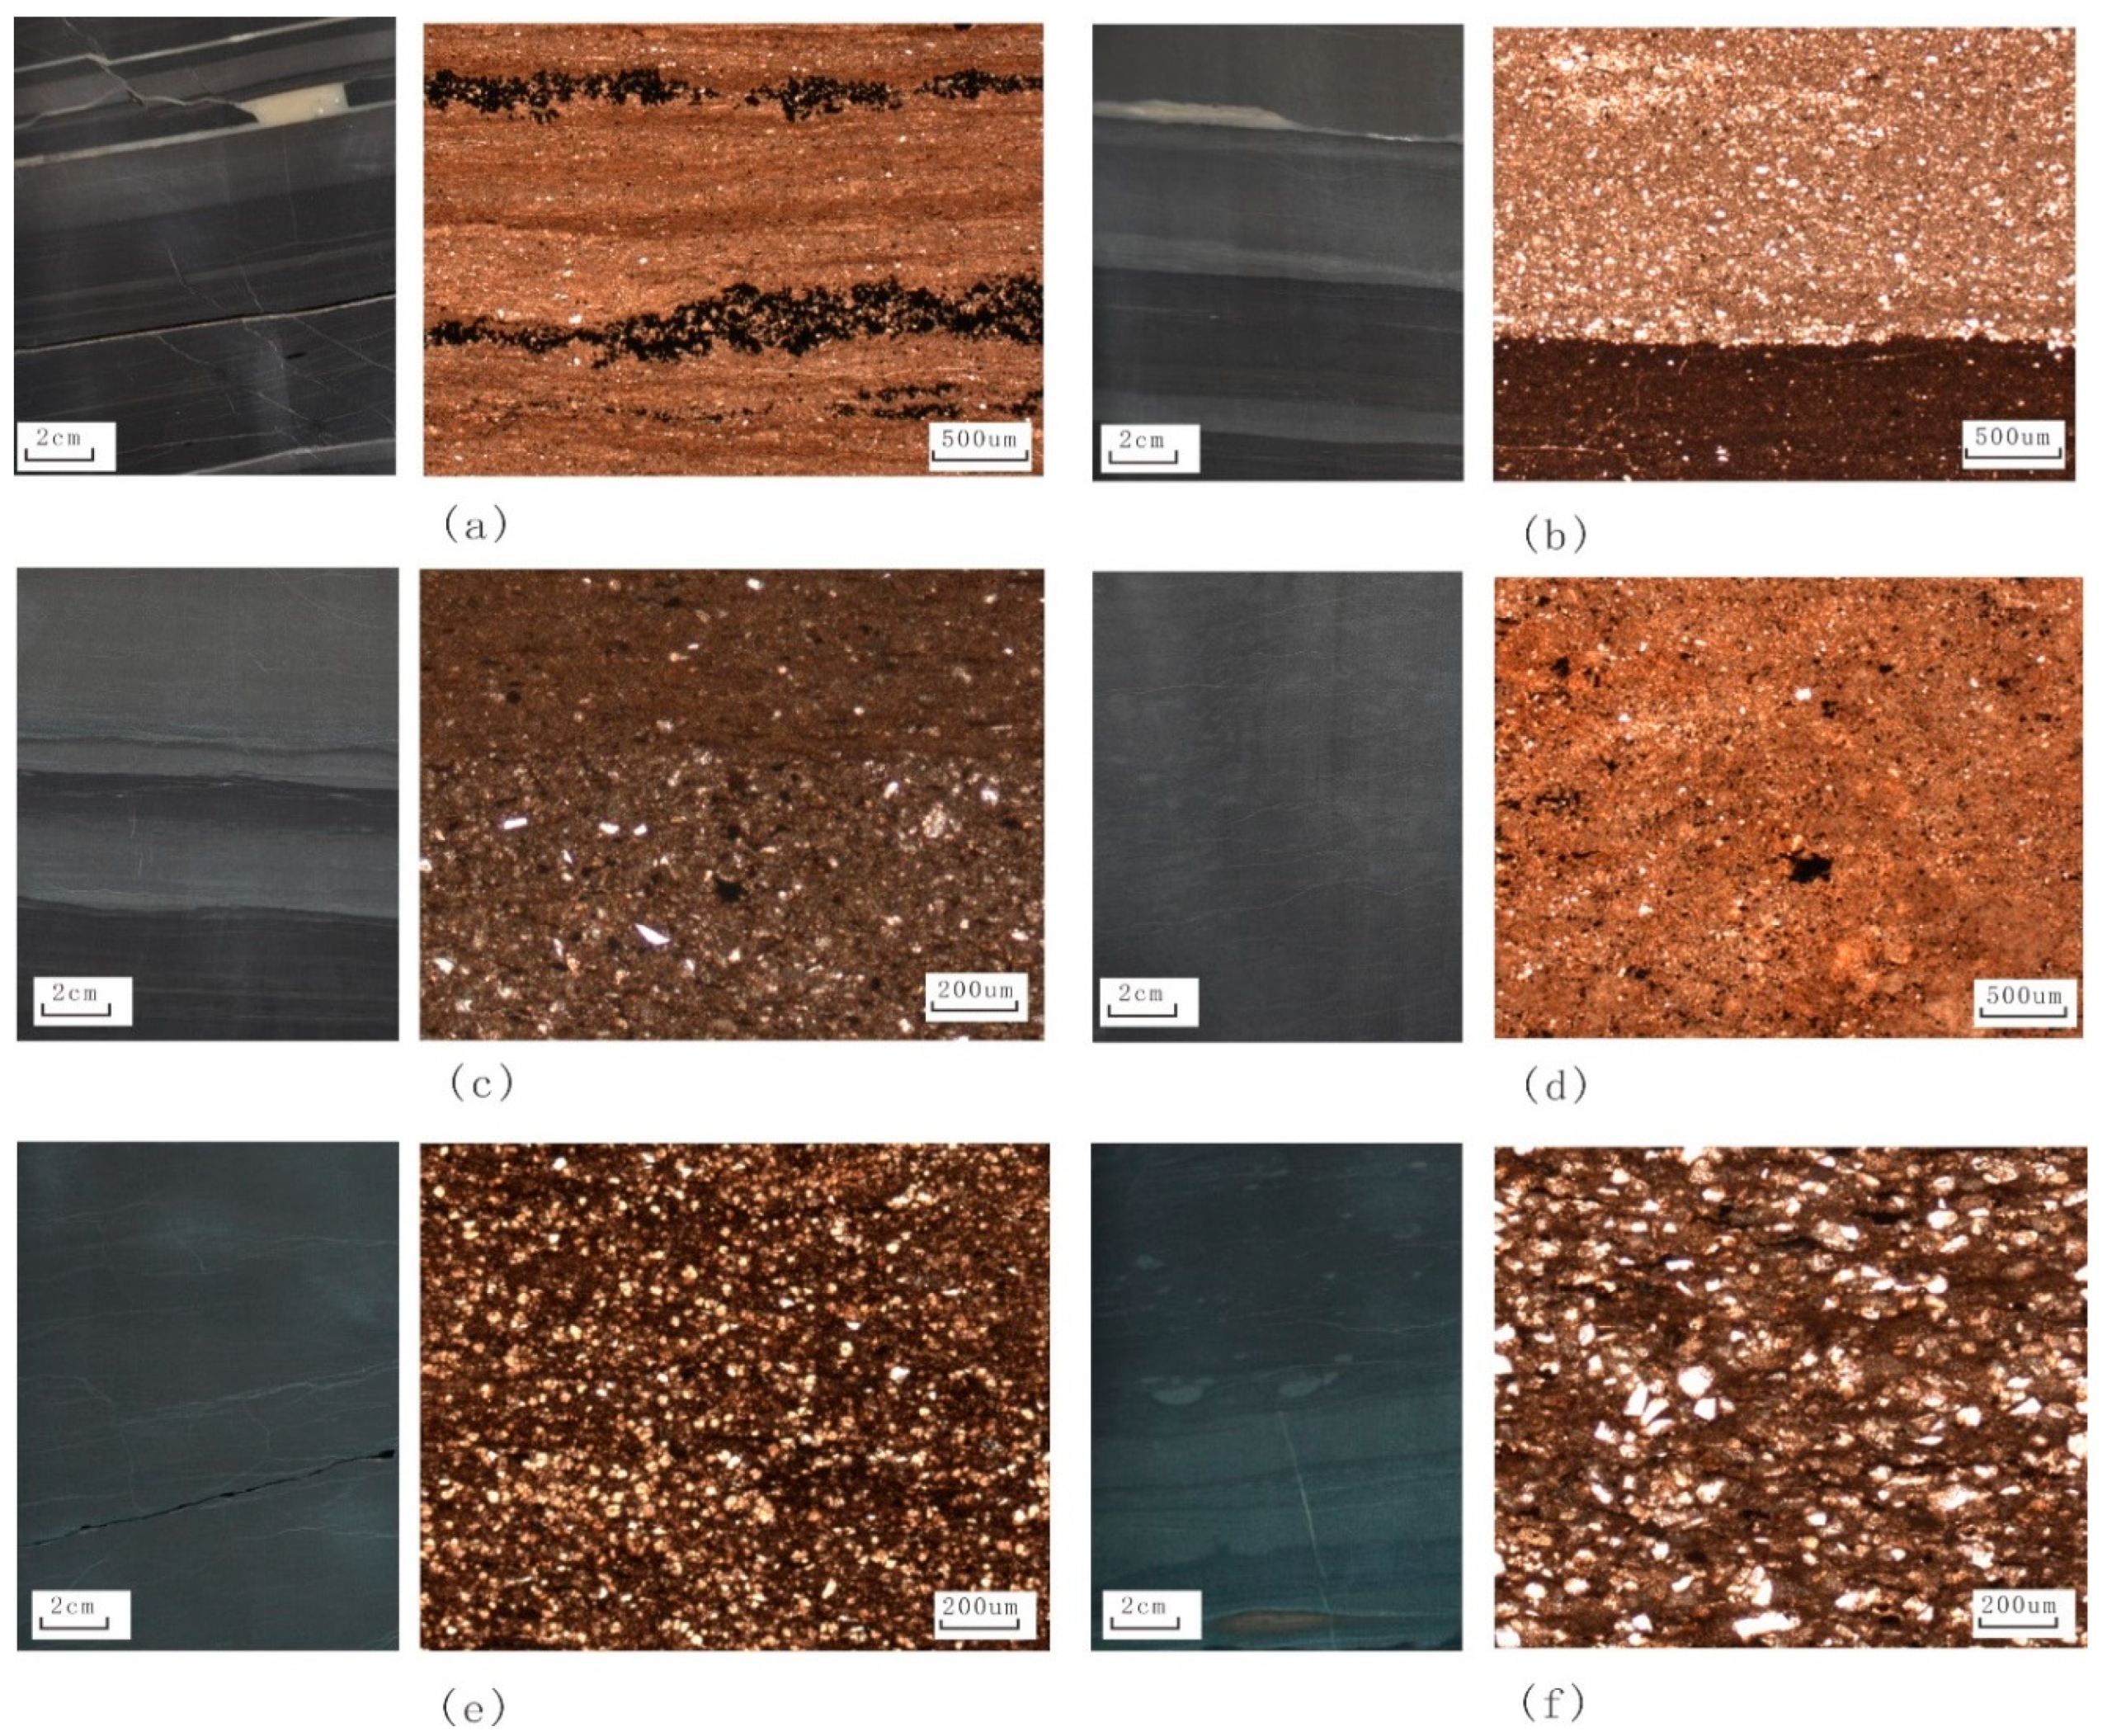
The thin laminar shale is dark gray and has well-developed laminae. It is dominated by dark laminae rich in organic matter. The thickness of a single layer is 0.05–2 mm. It is mainly composed of quartz, clay minerals, and carbonate minerals, with average mass fractions of 38%, 28%, and 23%, respectively. It is rich in pyrite, with an average of 3.8%. The laminae rich in pyrite can be seen in some core or thin sections (Figure 7a). The TOC is high, about 1.0–2.6%. The organic matter is generally enriched in the dark clay laminae. This type of lithofacies has typically formed in the semi-deep lake facies and some deep lake facies, where alternate depositions occurred due to seasonal flow and drying up [32]. This layer is the dominant organic-rich shale facies in Es3.

4.3.2. Lithofacies of Thick Laminar Shale

The thick laminar shale has alternating light gray and dark gray laminae. The dark laminas have high contents of organic matter and clay minerals, and the bright laminae have high contents of felsic and carbonate minerals (Figure 7b). The thickness of the laminae is usually greater than 1 cm (1–10 cm). The TOC in this type of lithofacies varies greatly from 0.5% to 1.66%. It can be divided into shale with a medium organic matter content and shale with a low organic matter content (with a mass fraction threshold of 1%). The former is better developed and has darker laminae, and its mineral composition is similar to that of the thin laminar shale. The clay mineral content is slightly higher, and the pyrite content is slightly lower, with mass fractions of 31% and 2.2%, respectively. The TOC is 1.0–1.6%. The light-colored laminae with low TOC are lake of pyrite, with an average mass fraction of 1.2% (Table 2). The mass fraction of TOC is low (0.5–1.0%) (Figure 7c). These two types of lithologies have formed in shallow to semi-deep lakes with more turbulent waters and were affected by the season and terrestrial inputs.

4.3.3. Lithofacies of Massive Mudstone

The massive mudstone is light-gray to yellow-gray, with less lamina, and the thickness of a single layer generally exceeds 10 cm. The mineral particles are mixed, and the stratification is poor. This lithofacies is divided into medium organic matter content and low organic matter content massive mudstone (with a threshold of 1% TOC). The TOC mass fraction of the former is 1.0–1.35%, and the contents of felsic and pyrite rock are high (Figure 7d), with mass fractions of 46% and 3%, respectively. The TOC mass fraction of the latter is less than 1%, and it contains boulders and dolomite, resulting in a light or yellow-gray color of the rock core. The clay mineral content is high, with an average mass fraction of 32.8% (Table 2). In addition, some of the blocky mudstone contains silty dolomite, with mass fractions greater than 30% (Figure 7e), indicating that this type of lithofacies developed in the semi-deep to shallow lake areas in the middle of the basin, where there was low input of source material and chemical deposition.

4.3.4. Lithofacies of Argillaceous Siltstone

The argillaceous siltstone has light-grey layers that are 1–5 cm thick, and quartz or feldspar particles occur in the silt. The felsic content is high (52.5%), and the carbonate mineral content (18%) and pyrite content (1%) are low (Table 2). The organic carbon mass fraction is generally less than 1%, indicating that these lithofacies formed at the delta front or the shores of the shallow lake. It is often located at the bottom of a lake and is scoured by the lower shale (Figure 6f).

4.4. Longitudinal Distribution of Lithofacies

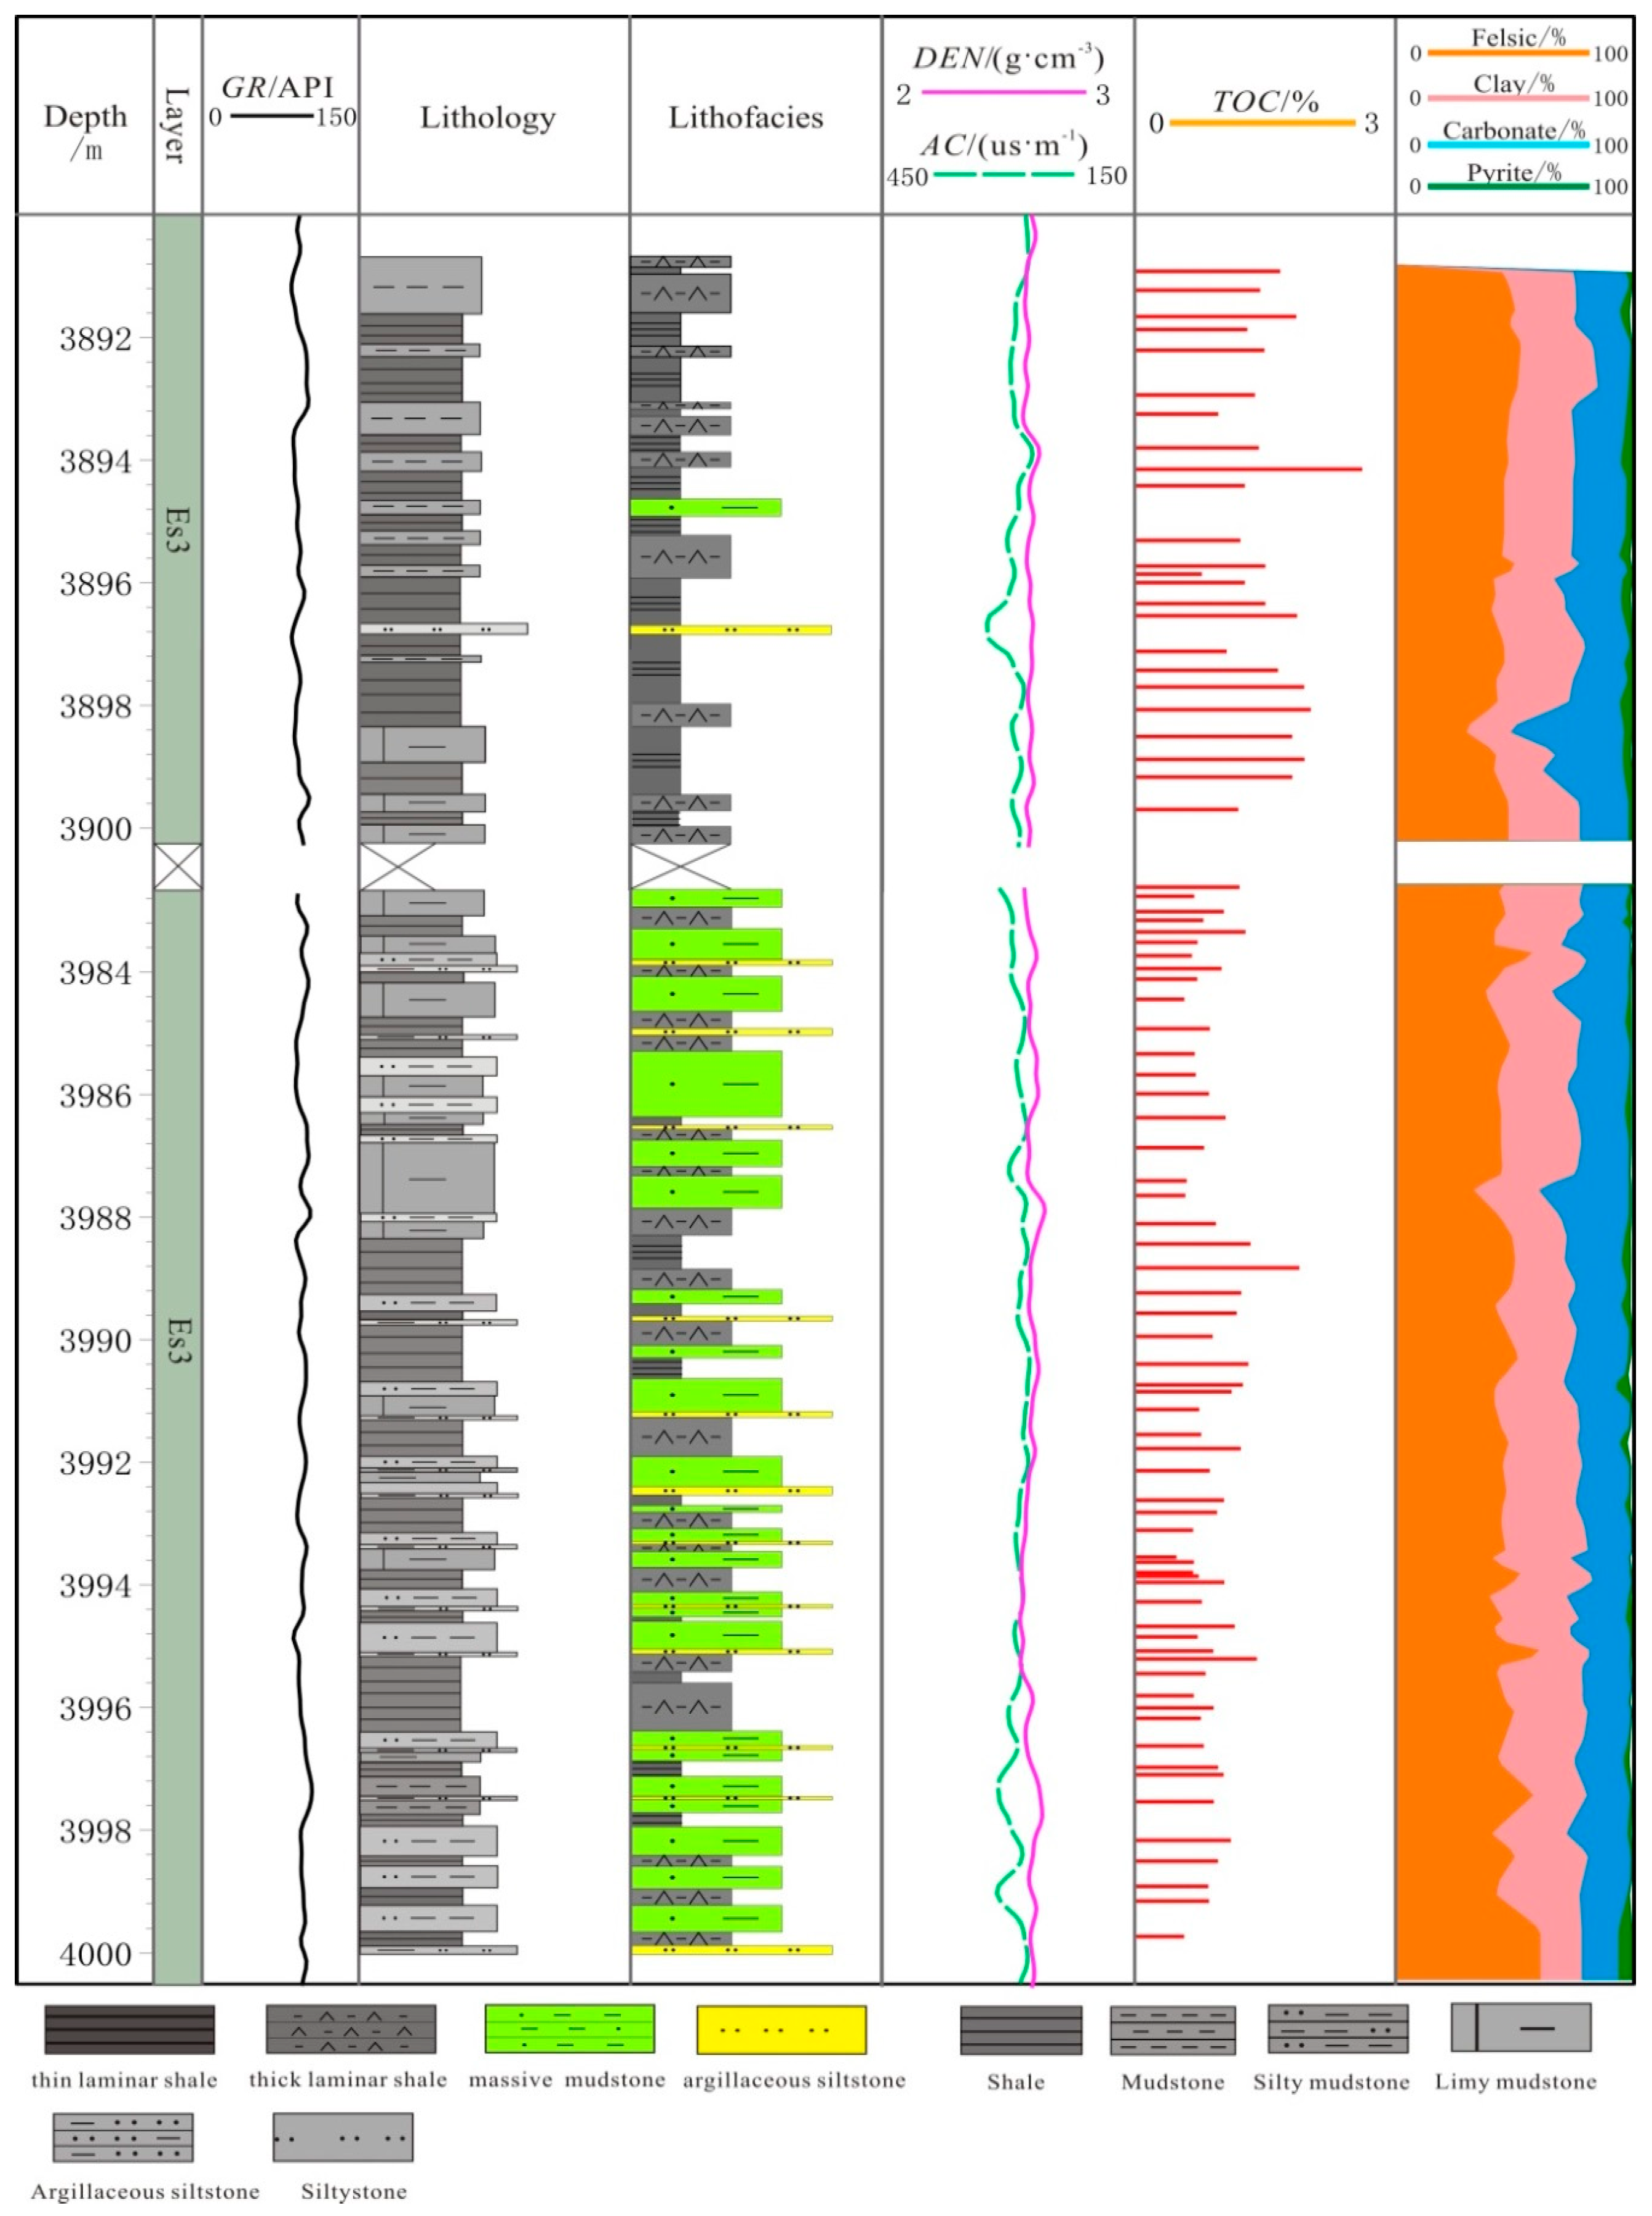
A comprehensive histogram is established based on the results of the lithological analysis, lithofacies classification, and mineral distribution (Figure 8). The shale lithology of Es3 is highly variable, including black shale, dark gray shale, gray mudstone, light-gray argillaceous siltstone, and yellow-gray dolomitic mudstone. These layers occur alternately in the vertical direction, indicating that the lake basin’s sedimentary environment and terrigenous material input changed significantly in this period. The 3891–3900 m section is primarily composed of thin black laminar shale and thick dark-grey laminar shale, accounting for 95% thickness of layer, with small amounts of massive mudstone and argillaceous siltstone. The TOC is high in this section, with mass fractions of 1.1–2.5% and an average of 1.5%. The lithofacies characteristics show that the water body of the lake basin was relatively deep, and there are semi-deep and some deep lake facies, with a relatively low input of terrigenous material. The lithology and lithofacies of the 3983–4000 m are also highly variable. The lithology is primarily composed of dark-grey mud shale, grey mudstone, yellow-grey dolomitic mudstone, and light-grey argillaceous interbedded siltstone. The lithofacies consist of thick laminar shale interbedded with massive mudstone, a small amount of laminar shale, and several thin laminar argillaceous siltstone lithofacies. Vertically, the lithofacies indicate a deepening of the water body toward the top. They are composed of a thin layer of argillaceous silt and massive mudstone or laminar shale. The layers become thinner toward the top, and the lamellar layer becomes more developed. The average thickness of a single layer exceeds 1 m. The mud shale in this section indicates a shallow lake environment and some areas of a semi-deep lake environment, with extensive source material input. The TOC is low (0.6–1.2%), with an average of 0.7%. The lithology, lithofacies, and organic matter content of the two coring sections differ, representing two different sedimentary environments and lithofacies development of Es3.
The mineral contents difference of the different lithofacies in the two coring sections is relatively low. The mass fractions are 40–45% for felsic material, 30% for clay, and 20% for carbonate, with small amounts of organic matter and pyrite. The main difference is the higher organic matter and pyrite contents in the upper section (mass fraction of two is 4–5%) and the lower contents of clay minerals (28–30%), while lower organic matter and pyrite in the lower section (2–3%), and higher clay mineral content is (29–32%). These results show a negligible change in the source material during the sedimentation period of Es3 in the upper section due to the large difference in water depth and sedimentary facies, affecting the spatial distribution of the lithofacies characteristics.

4.5. Pore Characteristics in the Mud Shale

The pores of the mud shale are highly heterogeneous, and the pore size distribution differs from that of conventional reservoirs. Most pores are micro and nanopores, and the nanopores account for the majority [34,35]. High-pressure mercury porosimetry and nitrogen adsorption analysis have been used to characterize pore spaces [4,36,37]. We used these methods and SEM to clarify the pore size distribution of the shale with different lithofacies.
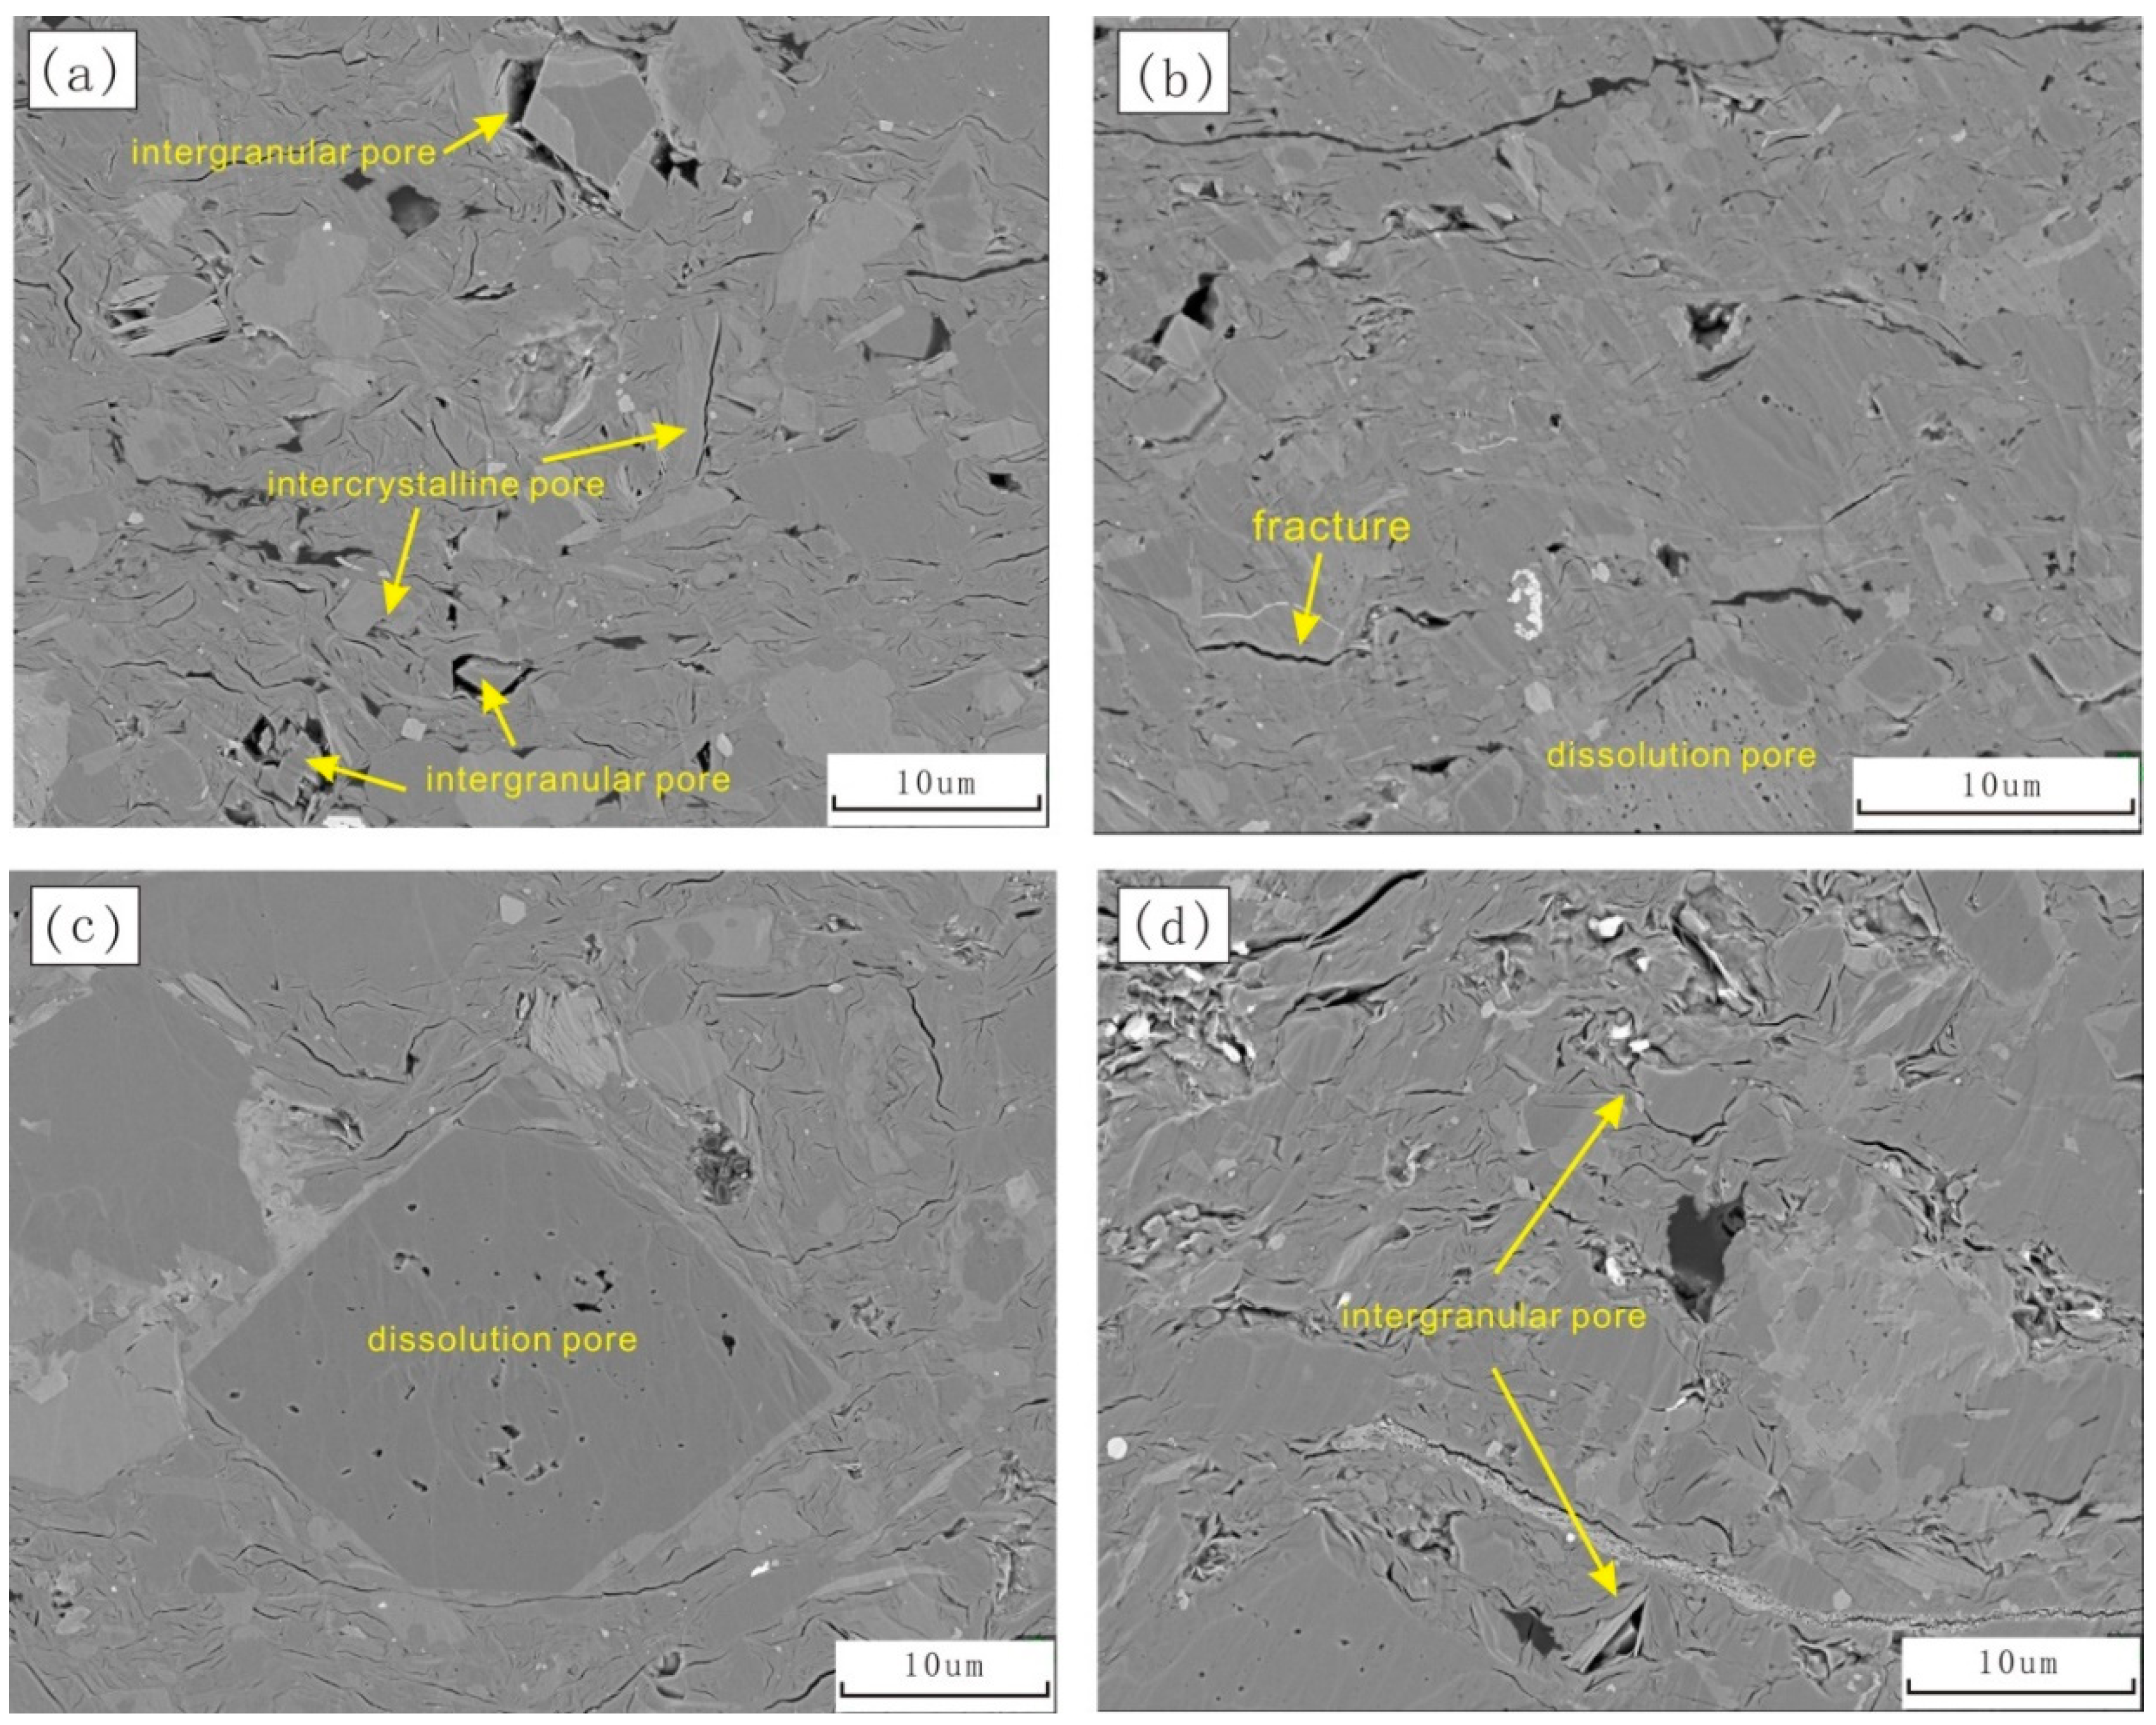
Shale pores have been categorized into organic pores, inorganic pores, and fractures. The inorganic pores can be divided into intergranular pores, intercrystalline pores, dissolution pores, and other pores. Zhao (2020) classified the mud shale in the Es3 in the Qikou Depression into matrix pores and fractures and further divided them into intergranular pores, intercrystalline pores, organism cavity pores, organic pores and bedding fractures, and structural (micro) fractures [18]. Following this example, we categorized the pores in the mud shale with different lithofacies based on the pore development type and characteristics (Figure 9). The SEM analysis shows that the pores in the felsic and calcareous laminae of the thin and thick laminar shale with a medium TOC are relatively well developed. There are many intergranular pores with a diameter of 0.5–2 um in diameter, some intercrystalline pores in the clay minerals, and dissolution pores in the calcareous minerals. There are no organic matter pores because of the low degree of organic matter evolution. In contrast, the pores in the thick laminar shale with low TOC and the massive mudstone are poorly developed. There are no intergranular pores, a few dissolution pores, and clay mineral intercrystalline pores. The reasons are as follows. First, the clay mineral content is low in the felsic and calcareous laminae, and the interparticle space is not completely filled with clay minerals. Second, the dissolution of some clay and calcareous minerals by organic acids generated during hydrocarbon generation in the laminar shale with a higher TOC promoted the development of intergranular and solution pores.
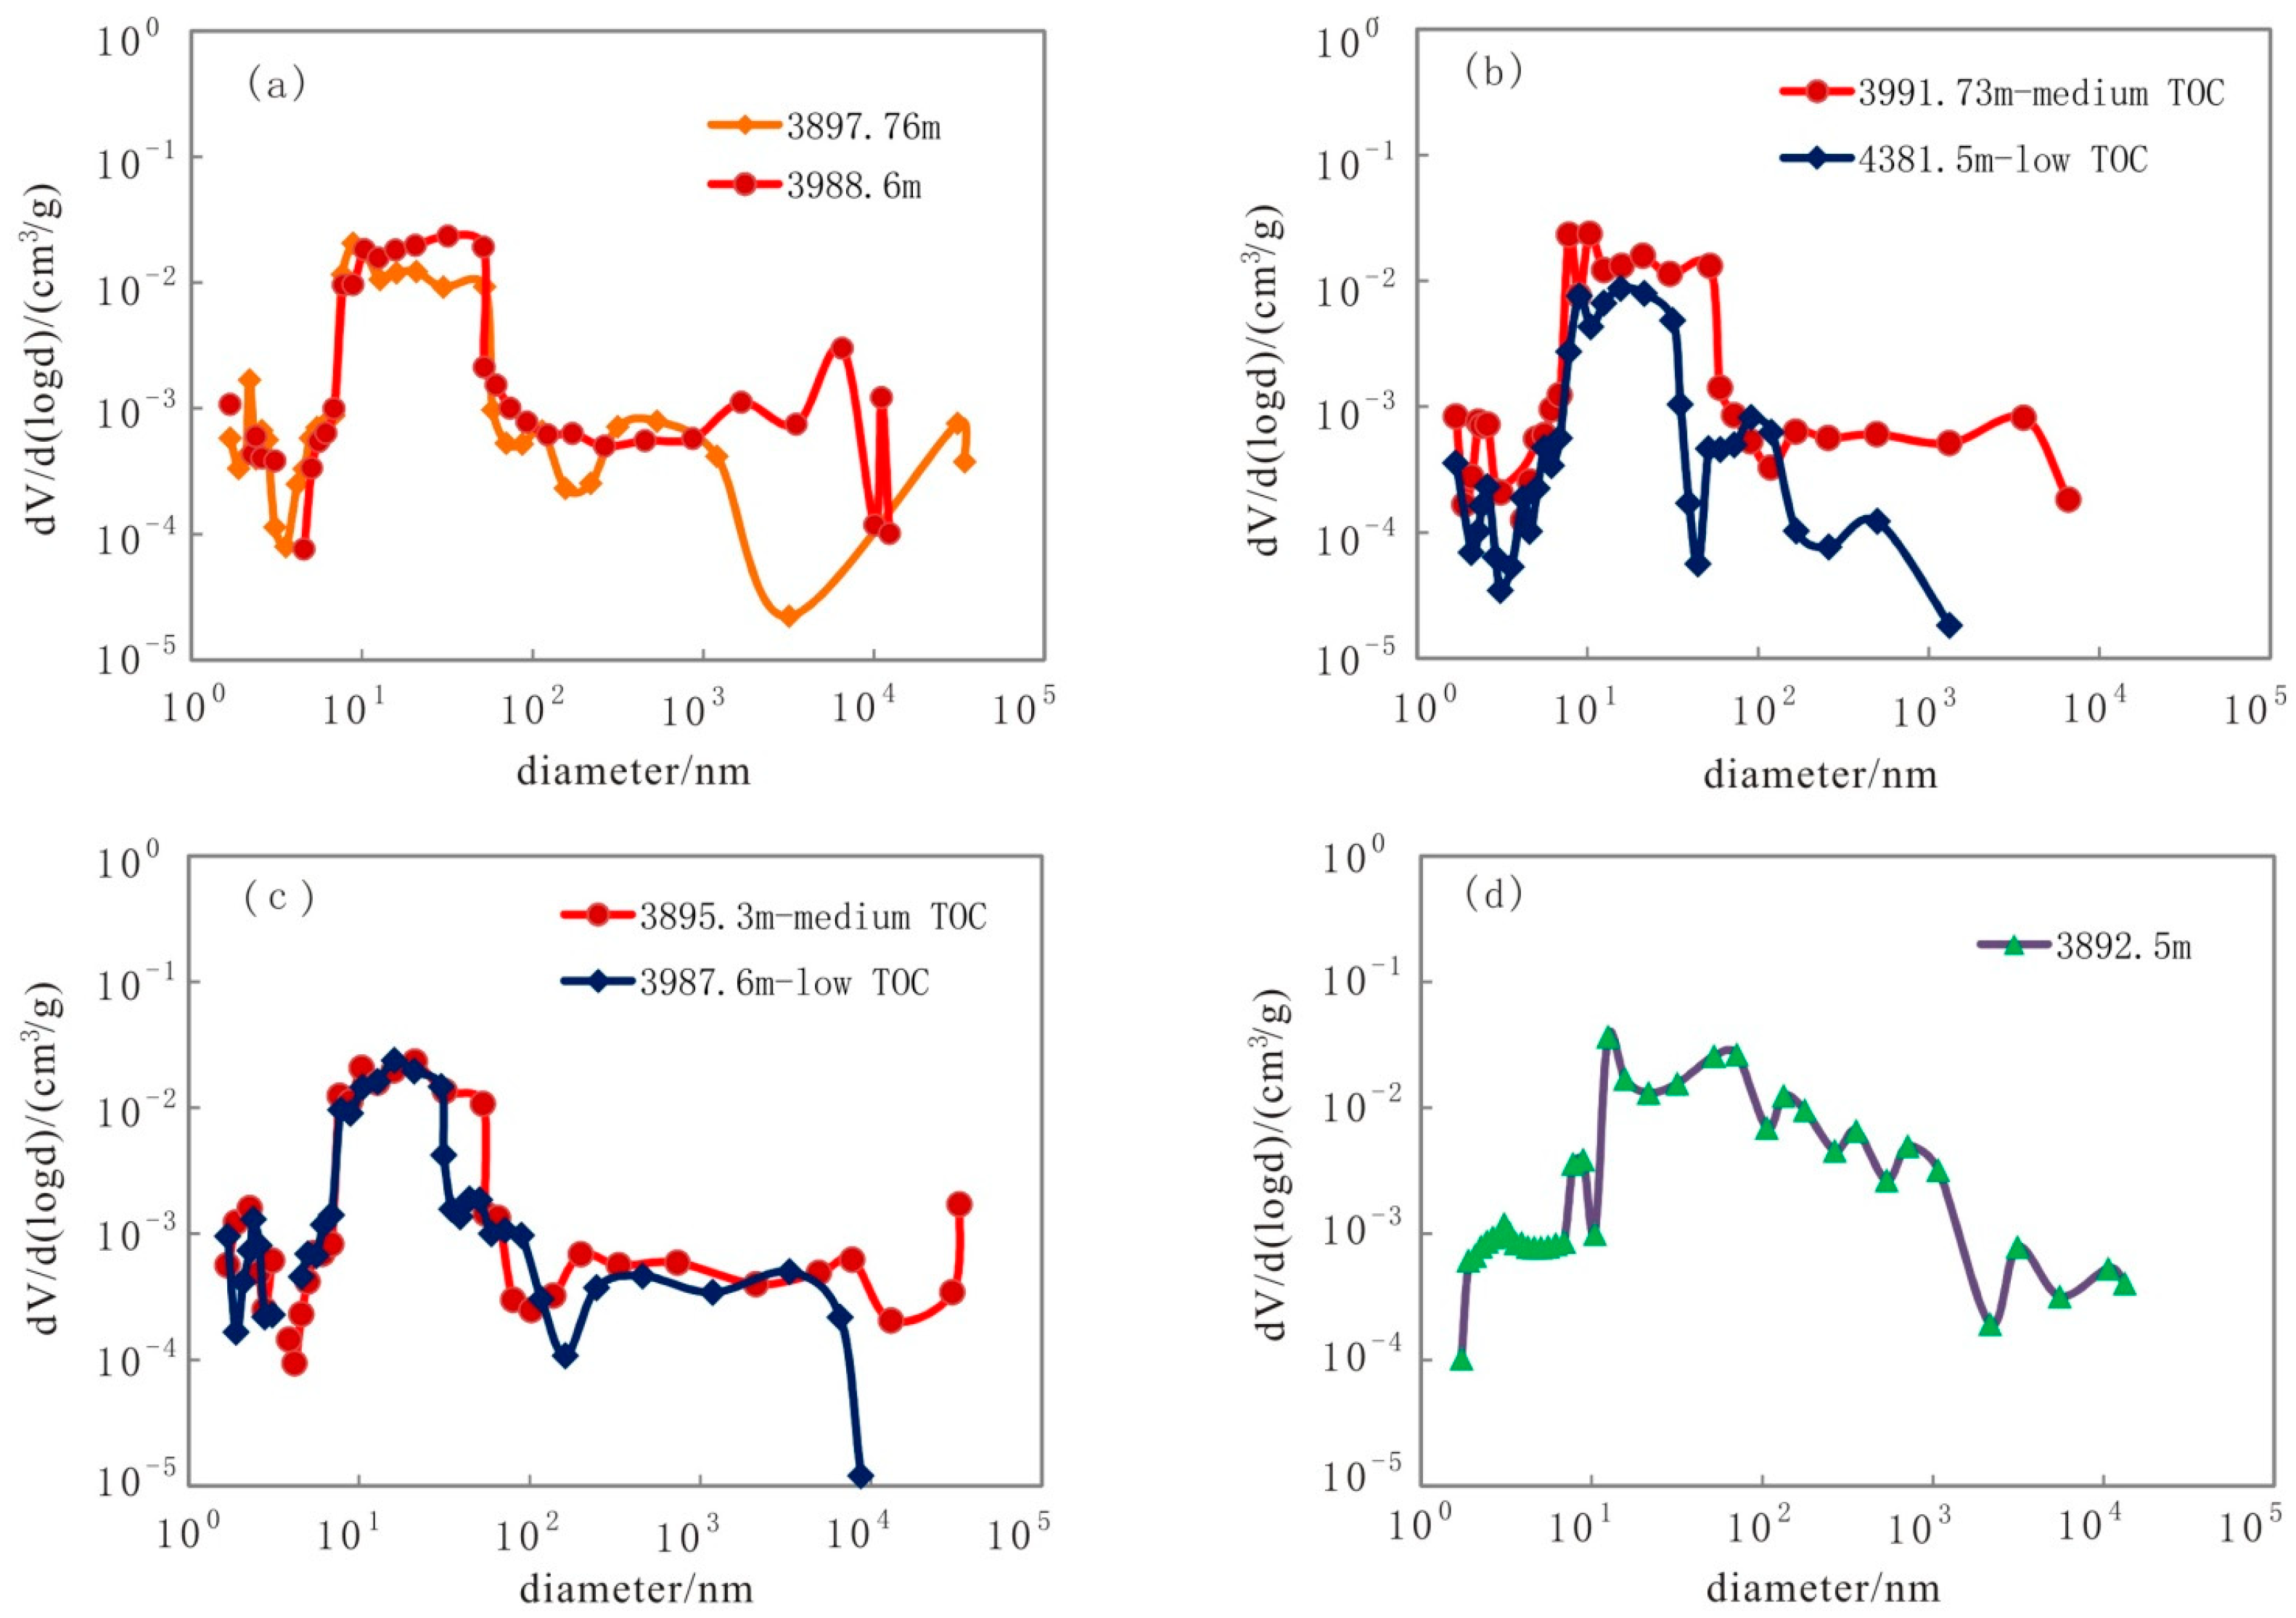
The results of constant-rate mercury intrusion porosimetry and nitrogen adsorption analysis are shown in Figure 10. The mud shale with different lithofacies shows well-distributed pores, with a pore diameter range of 2 nm to 10 um. Pores with a diameter of 10–100 nm are developed in all lithofacies, whereas differences are observed in the abundance of macropores with a pore diameter greater than 100 nm. The thin laminar shale, thick laminar shale, and massive mudstone with a medium organic matter content have many macropores. The pore diameter in the thin laminar shale exceeds 10 um, whereas there are few macropores in the massive mudstone with low TOC. More than 80% of the massive mudstone has low TOC. In addition, there are few micropores in the siltstone. The laminar shale has more micropores, whereas the massive mudstone is dominated by nanopores. These results are consistent with the SEM results.
In addition, research and exploration have shown that fractures can significantly improve shale oil reservoir performance, especially permeability [38,39]. The core observations and thin section analysis show well-developed fractures in the shale of E2s3. These are divided into high-angle structural fractures and low-angle bedding fractures. The fracture density is 80–120 pieces/m. Most are bedding fractures (80%), and structural fractures only account for 20%. The highest density of bedding joints occurs in the thin laminar shale, with an average fracture density of 110 pieces/m, followed by the thick laminar shale (80 pieces/m) and the massive mudstone (30 pieces/m). Therefore, the more developed the laminae are, the greater the fracture density, porosity, and permeability are.

4.6. Residual Hydrocarbon Content in the Mud Shale

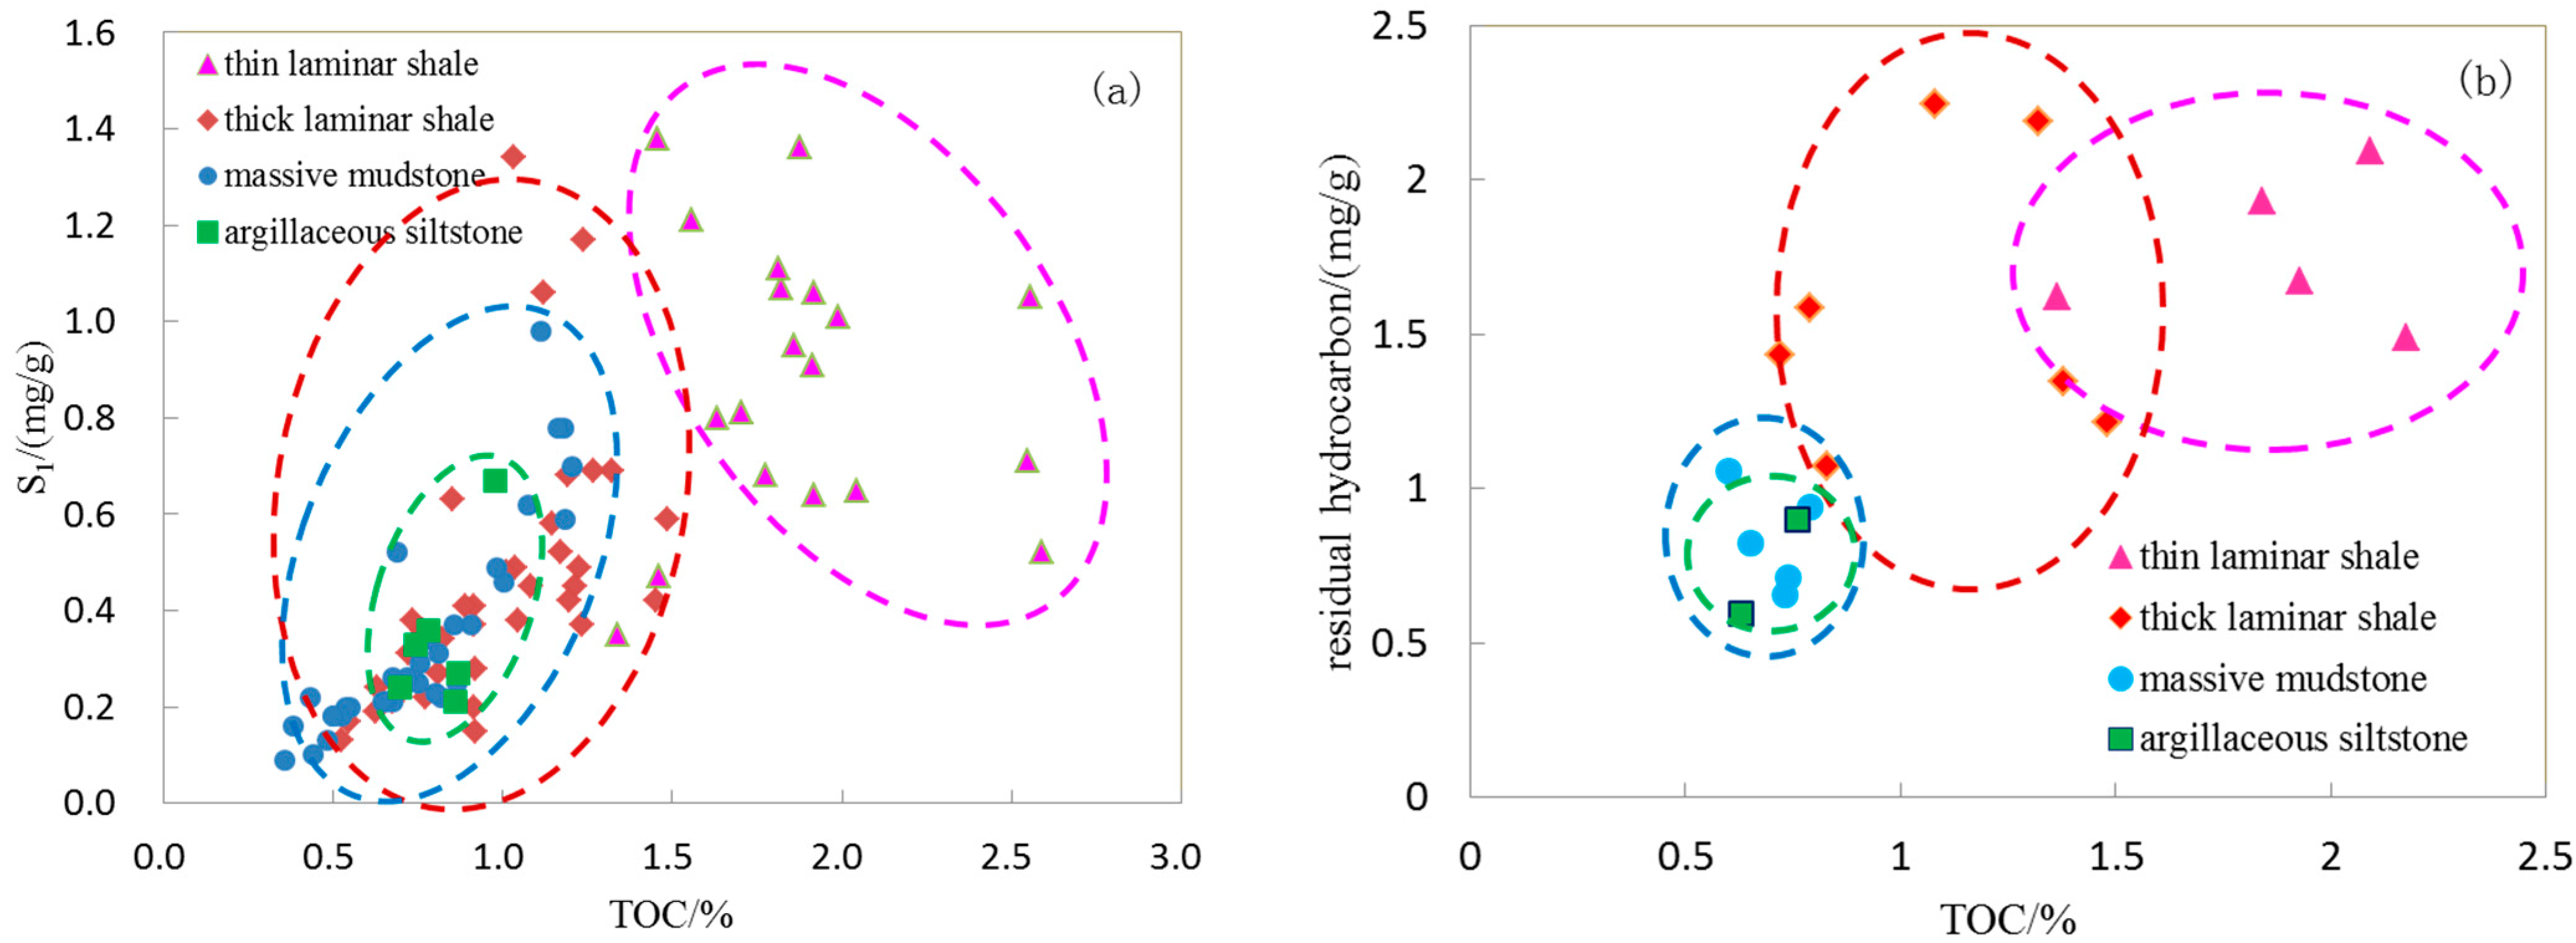
Residual hydrocarbons are the main source of oil and gas in shale. The concentration of residual hydrocarbons largely determines the enrichment degree and sweet spots of shale oil. Two geochemical methods, rock pyrolysis and extraction, are usually used to characterize residual hydrocarbons [20,40]. The pyrolysis analysis shows that the content of free hydrocarbon (S1) in the mud shale of Es3 is generally low, ranging from 0.1 to 1.4 mg/g (Figure 11a). The mud shale with different lithofacies has different free hydrocarbon contents. The free hydrocarbon content is the highest in the thin laminar shale (0.6–1.4 mg/g), with an average of 1.0 mg/g. Due to the large range in the organic matter content of the thick laminar shale, the free hydrocarbon content has a large range (0.2–1.4 mg/g), but the main content is 0.2–0.7 mg/g, with an average of 0.45 mg/g. The free hydrocarbon range of the massive mudstone and argillaceous siltstone is 0.1–0.8 mg/g, and the average S1 is also low (0.35 mg/g). In general, when the TOC OF mud shale is lower than 1.5%, the free hydrocarbon content is highly correlated with the TOC. This is not the case when the TOC is higher than 1.5%. The soluble organic matter content, i.e., the residual hydrocarbon content, can be obtained from the shale samples by chloroform extraction. As shown in Figure 10b, the residual hydrocarbon content of the shale in Es3 is 0.6–2.3 mg/g. The laminar shale has a high content (1.0–2.3 mg/g), whereas the massive mudstone and argillaceous siltstone have low contents (0.6–1 mg/g).

5. Discussion

5.1. Effect of Shale Lithofacies on Shale Oil Content

From the Figure 11, it is clear that the shale oil content is mainly controlled by its TOC. Due to the differences in the TOC content, shales with different lithofacies have different shale oil content. If the laminar shale has a high TOC content, the shale oil content is also high. In contrast, the residual hydrocarbon content is generally low if the massive mud shale and argillaceous siltstone have low TOC contents. If pyrolysis and extraction methods cannot comprehensively evaluate shale oil content, some indirect methods such as two-dimensional nuclear magnetic resonance spectroscopy and particle fluorescence analysis [41,42,43] can be used to further analyze the main controlling factors of shale oil enrichment in different lithofacies.
Two-dimensional nuclear magnetic resonance spectroscopy has been widely used for the analysis of shale oil and gas. It provides the properties of the pore fluid and the states of oil and water, such as free oil, free water, adsorbed oil, and clay mineral-bound water. Figure 12 shows that the free oil content(area B) of the laminar shale (both the thin and thick laminar shales) is high (2.0–3.5 uL/g), and those of the massive mudstone and siltstone are low (1.0–2.0 uL/g), in agreement with the pyrolysis analysis results. Further analysis shows that residual hydrocarbon content of the laminar shale is more than twice that of the massive mudstone and siltstone. One reason is the high hydrocarbon generation capacity of shale with high organic carbon content. Another is the development of micron and submicron pores in the laminar shale. The connectivity is good, the pore space to store hydrocarbons is large, and the hydrocarbon content is high. However, the massive mudstone and siltstone have low hydrocarbon generation capacity due to their low organic carbon contents. They have fewer pores, especially macropores, resulting in a low content of residual hydrocarbons.

5.2. Effect of the Source-Reservoir Relationship on Shale Oil Enrichment

Our analysis shows that the organic carbon content of the shale in Es3 of the Qibei Slope is generally low, with mass fractions of 0.5–2.5%. The geochemical analysis shows that the free hydrocarbon content S1 of the shale in Es3 is 0.2–1.2 mg/g, both lower than that of the shales of the Kongdian Formation in the Cangdong Sag, Bohai Bay basin, and the Qingshankou Formation in the Gulong Sag, Songliao Basin [14,26]. Therefore, the mud shale with relatively high organic carbon and residual hydrocarbon contents is critical for shale oil development in this area. The thin and thick laminar shales with a medium organic content have relatively high TOC, representing an important shale oil source in this area. The felsic and carbonate laminae of these two lithofacies are relatively well-developed and have sufficient intergranular and dissolution pores for the storage of shale oil. Thus, the hydrocarbons generated by organic matter in the clay laminae can enter the pores. In addition, the mud shale with well-developed laminae also has bedding joints that are crucial spaces for shale oil accumulation. Therefore, the organic-rich laminar shale has a good source-reservoir relationship and a high content of residual hydrocarbons, representing a sweet spot for shale oil (Figure 13).
The massive mudstone and siltstone have low organic matter contents, low hydrocarbon generation capacities, few macropores. The coring section shows that the shale adjacent to this type of lithofacies has a low content, and there are a few oil sources near massive mudstone and argillaceous siltstone. Therefore, the thick massive mudstone, siltstone, and their interbeds have an unfavorable source-reservoir relationship, low residual hydrocarbon content, and poor shale oil enrichment conditions. If these lithofacies could interact with or be sandwiched between organic-rich shale, their oil-bearing properties would be improved.
Therefore, shale laminae, especially organic-rich dark thin laminae, influence the organic matter content and the development of micropores. The combination of organic-rich, felsic, and carbonate laminae produces a good source rock-reservoir relationship. After the formation of shale oil, it can be discharged into the reservoir at a short distance to accumulate and create a shale oil enrichment area. Laminar shale mainly developed in the semi-deep and deep lake facies far away from the sediment source supply. Therefore, deep lake facies organic-rich laminar shale in the center of the eastern sag in the Qibei slope shows better development and has a higher content and thickness of organic matter and more abundant shale oil. This type of lithofacies has the highest values for shale oil exploration of Es3 in Qikou sag.

6. Conclusions

According to the laminated structure, lithological characteristics and mineral composition, the shale in Es3 on the Qibei slope of the Qikou sag was divided into four lithofacies: thin laminar shale, thick laminar shale, massive mudstone, and argillaceous siltstone. It was further divided into six subcategories based on the organic matter content. All lithofacies exhibited thin alternating layers in the longitudinal direction.
The laminar shale and few massive mudstone had high contents of organic carbon (TOC average 1.1–1.6%), sufficient micropores (diameter of 0.5–2 um) and fractures, which can form good source rock and reservoir for shale oil. Among them, the thin laminar shale had the highest TOC(average 1.6%), and carbonate (average 23.2%) as well as pyrite content (average 3.8%), and the thick laminar shale took the second place, with average TOC of 1.0%, and higher carbonate (average 21.7%) as well as pyrite content (average 1.7%). In contrast, majority massive mudstone and argillaceous siltstone had low organic carbon contents (TOC average 0.4–1.0%) and few micropores.
The residual hydrocarbon content was positively correlated with the organic matter content in the mud shale. The pyrolysis and extraction analysis indicated that the residual hydrocarbon content were higher for the thin and thick laminar shales (1.5–2.5 mg/g and 0.8–1.5 mg/g) than for the massive mudstone and argillaceous siltstone (0.6–0.8 mg/g). The nuclear magnetic resonance spectroscopy showed that the free oil content of the laminar shale (both the thin and thick laminar shales) is high (2.0–3.5 uL/g), and those of the massive mudstone and siltstone are low (1.0–2.0 uL/g).
The content of organic-rich laminae in shale affected the development of micropores and the residual hydrocarbon content. Thin interbeds of organic-rich laminae, felsic, and carbonate laminae developed in the laminar shale, creating a favorable source-reservoir relationship and controlling the distribution of shale oil enrichment area. Shale oil exploration should focus on the semi-deep and deep lake facies in the center of the eastern depression of the Qibei slope, in which the laminar shale with higher organic matter and residual hydrocarbon contents developed.

Author Contributions

Conceptualization, W.L. and Y.L.; methodology, C.B.; software, X.Z.; validation, B.G.; formal analysis, C.M.; investigation, Q.T.; resources, X.P. and K.Z.; data curation, C.B.; writing—original draft preparation, C.B.; writing—review and editing, C.B. and X.Z.; visualization, Q.T.; supervision, B.G.; project administration, C.B.; funding acquisition, W.L. All authors have read and agreed to the published version of the manuscript.

Funding

This research was funded by National Natural Science Foundation of China (Grant Numbers. U22B6004).

Data Availability Statement

The data that support the findings of this study are available from the corresponding author, upon reasonable request.

Conflicts of Interest

The authors declare no conflict of interest.

References

  1. EIA. Annual Energy Outlook. 2021. Available online: http://www.eia.gov/outlooks (accessed on 14 January 2021).
  2. Ma, Y.; Cai, X.; Zhao, P.; Hu, Z.; Liu, H.; Gao, B.; Wang, W. Geological characteristics and exploration practices of continental shale oil in China. Acta Geol. Sin. 2022, 96, 155–171. [Google Scholar]
  3. Li, M.; Ma, X.; Jiang, Q.; Li, Z.; Pang, X.; Zhang, C. Enlightenment from formation conditions and enrichment characteristics of marine shale oil in North America. Pet. Geol. Recovery Effic. 2019, 26, 13–28. [Google Scholar]
  4. Zhang, T.; Peng, Z.; Yang, W.; Ma, Y.; Zhang, J. Enlightenments of American shale oil research towards China. Lithol. Reserv. 2015, 27, 1–10. [Google Scholar]
  5. Wang, G.; Carr, T.R. Organic-rich Marcellus Shale lithofacies modeling and distribution pattern analysis in the Appalachian Basin. AAPG Bull. 2013, 97, 2173–2205. [Google Scholar] [CrossRef] [Green Version]
  6. Zhao, W.; Hu, S.; Hou, L.; Yang, T.; Li, X.; Guo, B.; Yang, Z. Types and resource potential of continental shale oil in China and its boundary with tight oil. Pet. Explor. Dev. 2020, 47, 1–10. [Google Scholar] [CrossRef]
  7. Hu, S.; Bai, B.; Tao, S.; Bian, C.; Zhang, T.; Chen, Y.; Liang, X. Heterogeneous geological conditions and differential enrichment of medium and high maturity continental shale oil in China. Pet. Explor. Dev. 2022, 49, 224–237. [Google Scholar] [CrossRef]
  8. Xiao, W.; Zhang, B.; Yao, Y.; Wang, Y.; Yang, H.; Yang, K. Lithofacies and sedimentary environment of shale of Permian Longtan Formation in eastern Sichuan Basin. Lithol. Reserv. 2022, 34, 152–162. [Google Scholar]
  9. Kang, J.; Wang, X.; Xie, S.; Zeng, D.; Du, H.; Zhang, R.; Zhang, S. Lithofacies types and reservoir characteristics of shales of Jurassic Da’anzhai member in central Sichuan Basin. Lithol. Reserv. 2022, 34, 53–65. [Google Scholar]
  10. Teichert, C. Concepts of facies. AAPG Bull. 1958, 42, 2718–2744. [Google Scholar]
  11. Song, Z.; Li, J.; Li, X.; Chen, K.; Wang, C.; Li, P.; Wei, Y.; Zhao, R.; Wang, X.; Zhang, S.; et al. Coupling Relationship between Lithofacies and Brittleness of the Shale Oil Reservoir: A Case Study of the Shahejie Formation in the Raoyang Sag. Geofluids 2022, 2022, 2729597. [Google Scholar] [CrossRef]
  12. Liu, B.; Wang, H.; Fu, X.; Bai, Y.; Jia, M.; He, B. Lithofacies and depositional setting of a highly prospective lacustrine shale oil succession from the Upper Cretaceous Qingshankou Formation in the Gulong sag, northern Songliao Basin, northeast China. AAPG Bull. 2019, 103, 405–432. [Google Scholar] [CrossRef] [Green Version]
  13. Gao, F.; Song, Y.; Li, Z.; Xiong, F.; Lei, C.; Zhang, Y.; Liang, Z. Lithofacies and reservoir characteristics of the Lower Cretaceous continental Shahezi Shale in the Changling Fault Depression of Songliao Basin, NE China. Mar. Pet. Geol. 2018, 98, 401–421. [Google Scholar] [CrossRef]
  14. Sun, L.; Liu, H.; He, W.; Li, G.; Zhang, S.; Zhu, R.; Jin, X. An analysis of major scientific problems and research paths of Gulong shale oil in Daqing Oilfield, NE China. Pet. Explor. Dev. 2021, 48, 453–463. [Google Scholar] [CrossRef]
  15. Jin, C.; Dong, W.; Bai, Y.; Lv, J.; Fu, X.; Li, J.; Ma, S. Lithofacies characteristics and genesis analysis of Gulong shale in Songliao Basin. Pet. Geol. Oilfield Dev. Daqing 2020, 39, 35–44. [Google Scholar]
  16. Wang, Y.; Liang, J.; Zhang, J.; Zhao, B.; Zhao, Y.; Liu, X.; Xian, D. Resource potential and exploration direction of Gulong shale oil in Songliao Basin. Pet. Geol. Oilfield Dev. Daqing 2020, 39, 20–34. [Google Scholar]
  17. Zhao, X.; Zhou, L.; Pu, X.; Jin, F.; Shi, Z.; Han, W.; Jiang, W. Formation conditions and enrichment model of retained petroleum in lacustrine shale: A case study of the Paleogene in Huanghua depression, Bohai Bay Basin, China. Pet. Explor. Dev. 2020, 47, 856–869. [Google Scholar] [CrossRef]
  18. Zhao, X.; Zhou, L.; Pu, X.; Shi, Z.; Han, G.; Wu, J.; Han, W. Geological characteristics and exploration breakthrough of shale oil in Member 3 of Shahejie Formation of Qibei subsag, Qikou sag. Acta Pet. Sin. 2020, 41, 643–657. [Google Scholar]
  19. Zhou, L.; Han, G.; Yang, F.; Ma, J.; Mou, L.; Zhou, K.; Wang, C. Geological characteristics and shale oil exploration of Es 3 in Qikou Sag, Bohai Bay Basin. Oil Gas Geol. 2021, 42, 443–454. [Google Scholar]
  20. Sun, Z.; Wang, F.; Han, Y.; Hou, Y.; He, S.; Luo, J.; Zheng, Y. Multi-scale characterization of the spatial distribution of movable hydrocarbon in intersalt shale of Qianjiang Formation, Qianjiang Sag, Jianghan Basin. Pet. Geol. Exp. 2020, 42, 586–595. [Google Scholar]
  21. Zhou, L.; Chen, C.; Han, G.; Yang, F. Difference Characteristics between Continental Shale Oil and Tight Oil and Exploration Practice: A Case from Huanghua Depression, Bohai Bay Basin. Earth Sci. 2021, 46, 555–571. [Google Scholar]
  22. Han, G.; Si, W.; Shi, Q.; Zhang, L.; Zhou, K.; Wang, Y. Conditions of Lithologic reservoir formation and favorable selection of exploration area in North Slope of Qikou Sag. Nat. Gas Geosci. 2010, 21, 594–600. [Google Scholar]
  23. Zhao, X.; Pu, X.; Wang, J.; Zhou, L.; Jin, F.; Xiao, D.; Jiang, W. Sand and reservoir controlling mechanism and exploration discovery in the gentle slope of fault basin: A case study of Qibei slope in Qikou sag. Pet. Explor. Dev. 2017, 38, 729–739. [Google Scholar]
  24. Zhou, L.; Chen, C.; Han, G.; Yang, F.; Ma, J.; Zhou, K.; Zhang, W. Geological characteristics and shale oil exploration potential of lower first member of Shahejie Formation in Qikou Sag, Bohai Bay Basin. Earth Sci. 2019, 44, 2736–2750. [Google Scholar]
  25. Liu, H.; Hu, S.; Li, J.; Wang, J.; Wang, Q.; Jiang, W.; Jiang, T. Controlling factors of shale oil enrichment and exploration potential in Lacustrine Bohai Bay Basin. Nat. Gas Geosci. 2019, 30, 1190–1198. [Google Scholar]
  26. Han, W.; Zhao, X.; Jin, F.; Pu, X.; Chen, S.; Mou, L.; Zhang, W. Sweet spots evaluation and exploration of lacustrine shale oil of the second member of Paleogene Kongdian Formation in Cangdong Sag, Bohai Bay Basin. Pet. Explor. Dev. 2021, 48, 777–786. [Google Scholar] [CrossRef]
  27. Gong, K.; Jiao, F.; Chen, Y.; Liu, X.; Pan, X.; Han, X.; Hou, X. Insights into the Site-Selective dsorption of Methanol and Water in Mordenite Zeolite by 129Xe NMR Spectroscopy. J. Phys. Chem. C 2019, 123, 17368–17374. [Google Scholar] [CrossRef]
  28. Peng, L.; Zhang, C.; Ma, H.; Pan, H. Estimating irreducible water saturation and permeability of sandstones from nuclear magnetic resonance measurements by fractal analysis. Mar. Pet. Geol. 2019, 110, 565–574. [Google Scholar] [CrossRef]
  29. O’Brien, N.R. Shale lamination and sedimentary processes. Geol. Soc. 1996, 116, 23–36. [Google Scholar] [CrossRef]
  30. Ingram, R.L. Terminology for the thickness of stratification and parting units in sedimentary rocks. GSA Bull. 1954, 65, 937–938. [Google Scholar] [CrossRef]
  31. Campbell, C.V. Lamina, laminaset, bed and bedset. Sedimentology 1967, 8, 7–26. [Google Scholar] [CrossRef]
  32. Liu, G.; Huang, Z.; Jiang, Z.; Chen, J.; Chen, C.; Gao, X. The characteristic and reservoir significance of lamina in shale from Yanchang Formation of Ordos Basin. Nat. Gas Geosci. 2015, 26, 408–417. [Google Scholar]
  33. Bian, C.; Zhao, W.; Yang, T.; Liu, W.; Dai, C.; Zeng, X.; Wang, K.; Li, Y.; Xiao, D. The Impact of Lamina Characteristics and Types on Organic Matter Enrichment of Chang 73 Submember in Ordos Basin, NW China. Geofluids 2022, 2022, 6558883. [Google Scholar] [CrossRef]
  34. He, J.; Ding, W.; Fu, J.; Li, A.; Dai, P. Study on genetic type of micropore in shale reservoir. Lithol. Reserv. 2014, 26, 30–35. [Google Scholar]
  35. Sun, W.; Li, W.; Dong, Z.; Yan, X.; Li, Y.; Li, S. A new approach to the characterization of shale pore structure. Lithol. Reserv. 2017, 29, 125–130. [Google Scholar]
  36. Lu, S.; Li, J.; Zhang, P.; Xue, H.; Wang, G.; Zhang, J.; Liu, H. Classification of microscopic pore-throats and the grading evaluation on shale oil reservoirs. Pet. Explor. Dev. 2018, 45, 436–444. [Google Scholar] [CrossRef]
  37. Wang, W.; Lu, S.; Tian, W.; Li, J.; Tian, N.; Shan, J.; Hu, Y. Liaohe Oilfield shale reservoir quality grading with micropore evaluation parameters in Damintun Depression. J. China Univ. Pet. 2016, 40, 12–19. [Google Scholar]
  38. Du, X.; Jin, Z.; Zeng, L.; Li, S.; Liu, G. Development characteristics and controlling factors of natural fractures in Chang 7 shale oil reservoir, Longdong Area, Ordos Basin. Earth Sci. 2022, 1–17. [Google Scholar]
  39. Wang, R.; Hu, Z.; Zhou, T.; Bao, H.; Wu, Q.; Du, W.; He, J. Characteristics of fractures and their significance for reservoirs in Wufeng-Longmaxi shale, Sichuan Basin and its periphery. Oil Gas Geol. 2021, 42, 1295–1306. [Google Scholar]
  40. Jiang, Q.; Li, M.; Qian, M.; Li, Z.; Li, Z.; Huang, Z.; Ma, C. Quantitative characterization of shale oil in different occurrence states and its application. Pet. Geol. Exp. 2016, 38, 842–849. [Google Scholar]
  41. Tian, S. Micro-Pore Characteristics of Shale Reservoirs and Evaluation of Shale Oil Occurrence and Movability. Ph.D. Thesis, China University of Petroleum (East China), Dongying, China, 2019; 154p. [Google Scholar]
  42. Feng, G.; Li, J.; Liu, J.; Zhang, X.; Yu, Z.; Tan, J. Discussion on the enrichment and mobility of continental shale oil in Biyang Depression. Oil Gas Geol. 2019, 40, 1236–1336. [Google Scholar]
  43. Liu, K.; Lu, X.; Gui, N.; Fan, J.; Gong, Y.; Li, X. Quantitative Fluoresence Techniques and their Applications in Hydrocarbon Accumulation Studies. Earth Sci. 2016, 41, 373–384. [Google Scholar]
Figure 1. Plane distribution of sedimentary facies (left) and stratigraphic column (right) of the upper part of Es3 in Qibei slope, Qikou Sag, Bohai Bay basin (modified from document [21]).
Energies 16 02107 g001
Figure 2. Comprehensive stratigraphic histogram of upper part of Es3 in well F39x1.
Energies 16 02107 g002
Figure 3. Schematic diagram of the experiments performed in this study.
Energies 16 02107 g003
Figure 4. Mineral composition and average content of shale at different depths in the upper part of Es3 in well F39x1.
Energies 16 02107 g004
Figure 5. Ternary diagram of shale mineral at different depths in the upper part of Es3 in well F39x1.
Energies 16 02107 g005
Figure 6. X-ray fluorescence (XRF) elements scan figure of different shale lithofacies in the upper Es3 member of Qibei slope. (a) Thin laminar shale, 3899.2 m, felsic, clayey, and calcareous lamina interbedding; (b) thin laminar shale, 3993.28 m, felsic, clayey and pyrite lamina interbedding; (c) thick laminar shale, 4377.2 m, the content of felsic in the upper bright lamina is high, the content of clay in the lower dark lamina is high; (d) massive mudstone, 3894.2 m, clayey and felsic are randomly distribute.
Energies 16 02107 g006
Figure 7. Photos of cores and thin sections of different lithofacies of the upper Es3 in Qibei slope. (a) Thin laminar shale, 3993.28 m; (b) medium organic matter thick laminar shale, 4377.2 m; (c) low organic matter thick laminar shale 3997.9 m; (d) medium organic matter massive mudstone, 3989.7 m; (e) low organic matter massive mudstone, 4381.1 m; (f) argillaceous siltstone, 3892.5 m.
Energies 16 02107 g007
Figure 8. Comprehensive histogram of lithology and lithofacies distribution of upper Es3 coring section in F39x1.
Energies 16 02107 g008
Figure 9. SEM pore characteristics of different shale lithofacies of Es3 in F39x1. (a) Thin laminar shale, 4385.4 m; (b) medium organic matter thick laminar shale, 3893.5 m; (c) low organic matter thick laminar shale 3899.77 m; (d) low organic matter massive mudstone, 3986.8 m.
Energies 16 02107 g009
Figure 10. Pore distribution of different shale lithofacies of Es3. (a) Thin laminar shale; (b) thick laminar shale; (c) massive mudstone; (d) argillaceous siltstone.
Energies 16 02107 g010
Figure 11. Distribution of residual hydrocarbon content in different shale lithofacies of Es3. (a) Pyrolysis S1 of mud shale with different lithofacies; (b) residual hydrocarbon of extraction in mud shale with different lithofacies.
Energies 16 02107 g011
Figure 12. 2D NMR shale oil content analysis of different shale lithofacies in Es3. (a) Thin laminar shale, 4381 m; (b) thick laminar shale, 3895.6 m; (c) massive mudstone 4373.35 m; (d) argillaceous siltstone, 3992.5 m.
Energies 16 02107 g012
Figure 13. Shale oil enrichment mode of different lithofacies in Es3 formation.
Energies 16 02107 g013
Table 1. Classification characteristics of shale lithofacies in Es3 formation.
Lithofacies TypeStructure CharacteristicAbundance of Organic MatterMineral Content of Lamina
Thin laminar shale Dark gray laminae development, a single layer thickness < 1 cmTOC content > 1.0%Composed of felsic and clay minerals, with high pyrite content
Thick laminar shaleMedium organic matter thick laminar shale composed of light and dark laminar interbedding, a single layer thickness >1 cmTOC content > 1.0%bright lamina is light gray felsic, and dark lamina is dark gray organic rich clay mineral
Low organic matter thick laminar shaleComposed of light and dark laminar interbedding, light laminae are higher, a single layer thickness >1 cm in averageTOC content < 1.0%The thickness of dark lamina is significantly lower than that of bright layer
Massive mudstoneMedium organic matter massive mudstonegray Massive, lamina is not developmentTOC content > 1.0%Felsic and clay minerals are distributed randomly
low organic matter massive mudstoneGray-yellow gray massive, lamina is not developmentTOC content < 1.0%The content of calcite or dolomite is relatively high
Argillaceous siltstoneLight gray bedded, silt textureTOC content < 1.0%The content of felsic is usually greater than 50%
Table 2. Statistical table of shale facies mineral composition and organic matter content in Es3 member (unit: mass fraction%).
LithofaciesQuartzFeldsparClayCarbonatePyriteOrganic Atter
Thin laminar shale386.42823.23.81.6
Medium organic matter thick laminar shale37.55.73123.42.21.2
Low organic matter thick laminar shale38.75.833.9201.20.8
Medium organic matter massive mudstone40.65.429.620.731.1
Low organic matter massive mudstone37.76.232.820.81.50.6
Argillaceous siltstone4210.42818.31.10.8
Disclaimer/Publisher’s Note: The statements, opinions and data contained in all publications are solely those of the individual author(s) and contributor(s) and not of MDPI and/or the editor(s). MDPI and/or the editor(s) disclaim responsibility for any injury to people or property resulting from any ideas, methods, instructions or products referred to in the content.