Abstract
(1) Background: The economic impact of supply and demand in the energy industry can be seen throughout raw material production, processing and distribution. The purpose of this study is to provide academic information to prepare for crisis management through prediction using indices. (2) Method: In order to predict a crisis of the energy industry, the Crisis Index presented by the Korea Institute of Science and Technology Information was utilized instead of the economic indicators that have hitherto been widely used. Specifically, we propose a new forecasting model based on the concept of economic momentum theory used in financial research and the proper weighting of the earning downside risk theory. Then, statistical empirical analysis was performed to verify the new prediction model. (3) Results: As the result of the empirical analysis, the risk index prediction model proposed in this study showed statistically significant results in predicting the future risk index. (4) Conclusions: This study proposed a risk prediction model using an index and thereby provides an academic analysis of the predictability of numerous indicators created for various purposes and, furthermore, provides implications for predicting crises in the Korean energy industry.
1. Introduction
1.1. Research Background
In recent years, the energy industry has played a very important role in the overall economic environment [1]. This is because the energy industry has an economic influence on supply and demand throughout the entire process, ranging from raw material production to processing and distribution [2]. Therefore, governmental policy to create an efficient economic environment and the strategies of companies participating in the market are of high importance. In addition, the prediction and management of the energy industry in an academic sense is of great interest [3].
Recent economic instabilities, caused by the Russian–Ukrainian conflict that erupted in 2022 and the contraction of global demand in response to the COVID-19 pandemic that began in 2019, are amplifying uncertainty regarding industry prediction and management. Russia’s natural resource supply restrictions and oil production restrictions in the Middle East are increasing costs in the energy industry, and these effects have gradually spread throughout the industry. An increase in economic costs goes hand in hand with a contraction in demand. As a result of the chain reactions of the economic downturn, predictions of the spread of the global recession continue to emerge.
In this situation, there is an urgent need for research to predict the future direction of the energy industry and to suggest countermeasures. A prerequisite for proposing such a plan is to preemptively secure the time and resources to respond by detecting in advance any problems that may occur in an economic crisis situation, not in an ordinary situation [4]. A crisis of economic problems is different from a decline that leads to elimination over a long period of time. Current uncertainties in the energy industry reflect the prospects of a crisis in which a dangerous situation that rapidly escalates is created over a short period of time [3]. To preempt such a crisis, it is possible to implement management designed to control problems in advance through prediction [5].
However, completely predicting a crisis is close to impossible. Even if we knew all the negative economic events that could happen in the future, we don’t know how serious the impact will be. Infallible prediction does not belong to the academic realm but to the prophetic realm. However, if historical and current information can predict the level of a possible crisis, this can free up time and resources to prepare for a severe shock. Within the range of information available in this respect, numerous methodologies have been proposed to make the most accurate predictions.
Research on time series predictions started with classical statistical techniques. The exponential smoothing method and the regression analysis method [6] were followed by additional techniques, such as the autoregressive integrated moving average (ARIMA) [7] and the vector autoregressive model (VAR) [8]. However, predictions related to the modern industry have become more complicated, impeded by problems such as the simple design of classical statistical techniques and the distortive effects of researchers’ bias; consequently, the level of predictive accuracy has been inadequate [9,10]. Therefore, studies using statistical techniques based on advanced science and technology, such as artificial neural network (ANN) models [11], have also been conducted. However, machine learning algorithms based on science and technology have their own limitations, in that unintended distortions may easily be caused by the interventions of researchers in complex designs, and such algorithms require significant amounts of data [12,13].
Therefore, the concept of momentum began to be used to perform the time series forecasting of the energy industry. In order to predict crude oil prices, the informativeness of momentum was considered [14] and the momentum effect by industry group was compared and analyzed [15]. However, research on forecasting in the energy industry has been conducted mainly on the supply and demand of specific crude oil products or from the point of view of the profitability of investments [16].
Compared to studies predicting the profitability of the energy industry using classical statistical techniques or advanced algorithms, studies on predicting risks to prepare for energy industry crises are relatively lacking. There is a difference between the data used in prediction research focused on profitability and the data used in risk prediction research; therefore, a new tool also needs to be proposed in the research model.
1.2. Research Purpose
Our specific research purposes are as follows:
- The development of an energy crisis prediction model.
- The statistical verification of a crisis prediction model.
This study proposes a model for predicting crises in the energy industry from a new perspective. Instead of the economic index that has been widely used so far, this study will use the Crisis Index proposed by the Korea Institute of Science and Technology Information to predict crises in the energy industry. Unlike other economic indices, the Crisis Index is a specialized index that focuses on a crisis, and therefore it is suitable as time series data to predict crises in the energy industry. The purpose of this study is to provide useful information on potential crises in the energy industry by proposing a new model that can perform predictions using the Crisis Index proposed by a national institution that has secured public trust.
For predictions using the Crisis Index, this study provides a model for predicting the risk of rises in the Crisis Index that exceed a simple pattern of rises and falls in the future index. Specifically, this study proposes a new prediction model by considering the concept of economic momentum and the appropriate proportion of earning downside risk techniques used in financial research. In addition, statistical empirical analysis is performed to verify the robustness of the new prediction model.
In this regard, this study can be distinguished from numerous other studies on crisis management. Analysis using the Crisis Index of the South Korean energy industry provides key implications for risk management, and this study provides academic contributions by proposing and testing methodologies that have not been tried so far.
2. Literature Review
2.1. Prediction of the Energy Industry Based on Time Series Prediction
The academic literature on time series prediction has developed steadily over many years. Classical statistical techniques for prediction using time series samples include the exponential smoothing method, single equation regression model, simultaneous equation regression model [6], ARIMA model [7] and VAR model [8,10]. Exponential smoothing is basically a classical method of fitting an appropriate curve to the historical data of a given time series. The single equation regression model is a more advanced method than the exponential smoothing method and sets up a single equation regression model to estimate trends in time series data. However, as with various indices, the inflection points of indices can appear in various ways; therefore, the explanatory power can be improved by using a simultaneous equation regression model.
The regression model prediction method using the exponential smoothing method and equations has the advantage of simplicity in its application but raises questions about the accuracy of prediction. For example, parameters estimated by econometric models produce inconsistent predictions depending on when the model was estimated. Therefore, these predictions may be less meaningful. To remedy this, the ARIMA model was proposed. It focuses on the probabilistic characterization of the data itself, not from the perspective of the predictor of the equation model. Therefore, the result of the prediction can be explained by the past value of the data or the value given by the lag and the stochastic error term.
However, since the predictive model using the ARIMA model tends to be highly dependent on data fluctuations, it imposes the condition that the time series must be originally stable or become stable after one or more differences. In addition, the trial-and-error method for time series prediction inevitably involves the bias of the researcher. This problem is also found in the VAR model, a prediction technique that considers the causal relationship of time series data.
These limitations also appeared in time series prediction studies of the energy industry. Prediction models using traditional techniques, such as VAR models [8,10] and linear regression models [9], have not attained sufficient significance to explain the nonlinear dynamics of crude oil prices.
Therefore, more recently, various attempts at time series prediction have been made with advanced statistical techniques and advanced scientific technology. In particular, there was a research trend related to the ANN model, a model that received much academic attention [17]. For example, the literature in the financial field has produced new predictive analyses, mainly concerning the stock market [11]. However, according to the study [11], the prediction accuracy of the ANN model for stock price prediction was relatively low, so an improved research method was required.
The model proposed as an alternative is a multilayer perceptron (MLP) model that is relatively simpler and more accurate than the ANN model [18]. This method is simple and easy to apply, but the prediction accuracy is low.
To overcome these limitations, the artificial neural networks (DAN2) model [11] and the multi-layer perceptron (MLP) model [19] were proposed. However, these machine learning algorithms tend to involve researchers’ bias in complex designs and require a lot of data for analysis [12,13]. In particular, it is difficult to apply such algorithms to time series industrial index data that are not standardized.
Table 1 summarizes the limitations of research models related to time series prediction. The problem of researcher bias, along with the statistical limitations, leads to the problem of accuracy. Therefore, in subsequent studies, a more complex improvement model was proposed to increase accuracy, but there were constraints assuming a stable and upward-sloping economy, such as the basic assumption of economic theory [19]. Therefore, in the context of the recent COVID-19 pandemic or long-term global economic downturn due to regional conflicts, time series forecasting requires a redesign to overcome the limitations of existing models [20].

Table 1.
Time Series Prediction Models and Limitations of Previous Studies.
A recent study on the energy industry proposed a time series forecasting model for crude oil using scientific algorithms [21]. Crude oil time series information is difficult to predict due to its disordered and nonlinear characteristics, and therefore, the long short-term memory concept and technical indicators, such as trend, volatility and momentum, were considered. Particularly noteworthy is the proposal of statistical techniques using optimization algorithms applying scientific techniques.
However, predictions using these latest scientific algorithm techniques focus on accurate predictions for specific crude oil products. Therefore, the consideration of complex variables reflect the neural network, trend and volatility of a specific crude oil product but have little relevance to the prediction of risk, which is of interest in this study. Above all, a more objective and intuitive method is needed to predict the risks in the energy industry using the calculated time series index. A quantitative statistical model that is not affected by periods of boom or bust and at the same time does not involve researcher bias is needed. Therefore, this study proposes a new index prediction model that considers momentum theory [15,16] and earning downside risk theory [22].
2.2. The Trends in Latest Research on the Energy Industry
The recent trend in energy industry research is the convergence of eco-friendly energy and other academic research fields. Existing research on energy efficiency is gradually developing into research on eco-friendly energy [23], but research in the field of energy engineering alone is not enough to explain the increasingly complex industrial ecosystem [24]. For example, it is well-known that hydroelectric power is a very efficient alternative energy in terms of carbon dioxide emissions compared to chemical power generation [25]. However, in order for such eco-friendly energy research to be widely cited, interpretations from various perspectives are required [26]. Therefore, recent energy industry research is being conducted as a study that combines economic theory and financial theory.
Among many research subjects, the most interesting energy industry research converges with financial research [27]. In addition to technical attempts to improve existing energy efficiency, the ripples of economic effects through energy efficiency have been studied. In order to choose between the maximization of profitability and eco-friendliness, companies should pursue an appropriate level of individual environmental protection and government policies should also determine optimal environment-related tax policies in accordance with extant conditions [28]. This is the most basic research regarding the development and policies of the energy industry, proving that industry and economy are closely related [29].
Along with these research trends, green bonds, which are focused on carbon reduction, energy efficiency improvement, renewable energy and the use of electric vehicles, are a topic of great interest in the global financial market. Green bonds have been found to have a positive relationship with actual eco-friendly quality [30] and a positive relationship with energy efficiency [31]. This relationship was also valid during the COVID-19 pandemic [32]. These results indicate that the economic and financial environment has a positive impact on the eco-friendly energy industry and that a prudent approach from the state is needed for the effectiveness of environmental policies.
Instead of an approach focused on one field, an approach from interdisciplinary perspectives can provide more useful information about the recent energy industry. Therefore, this study also attempts to converge the field of energy industry research with momentum theory, economics and profit downside risk, an area of finance.
2.3. Momentum Theory
The simplest and most intuitive way to the predict risk index using time series data is to check the trend [33]. In economic geometry, if the past time series has an upward-sloping curve, the future risk index is expected to rise. On the other hand, if it has a downward-sloping curve, the future risk index is expected to decrease. However, the observation period of the curve can be problematic when it comes to identifying time series trends [34]. For example, even a trend with downside volatility in the short term can create a stable uptrend by widening the range over the long term.
Momentum theory [35] is an improved model that compensates for these limitations. Since a simple economic trend line has limitations in predicting the long-term trend of an industry, it is necessary to consider the acceleration of an uptrend or downtrend. As a physical concept, momentum refers to driving force, and as a geometric concept, it refers to the slope of a point on a curve. Momentum in economic usage refers to the acceleration of stock price trends in capital markets [36]. It is a technique for predicting the strength of a stock price rise or fall in advance by drawing the change lines based on the time series data of stock prices. In other words, even if the stock price continues to rise, if the momentum slope slows, a future stock price decline can be expected. Conversely, even if the stock price continues to decline, if the momentum slope rises, a stock price rise can be expected [37].
Momentum theory has been actively studied, especially in the field of finance [38,39]. The most noteworthy finance topic is the meaning of the momentum effect, which is widely used in portfolio strategies in the capital market. Recent research suggests that, contrary to popular belief, momentum does not apply to individual stock trends, but to general trends in an industry [40]. These results have been proven through the profitability of stock investors, and thus the concept of momentum in the capital market has spread to various fields [41].
The concept of momentum in the energy industry has only relatively recently begun to be studied [14]. In the energy industry, analyzing the movement between the crude oil industry and the petroleum product industry, the authors of [14] analyzed whether there was deviation from the estimated equilibrium price by calculating the long-term equilibrium price, which could be used for prediction and risk management. The analysis found that crude oil prices and product prices move together [16]. These results imply the informational nature of momentum regarding predictability in the energy industry.
The concept of momentum was meaningful not only for information to perform predictions of single crude oil commodity prices but also for predictions at the industrial level. The effect of momentum in industrial groups was compared and analyzed. According to research, the profitability of an industry depends on the industry group level [15]. In general, the profitability of low-performing industries is lower than that of high-performing industries, according to the theory of momentum. The drop in profitability is especially noticeable in industries with relatively high inter-industry coupling and less so in industries with relatively low industry competition [15,42]. These results suggest that industry location and composition need to be considered when implementing momentum strategies.
A recent energy industry-related study analyzed the predictive power of crude oil’s return and volatility using the momentum theory of the stock market [16]. The authors of [16] found that crude oil yield volatility serves as a strong predictor of industry momentum, even after controlling for stock market conditions, volatility and key macroeconomic variables. In addition, the predictability of crude oil, which can explain momentum, is influenced by pressures related to the purchase of crude oil in uncertain times and also by investors. This study found that, from an investor’s point of view, a higher abnormal rate of return was obtained than when using the existing method, depending on the conditions related to the volatility of crude oil yield. The results suggested that momentum in the oil market is able to contribute to inefficiency in the stock market, and that this inefficiency can generate significant abnormal earnings for active managers.
In order to use this momentum concept for future prediction using the Crisis Index of the energy industry, logical reconstruction is necessary. In other words, since the Crisis Index provided by the Korea Institute of Science and Technology Information represents the degree of crisis calculated by processing various indices, the concept is different from the prediction of simple stock product prices in the capital market. Even if the stock price is on an upward trend, if the slope slows down, the stock price can be expected to decline. Even if the Crisis Index rises, if the slope slows, the crisis would abate. In this study, risk reduction is not a concern, so this situation is excluded. In order to predict the crisis of the energy industry, only the condition of a rising slope is considered in all situations where the Crisis Index increases or decreases.
This momentum model differs from the simple upward and downward patterns of the index utilized in previous studies. The biggest difference is that acceleration is considered, which is significant as a concept that complements errors in hypothesis testing theories.
A new advantage of momentum in time series prediction is that it can be a very suitable instrumental variable for testing hypotheses. A type 1 error occurs if the simple Crisis Index is expected to rise higher than before but misunderstands it as a crisis even though the actual slope is decreasing. Conversely, in a situation where the Crisis Index is expected to be low, if the crisis is not detected despite the actual slope increasing, this would lead to a type 2 error. The concept of slope can be a prediction technique that is able to compensate for both types of errors [43].
2.4. Earnings Downside Risk Theory
Earning downside risk is a time series prediction technique mainly used in the field of business accounting [44,45]. In general, the business performance of a company forms a long-term trend line. In fact, even if monthly, quarterly, semi-annual and yearly performance has some volatility, earnings flexibility is achieved depending on the accounting method. In accounting, this is explained by the concept of “income smoothing” [46,47]. Therefore, when trying to predict a company’s performance in ordinary circumstances, statistical probability calculation using past information is appropriate.
However, as mentioned in regard to the limits of the trend line, the simple distinction between earnings and loss is meaningless. The reason is that the capital market reacts more sensitively to losses than profits to corporate performance, and therefore, most corporate performance reports tend to be zero or report earnings [48]. Therefore, rather than simply assigning equal weight to earnings and loss to predict future performance, it is useful to calculate by placing more weight on reported business performance and loss despite sensitive responses [22]. The earning downside risk theory is designed from this perspective [22].
Empirical analysis based on these hypotheses found that when the downside risk of corporate performance was higher, the management performance was more negative [22]. They also found that these results were stronger during recessions. These results suggest that earning downside risk has relatively better predictability compared to other indicators of financial risk. Therefore, the downside risk of returns can provide useful information for risk management based on data composed of time series data [22].
Another study also argued that earning downside risk could be a meaningful proxy for corporate risk [49]. In particular, not only is earning downside risk related to earnings, but downside risks related to accounting occurrences were also found to be highly predictable. This case suggests that it might make sense to input other variables into the structure for calculating earning downside risk. Above all, the study by [50] was meaningful because it demonstrated the possibility of making predictions based on volatility, a proxy indicator of risk.
Volatility has a very important meaning in risk prediction. The ripple effect of volatility can be analyzed in relation to an industry and such analysis is particularly useful during periods of crisis in the industry in question [51]. According to previous studies of industrial economy, banking and insurance are highly related to global financial crises and the energy industry has proven to be highly relevant during the COVID-19 pandemic. These results suggest that the meaning of volatility is a proxy for risk and can be an appropriate tool for measuring industry risk [51].
Along with the past corporate risk capture model [52], the recently improved model [53] also assigns equal weights to gains and losses. Because the response of the capital market is more sensitive to losses, the prediction accuracy of the earning downside risk model, which is more weighted toward losses, is relatively high [22].
The concept of risk capture at the enterprise level and the concept of risk prediction at the industry level are different in scope. However, when predicting the future based on past information, statistical significance can be secured based on the frequency of cases where the risk index rises or falls compared to the previous observation period. In particular, by assigning a higher weight to situations in which the Crisis Index rises, timeliness of crisis prediction can be secured.
Therefore, it is necessary to redefine the model in order to apply the downside risk to energy industry crisis prediction. Earnings downside risk uses past information to predict future risk by giving more weight to declining earnings. However, the Crisis Index information of the energy industry should be predicted by considering the Crisis Index moving upward as a risk. Therefore, while following the structure of earnings downside risk, the application sign of the earnings and risk indices should be reversed. In this study, the structure of the earning downside risk model, which weights loss, is borrowed and converted into “Crisis Index Upside Risk”, which weights the risk of rising risk index.
3. Crisis Prediction Model
The main purpose of predicting the crisis of the energy industry using the Crisis Index provided by the Korea Institute of Science and Technology Information is to provide useful information by predicting crises in advance. To this end, this study proposes a new model that has not been used in risk management studies or index prediction studies. Simplistically, crises can be captured by momentum theory with the concept of an improving gradient in a simple trend. However, predicting the Crisis Index with only this momentum theory may not be an adequate forecasting technique. This is because, as observed in other energy industry studies, the economic trend of an industry is a concept that includes seasonality and periodicity [54,55].
Against this background, in order to supplement the limitations of seasonality and periodicity, this study also considers the risk index rising risk method, which is a method of performing prediction by confirming frequency from past information. Overall, the two models are combined and compared with the risk index. With the risk prediction result as the main explanatory variable and the future Crisis Index result as the dependent variable, statistical significance is given through ordinary least squares (OLS) regression analysis between the two variables.
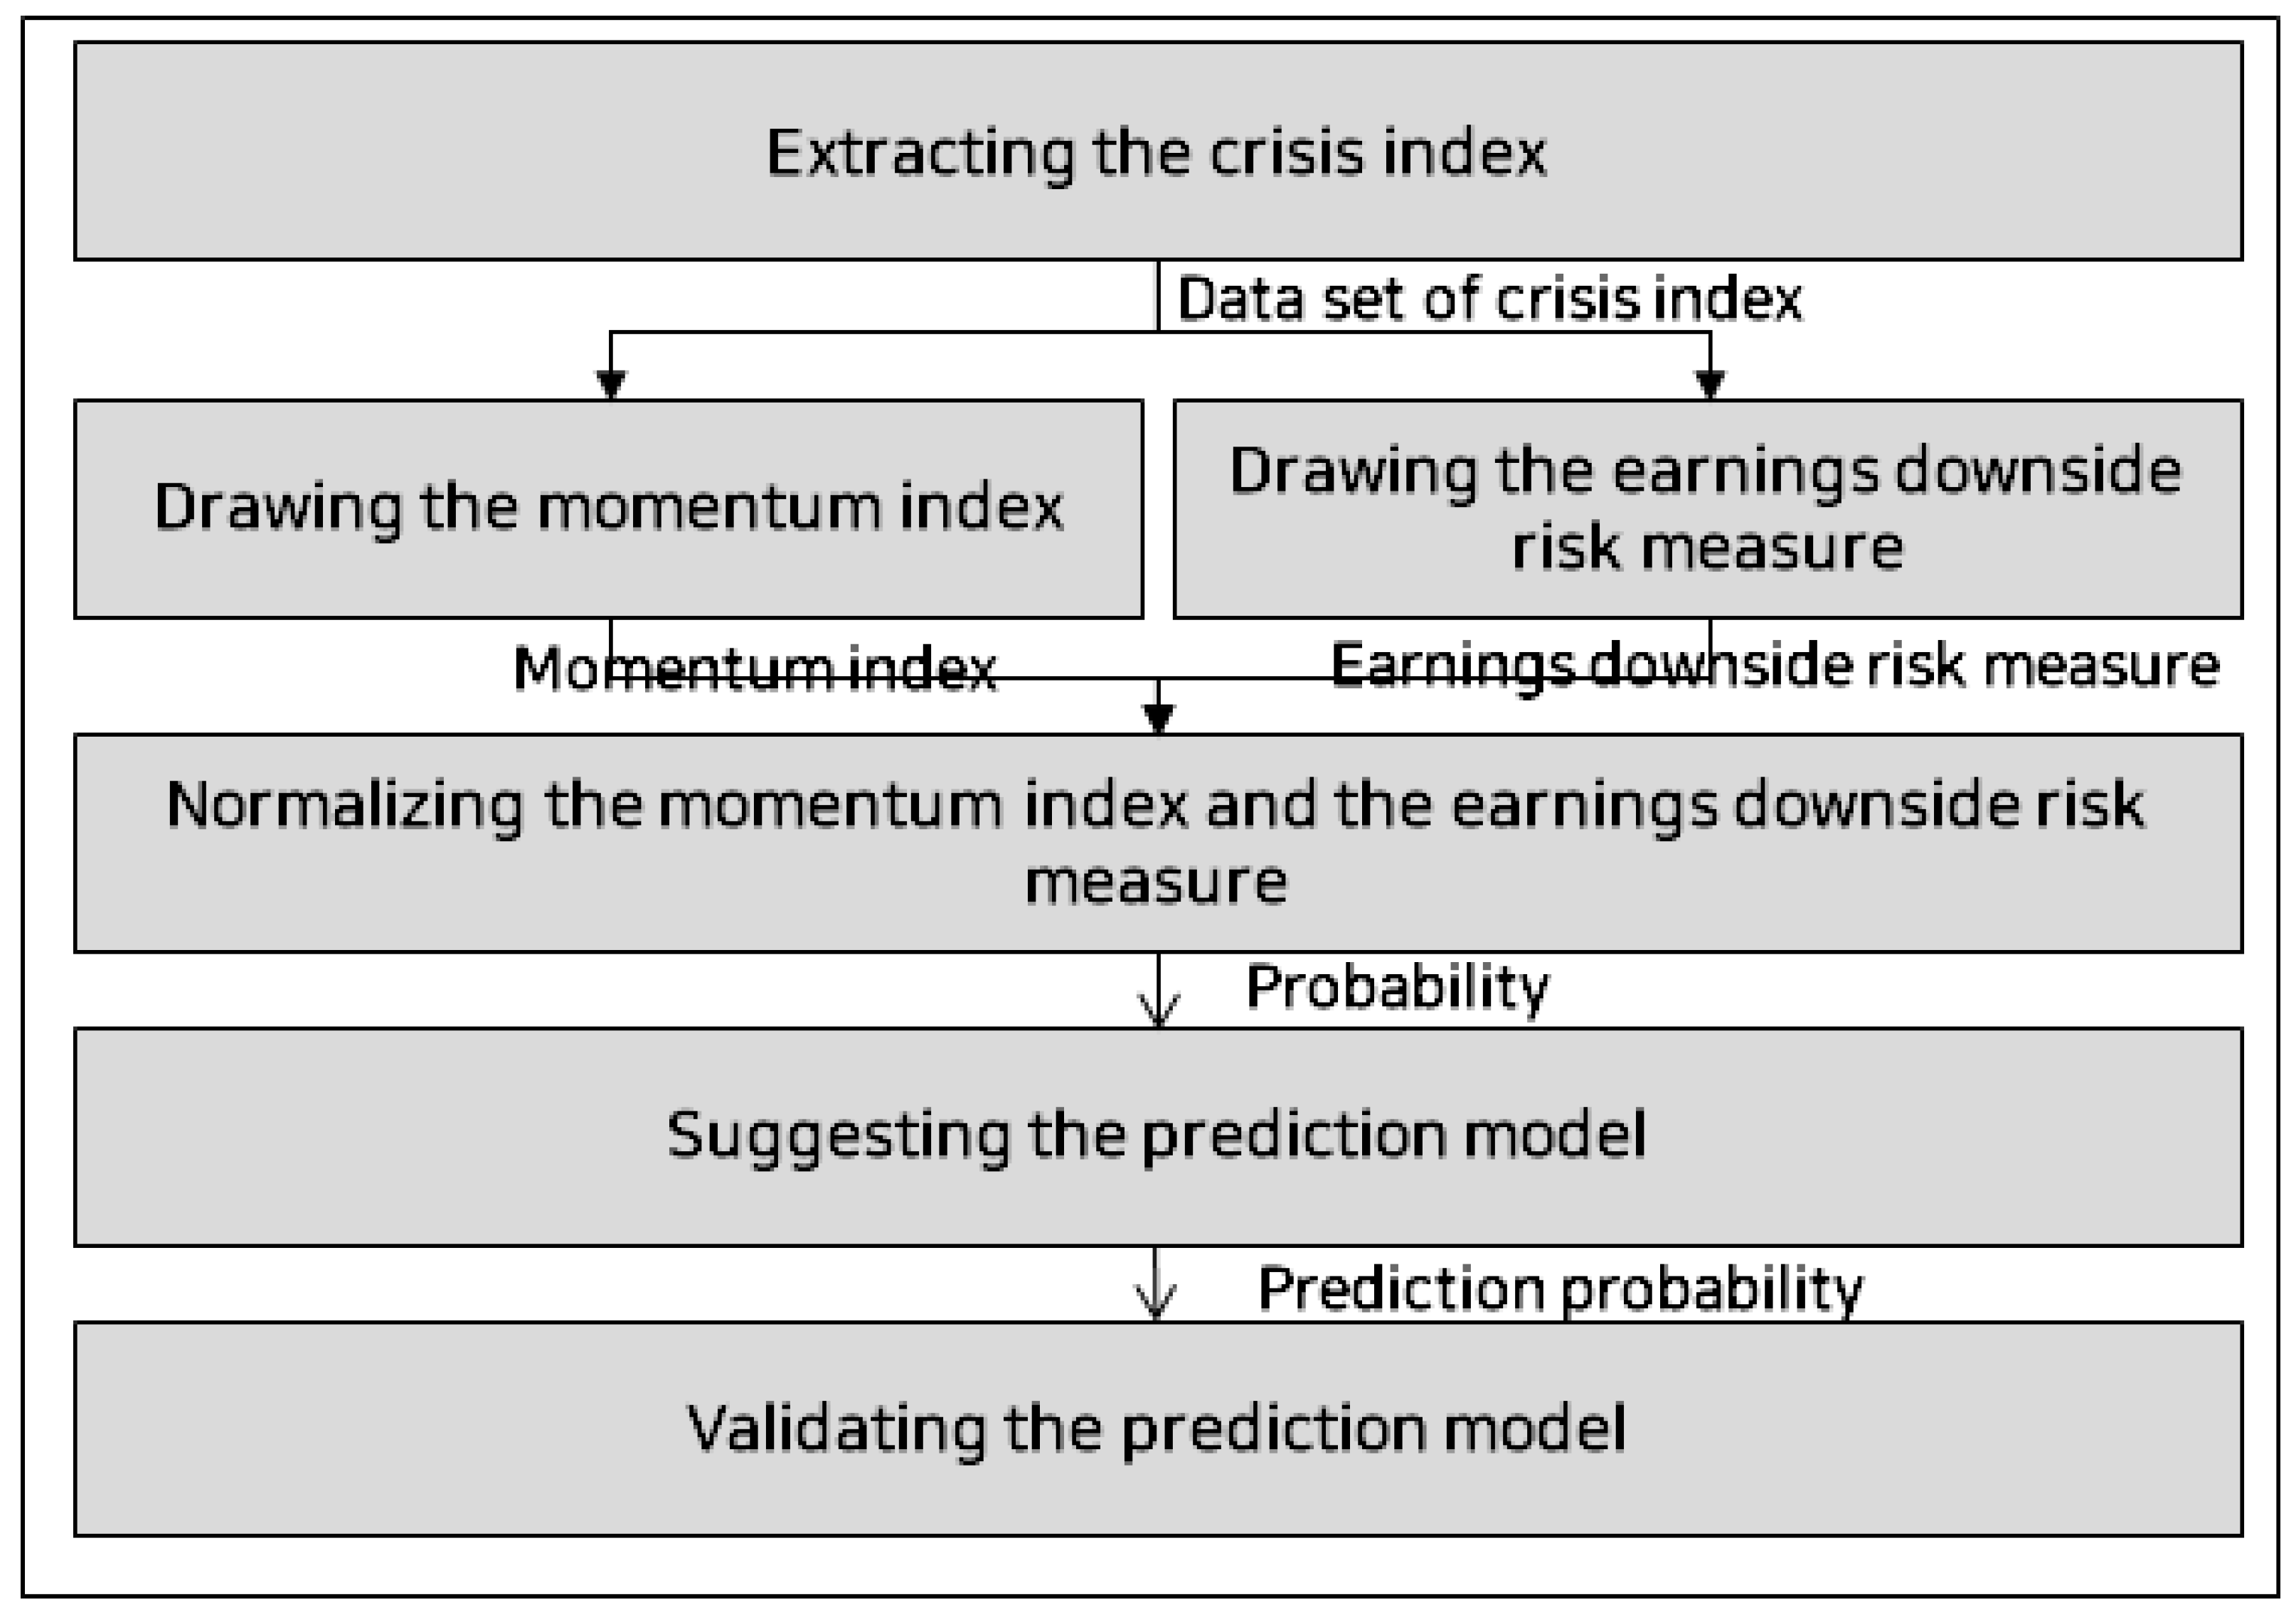
The specific research framework is shown in Figure 1 below. First, the Crisis Index is extracted and put into two crisis forecasting models. The predicted values according to the momentum theory and the downside risk theory of profits are normalized and the two results are combined. A new crisis prediction model is proposed by adjusting the weight of the two results. Finally, it is verified whether this crisis prediction model actually has statistical significance.
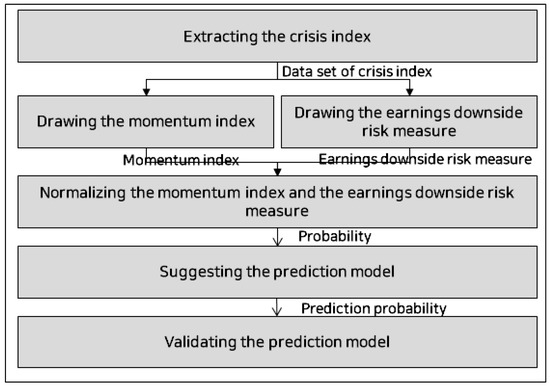
Figure 1.
The framework of the proposed model for Crisis Index prediction.
3.1. Extracting the Crisis Index
The Crisis Index provided by the Korea Institute of Science and Technology Information is a new index that considers both industry-specific information and external environment information and is differentiated in terms of representing crisis. Until now, the indices calculated and operated at the national level have been characterized according to their purpose, but they had limitations as proxy variables for industrial crises. For example, a decrease in the production index of a specific industry can be regarded as an increase in crisis, but as an index specific to production, it cannot be regarded as an industry-wide crisis.
In order to calculate an accurate risk index, various indices are selected, and experts’ opinions on these indices are combined and weighted. Then, the risk index collected through the normalization process is completed. The Crisis Index used in this study was extracted from information on the South Korean energy industry from 2012 to 2021. The industry selected as a sample is coke briquette and petroleum refinery manufacturing, which belongs to the Korean energy industry.
3.2. Drawing the Momentum Index
First, the risk index of South Korea’s energy industry is sequentially arranged. Then, the difference between the value at the previous observation time point and the value at the current observation time point is calculated. In Equation (1), the difference obtained by subtracting the Crisis Index at the observation time point from the previous observation point is defined as .
Then, the slope value of each point in the trend line of the risk index composed of the calculated time series is calculated. Dividing in the minimum observation period t yields the derivative d, which is then used for obtaining the slope of the trend line. The derivative is the momentum value at the point of observation [56].
The calculated positive value captures both the risk of a crisis appearing in a situation where the risk index is low and the risk of further escalation in a situation where the risk index is high. Since this study does not pertain to predicting a situation in which the risk index declines, only positive values among the calculated slope values are captured and used as risk prediction information.
3.3. Illustrating the Earnings Downside Risk Measurement
The basis for earning downside risk is measured as the ratio between the standard deviation of the observations of returns below the expected level and the standard deviation of the observations of returns above the expected level. The expression of earning downside risk begins with estimating the expected earnings. The structure for estimating expected earnings involves financial accounting research that calculates unexpected earnings by subtracting actual earnings from expected earnings [57].
Here, ϵ is the expected earnings for period t, which is estimated using the actual earnings for period t − 1 and other financial variables. It is possible to verify whether the actual earnings have increased or decreased compared to the actual earnings in year t through ϵ. A positive value of the estimated ϵ indicates that earnings have increased, whereas a negative value indicates that earnings have decreased.
Then, the estimated ϵ, according to the research model of [22], is applied to the following Equation (4).
What the numerator formula describes here is the standard deviation at which the earnings begin to fall, which can be explained by a dummy variable , which has a value of 1 if the actual earnings are lower than the expected level and 0 otherwise. Conversely, what the expression of the denominator describes is the standard deviation at which the earnings increase, which can be explained by the dummy variable , which is 1 if the actual earnings are higher than the expected level and 0 otherwise. N means the number of observed ϵ. Here, in order to exclude cases where N becomes 0, at least three or more ϵ are used. In conclusion, the two standard deviations can be used to calculate the relative downward movement of earnings.
In order to use the earning downside risk as the risk that the Crisis Index of the energy industry will rise, the formula is converted as follows. Unlike Equation (3), which reflects various externalities, it is assumed that the expected value of the Crisis Index is at least the same as the value before the observation mechanism. The reason is that, since the risk index is calculated as the sum of the indices reflecting various weights, all available information is reflected and uncontrollable externalities are not considered. Therefore, first, the expected risk index level is set as follows.
The ε estimated here is input into the following Equation (6).
The difference between Equations (4) and (6) is that the risk index increases in the numerator and the risk index decreases in the denominator. The other parts are the same. In conclusion, using the two standard deviations, it is possible to calculate the relative degree to which earnings fall. All calculated values are defined as the “Crisis Index Upside Risk”.
3.4. Normalizing the Momentum Index and the Earnings Downside Risk Measure
The results of the momentum method and the “Crisis Index Upside Risk” method are normalized so that the differences in the comparison and processing range of each method are not distorted. The following formula is used to normalize the calculated “Crisis Index Upside Risk” value to the “Crisis Prediction Probability” value. The min–max normalization method is used so that the data from both methods have the same information scale [58].
3.5. Proposing the Prediction Model
As mentioned previously, momentum is an improved exponential prediction method that is more informative than trends [36]. Nonetheless, momentum also has limitations: it not only fails to capture changes in the index that can cause seasonality and periodicity [59] but also intentionally excludes the impact of a decline in the Crisis Index. Therefore, the model for earnings downside risk is constructed together by reflecting long-term information from the past. In this study, improved information is provided through the statistical aggregation of the results of the two models in order to complement their respective limitations and to prevent the error of presenting conflicting results regarding crisis prediction in terms of the calculation structure.
By adjusting the proportions of the momentum value and the upside risk value of the Crisis Index, the degree of correlation between each proportion and the actual Crisis Index was compared. After examining Spearman’s correlation analysis result for each input weight of each result value, the appropriate weight was set.
3.6. Validating the Prediction Model
A test was conducted to verify whether the new method proposed in this study to determine the degree of crisis in the energy industry yields statistically significant results. First, the degree of correlation was judged by comparing the momentum, the Crisis Index Upside Risk, and the new crisis prediction model collected with the actual Crisis Index. Next, in order to confirm the predictive power of the new crisis prediction model, regression analysis was performed by attaining the future time point.
Here, the prediction range is set to t period, t + 1 period and t + 2 period.
4. Research Results
4.1. Extracting the Crisis Index
From 2012 to 2021, industries related to the energy industry were selected from the risk index provided by the Korea Institute of Science and Technology Information. In the Korean Standard Industry Classification, the energy industry represents No. 19, No. 191 and No. 192. No. 19 refers to the upper middle level classification of industry codes No. 191 and No. 192, namely coke briquettes and petroleum refinery manufacturing. Subdivision No. 191 refers to coke and briquette manufacturing, and No. 192 refers to petroleum refinery manufacturing.
Subcategories in coke and briquette manufacturing include lignite, carbonized carbon, semi-sacred coke, tar and pitch coke. Detailed items in petroleum refined product manufacturing include gasoline, gas, methane, bunker oil, petroleum gas, marine diesel, crude oil refined products and propane gas.
Manufacturing industries related to Korea’s energy industry are highly dependent on the supply and demand of the global crude oil energy market. This is because the domestic market for energy consumption is relatively small and South Korea does not have enough natural resources to secure a stable supply chain [60]. Therefore, it is very important to propose a model that can predict crises of the energy industry, which has higher industrial-level volatility than South Korea’s representative industries, such as automobile manufacturing, shipbuilding and semiconductor and electronic manufacturing.
The most basic step in predicting a crisis is to select an index that can deliver crisis information. It is possible to use, for example, the comprehensive economic index, sentiment index, price index, import/export index, business economic index and business conditions within the industry, which indicate the current state of the energy industry [61]. However, these indices cannot be selected as representative variables to capture a true crisis. Since industrial crises are manifested as the complex actions of various variables, it is necessary to reprocess various indices for the purpose of predicting crises.
The Crisis Index provided by the Korea Institute of Science and Technology Information has the distinction of providing information by processing these various indexes. Since the Crisis Index collects various information and provides crisis situations on a monthly basis, timely and accurate industry information can be confirmed.
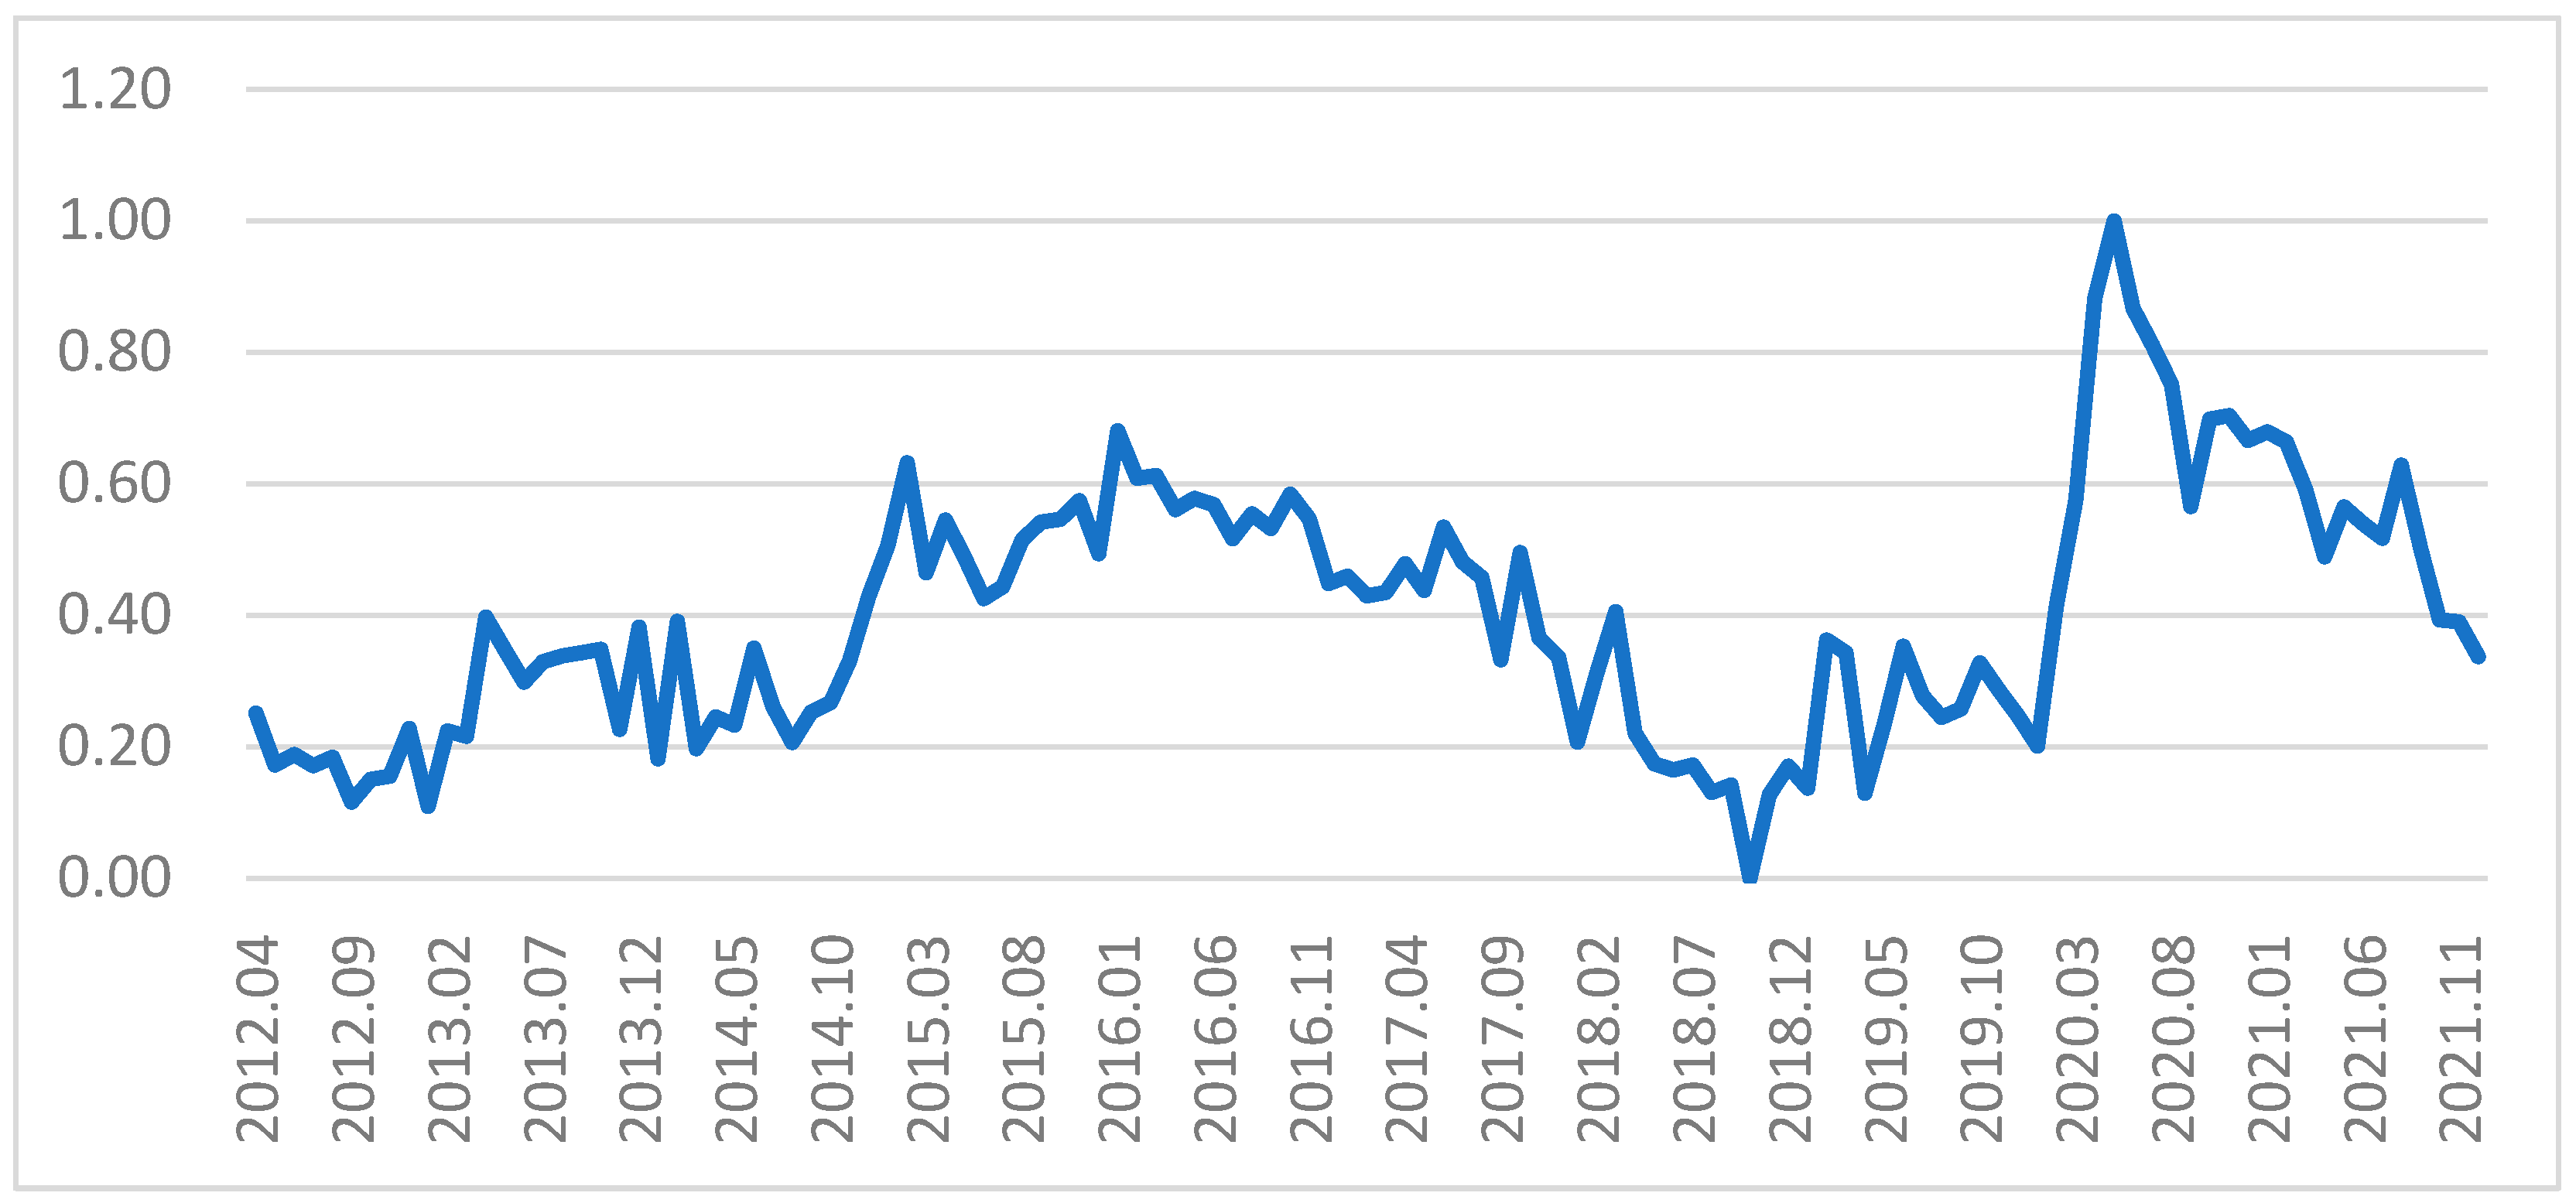
Figure 2 shows the trend of the risk index of the energy industry related to coke briquettes and petroleum products. Unlike other various economic indices, the Crisis Index provides crisis information, and the higher the value, the greater the crisis. As we can see in the trends of the Crisis Index, the risk of crisis gradually increased from the initial observation in 2012, and then gradually decreased again after 2016. The volatility of the risk of crisis in South Korea’s energy industry is based on the instability of the global market due to Russia’s natural resource exports and the Paris Agreement, which is related to the environment and was concluded in the mid-2010s. Along with the development of the alternative energy industry and South Korea’s adoption of eco-friendly policies, the Crisis Index in 2018 reached its lowest point. After 2019, the Crisis Index rose sharply due to global economic uncertainty caused by the COVID-19 pandemic but subsequently gradually moved downward. This trend suggests that South Korea’s energy industry is responding very closely to the volatility of the global market.
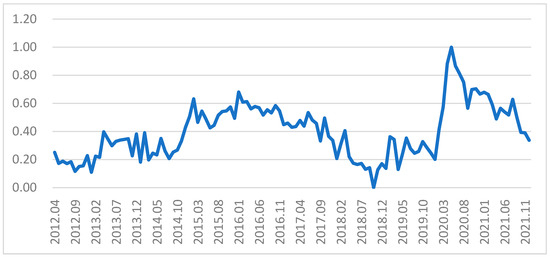
Figure 2.
Industry Crisis Index Trend of Coke Briquettes and Petroleum Products.
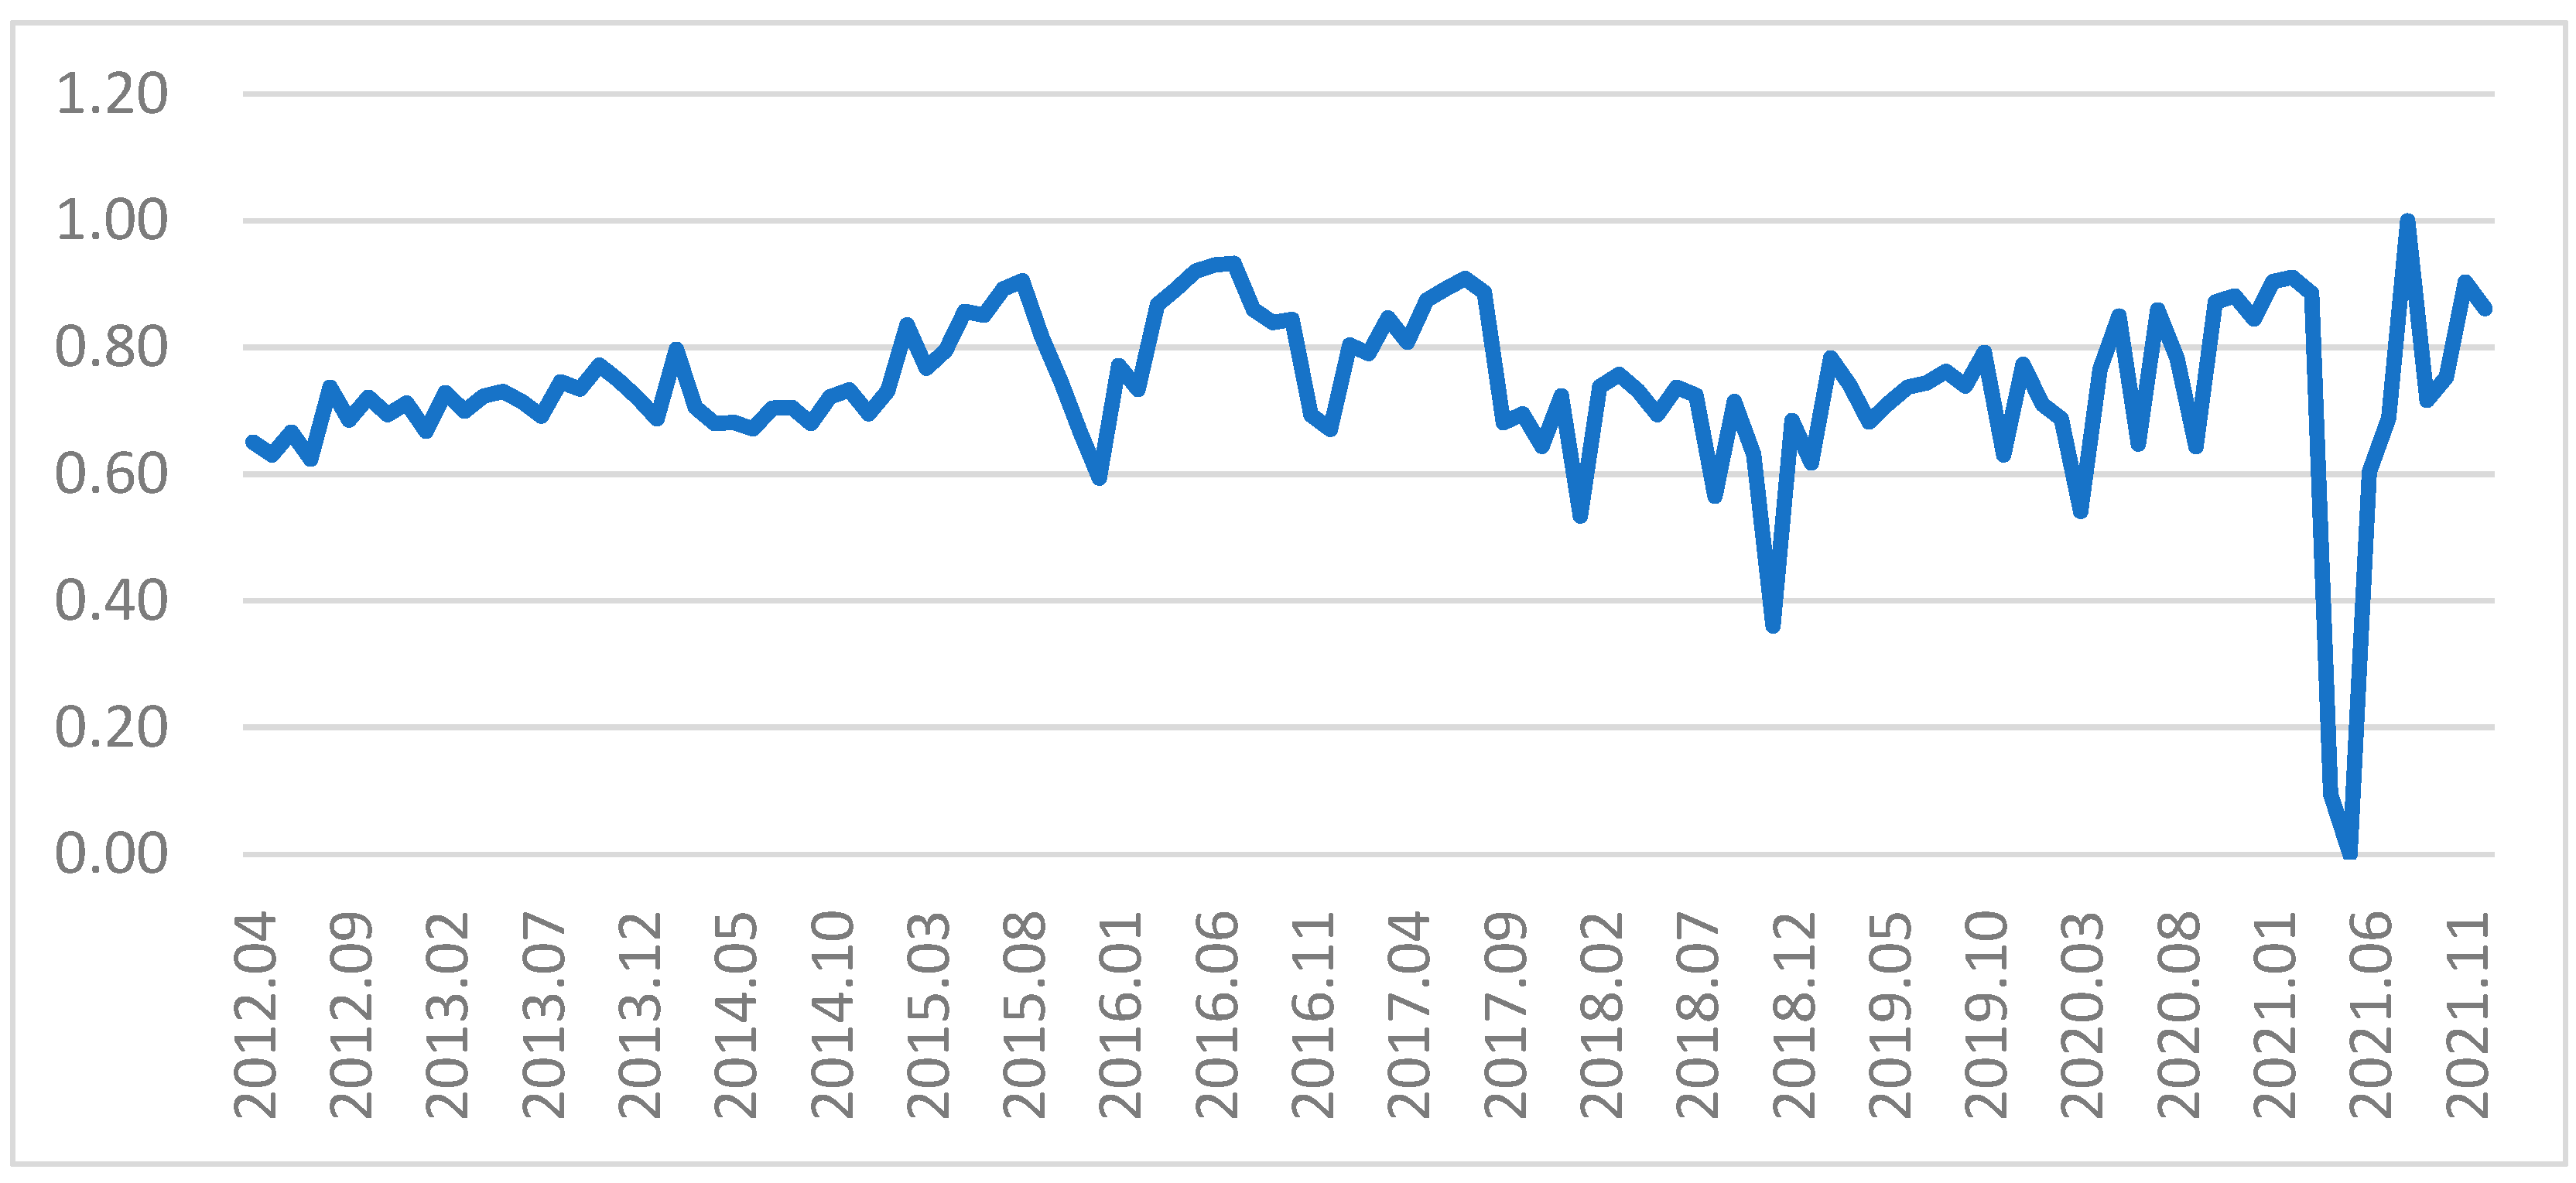
Figure 3 below shows the trend of the Crisis Index of the coke and briquette manufacturing industry, which is a subclass of the energy industry. Unlike Figure 2, which reflects the volatility of the entire energy industry, the Crisis Index of coke and briquette manufacturing has displayed a relatively stable trend.
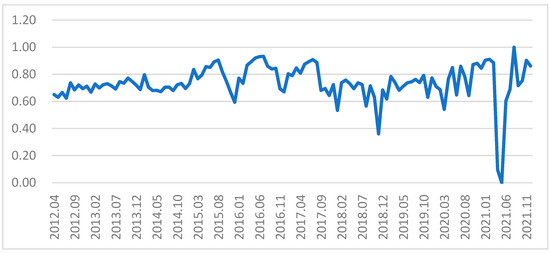
Figure 3.
Crisis Index Trend in the Coke and Briquettes Industry.
This is due to the uniqueness of South Korea’s energy industry. In the 1960s, South Korea actively supplied its own energy through coal mining, but the use of coal fuel gradually decreased due to technological development. Accordingly, since 2010, the coke and briquette manufacturing industry has been greatly reduced, which can be interpreted as indicating low volatility in the industry.
In the latter half of 2010, as the global crude oil market became unstable, there were temporary fluctuations in energy demand and supply, and as global energy logistics were reduced after the COVID-19 pandemic, a crisis occurred in the coke and briquette manufacturing industries.
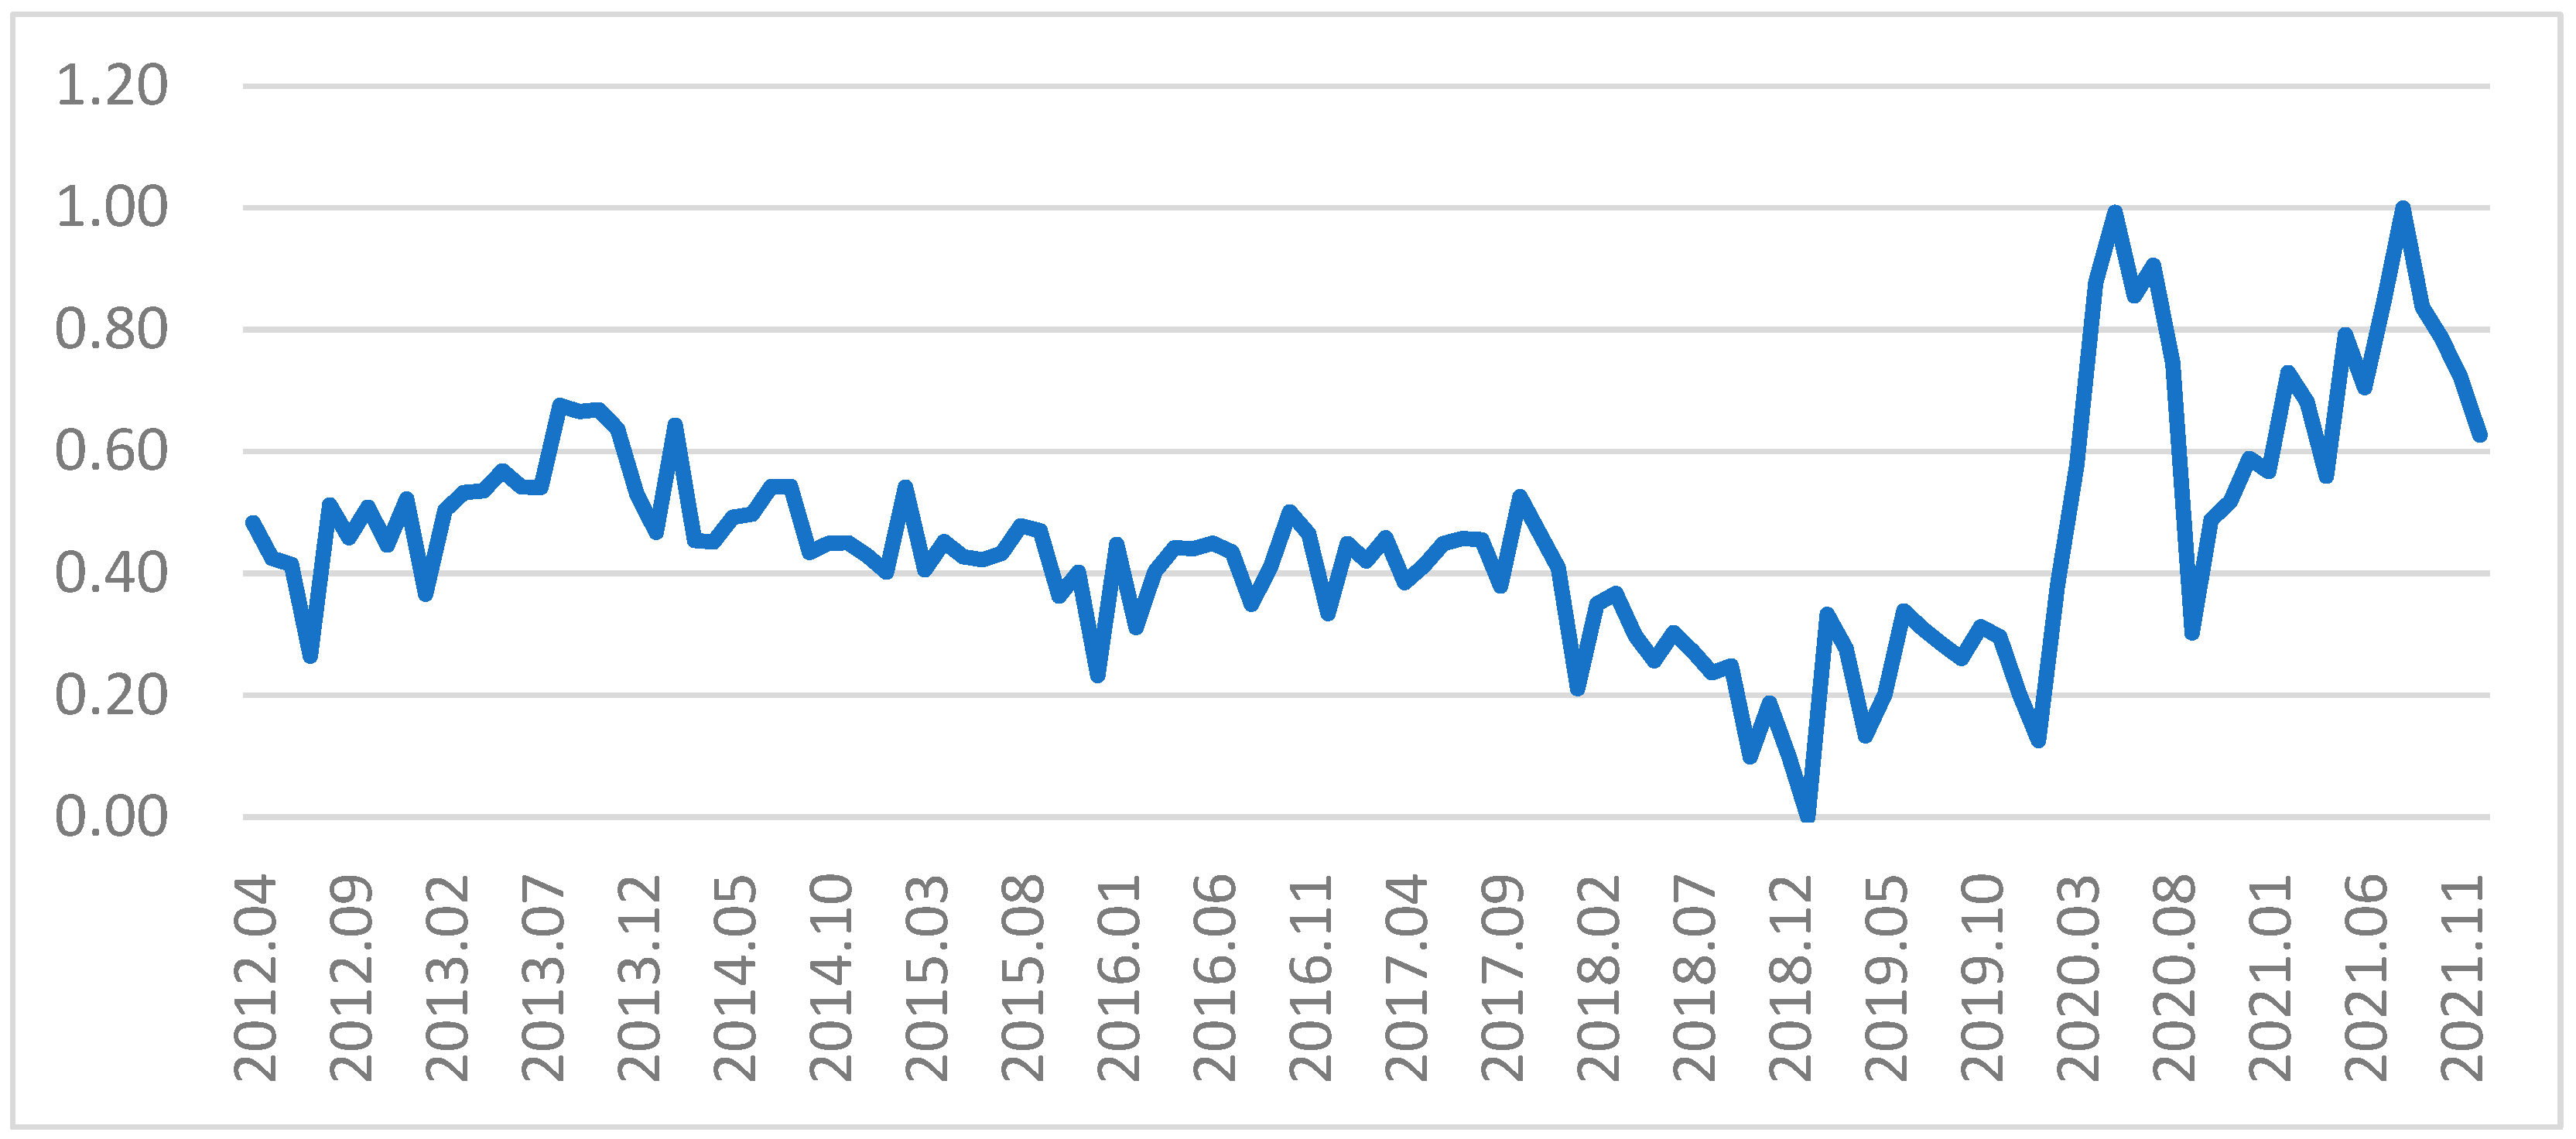
Figure 4 shows the trend of the Crisis Index in the petroleum products manufacturing industry. Similar to the trend in Figure 2, the risk index gradually decreased and reached its lowest point in 2018. However, the Crisis Index rose during the COVID-19 pandemic, and the impact continues. This is because crude oil supply became unstable due to a contraction in global logistics, as well as complex factors such as economic exchange rates.
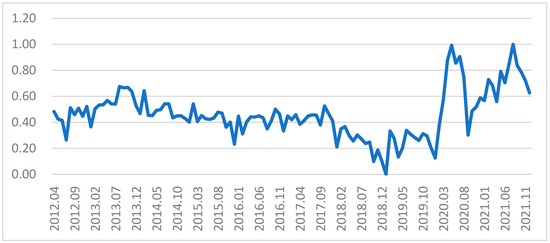
Figure 4.
Crisis Index Trend in the Petroleum Refined Products Industry.
4.2. Visualizing the Momentum Index
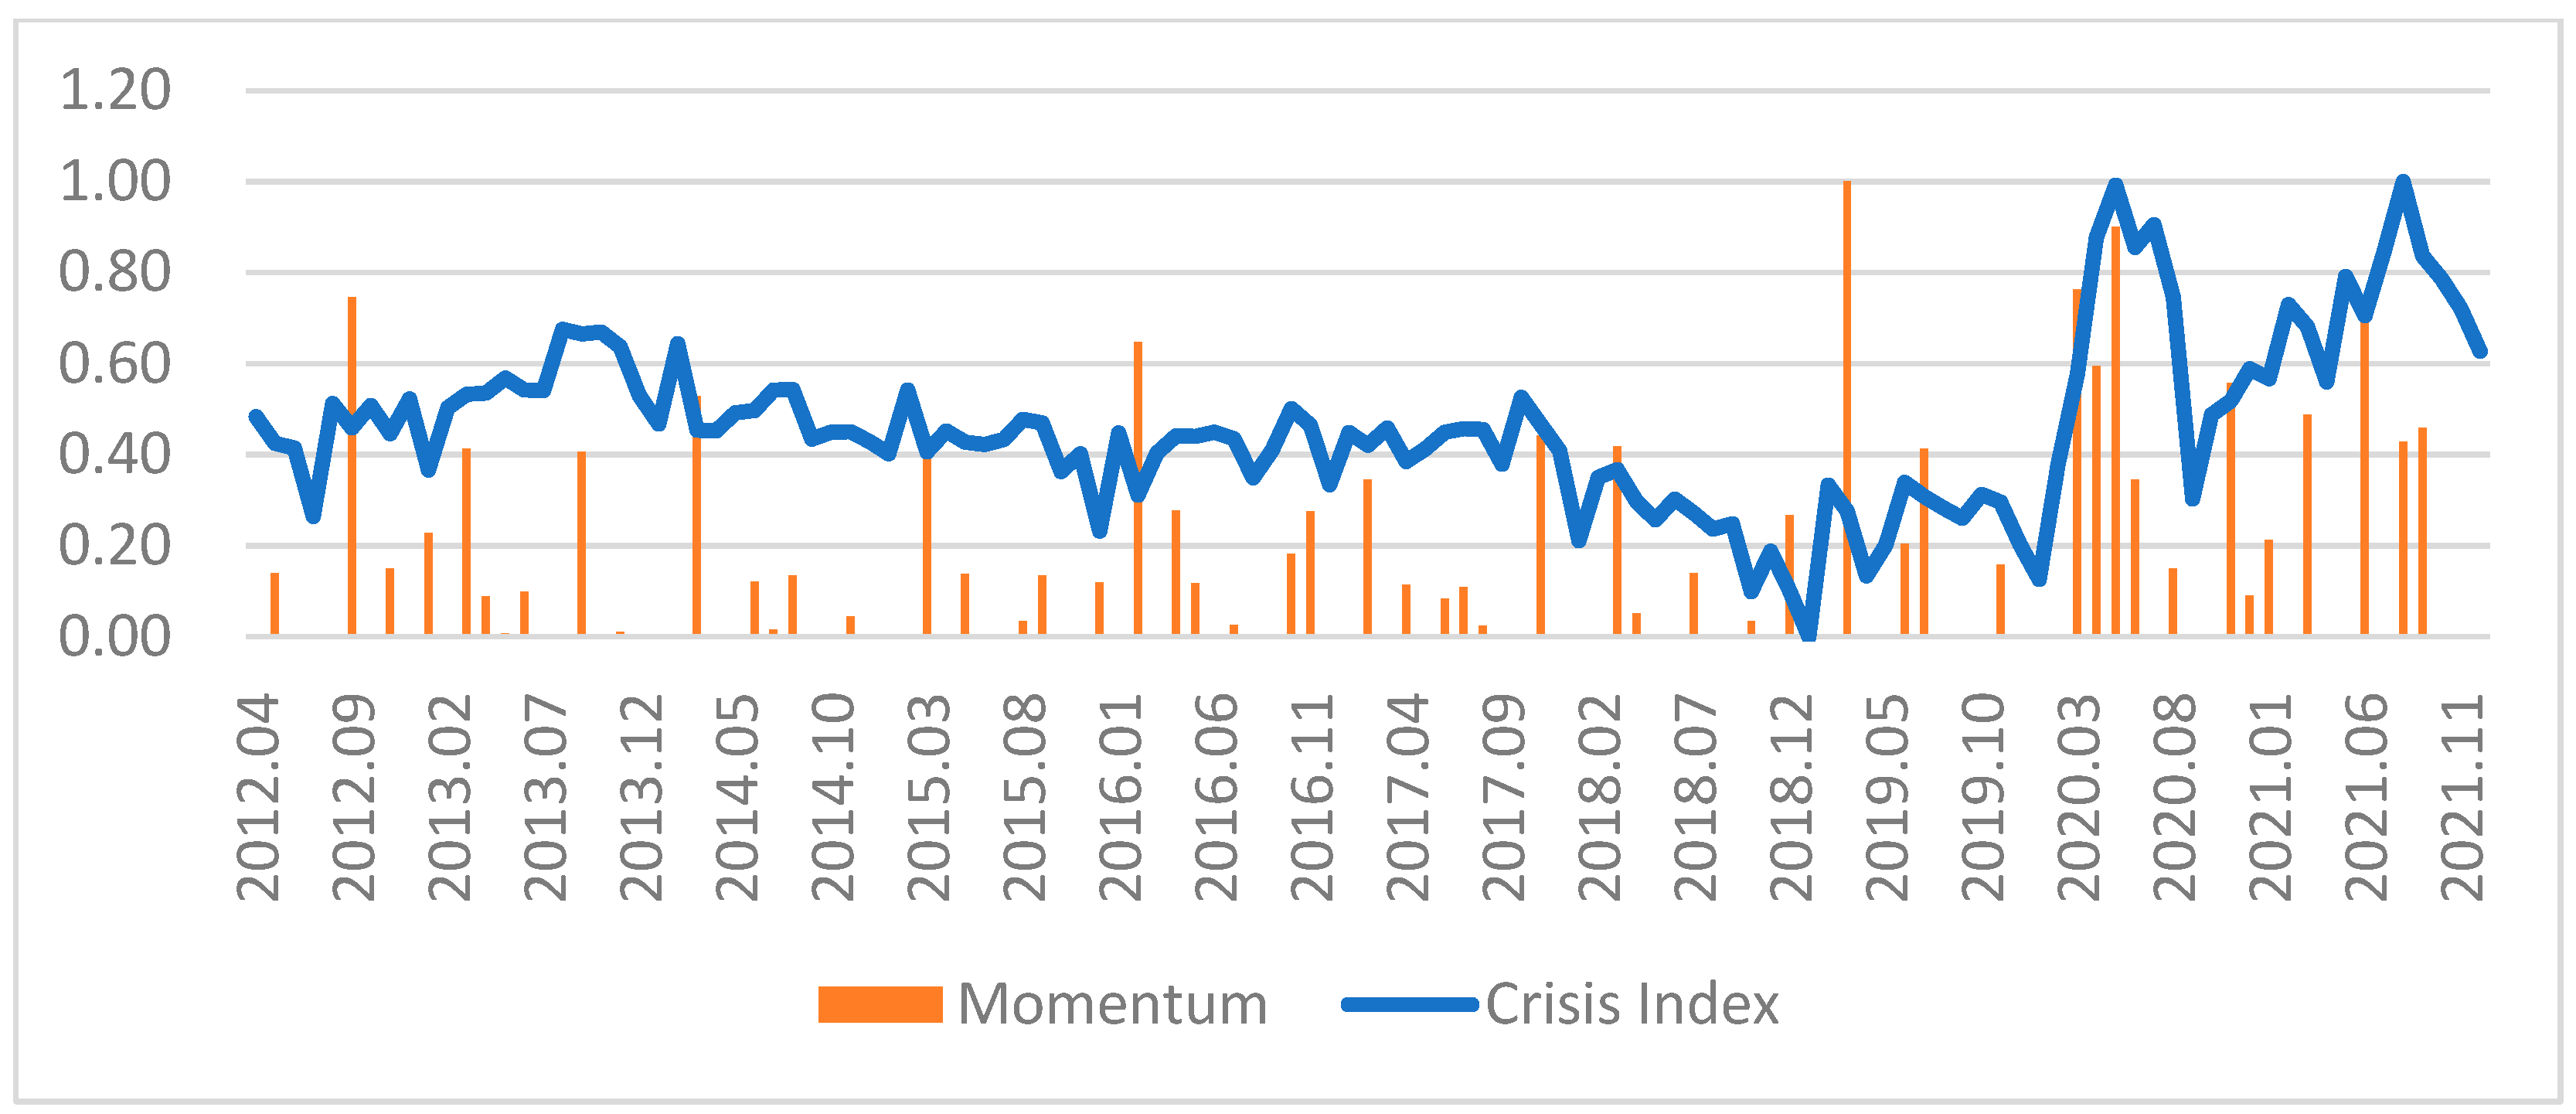
The following figure shows the results of the energy industry predicted by momentum. The line graph represents the Crisis Index, and the bar graph represents the momentum results. As mentioned earlier, situations in which the risk index is lowered are excluded. In the graph of momentum in all industries, the predictability of the Crisis Index is not visible. It can be seen that the frequency of momentum increases prior to the section where the risk index rises, but this does not indicate the accuracy of the predictability of the risk index.
4.3. Visualizing the Earnings Downside Risk Measurement
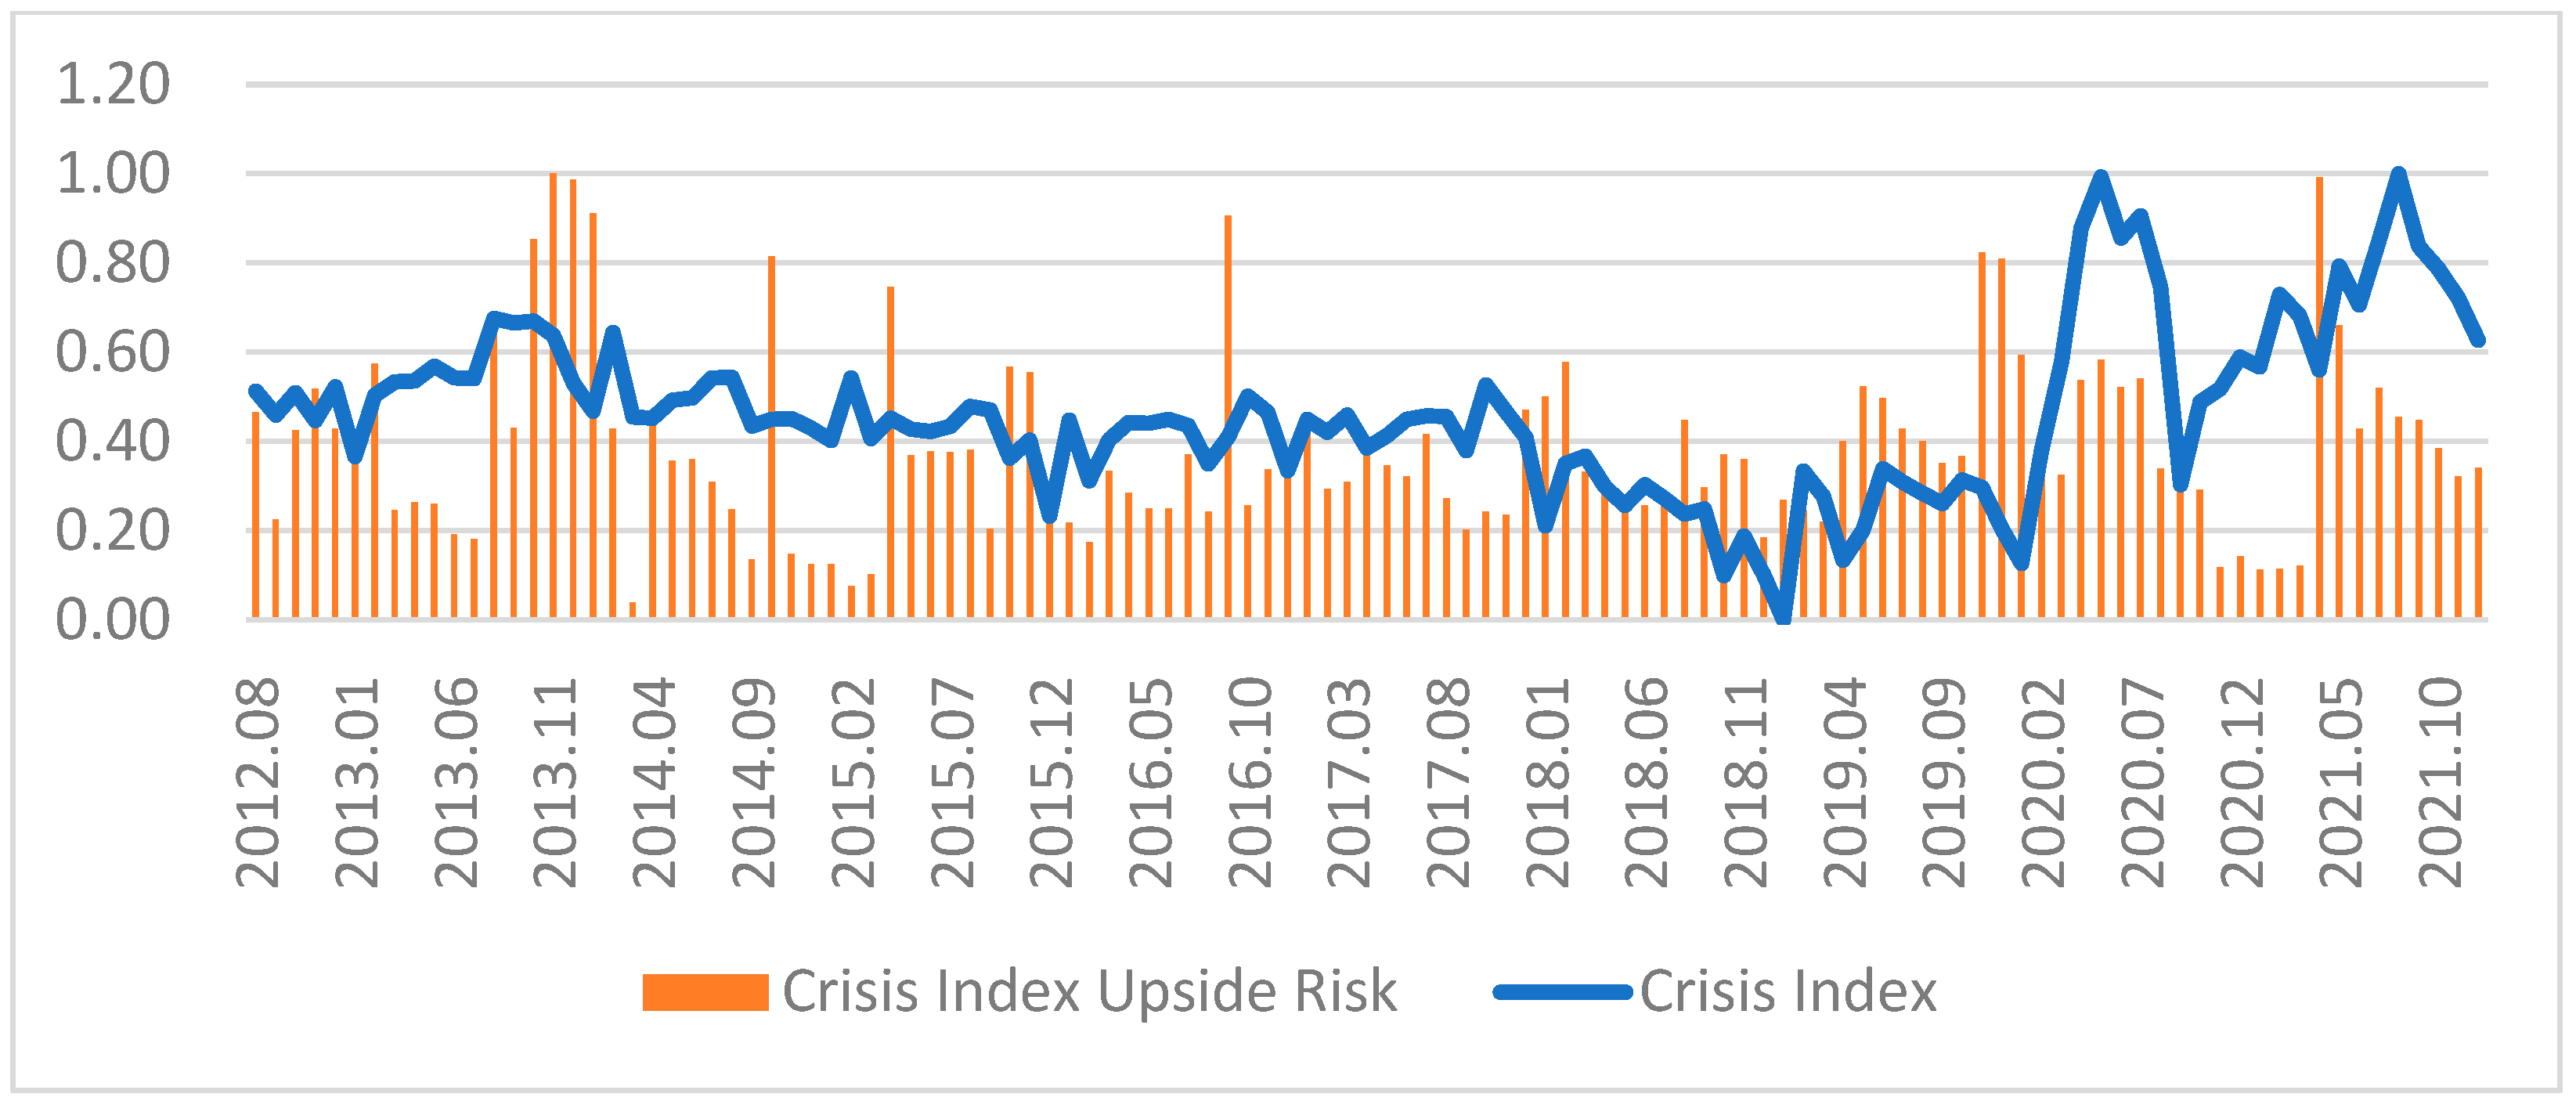
The following figure shows the results of the energy industry predicted by the upside risk of the Crisis Index. The line graph shows the Crisis Index, and the bar graph shows the results of the upside risk of the Crisis Index. Compared to the case of momentum, there are relatively similar trend lines. However, even though a very high upside risk of the risk index is found in a specific section, it can be confirmed that the change in the actual risk index appears late or decreases.
4.4. Normalizing the Momentum Index and the Earnings Downside Risk Measurement
As shown in Figure 5 and Figure 6, momentum can have a negative value and a different range of crisis upside risk. In addition, the value ranges of momentum and crisis upside risk are different from the value ranges of probability. Therefore, a normalization process is needed to convert momentum and crisis upside risk values into probabilities.
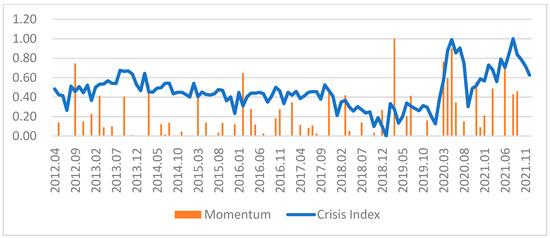
Figure 5.
Comparison of Trends between Crisis Index and Momentum in the Energy Industry.
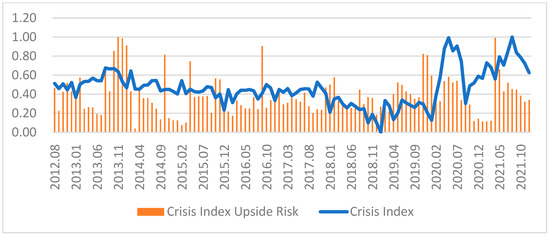
Figure 6.
Comparison of Crisis Index and Crisis Upside Risk Trends in the Energy Industry.
In order to collect the two prediction methods with different characteristics, first, a normalization process is performed so that the range of each method has a value between 0 and 1. The min-max normalization method is used so that the data of both methods have the same information scale. The range of momentum results in the past was 0 to 15.65, but it is converted to a value between 0 and 1, and the range of the past Crisis Index Upside risk was 0 to 0.98, but it was converted to a value between 0 and 1.
4.5. Proposing the Prediction Model
In order to collect the two prediction methods with different characteristics, the proportions of each method were varied, and then the trend of the actual Crisis Index and Spearman’s correlation were confirmed. The different correlations, which were created according to the weight of the risk index and each prediction method, were intended to find the most closely correlated weight and increase prediction accuracy.
Table 2 shows the result of correlation analysis to verify the optimal weight of Momentum and Crisis Index Upside Risk. As a result of the analysis, a statistically significant level of Spearman’s correlation was found at other weights, but the highest correlation coefficient value was shown at the 5:5 weights. Therefore, in order to adopt an approach to risk prediction that is as conservative as possible, the weights for combining the two models was set at 5:5.

Table 2.
Correlation Analysis to Verify the Optimal Weights of Momentum and Crisis Index Upside Risk.
4.6. Validating the Prediction Model
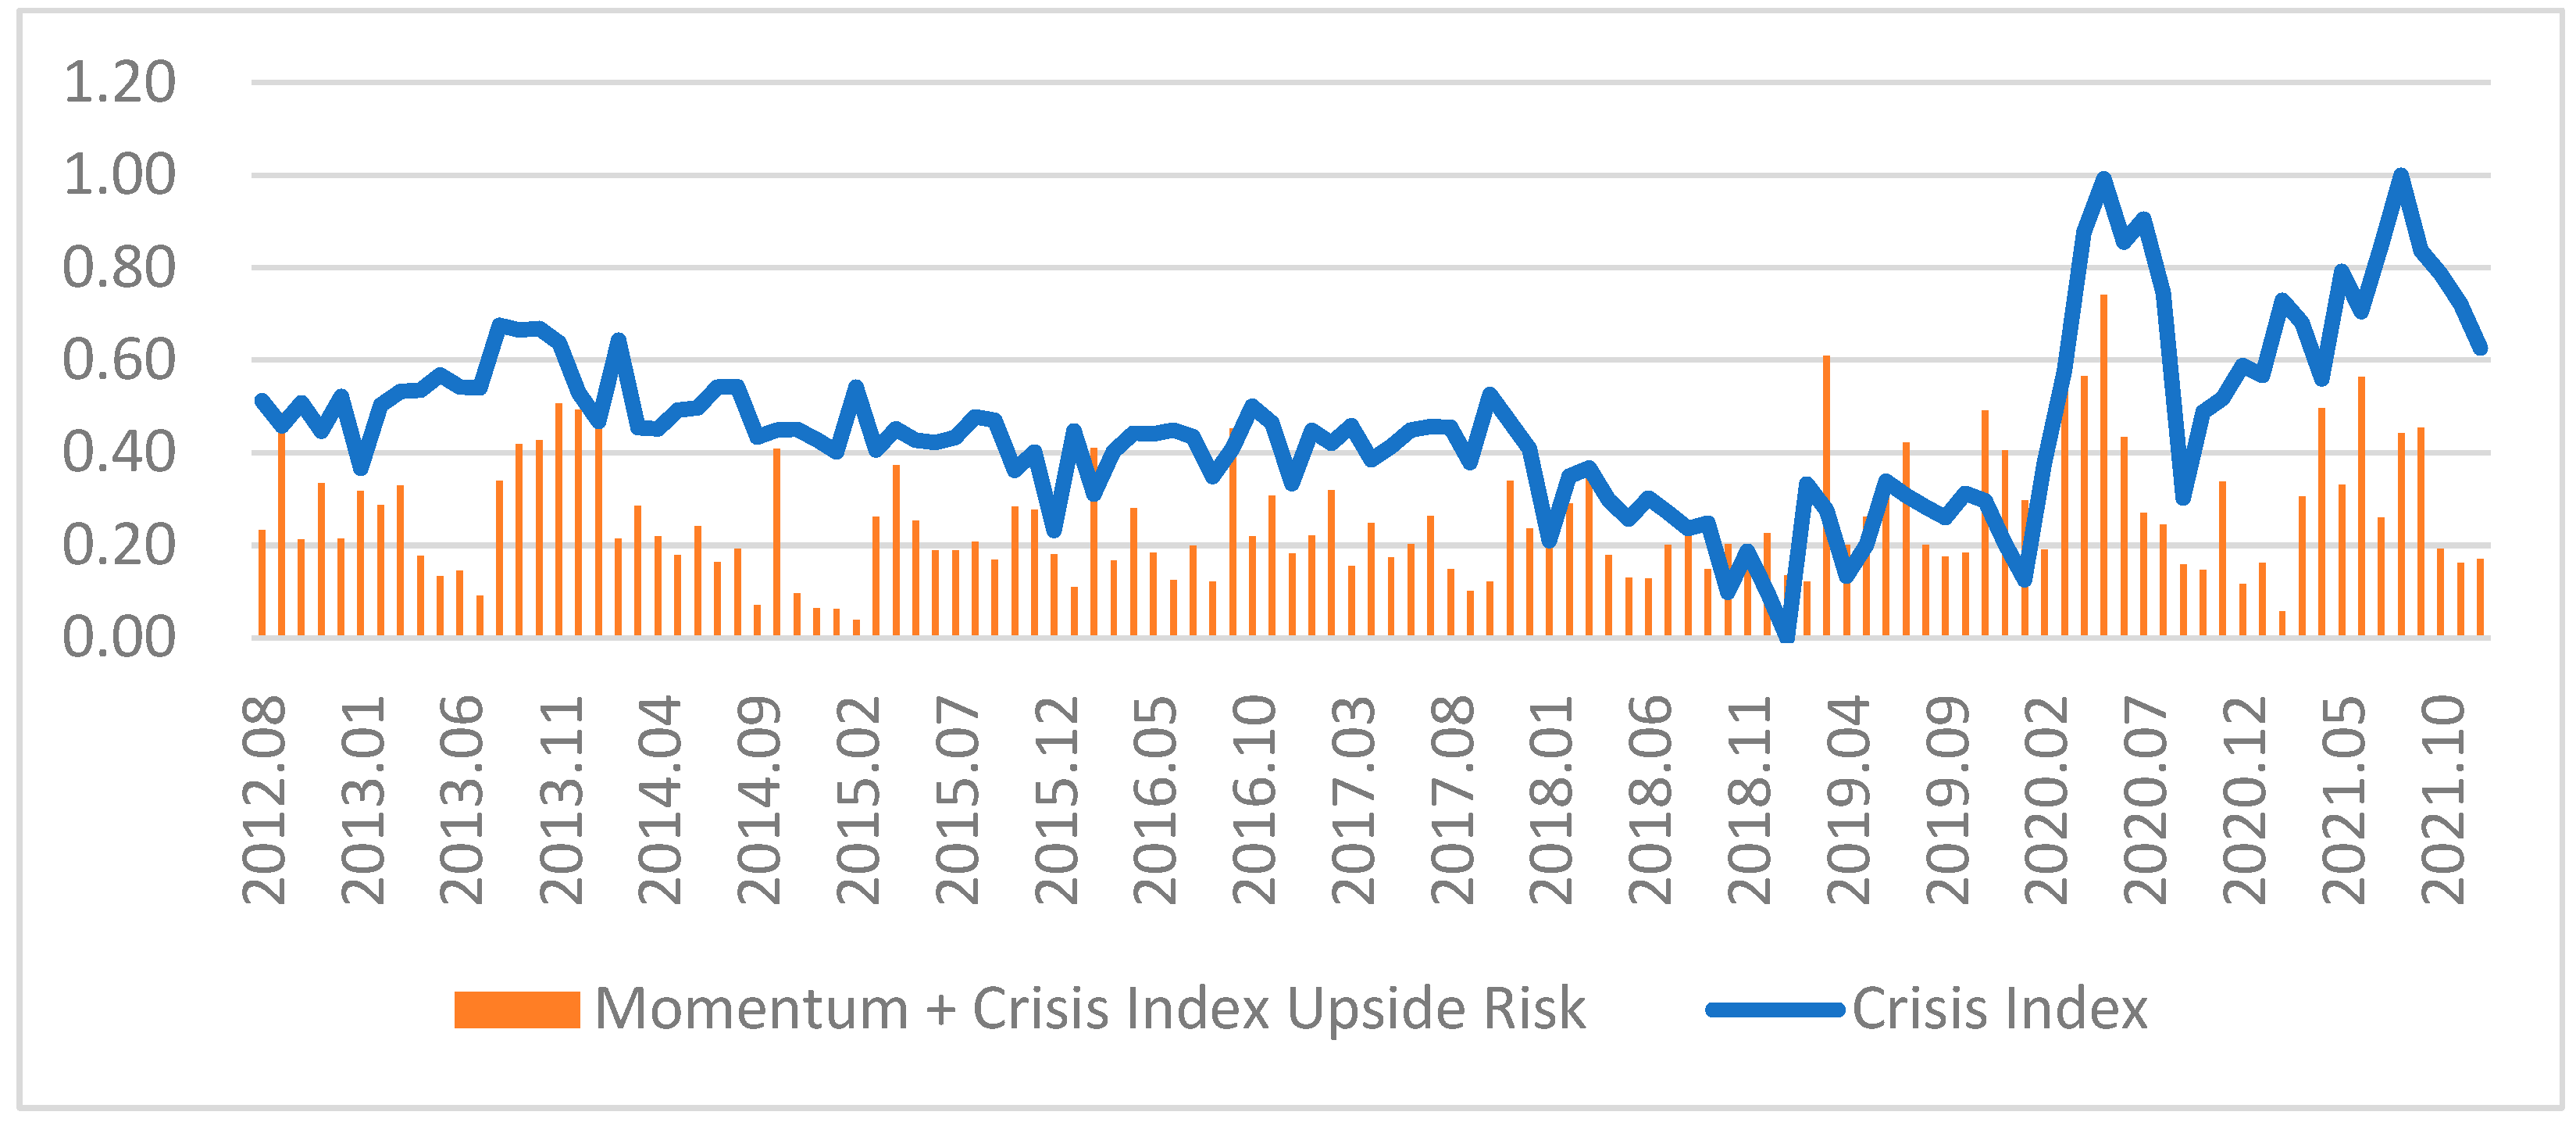
Statistical evidence is provided to verify the robustness of the crisis prediction model. First, the prediction picture of the crisis prediction model combining the two methods is shown in Figure 7. The line graph represents the Crisis Index, and the bar graph represents the crisis prediction model. The trend line shown in the graph visually confirms that the prediction accuracy is relatively higher than when each method is applied separately.
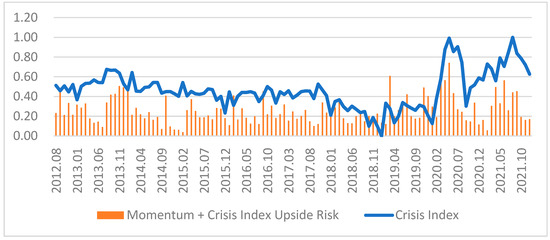
Figure 7.
Comparison of Crisis Index Trends and Crisis Prediction Models in the Energy Industry.
For the statistical verification of the newly proposed Crisis Index prediction model, the 19th subclass of the Korean Standard Industrial Classification was selected. The Crisis Index prediction period was set to period t, period t + 1 and period t + 2. First, Spearman’s correlation was performed to verify the correlation of each variable.
Table 3 shows the correlation of variables used in the crisis prediction model. As a result of the analysis, the new Crisis Index prediction model showed a higher correlation with the Crisis Index than other models. Based on the correlation with the future prediction index, the new Crisis Index prediction model showed a significant correlation at the 1% level in the t + 1 period but no significant correlation appeared in the t + 2 period.

Table 3.
Correlation of Crisis Prediction Model Variables.
OLS regression analysis was conducted to analyze the time-specific causal relationship between the new crisis index prediction model and the actual Crisis Index. The independent variable uses the value calculated by the crisis prediction model, and the dependent variable uses the value of the future Crisis Index.
Table 4 shows the results of OLS regression analysis on the effect of the Crisis Index prediction model on future Crisis Index. As a result of the analysis, the Crisis Index prediction model showed statistically significant positive values for the t period, t + 1 period and t + 2 period of the future Crisis Index. These results suggest that the new crisis prediction model, which combines momentum and the risk index upside risk, has statistical robustness.

Table 4.
Result of the OLS Regression Analysis of the Effect of the Crisis Index Prediction Model on Future Crisis Index.
5. Discussion
The crisis prediction model, which was created by combining the momentum theory and the earning downside risk theory to predict a crisis in the energy industry, showed statistically significant values for the Crisis Index of the current month, one month later and two months later. These results indicate the accuracy of the prediction model presented.
The statistical verification results of the model proposed in this study suggest that it is a very reliable new model in the energy literature. Compared to existing prediction models, which had problems with researcher bias, the model of this study is very intuitive and highly accurate. Therefore, it achieves the goal of sharing reliable information to respond to crises in the energy industry.
Being able to predict crises every month can secure time to respond. For example, in situations where a crisis is expected to continue to increase, a proactive energy demand response strategy can mitigate the shock. On the other hand, if a crisis is expected to decrease, a long-term strategy to improve social stability can be prepared. Creating a sustainable and stable energy ecosystem is the most significant development underway in the energy industry and will have a considerable ripple effect on other industries. Therefore, the results of this study can be used an alternative path to reach this goal.
6. Conclusions
6.1. Research Conclusions
In the energy industry, the economic impact of supply and demand manifests itself throughout raw material production, processing and distribution. The purpose of this study is to provide academic information to help prepare for crisis management through prediction using indicators. This study provides a risk prediction model using an index. Therefore, it contributes analytic insight into the predictability of numerous indicators created for various purposes, and furthermore, provides implications for crises in the Korean energy industry.
The new predictive model outlined in this study can be applied to various fields. It can be an intuitively applicable tool for forecasting national indices, thus serving a variety of purposes. The crisis prediction model can be used as a model to predict crises of various industries. If these crises can be predicted in advance, they can provide opportunities for establishing corporate strategies and national policies to respond to risk. Furthermore, if a crisis can be predicted two months in advance, a response to reduce the impact of the crisis becomes possible. Therefore, it is expected that the risk prediction model can be usefully applied to various industries. Specifically, based on the Crisis Index created by combining various indicators, this study provides an academic basis for risk management through forecasts that reflect momentum and volatility. Therefore, this study contributes to securing preparation time to cope with the crises caused by recent global and regional conflicts and economic anxiety caused by COVID-19.
6.2. Research Contributions
The purpose of this study was to develop and verify a model for predicting crises of the energy industry using the Crisis Index provided by the Korea Institute of Science and Technology. Unlike other widely used economic indices, the Crisis Index makes it possible to attain differentiations in analysis by using an index representing the crisis of the industry. The fact that the Crisis Index calculated for a specific period appears high can be interpreted as an increase in crises of the industry. However, it is not very useful to simply observe the Crisis Index at a specific time. In a market such as South Korea, which is exposed to the volatility of the global energy industry, predicting and preparing for industrial crises in advance can be a useful approach not only at the industrial level but also at the corporate level.
Instead of a single statistical technique which may involve the bias of past researchers, we applied momentum, an economic theory that captures trend changes, and earnings downside risk theory, which captures financial risks that can cause corporate earnings to fall based on past volatility to develop a new crisis prediction model. For predictive accuracy, we sought the optimal combination weights of the two theories and secured reliability through the statistical analysis of the predictive model and actual risk index. Therefore, this study provides a scholarly contribution concerning predictive information using an economic theory for crisis situations of the actual energy industry. In particular, future prediction information can be improved by verifying the statistical relationship between the value calculated by the predictive model and the actual risk index value at the time of observation, one month after observation and two months after the observation.
The results of this study not only offer an academic basis for the crisis prediction model applicable to the Korean energy industry but also provide a practical means for industry forecasting in various countries. Since there are relatively few countries with abundant natural resources and a stable energy industry ecosystem, it is very important to predict upcoming crises based on crisis-related indices that reflect each country’s unique characteristics. In particular, the proposed model has high practical use value in providing information to secure time to respond to crises amidst the recent global economic instability.
The results of this study comprise useful information that can reflect the current state of the energy industry in national macro-policy processes. These findings can be used as basic data for efficient state support and assistance and can also be used as environmental information to which companies in the energy industry can refer when establishing management strategies. In particular, unlike many economic indices, the proposed model will be of broad interest to modern energy information users, in that it can intuitively inform predictive information by capturing a crisis.
6.3. Research Limitations
The energy industry crisis prediction model proposed in this study has design limitations. We sought to increase theoretical accuracy by combining two theories, but each theory has its limitations. First, momentum theory begins by observing trends under the assumption of normal economic conditions. In other words, if there has been a significant economic crisis in the past, the accuracy of the momentum theory is inevitably lessened. This also applies to the theory of downside risks to earnings. This theory is highly accurate in predicting risks by capturing earning fluctuations within an appropriate range, but the predictability is inevitably low in boom and slump situations, thus exceeding the appropriate range. In order to compensate for these limitations, this study analyzed the period after 2012 when the effects of the 2008 global financial crisis had stabilized.
Furthermore, the crisis-related information that was used in this study had a limitation in that only information available at the point of observation was collected. In other words, it is impossible to predict global events, such as the unforeseen COVID-19 pandemic. Accurately predicting the future with only past information can be an impossible challenge. Therefore, in order to utilize the predictive model of this study, a cautious approach by information providers may be required.
6.4. Future Research
Although the crisis prediction model proposed in this study can act as a new model for index prediction, there are still many shortcomings regarding accuracy. There are multiple variables that need to be considered in order for the predictions to be more accurate. In this regard, it is notable that numerous prediction methodologies using scientific algorithms based on large amounts of data already exist and are being developed, and these research trends are being accelerated by artificial intelligence and supported by advanced technology. Thus, predictions can be very accurate.
Although studying accurate predictions for a particular field has academic value, it does not imply practicality. This is because advanced technical research has limitations in terms of being widely accepted by the public more easily.
Therefore, it is necessary to continuously critique and improve complex structural problems caused by the use of various variables, especially those involving issues caused by the intrusion of researchers’ biases. From this point of view, it is the researcher’s task to develop new predictive techniques that are more intuitive and have better accuracy. Follow-up studies should be directed toward achieving this original purpose, namely, to develop intuitive research along with technologically advanced research.
Author Contributions
Conceptualization, J.C. and J.H.; formal analysis, J.H.; funding acquisition, H.K.; investigation, H.K.; methodology, J.H.; project administration, J.C.; resources, H.K.; software, K.P.; supervision, J.C. and J.H.; validation, J.C. and K.P.; visualization, K.P.; writing—original draft, J.C.; writing—review and editing, J.C. and J.H. All authors have read and agreed to the published version of the manuscript.
Funding
This research was funded by a Research Program of the Korea Institute of Science and Technology Information (KISTI) (No. K-22-L03-C03-S01 and No. K-23-L03-C03-S01).
Data Availability Statement
Not applicable.
Conflicts of Interest
The authors declare no conflict of interest.
References
- Omer, A.M. Energy, environment and sustainable development. Renew. Sustain. Energy Rev. 2008, 12, 2265–2300. [Google Scholar] [CrossRef]
- Fisher, M.L.; Hammond, J.H.; Obermeyer, W.R.; Raman, A. Making supply meet demand in an uncertain world. Harv. Bus. Rev. 1994, 72, 83–93. [Google Scholar]
- Mouapi, A.; Mrad, H. Energy prediction and Energy Management in Kinetic Energy-Harvesting Wireless Sensores Network for Industry 4.0. Appl. Sci. 2022, 12, 7298. [Google Scholar] [CrossRef]
- Scholes, M.S. Crisis and Risk Management. American Econ. Rev. 2000, 90, 17–21. [Google Scholar] [CrossRef]
- Haiyun, C.; Zhixiong, H.; Yuksel, S.; Yüksel, S.; Dinçer, H. Analysis of the innovation strategies for green supply chain management in the energy industry using the QFD-based hybrid interval valued intuitionistic fuzzy decision approach. Renew. Sustain. Energy Rev. 2021, 143, 110844. [Google Scholar] [CrossRef]
- Yang, H.; Huang, K.; King, I.; Lyu, M.R. Localized support vector regression for time series prediction. Neurocomputing 2009, 72, 2659–2669. [Google Scholar] [CrossRef]
- Faruk, D.Ö. A hybrid neural network and ARIMA model for water quality time series prediction. Eng. Appl. Artif. Intell. 2010, 23, 586–594. [Google Scholar] [CrossRef]
- Zivot, E.; Wang, J. Vector autoregressive models for multivariate time series. In Modeling Financial Time Series with S-PLUS; Springer: New York, NY, USA, 2006; pp. 385–429. [Google Scholar]
- Scholtens, B.; Yurtsever, C. Oil price shocks and European industries. Energy Econ. 2012, 34, 1187–1195. [Google Scholar] [CrossRef]
- Gupta, R.; Wohar, M. Prediction oil and stock returns with a Qual VAR using over 150 years off data. Energy Econ. 2017, 62, 181–186. [Google Scholar] [CrossRef]
- Guresen, E.; Kayakutlu, G.; Daim, T.U. Using artificial neural network models in stock market index prediction. Expert Syst. Appl. 2011, 38, 10389–10397. [Google Scholar] [CrossRef]
- Längkvist, M.; Karlsson, L.; Loutfi, A. A review of unsupervised feature learning and deep learning for time-series modeling. Pattern Recognit. Lett. 2014, 42, 11–24. [Google Scholar] [CrossRef]
- Hamdoun, H.; Sagheer, A.; Youness, H. Energy time series forecasting-analytical and empirical assessment of conventional and machine learning models. J. Intell. Fuzzy Syst. 2021, 40, 12477–12502. [Google Scholar] [CrossRef]
- Gjolberg, O.; Johnson, T. Risk management in the oil industry: Can information on long-run equilibrium prices be utilized? Energy Econ. 1999, 21, 517–527. [Google Scholar] [CrossRef]
- Demirer, R.; Lien, D.; Zhang, H. Industry herding and momentum strategies. Pac.-Basin Financ. J. 2015, 32, 95–110. [Google Scholar] [CrossRef]
- Chen, C.; Cheng, C.; Demirer, R. Oil and stock market momentum. Energy Econ. 2017, 68, 151–159. [Google Scholar] [CrossRef]
- Celik, A.E.; Karatepe, Y. Evaluating and forecasting banking crises through neural network models: An application for Turkish banking sector. Expert Syst. Appl. 2007, 33, 809–815. [Google Scholar] [CrossRef]
- Yümlü, S.; Gürgen, F.G.; Okay, N. A comparison of global, recurrent and smoothed-piecewise neural models for Istanbul stock exchange (ISE) prediction. Pattern Recognit. Lett. 2005, 26, 2093–2103. [Google Scholar] [CrossRef]
- Bildirici, M.; Ersinb, Ö.Ö. Forecasting oil prices: Smooth transition and neural network augmented GARCH family models. J. Pet. Sci. Eng. 2013, 109, 230–240. [Google Scholar] [CrossRef]
- Moghaddam, A.H.; Moghaddam, M.H.; Esfandyari, M. Stock market index prediction using artificial neural network. J. Econ. Financ. Adm. Sci. 2016, 21, 89–93. [Google Scholar] [CrossRef]
- Karasu, S.; Atlan, A. Crude oil time series prediction model based on LSTM network with chaotic Henry gas solubility optimization. Energy 2022, 242, 122964. [Google Scholar] [CrossRef]
- Konchitchki, Y.; Luo, Y.; Ma, M.L.Z. Accounting-based downside risk, cost of capital, and the macroeconomy. Rev. Account. Stud. 2016, 21, 1–36. [Google Scholar] [CrossRef]
- Kanagaraj, J.; Senthilvelan, T.; Panda, R.; Kavitha, S. Eco-friendly waste management strategies for greener environment towards sustainable development in leather industry: A comprehensive review. J. Clean. Prod. 2015, 89, 1–17. [Google Scholar] [CrossRef]
- Bale, C.S.; Varga, L.; Foxon, T.J. Energy and complexity: New ways forward. Appl. Energy 2015, 138, 150–159. [Google Scholar] [CrossRef]
- Chang, L.; Lu, Q.; Ali, S.; Mohsin, M. How does hydropower energy asymmetrically affect environmental quality? Evidence from quantile-based econometric estimation. Sustain. Energy Technol. Assess. 2022, 53, 102564. [Google Scholar] [CrossRef]
- Reddy, S.; Painuly, J.P. Diffusion of renewable energy technologies-barriers and stakeholders’ perspectives. Renew. Energy 2004, 29, 1431–1447. [Google Scholar] [CrossRef]
- Geddes, A.; Schmidt, T.S.; Steffen, B. The multiple roles of state investment banks in low-carbon energy finance: An analysis of Australia, the UK and Germany. Energy Policy 2018, 115, 158–170. [Google Scholar] [CrossRef]
- Pan, W.; Hang, C.; Ying, L. “Green” innovation, privacy regulation and environmental policy. Renew. Energy 2023, 203, 245–254. [Google Scholar] [CrossRef]
- Moe, E. Energy, industry and politics: Energy, vested interests, and long-term economic growth and development. Energy 2010, 35, 1730–1740. [Google Scholar] [CrossRef]
- Lei, C.; Farhad, T.; Huangen, C.; Muhammad, M. Do green bonds have environmental benefits? Energy Econ. 2022, 115, 106356. [Google Scholar]
- Chang, L.; Moldir, M.; Zhang, Y.; Nazar, R. Asymmetric impact of green bonds on energy efficiency: Fresh evidence from quantile estimation. Util. Policy 2023, 80, 101474. [Google Scholar] [CrossRef]
- Chang, L.; Iqbal, S.; Chen, H. Does financial inclusion index and energy performance index co-move? Energy Policy 2023, 174, 113422. [Google Scholar] [CrossRef]
- Gray, J.; Goldstein, H.; Thomas, S. Predicting the future: The role of past performance in determining trends in institutional effectiveness at A level. Br. Educ. Res. 2001, 27, 391–405. [Google Scholar] [CrossRef]
- McKinnon, A.C. Decoupling of Road Freight Transport and Economic Growth Trends in the UK: An Exploratory Analysis. Transp. Rev. 2007, 27, 37–64. [Google Scholar] [CrossRef]
- Nelson, R.H. The Momentum Theory of Goodwill. Account. Rev. 1953, 28, 491–499. [Google Scholar]
- Liew, J.; Vassalou, M. Can book-to-market, size and momentum be risk factors that predict economic growth? J. Financ. Econ. 2000, 57, 221–245. [Google Scholar] [CrossRef]
- Moskowitz, T.J.; Grinblatt, M. Do industries explain momentum? J. Financ. 1999, 4, 1249–1290. [Google Scholar] [CrossRef]
- Hong, H.; Stein, J.C. A unified theory of underreaction, momentum trading, and overreaction in asset markets. J. Financ. 1999, 54, 2143–2184. [Google Scholar] [CrossRef]
- Grinblatt, M.; Han, B. Prospect theory, mental accounting, and momentum. J. Financ. Econ. 2005, 78, 311–339. [Google Scholar] [CrossRef]
- Scowcroft, A.; Sefton, J. Understanding Momentum. Financ. Anal. J. 2005, 61, 64–82. [Google Scholar] [CrossRef]
- Bontempo, R.; Manna, M. On the potential of the ideal diffuser augmented wind turbine: An investigation by means of a momentum theory approach and of a free-wake ring-vortex actuator disk model. Energy Convers. Manag. 2020, 213, 112794. [Google Scholar] [CrossRef]
- Gay, C.F.; Moon, S.; Brown, H. Momentum at Last: Perspectives on the U. S. Renewable Energy Industry. Energy Sources 1998, 20, 97–102. [Google Scholar] [CrossRef]
- Soper, H.V.; Cicchetti, D.V.; Satz, P.; Light, R.; Orsini, D.L. Null Hypothesis Disrespect in Neuropsychology: Dangers of Alpha and Beta Errors. J. Clin. Exp. Neuropsychol. 1988, 10, 225–270. [Google Scholar] [CrossRef] [PubMed]
- Bhimani, A. Risk management, corporate governance and management accounting: Emerging interdependencies. Manag. Account. Res. 2009, 20, 2–5. [Google Scholar] [CrossRef]
- Soin, K.; Collier, P. Risk and risk management in management accounting and control. Manag. Account. Res. 2013, 24, 82–87. [Google Scholar] [CrossRef]
- Copeland, R.M. Income Smoothing. J. Account. Res. 1968, 6, 101–116. [Google Scholar] [CrossRef]
- Baik, B.; Choi, S.; Farber, D.B. Managerial ability and income smoothing. Account. Rev. 2020, 95, 1–22. [Google Scholar] [CrossRef]
- Kothari, S.P.; Shu, S.; Wysocki, P.D. Do managers withhold bad news? J. Account. Res. 2009, 47, 241–276. [Google Scholar] [CrossRef]
- Wei, H.; Yan, L.; Chenyang, Z. Accounting-based downside risk and stock price crash risk: Evidence from China. Financ. Res. Lett. 2022, 45, 102152. [Google Scholar]
- Larborda, R.; Olmo, J. Volatility spillover between economic sectors in financial crisis prediction: Evidence spanning the great financial crisis and COVID-19 pandemic. Res. Int. Bus. Financ. 2021, 57, 101402. [Google Scholar] [CrossRef]
- Diebold, F.X.; Yilmaz, K. Better to give than to receive: Predictive directional measurement of volatility spillover. Int. J. Forecast. 2012, 28, 57–66. [Google Scholar] [CrossRef]
- Clifford, W.; Smith, J. Corporate risk management: Theory and practice. J. Deriv. 1995, 2, 21–30. [Google Scholar]
- Lima Rua, O.; Musiello-Neto, F.; Arias-Oliva, M. Linking open innovation and competitive advantage: The roles of corporate risk management and organisational strategy. Balt. J. Manag. 2022, 18, 104–121. [Google Scholar] [CrossRef]
- Clark, R.T.; Bett, P.E.; Thornton, H.E.; Scaife, A.A. Skillful seasonal predictions for the European energy industry. Environ. Res. Lett. 2017, 12, 024002. [Google Scholar] [CrossRef]
- Yu, L.; Lian, S.; Chen, R.; Lai, K.K. Predicting monthly biofuel production using a hybrid ensemble forecasting methodology. Int. J. Forecast. 2022, 38, 3–20. [Google Scholar] [CrossRef]
- Benson, D.J. Momentum advection on a staggered mesh. J. Comput. Phys. 1992, 100, 143–162. [Google Scholar] [CrossRef]
- Bamber, L.S. Unexpected Earnings, Firm Size, and Trading Volume around Quarterly Earnings Announcements. Account. Rev. 1987, 62, 510–532. [Google Scholar]
- Saranya, C.; Manikandan, G. A Study on Normalization Techniques for Privacy Preserving Data Mining. Int. J. Eng. Technol. 2013, 5, 2701–2704. [Google Scholar]
- Lesmond, D.A.; Schill, M.J.; Zhou, C. The illusory nature of momentum profits. J. Financ. Econ. 2004, 71, 349–380. [Google Scholar] [CrossRef]
- Kalinowski, T.; Cho, H. Korea’s Search for a Global Role between Hard Economic Interests and Soft Power. Eur. J. Dev. Res. 2012, 24, 242–260. [Google Scholar] [CrossRef]
- Kim, J.; Chung, K. Emerging risk forecast system using associative index mining analysis. Clust. Comput. 2017, 20, 547–558. [Google Scholar] [CrossRef]
Disclaimer/Publisher’s Note: The statements, opinions and data contained in all publications are solely those of the individual author(s) and contributor(s) and not of MDPI and/or the editor(s). MDPI and/or the editor(s) disclaim responsibility for any injury to people or property resulting from any ideas, methods, instructions or products referred to in the content. |
© 2023 by the authors. Licensee MDPI, Basel, Switzerland. This article is an open access article distributed under the terms and conditions of the Creative Commons Attribution (CC BY) license (https://creativecommons.org/licenses/by/4.0/).

