Article

Energy Conveyor Belt—A Detailed Analysis of a New Type of Hydrokinetic Device

by
Mithran Daniel Solomon
1,*,
Wolfram Heineken
1,
Marcel Scheffler
1 and
Torsten Birth
1,2
1
Fraunhofer Institute for Factory Operation and Automation IFF, Sandtorstraße 22, 39106 Magdeburg, Germany
2
Hochschule für Angewandte Wissenschaften, Berliner Tor 5, 20099 Hamburg, Germany
*
Author to whom correspondence should be addressed.
Energies 2023, 16(5), 2188; https://doi.org/10.3390/en16052188
Submission received: 27 January 2023 / Revised: 19 February 2023 / Accepted: 21 February 2023 / Published: 24 February 2023
(This article belongs to the Section L: Energy Sources)

Abstract

:
Renewable energy technologies can help us combat climate change and hydrokinetic energy conversion systems could play a major role. The simplicity of hydrokinetic devices helps us to exploit renewable sources, especially in remote locations, which is not possible with conventional methods. A new type of hydrokinetic device called the Energy Conveyor Belt was designed, which works on the concept of conveyor belt technology. Numerical simulations are performed on the design of the Energy Conveyor Belt with Ansys FLUENT to optimize its performance. Some of the optimized models produced a maximum power slightly above 1 kW. The numerical results are then compared to the experimental results of other hydrokinetic turbines. The compactness and flexibility of the design give the Energy Conveyor Belt an advantage over other hydrokinetic devices in regions with fluctuating water levels. Further research has to be undertaken into cascading systems to increase the overall power generated by the system.

1. Introduction

The current focus of the global energy discussion is on energy resources, the effects of their depletion, and price fluctuations. Today, the most pressing issues are guaranteeing the continued existence of natural life and leaving behind a livable and unpolluted environment for future generations. Energy demand, the security of its supply and the effects of climate change will necessitate policies to take advantage of natural resources with minimal environmental impacts [1]. Compared to conventional energy sources, renewable energy technologies have several positive environmental effects. The largest and most affordable renewable energy source in the world is hydropower. Additionally, it is also one of the most effective ways to generate electricity [2,3,4].
The hydrostatic and hydrokinetic methods are the two basic ways to use water to generate energy. The traditional method of creating electricity is called the hydrostatic technique, which involves storing water in reservoirs to produce a pressure head and then using proper turbo-machinery to extract the water’s potential energy [5]. The suitable locations for large-scale hydrostatic hydropower plants have largely been exploited in industrialized nations. Furthermore, due to geography, geology, lack of construction materials, seismic risks, etc., building a dam across some river valleys may be technically or economically impractical. In contrast, systems for converting hydrokinetic energy into electricity are promising options for electrifying such locations. Hydrokinetic technologies are designed in such a way that they can be deployed in natural streams such as rivers, tidal estuaries, ocean currents, waves, man-built waterways, and other flowing water facilities [6,7,8]. Using hydrokinetic turbines to generate energy in off-the-grid and distant locations where transmission lines are lacking may be the most practical and affordable option [9,10,11,12]. Additionally, hydrokinetic systems have less of an impact on the environment than dams do [5,13]. Hydrokinetic systems can be classified as: marine based (ocean current and tidal): high power with many turbines [14], large river (e.g., Amazon): intermediate power, small river (like devices studied here): low power, but suitable for the insular application. The highest efficiency that an in-stream hydrokinetic turbine may achieve, sometimes referred to as the Betz limit, is 59.3% [15]. Only professional systems of the highest caliber can operate at 50% efficiency [16]. Hydrokinetic devices also have a drawback in the harsh marine environment. Devices that convert energy from waves in particular need to be robustly built to endure high and unpredictable water loads. Small-scale environmental concerns can also be present in hydrokinetic systems. Installation of hydrokinetic devices may obstruct fishing and navigation. Turbine components, chemicals, noise, and vibration can all negatively impact the aquatic environment [16].
In-stream energy conversion devices have a similar scientific foundation to wind energy conversion technology. Aside from a few key distinctions, the primary principles such as the use of blade sections, Blade element momentum theory, Betz limit, etc., are learnt from aerodynamic and hydrodynamic applications, wind turbine, and ship propeller techniques. Designing hydrokinetic systems necessitates interdisciplinary research in the fields of hydraulics, hydrology, electrical engineering, and mechanics [17]. Compared to a wind turbine of the same size, an in-stream hydrokinetic turbine produces a significant amount of power [5]. For example, a hydrokinetic turbine with a rated speed of 2–3 m/s may generate four times the energy of a wind turbine with a similar rating [18]. For water and wind, the estimated fluid densities are 1000 kg/m3 and 1.223 kg/m3, respectively. Typically, wind turbines are engineered to perform at rated wind speeds of 11 to 13 m/s [19]. Hydrokinetic turbines, on the other hand, have rated speeds of 1.5 to 3 m/s. A hydrokinetic turbine’s power density while operating at 2 m/s free stream velocity is equivalent to a wind turbine’s power density when operating at about 16 m/s flow rate [16].
There are currently several types of hydrokinetic turbines available on the market, including horizontal-axis turbines, vertical-axis turbines, and oscillating hydrofoils. Horizontal-axis turbines resemble wind turbines and have blades that rotate around a horizontal axis. On the other hand, vertical-axis turbines have blades that rotate around a vertical axis. Oscillating hydrofoils, or flapping wing turbines, use the movement of the water to move a set of wings back and forth, generating electricity. Some of the well-known hydrokinetic energy systems are given in Table 1 [20,21] along with their technical specifications.
The aim of this research paper is to provide a detailed analysis of a new type of hydrokinetic device. The device is based on conveyor belt technology, hereinafter referred to as ‘Energy Conveyor Belt’ (ECB). In Section 2, two types of ECB and also the geometry of the ECB are explained in detail. Section 3 summarizes all the results obtained by the numerical simulations. The results obtained by varying parameters are compared with one another. The best models are highlighted in Section 4, where also further research topics are identified.

2. Materials and Methods

2.1. Energy Conveyor Belt

Two designs were developed by Sibau Genthin GmbH and Co. KG, Genthin, Germany, as shown in Figure 1a,b. In the first design shown in Figure 1a, hereinafter referred to as Open-Chain ECB, the blades are suspended on two chains. This allows the water to freely flow in between the blades. In the second design shown in Figure 1b, hereinafter referred to as Closed-Band ECB, the blades are attached to a single closed band. In this case, there is no water flow in between the blades. In both cases, the ECB can be lowered with the help of a toothed rack. This allows the ECB to be adapted to different water levels.

2.2. Operating Principle

The ECB works on the principle of current energy conversion. Energy is extracted from the stream by converting the kinetic energy from a moving fluid into a motion of a mechanical system driving a generator [16,25,26].
Consider a fluid with mass m , moving at velocity v . It has a kinetic energy
e k = ( 1 2 ) m v 2
A fluid with density ρ travelling at a velocity v through a cross-sectional area A , which is perpendicular to the inflow velocity, has a mass flow rate
m ˙ = ρ v A
The power generated by a stream of fluid is then given by
P f l o w = ( 1 2 ) ρ A v 3

2.3. Betz Law

In 1919, German physicist Albert Betz formulated a law of fluid mechanics, describing the maximum possible power output of a wind turbine [27]. The law is independent of the medium and can, therefore, also be used on water turbines. Even if the law was originally specified for turbines whose rotor blades cover a circular cross-sectional area, the law can be formulated more generally, so that hydroelectric power plants such as the ECB can also be taken under consideration.
Consider a stream tube around the ECB, i.e., an area bounded by streamlines. The upper boundary is straight and is defined by the top surface of the water. The ECB slows down the flow, and therefore, according to the continuity equation, the stream tube expands. The conditions are shown in Figure 2.
Let m ˙ be the mass flow through the stream tube. According to the momentum equation, the force F acting on the moving parts of the ECB is given by
F = m ˙ ( v 1 v 2 )
According to the law of conservation, the mechanical power P is given by
P = F v = m ˙ ( v 1 2 v 2 2 ) 2
Substituting F in Equation (5)
v ( v 1 v 2 ) = ( v 1 2 v 2 2 ) 2
v = v 1 + v 2 2
This is Froude and Rankine’s theorem.
The power P is then given by
P = m 2 ˙ ( v 1 2 v 2 2 ) = ρ A v 2 ( v 1 2 v 2 2 )
P = ρ A 4 ( v 1 + v 2 ) ( v 1 2 v 2 2 )
where ρ is the density of water. If ρ , A , and v 1 are given, then the power is just a function of v 2 . Therefore, the power has a local extremum when
d P d v 2 = ρ A 4 · d d v 2 ( v 2 3 v 1 v 2 2 + v 1 2 v 2 + v 1 3 ) = 0  
This leads to the quadratic equation
3 v 2 2 2 v 1 v 2 + v 1 2 = 0
The positive solution of the quadratic equation is v 2 = v 1 3 , which is the maximum point of power. Hence, the maximum power is given by
P max = ρ A 4 · 4 3 v 1 · ( v 1 2 v 1 2 9 ) = 8 27 ρ A v 1 3
This forms the Betz law. Substituting P f l o w from Equation (3)
P max = 16 27 P f l o w
The value 16⁄27 is called the Betz power coefficient. It states that theoretically a maximum of 16⁄27 = 59.3% of the inflow power can be converted to a turbine or other free-standing hydroelectric power plant.

2.4. Geometry of the ECB

Figure 3 shows an example of the geometric features and arrangement of the ECB. The symbols indicate the following:
  • n—the number of blades.
  • S i —the blade number i.
  • S 1 —the first blade, this is the initial position in our simulation model. When moving, positions become different.
  • L—the distance between the axes of the two rollers.
  • r—the radius of the two rollers.
  • b—the width of a blade.
  • d—the distance between two adjacent blades.
  • α—angle of immersion.
  • P i the base of the blade  S i .
  • a—the distance from the axis of the upper roller to the water surface.
  • e i —the unit vector giving the direction of the band speed at blade S i .
As indicated in the figure, the blades S 1 to S k and S l to S m are on the straight sections of the band. The following relations are valid for the geometry:
d = 2 π r + 2 L n
k = L d + 1
l = L + π r d + 1
m = 2 L + π r d + 1
P i = ( r sin α + ( i 1 ) d cos α r cos α ( i 1 ) d sin α )   for   i = 1 , , k
P i = ( r sin β i + L cos α r cos β i L sin α )   for   i = k + 1 , , l 1
where β i = α + ( i 1 ) d L r
P i = ( r sin α + s i cos α r cos α s i sin α )   for   i = l , , m
where s i = 2 L ( i 1 ) d + π r
P i = ( r sin γ i r cos γ i )   for   i = m + 1 , , n
where γ i = α + ( i 1 ) d 2 L r
e i = (   cos α sin α )   for   i = 1 , , k
e i = (   cos β i sin β i )   for   i = k + 1 , , l 1
e i = ( cos α sin α )   for   i = l , , m
e i = (   cos γ i sin γ i )   for   i = m + 1 , , n
Here, ‘⌊ ⌋’ denotes the round-down function and ‘⌈ ⌉’ the round-up function. L = 3 m and r = 175 mm applies to all variants of the ECB examined within the scope of the project. The factors varied during the project are:
  • The number of blades n;
  • The blade width b;
  • The angle of immersion α;
  • The distance from the axis of the upper roller to the water surface a.
From the numerical simulations, the force F i = ( F i ,   x , F i , z ) acting on blade S i is given by ANSYS Fluent. The total force in the band direction is then calculated by
F Band = i = 1 n F i · e i  
Here, the symbol ‘∙’ denotes the scalar product. The mechanical power of the ECB is given by
P = F Band v Band
where v Band is the band velocity.

2.5. Meshing and Turbulence Modelling

The mesh of the 3D domain was generated using ANSYS Workbench Meshing. As illustrated in Figure 4a,b, a non-conformal unstructured grid with polyhedral elements was used to build the mesh for the whole flow domain, as well as a fine mesh in the rotational region compared to the stationary zone. The grid size at the walls is approximately 1 cm. A total of 1.08 million cells are estimated, beyond which there is no discernible change in the power coefficient. As a result, mesh refining is halted at 1.08 million cells. The boundaries have an inlet in the direction of the flow and an outlet in the opposite direction. The bottom is a stationary wall since it is considered as the river bed. The sides and the top surface are modeled as a slip wall with zero shear and no wave conditions are considered.
For all Computational Fluid Dynamics (CFD) simulations the turbulence model k-ω (SST) [28] with default y+ insensitive wall functions based on Launder and Spalding [29] was used where the boundary layers are not resolved by the grid and y+ is approximately 100. The CFD investigation was carried out using a SIMPLE (Semi-Implicit Method for Pressure-Linked Equations) pressure–velocity coupled solver with a first-order upwind scheme for all convection terms, i.e., equation of momentum, turbulent kinetic energy, and turbulent dissipation rate. For all residuals of momentum, continuity, and turbulence equations, the convergence conditions were set at 1 × 10⁻⁴.
With the “Multiple Reference Frames” (MRF) model, the Ansys Fluent software provides the possibility to carry out simulations with moving components in a quasi-stationary manner [30]. It is a modeling technique used to simulate rotating machinery. The flow equations and boundary conditions are modified in the MRF model in such a way that the movement is taken into account without performing an actual displacement of the boundary surfaces. The computation grid can, therefore, remain fixed. It eliminates the need for constant remeshing associated with a truly dynamic simulation involving boundary surface motion. This reduces the computing time significantly. The MRF model is particularly attractive for problems involving moving components that do not perform the pure translational or rotational motion, as in the case of ECB.
The MRF model represents an approximation. The dynamic simulation with actual displacement of the boundary surfaces is theoretically more accurate, at least with sufficiently good grid refinement and the use of very small time steps. However, even with dynamic simulation, constant remeshing implies numerical errors, and in this case, the solution only becomes approximately stationary after a longer transient phase. The computing capacities required for the dynamic simulation and especially the computing time exceed the possibilities within the scope of this project many times over. It was, therefore, decided to use the MRF approximation model.

3. Results and Discussion

Three-dimensional simulations were performed on the two designs of ECB shown in Figure 1a,b. The parameters that were varied in the simulation to optimize power output were:
  • The immersion angle α;
  • The number of blades n;
  • The width of the blades b;
  • The inflow velocity;
  • The band velocity v Band .
The definition of the parameters is illustrated in Figure 3. The selected simulation area is shown in Figure 5a,b. The immersed blades are always numbered from the inflow side. The numbering for the initial variant is shown in Figure 5b as an example. The numbering here is different from Figure 3 and is more intuitive for showing the results.

3.1. Simulation of Open-Chain ECB

3.1.1. Simulation of an Initial Variant

The results of an initial variant of the open-chain model for an inflow velocity of 2 m/s are given below. Figure 6a shows the total force in band direction and Figure 6b shows the total mechanical power.
For this case, the theoretically maximum possible power according to Betz’s law is 4668 W. The maximum power achieved in the simulation is 934 W at a band velocity of 0.35 m/s. That is 20.0% of the power according to Betz’s law.
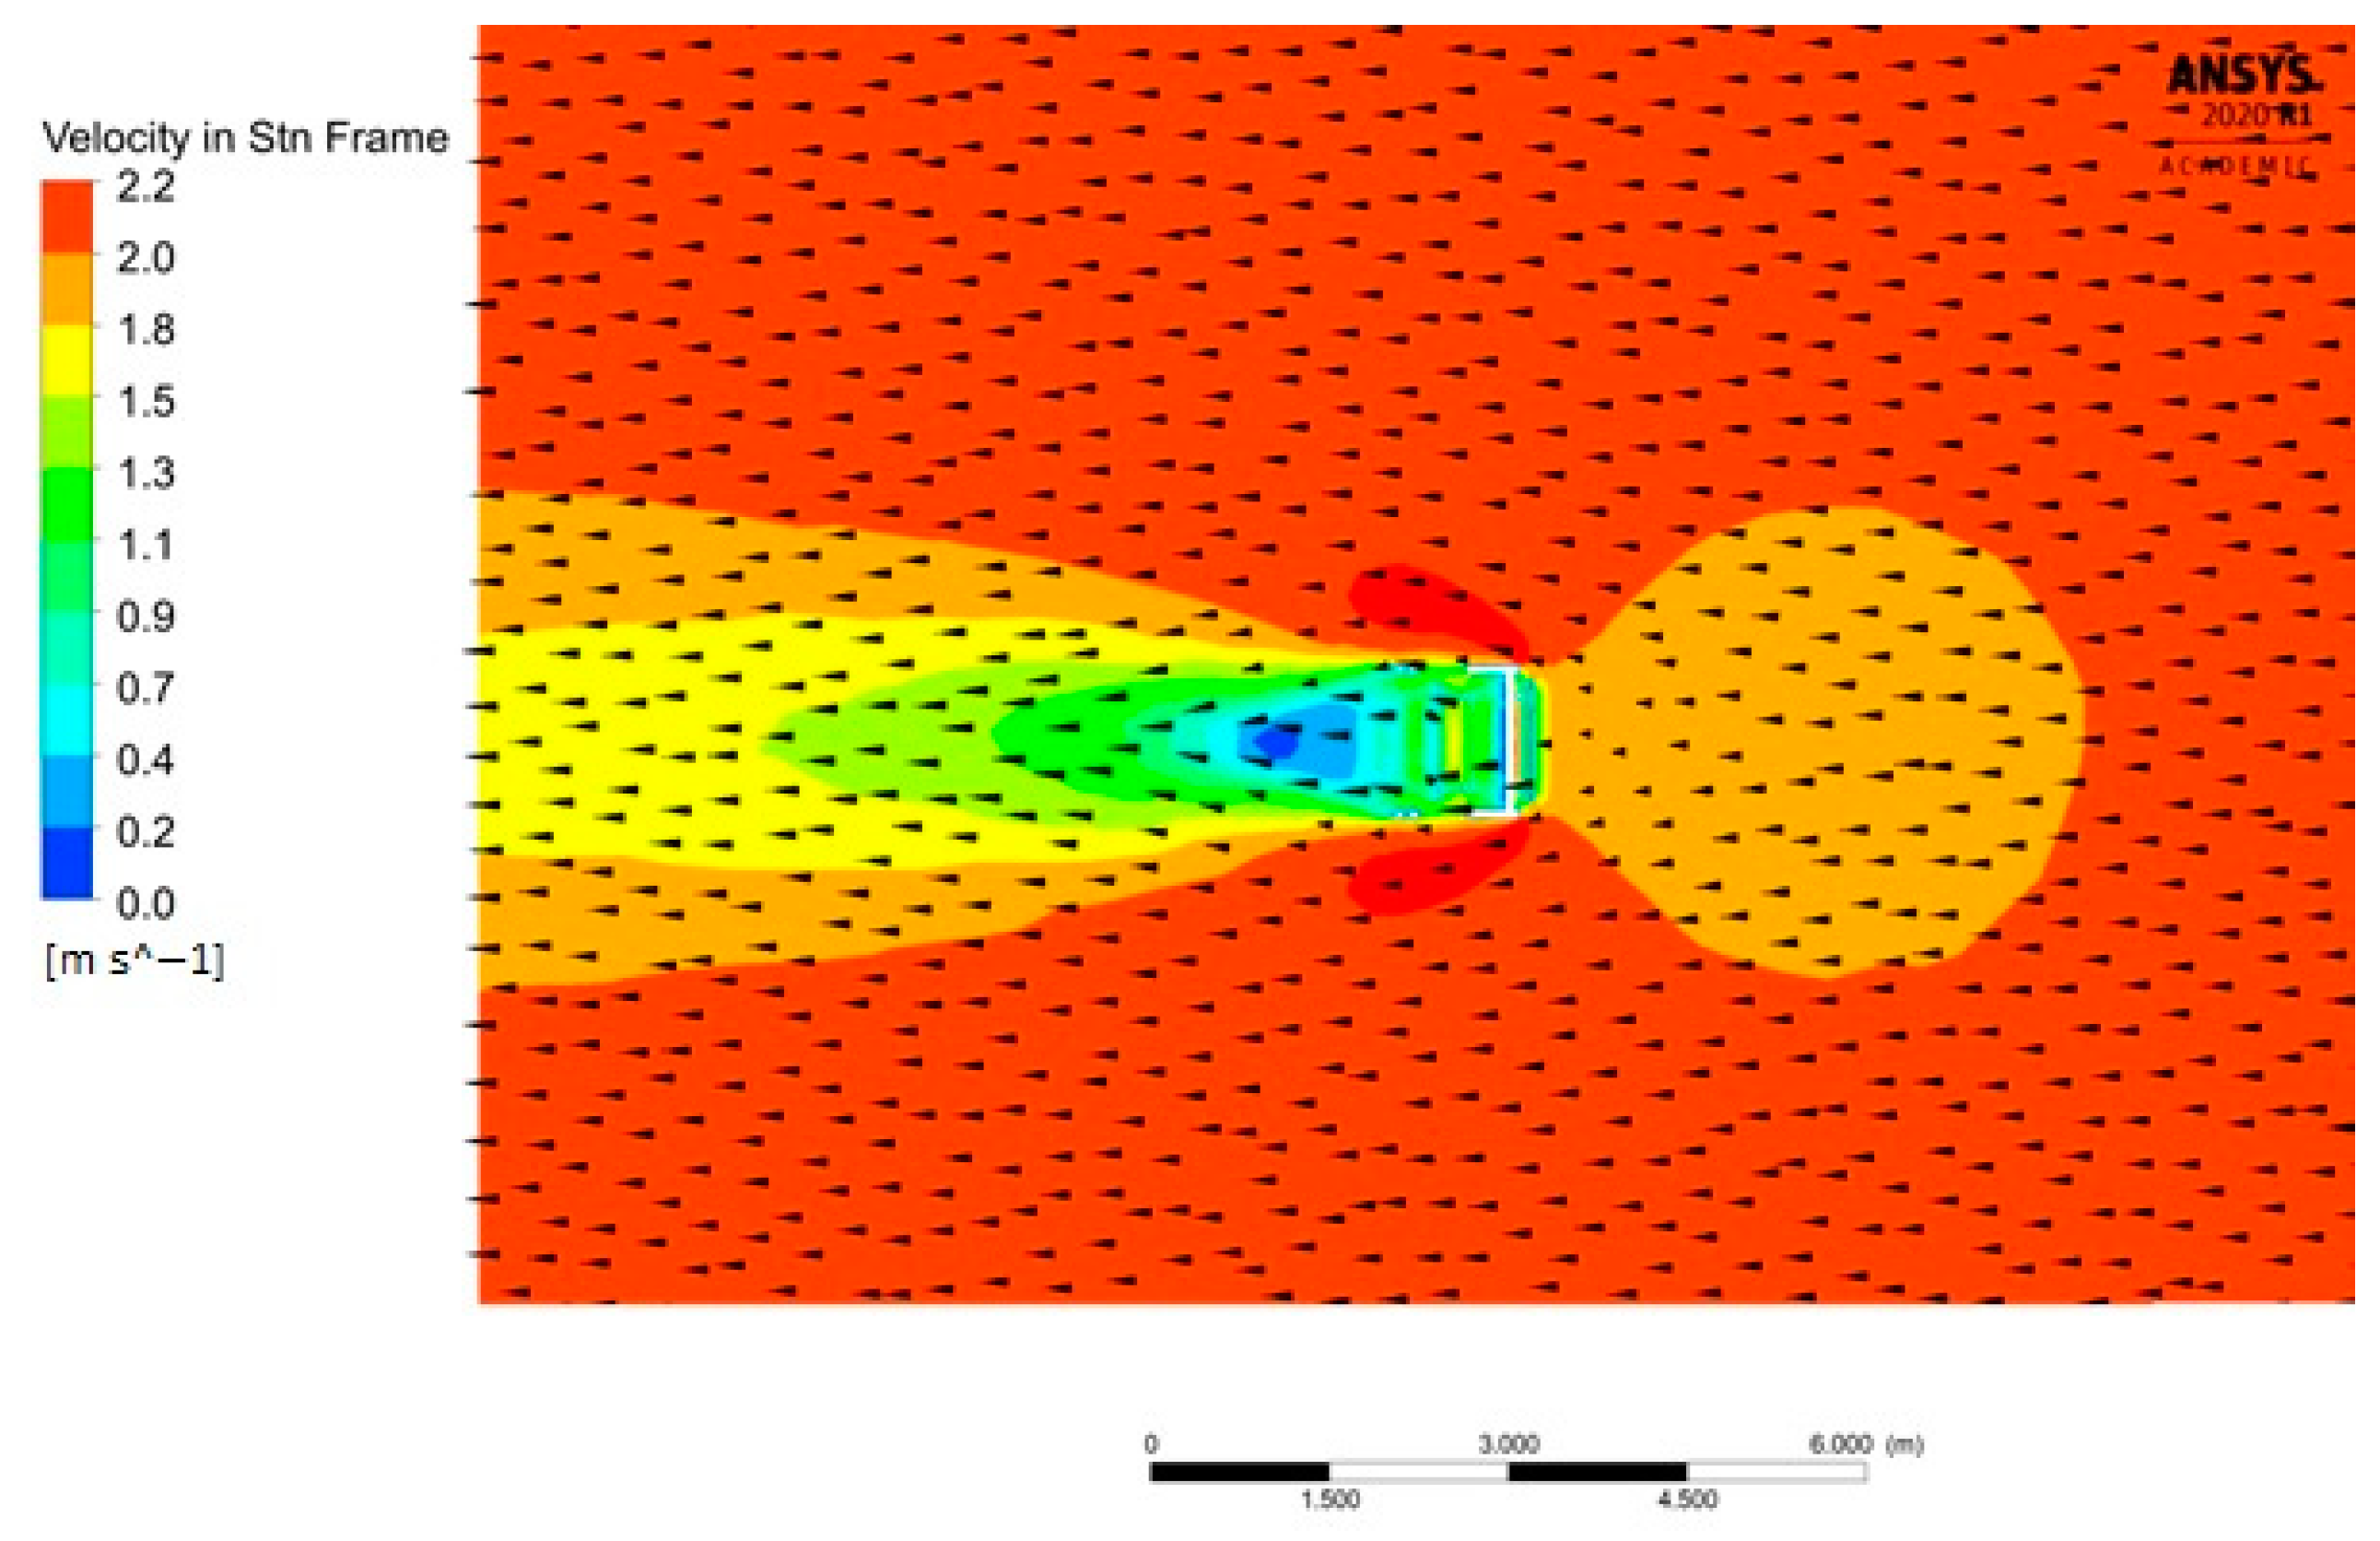
The following are the results of the case taken as an example. In the following sections, the simulation results will not be shown for each case but the final mechanical output will be tabulated and compared. The results for the case where the inflow velocity = 2 m/s, n = 25, α = 45°, b = 16 cm and v Band = 0.3 m/s are given in Figure 7, Figure 8, Figure 9 and Figure 10.

3.1.2. Variation of the Number of Blades and the Inflow Velocity

In this section, we consider a variation of inflow velocity and number of blades for the Open-Chain ECB. The results are summarized in Table 2 below.
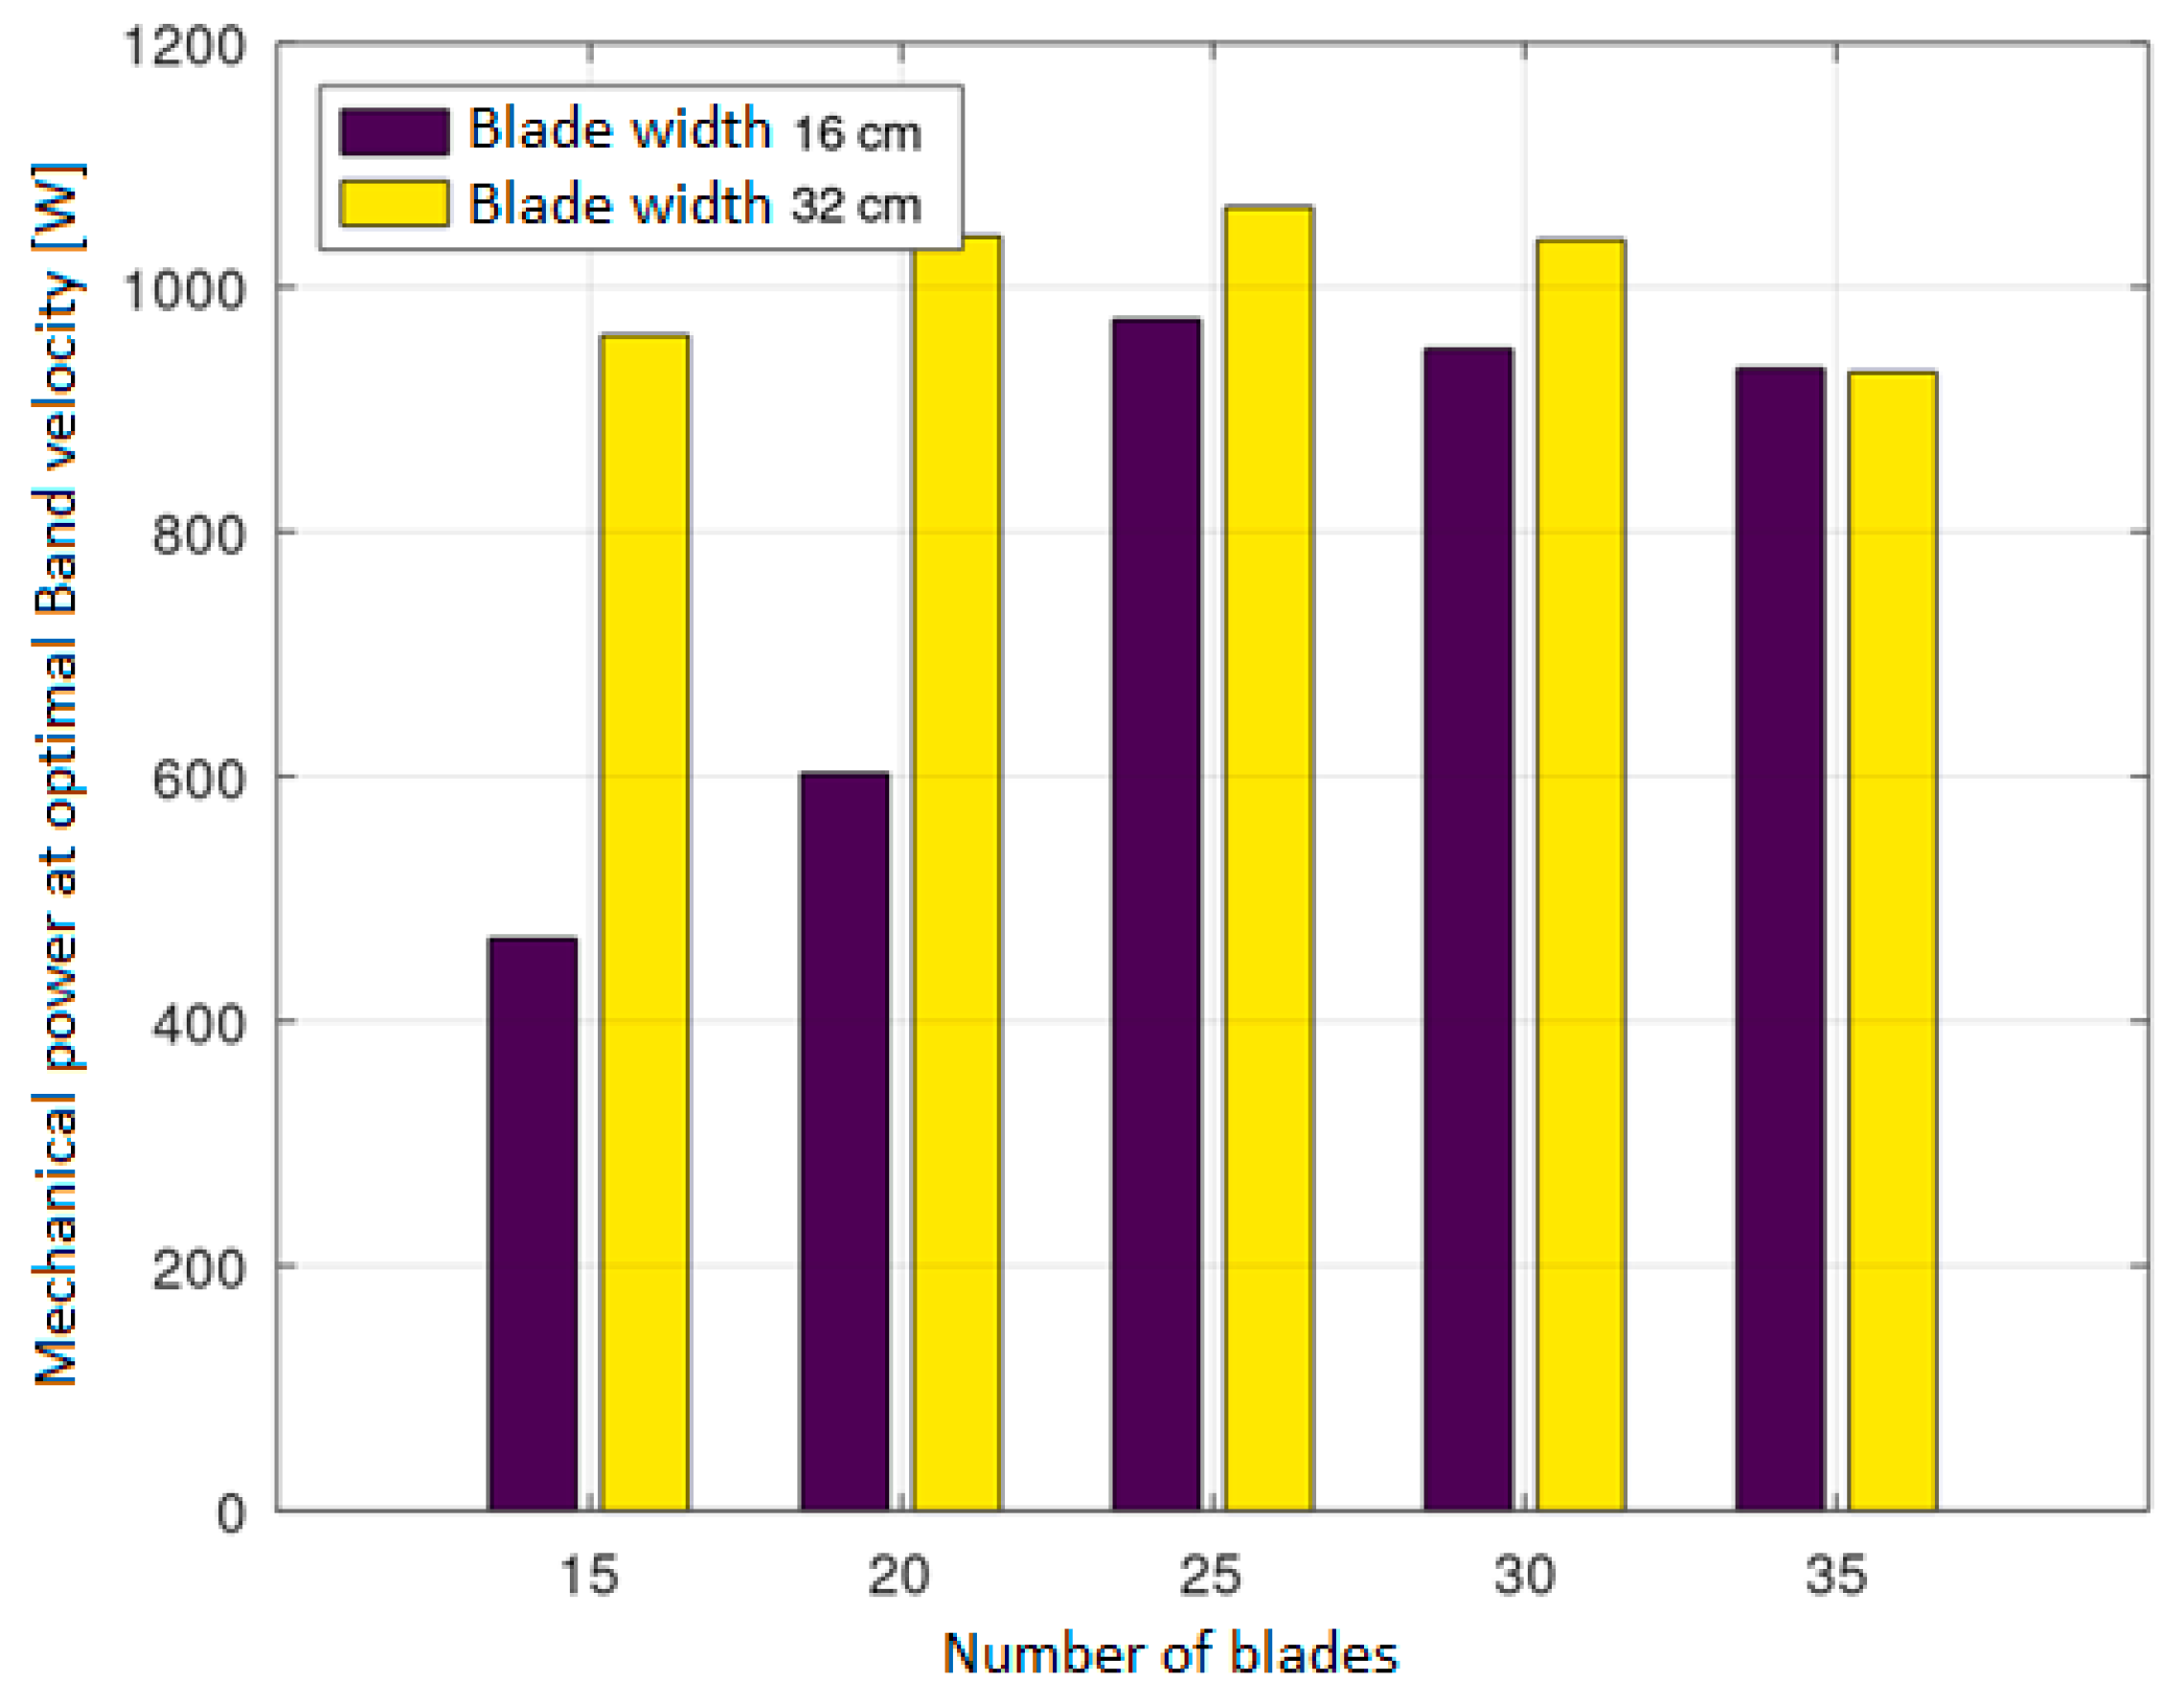
With an inflow velocity of 1.5 m/s, the cases with 25 and 30 blades have the highest power at 400 W each. With an inflow of 2 m/s, the case with 25 blades has the highest power at 974 W. For cases with less than 25 blades, the performance drops significantly. A maximum of 21% of the Betz power is achieved, with the value being less for cases with 15 and 20 blades. Theoretically, the power is scaled with the third power of the inflow velocity, i.e., the power at 2 m/s inflow should be about (2/1.5)³ = 2.37 times as high as the power at 1.5 m/s inflow. This scaling is also observed in the simulation. This is reflected in the almost identical efficiency with regard to the Betz power with the same number of blades. Figure 11 shows the difference in mechanical power for all the cases above.

3.1.3. Variation of the Angle of Immersion

In this section, a variation of the angle of immersion is examined. The results are summarized in Table 3 below.
Decreasing the angle of immersion results in a significant drop in the power output. If possible, an angle of immersion of 45° should be selected. Only in the case of low water levels should the angle of immersion be reduced.

3.1.4. Variation of the Width of the Blade and the Number of blades

In this section, the width of the blade, originally 16 cm, is doubled to 32 cm and examined.
It is clear from the above results shown in Table 4 and Figure 12, that by widening the blades, higher performance can be achieved. The variant with 25 blades is ideal for both a blade width of 16 cm and a blade width of 32 cm. With a blade width of 32 cm, the variant with only 15 blades still achieves quite a high performance.

3.1.5. Variation of the Grid Size and the Turbulence Model

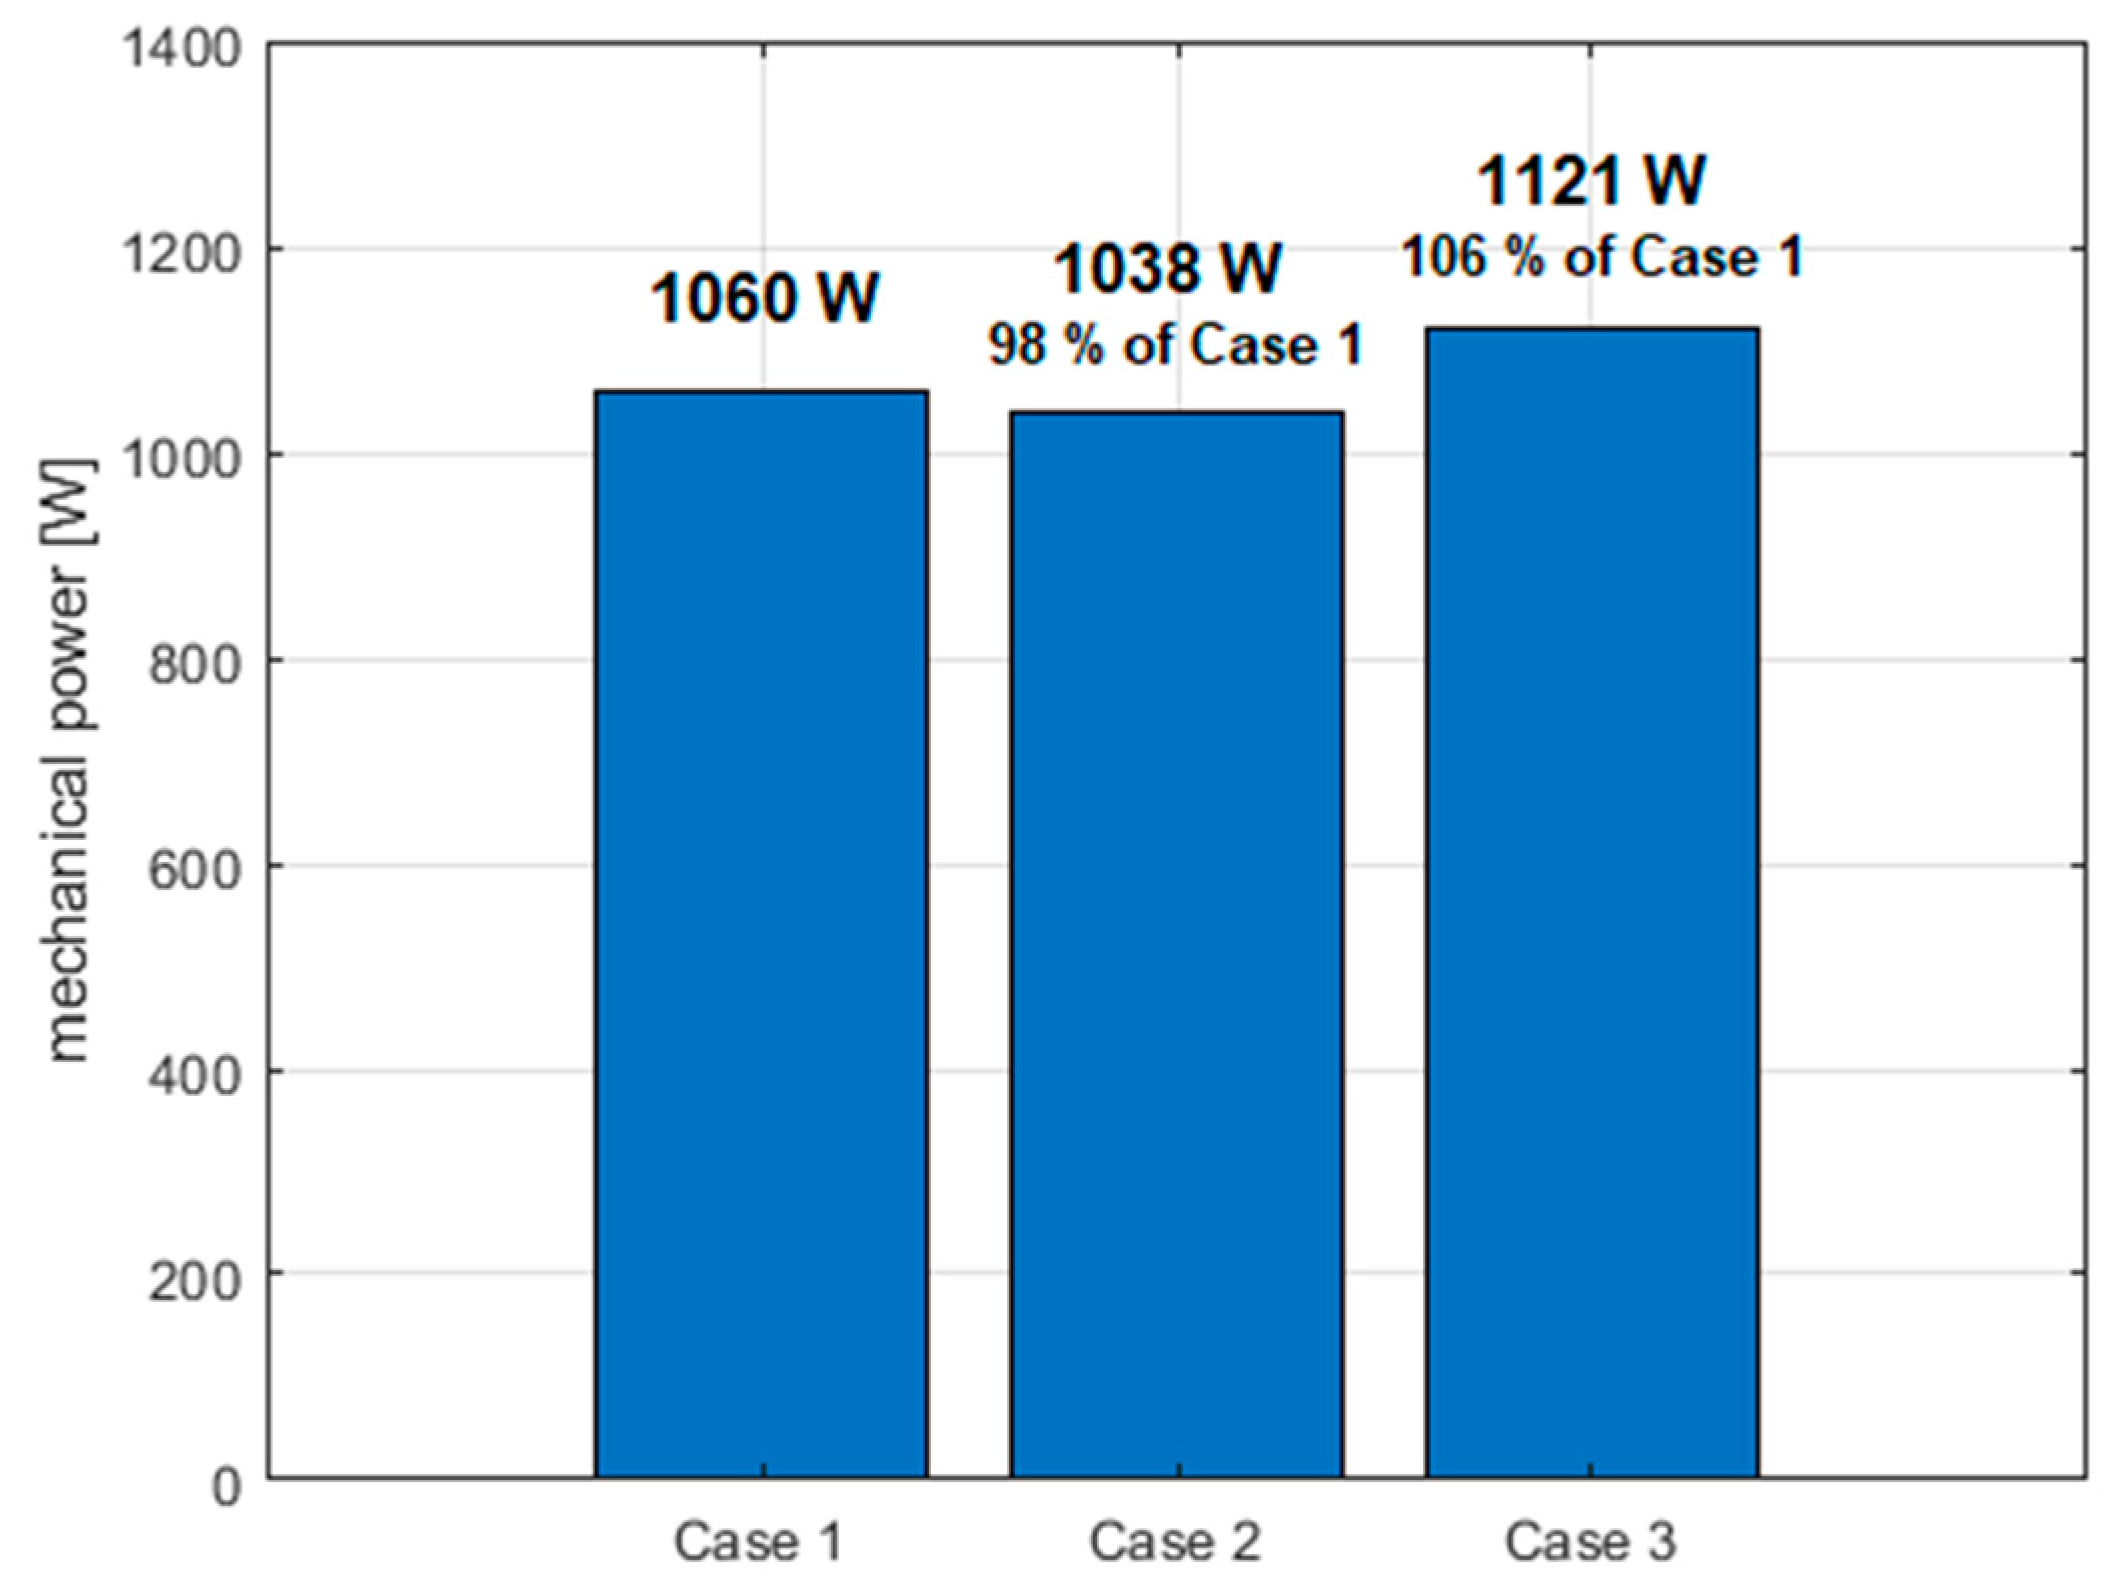
In computational fluid dynamics, the choice of grid size and turbulence model can have a significant impact on the accuracy and computational cost of simulations. In this section, the influence of grid size and turbulence model on the mechanical power output of the Open-Chain ECB was investigated. For the investigation, an example of the Open-Chain ECB with 2 m/s inflow velocity, 0.3 m/s band velocity, 45° immersion angle, 25 blades, and a 32 cm blade width was considered.
Simulations were performed with three different combinations of grid size and turbulence model:
  • Case 1: Grid size of 10 mm at the blades, using the k-ω-SST turbulence model, as in the previous simulations [28].
  • Case 2: Grid size of 10 mm at the blades, using the realizable k-ε turbulence model [31] with enhanced wall treatment (EWT-ε) [32].
  • Case 3: Grid size of 5 mm at the blades, using the k-ω-SST turbulence model.
Case 2 involved a change in the turbulence model, whereas in Case 3 the grid size was changed. It is worth noting that both the k-ω-SST and realizable k-ε turbulence models are recommended for a wide range of flow problems in the literature [33]. The grid statistics for Cases 1 and 2 are identical, with 1.08 million cells in the simulation domain. However, for Case 3, the finer grid size results in a higher number of cells, with 3.97 million cells in the simulation domain.
As demonstrated in Figure 13, both turbulence models studied give very similar results. The realizable k-ε model with enhanced wall treatment produced slightly less mechanical power, with a decrease of 2% compared to the k-ω-SST model. Therefore, the realizable k-ε model with enhanced wall treatment can be considered a viable alternative to the k-ω-SST model for simulating the flow around an Open-Chain ECB. However, the finer grid size used in Case 3 led to a slight increase in mechanical power output of approximately 6%. Despite this difference, the deviation was very moderate, and the coarser grid sizes used in Cases 1 and 2 could still be considered sufficient because the investigation involved many different cases with varying parameters.

3.2. Simulation of Closed-Band ECB

3.2.1. Variation of the Inflow Velocity, Angle of Immersion and the Blade Width

For the design of the Closed-Band ECB, the inflow velocity, the angle of immersion and the blade width are varied. The results are summarized in Table 5.
The theoretical scaling of the power with the third power of the inflow speed is also reproduced very well in this simulation. The performance at a 45° angle of immersion is significantly higher than at 30°. The widening of the blades to 32 cm brought a significant increase in power output.

3.2.2. Variation of the Number of Blades and the Blade Width

In this section, the number of blades of the Closed-Band ECB is varied with the blade width. The results are summarized in Table 6.
Maximum power is achieved with 30 wide blades. Even with just 25 wide blades, the performance is only slightly lower.

3.3. Validation of the Numerical Results

Verifying CFD results without experimental data can be challenging as experimental data is often considered the gold standard for validating CFD simulations. However, there are several methods that can be used to help verify CFD results even in the absence of experimental data. Some of the possible approaches are: Grid Independence Study (Section 3.1.5), Sensitivity analysis, Benchmarking, and Physical understanding.
Considering the optimization method used for TIGRIS-27 H turbine [6], the power generated by the turbine is scaled to the third power of inflow velocity as shown in Equation (3). The power generated at 2 m/s inflow velocity is approximately (2/1.5)3 times the power generated at 1.5 m/s inflow velocity. This is true for both the optimization method and the CFD simulations and is shown in Table 7. Similarly, two cases of the ECB are also shown in Table 7, case 1 being an Open-Chain ECB with a 45° angle of immersion, 25 blades, and a 16 cm blade width, and case 2 is a Closed-Band ECB with a 45° angle of immersion 35 blades, and a 32 cm blade width. It is clear from the results that the power generated in the CFD simulations for an inflow velocity of 2 m/s in both cases of the ECB is approximately equal to (2/1.5)3 times the power generated at 1.5 m/s inflow velocity. Similar results can also be found in the power generated by the Water current turbine from Thropton Energy Services (UK) [22] and the Smart turbine from Smart Hydro Power [24]. Experimental data on the ECB is not available since the results of the simulations form the basis for the decision-making processes in the selection of the ECB. Since the ECB has a unique design it cannot be directly compared with any similar designs and has to be compared with slightly bigger hydrokinetic turbines like the TIGRIS-27 H which also explains the difference in the power generated between the two as the turbine has a diameter of 3 m [6].

4. Conclusions

Numerical simulations were performed on the two designs of the ECB by varying different parameters to optimize the performance. The results of the simulation are categorized into four favorable variants, which are highlighted in the tables with the power written in red color:
  • The first variant was the best-case scenario, where a maximum mechanical power of 1066 W was reached for the case with
    • Open-Chain ECB;
    • 25 blades;
    • 32 cm blade width;
    • 45° angle of immersion;
    • 2 m/s inflow velocity.
Other cases with 20 and 30 blades also reached a maximum of 1042 W and 1039 W, respectively. With the increase in the number of blades, the full force of the water hitting the surface area of the blades is reduced by the preceding blade and this causes a decrease in the power output. Similarly, with the decrease in the number of blades, there is a decrease in the surface area of blades causing the loss of power. The optimum number of blades lies between 20 and 30.
2.
The second variant is the case of an Open-Chain ECB with 25 blades, a 45° angle of immersion and a 16 cm blade width, where a maximum mechanical power of 974 W was reached. For a blade width of 16 cm, fewer number of blades are not favorable.
3.
The third variant is also an Open-Chain ECB with 15 blades, a 45° angle of immersion, and a 32 cm blade width, where a power of 961 W was reached. The number of blades used in this variant is quite less compared to the other variants.
4.
The final variant belongs to the Closed-Band ECB with 30 blades, a 45° angle of immersion, and a 32 cm blade width, where the mechanical power reached 1007 W. The case with 25 blades reached a power of 960 W. In the Closed-Band ECB, only a blade width of 32 cm is favorable.
Reducing the angle of immersion decreases the flow area and since the power is directly proportional to the area of flow as shown in Equation (3), this has a negative impact on the power generated. However, this measure might be necessary for regions where the water level fluctuates. Since the ECB is compact and the angle of immersion can be reduced, it has an advantage over existing hydrokinetic turbines in regions where the depth of water fluctuates often. The Closed-Band ECB seems to have an advantage over the Open-Chain ECB when the angle of immersion is reduced.
From the results of the Energy Conveyor Belt project, we can conclude that a single ECB alone will not be sufficient for any practical application. Further research has to be undertaken into a cascading system to increase the overall power output. The design of the blade could be another factor that can be varied which will affect the final power output. Once the desired power is reached, it is planned to apply the ECB technology to supply electricity for a hydrogen-generating platform in a future project.

Author Contributions

Conceptualization, W.H., M.S. and T.B.; methodology, M.D.S., W.H. and M.S.; software, M.D.S. and W.H.; validation, W.H. and T.B.; formal analysis, M.D.S., W.H. and M.S.; investigation, M.D.S. and W.H; resources, M.S. and T.B; data curation, M.D.S. and W.H.; writing—original draft preparation, M.D.S.; writing—review and editing, W.H., M.S., and T.B.; visualization, M.D.S., W.H., M.S. and T.B.; supervision, W.H. and T.B.; project administration, M.S. and T.B.; funding acquisition, T.B. All authors have read and agreed to the published version of the manuscript.

Funding

This research was funded by Investitionsbank Sachsen-Anhalt, grant number 2004/00025.

Data Availability Statement

Data is contained within the article.

Acknowledgments

The authors would like to thank Frank Mewes, Mostafa Ashkavand, Jari Silvan Roßberg and Stephan Mertens for their valuable contributions to the project.

Conflicts of Interest

The authors declare no conflict of interest. The funders had no role in the design of the study; in the collection, analyses, or interpretation of data; in the writing of the manuscript; or in the decision to publish the results.

Abbreviations and Notations

Latin symbolsUnitMeaning
Am2Area
amDistance between upper roller axis and water surface
bmWidth of the blade
dmDistance between two blades
ei-Unit vector giving direction of the band speed at blade Si
ekJKinetic energy
FNForce
FBandNTotal force in band direction
FiNForce acting on blade Si
PWMechanical power
P flowWPower generated by the stream
Pi-Base of the blade Si
PmaxWMaximum mechanical power
rmRadius of the two rollers
Si-Blade number i
S1-First blade
vm/sFluid velocity
vBandm/sBand velocity
v1m/sInflow velocity
Greek symbolsUnitMeaning
αdegAngle of immersion
ρkg/m3Density
AbbreviationsMeaning
CFDComputational Fluid Dynamics
ECBEnergy Conveyor Belt
MRFMultiple Reference Frames

References

  1. Laws, N.D.; Epps, B.P. Hydrokinetic energy conversion: Technology, research, and outlook. Renew. Sustain. Energy Rev. 2016, 57, 3. [Google Scholar] [CrossRef] [Green Version]
  2. Güney, M.; Kaygusuz, K. Hydrokinetic energy conversion systems: A technology status review. Renew. Sustain. Energy Rev. 2010, 14, 2996–3004. [Google Scholar] [CrossRef]
  3. Ozturk, M.; Bezir, N.C.; Ozek, N. Hydropower–water and renewable energy in Turkey: Sources and policy. Renew. Sustain. Energy Rev. 2009, 13, 605–615. [Google Scholar] [CrossRef]
  4. Paish, O. Small hydro power: Technology and current status. Renew. Sustain. Energy Rev. 2002, 6, 537–556. [Google Scholar] [CrossRef]
  5. Khan, M.J.; Iqbal, M.T.; Quaicoe, J.E. River current energy conversion systems: Progress, prospects and challenges. Renew. Sustain. Energy Rev. 2008, 12, 2177–2193. [Google Scholar] [CrossRef]
  6. Muratoglu, A.; Yuce, M.I. Design of a River Hydrokinetic Turbine Using Optimization and CFD Simulations. J. Energy Eng. 2017, 143, 04017009. [Google Scholar] [CrossRef]
  7. Lago, L.; Ponta, F.; Chen, L. Advances and trends in hydrokinetic turbine systems. Energy Sustain. Dev. 2010, 14, 287–296. [Google Scholar] [CrossRef]
  8. Kumar, D.; Sarkar, S. A review on the technology, performance, design optimization, reliability, tech-no-economics and environmental impacts of hydrokinetic energy conversion systems. Renew. Sustain. Energy Rev. 2016, 58, 796–813. [Google Scholar] [CrossRef]
  9. Contreras, L.T.; Lopez, O.D.; Lain, S. Computational fluid dynamics modelling and simulation of an inclined hori-zontal axis hydrokinetic turbine. Energies 2018, 11, 3151. [Google Scholar] [CrossRef] [Green Version]
  10. Balat, M. Hydropower Systems and Hydropower Potential in the European Union Countries. Energy Sources Part A: Recover. Util. Environ. Eff. 2006, 28, 965–978. [Google Scholar] [CrossRef]
  11. Kusakana, K.; Vermaak, H.J. Hydrokinetic power generation for rural electricity supply: Case of South Africa. Renew. Energy 2013, 55, 467–473. [Google Scholar] [CrossRef]
  12. Guner, F.; Zenk, H. Experimental, Numerical and Application Analysis of Hydrokinetic Turbine Performance with Fixed Rotating Blades. Energies 2020, 13, 766. [Google Scholar] [CrossRef] [Green Version]
  13. Ben Elghali, S.; Benbouzid, M.; Charpentier, J. Marine Tidal Current Electric Power Generation Technology: State of the Art and Current Status. IET Renew. Power Gener. 2007, 2, 1407–1412. [Google Scholar] [CrossRef] [Green Version]
  14. Gotelli, C.; Musa, M.; Guala, M.; Escauriaza, C. Experimental and Numerical Investigation of Wake Interactions of Marine Hydrokinetic Turbines. Energies 2019, 12, 3188. [Google Scholar] [CrossRef] [Green Version]
  15. Barbarić, M.; Guzović, Z. Investigation of the possibilities to improve hydrodynamic performances of mi-cro-hydrokinetic turbines. Energies 2020, 13, 4560. [Google Scholar] [CrossRef]
  16. Yuce, M.I.; Muratoglu, A. Hydrokinetic energy conversion systems: A technology status review. Renew. Sustain. Energy Rev. 2015, 43, 72–82. [Google Scholar] [CrossRef]
  17. Batten, W.; Bahaj, A.; Molland, A.; Chaplin, J. Hydrodynamics of marine current turbines. Renew. Energy 2006, 31, 249–256. [Google Scholar] [CrossRef] [Green Version]
  18. Bahaj, A.; Myers, L. Fundamentals applicable to the utilisation of marine current turbines for energy production. Renew. Energy 2003, 28, 2205–2211. [Google Scholar] [CrossRef]
  19. Twidell, J. Renewable Energy Resources; Routledge: New York, NY, USA, 2021. [Google Scholar]
  20. Vermaak, H.J.; Kusakana, K.; Koko, S.P. Status of micro-hydrokinetic river technology in rural applications: A review of literature. Renew. Sustain. Energy Rev. 2014, 29, 625–633. [Google Scholar] [CrossRef]
  21. Awandu, W.; Ruff, R.; Wiesemann, J.-U.; Lehmann, B. Status of Micro-Hydrokinetic River Technology Turbines Application for Rural Electrification in Africa. Energies 2022, 15, 9004. [Google Scholar] [CrossRef]
  22. Verdant Power. Technology Evaluation of Existing and Emerging Technologies; Verdant Power Canada ULC: St. Catharines, ON, Canada, 2006; Volume 3502, pp. 1–48. [Google Scholar]
  23. Netzwerk Technologiekompetenz Fluss-Strom. Available online: http://www.flussstrom.de/ (accessed on 17 February 2023).
  24. Smart Hydro Power GmbH Garatshausen. Available online: https://www.smart-hydro.de/renewable-energy-systems/hydrokinetic-turbines-river-canal/ (accessed on 17 February 2023).
  25. Zdankus, N.; Punys, P.; Zdankus, T. Conversion of lowland river flow kinetic energy. Renew. Sustain. Energy Rev. 2014, 38, 121–130. [Google Scholar] [CrossRef]
  26. Kumar, A.; Saini, R. Performance parameters of Savonius type hydrokinetic turbine—A Review. Renew. Sustain. Energy Rev. 2016, 64, 289–310. [Google Scholar] [CrossRef]
  27. Betz, A. Das maximum der theoretisch moglichen Auswendung des Windes durch Windmotoren. Z. Fur Gesamte Turbinewesen 1920, 26, 307–309. (In German) [Google Scholar]
  28. Menter, F.R. Two-equation eddy-viscosity turbulence models for engineering applications. AIAA J. 1994, 32, 1598–1605. [Google Scholar] [CrossRef] [Green Version]
  29. Launder, B.E.; Spalding, D.B. The Numerical Computation of Turbulent Flows. In Numerical Prediction of Flow, Heat Transfer, Turbulence and Combustion; Pergamon: Oxford, UK, 1983; pp. 96–116. [Google Scholar]
  30. Luo, J.Y.; Gosman, A.D. Prediction of Impeller-Induced Flow in Mixing Vessels Using Multiple Frames of Reference; Institute of Chemical Engineers Symposium: London, UK, 1994. [Google Scholar]
  31. Shih, T.-H.; Liou, W.W.; Shabbir, A.; Yang, Z.; Zhu, J. A new k-ϵ eddy viscosity model for high reynolds number turbulent flows. Comput. Fluids 1995, 24, 227–238. [Google Scholar] [CrossRef]
  32. Fluent, A.N.S.Y.S. Ansys Fluent. R1 Theory Guide; Section 4.18.5. Enhanced Wall Treatment ε-Equation (EWT-ε); 2022. [Google Scholar]
  33. Fluent, A.N.S.Y.S. Ansys Fluent. R1 User‘s Guide; Section 13.2.1. Reynolds Averaged Navier-Stokes (RANS) Turbulence Models; 2022. [Google Scholar]
Figure 1. (a) Open-Chain ECB with 35 blades; (b) Closed-Band ECB with 35 blades.
Energies 16 02188 g001
Figure 2. Fluid flow in the area of the ECB.
Energies 16 02188 g002
Figure 3. ECB with dimensions for the case where n = 35, α = 30°, L = 3 m, r = 175 mm, and b = 160 mm.
Energies 16 02188 g003
Figure 4. (a) Complete mesh including domain; (b) Refined mesh along the model.
Energies 16 02188 g004
Figure 5. (a) Top view of simulation area; (b) Side view of simulation area and numbering of the blades.
Energies 16 02188 g005
Figure 6. (a) Force in band direction; (b) Mechanical power.
Energies 16 02188 g006
Figure 7. Force acting on each blade in the band direction.
Energies 16 02188 g007
Figure 8. Side view of the velocity profile.
Energies 16 02188 g008
Figure 9. Top view of the velocity profile, 1 m under the top surface.
Energies 16 02188 g009
Figure 10. Side view of the pressure profile.
Energies 16 02188 g010
Figure 11. Mechanical power for Result summary I.
Energies 16 02188 g011
Figure 12. Mechanical power for Result summary III.
Energies 16 02188 g012
Figure 13. Mechanical power comparison of three simulations with different grid size and turbulence models.
Energies 16 02188 g013
Table 1. Technical specifications of some hydrokinetic turbines.
Device NameManufacturerTurbine TypeMin/Max SpeedPower Output
StreamSeabell Int. Co., Ltd. (Tokyo, Japan)Dual, cross-axis(0.6 m/s) to no limit0.5–10 kW
EnCurrent hydro turbineNew Energy Corporation Inc. (Calgary, AB, Canada)Cross-axisMax. 3 m/s5–10 kW
Free-stream Darrieus turbineWater Alternative Hydro Solutions Ltd. (Toronto, OT, Canada)Cross-axis(0.5 m/s)/depends on diameter2–3 kW
Water current turbine [22]Thropton Energy Services (UK)Axis flow propeller(0.6 m/s)/depends on diameterUp to 2 kW at 240 V
Tigris-27 H [6]-Horizontal axisMax. 2.7 m/s5–30 kW
River Rider [23]Technologiekompetenz Fluss-StromCross axisDepends on flow conditions0.8–23 kW
Smart Turbine [24]Smart Hydro PowerHorizontal axisMax 2.8 m/s5 kW
Table 2. Result summary I for Open-Chain ECB (red color is one of the optimum variants which is mentioned later in the conclusions).
DesignOpen Chain
Inflow velocity, v 1 1.5 m/s1.5 m/s1.5 m/s1.5 m/s1.5 m/s2 m/s2 m/s2 m/s2 m/s2 m/s
Angle of immersion, α 45°45°45°45°45°45°45°45°45°45°
Number of blades, n 15202530351520253035
Width of the blade, b 16 cm16 cm16 cm16 cm16 cm16 cm16 cm16 cm16 cm16 cm
Axis of top roller above water surface, a 50 cm50 cm50 cm50 cm50 cm50 cm50 cm50 cm50 cm50 cm
Area of flow, A 1.97 m²1.97 m²1.97 m²1.97 m²1.97 m²1.97 m²1.97 m²1.97 m²1.97 m²1.97 m²
Maximum attainable power according to Betz, P max 1969 W1969 W1969 W1969 W1969 W4668 W4668 W4668 W4668 W4668 W
Optimal Band velocity, v Band 0.3 m/s0.27 m/s0.31 m/s0.29 m/s0.26 m/s0.38 m/s0.33 m/s0.41 m/s0.37 m/s0.34 m/s
Mechanical power at optimal Band velocity, P 200 W251 W400 W400 W394 W468 W603 W974 W950 W934 W
Efficiency with respect to Betz power, P / P max 0.100.130.200.200.200.100.130.210.200.20
Table 3. Result summary II for Open-Chain ECB.
DesignOpen Chain
Inflow velocity, v 1 2 m/s2 m/s2 m/s
Angle of immersion, α 15°30°45°
Number of blades, n 353535
Width of the blade, b 16 cm16 cm16 cm
Axis of top roller above water surface, a 20 cm50 cm50 cm
Area of flow, A 1.92 m²1.35 m²1.97 m²
Maximum attainable power according to Betz, P max 2181 W3195 W4668 W
Optimal Band velocity,   v Band 0.40 m/s0.48 m/s0.35 m/s
Mechanical power at optimal Band velocity, P 214 W403 W934 W
Efficiency with respect to Betz power, P / P max 0.100.130.20
Table 4. Result summary III for Open-Chain ECB (red color is one of the optimum variants which is mentioned later in the conclusions).
DesignOpen Chain
Inflow velocity, v 1 2 m/s2 m/s2 m/s2 m/s2 m/s2 m/s2 m/s2 m/s2 m/s2 m/s
Angle of immersion α 45°45°45°45°45°45°45°45°45°45°
Number of blades, n 15202530351520253035
Width of the blade, b 16 cm16 cm16 cm16 cm16 cm32 cm32 cm32 cm32 cm32 cm
Axis of top roller above water surface, a 50 cm50 cm50 cm50 cm50 cm50 cm50 cm50 cm50 cm50 cm
Area of flow A 1.97 m²1.97 m²1.97 m²1.97 m²1.97 m²2.13m²2.13 m²2.13 m²2.13 m²2.13 m²
Maximum attainable power according to Betz, P max 4668 W4668 W4668 W4668 W4668 W5049 W5049 W5049 W5049 W5049 W
Optimal Band velocity,   v Band 0.38 m/s0.33 m/s0.41 m/s0.37 m/s0.34 m/s0.35 m/s0.33 m/s0.32 m/s0.33 m/s0.32 m/s
Mechanical power at optimal Band velocity, P 468 W603 W974 W950 W934 W961 W1042 W1066 W1039 W931 W
Efficiency with respect to Betz power, P / P max 0.100.130.210.200.200.190.210.210.210.18
Table 5. Result summary I for Closed-Band ECB (red color is one of the optimum variants which is mentioned later in the conclusions).
DesignClosed Band
Inflow velocity, v 1 1.5 m/s1.5 m/s1.5 m/s1.5 m/s1.5 m/s2 m/s2 m/s2 m/s2 m/s2 m/s
Angle of immersion, α 15°30°45°30°45°15°30°45°30°45°
Number of blades, n 35353535353535353535
Width of the blade, b 16 cm16 cm16 cm32 cm32 cm16 cm16 cm16 cm32 cm32 cm
Axis of top roller above water surface, a 20 cm38 cm50 cm46.5 cm56 cm20 cm38 cm50 cm46.5 cm56 cm
Area of flow, A 0.91 m²1.46 m²1.97 m²1.53 m²2.06 m²0.91 m²1.46 m²1.97 m²1.53 m²2.06 m²
Maximum attainable power according to Betz, P max 914 W1458 W1959 W1533 W2059 W2166 W3456 W4644 W3634 W4881 W
Optimal Band velocity,   v Band 0.6 m/s0.5 m/s0.5 m/s0.4 m/s0.4 m/s0.8 m/s0.6 m/s0.65 m/s0.4 m/s0.4 m/s
Mechanical power at optimal Band velocity, P 151 W272 W299 W244 W385 W347 W662 W739 W607 W905 W
Efficiency with respect to Betz power, P / P max 0.160.190.150.160.190.160.190.160.170.19
Table 6. Result summary II for Closed-Band ECB (red color is one of the optimum variants which is mentioned later in the conclusions).
DesignClosed Band
Inflow velocity, v 1 2 m/s2 m/s2 m/s2 m/s2 m/s
Angle of immersion, α 45°45°45°45°45°
Number of blades, n 2535253035
Width of the blade, b 16 cm16 cm32 cm32 cm32 cm
Axis of top roller above water surface, a 50 cm50 cm50 cm50 cm56 cm
Area of flow, A 1.96 m²1.96 m²2.12 m²2.12 m²2.06 m²
Maximum attainable power according to Betz, P max 4644 W4644 W5023 W5023 W4881 W
Optimal Band velocity,   v Band 0.6 m/s0.65 m/s0.6 m/s0.6 m/s0.4 m/s
Mechanical power at optimal Band velocity, P 715 W739 W960 W1007 W905 W
Efficiency with respect to Betz power, P / P max 0.150.160.190.200.19
Table 7. Comparison of the Design/optimization and Simulation results of TIGRIS-27 H turbine and ECB.
TIGRIS-27 H Turbine
ParameterInflow velocity (m/s)
1.52
Design/optimization5.4 kW12.57 kW
CFD simulation5.46 kW12.77 kW
Error (%)1.111.59
ECB
CaseInflow velocity (m/s)
1.52
Case 1400 W974 W
Case 2385 W905 W
Disclaimer/Publisher’s Note: The statements, opinions and data contained in all publications are solely those of the individual author(s) and contributor(s) and not of MDPI and/or the editor(s). MDPI and/or the editor(s) disclaim responsibility for any injury to people or property resulting from any ideas, methods, instructions or products referred to in the content.