Abstract
Based on the consideration of various environmental problems caused by human activities, energy transition solutions are starting to emerge. Power electronics will be central to these transitions. The level of knowledge linking power electronics and sustainability remains very limited today, and the study of the environmental impacts tied to the mass-scale deployment of power electronic systems across all sectors of activity is now essential. This study presents the life cycle assessment of a power electronic inverter capable of delivering a power of 150 kW, operating with an average 450 V DC bus for 15 years with 10,000 operating hours. The main hotspots are investigated to offer recommendations to designers. The most important impact highlighted is the depletion of mineral resources. Manufacturing and use are the two subsections with the highest environmental impact. Manufacturing is dominated by the casing and power module (specifically, the electric contacts, baseplate, and die). These results make it possible to orient an eco-design action with technologies capable of creating an evolution in hotspots. However, they also serve to consider scenarios involving a circular economy by setting up maintenance, recycling, and reuse loops in the inverter, combined with modularity and self-diagnostic functions.
1. Introduction
Power generation, transportation, and industry are the three main sectors producing greenhouse gases across the world (41%, 25%, and 18%, respectively, in 2018) [1]. It is therefore most important to act upon these distinct areas of activity. The reduction in impacts arising from the means of energy production and use of electrical energy requires a near-generalized and mass-scale application of power electronics systems [2,3,4]. These new means of energy management could prove to be “poor solutions” if the issue of the environmental impact of these systems is not incorporated into research.
Power electronics (PE) and electronics have allowed for rapid social development as well as the operations of currently widespread technologies, which is why static PE systems are ubiquitous; the mention of 53 Mt in the Waste Electrical and Electronic Equipment (WEEE) Directive in 2019 provides sobering evidence of this [5]. Moreover, PE is and will remain at the heart of both energy production [6,7] and electric mobility [8,9], constituting an essential link in the ongoing energy transition. However, PE systems are complex, have high technological value, and are composed of a large number of materials [10], some of which are already considered critical. In addition, manufacturing processes require advanced infrastructure, which adds further intrinsic value to the product [11]. Electronic products therefore generate significant environmental impacts, even when compared with larger, more complex systems. One example is the percentage share that electronics have in the mass of a car glider (0.3%) compared with its impact on climate change (17.7%) [12]. For this reason, it is necessary to eco-design and eco-optimize such systems, i.e., by implementing a product design approach that pays special attention to the environmental impacts of a product over its entire life cycle, and is optimized to achieve the maximum possible reduction. However, depending on the system, eco-design data are very limited or, in some cases, nonexistent for PE systems. Hence, we must start with a calculation of environmental impacts. There is a consensus on the life cycle assessment (LCA) technique; it is a multi-criteria method that enables rigorous comparison of various designs due to avoiding the transfer of pollution between the different impacts [13,14].
Few studies in the literature focus on PE while confronting the problems of inventory imprecision, transparency, or results merely presented as Global Warming Potential (GWP CO2eq). For example, a study of an IGBT power module [15] focuses only on climate change. Another study [16] presents three simplified LCAs of electronic products, including a variable-speed drive; however, the results are normalized, and the inventory is not transparent. An LCA of a photovoltaic inverter [17] presents a subdivision of the results that is not relevant for a PE designer and does not present a power module in its inventory because of a different technology. The LCA of a power module [18] has non-transparent input data and normalizes its output results, which makes the study irreplicable. Other LCA studies have been published and/or proposed on systems containing PE; however, these studies rarely explicitly focus on PE systems, which are only considered as part of a subassembly (black box type). For example, in Temporelli et al.’s [19] review of the LCA of an electric car, the focus is essentially on the battery part of the car and does not consider the inverter. Another study [20] presents a review of the LCA of an electric car focusing on the use of resources while other environmental impacts are missing and the inverter part is seen as a black box with an imprecise inventory. The same remark can be made for [21]. Even if a specific inventory of PE were to be introduced, this part tends not to receive any specific focus, simply providing an overall LCA result that does not reveal which subpart, material, or process is the most impactful [12]. A PE designer cannot use existing information in this form to eco-design or eco-optimize the PE. Indeed, the designer needs an accurate and detailed LCA for the purpose of building an eco-design parametric method in PE. As explained above, the hotspots (the most impactful parts) on which to act are not precisely known (eco-design). In addition, the data cannot be extended to other architectures (eco-optimization). The uncertainties are rarely mentioned but are useful not only for the reliability of the results but also in comparative studies. The present study is based on this context.
The aim of this article is to offer an environmental vision of a PE product in relation to its materials, manufacturing processes, use characteristics, and end-of-life, in addition to a precise assessment of which part proves to be the most impactful. Moreover, it presents a life cycle assessment of a PE system—specifically, an inverter—but also, crucially, represents the first step in the eco-design of a PE product. A parametric eco-design method can then be developed with the precise system presented in this article as input. Having a precise model allows one to make modifications with full knowledge of their impacts. It is important to remember that an LCA study is dependent on all the choices that precede the result. All these choices are summarized in Section 2 and Section 3 of this article.
This study is based on a 150 kW reference inverter, with the HybridPACK Drive being in kit form [22]. This inverter is recent, typical, and well documented. The inventory values have been retrieved from several sources, including technical documentation and reverse engineering. When inventory values are missing, they have been extracted from Nordelöf and Alatalo (2017) [23]; a scalable life cycle inventory (LCI) model provides the mass of each inverter component along with the processes.
2. Materials and Methods—LCA
The LCA is defined as a standardized multi-criteria method [24,25] that quantifies the impacts of a “product” from the extraction of its raw materials to its end-of-life disposal, including the distribution and use phases, or “from cradle to grave.” Its objective is to present a global vision of life cycle impacts in order to inform, compare products, or improve a system. This decision-making tool was designed to assist with industrial or public policies.
The LCA is divided into 4 steps, as described in Figure 1: the definition of study objectives and scope; the inventory of material and energy flows associated with the life cycle stages pertaining to the functional unit selected; an assessment of potential impacts from the identified flows; and lastly, the interpretation of results obtained with respect to the initial objectives.
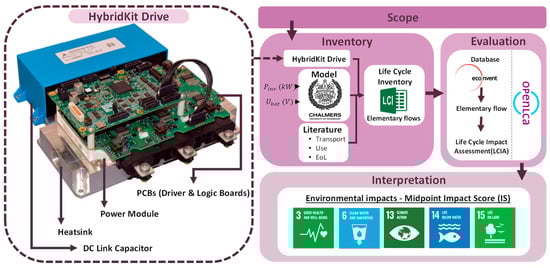
Figure 1.
Principles of the LCA based on the study data. The 4 LCA steps correspond to the 4 highlighted areas.
2.1. First Step: Scope
The functional unit (FU) is a foundational step in any LCA; it is used to rigorously define the framework for the studied system as well as to set the study boundaries, which should be the same as those used to conduct a comparative study. The FU is constructed so as to specify a quantity of product, a unit of operating time (indirectly linked to its quality), and, subsequently, a performance context. The lifetime of PE can be highly variable depending on the application, ranging from 5 years for some inverters used in industry to 30 years for rail transport [26]. For this study, an inventory of traction inverters was prioritized with a 15-year average lifespan for the automobile, thus corresponding to 10,000 h of functional unit operations. In addition, this study assumes the lifetime to be equivalent to the useful life; hence, no replacement during the use period shall be considered.
The FU of our study is defined as follows:
Generate a three-phase AC electrical operating point for a 150 kW load (electric machine) from a 450 V DC power source, based on a lifespan of 15 years, i.e., equivalent to 10,000 h of operation.
The LCA is a multi-criteria tool, and both its impact categories and midpoints were selected according to the product environmental footprint (PEF) method guide [27], as summarized in Table 1 below.

Table 1.
Midpoint impacts and their abbreviations used in this LCA.
2.2. Second Step: Inventory
The inventory step is one of the most time-consuming and sensitive in the LCA process. The goal was to identify all the elementary flows necessary to achieve the studied product, in this case, the power inverter. These flows are defined as the material/energy entering/leaving the system under study that was extracted from/released to the environment without prior adverse human transformation [28]. Such flows are essential and were used to calculate the environmental impacts during Step 3 of the LCA. The overall functioning of our study, in relation to our inventory, is summarized in Figure 1 and explained below.
Environmental impacts are correlated with the corresponding sustainable development goals.
Elementary flows are typically difficult to determine, and only complex flows can be known, i.e., an aggregation of elementary flows, waste, byproducts, processes, etc. Such flows require additional modeling efforts in order to be transformed into elementary flows. Consequently, we relied on a database herein, namely Ecoinvent (Zurich, Switzerland).
This database models human activities or processes by measuring the natural resources extracted from the environment, the emissions released into water, soil, and air, the products demanded by other processes (electricity), and, naturally, the products, co-products, and waste. Ecoinvent V3 is one of the most widely used databases in the field of LCA due to the completeness of its catalogue.
First, the studied flows refer to a reference inverter from Infineon (Figure 1), i.e., the HybridPACK Drive in kit form [22]. Infineon provides open-access information relevant to the LCA study.
Second, a study conducted by System Plus Consulting (a firm specializing in reverse engineering, based in Nantes, France) on the FS820R08A6P2B HybridPACK Drive 750 V IGBT, the power module used herein, has yielded accurate and complementary information on this part [29].
The final inventory was completed with flows from the 150 kW inverter introduced in the study by Nordelöf (2017) [23]. These flows are presented in a scalable LCI model (the Chalmers model); this inventory represents the evolution of the mass of each component of the EV inverter as a function of the inverter power. The Chalmers model plays an important role and can be explained by 3 aspects [23]: a lack of data in the field of PE; the observation of a correlation between inverter volume and power; and the goal of allowing LCA practitioners (not necessarily from the PE field) to access a fast tool whose input values are easily found. Therefore, electric power is the main selected input parameter. The power can vary from 20 to 200 kW, while battery voltage ranges from 250 to 700 V depending on the type of vehicle, from a mild hybrid to a fully electric car. The Chalmers model was devised in collaboration between researchers with different expertise in LCA and PE design. Component design data were compiled from material content statements, technology benchmarking literature, industry experts, and product descriptions. This model represents “gate-to-gate,” i.e., solely the production of the inverter, from materials to the final usable unit.
The Chalmers model is not fully employed for manufacturing given its non-representation of an existing inverter for the functional unit, thus potentially leading to an error in the estimation of materials and processes. Therefore, HybridKit Drive served as the starting point of the study, and Chalmers filled in the missing data. In addition, Chalmers developed his model with two reference inverters of the same family as that studied herein, allowing for a simpler correlation. Appendix A indicates the changes made in the Chalmers model in order to accommodate the HybridKit Drive.
Table 2 presents the overall structure of the proposed system with all the various subparts, along with a summary of their relevant key information. The weight of the inverter (corresponding to the FU) and each subpart is shown in Figure 2a, where the main part is the casing (≈7 kg). Figure 2b provides the electrical diagram of the studied inverter.
Table 2.
Composition of the inverter.
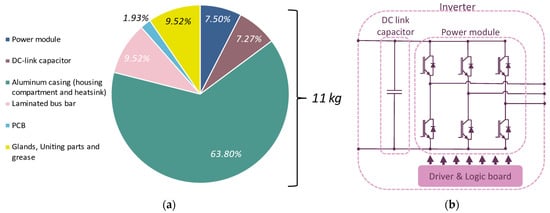
Figure 2.
(a) Mass diagram of a 150 kW inverter with 450 V DC bus, total weight = 11 kg; (b) Electrical diagram.
Clearly, the inventory must be carried out over the entire life cycle, hence the name LCI. However, the Chalmers model only focuses on manufacturing, so the three missing parts needed to be added, namely, product transport, use, and end-of-life.
For the transport component, in the absence of specific data, the product environmental footprint (PEF) proposed a default scenario with different types of transportation options, vehicles, and loads. The default scenario was selected [27], from the factory to the distribution center and on to the final customer.
End-of-life (EoL) is the last stage of the product once it has been fully used; this is the recycling stage. PE in EVs today is shredded and post-processed, with a very small quantity of the materials being recovered [31]. The Ecoinvent “waste electric and electronic equipment” process was employed here since it effectively represents today’s EoL treatment of an inverter. Moreover, it describes the mechanical treatment (including the previous manual depollution step with all necessary facilities) of waste from electrical and electronic equipment (WEEE). This process separates the waste into fractions: ferrous materials, aluminum, copper, and residues. The treatment of these fractions has not been considered in the present study.
Lastly, the use phase accounts for the energy losses of the inverter. As described for the functional unit, the lifetime of the automotive domain was adopted [26], namely 15 years with 10,000 h of operations, or 300,000 km. To calculate the losses, the average consumption of an EV in use was scaled over its lifetime and then multiplied by the inverter loss ratio (Equation (1)). An equivalent efficiency of 97% over an operating cycle was considered [32]. This value was calculated according to a standardized driving cycle (Worldwide Harmonized Light Vehicle Test Procedure (WLTP)) and was given by the ratio between the energy supplied by the converter to the load and the energy absorbed by the inverter. In the considered case, load energy is 2.7614 kWh, and the inverter losses are 0.0706 kWh during one WLTP cycle. Volkswagen ID.3 150 kW was selected for the consumption [33], with an average of 16 kWh/100 km over the entire lifespan. For a lifespan equivalent to 300,000 km, an energy loss over the life cycle equal to 1440 kWh was obtained. A global energy mix was selected for the electricity process in Ecoinvent.
3. Analysis of the Uncertain Nature of the LCA
3.1. Context
While the life cycle assessment tool is currently the most relevant to calculating environmental impacts, its use suffers from a number of uncertainties that are present not only in all stages of the product life cycle but also in all stages of LCA creation [34,35,36,37]. An incorrect diagnosis may be given—in particular, when two products are compared, one may appear better than the other—yet an uncertainty study would reveal the possible variations in overlapping values, thereby leading to completely different conclusions [38].
3.2. Methods
Various types of approaches are available to consider uncertainties [39], either by trying to reduce them or by including them in the final result. This study will focus on a probabilistic approach that allows quantifying variations in the results. Such quantifications can be obtained by means of several methods, in this case via an uncertainty analysis and a sensitivity analysis. The two methods are intimately linked [40] through the uncertainties in model input and output and depending on the sensitivity of the system.
Uncertainty analysis (UA) is a methodology used to quantify the level of uncertainty in the model output as induced by the different sources of variability; its purpose, therefore, is to propagate the uncertainties through the model [38,41]. The sensitivity analysis (SA) conveys the weight of assumptions in the model input relative to the model output [42]. This step can represent assumptions on, for example, input values (flows) and scenarios (e.g., energy mix). In this study, SA was conducted solely on input quantity variation. UA and SA may be performed in a variety of ways [38].
For UA, the Monte Carlo method of N iterations based on a sampling of input flows was selected [43]. The underlying principle is to calculate the environmental impacts by varying the input flows with respect to their potential values, as well as the number of iterations defined; the output distribution function can then be analyzed. The analysis will only present a result relative to the uncertainties of the inventory flows and not of other sources. The difficulty of this method lies in the need to know the distribution function of input flows, or at least a representative sample. Unfortunately, during the inventory creation phase, the data collected were unique, as is the case for the Chalmers model. Therefore, the so-called semi-quantitative/hybrid technique, i.e., the “simplified standard procedure”, is to be added [44]. This technique serves to determine the standard deviation of each distribution based on a “pedigree” matrix, as a qualitative flow scoring matrix derived from six characteristics: “reliability”, “completeness”, “temporal correlation”, “geographic correlation”, “further technological correlation”, and “sample size”. This procedure is correlated with the lognormal distribution; it offers the advantage of being external to the system, i.e., it can be directly used with the LCA software without having to modify the environmental calculation code. The Chalmers model includes in its dataset the various parameters of the lognormal distribution function for each flow related to the “simplified standard procedure”, that is, the geometric standard deviation (GSD) image of the “pedigree” matrix and the geometric mean (μg) together equal the deterministic value of each flow [23]. For the flows added to the study of transport, use, and EoL, the same procedure is employed.
For SA, the principle of the one-at-a-time (OAT) method is adopted to calculate the sensitivity of flows [43]. This method consists of analyzing the evolution of the environmental impacts in an output when a variation is applied to an input.
4. Results
4.1. LCA of a Power Inverter
The results of the LCA are presented and discussed in this subsection; these results constitute the study of the functional unit (FU) of an inverter generating an AC electrical operating point for a 150 kW load from a DC power source of 450 V, based on 15 years and 10,000 total operating hours. This LCA uses the Chalmers model to obtain the “gate-to-gate” inventory, i.e., manufacturing, along with the literature dedicated to transport, use, and end-of-life. The complete methodology is described in Section 2.
An analysis of the entire life cycle of the inverter is shown in Figure 3. Two main components of the LCA emerge for all types of environmental impacts: manufacturing and use.
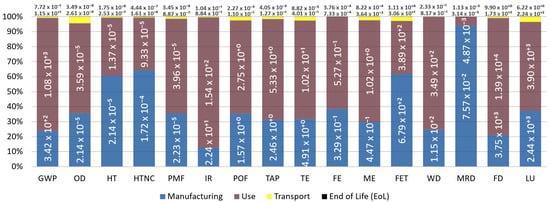
Figure 3.
LCA results of an inverter operating point for a 150 kW load from a DC power source of 450 V, based on 15 years and 10,000 operating hours. This output conveys the standardized environmental impacts, according to the European Commission [27]. All abbreviations are presented in Table 1.
Transport and the end-of-life are the two life cycle components having the least impact on the environment. Together, they do not exceed 4% of the environmental impacts in each category (ozone depletion (OD) ≈4%, land use (LU) ≈3%, etc.). Depending on the environmental impacts, end-of-life is two to one hundred times less than transport.
Use is predominant in 12 impact categories: GWP ≈ 75%, IR ≈ 87%, FD ≈ 78%, etc. It is important to note that use represents electrical energy and is therefore directly correlated with the chosen method of electricity production. This feature can have a tremendous impact on the final results [45]. For example, in the French energy mix (with a majority of nuclear), the score on ionizing radiation can be multiplied by five and divided by seven for the global warming potential. This is because nuclear power plants use radioactive materials as their main fuel, the extraction of which increases IR [46]. A country such as China, which generates its electricity mainly with coal power plants, plays a larger role in climate change (GWP). The utilization phase is highly dependent on the energy mix from an environmental point of view.
Product manufacturing is also an important component since it takes precedence over four different impacts. More specifically, it exceeds 60% in the following categories: human toxicity (≈61%), non-cancer human toxicity (≈64%), freshwater ecotoxicity (≈62%), and mineral resource depletion (≈94%). The discussion on manufacturing is developed in the following sections.
4.2. Hierarchy/Communication of Results
The results of an LCA can be difficult to interpret, given not only the multi-criteria aspect of an LCA, which requires a multidisciplinary understanding, but also the complexity of relating the intermediate impacts to reality. One way to simplify this matter is to normalize the results to a unit that is known and visualizable by the reader, which would also provide insight into the real importance of impact results for our case study. It should be noted that this procedure can add sources of error due to the use of a reference value (which is far from perfect) in finding the normalized result [47]. Thus, Figure 4 presents the results in a more instructional format. The aim is to correlate the planetary limits [48], which comprise the nine limits not to be exceeded in order to provide humanity with a safe and fair development framework, i.e., climate change, biodiversity loss, disruption of the biogeochemical cycles of nitrogen and phosphorus, land use change, ocean acidification, global water use, stratospheric ozone depletion, increase in aerosols in the atmosphere, and introduction of new entities into the biosphere.
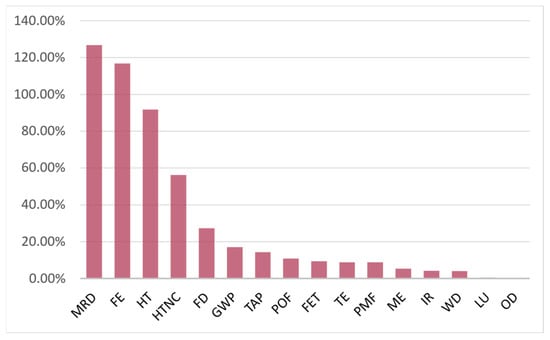
Figure 4.
Hierarchy of environmental impacts, with the use of planetary limits as normalization. Environmental impacts calculated for an inverter operating point with a 150 kW load from a DC power source of 450 V, based on 15 years encompassing 10,000 operating hours. This depiction represents the standardized environmental impacts, according to the European Commission [27]. Relevant abbreviations are presented in Table 1.
Based on the work on planetary limits and the summary of the link to LCA in the form of NF-normalized factors [49], Figure 2 shows the comparison between planetary limits per person per year () and the environmental impacts of the 150 kW inverter. This reflects a hierarchy of the significance of the inverter’s impacts in relation to planetary limits.
As shown in Figure 4, it is possible to direct future actions aimed at reducing environmental impacts by knowing the order of magnitude. As an example, Figure 3 shows the impact of ionizing radiation (IR) on the use; consequently, a design effort can be engaged to increase the inverter efficiency, thereby decreasing the losses and thus decreasing the use share of IR. However, in this example, improving efficiency could mean increasing the need for materials (e.g., oversizing components) and therefore potentially increasing the depletion of resources, minerals, and metals (MRD). Figure 4 shows that MRD constitutes the most significant impact, while IR is among the least significant compared with the planetary limits. Taken as an improvement, the decrease in energy consumption during the use phase is not relevant in this example.
4.3. “Gate-to-Gate” Inverter Environmental Impacts
As highlighted in the previous section, manufacturing is among the most impactful “hotspots.” However, the inverter is not manufactured from a single block; rather, it is composed of several subparts. A particular development of the tree structure was thus chosen. In this study, the inverter was divided into seven subparts: the power module, bus capacitors, aluminum housing, busbar, PCBs (gate drivers and logic control cards), hardware (cable glands, seals, and spacers), and an assembly service.
Figure 5 displays the various environmental impacts associated with manufacturing the 150 kW inverter by subpart. The three subparts with the smallest impacts are: PCBs (≈17% for ionizing radiation); cable glands, seals, and spacers (≈18% for non-cancer human toxicity); and assembly (≈8% for abiotic resource consumption). The impact of PCBs is explained not only by their composition of integrated circuits, which are not very environmentally friendly elements, but also by the FR4 panels used for their substrates. The use of brass for the cable glands and the need for electrical power for assembly are impactful. The three-subpart grouping mentioned above is followed by the busbar, which lies around 20% for human toxicity, excluding cancer (≈26%), freshwater eutrophication (≈18%), and freshwater ecotoxicity (≈15%). The DC link capacitor exerts a large impact on OD (≈19%), IR (≈21%), POF (≈17%), WD (≈16%), and LU (≈16%). The DC link capacitor’s environmental impacts are mainly due to the production effort. It is important to remember that the process used in Ecoinvent for the production effort of the capacitor does not make any distinction between the type of capacitor but is an average of all the production efforts of all the types. Furthermore, the use of metal, specifically copper, is an aggravating factor for the environmental impact of the DC link capacitor and the busbar.
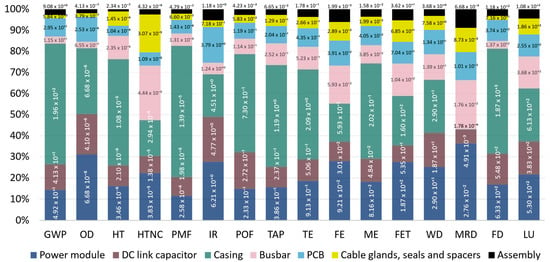
Figure 5.
Standardized environmental impacts of the “gate-to-gate” manufacturing phase, at the inverter operating point for a 150 kW load, from a DC power source of 450 V, in applying the European Commission recommendations for choosing impact categories [27]. The associated abbreviations are presented in Table 1.
Lastly, two hotspots still exist, namely the power module and aluminum case. The power module is dominant for OD (≈31%), HTNC (≈22%), IR (≈28%), FE (≈28%), FET (≈28%), and MRD (≈36%). Alternatively, the aluminum case predominates for GWP (≈57%), HT (≈50%), PMF (≈62%), POF (≈47%), TAP (≈48%), TE (≈43%), ME (≈45%), and FD (≈50%). For aluminum casing, the environmental impacts are mainly dominated by the primary aluminum ingot. Metals are difficult to obtain due to their proportion in the ground and the processes required to obtain an ingot. The energy required for die-casting and the use of anti-corrosion resin also cause environmental impacts. The discussion on the power module is developed in the following sections.
In returning to Figure 4, it can be observed that the manufacturing part plays a role in the largest impacts. Zooming in on the manufacturing presented in Figure 5 shows that, for these same impacts, some subparts are predominant, as they correspond well with the hotspots mentioned earlier, as well as the power module and aluminum case.
4.4. “Gate-to-Gate” Power Module Environmental Impacts
During the manufacturing phase, certain subparts stand out. The power module is among the “hotspots” linked to inverter manufacturing. As for the inverter, the power module can be subdivided into distinct subparts (Figure 6a): the chips (IGBTs and diodes), contacts (wire bonds, auxiliary terminals), DCB, copper baseplate, terminals, screws, and washers (power part), frame, lid, and final assembly.
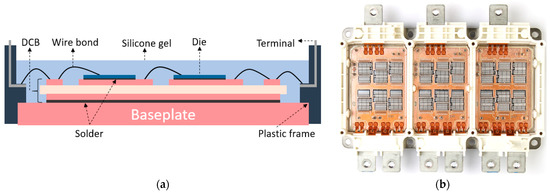
Figure 6.
(a) Power module cross-section; (b) Open FS820R08A6P2B HybridPACK Drive [29].
Figure 7 shows the environmental impacts of the power module present inside the inverter. The assembly oscillates between ≈12% (POF) and ≈3% (FET), caused mainly by using soldering paste. Frame and lid are lower-impact parts, with the use of polyphenylene, which is a thermoplastic. Terminals, screws, and washers exert minimal impact, except for HT at ≈30%, due to the use of raw material, steel. In contrast, DCB stagnates at around 3% (IR ≈ 5%, MRD ≈ 1%), also due to the use of raw material, copper, but also because of the inert gas used in the furnace to assemble the copper with the ceramic, i.e., nitrogen.
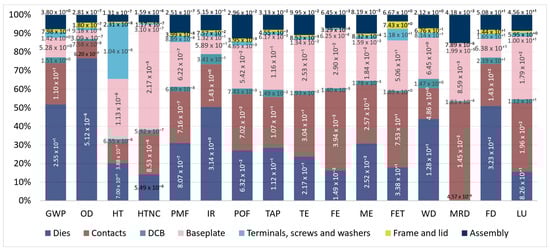
Figure 7.
Standardized environmental impacts of the manufacturing phase, “gate-to-gate,” of the 7 subparts of an IGBT power module (150 kW), in adopting the European Commission recommendations for choosing impact categories [27]. Abbreviations are presented in Table 1.
For the remainder, three hotspots can be highlighted: the chips, contacts, and baseplate. The baseplate has the greatest impact on human toxicity, with and without cancer, and land use, at approximately 56%, 32%, and 34%, respectively, while having the lowest for ozone depletion at ≈5%. Contacts have a maximum impact on freshwater eutrophication and mineral resource use (≈53%) and a minimum impact on ozone depletion (≈10%). Chip manufacturing yields the main impacts for climate change (≈52%), ozone depletion (≈77%), ionizing radiation (≈50%), and fossil material consumption (≈51%). The discussion on the contact and the baseplate is developed in the following section.
The most significant impacts, presented in Figure 4, lead to the same conclusion for the power module hotspots: the baseplate, contacts, and chips all have a major environmental dimension.
4.5. Contact and Baseplate Process
A product can be divided into a multitude of subparts. In the case of an LCA study, this subdivision step serves to improve system knowledge in order to further reduce environmental impacts. One interesting subdivision consists, once the hotspots are known, of drawing the difference between the materials needed and the production efforts. As shown in Figure 7, in an attempt to reduce the MRD, one solution would be to limit contacts, but how can this be achieved? Should we reduce or change materials, or act upon the production effort?
The environmental impacts of contacts (wire bonds, auxiliary terminals) and the baseplate are presented in Figure 8 in order to determine whether the effort should be directed towards the processes or whether the material itself is a problem. By unanimous agreement, the materials are more important than the production effort. Therefore, developing different methods while maintaining the same material will not significantly decrease the environmental footprint. Other technologies that allow for either the elimination of material or a decrease in its weight will be more relevant. Clearly, a new LCA would need to be carried out to ensure that no pollution transfer to another impact is being created.
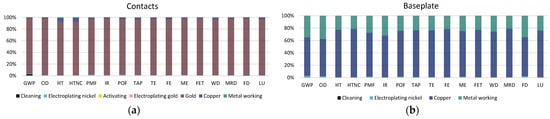
Figure 8.
Standardized environmental impacts of contact (a) and baseplate (b) processes for the power module (150 kW), given the European Commission recommendations for choosing impact categories [27]. Abbreviations are presented in Table 1.
4.6. Uncertainty Analysis
Uncertainty analysis is an essential step in the LCA process because it allows the study to be both more robust and more accurate. The results displayed in this subsection establish a range of potential variations in impact values. The selected method, i.e., semi-quantitative, sets forth the variation in input data according to a distribution law along with the use of the Monte Carlo method. More specifically, it calculates the environmental impacts a determined number of times and retrieves the output distribution function. Therefore, only the variation in the input data is studied. Details of the methods used are described in Section 3.
Figure 9 shows the calculated uncertainty of the 16 environmental impacts of the inverter (150 kW) over its entire life cycle. There is a 95% probability that the values are in the interval [µ + 2σ; µ − 2σ], where σ is the standard deviation of the distribution and µ is the mean. Water consumption, climate change, and fossil resource use have a variation of ≈+/−9% in terms of uncertainty. Finally, ionizing radiation is the environmental impact with the largest uncertainty, with ≈+/−10% variation on the mean value.
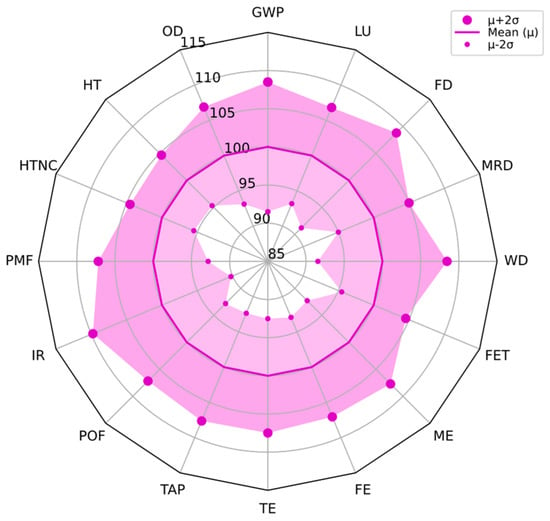
Figure 9.
Results of normalized uncertainties over the life cycle of an inverter operating point for a 150 kW load from a DC power source of 450 V, based on 15 years and 10,000 operating hours. Use of a semi-quantitative approach focusing solely on input streams and a Monte Carlo setup with 1000 iterations. The associated abbreviations are presented in Table 1.
The uncertainties are directly related to the potential variations in the input values and how much these values weigh on the environmental impact. On the one hand, an elementary flow with a distribution function that has a large standard deviation will not have a large impact on the final uncertainty if its weight in terms of environmental impact is small. Alternatively, an elementary flow that has a large impact on the environment, even if its potential variation is small, may imply a large degree of uncertainty. The explanation of Figure 9 needed to be based on a sensitivity analysis (Section 4.7), which allows us to know the sensitivity of the input data and plays a role in the uncertainty analysis.
4.7. “OAT” Sensitivity Analysis of Input Values
The purpose of a sensitivity analysis is to examine various assumptions. Different types of sensitivity analyses are available, but the one presented in this subsection deals specifically with input flows and is therefore called the value-of-flow assumption. It is associated with uncertainty analysis (Section 4.6), which presents the potential variation in environmental impacts and then enables visualizing the causes of uncertainties. The method employed is referred to as one-at-a-time (OAT) [43], given that the individual variation in an input flow provides for the study of its weight on the variation in environmental impacts. This OAT analysis was conducted with a choice of variation corresponding to +10%. The development of the method is discussed in Section 3.
Figure 10 shows the sensitivity analysis performed with the OAT method. The variation is individually applied to the different inverter subparts. These subparts comprise complex flows, which stem from the Chalmers model, thus yielding a correlation between the flows. It should be noted here that the application of the variation proceeds in a uniform manner; moreover, it does not take into account the relationships between the flows but directly applies a 10% variation to all of them. The result of this method is indeed logical. Knowing that the calculation of environmental impacts is derived from linear models, the result is an image of the weight of the subpart on the environmental impact. The results shown in Figure 10 can be deduced from Figure 3 and Figure 5. The subsequent analysis is no less valuable for understanding the contribution that future eco-design can make. For purposes of illustration, if a new type of power module yields a 10% reduction in the weight (and process effort) of the baseplate, this would lead to a diminution of ≈1% of MRD.
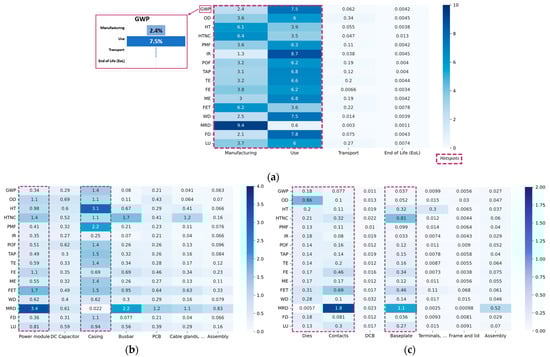
Figure 10.
Results of the evolution of the environmental impacts (%) with respect to a variation in the input of 10% (OAT method). The life cycle analysis of the various subparts of an inverter operating point for a 150 kW load from a DC power source of 450 V, based on 15 years and 10,000 operating hours. (a) Inverter life cycle; (b) Inverter manufacturing; (c) Power module. Abbreviations are presented in Table 1.
The hotspots for the power module, aluminum housing, and usage are all visible in Figure 10 due to darker shading. For example, a 10% variation in the power module causes a 0.34% variation in climate change (GWP), 1.4% HTNC, 3.4% MRD, etc. This output serves to ascertain the weight of the subpart on the impact, e.g., 3.4% GWP, 14% HTNC, 34% MRD.
An explanation of the uncertainty analysis is derived from the sensitivity analysis, i.e., the uncertainty analysis allows one to know the variation in the environmental impacts in output and which input of the system creates the variation in output. This is why Figure 10 is also related to Figure 9, in that all subparts do not possess the same weight in the uncertainty dispersion. According to Figure 9, ionizing radiation (IR), water consumption (WD), climate change (GWP), and fossil resource use (FD) have the largest degree of uncertainty in this study. Only Figure 10 shows that use is the primary sensitive parameter for these types of impacts, as the uncertainty present is mainly due to use.
5. Discussion
This precise analysis is a first step towards a parametric method that enables eco-design. In other words, the parameters used are known and precise, which allows one to not only modify them but also guide the actions to be implemented in relation to the hotspots.
Reducing the environmental footprint will, first and foremost, involve improving hotspots; however, not all types of impacts are equal. It is therefore necessary to act intelligently by first examining which impacts are the most significant and then, based on this observation, determining which subparts are predominant. One way to approach this task is to focus on manufacturing, either with other materials and other processes or by developing new technologies that modify the design of certain inverter parts. Research in the field of power modules is moving towards less-standard designs than that noted in Figure 6, such as power modules without baseplates or direct integration into the PCB [50,51]. These two designs may be environmentally relevant due to the contacts and baseplate being either modified or removed.
It is also interesting to question the life cycle of the inverter by generating scenarios that could be part of a circular economy approach, for example, in considering degradations and the need to replace the inverter. Loops of reuse, repair, or recycling of the product at the end of its life could also be introduced [52]. This approach could be combined with inverter modularity, whereby it could be subdivided into several interconnected elementary standard cells, allowing for improved maintenance flexibility and, in the event of a breakdown, the identification of the faulty cell requiring replacement. It would also be relevant to focus on the diagnostic functions, being informed of the state of health of the product, and deriving more precise maintenance or an adapted functioning that serves to increase the lifespan.
It is important to keep in mind that the presented impacts are related to a specific technology, which offers a reference case, and a design change can lead to a transfer of pollution, which is why a new LCA using the same primary assumptions must be performed in order to compare different technological solutions. The comparison of environmental impacts with other inverters, or even other PE products, would be interesting for future studies.
6. Conclusions
In this paper, we have developed an LCA applied to a 150 kW inverter (traction). It is intended to be a general method for use in eco-design studies and/or comparisons between architectures. The method deals in detail with all the parts of the inverter. Despite the importance of such studies, the authors remain unaware of any similar study for electrical engineering designers detailing the LCA of a power inverter.
The environmental study of the inverter presents the level of importance of each type of impact, with the use of mineral resources, the eutrophication of freshwater, and human toxicity among the main factors. For these impacts and on a life cycle basis, manufacturing and use (losses) dominate the environmental scores, with metal and mineral resource depletion (MRD) being primarily due to manufacturing (≈94%).
The use phase is characterized by the consumption of electrical energy resulting from an energy mix that may, depending on the nature of the mix, have a major impact on the final result. For example, in the French energy mix, the score on ionizing radiation can be multiplied by five and divided by seven for its global warming potential.
This study on manufacturing processes has presented the power module and casing as the two most impactful subparts in the types of impacts mentioned above; these make up the hotspots of the inverter. For the most important impact type, MRD, the power module is responsible for ≈43% of the final score.
The chip, contacts, and baseplate stand out in the power module. For MRD, the contacts and baseplate account for ≈53% and 31% of the power module impact, respectively, while the chip accounts for just ≈0.2%. The other main impacts are the baseplate followed by contacts as dominant components, knowing that the materials (gold, copper) and not the production efforts are really the most impactful.
For the other parts of the inverter, the use of metals is an aggravating factor in terms of environmental impact, such as copper in the capacitor and in the busbar, aluminum in the casing, and brass in the cable gland. The production efforts in the die casting of the case or for the DC link capacitor are impactful. For the PCB, the main impacts are due to the use of integrated circuit components and boards.
The next step will consist of determining whether the methods described (modularity and diagnosis) can lead to a reduction in environmental impacts and, moreover, what the optimal solution would be according to these life cycle scenarios.
The work presented in this article will serve as the basis for such future studies. It is relevant to start with a very fine analysis of the product, well documented, in order to implement eco-design solutions and have a precise quantification of the environmental benefits. This article should be seen as the first stone of a larger edifice, an eco-design parametric method for a PE product.
To illustrate the eco-design parametric method, an example could consider scale effects, i.e., take into account the modularity of the system. The modular aspect of the power converter can be used in a circular economy approach with maintenance. For maintenance, the goal is to be able to separate the failing part of the product without impacting the functioning parts. Instead of one 150 kW power module, two 75 kW modules can be used. A logical interpolation can be set up to show the evolution of environmental impacts. The knowledge of a precise reference inverter allows one to progress towards an eco-designed inverter according to the designers’ needs.
Author Contributions
Conceptualization, B.B., H.B.A., G.J., N.D. and S.L.; Methodology, B.B.; Software, B.B.; Validation, B.B., H.B.A., G.J., N.D. and S.L.; Formal analysis, B.B.; Investigation, B.B.; Resources, B.B.; Data curation, B.B.; Writing—original draft, B.B.; Supervision, H.B.A., G.J., N.D. and S.L. All authors have read and agreed to the published version of the manuscript.
Funding
This research received no external funding.
Data Availability Statement
All data supporting the findings of this study are available within the article’s manuscript.
Conflicts of Interest
The authors declare no conflict of interest.
Abbreviations
The following abbreviations are used in this manuscript in addition to those defined in Table 1:
| PE | Power electronics |
| LCA | Life cycle assessment |
| LCI | Life cycle inventory |
| IGBT | Insulated gate bipolar transistor |
| PCB | Printed circuit board |
| DCB | Direct copper bond |
Appendix A
The inverter inventory was designed based on the HybridPACK Drive kit [22], and the array of sources used includes the Chalmers model. In order to facilitate inventory creation, the Chalmers open access file (Excel) can be directly used after modification of the known parameters. The Excel file was built around the “scale factors and tables” worksheet, which lists all constants/parameters of the Chalmers model. Table A1 and Table A2 show the various parameters of the power module FS820R08A6P2B HybridPACK Drive and the bus capacitor Epcos Capacitor B25655P5507K taken into account in this study; these values can be replaced on the “scale factors and tables” worksheet.
The flow chart presented in Figure 2 of Nordelöf’s (2017) [23] study helps one understand which flow is involved in the LCA study for the manufacture of the inverter. Table A1 and Table A2 show the evolution of the flows on the power module and the DC link capacitor adapted for the study.
Table A1.
Power module FS820R08A6P2B HybridPACK Drive.
Table A1.
Power module FS820R08A6P2B HybridPACK Drive.
| Substance | Scaled Mass (Grams) |
|---|---|
| Aluminum oxide | 10.5 |
| Copper | 554.8 |
| Diantimony trioxide | 0 |
| Glass fiber | 34.9 |
| Polyphenylene sulfide (PPS) | 81.5 |
| Silicone gel | 28 |
| Entity/subpart | Scaled area (cm2) |
| Baseplate area for system soldering | 86.8 |
| Entity/subpart | Value |
| Alumina substrate thickness (m) | 0.00032 |
| DCB substrate, area (cm2) | 86.8 |
| DCB foils, thickness (m) | 0.00056 |
| Copper in DCB (g) | 43.5 |
| Copper in baseplate (g) | 500 |
| Copper in wires (g) | 3.78 |
| Copper in terminals and conductors (g) | 11.3 |
| Total chip area (cm2) | 9.00 |
Table A2.
DC-link capacitor.
Table A2.
DC-link capacitor.
| Substance | Fixed Mass Share | Scaled Mass (Grams) |
|---|---|---|
| Capacitor | 100% | 8.00 × 10² |
| Aluminum | 0.10% | 8.00 × 10⁻¹ |
| Copper | 0.10% | 8.00 × 10⁻¹ |
| Polypropylene | 29.20% | 2.34 × 10² |
| Tin | 3.10% | 2.48 × 101 |
| Zinc | 7.10% | 5.68 × 101 |
| Polyethylene terephthalate (PET) | 19.00% | 1.52 × 10² |
| Polycarbonate | 0.90% | 7.20 × 100 |
| Polyurethane resin | 14.40% | 1.15 × 10² |
| Brass (64% copper, 36% zinc) | 0.40% | 3.20 × 100 |
| Copper | 25.10% | 2.01 × 10² |
| Tin | 0.60% | 4.80 × 100 |
References
- Ministère de la Transition Écologique (MTE). Chiffres Clés du Climat—France, Europe et Monde; Ministère de la Transition Écologique (MTE): Paris, France, 2020.
- IEA. Global EV Outlook 2021; IEA: Paris, France, 2021. Available online: https://www.iea.org/reports/global-ev-outlook-2021 (accessed on 1 April 2022).
- Rte. Futurs Énergétiques 2050, Principaux Résultats; Rte: Paris, France, 2021. [Google Scholar]
- negaWatt. (2022) Association négaWatt, La Transition Énergétique au Cœur D’une Transition Sociétale, Synthèse du Scénario négaWatt 2022. Available online: https://negawatt.org/Scenario-negaWatt-2022 (accessed on 1 November 2022).
- Forti, V.; Baldé, C.; Kuehr, R.; Bel, G. The Global E-Waste Monitor 2020—Quantities, Flows, and the Circular Economy Potential; International Solid Waste Association: Rotterdam, The Netherlands, 2020; ISBN 978-92-808-9114-0. [Google Scholar]
- Smart Grid + Power Electronics Consortium Singapore (SPECS). Advanced Power Electronics: Enabler for Energy Transition & Efficiency; SPECS: Singapore, 2020. [Google Scholar]
- Blaabjerg, F. Villum Investigator. Power Electronics for Renewable Energy Systems—Wingrid; Aalborg University: Aalborg, Denmark, 2021. [Google Scholar]
- Adlkofer, H. Vice President, Bernstein Conference on EVs and Energy Storage; Infineon: Neubiberg, Germany, 2017. [Google Scholar]
- Saber, C. Analysis and Optimization of the Conducted Emissions of an On-Board Charger for Electric Vehicles—Electric Power; Université Paris Saclay: Paris, France, 2017. [Google Scholar]
- European Commission. Critical Materials for Strategic Technologies and Sectors in the EU—A Foresight Study; European Commission: Brussels, Belgium, 2020. [Google Scholar]
- Volke, A. IGBT Modules: Technologies, Driver and Application; Infineon: Neubiberg, Germany, 2012. [Google Scholar]
- Samsu Koroma, M.; Costa, D.; Philippot, M.; Cardellini, G.; Hosen, M.S.; Coosemans, T.; Messagie, M. Life cycle assessment of battery electric vehicles: Implications of future electricity mix and different battery end-of-life management. Sci. Total Environ. 2022, 831, 154859. [Google Scholar] [CrossRef] [PubMed]
- Boeglin, N.; Veuillet, D. Introduction à l’Analyse de Cycle de Vie (ACV); Note de Synthese Externe; ADEME: Angers, France, 2005. [Google Scholar]
- ILCD. International Reference Life Cycle Data System (ILCD) Handbook—General Guide for Life Cycle Assessment—Provisions and Action Steps; EUR 24378 EN; Publications Office of the European Union: Luxembourg, 2010. [Google Scholar]
- Li, J.; Wang, C.; Zhang, B. Life Cycle Assessment of Typical Electric Vehicle IGBT Module. Mater. Sci. Forum 2016, 847, 398–402. [Google Scholar] [CrossRef]
- Valkama, J.; Keskinen, M. Comparison of simplified LCA variations for three LCA cases of electronic products from the ecodesign point of view. In Proceedings of the 2008 IEEE International Symposium on Electronics and the Environment, San Francisco, CA, USA, 19–22 May 2008; pp. 1–6. [Google Scholar] [CrossRef]
- Tschümperlin, L.; Stolz, P.; Frischknecht, R. Life Cycle Assessment of Low Power Solar Inverters (2.5 to 20 kW); treeze: Uster, Switzerland, 2016. [Google Scholar]
- Schellscheidt, B.; Richter, J.; Licht, T. Life-Cycle Assessment for Power Electronics Module Manufacturing. In Proceedings of the 22nd European Microelectronics and Packaging Conference & Exhibition (EMPC), Pisa, Italy, 16–19 September 2019; pp. 1–4. [Google Scholar] [CrossRef]
- Temporelli, A.; Carvalho, M.L.; Girardi, P. Life Cycle Assessment of Electric Vehicle Batteries: An Overview of Recent Literature. Energies 2020, 13, 2864. [Google Scholar] [CrossRef]
- Tintelecan, A.; Dobra, A.C.; Martis, C.S. Literature Review—Electric Vehicles Life Cycle Assessment. In Proceedings of the 2020 ELEKTRO, Taormina, Italy, 25–28 May 2020; pp. 1–6. [Google Scholar]
- Nordelöf, A.; Messagie, M.; Tillman, A.M.; Söderman, M.L.; Van Mierlo, J. Environmental impacts of hybrid, plug-in hybrid, and battery electric vehicles—What can we learn from life cycle assessment? Int. J. Life Cycle Assess. 2014, 19, 1866–1890. [Google Scholar] [CrossRef]
- Infineon. HybridKit Drive Quickstart Manual Quick Start Guide for HYBRIDKIT DRIVE; Infineon: Neubiberg, Germany, 2020. [Google Scholar]
- Nordelöf, A.; Alatalo, M. A Scalable Life Cycle Inventory of an Automotive Power Electronic Inverter Unit; Chalmers University of Technology: Gothenburg, Sweden, 2017. [Google Scholar]
- ISO 14040; DIN EN ISO 14040: Environmental Management—Life Cycle Assessment—Principles and Framework. European Committee for Standardization: Brussels, Belgium, 2006.
- ISO 14044; DIN EN ISO 14044: Environmental Management—Life Cycle Assessment—Requirements and Guidelines. European Com-mittee for Standardization: Brussels, Belgium, 2006.
- Wang, H.; Liserre, M.; Blaabjerg, F.; de Place Rimmen, P.; Jacobsen, J.B.; Kvisgaard, T.; Landkildehus, J. Transitioning to Physics-of-Failure as a Reliability Driver in Power Electronics. IEEE J. Emerg. Sel. Top. Power Electron. 2014, 2, 97–114. [Google Scholar] [CrossRef]
- Zampori, L.; Pant, R. Méthode De l’Empreinte Environnementale de Produit (PEF), EUR 29682 FR; Office des Publications de l’Union Européenne: Luxembourg, 2019. [Google Scholar] [CrossRef]
- Althaus, H.-J.; Doka, G.; Dones, R.; Heck, T.; Hellweg, S.; Hischier, R.; Nemecek, T.; Rebitzer, G.; Spielmann, M.; Wernet, G. Overview and Methodology Data v2.0, Ecoinvent Report No. 1; Frischknecht, R., Jungbluth, N., Eds.; ecoinvent: Dübendorf, Switzerland, 2007. [Google Scholar]
- System Plus Consulting. Infineon FS820R08A6P2B HybridPACK Drive 750V IGBT Module Power Semiconductor Report by Elena Barbarini November 2017—Version 2; SEMI: Nantes, France, 2017. [Google Scholar]
- EPCOS. Product Brief 2016 Film Capacitors PCC Power Capacitors for HybridPACK™ IGBT Modules; EPCOS: Munich, Germany, 2017. [Google Scholar]
- Winfried, B.; Schüler, D.; Sellin, G.; Elwert, T.; Schmid, D.; Goldmann, D.; Buchert, M.; Kammer, U. Electric vehicle recycling 2020: Key component power electronics. Waste Manag. Res. 2018, 36, 311–320. [Google Scholar] [CrossRef]
- Kersten, A.; Kuder, M.; Grunditz, E.; Geng, Z.; Wikner, E.; Thiringer, T.; Weyh, T.; Eckerle, R. Inverter and Battery Drive Cycle Efficiency Comparisons of CHB and MMSP Traction Inverters for Electric Vehicles. In Proceedings of the 2019 21st European Conference on Power Electronics and Applications (EPE ’19 ECCE Europe), Genova, Italy, 3–5 September 2019. [Google Scholar] [CrossRef]
- ID3 Volkswagen (2021) ID.3 100% électrique, Tarifs au 20 juillet 2021—Mise à jour au 5 octobre 2021 Année-modèle 2022.
- Lloyd, S.M.; Ries, R. Characterizing, Propagating, and Analyzing Uncertainty in Life-Cycle Assessment: A Survey of Quantitative Approaches. J. Ind. Ecol. 2007, 11, 161–179. [Google Scholar] [CrossRef]
- Leroy, Y.; Froelich, D. A qualitative, quantitative or mixed approach to deal with uncertainty in Life Cycle Assessment of complex systems: Towards a selective integration of uncertainty according to LCA objectives. Int. J. Des. Eng. IJDE 2010, 3, 151–171. [Google Scholar] [CrossRef]
- Huijbregts, M. Application of uncertainty and variability in LCA. Int. J. LCA 1998, 3, 273. [Google Scholar] [CrossRef]
- Sonnemann, G.W.; Schuhmacher, M.; Castells, F. Uncertainty assessment by a Monte Carlo simulation in a life cycle inventory of electricity produced by a waste incinerator. J. Clean. Prod. 2003, 11, 279–292. [Google Scholar] [CrossRef]
- Pannier, M.-L.; Schalbart, P.; Peuportier, B. Comprehensive assessment of sensitivity analysis methods for the identification of influential factors in building life cycle assessment. J. Clean. Prod. 2018, 199, 466–480. [Google Scholar] [CrossRef]
- Heijungs, R.; Huijbregts, M. A Review of Approaches to Treat Uncertainty in LCA, IEMs. In Proceedings of the 2nd International Congress on Environmental Modelling and Software, Osnabrück, Germany, 14–17 June 2004. [Google Scholar]
- Chouquet, J. Development of a Method for Building Life Cycle Analysis at an Early Design Phase—Implementation in a Tool—Sensitivity and Uncertainty of Such a Method in Comparison to Detailed LCA Software; KIT: Karlsruhe, Germany, 2007. [Google Scholar]
- Andrianandraina, A. Approche D’éco-Conception Basée sur la Combinaison de l’Analyse de Cycle de Vie et de l’Analyse de Sensibilité: Cas d’Application sur le Cycle de vie du Matériau d’Isolation Thermique Biosourcé, le Béton de Chanvre; Eco-conception; Ecole Centrale de Nantes (ECN): Nantes, France, 2014. [Google Scholar]
- Saltelli, A.; Tarantola, S.; Campolongo, F.; Ratto, M. Sensitivity Analysis in Practice: A Guide to Assessing Scientific Models; Wiley: New York, NY, USA, 2004. [Google Scholar]
- Igos, E.; Benetto, E.; Meyer, R.; Baustert, P.; Othoniel, B. How to treat uncertainties in life cycle assessment studies? Int. J. Life Cycle Assess. 2019, 24, 794–807. [Google Scholar] [CrossRef]
- Pedersen, W.B.; Bauer, C.; Hischier, R.; Mutel, C.; Nemecek, T.; Reinhard, J.; Vadenbo, C.; Wernet, G. Overview and Methodology: Data Quality Guideline for the Ecoinvent Database Version 3; Aalborg University: Aalborg, Denmark, 2013. [Google Scholar]
- United Nations Economic Commission for Europe. Life Cycle Assessment of Electricity Generation Options; UNECE: Geneva, Switzerland, 2022. [Google Scholar]
- Zhang, X.; Bauer, C. Life Cycle Assessment (LCA) of Nuclear Power in Switzerland—Final Report; PSI: Würenlingen, Switzerland, 2018. [Google Scholar]
- Gérard, A.; Descos, I. Apprehender l’Ordre de Grandeur Des Résultats d’Impacts Environnementaux—Les Apports et Les Limites de Normation; Guide à l’Intention des Praticiens et Lecteurs d’ACV. (Rapport de recherche); HAL: Lyon, France, 2013; 92p, pp. 92. [Google Scholar]
- Rockström, J.; Steffen, W.; Noone, K.; Persson, Å.; Chapin, F.S., III; Lambin, E.F.; Lenton, T.M.; Scheffer, M.; Folke, C.; Schnellnhuber, H.J.; et al. A safe operating space for humanity. Nature 2009, 461, 472–475. [Google Scholar] [CrossRef] [PubMed]
- Sala, S.; Crenna, E.; Secchi, M.; Pant, R. Global Normalisation Factors for the Environmental Footprint and Life Cycle Assessment; EUR (28984); Publications Office of the European Union: Luxembourg, 2017; ISBN 978-92-79-77213-9. [Google Scholar] [CrossRef]
- Yang, Y.; Dorn-Gomba, L.; Rodriguez, R.; Mak, C.; Emadi, A. Automotive Power Module Packaging: Current Status and Future Trends. IEEE Access 2020, 8, 160126–160144. [Google Scholar] [CrossRef]
- Lipppert, M. Key Account Manager at Starpower Europe, Power modules for E-vehicles—Available solutions and future challenges. 2018. [Google Scholar]
- Rahmani, B.; Rio, M.; Lembeye, Y.; Andreta, A.; Crebier, J.-C. Opportunités de la Modularité Pour l’Écoconception de Convertisseurs de Puissance. In Proceedings of the 4th Symposium de Genie Electrique (SGE 2021), Nantes, France, 6–8 July 2021. [Google Scholar]


Disclaimer/Publisher’s Note: The statements, opinions and data contained in all publications are solely those of the individual author(s) and contributor(s) and not of MDPI and/or the editor(s). MDPI and/or the editor(s) disclaim responsibility for any injury to people or property resulting from any ideas, methods, instructions or products referred to in the content. |
© 2023 by the authors. Licensee MDPI, Basel, Switzerland. This article is an open access article distributed under the terms and conditions of the Creative Commons Attribution (CC BY) license (https://creativecommons.org/licenses/by/4.0/).