Article

Integrated Design and Experimental Validation of a Fixed-Pitch Rotor for Wind Tunnel Testing

Department of Mechanical Engineering, Politecnico di Milano, Via La Masa 1, 20156 Milano, Italy
*
Authors to whom correspondence should be addressed.
Energies 2023, 16(5), 2205; https://doi.org/10.3390/en16052205
Submission received: 12 January 2023 / Revised: 3 February 2023 / Accepted: 14 February 2023 / Published: 24 February 2023
(This article belongs to the Special Issue Advancement in Wind Turbine Technology)

Abstract

:
In this paper we report about the design and validation of a 1.2 m wind turbine rotor with fixed blade pitch. The wind turbine is a scaled version of the DTU 10 MW. Integrated design of dimensional scaling laws, blade aerodynamics, and turbine control is carried out to reproduce blade loading and interaction with atmospheric boundary layer of the reference turbine, despite challenges posed by the great reduction in chord-based Reynolds number. The rotor is verified with numerical simulations in OpenFAST and wind tunnel testing. The servo-aerodynamic design approach proposed in this article is shown to be successful for small-scale wind turbine models for use in experiments about wakes and floating wind.

1. Introduction

Wind tunnel testing of wind turbines supports the advancement of wind energy technology, complementing field experiments providing low-cost and low-uncertainty data. Technical characteristics of wind turbine scale models are tailored to the aim of single experiments and their needs in terms of measurements, environmental conditions, and turbine controls. Among many, one important application of wind tunnel testing is the investigation of wakes and wake-turbine interactions in wind farms. Experiments have been carried out to understand the physics of wakes, to verify flow models, and to develop wind farm control tools [1]. Recently, a test campaign with scale model wind turbines in a boundary layer wind tunnel was conducted in [2] to measure the wake flow field and validate an actuator-line code. Wake measurements of a wind turbine scale model are used in [3] to calibrate an engineering wake model, which is then validated in a second experiment with three interacting turbines. In [4] wind tunnel data are compared to several engineering wake models in terms of wake velocity, wake deflection and turbulence intensity. The effect of wake models uncertainty on robustness of wind farm control strategies is studied in [5] with a scaled six-turbine cluster tested in an atmospheric boundary layer wind tunnel. In [6] the wake of a wind turbine scale model is mapped to investigate the physics of wake deflection. In recent years, another prominent application of wind tunnel testing is floating wind, where experiments have been used to gain knowledge about the effect of large platform motions on the aerodynamic response of floating wind turbines and to embed this knowledge in computational codes. In [7,8] a wind turbine scale model is subjected to imposed platform motion performing measurements of rotor forces and wake. In [9] interaction between aerodynamic and hydrodynamic loads is studied in hardware-in-the-loop experiments, where the wind turbine is reproduced with a physical scale model in the wind tunnel and the floating platform by means of a numerical model and a motion actuator. In [10,11] wind tunnel data of [7] are used for three-way validation of several offshore codes.
The main aim of this work is to provide information about the design of a fixed-pitch wind turbine rotor of 1.2 m diameter for wind tunnel experiments. The wind turbine is a scaled version of the DTU 10 MW [12], that has been used as a reference for a number of wind tunnel models: [13] reports about a 0.6 m diameter turbine (1:297 scale) for wake study; [14] describes a 2.4 m diameter model (1:75 scale) aimed at the investigation of floating wind turbine aerodynamics; in [15] a Forude-scaled model of a 10 MW tension leg platform (1:60 scale) is tested in a deep-water basin in combined wind and waves. Requirements for the turbine model of this paper are: to reproduce the interaction between rotor atmospheric boundary layer wind, dimensions that allow to set up multiple turbine units in the wind tunnel test section, scaled blade axial loading in below rated wind to have correct emulation of thrust response and wake deficit when the turbine is operated at design TSR, to be as light as possible. To attain these requirements, we follow an integrated design approach, where scaling laws, blade, mechatronics, turbine control strategy and inflow are developed in parallel. In this study the POLIMI wind tunnel is used as a reference, but methods are valid for other facilities of comparable dimensions.

2. Materials and Methods

This section describes the design procedure that follows these steps: scale factors are decided on the basis of requirements imposed by the applications foreseen for the model and the wind tunnel characteristics; the rotor blade is designed leveraging the aerodynamic characteristics of a low Reynolds airfoil and altering the geometry of the full-scale turbine blade; two control strategies for regulation of rotor speed in below-rated wind are established and verified with a numerical model of the rotor; a suitable torque actuator is selected to implement closed-loop control strategies and fit the rotor power-rpm characteristic.
The DTU 10 MW is a variable-speed pitch-regulated turbine of 178.4 m diameter, reaching rated power at 11.3 m/s, with design TSR of 7.5 in variable-speed regime. The scale model is used in experiments on wake interactions in wind farms that require realistic atmospheric boundary layer wind and correct scaling of the wind-to-turbine interaction, realistic wake of the wind turbine model, and the possibility to arrange multiple turbine units inside the test section for emulation of wind farm array conditions. The scale model is also used in experiments on floating wind turbines where it is required to reproduce the blade thrust force distribution of the full-scale turbine and its variation with relative wind speed; thrust force is a relevant excitation source for any floating turbine and must be scaled correctly [16].

2.1. Selection of Scale Factors

The geometry scale factor λ L is decided comparing the dimensions of the DTU 10 MW to typical wind profiles generated in the POLIMI wind tunnel, and to the main dimensions of the wind tunnel test section. Figure 1 shows vertical profiles of average wind speed and turbulence intensity for typical onshore and offshore conditions, and for empty inlet (i.e., without roughness elements and turbulence generator). The inflow generated in the wind tunnel at 1:150 scale matches up to 2 D from ground the typical logarithmic profile obtained for a full-scale roughness of 34 mm in the onshore case and 5.91 mm in the offshore case. At 1:150 scale the empty inlet condition results in constant wind speed across the rotor, with turbulence intensity around 2%, which is suitable for experiments with uniform wind. The rotor diameter of the DTU 10 MW at 1:150 scale is 1.19 m, and it is rounded to 1.2 m (i.e., the effective geometry scale is 148.7). At POLIMI wind tunnel, models are placed on top of a motorized turning table of 13 m diameter, visible in Figure 1, which is used to investigate different wind angles or to reproduce dynamic wind-direction changes. The turning table diameter is 10.8 times the rotor diameter, and can host a six-turbine array of 2 columns an 3 rows, with turbine-to-turbine distance of 5D. The scale model is used for testing of floating wind turbines, but Froude scaling is not used because hydrodynamic and gravity loads will be simulated with the hardware-in-the-loop technique. Since Froude scaling is not used, the velocity scale factor λ v is set independently from λ L ; it is chose as large as possible to limit the reduction in Reynolds number, that is reduced of a factor λ R e = λ L λ v . The cut-off wind speed of the DTU 10 MW is 24 m/s and the maximum wind speed reachable in smooth flow conditions is 15 m/s (the maximum wind speed is lower for higher turbulence levels). In reason of these constraints the velocity scale factor is fixed to λ v = 1:2. The properties of the scaled turbine obtained with the selected scale factors are reported in Table 1.

2.2. Aerodynamic Design

Rotor design is based on pure-aerodynamic requirements. The aim is to replicate the blade normal-to-plane distributed loading of the DTU 10 MW at design TSR and blade pitch. Rotor normal force (i.e., thrust) characterizes the wake velocity deficit and, in misaligned conditions, the lateral wake deflection [17]. In floating wind turbines, rotor thrust is coupled with the platform response and influences platform motion [16]. In the process of downscaling the DTU 10 MW blade, the main challenge is set by Reynolds number R e , which is lower than 100 k, whereas R e for the DTU 10 MW is between 1.5 × 10 6 and 1.5 × 10 7 . Airfoils of the full-scale rotor are replaced with the SD7032, due to the suitable characteristics at R e < 250 k. Separate 2D testing was performed in a previous project [7] to characterize the airfoil aerodynamic coefficients, which are available at [18]. 2D airfoil coefficients measured in the [ 10 , + 25 ] AoA range are extended to ± 180 by means of Viterna method, and are corrected for 3D stall-delay with the method of [19]. The balde design considers a single operating point, corresponding to the rated condition of the DTU 10 MW (i.e., full-scale wind speed of 11.4 m/s); TSR is preserved; for r / R > 0.32 the blade section is the SD7032, whose chord and twist are altered, section by section, to match the distribution of lift force and the variation of lift force with angle of attack of the DTU 10 MW; the blade root ( r / R < 0.18 ) is circular; for 0.18 < r / R < 0.32 the airfoil gradually passes from circular section to the SD7023, the geometry and polars are obtained by means of interpolation. The procedure used to compute the chord and twist, and the underlying aerodynamic model, are reported in Appendix A. The design outputs are the chord, twist and thickness-over-chord, and blade profile at 174 radial sections. The profiles form a point cloud which is converted to 3D surface by means of B-Spline interpolation. The blade surface is divided along the leading and trailing edge and this constitutes the mold geometry, produced with CNC machining. In the current design, blades have no pitch regulation, thus the three blades and hub are made as a single component with blades pitched to the design value (i.e., 0 ). With this choice uncertainty related to blade pitch regulation that is commented in [20] is eliminated. The rotor is made of laminated carbon fiber reinforced plastic.
The blade geometry and Reynolds-dependent polars at 39 radial stations are used in a computational model of the rotor in AeroDyn15, where aerodynamic calculations are based on dynamic blade-element momentum theory (BEM). The aerodynamic model is embedded in an OpenFAST (v3.3.0) model of the wind turbine that simulates the structural dynamics of blades and tower, and servo dynamics. The OpenFAST model is utilized for cross-validation of the rotor aerodynamic response measured in the wind tunnel and to develop closed-loop control strategies.

2.3. Closed-Loop Control

A variable-speed control strategy is used to regulate power when the turbine is below rated wind speed. The control goal is to maximize power by operating rotor at design blade pitch and TSR. Blade pitch is fixed to 0 and generator torque is regulated to achieve the design TSR of 7.5. This is traditionally done making generator torque proportional to squared generator speed [21], Q g = k ω 2 . The constant k is:
k = π ρ R 5 C P , max 2 λ 0 3 τ g 3 η g ,
where ρ is air density, R is rotor radius, C P , max the maximum power coefficient, λ 0 the TSR where the maximum power coefficient is achieved, τ g is the gearbox transmission ratio, and η g the gearbox efficiency. Calculation of k requires a priori knowledge of the rotor aerodynamic behavior, in particular of C P ( λ ) , which is assumed to be independent on wind speed. This modeling assumption is not needed if TSR is regulated with feedback control, the so called TSR tracking [22]:
Q g = k p ( ω g , s ω g ) + k i 0 T ( ω g , s ω g ) d t ,
where k p and k i are the proportional and integral gains, and ω g , s is the generator speed set point:
ω g , s = τ g λ 0 u ^ R .
u ^ is the rotor effective wind speed. An estimate of u ^ is needed for TSR tracking control, and this is obtained by means of a wind speed estimator or from measurement of the upwind pitot tube placed at hub height. The estimator we consider here is Immersion & Invariance with the formulation of [23], which is based on the drivetrain dynamic torque balance. The generator speed setpoint of Equation (3) is saturated to ω g , max = ω e τ g , with ω e = 9.6 λ v / λ L rpm. For wind speeds above rated, rotor speed is kept constant and torque increases: power increases until the turbine stalls [24].

2.4. Actuators, Sensors, and Mechanical Design

The wind turbine generator is an electric motor selected to fit the rotor power-rpm characteristic. Preliminary simulations have shown the maximum power coefficient at the rated wind speed (i.e., 11.4 λ v = 5.6 m/s) and TSR = 7.5 is C P , max = 0.39 , that yields 47 W of power. The generator torque requirement at rotor side is 0.63 Nm at 713 rpm. To satisfy this requirement, a brushless DC motor Maxon EC-4pole-30 is selected. The motor is coupled with the Maxon GP 32C planetary gearbox with ratio τ g = 12 and efficiency η g = 0.8 . With this configuration, the generator is capable of 1.15 Nm of torque at rotor side for rotor speed of 1342 rpm. Generator speed is measured with the encoder HEDL 5540 and this signal is used for closed-loop control. The electric motor is controlled by the Maxon ESCON 70/10 and is operated as a generator. The electric motor can be controlled in speed, with user defined speed set point, or in torque, and the torque set point is computed with the variable-speed control strategy.
The generator-gearbox unit is fixed to a support frame, mounted on top of the tower. The tower is a carbon fiber tube of 30 mm diameter and 0.7 m height, the hub-height is 0.8 m. An ATI Mini45 SI-580-20 6-components force transducer is mounted at tower-top and measures the tower-nacelle interface forces.

2.5. Experimental and Simulation Setup

The aerodynamic response of the scale model rotor is assessed with wind tunnel experiments and the setup is shown in Figure 2. Wind is generated according to the empty inlet configuration of Figure 1 and the undisturbed wind velocity is measured with a pitot tube placed 4 m upstream of the turbine rotor, centerline, hub-height. Rotor thrust and torque measurements are obtained from the tower-top load cell and generator speed is measured with the encoder. The wind turbine controller is composed of the variable-speed controller and the interface with external signals, it is written in MATLAB Simulink and compiled to run on a National Instrument (NI) PXI embedded control system. All measurements and control inputs are acquired simultaneously with a NI DAQ.
Simulations are run with the OpenFAST model to develop the turbine control strategy. Wind tunnel tests are simulated and compared to experimental measurements to assess any deviation of the physical rotor from its design and to verify the capability of OpenFAST to capture the aerodynamic behavior of the turbine scale model. In OpenFAST the turbine blades and tower are rigid, aerodynamics rotor loads are computed with BEM theory with dynamic inflow model with unsteady airfoil aerodynamics, wind is uniform in space. Simulations with closed-loop control use the same Simulink controller of the experiment that is run in co-simulation with OpenFAST.

3. Results

First, results of the rotor design are presented: 2D aerodynamic coefficients of the model blade airfoil, and the blade and rotor geometry. The rotor performance coefficients are measured for different TSR and Reynolds and compared to the DTU 10 MW and the OpenFAST of the turbine model. Based on this knowledge, the generator active-control strategies are discussed. Finally, the rotor aerodynamic response is assessed with wind tunnel testing and compared to the DTU 10 MW.

3.1. Rotor Design

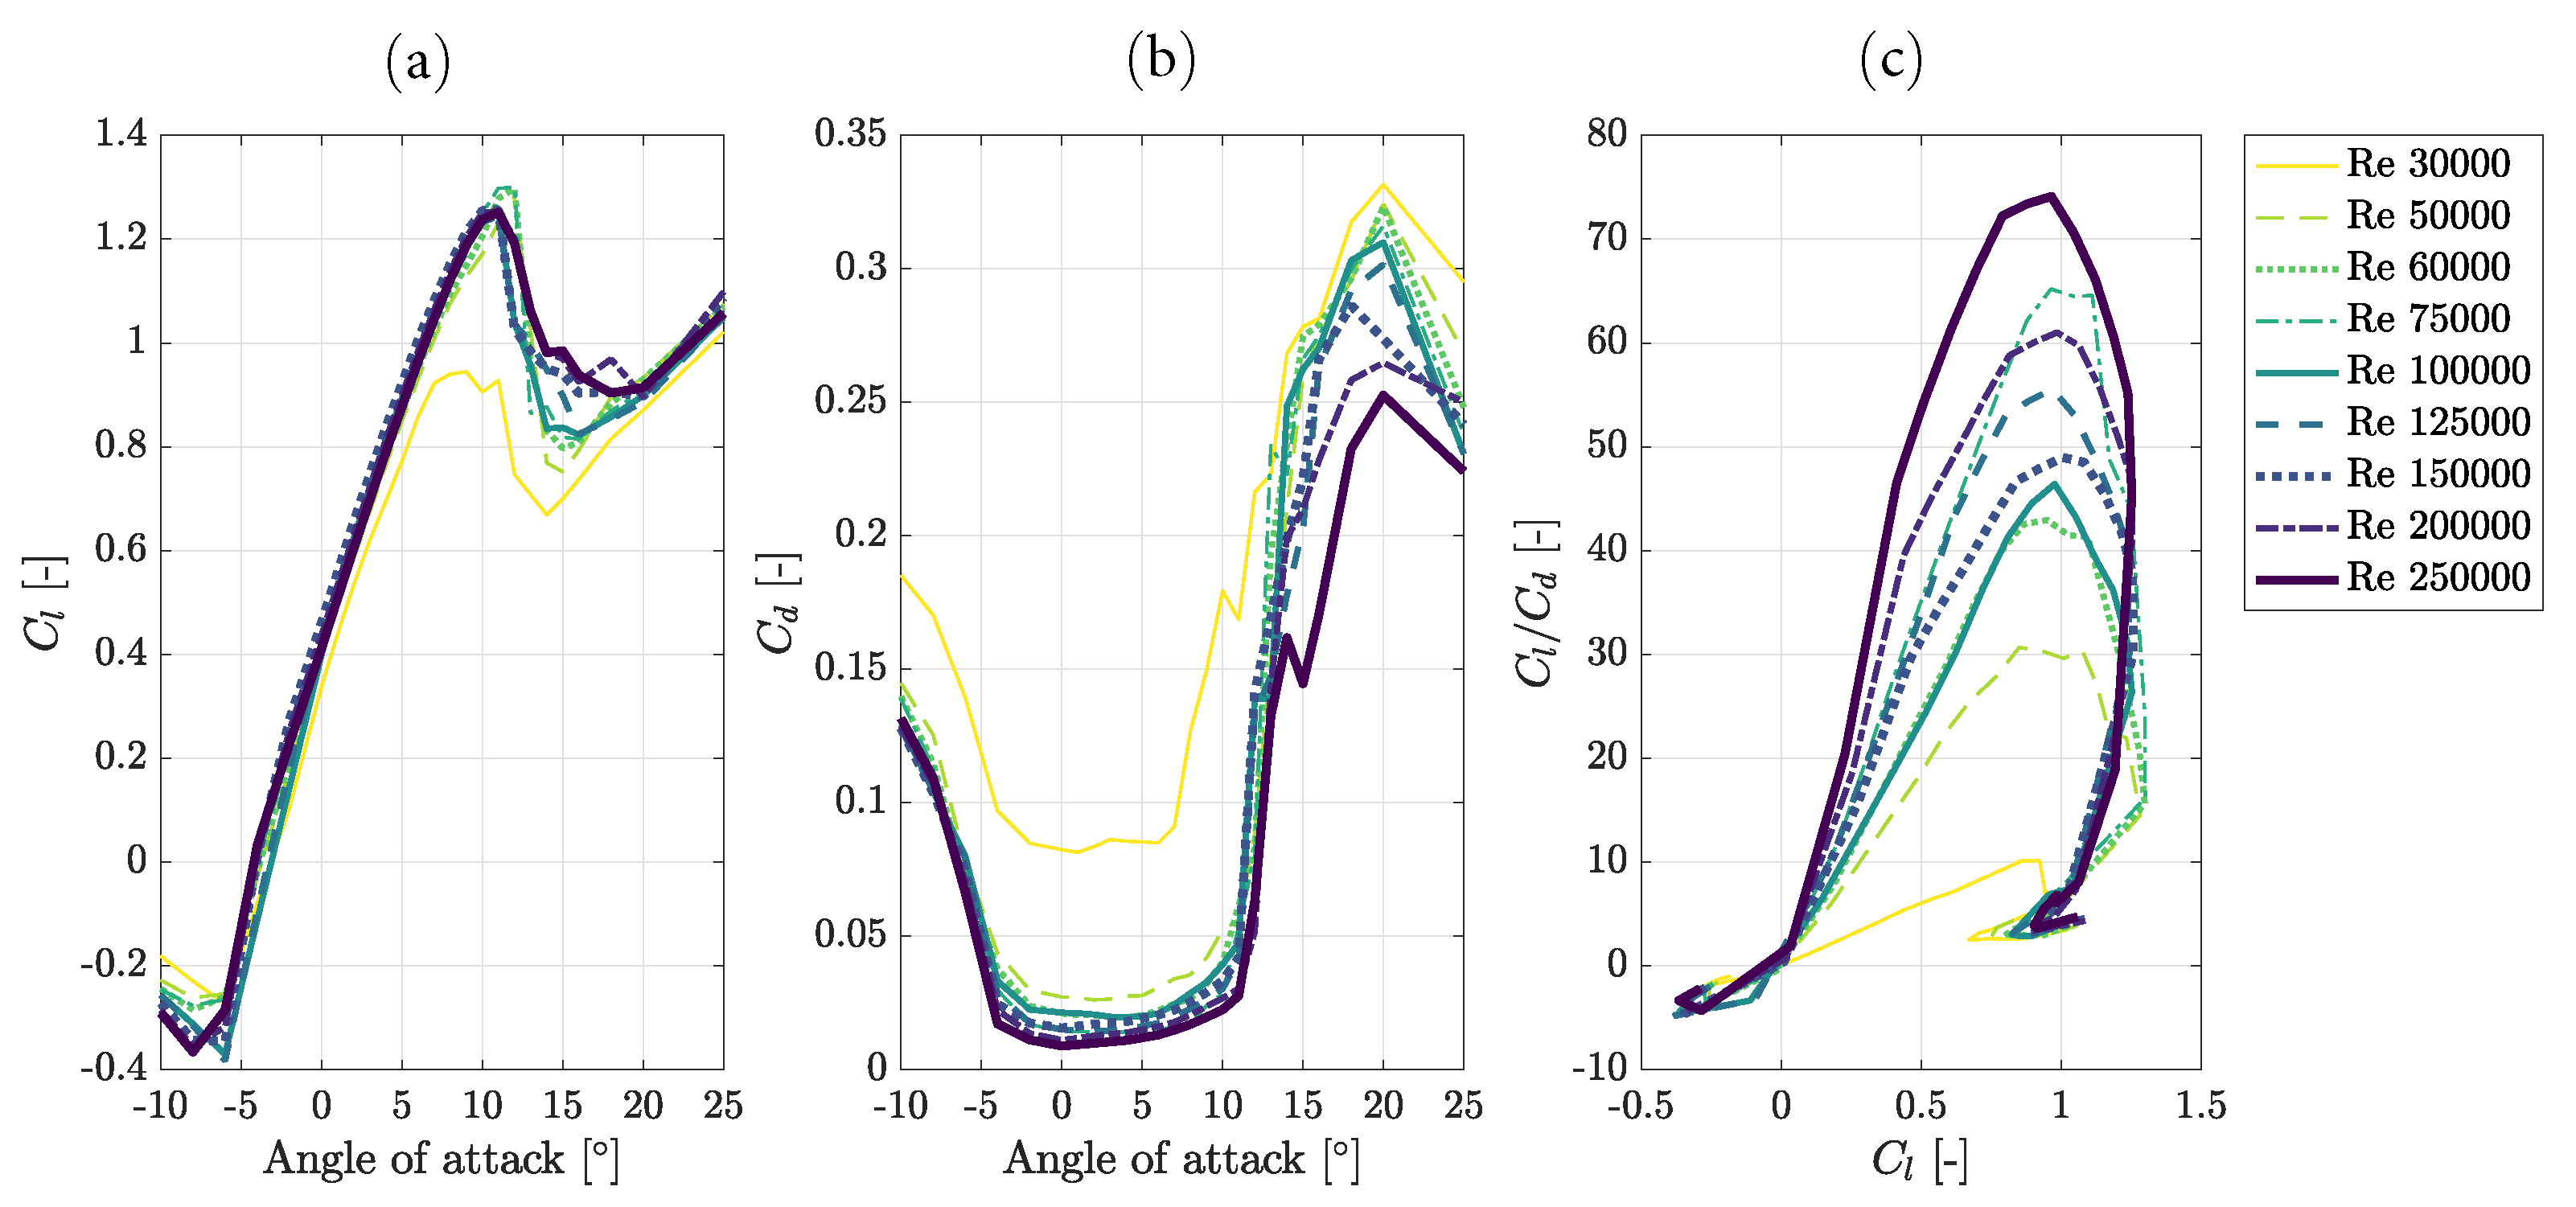
The rotor aerodynamic design and modeling is based on knowledge of Reynolds-dependent polars of the SD7032 airfoil. Results of 2D sectional model testing are reported in Figure 3. The lift coefficient C l is linear with AoA in attached flow conditions, and shows low dependence on R e . At R e 30 k stall occurs at lower AoA, the C l slope is slightly lower, and the stall behavior is milder. In the attached flow region, the dependence of C d on R e is low for R e > 30 k, whereas at R e = 30 k C d it is about 4 times higher than at higher R e . The profile efficiency is maximum for C l 1 , so for AoA close to 6 . The maximum lift-to-drag ratio of FFA airfoils in the outboard sections of the full-scale turbine blade is 70–100, for the SD7032 at R e = 100 k the maximum lift-to-drag ratio is 45 and drops rapidly for lower R e values.
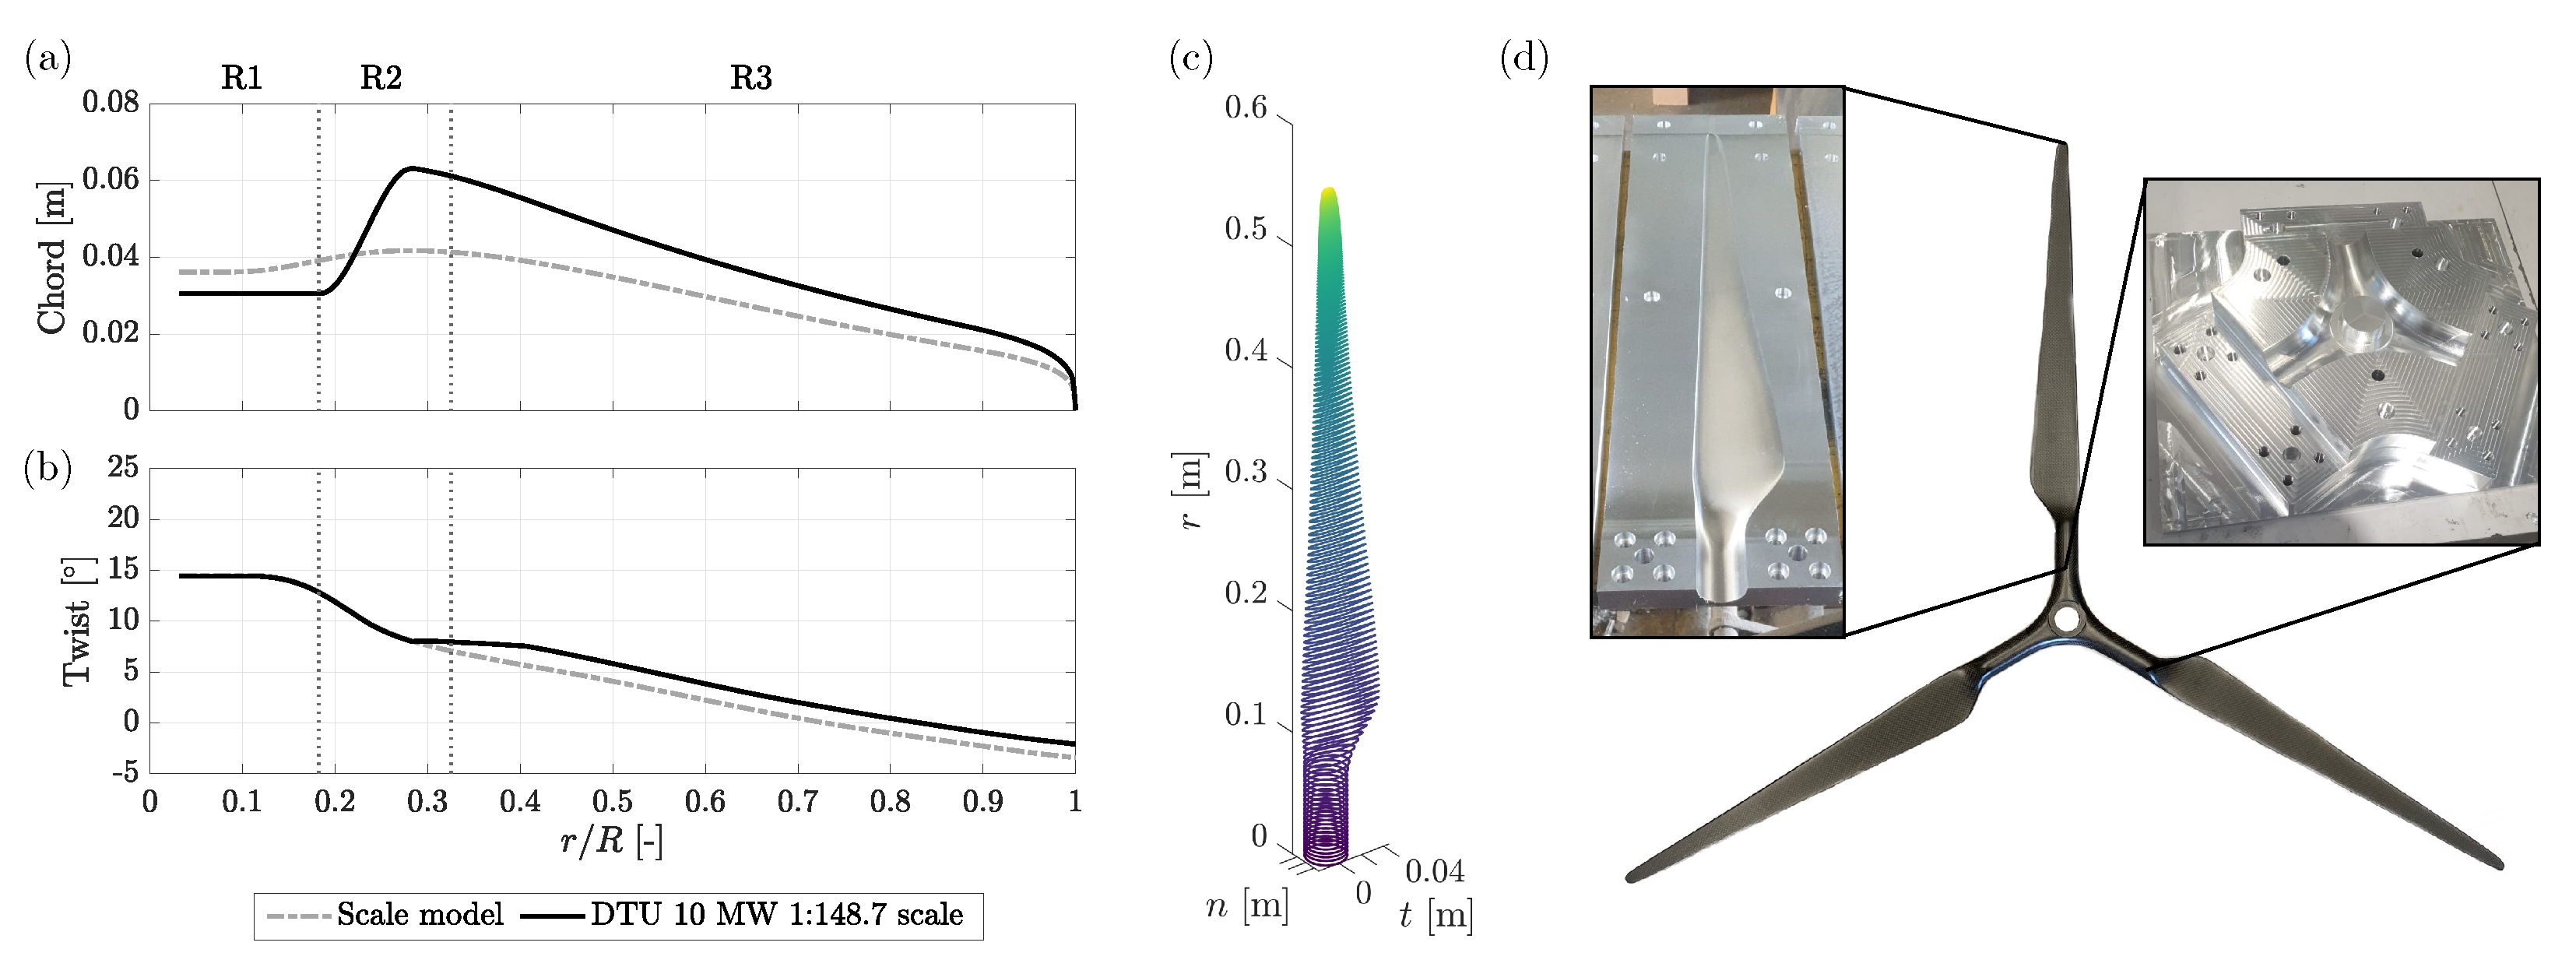
Figure 4 shows the 3D blade geometry, and its chord and thickness distributions which are compared to those of the DTU 10 MW at 1:148.7 scale. The operating point of blade design is characterized by TSR = 7.5, collective pitch of 0 , wind speed of 11.4 λ v . The scale model blade has three span regions: R1 ( r / R < 0.18 ) where the airfoil is circular (relative thickness 100%), R3 ( r / R > 0.32 ) where the SD7032 with relative thickness 9.97% is used, and R2 where section gradually transitions from R1 to R3. Chord and twist distributions are altered by means of the blade design algorithm at radial stations with r [ 0.28 , 0.88 ] R ; outside this interval are equal to values at the nearest extremity of the interval. The maximum chord for the scale model blade is 63 mm, 1.5 times the maximum chord of the DTU 10 MW at 1:148.7 scale. The chord increment is required to compensate for the lift coefficient slope, lower for the SD7032 compared to the FFA airfoils of the full-scale turbine. Twist is lower for the scale model compared to the DTU 10 MW.
The mold is obtained from the blade surface which is divided in two halves along the leading and trailing edge. Each half of the mold is made in four parts to use a smaller volume of material. The central part is the rotor hub and half of the cylindrical root of the three blades; the three separate sub-molds of the blades are joined to the central sub-mold with pin connection. Carbon fiber layers are laminated inside the mold obtaining the two halves of the rotor, that are glued with epoxy resin. Blades are realized with this construction method due to their small thickness (thickness at r / R = 0.6 is 4 mm). The full-rotor weight is 0.49 kg, which is 7.1 times the mass target of Table 1. Mass scales with λ L 3 and the mass requirement is particularly strict for small-scale rotors. The scaled rotor mass is comparable to other off-the-shelf components in the nacelle (e.g., the generator and gearbox is 0.42 kg) and it is hard to reduce it further.
Performance coefficients of the scale model rotor are measured in smooth flow for several TSR and wind speed combinations. Wind speed is varied to assess the effect of Reynolds number. The thrust and power coefficient are:
C T = F x 1 2 ρ π R 2 v 2 , C P = M x ω r 1 2 ρ π R 2 v 3 ,
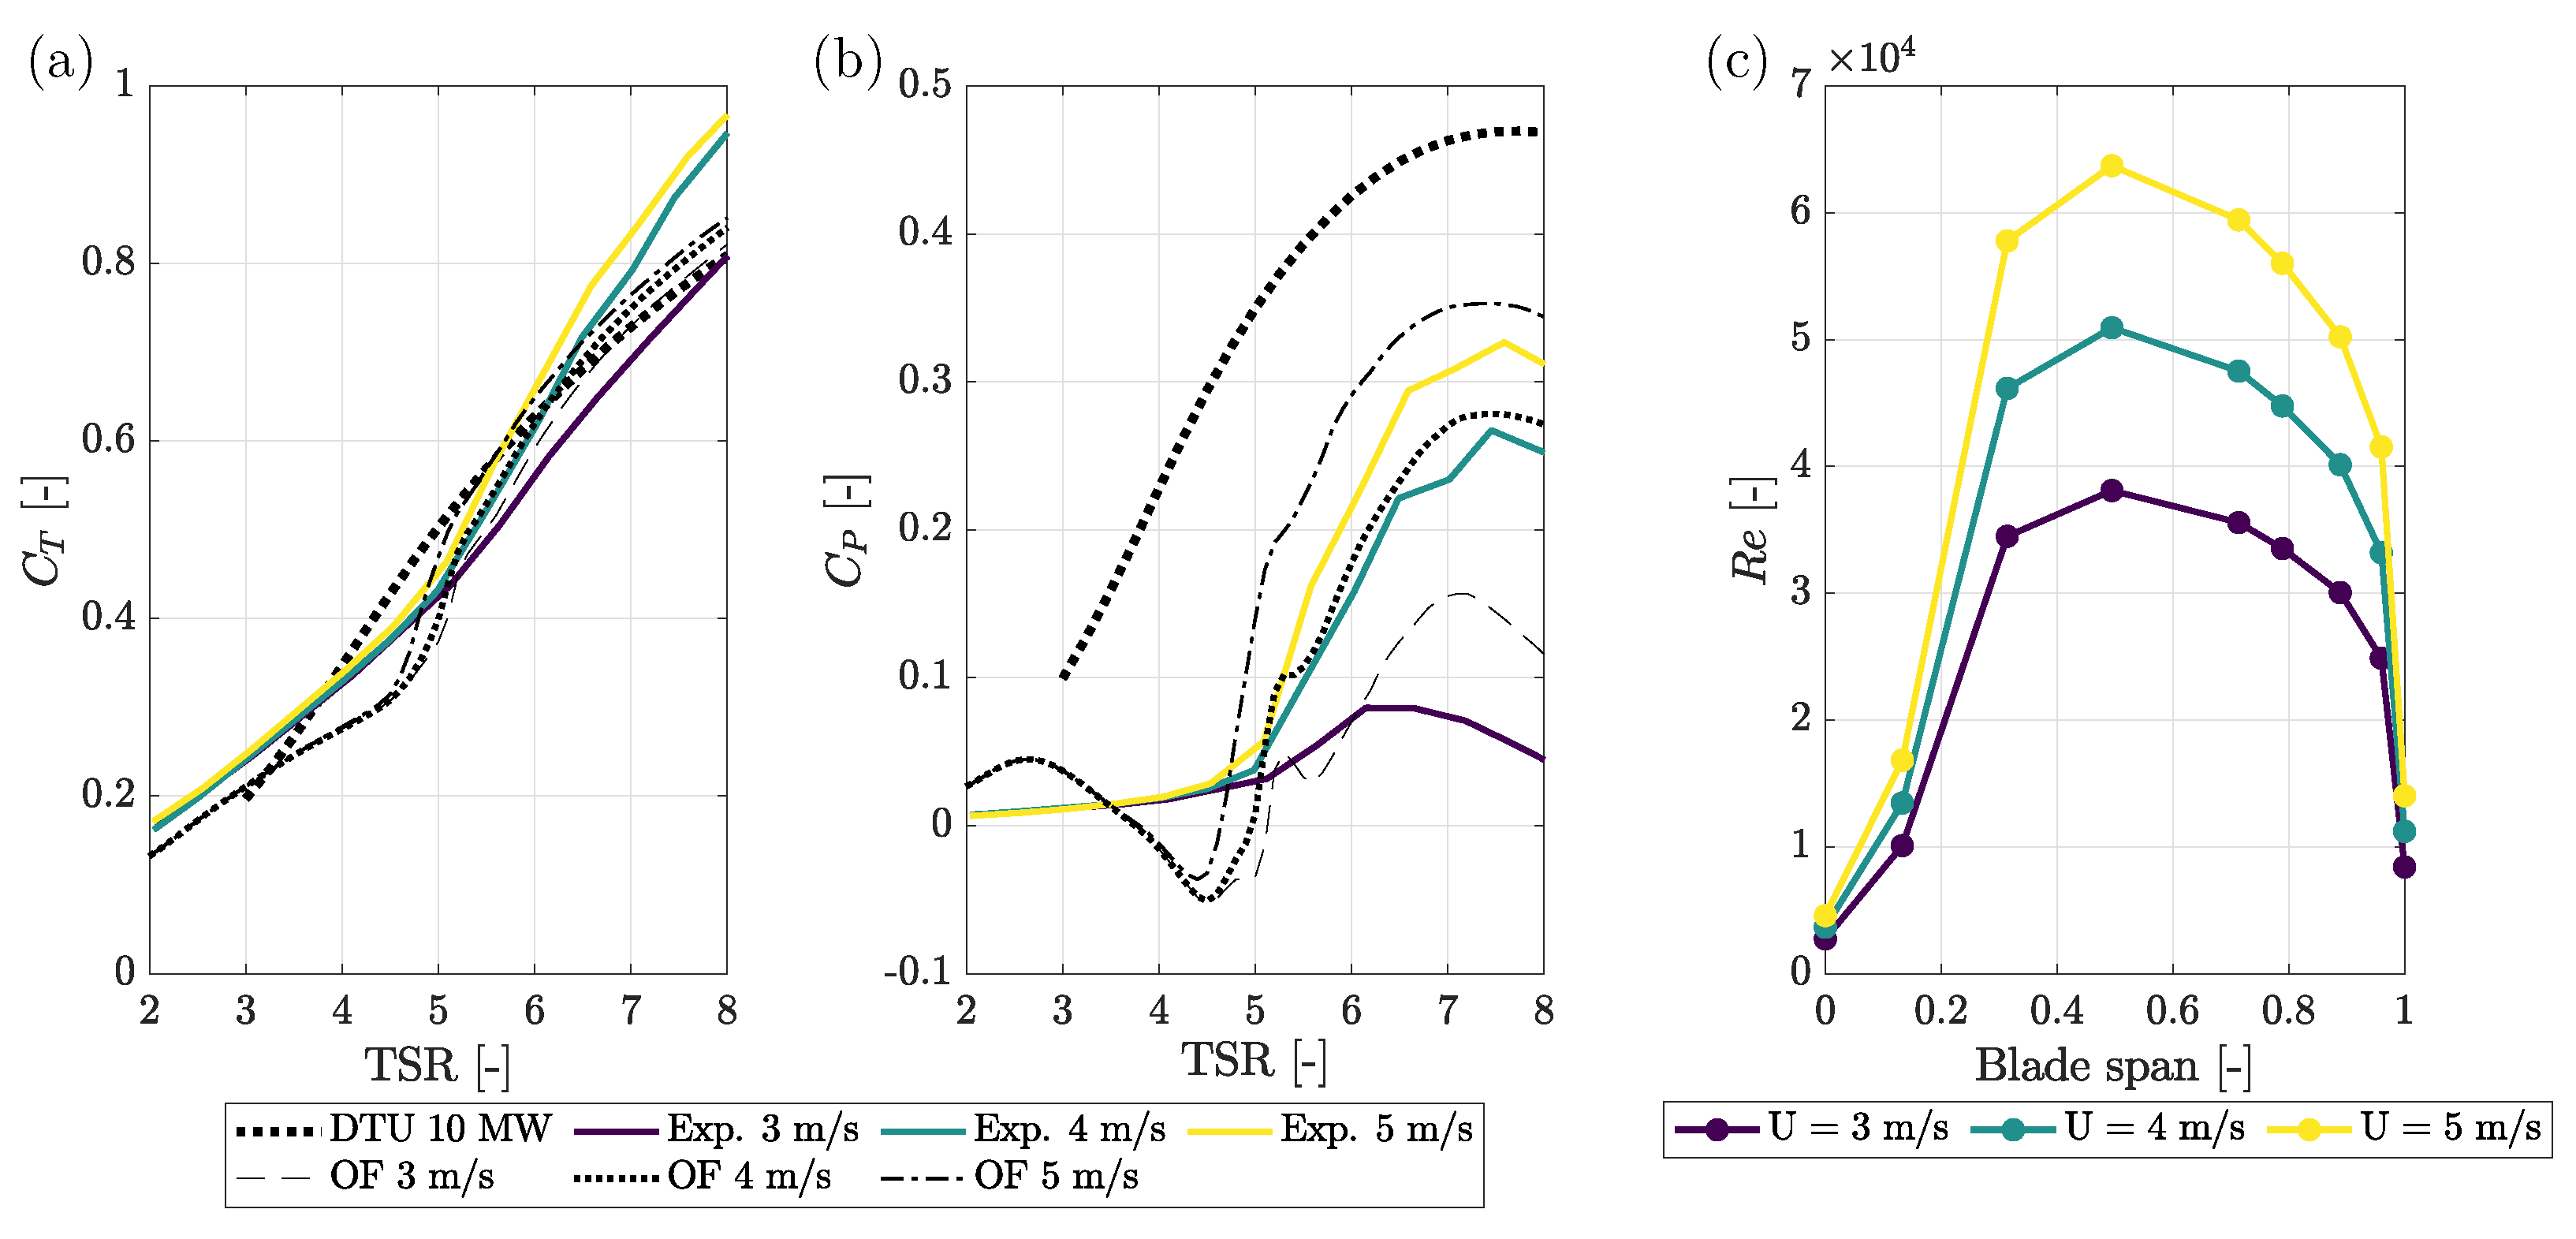
where F x and M x are the shear force and moment in the rotor axial direction measured at the tower-nacelle interface, and v the hub-height wind speed. Figure 5 shows coefficients measured in the wind tunnel that are compared to those obtained in equivalent simulations with the OpenFAST model and those of the DTU 10 MW. Coefficients of the DTU 10 MW are obtained from steady-state simulation in OpenFAST with various TSR values. The OpenFAST model of the DTU 10 MW [25] is based on 2D aerodynamic airfoil characteristics obtained with a computational fluid dynamics (CFD) method and 3D corrected; one airfoil polar is defined for each airfoil considering a representative R e value between 6 × 10 6 and 1.2 × 10 7 [12].
Curves at one wind speed (11.4 m/s) are shown for the DTU 10 MW because Reynolds-dependent aerodynamics is not considered in the OpenFAST model of the reference turbine. C T for the turbine scale model is insensitive to R e for TSR < 5 , and has low sensitivity for higher TSR, i.e., lower AoA. C T = 0.9 for design TSR = 7.5 , which is close to the DTU 10 MW. Power coefficient C P of the scale model turbine is instead sensitive to R e , and this is consequence of the 2D lift-to-drag ratio of Figure 3. At 3 m/s the chord- R e is 30–40 k for most of the blade, the lift-to-drag ratio drops, and C P is lower than 0.1. The maximum C P is achieved around TSR 7.5 , and its value increases with wind speed; at 5 m/s C P = 0.35 , whereas it is 0.48 for the DTU 10 MW. The maximum C P of the scaled turbine obtained in the experiment is lower than in OpenFAST. The shape of C P and C T of the OpenFAST model is correct for TSR > 5, whereas discrepancies are more evident at lower TSR (i.e., higher AoA, above stall for most of the blade), in particular for C P . This discrepancy can be due to a different stall behavior that is not captured by the numerical model. Low-Reynolds airfoils, as the SD7032 of the turbine model, have peculiar stall mechanisms associated with the formation of separation bubbles, for example cause of lift hysteresis [26]. These phenomena cannot be predicted by any computational method and are not captured by the OpenFAST model.

3.2. Active Generator Control

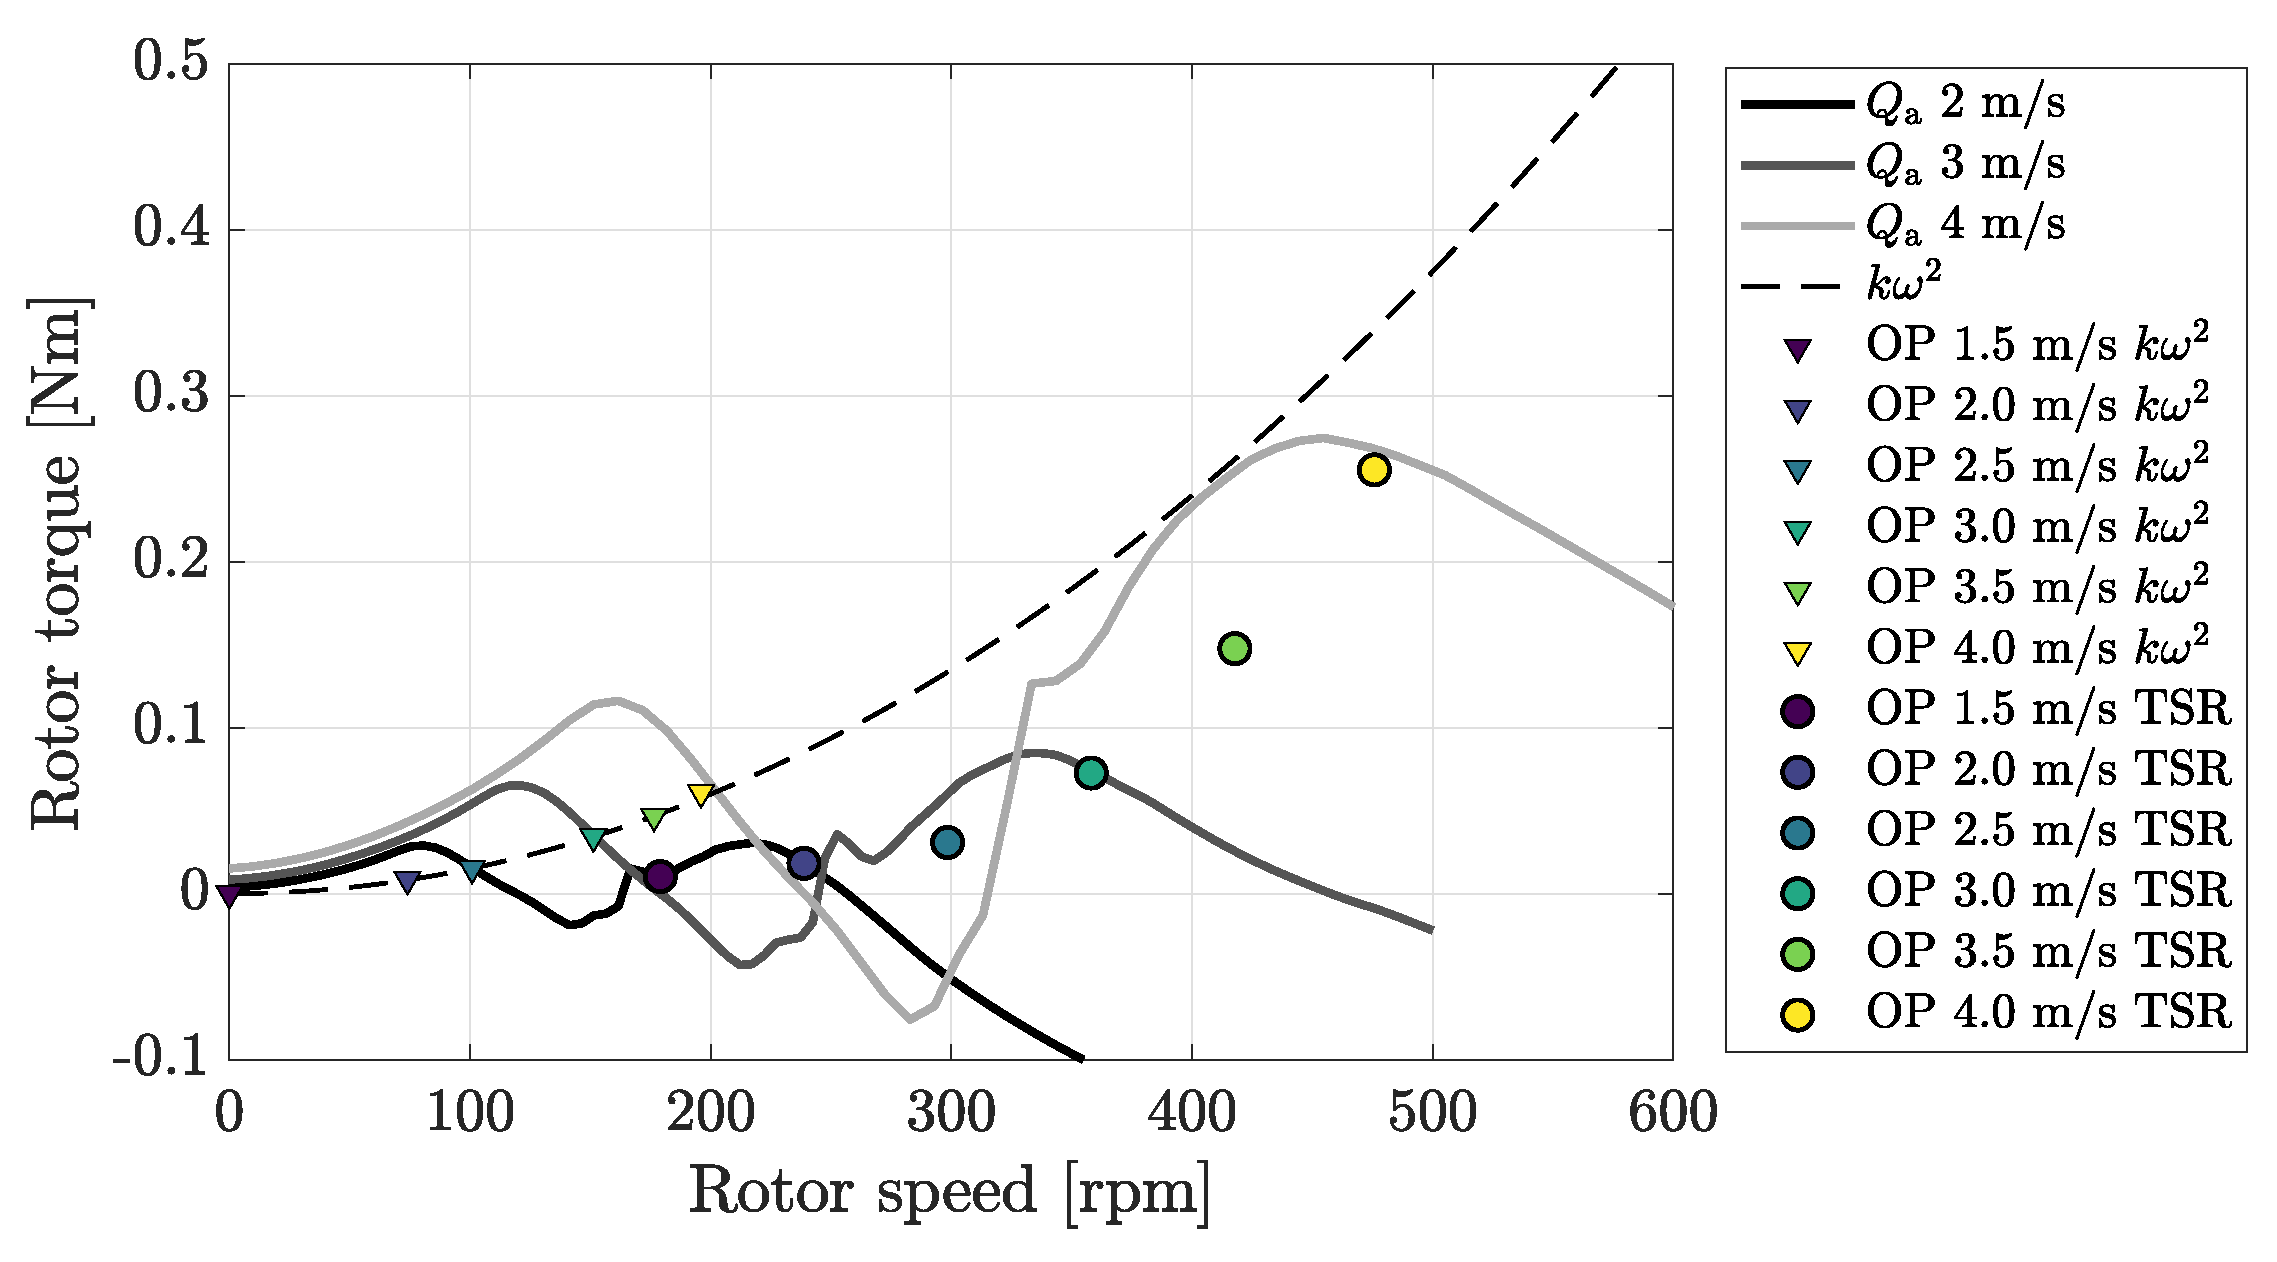
The generator control strategies k ω 2 and TSR tracking are tested in OpenFAST. Results are shown in Figure 6 in terms of operating points in the rotor speed-rotor torque plane. With TSR tracking, the wind turbine operates at design TSR of 7.5, where maximum C P is achieved. With k ω 2 , the operating points are at the intersections of Q r = k ω 2 τ g / η g with the aerodynamic torque curves, which are at TSR lower than 7.5. Calculation of the k ω 2 control trajectory of Equation (1) considers a single value of C P , max ( λ 0 ) , which is true for large turbines. In the turbine scale model case, C P , max and λ 0 are heavily influenced by Reynolds and aerodynamic torque is subjected to phenomena peculiar of low-Reynolds airfoils, as seen in Figure 5, and this behavior cannot be captured in k ω 2 control.
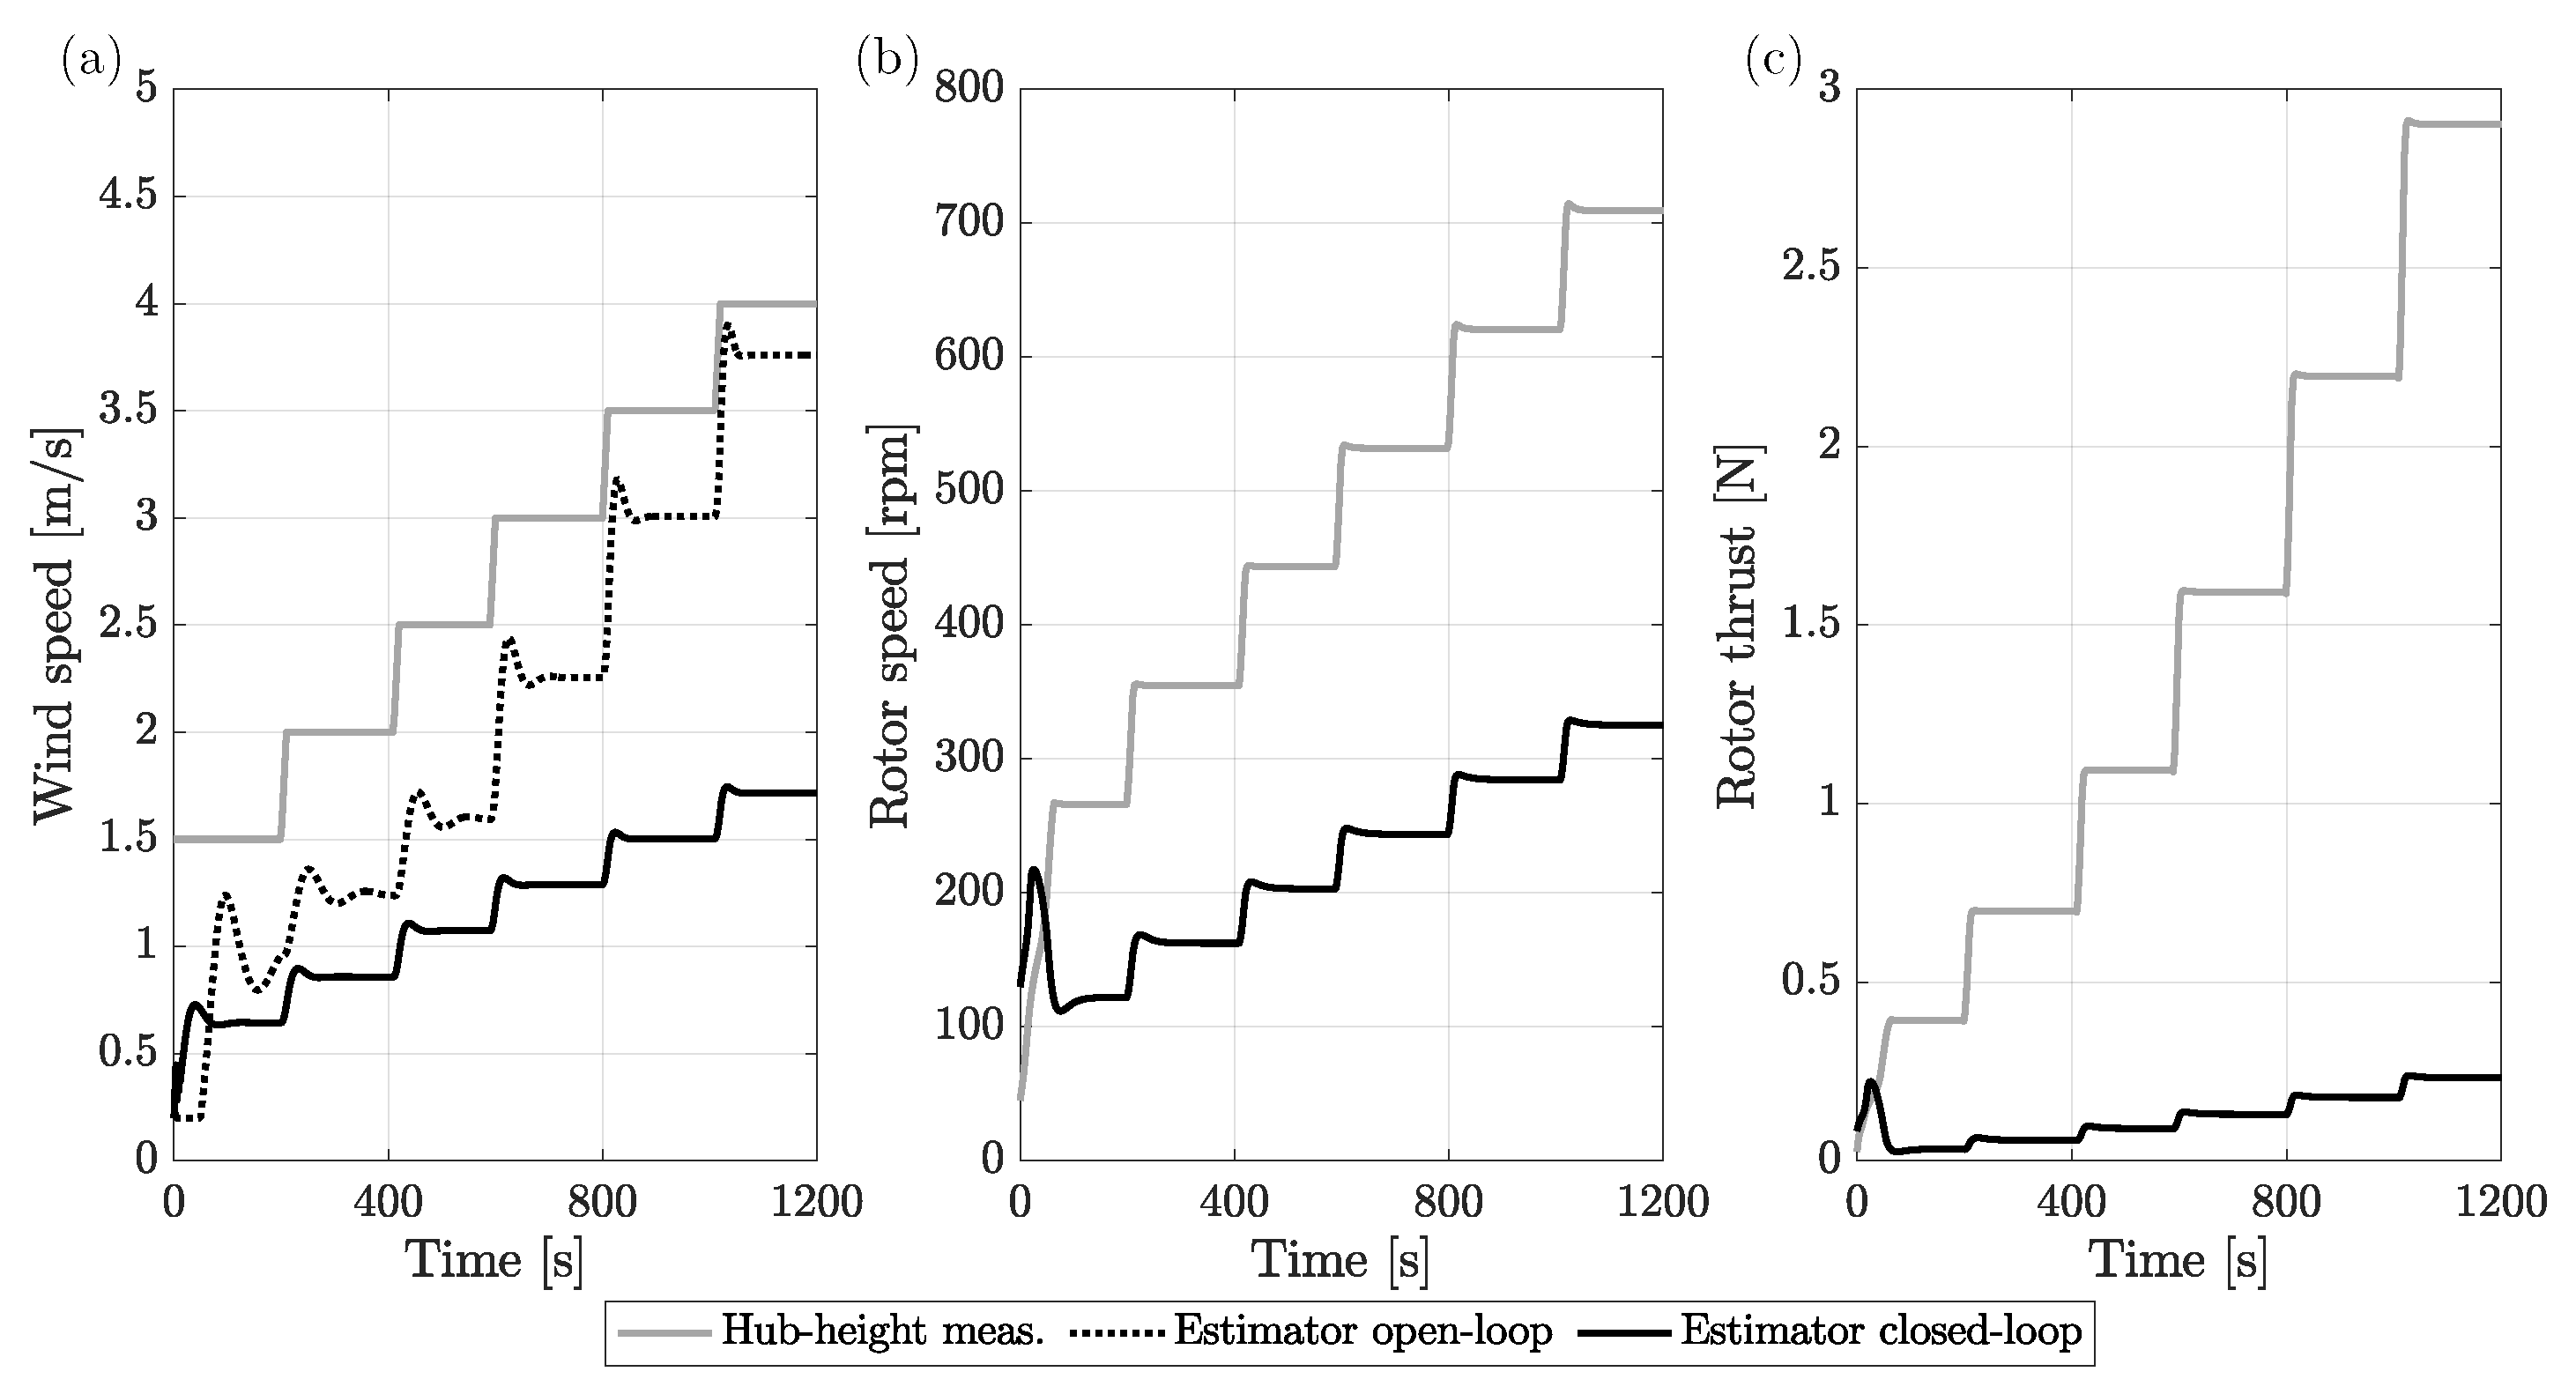
Wind speed needed for TSR tracking control of Figure 6 is obtained from the upwind pitot measurement. Alternatively, the estimate obtained with Immersion & Invariance can be used, and Figure 7 compares the turbine response in the two cases. A step wind case (from 1.5 to 4 m/s with 0.5 m/s steps) is simulated alternatively using the pitot measurement or the estimated wind speed as the controller input. In the first case, a wind speed estimate is also computed but not used in the controller. The average steady-state estimation error is 26%, it is maximum (37%) when wind speed is minimum, and minimum at 4 m/s (6%). The C P ( λ ) curve used in the estimator is not Reynolds-dependent, but the one at 4 m/s is used at any wind speed. In case of lower wind speeds, this curve overestimates the C P experienced by the turbine and, as a consequence, the estimator underestimates the effective wind speed. When the estimated wind speed is used as the controller input, the wind speed estimation error leads to significant errors in rotor speed and TSR, that are lower than expected. As a consequence of low TSR, the rotor thrust is not realistic. Based on these considerations, TSR tracking is used for control of the wind turbine scale model.

3.3. Verification of the Rotor Aerodynamic Response

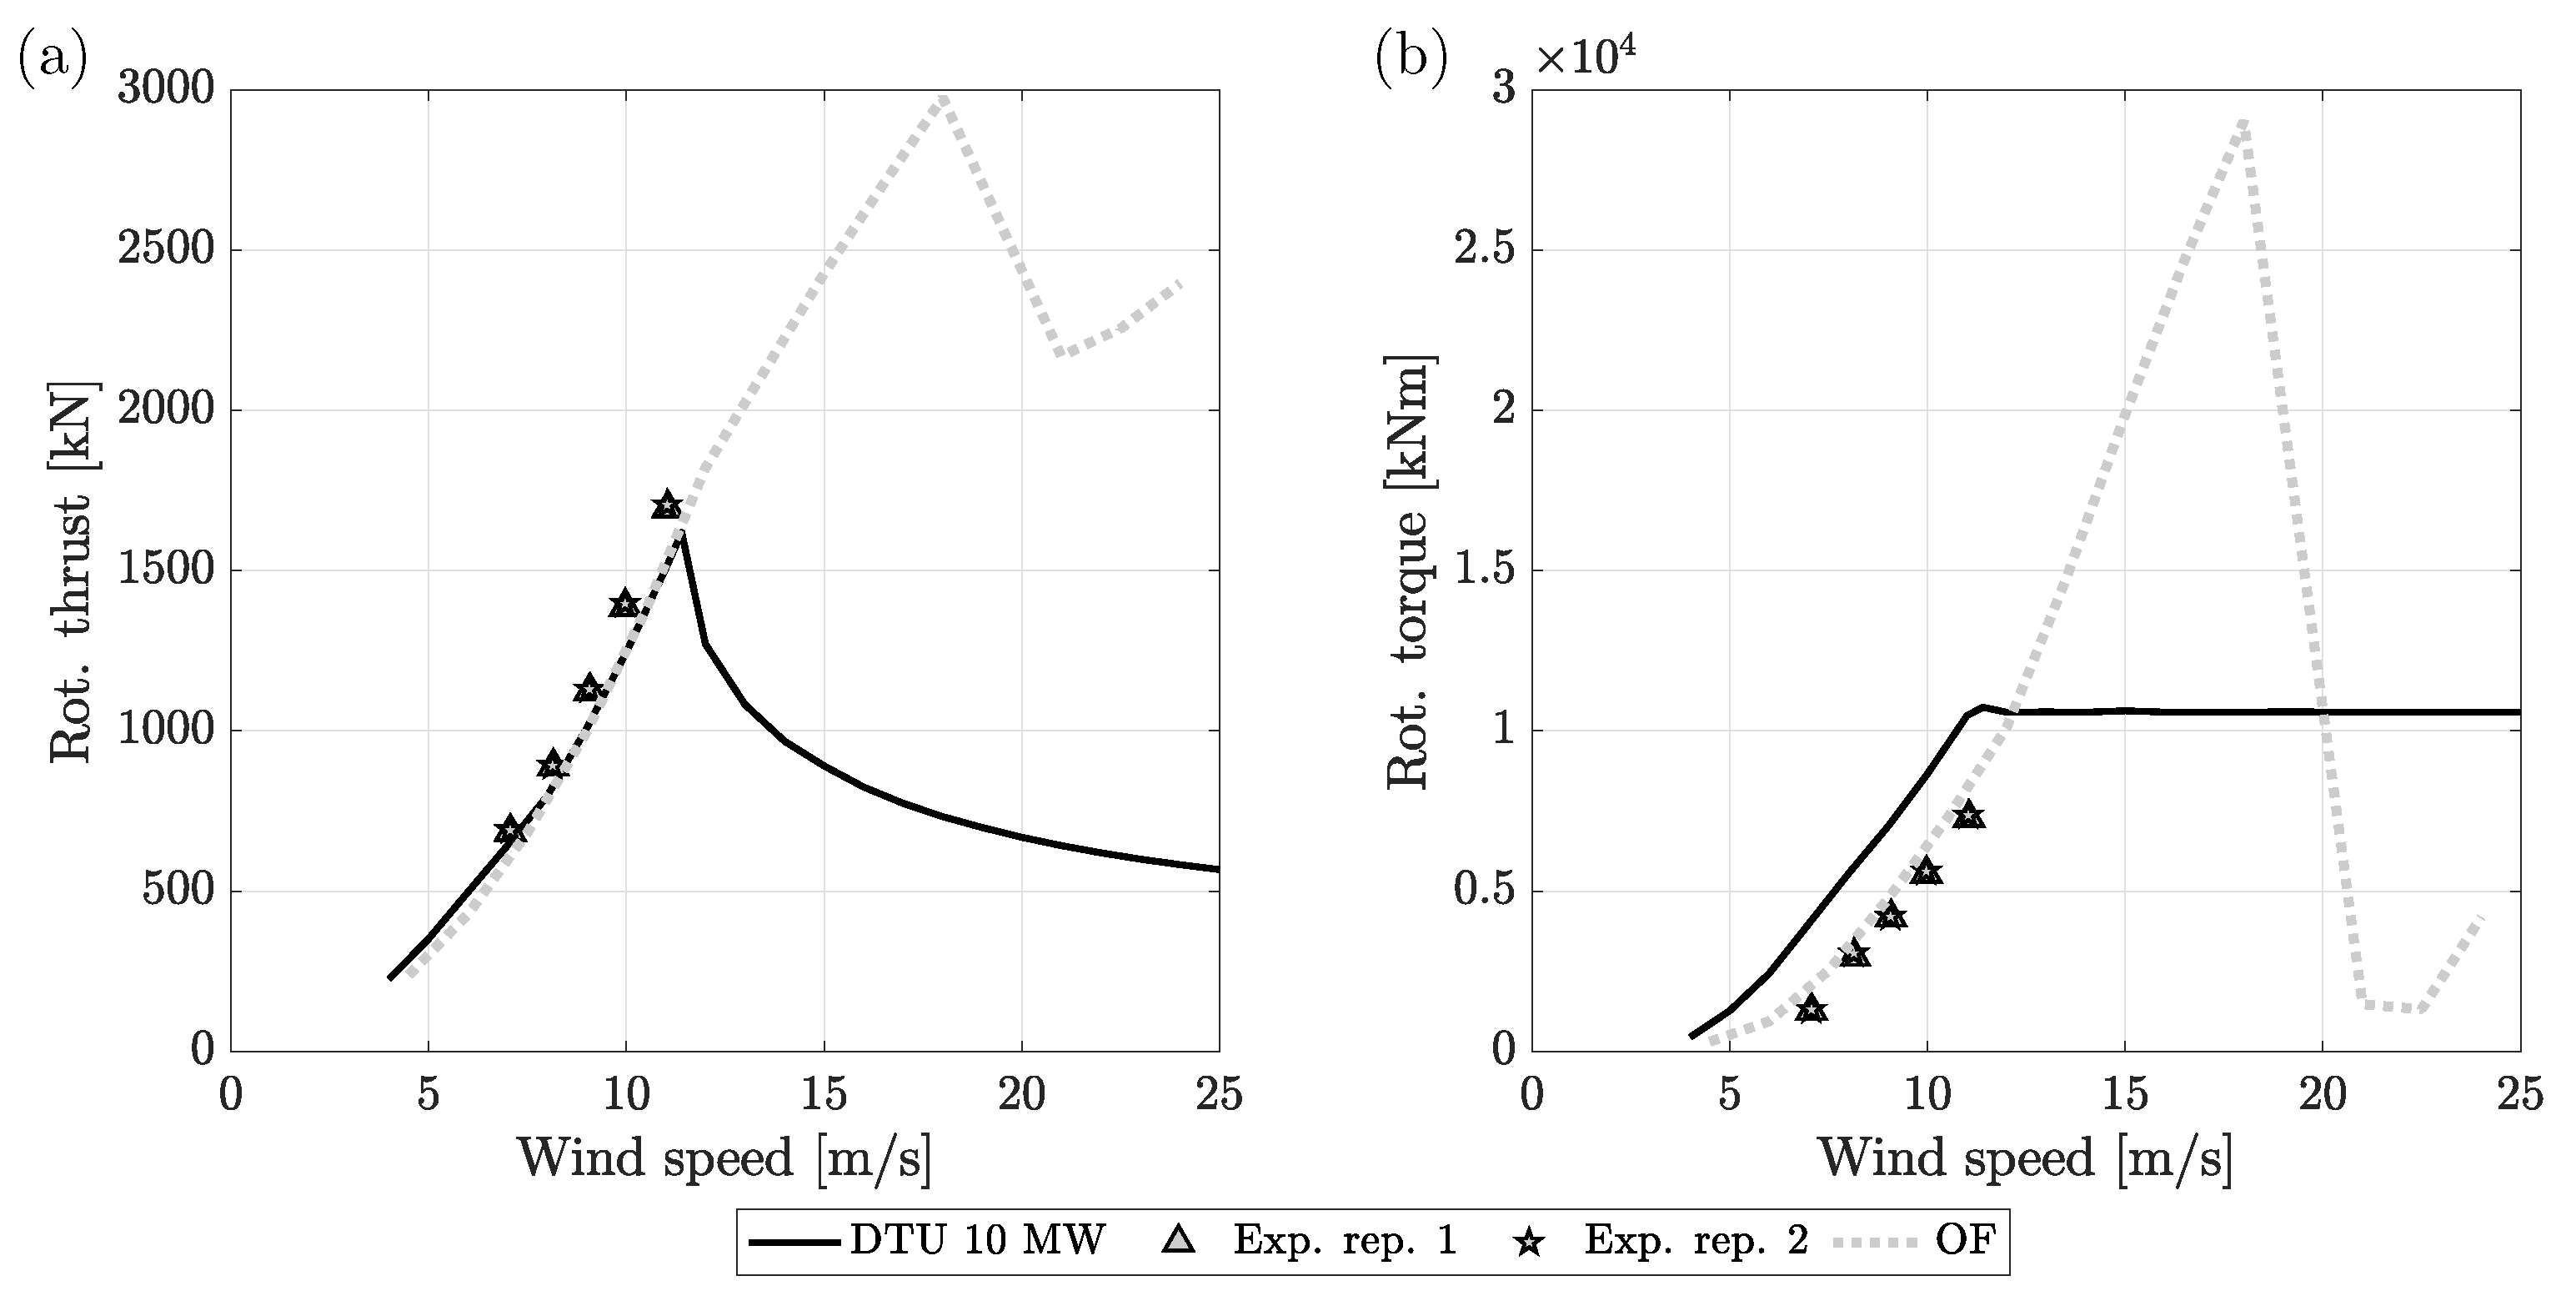
The scale model servo-aero-dynamic response is verified in below-rated wind (i.e., the condition considered for rotor design) with experiments and OpenFAST simulations. Steady-state rotor thrust and torque are measured for a number of wind speeds and compared (at full scale) in Figure 8 with nominal values for the DTU 10 MW and simulations with the OpenFAST model of the scaled turbine; measurements are repeated two times to have a rough assessment of their random uncertainty. In general, rotor thrust measurements are aligned to the DTU 10 MW curve. There is a slight difference between measurements and the OpenFAST model, which is perfectly overlapped to the reference turbine; the difference increases with wind speed and it is maximum at 11 m/s, where experimental values are 12% higher than target. The scale model torque is lower than target for any wind speed; this is consequence of the lower efficiency of the SD7032 compared to airfoils used in the DTU 10 MW blade; measurements are slightly below the OpenFAST model (12% lower at 11 m/s). Repeatability of experimental measurements is good for both thrust and torque. Simulations extend to the full-load region to verify the turbine model behavior for above-rated wind speeds. Contrary to the DTU 10 MW that adopts a variable-pitch control strategy, blade-pitch is fixed for the turbine scale model, and the response is not representative of the reference turbine. Torque and thrust increase with wind speed up to 19 m/s, when most of the blade reaches the stall angle, and torque drops abruptly for higher wind speeds. This behavior is different than in fixed-pitch utility-scale turbines [24], and is given by the SD7032 airfoil and the blade design, whose goal is to reproduce the full-scale aerodynamics in the partial load region.
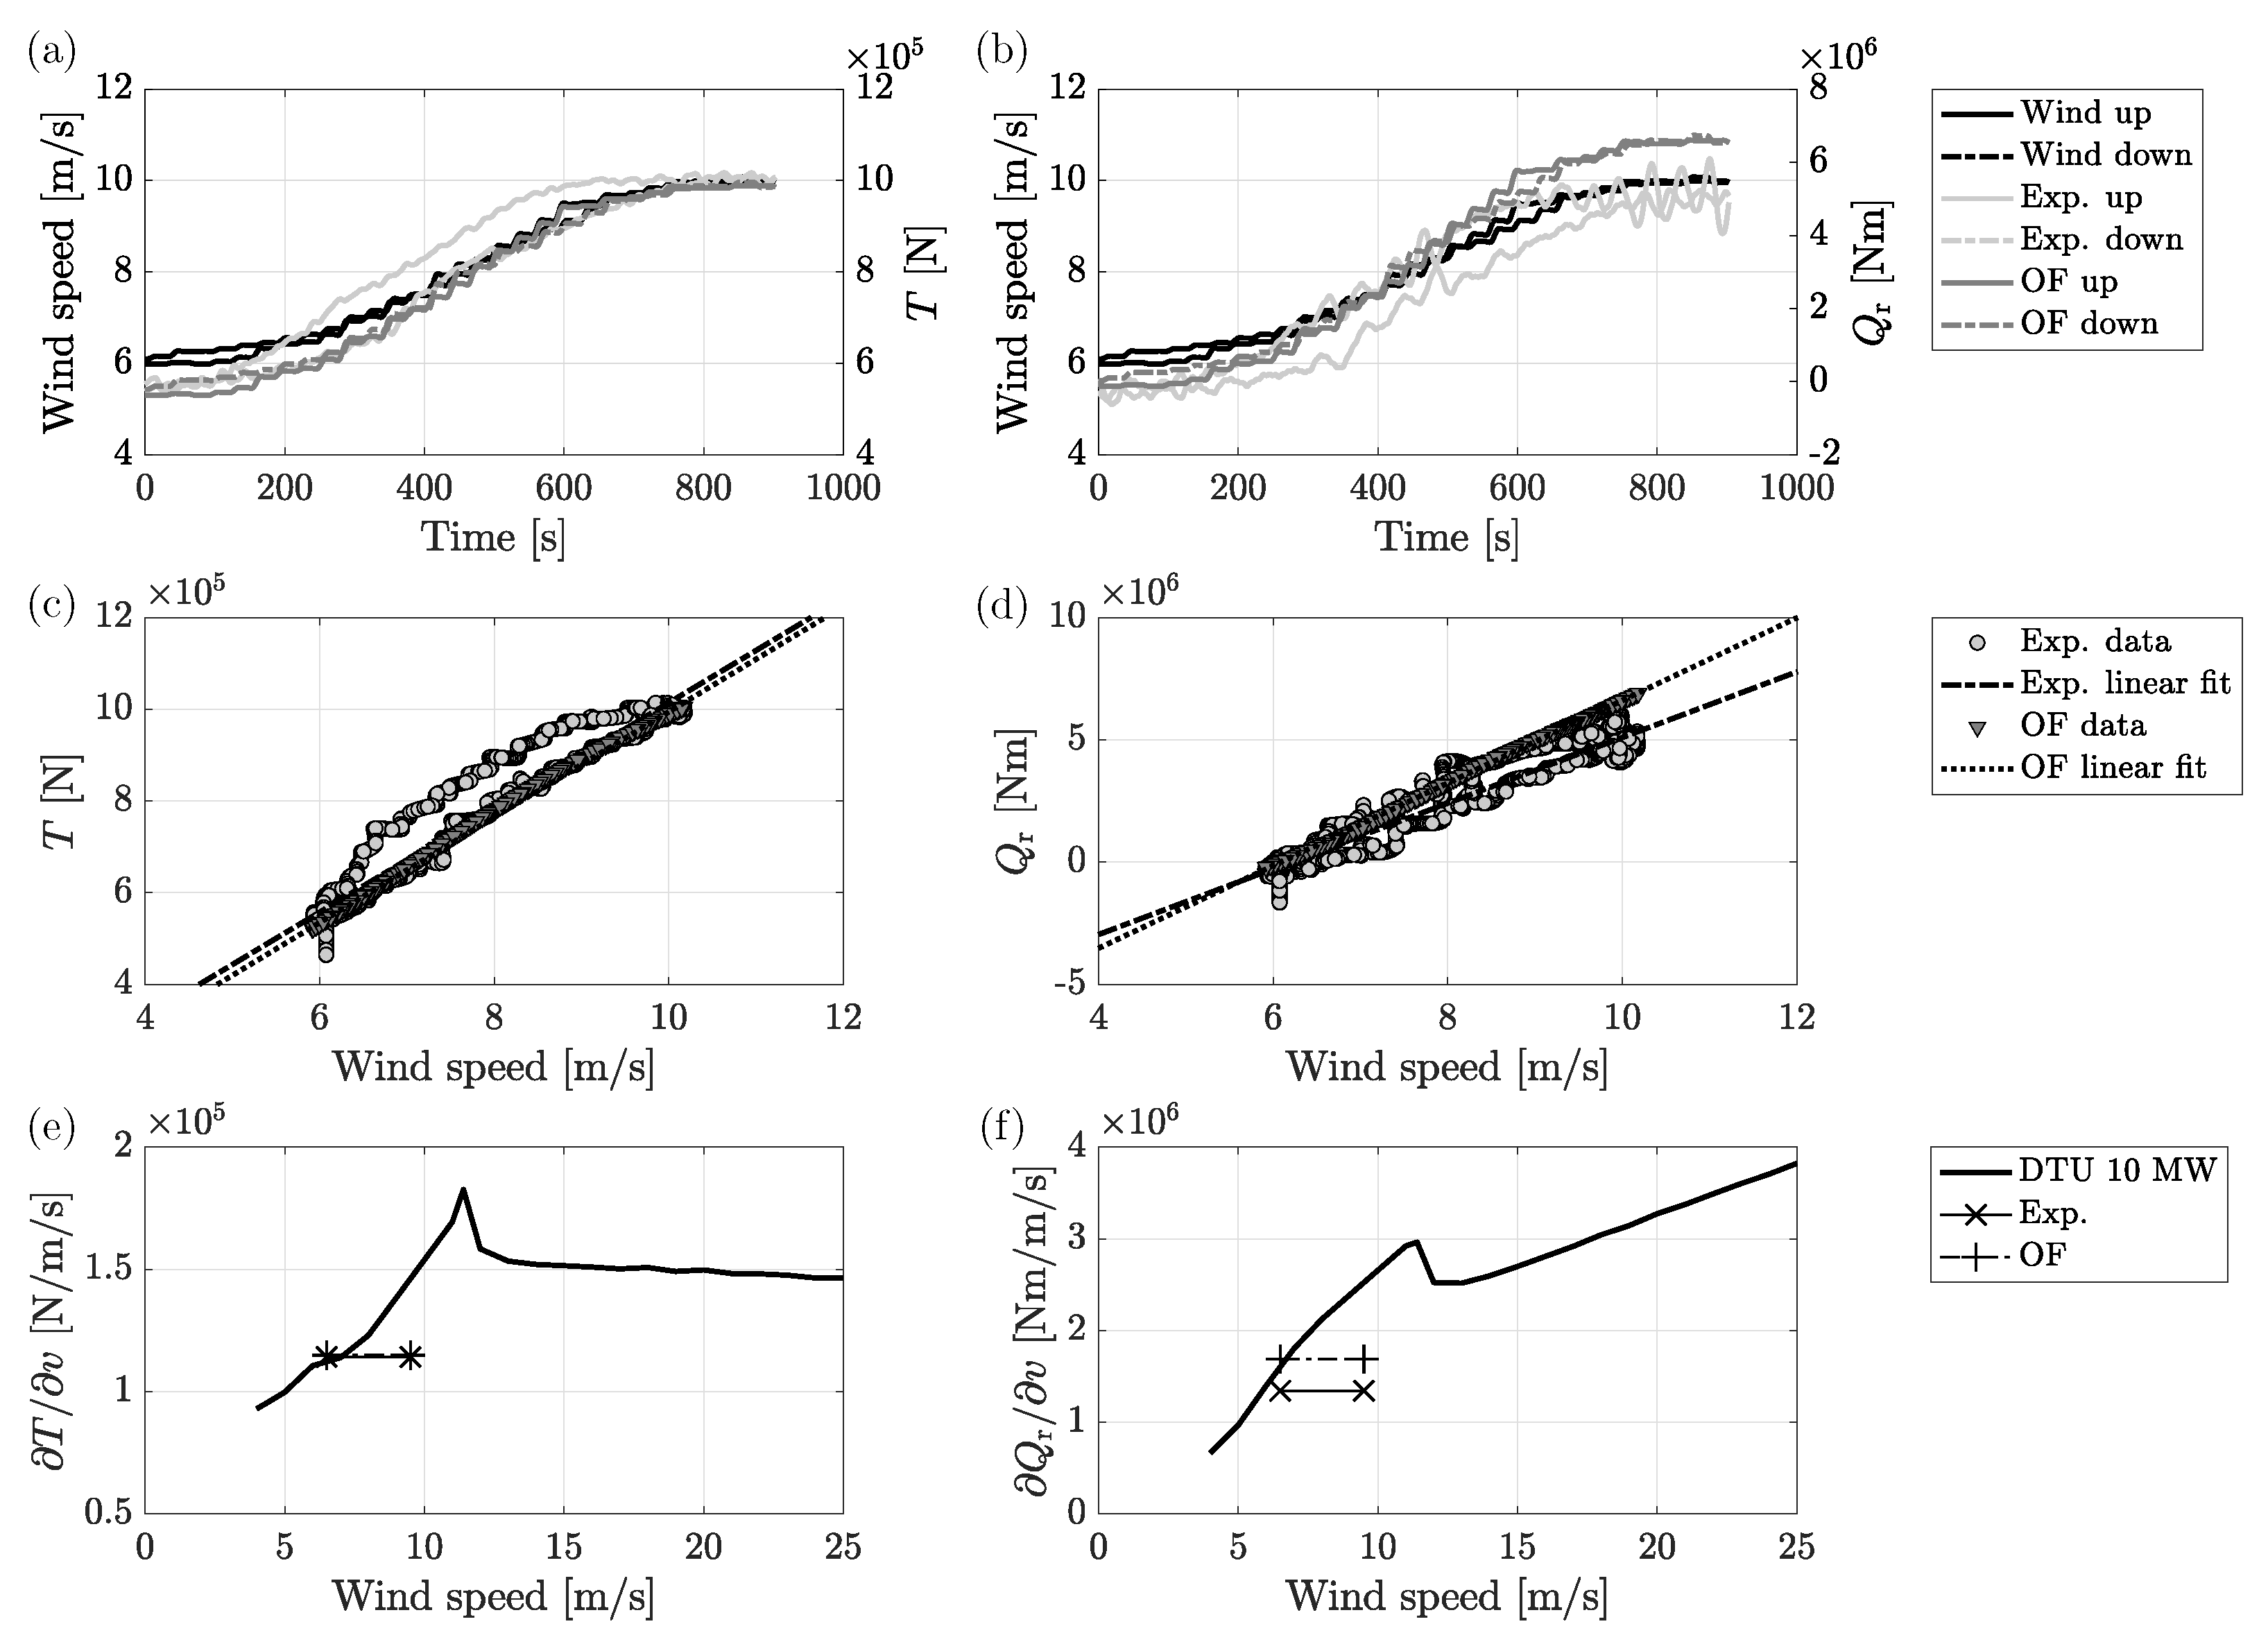
A wind-speed ramp case is used to assess the rotor unsteady response in terms of thrust and torque derivatives with respect to wind speed, often reported as aerodynamic sensitivities (e.g., see [24]). In this test, rotor speed is fixed and unsteadiness is due to wind speed only. The wind ramp is from 6 m/s to 10 m/s, ascending and descending. The wind speed range covered by the ramp at model scale is equal to 4 ± 1 m/s: the central value is chosen to be in the middle of the below-rated region and a variation of 1 m/s is considered to produce large enough variation of rotor loads. In the ramp, the minimum AoA for central sections of the blade is 1–4 and increases up to 8–10 (i.e., it is below the stall angle). Results are shown in Figure 9. The wind speed ramp is not linear with time, but shows the transient response of the wind tunnel. The ramp measured with the pitot tube is delayed of 0.6 s and included in the OpenFAST model as an external wind file to simulate the wind tunnel test (the delay is the time needed for the wind speed perturbation to propagate from the pitot to the turbine position, and it was measured with a second pitot tube placed in the rotor plane). The experimental response is approximately linear linear for wind speed between 6.5–9.5 m/s, but shows a small hysteresis loop that is more pronounced in the thrust force than in torque. The hysteresis is not present in OpenFAST, where the same response is obtained with increasing and decreasing wind, and may be explained as the effect of flow separation in attached flow that can occur in low-Reynolds airfoils [26]. Thrust and torque measured during the wind ramp are fitted with linear functions, whose slopes are the aerodynamic sensitivities. Slopes are constant for 6.5–9.5 m/s, thus the same sensitivity is valid for the speed interval. The thrust slope of OpenFAST is very close to the experiment, and the torque slope is slightly higher. Compared to the sensitivities of the DTU 10 MW, the thrust sensitivity is close to target (at 8 m/s it is 7% lower) and this is possible because lift derivate matching is included in the aerodynamic design. A larger difference is found instead for torque, which is 58% lower for the scale model compared to the DTU 10 MW at 8 m/s.

4. Discussion

In this paper we discussed the integrated design of a scale model rotor for wind tunnel testing, we investigated its aerodynamic response experimentally and with OpenFAST simulations. In the present case, the rotor is realized with fixed blade-pitch and is capable of reproducing the full-scale turbine only in below rated wind. With this choice, the scaled rotor has light weight, because it has no pitch regulation mechanisms. Moreover, being the pitch fixed, uncertainty in the aerodynamic response due to pitch setting is eliminated. In this study blades are realized with fixed-pitch, but the same blade design can be used in a pitch-regulated rotor. Despite the chord-based Reynolds number, lower than 100 k, the turbine aerodynamic response is similar to the full-scale turbine. The thrust force, which is the main design objective, is correctly reproduced in below rated wind with maximum deviation of 12%; power is lower than target, but the shape of power coefficient is similar to the full-scale turbine. Differently than in the full-scale turbine, the power coefficient is strongly affected by Reynolds, due to the behavior of the SD7032 airfoil used in the scaled blade.
This has consequences for the closed-loop control of rotor speed. TSR tracking is preferable to k ω 2 for small turbines, because k ω 2 implicitly assumes the power coefficient is not Reynolds dependent and does not account for aerodynamic phenomena typical of low-Reynolds airfoils. Improved performance is achieved with TSR tracking, but it requires an estimate of rotor effective wind speed. In wind tunnel testing, this is easily obtained from an upwind sensor (e.g., pitot tube at hub height); wind speed estimators based on torque balance, that are successfully used in utility-scale turbines, are not suitable for small turbines because they do not capture Reynolds-dependent aerodynamics. Future research may develop a wind speed estimator that account for Reynolds dependency of the turbine power coefficient.
A computational model of the rotor aerodynamics is created in AeroDyn-OpenFAST, based on the 2D polars also used for blade design. The numerical model predicts thrust coefficient with more accuracy than power coefficient, so blade lift is captured better than drag. The larger discrepancy with respect to experimental data is found at low TSR, possibly due to the rotor stall behavior. The difference in the power response introduces uncertainty when the numerical model is used for the development of rotor speed control strategies. Polars in the OpenFAST model can be corrected to improve accuracy with respect to the experiment, for example with the method of [27], but phenomena associated with separation in low-Reynolds airfoils remain difficult to capture.

Author Contributions

Conceptualization, A.F. and G.D.P.; methodology, A.F., G.D.P. and M.B.; software, A.F. and G.D.P.; validation, A.F. and G.D.P.; investigation, A.F. and G.D.P.; resources, A.F., G.D.P. and M.B.; data curation, A.F. and G.D.P.; writing—original draft preparation, A.F.; writing—review and editing, A.F.; visualization, A.F.; supervision, M.B.; project administration, M.B.; funding acquisition, M.B. All authors have read and agreed to the published version of the manuscript.

Funding

This research received no external funding.

Data Availability Statement

2D aerodynamic coefficients of the SD7032 airfoil used in the scale model blade are available at [18].

Conflicts of Interest

The authors declare no conflict of interest. The funders had no role in the design of the study; in the collection, analyses, or interpretation of data; in the writing of the manuscript; or in the decision to publish the results.

Abbreviations

The following abbreviations are used in this manuscript:
AoAAngle of Attack
DTUDanmarks Tekniske Universitet
OFOpenFAST
TSRTip Speed Ratio
POLIMIPolitecnico di Milano

Appendix A. Aerodynamic Model for Blade Design
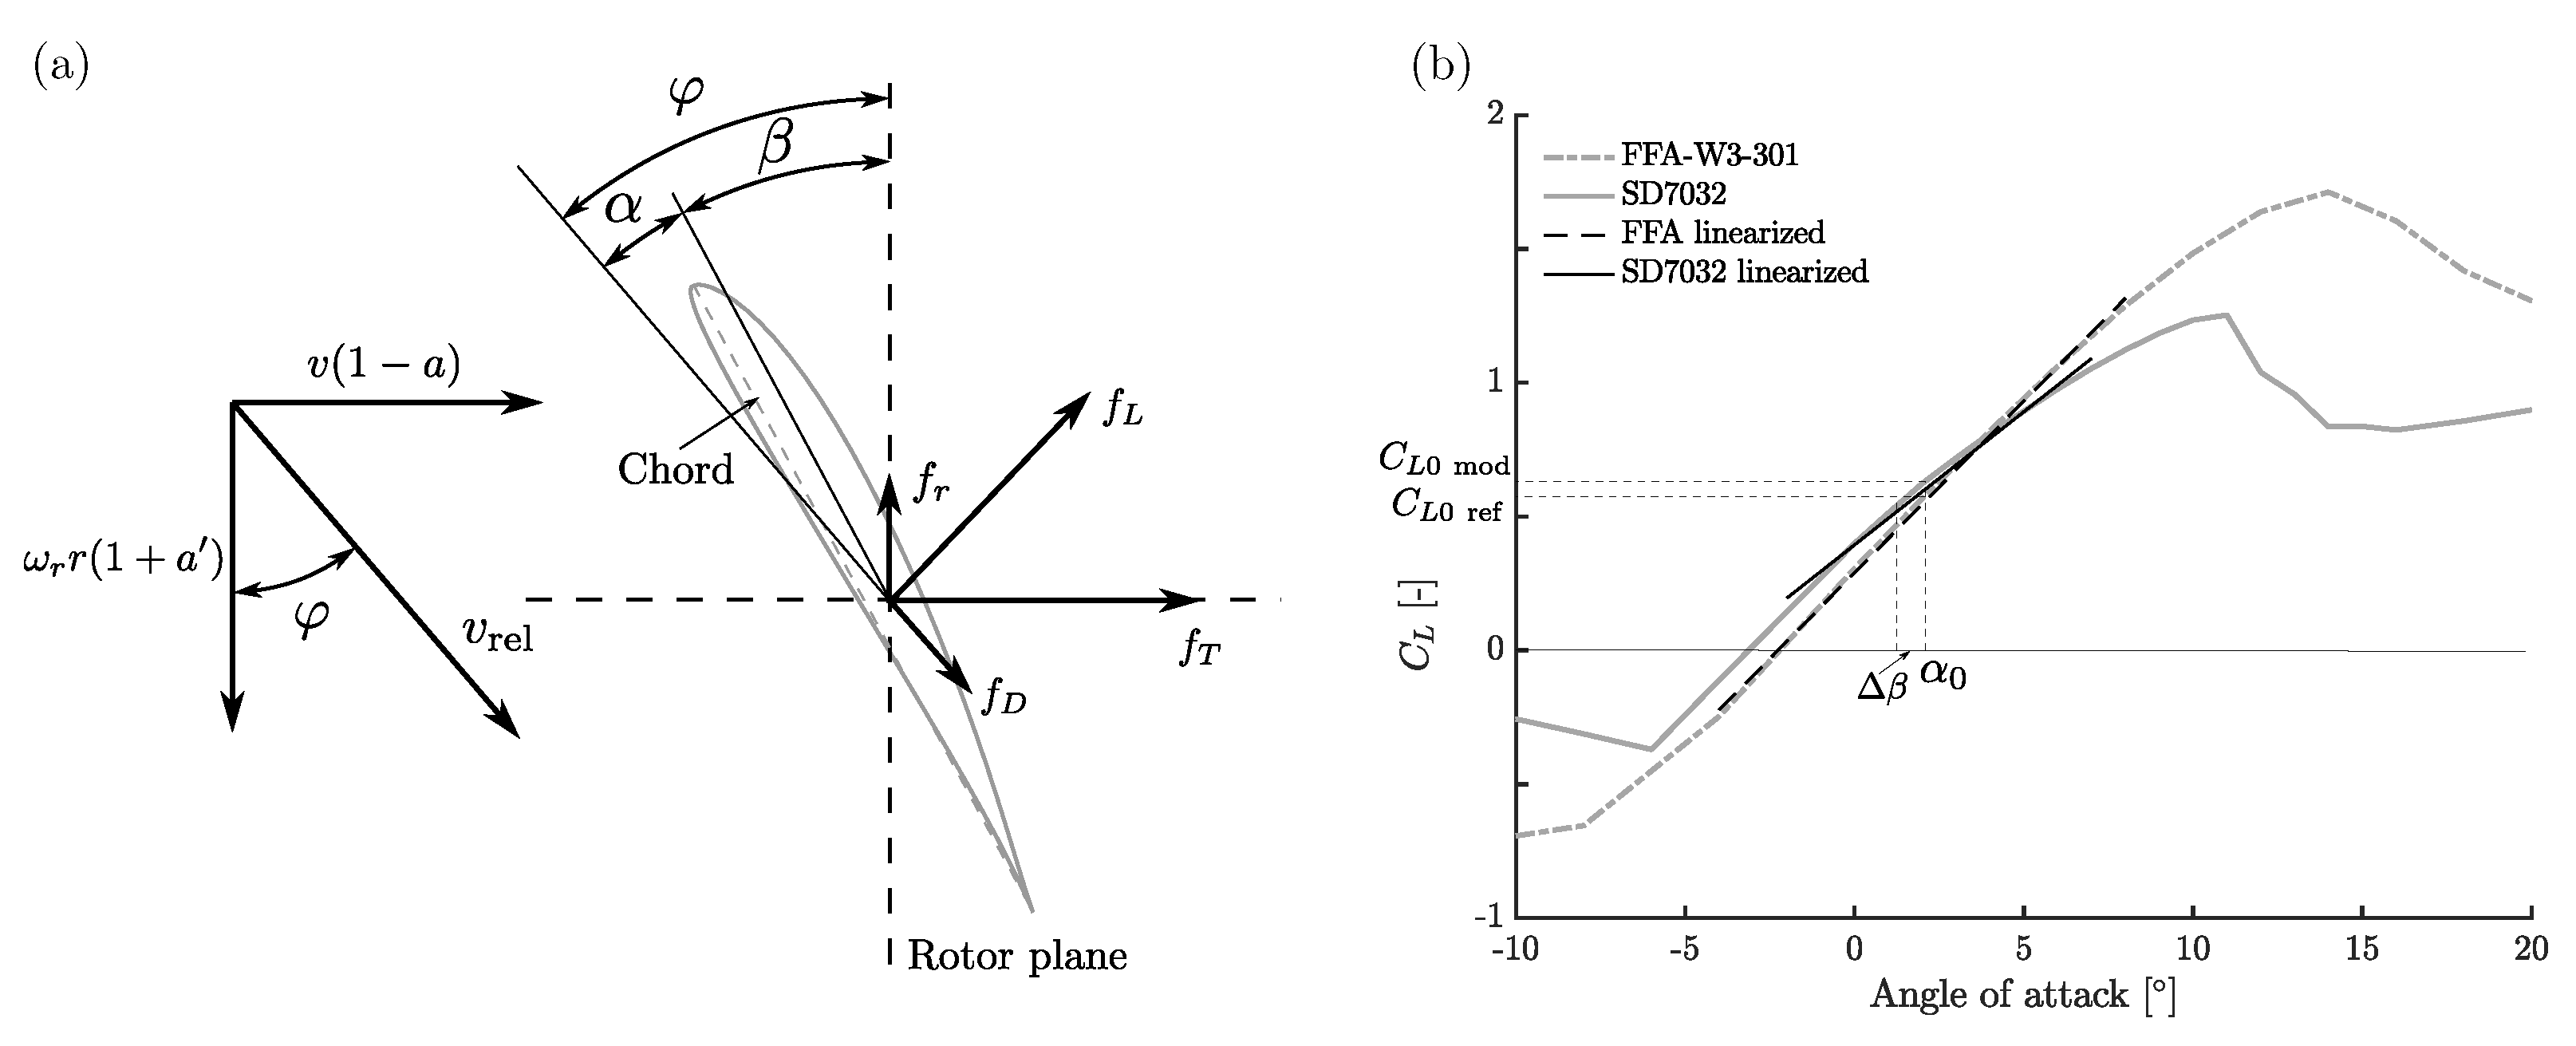
Blade design is purely aerodynamic and is based on the blade element model (e.g., see [24]), shown in Figure A1.
Figure A1. Aerodynamic model used for blade design. (a) Blade element for the generic blade section (a and a are the axial and tangential induction coefficients, ω r is rotor speed, and r is the radial position of the blade element). (b) Lift coefficient of the FFA-W3-301 airfoil (DTU 10 MW), and of the SD7032 (scale model), with notation used in blade design equations.
Energies 16 02205 g0a1
The force per unit length normal to rotor plane for the i-th blade element is:
f T , i = f L , i cos φ i + f D , i sin φ i f L , i ,
where f L , i is the lift force, f D , i the drag force and φ i is the angle between the local flow direction and the rotor plane. φ is normally small so thrust force is approximately equal to lift force. The lift force per unit length for the i-th blade element is:
f L , i = 1 2 ρ C L ( α i ) c i v rel , i 2 ,
where ρ is the air density, C L the lift coefficient, α i the angle of attack, c i the local chord, and v rel , i the local relative flow speed. The variation of lift with respect to angle of attack is:
f L α = 1 2 ρ C L α c v rel 2 = 1 2 ρ k L c v rel 2 .
In normal operating conditions, most of the blade works away from stall, where C L is linear with angle of attack and has slope equal to k L . At every blade section, the model blade must have the same variation fo lift force of the full scale turbine:
1 2 ρ k L mod , i c mod , i v rel 2 = 1 2 ρ k L ref , i c ref , i v rel 2 ,
where k L ref , i is the lift coefficient derivative for the i-th blade element of DTU 10 MW, k L model , i the lift coefficient derivative for the i-th blade element of the scale model, and c ref , i is equal to the chord of the DTU 10 MW scaled with a factor 1:148.7. The scale model blade chord is c mod , i = c ref , i k c , i , where:
k c , i = k L ref , i k L mod , i .
Twist of the scale model blade is adjusted to have the same thrust force of the DTU 10 MW given the same flow angle φ (i.e., same TSR and blade pitch). The angle of attack for the i-th section of the scale model blade is:
α i = α 0 , i + Δ β i ,
where α 0 , i is the angle of attack of the corresponding blade section of the DTU 10 MW and Δ β i the twist correction. Assuming the lift coefficient linear with respect to angle-of-attack, from Equation (A2) we get:
C L 0 ref , i ( α 0 , i ) c ref , i = C L 0 mod , i ( α 0 , i ) c mod , i + k L mod , i Δ β i ,
and rearranging the equation:
Δ β i = C L 0 ref , i c ref , i c mod , i C L 0 mod , i 1 k L mod , i .

References

  1. Meyers, J.; Bottasso, C.; Dykes, K.; Fleming, P.; Gebraad, P.; Giebel, G.; Göçmen, T.; van Wingerden, J.W. Wind farm flow control: Prospects and challenges. Wind. Energy Sci. 2022, 7, 2271–2306. [Google Scholar] [CrossRef]
  2. Wang, J.; Foley, S.; Nanos, E.; Yu, T.; Campagnolo, F.; Bottasso, C.; Zanotti, A.; Croce, A. Numerical and Experimental Study of Wake Redirection Techniques in a Boundary Layer Wind Tunnel. J. Phys. Conf. Ser. (JPCS) 2017, 854, 012048. [Google Scholar] [CrossRef]
  3. Schreiber, J.; Nanos, E.; Campagnolo, F.; Bottasso, C. Verification and Calibration of a Reduced Order Wind Farm Model by Wind Tunnel Experiments. J. Physics: Conf. Ser. (JPCS) 2017, 854, 012041. [Google Scholar] [CrossRef]
  4. Campagnolo, F.; Molder, A.; Schreiber, J.; Bottasso, C. Comparison of Analytical Wake Models with Wind Tunnel Data. J. Phys. Conf. Ser. 2019, 1256, 012006. [Google Scholar] [CrossRef]
  5. Campagnolo, F.; Schreiber, J.; Bottasso, C. Wake Deflection Control with Wind Direction Changes: Wind Tunnel Comparison of Different Wind Farm Flow Models. In Proceedings of the 2020 American Control Conference (ACC), Denver, CO, USA, 1–3 July 2020; Volume 2020, pp. 4817–4823. [Google Scholar]
  6. Hulsman, P.; Wosnik, M.; Petrović, V.; Hölling, M.; Kühn, M. Turbine Wake Deflection Measurement in a Wind Tunnel with a Lidar WindScanner. J. Phys. Conf. Ser. 2020, 1452, 012007. [Google Scholar] [CrossRef]
  7. Fontanella, A.; Bayati, I.; Mikkelsen, R.; Belloli, M.; Zasso, A. UNAFLOW: A holistic wind tunnel experiment about the aerodynamic response of floating wind turbines under imposed surge motion. Wind. Energy Sci. 2021, 6, 1169–1190. [Google Scholar] [CrossRef]
  8. Fontanella, A.; Facchinetti, A.; Di Carlo, S.; Belloli, M. Wind tunnel investigation of the aerodynamic response of two 15 MW floating wind turbines. Wind. Energy Sci. 2022, 7, 1711–1729. [Google Scholar] [CrossRef]
  9. Bayati, I.; Facchinetti, A.; Fontanella, A.; Taruffi, F.; Belloli, M. Analysis of FOWT dynamics in 2-DOF hybrid HIL wind tunnel experiments. Ocean. Eng. 2020, 195. [Google Scholar] [CrossRef]
  10. Mancini, S.; Boorsma, K.; Caboni, M.; Cormier, M.; Lutz, T.; Schito, P.; Zasso, A. Characterization of the unsteady aerodynamic response of a floating offshore wind turbine. Wind Energy Sci. 2020, 5, 1713–1730. [Google Scholar] [CrossRef]
  11. Bergua, R.; Robertson, A.; Jonkman, J.; Branlard, E.; Fontanella, A.; Belloli, M.; Schito, P.; Zasso, A.; Persico, G.; Sanvito, A.; et al. OC6 Project Phase III: Validation of the Aerodynamic Loading on a Wind Turbine Rotor Undergoing Large Motion Caused by a Floating Support Structure. Wind Energy Sci. Discuss. 2022, 2022, 1–33. [Google Scholar]
  12. Bak, C.; Zahle, F.; Bitsche, R.; Taeseong, K.; Yde, A.; Henriksen, L.C.; Hansen, M.H.; Jose, J.P.A.A.; Gaunaa, M.; Natarajan, A. The DTU 10-MW Reference Wind Turbine; DTU Wind Energy Report; DTU Department of Wind Energy: Roskilde, Denmark, 2013. [Google Scholar]
  13. Nanos, E.M.; Bottasso, C.L.; Campagnolo, F.; Mühle, F.; Letizia, S.; Iungo, G.V.; Rotea, M.A. Design, steady performance and wake characterization of a scaled wind turbine with pitch, torque and yaw actuation. Wind. Energy Sci. 2022, 7, 1263–1287. [Google Scholar] [CrossRef]
  14. Bayati, I.; Belloli, M.; Bernini, L.; Giberti, H.; Zasso, A. Scale model technology for floating offshore wind turbines. IET Renew. Power Gener. 2017, 11, 1120–1126. [Google Scholar] [CrossRef] [Green Version]
  15. Madsen, F.; Nielsen, T.; Kim, T.; Bredmose, H.; Pegalajar-Jurado, A.; Mikkelsen, R.; Lomholt, A.; Borg, M.; Mirzaei, M.; Shin, P. Experimental analysis of the scaled DTU10MW TLP floating wind turbine with different control strategies. Renew. Energy 2020, 155, 330–346. [Google Scholar] [CrossRef]
  16. Azcona, J.; Bouchotrouch, F.; González, M.; Garciandía, J.; Munduate, X.; Kelberlau, F.; Nygaard, T.A. Aerodynamic Thrust Modelling in Wave Tank Tests of Offshore Floating Wind Turbines Using a Ducted Fan. J. Phys. Conf. Ser. 2014, 524, 012089. [Google Scholar] [CrossRef] [Green Version]
  17. Wang, C.; Campagnolo, F.; Canet, H.; Barreiro, D.J.; Bottasso, C.L. How realistic are the wakes of scaled wind turbine models? Wind. Energy Sci. 2021, 6, 961–981. [Google Scholar] [CrossRef]
  18. Fontanella, A.; Bayati, I.; Mikkelsen, R.; Belloli, M.; Zasso, A. UNAFLOW: UNsteady Aerodynamics of FLOating Wind turbines. Zenodo 2021. [Google Scholar]
  19. Du, Z.; Selig, M. A 3-D Stall-Delay Model for Horizontal Axis Wind Turbine Performance Prediction. In Proceedings of the 1998 ASME Wind Energy Symposium, Reno, NV, USA, 15 January 1998. [Google Scholar]
  20. Jüchter, J.; Peinke, J.; Lukassen, L.J.; Hölling, M. Reduction and analysis of rotor blade misalignments on a model wind turbine. J. Phys. Conf. Ser. 2022, 2265, 022071. [Google Scholar] [CrossRef]
  21. Bossanyi, E.A. The Design of closed loop controllers for wind turbines. Wind Energy 2000, 3, 149–163. [Google Scholar] [CrossRef]
  22. Abbas, N.J.; Zalkind, D.S.; Pao, L.; Wright, A. A reference open-source controller for fixed and floating offshore wind turbines. Wind. Energy Sci. 2022, 7, 53–73. [Google Scholar] [CrossRef]
  23. Liu, Y.; Pamososuryo, A.K.; Ferrari, R.M.G.; van Wingerden, J.W. The Immersion and Invariance Wind Speed Estimator Revisited and New Results. IEEE Control. Syst. Lett. 2022, 6, 361–366. [Google Scholar] [CrossRef]
  24. Bianchi, F.; de Battista, H.; Mantz, R. Wind Turbine Control Systems; Springer: Cham, Switzerland, 2007; p. 208. [Google Scholar]
  25. Borg, M. DTU 10MW Reference Wind Turbine FAST Model v1.00; European Comission: Brussels, Belgium, 2016. [Google Scholar]
  26. Selig, M. Low Reynolds Number Airfoil Design Lecture Notes. In Proceedings of the Applied Vehicle Technology (AVT) Panel, 24–28 November 2003; pp. 1–43. [Google Scholar]
  27. Sanderse, B.; Dighe, V.V.; Boorsma, K.; Schepers, G. Efficient Bayesian calibration of aerodynamic wind turbine models using surrogate modeling. Wind. Energy Sci. 2022, 7, 759–781. [Google Scholar] [CrossRef]
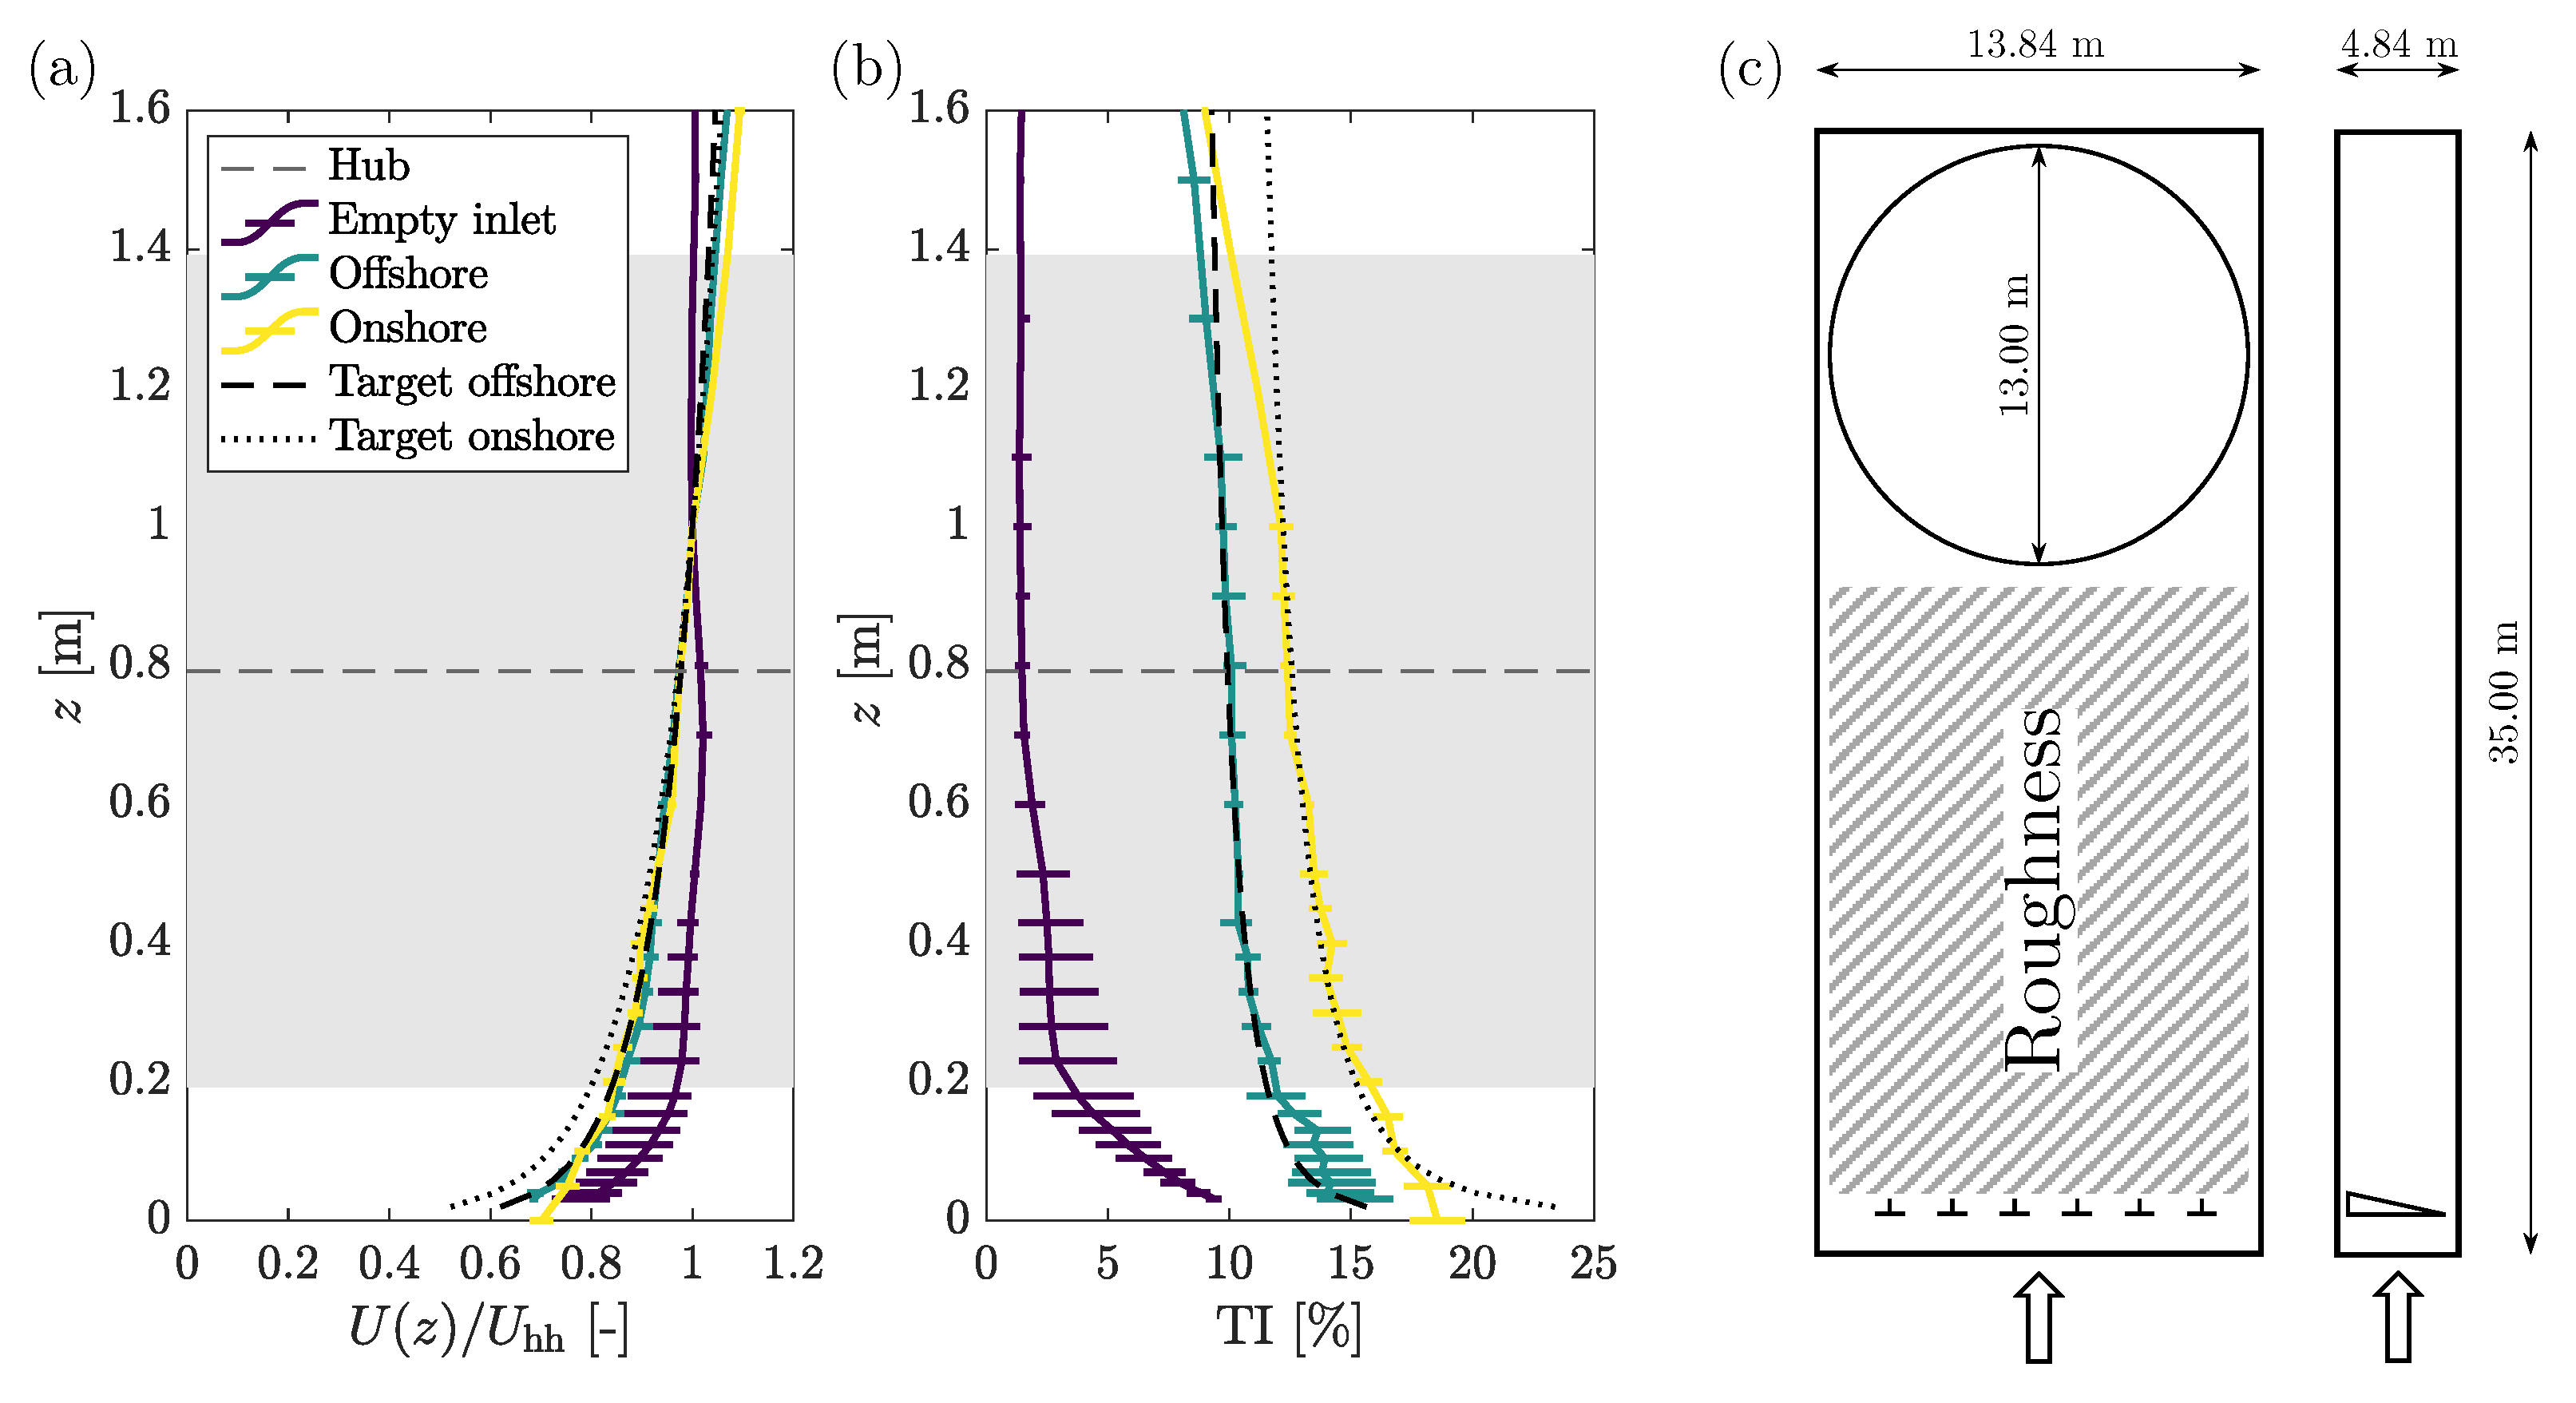
Figure 1. Dimensions of the wind turbine scale model are compared to typical wind profiles of the POLIMI wind tunnel and to the main dimension of the wind tunnel test section. (a,b) Vertical profile of average wind speed and turbulence intensity (TI) at the test section inlet for three terrain conditions (error bars are the min/max across the test section, “Target” is the typical logarithmic profile for the site, and the grey area corresponds to the rotor dimensions). (c) Main dimensions of the wind tunnel, the dashed area is occupied by roughness elements and is used to generate wind with controlled characteristics.
Energies 16 02205 g001
Figure 2. The wind turbine scale model inside the wind tunnel.
Energies 16 02205 g002
Figure 3. Aerodynamic coefficients of the SD7032 airfoil for several Reynolds numbers. (a) Lift coefficient. (b) Drag coefficient. (c) Lift-to-drag ratio.
Energies 16 02205 g003
Figure 4. Geometry of the scale model blade and rotor. (a,b) Chord and twist of the scale model blade are compared to the DTU 10 MW at 1:148.7 scale. (c) Geometry of the blade at 174 radial sections. (d) Picture of the rotor and of the mold sub-components.
Energies 16 02205 g004
Figure 5. Performance coefficients of the wind turbine scale model for three wind speeds: wind tunnel measurements (Exp.) against OpenFAST (OF) model and DTU 10 MW. (a) Thrust coefficient. (b) Power coefficient. (c) Reynolds along the blade.
Energies 16 02205 g005
Figure 6. Steady-state operating points (OP) with k ω 2 and TSR tracking control algorithms ( Q a is the aerodynamic torque at rotor).
Energies 16 02205 g006
Figure 7. Turbine response to step wind with TSR tracking with different feedback signal: hub-height measurement, and rotor-effective value estimated with the Immersion & Invariance algorithm. (a) Wind speed signals. (b) Rotor speed. (c) Rotor thrust.
Energies 16 02205 g007
Figure 8. The steady-sate aerodynamic response of the wind turbine model and two wind tunnel runs (rep. 1, rep. 2) is compared at full-scale to the DTU 10 MW and to predictions obtained with the OpenFAST (OF) model of the scale model turbine. (a) Rotor thrust. (b) Rotor torque.
Energies 16 02205 g008
Figure 9. The aerodynamic response to a wind speed ramp for the wind turbine model is compared at full-scale to the OpenFAST (OF) model of the scaled model; the corresponding thrust and torque sensitivities to wind speed are compared to the DTU 10 MW. (a,b) Thrust and torque response to a wind speed ramp for the scale model turbine. (c,d) Linear fit of the thrust and torque response to wind speed. (e,f) Thrust and torque sensitivities to wind speed.
Energies 16 02205 g009
Table 1. Properties of the DTU 10 MW rotor and scaled values for the wind turbine model.
ParameterDTU 10 MWScale Model
Cut in wind speed (m/s)4.02.0
Cut out wind speed (m/s)25.012.5
Rated wind speed (m/s)11.45.7
Rotor diameter (m)178.41.2
Hub height (m)118.00.79
Design TSR (-)7.57.5
Design blade pitch ( )00
Minimum rotor speed (rpm)6.0446
Maximum rotor speed (rpm)9.6713
Rotor tilt ( )5 0
Rotor mass (kg) 228 × 10 3 0.069 (target)
Disclaimer/Publisher’s Note: The statements, opinions and data contained in all publications are solely those of the individual author(s) and contributor(s) and not of MDPI and/or the editor(s). MDPI and/or the editor(s) disclaim responsibility for any injury to people or property resulting from any ideas, methods, instructions or products referred to in the content.